Article

Comprehensive Investigation of Coverage Rates of Shot Peening on the Tribological Properties of 6061-T6 Alloy

by
Orçun Canbulat
1 and
Fatih Bozkurt
2,*
1
Institution of Graduate Schools, Eskisehir Technical University, 26555 Eskisehir, Turkey
2
Vocational School of Transportation, Eskisehir Technical University, 26140 Eskisehir, Turkey
*
Author to whom correspondence should be addressed.
Metals 2025, 15(9), 964; https://doi.org/10.3390/met15090964
Submission received: 9 July 2025 / Revised: 25 August 2025 / Accepted: 28 August 2025 / Published: 29 August 2025

Abstract

In the search for lightweight and sustainable engineering approaches, enhancing the surface wear resistance of structural materials, such as 6061-T6 aluminum alloy, has become increasingly important. This study investigates the effect of coverage rates on the tribological properties of shot-peened 6061-T6 alloy, aiming to improve its usage in industries where weight reduction and durability are important, such as aerospace, automotive, railway, and renewable energy systems. A shot peening process was applied at four different coverage rates of 100%, 200%, 500%, and 1500% for comprehensive evaluation. A series of experimental analyses were conducted, including microhardness tests, ball-on-plate wear tests, residual stress measurements, and surface roughness evaluations. Furthermore, microstructural analysis was performed to investigate subsurface deformation, and scanning electron microscopy (SEM) was carried out to identify the wear mechanisms of the worn surfaces in detail. The results demonstrated a clear trend of gradual improvement in wear resistance with increasing shot peen coverage. The sample treated at a 1500% coverage rate exhibited 1.34 times higher hardness and 19 times higher wear resistance compared to the untreated sample. This study highlights that shot peening is an effective and feasible surface engineering method for enhancing the wear performance of 6061-T6 alloy. The findings offer valuable contributions for the development of lightweight and wear-resistant components considering sustainable material design.

1. Introduction

Nowadays, transportation, aerospace, and renewable energy industries are seeking sustainable and energy-efficient engineering materials. Due to its weldability, corrosion resistance, especially high strength to weight ratio, excellent thermal conductivity, and good formability, 6061-T6 is generally used in structural components, such as pistons, connecting rods, cylinder liners, valves, bearing surfaces, and braking systems. However, under severe sliding contact and high-temperature conditions, these parts are prone to wear and oxidation-induced degradation, which can reduce their service life and reliability [1,2,3,4,5].
As a mechanical surface treatment, shot peening is widely implemented to enhance the resistance of metallic materials against different failure mechanisms, particularly fatigue [6,7,8]. Shot peening process involves bombarding the surface with high-velocity spherical media, generally metallic or ceramics shots. Each shot acts as a micro hammer, plastically deforming the surface by creating localized dimples. This plastic deformation induces compressive residual stress in the surface layer of the parts. These compressive residual stresses are beneficial in inhibiting crack initiation and propagation, especially under cyclic loading, which is why the fatigue life of the mechanical parts can be significantly extended [9]. In addition, shot peening can refine surface grain structure, increase dislocation density, and enhance surface hardness and wear resistance without compromising its intrinsic bulk properties [10]. However, the efficiency of shot peening is influenced by many parameters, including shot size, coverage rate, impact velocity, material density, shot flow rate, nozzle to surface distance, and the mechanical behavior of the workpiece. As a result, prediction and control of shot peening parameters remain a critical and complex task in process design and industrial practice [11].
In the existing body of literature, studies involving shot-peened aluminum alloys have predominantly focused on evaluating improvements in corrosion resistance and fatigue performance. This originates from the widespread application of aluminum alloys in aerospace, marine, and automotive industries, where components are generally subjected to cyclic loading and aggressive environmental conditions. Chen et al. investigated the effects of various shot peening parameters on the surface characteristics of 6061 aluminum [12]. The results revealed significant improvements in both compressive residual stress and surface roughness across all shot-peened samples. The highest compressive stress and surface roughness values were observed at a shot flow rate of 5.5 lbs/min and an air pressure of 20 Psi. Microstructural analysis demonstrated the formation of a nanostructured surface layer with an average grain size below 100 nm on all treated samples. This nanocrystalline layer exhibited enhanced microhardness, primarily attributed to grain refinement and strain hardening mechanisms. Furthermore, electrochemical measurements, surface corrosion morphology observations, and EDS analyses indicated that shot peening induced surface nanocrystallization, which significantly increased the corrosion susceptibility of 6061 alloy. Mohammadi et al. evaluated the combined effects of Equal Channel Angular Pressing (ECAP) followed by shot peening on the fatigue behavior of 6082 aluminum alloy [13]. Mechanical characterization through tensile, microhardness, and fatigue tests showed that shot peening after a single ECAP pass, followed by polishing, effectively improved the fatigue life of the samples. However, increasing the number of ECAP passes prior to shot peening led to subsurface work softening, which significantly reduced the fatigue performance. Fractographic analysis revealed that the crack initiation sites shifted from the surface to the subsurface in samples subjected to multiple ECAP passes and subsequent shot peening. Sun et al. performed analysis of the microstructure, corrosion behavior, and thermal stability of AA7150 aluminum alloy subjected to ultrasonic shot peening [14]. The treatment reduced exfoliation susceptibility, inhibited intergranular corrosion on both normal and transverse planes, and shifted the pitting potential in the positive direction. These improvements in localized corrosion resistance were attributed to the formation of equiaxed nanograins in the surface layer. Shot peening caused the immediate dissolution of pre-existing aging-induced η′ and η precipitates re-formed on the surface, resulting in surface softening. Ravnikar et al. examined the influence of shot peening on the mechanical and corrosion properties of 6082-T651 aluminum alloy [15]. The microstructure, surface roughness, microhardness, residual stresses, and corrosion behavior of shot-peened samples were evaluated and compared to those of untreated samples. Surface cracks and delaminations were observed only at higher working pressures (4 and 8 bar), while no such defects appeared at 1.6 bar. Shot peening at 8 bar significantly increased surface roughness and enhanced microhardness by 27%. Additionally, deeper compressive residual stress layers were introduced. All treated samples demonstrated improved corrosion resistance, with reduced anodic dissolution. The sample with the lowest surface roughness exhibited a current density more than twice as low as that of the untreated alloy. Mathi et al. identified the effects of shot peening on the microstructure, surface characteristics, precipitation behavior, hardness, and wear resistance of 6061 alloy [16]. Shot peening significantly refined the grain structure, reducing the average grain size from 95 µm to 8.2 µm and precipitate size from 1.5 µm to approximately 1 µm. These microstructural changes, along with the formation of a plastically deformed surface layer, led to a marked increase in surface hardness, reaching 111.1 HV, and enhanced wear resistance. EDS analysis revealed that a more uniform distribution of Mg2Si precipitates and the formation of a thin oxide layer both contribute to the improvement of hardness. Compressive residual stresses, measured at −335 MPa at a depth of 300 µm, further strengthened the material by hindering crack initiation and propagation. Wear testing showed a decrease in the wear rate from 8.1 to 4.2 mg/m × 103 under a 25 N load and a reduction in the coefficient of friction from 1.13 to 0.98, primarily due to the refined microstructure, increased hardness, and compressive stress state. Comparable to systematic analysis of shot peening parameters, Park et al. highlighted the critical role of processability in determining the performance of Co-based lattice structures [17].
To date, there has been little experimental investigation of the effects of shot peening at various coverage rates on the wear resistance and tribological behavior of 6061-T6 aluminum alloy. This study addresses a critical gap in the literature by providing a comprehensive analysis, including microhardness measurements to evaluate surface hardening, ball-on-plate tests to characterize wear performance, and residual stress evaluations to quantify the depth and magnitude of induced compressive stresses. Surface roughness measurements were performed to examine the topographical alterations after the shot peening process. In addition, microstructural characterization and scanning electron microscopy (SEM) of the worn surface were employed to explore subsurface deformation and identify the underlying wear mechanisms.

2. Experimental Procedure

2.1. Materials

In this study, 4 mm thick 6061-T6 aluminum alloy plates were used for the shot peening process. Samples had dimensions of 30 mm × 50 mm, as shown in Figure 1, and they were sectioned from the main plate using an abrasive disc cutting machine. Before the shot peening process, all samples’ edges were ground using 1200 grit SiC paper and thoroughly cleaned to ensure uniform surface and edge conditions. To assess experimental repeatability, three samples were prepared for each processing condition. The 6061-T6 aluminum alloy, as specified by the manufacturer, has a yield strength of 274 MPa, an ultimate tensile strength of 334 MPa, and an elongation at fracture of 20.1%. These values reflect the typical mechanical performance of the T6 temper treatment, which provided a good balance between strength and ductility suitable for structural applications. The chemical composition of 6061-T6 alloy is given in Table 1 according to the manufacturer.

2.2. Shot Peening Process

Shot peening operations were carried out manually by experienced operators at the Turkish Air Force 1st Air Supply and Maintenance Center Command (TAFASMC) shot peening unit. The process was conducted using an IEPCO Micopeen-Peenmatic 2000S system (Leuggern, Switzerland). During shot peening, a standoff distance of 150 mm was maintained, and the impingement angle was consistently set at approximately 90° for all samples to ensure uniform treatment. Almen strip tests and coverage rate evaluations were conducted by certified inspectors of the TAFASMC unit to verify process consistency and quality control. Shot peening was applied to AA 6061-T6 plates using S110-grade steel (55–62 HRC and 0.26 mm) shot media because they are commonly used in aerospace and automotive applications. Coverage refers to the proportion of the sample surface area that has been deformed by shot peening dimples. A 100% coverage rate means that the entire surface has been completely covered once. To achieve a 100% coverage rate, the process takes 25 s. The surface treatment was performed on one surface of each plate. An air pressure of 50 Psi was applied for all coverage rates. Shot peening was applied at four different coverage rates of 100%, 200%, 500%, and 1500%, in addition to an untreated reference sample, resulting in five groups that were evaluated for comprehensive evaluation. For clarity, the samples are hereafter designated as follows: “Sref” for the reference sample and “SP100”, “SP200”, “SP500”, and “SP1500” for samples shot peened at 100%, 200%, 500%, and 1500% coverage rates, respectively.

2.3. Roughness Measurements

Surface roughness measurements were performed after the shot peening process using a Mitutoyo SJ401 surface profilometer (Kawasaki, Japan). Multiple measurements were taken from different regions of each sample, covering 4 mm segments from the treated surface to ensure repeatability and accuracy.

2.4. Microstructural Examinations

The characterization of the samples subjected to different shot peening coverage rates was performed using an optical microscope (Nikon Eclipse L150 optical microscope (Shinagawa-ku, Japan) with Clemex Software 6.5 and Carl Zeiss Jena Neophot 32 microscope (Oberkochen, Germany) with Olympus analysis software v1.4). Prior to microscopic examination, the samples were sectioned into appropriate dimensions and subjected to standard metallographic preparation procedures. Initial surface preparation involved sequential grinding using SiC abrasive papers with mesh sizes of 120, 320, 500, 800, 1000, and, finally, 1200 grit. This was followed by polishing with 3 µm and 1 µm DiaDouble Mono diamond suspension. Subsequently, the samples were etched using Keller’s reagent (composed of 2 mL HF, 3 mL HCL, 5 mL HNO3, and 190 mL distilled water) to reveal the grain boundaries, grain refinement, and subsurface morphological changes. Microstructural examinations were conducted on both the surface and cross-sectional areas of the samples. Additionally, a Nikon SMZ800N zoom stereo microscope (Shinagawa-ku, Japan) was used to capture the side of the shot-peened sample. 3D surface topography and wear profiles were obtained by capturing the surface and wear scars using optical microscopy, and the images were imported to ImageJ software 1.54g for each sample.

2.5. Microhardness Measurements

Microhardness measurements were carried out using a Future Tech FM-700 Vickers microhardness tester (Kawasaki, Japan). The tests were performed under a constant load of 50 g with a dwell time of 10 s, in accordance with the procedures outlined in the ASTM E384 standard [18] for hardness testing. For each sample, a minimum of five measurements were performed (laterally on the cut surface with a spacing of ≥3x the indent diagonal) at a cross-section to ensure measurement consistency. The reported hardness values represent the average of these measurements and are expressed in Vickers Hardness (HV).

2.6. Residual Stress Evaluation

To evaluate the residual stresses resulting from shot peening, the indentation method was applied on cross-sections of the samples (starting from 50 µm below the shot-peened surface and continuing to subsurface region at 25 µm intervals) by analyzing the loading–unloading curves. The Wang model was applied to correlate the variations in these curves with the underlying residual stress distribution [19]. A Berkovich indenter, which has a three-sided pyramidal geometry with a centerline to face angle of α = 65.3°, was used for the indentation tests using a Zwick Roell ZHU 2.5 indentation testing machine (Ulm, Germany). The detailed procedure for calculating residual stress is provided in the article. Based on the theoretical framework, the residual stress is calculated using Equation (1), derived from the indentation analysis considering Figure 2:
σ r e s i d u a l = P 1 P 2 2 π t a n 2 α h r 2
where “α” represents the semi-angle of the conical indentation impression.

2.7. Wear Tests

In this study, a series of wear tests was conducted to investigate the influence of shot peening on the frictional behavior and wear resistance of 6061-T6 alloy. The experiments were performed using a CSM Tribometer equipped with a ball-on-plate configuration, operating under a reciprocating sliding motion to simulate real contact conditions more accurately. This tribological testing method enables the assessment of both the coefficient of friction and the wear rate under controlled loading and environmental parameters. A schematic representation of the wear test setup is provided in Figure 3.
The selection of wear test parameters was primarily based on replicating the operational wear conditions of the material while slightly intensifying certain parameters to account for the limited test duration and to accelerate the wear process. In particular, the determination of the applied normal load was conducted by considering key factors, such as the diameter of the counter face ball and the elastic modulus of the materials involved. Comprehensive details regarding the wear test parameters are presented in Table 2. Wear tests were conducted using a ball-on-plate configuration in accordance with the ASTM G133 [20] standard. Tungsten Carbide (WC) balls containing 6% cobalt, with a diameter of 3 mm, were employed as counter bodies. These balls exhibited a hardness of 91.6 HRA, an elastic modulus of 690 GPa, and Poisson’s ratio of 0.22. The sphericity and chemical composition of counter bodies were certified by the manufacturer (Redhill, Tel Aviv, Israel) to ensure consistency across all tests. The use of a counter body with such high hardness was intentional, aiming to localize wear exclusively on tested 6061-T6 alloy samples and prevent significant deformation or wear on the ball itself. The applied normal load during tests was 2 N. Before starting the wear tests, the surfaces of the samples and the WC balls were cleaned with alcohol and air-dried. At least three wear tests were performed, and their mean values were evaluated for comparison.
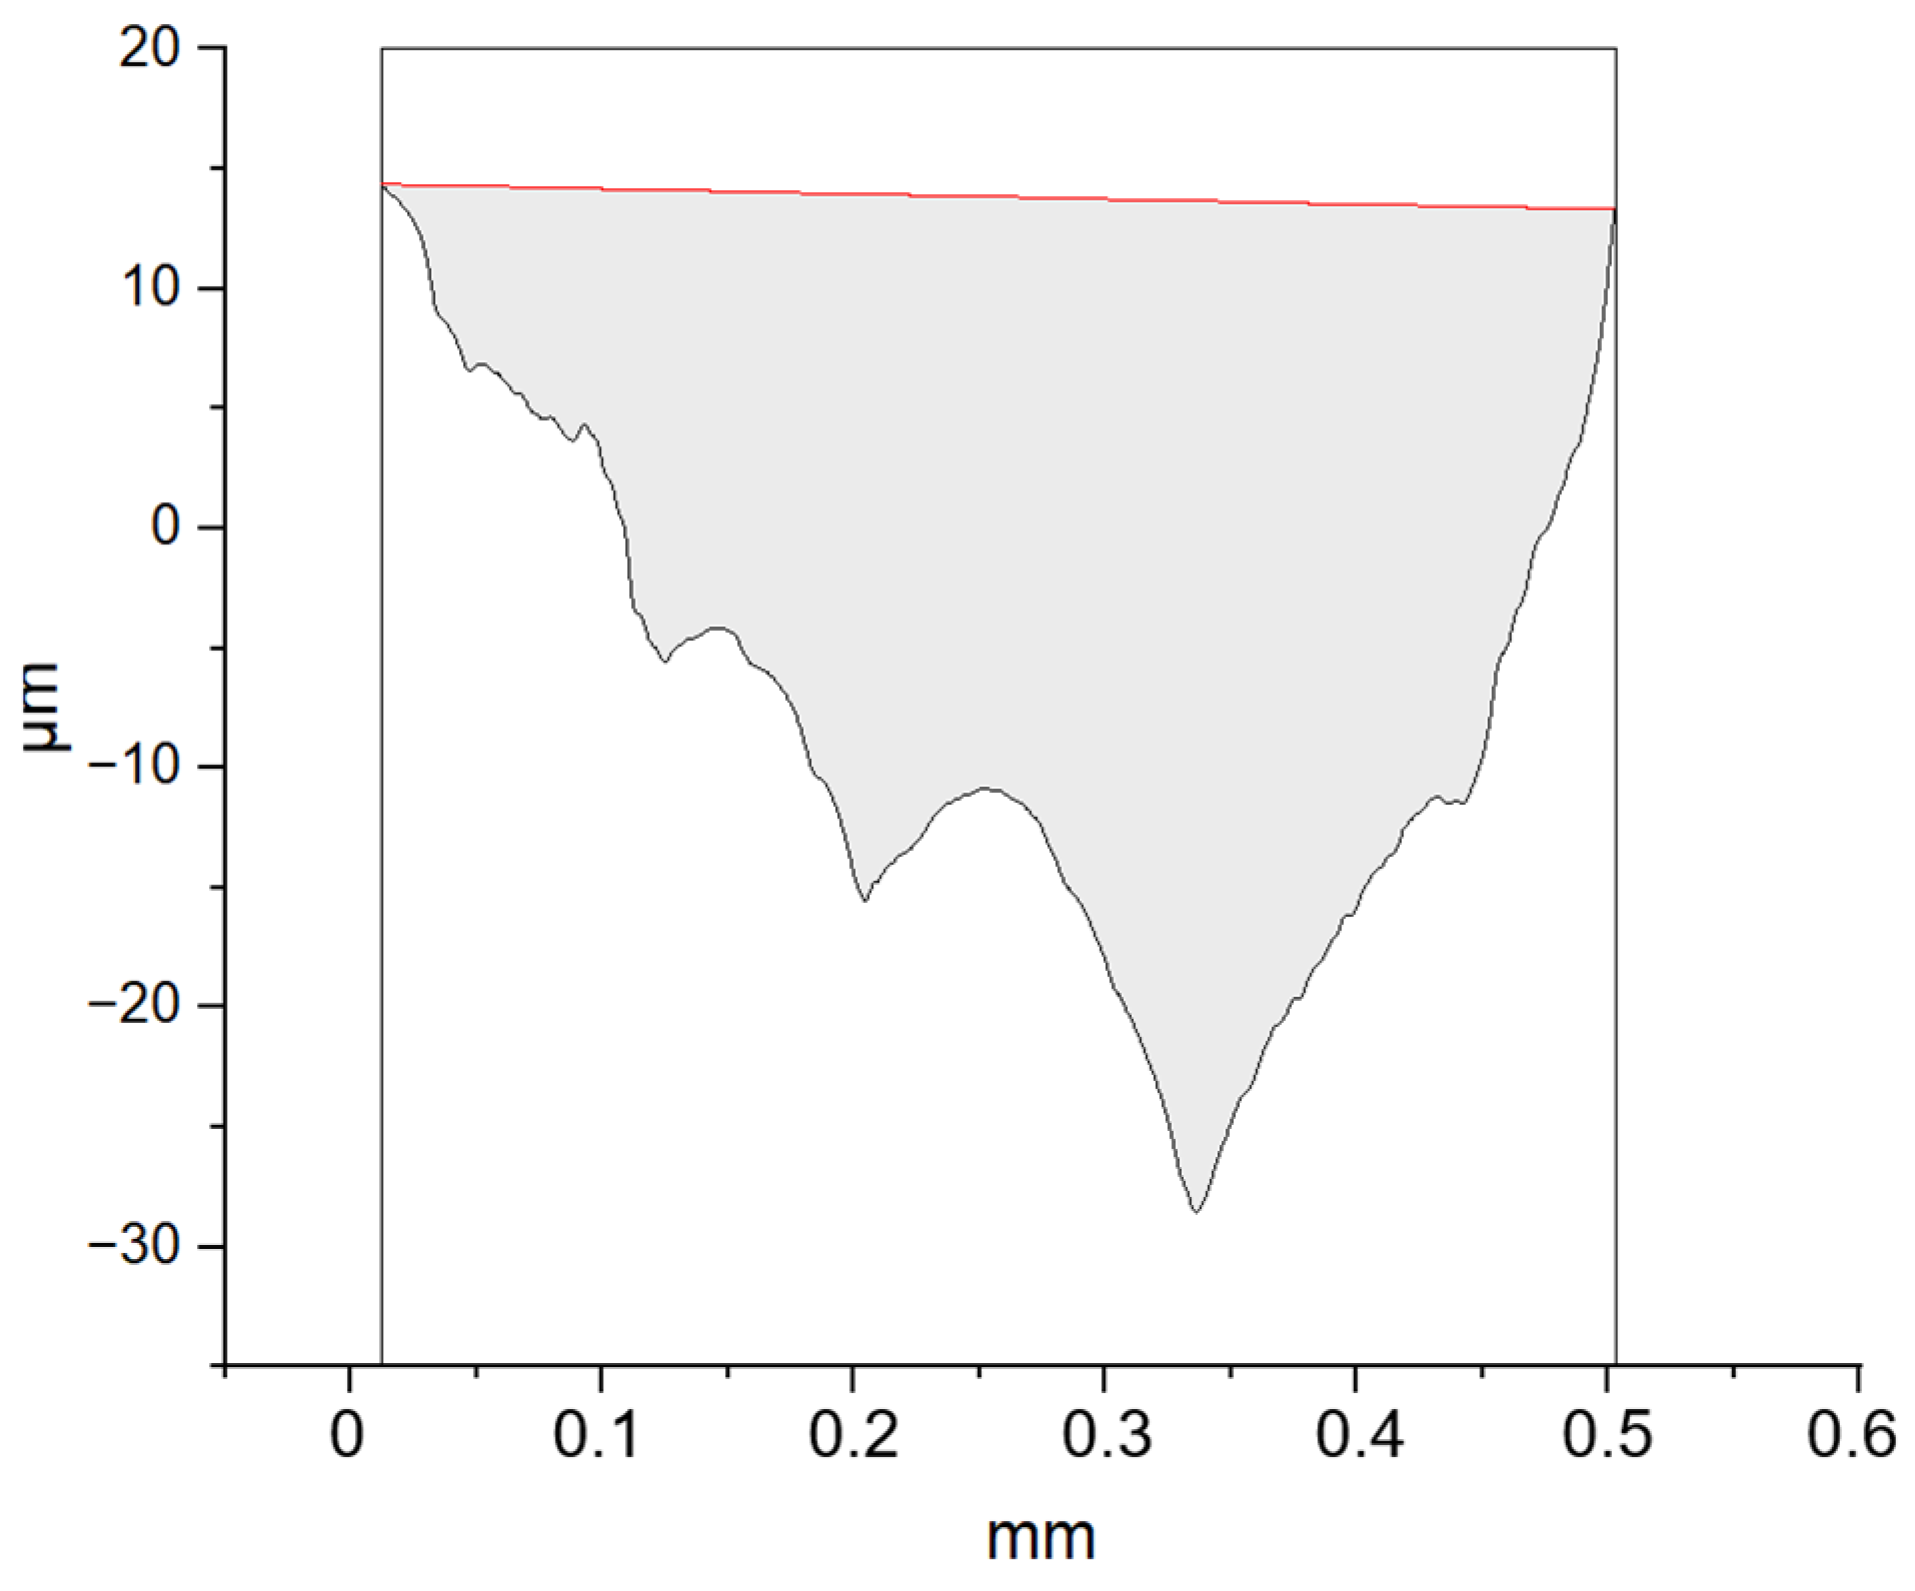
The width and depth of the wear tracks were precisely measured using a Mitutoyo SJ 401 surface profilometer equipped for roughness and cross-sectional analysis. The raw profile data obtained from the worn surface were further processed using OriginLab Pro software 10.1.0.178 to calculate the cross-sectional area of the wear tracks. These measurements were performed at multiple locations along the wear scar, with each measurement taken in a direction perpendicular to the sliding direction to ensure a representative average of the wear profile. As illustrated in Figure 4, the wear cross-section was evaluated based on the gray-shaded region, which represents the actual material loss. This area was determined after applying a Gaussian filter to raw profilometric data in order to reduce noise and extract the true surface deformation. The average area was then obtained by computing the mean value of several measurements taken at different positions along the wear track. To quantify the total wear volume, the average cross-sectional wear area was multiplied by the stroke length of the wear test, assuming a constant wear track geometry throughout the reciprocating motion. The resulting volume loss was then used to calculate the wear volume (Vwear) per stroke using Equation (2).
V w e a r = S A a v e r a g e
where S is a stroke of 8 mm for all wear tests.
To normalize the wear performance and eliminate the dependency on test parameters, such as applied load and sliding distance, the specific wear rate (k) (mm3/Nm) was determined. This parameter, calculated using Equation (3), provided a more universal metric for comparing wear behavior across different testing conditions and materials.
S p e c i f i c   W e a r   R a t e   ( k ) = V w e a r X L  
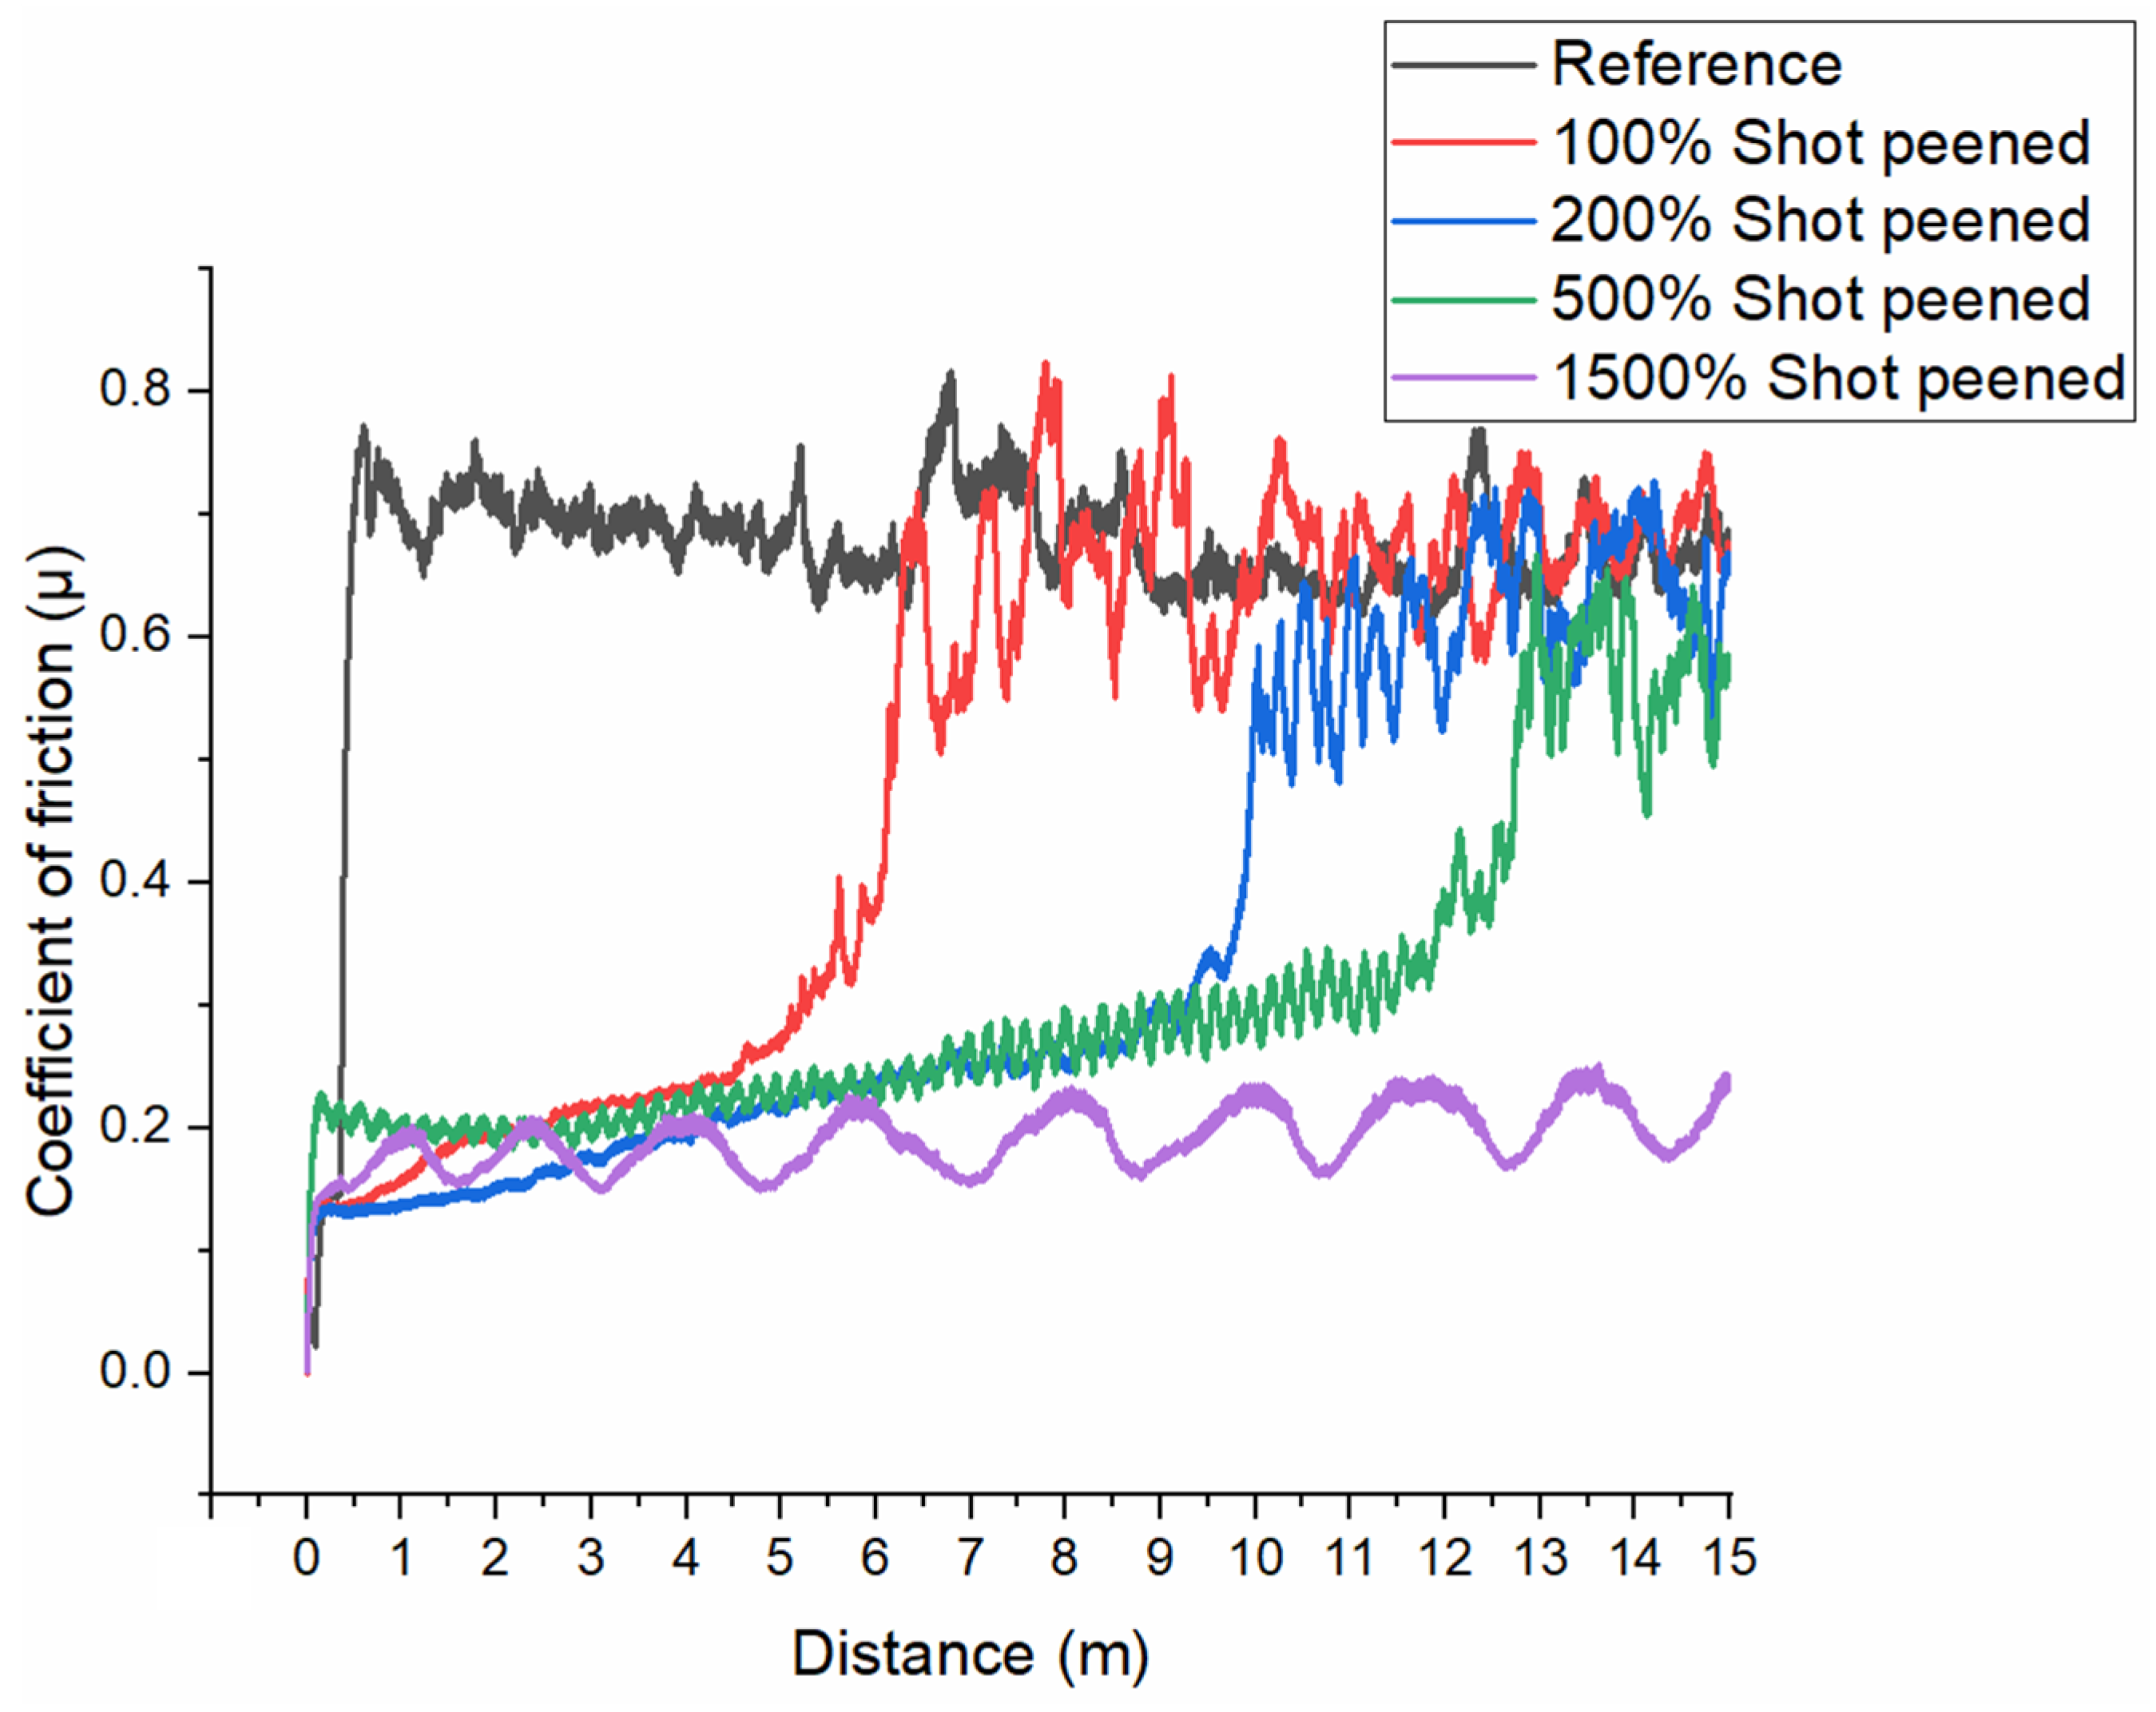
where X is the sliding distance (15 m) and L is the normal load (2 N). During the tribological experiments, the friction force was continuously monitored and recorded using the integrated load cell of the CSM wear tester. The tribometer is equipped with a high-precision sensor and a closed-loop control mechanism that regulates the applied normal load and ensures stable test conditions. Additionally, the coefficient of friction (COF) vs. distances was produced to observe friction behavior and identify any stabilization trends, fluctuations, or stick–slip phenomena that may have occurred during the sliding process.

2.8. SEM Analysis

The worn surface of the samples was examined using Tescan MIRA scanning electron microscopy (SEM) (Brno, Czech Republic) to investigate the dominant wear mechanisms that occurred during linear wear tests. In addition to the examination of the worn surface, the shot-peened samples were also investigated using SEM to characterize the surface morphology and topographical features induced by the shot peening process. Morphological characterization and energy-dispersive X-ray spectroscopy (EDS) analysis were performed on selected regions of the worn surfaces to assess elemental composition changes.

3. Results and Discussion

3.1. Microstructural and Surface Analysis

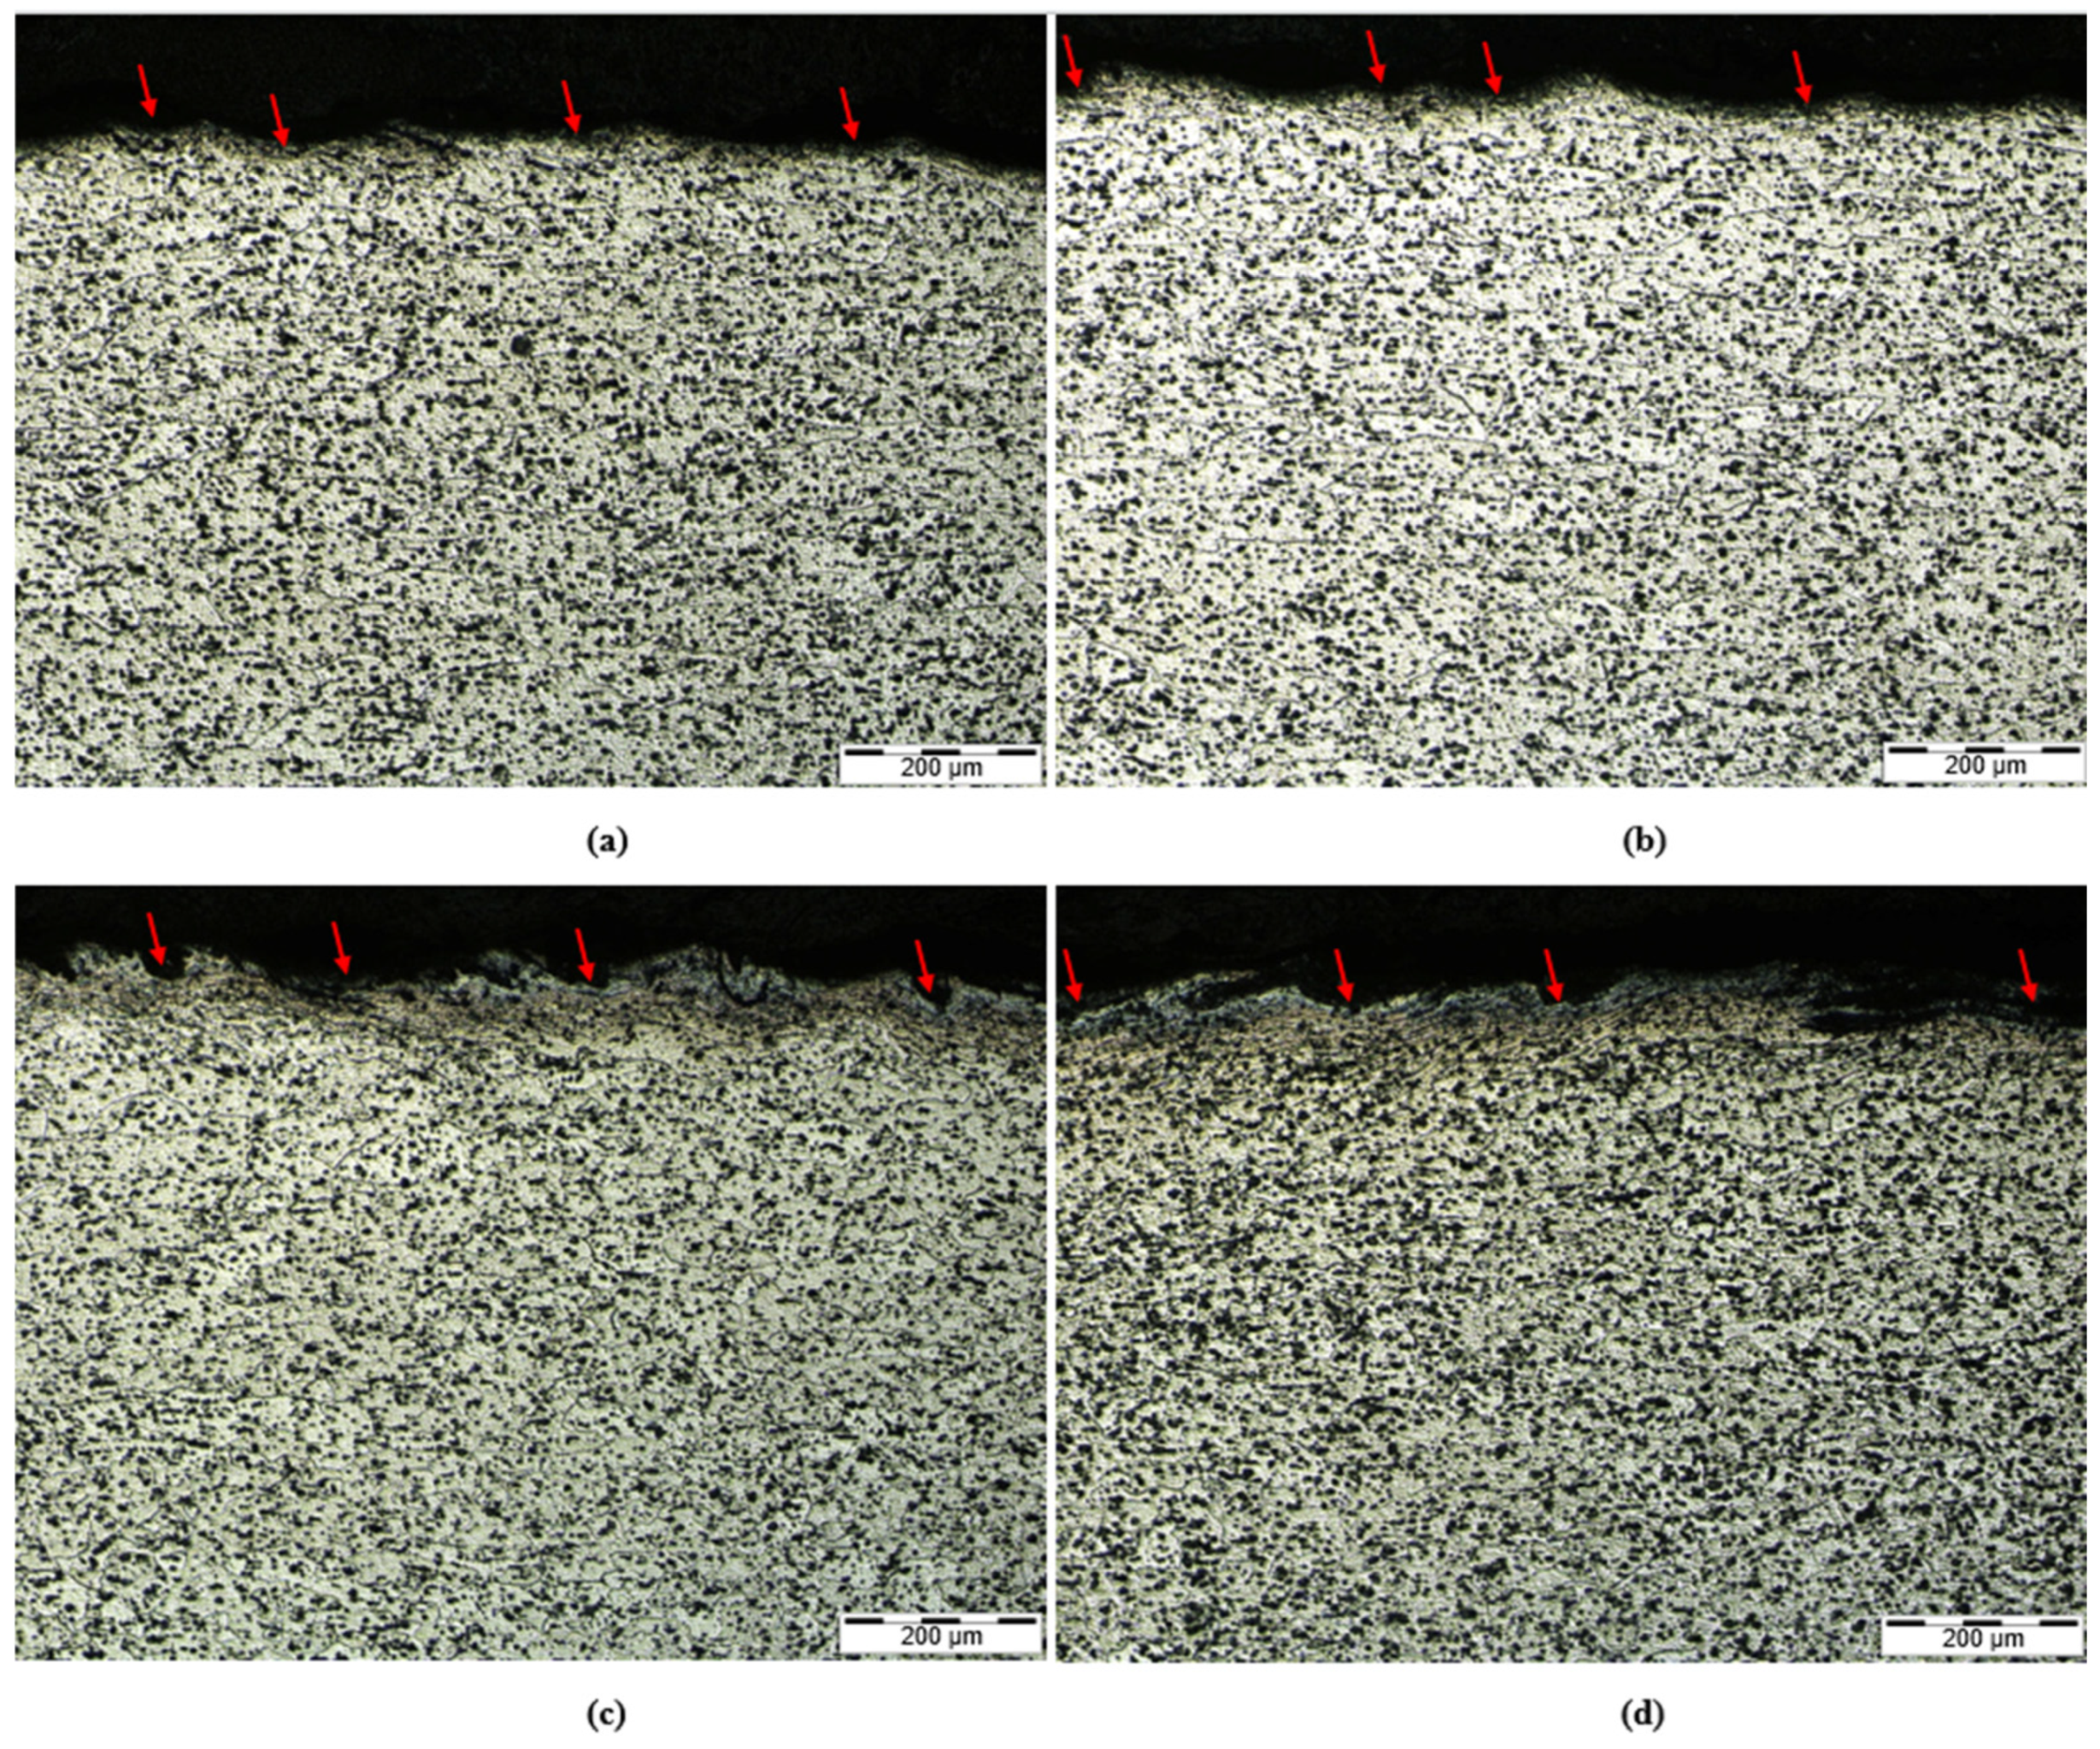
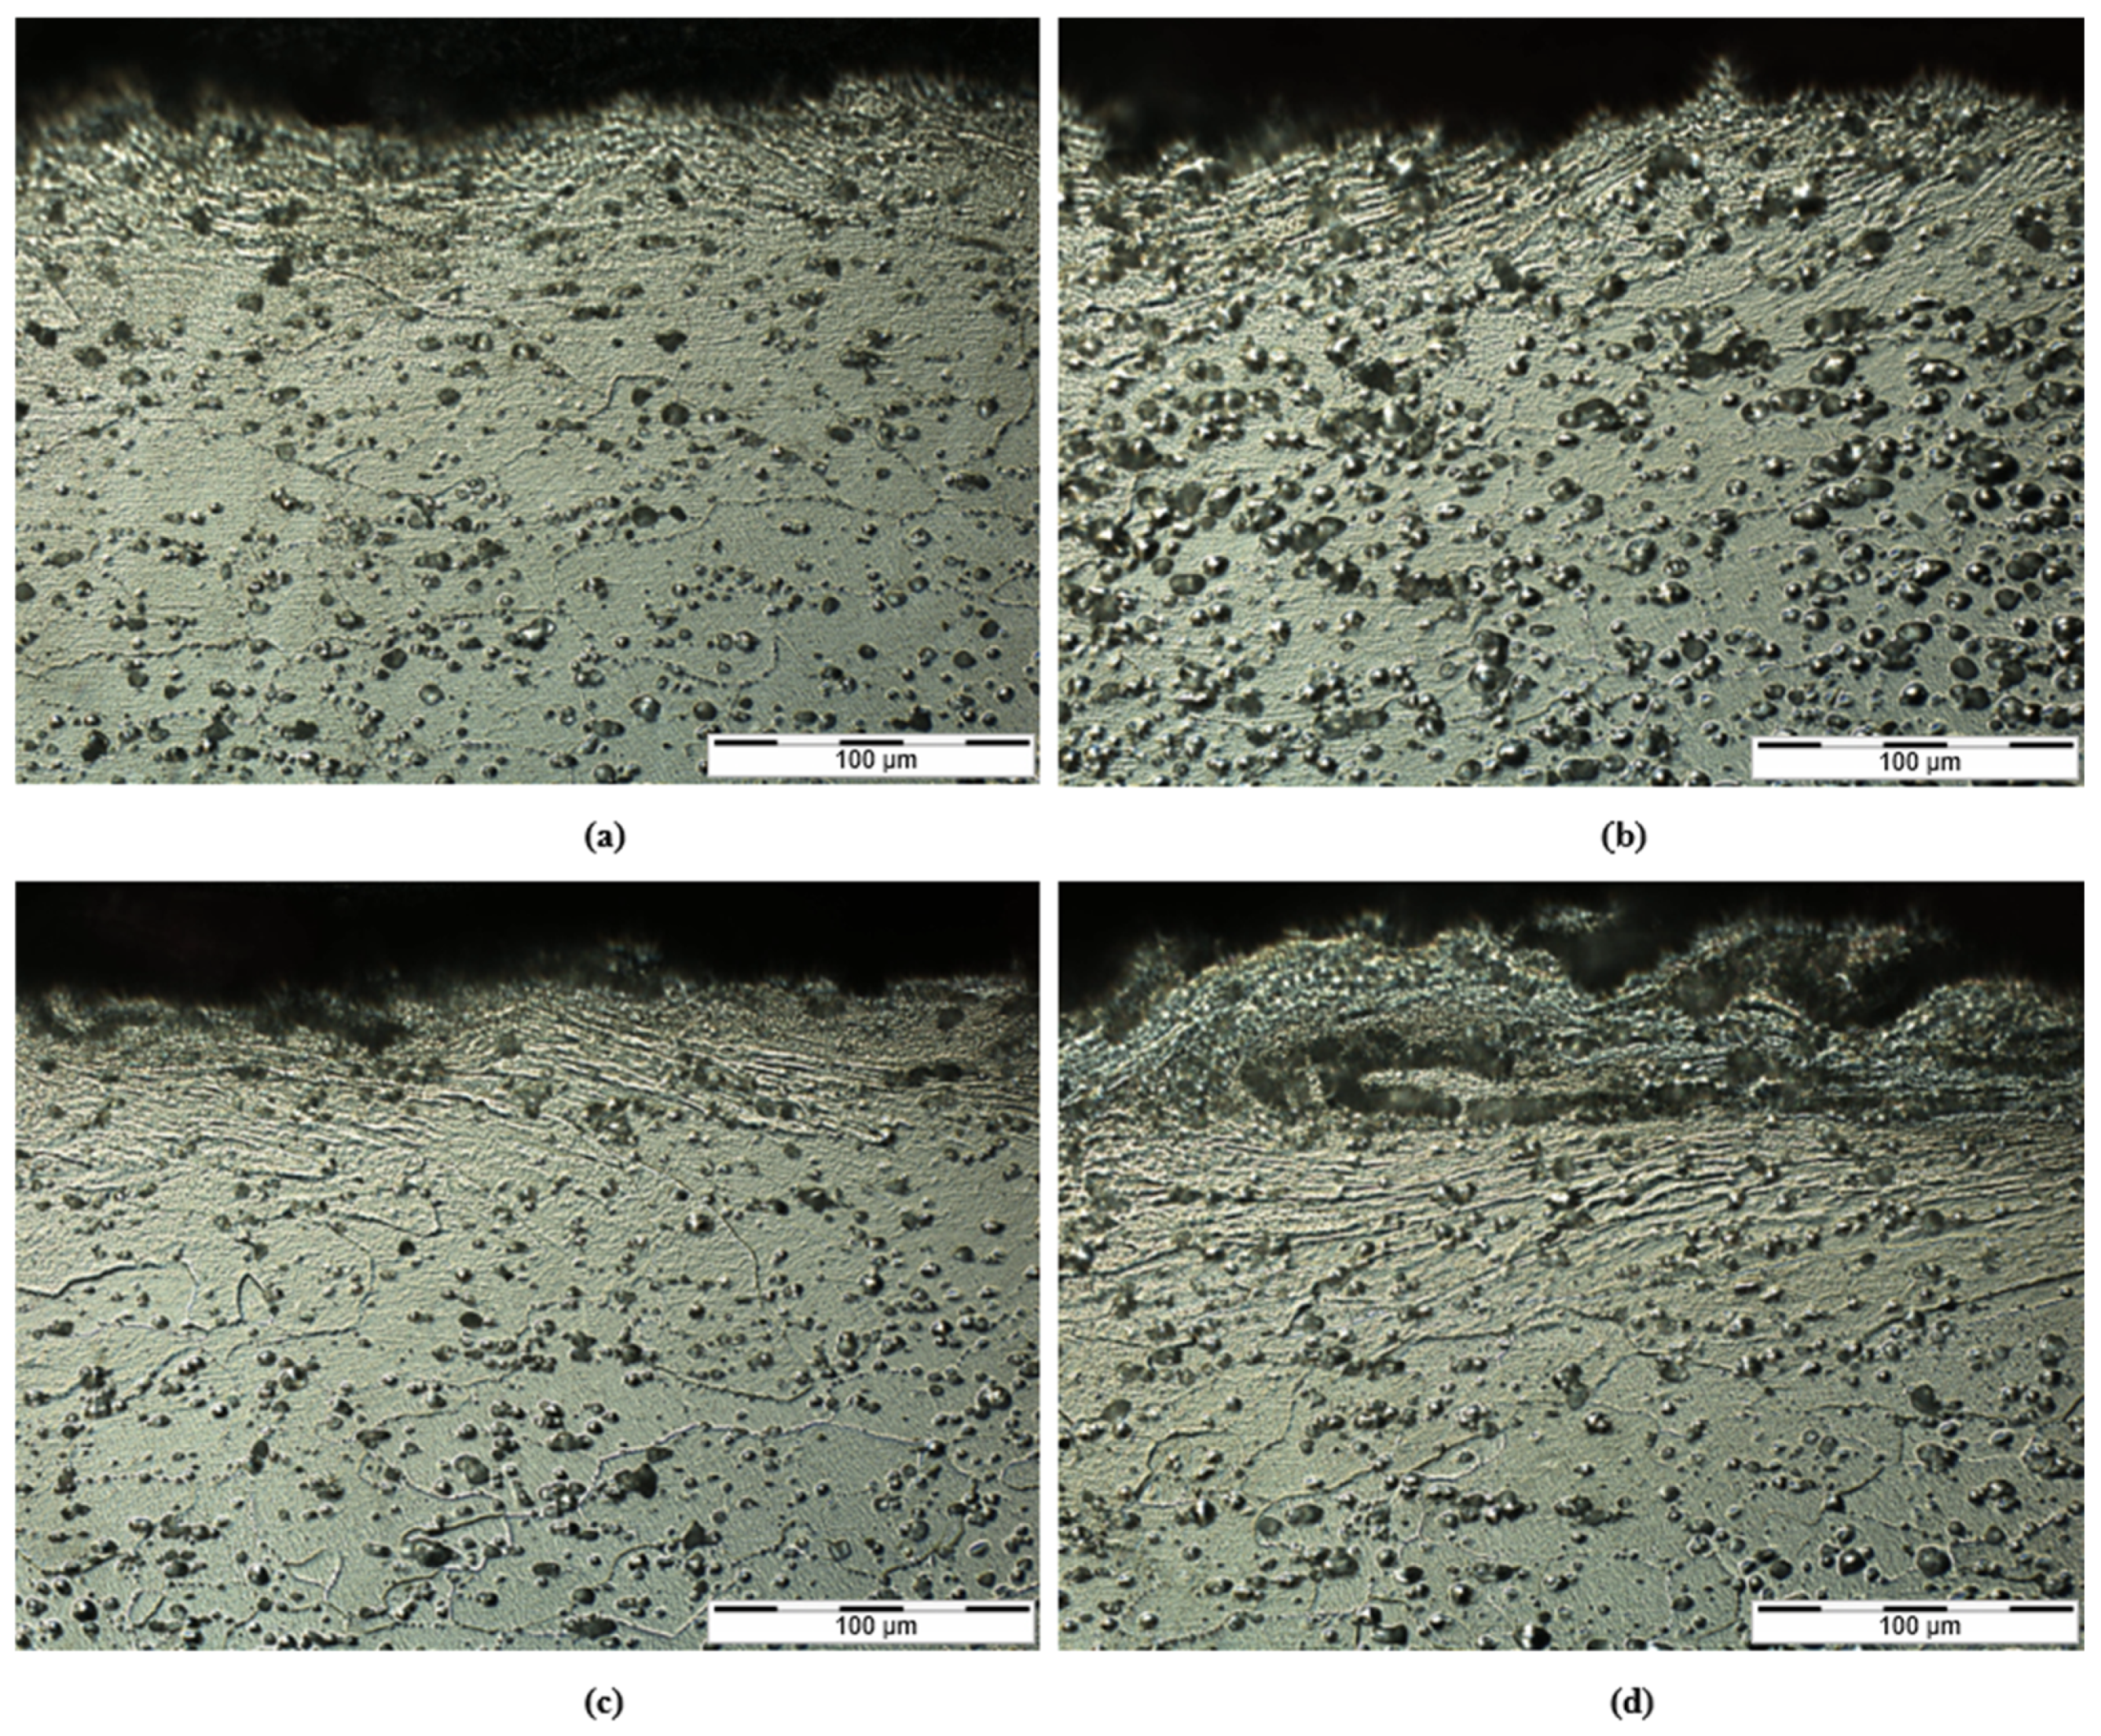
The microstructure of the base metal 6061-T6 aluminum alloy was characterized by a uniform distribution of equiaxed to slightly elongated grains, typically resulting from thermomechanical processing and subsequent T6 heat treatment. Ji et al. and Jiang et al. obtained the same elongated microstructures in their work [21,22]. As shown in Figure 5, the microstructure evaluation of 6061-T6 aluminum alloy that was subjected to shot peening at various coverage rates (100%, 200%, 500%, and 1500%) revealed a clear gradient in deformation extending from the surface into the sample, highlighting the localized nature of plastic deformation. As seen in Figure 5, each arrow points to a dimple formed by localized plastic deformation resulting from the high-velocity impact of shot particles. Generally, 6061-T6 alloy contains Mg2Si precipitates. This was confirmed through SEM and EDS analysis, as shown in Figure 6, which belongs to the SP500 sample and was taken from near the surface region. The greater magnification of microstructures is presented in Figure 7. As a result of increasing shot peening coverage, the thickness of the severely plastically deformed surface layer gradually increased. Near the surface, grain refinement was observed, especially at higher coverage rates, where the grains were elongated and subgrain formation was detected, indicating the activation of dynamic recovery and possible continuous dynamic recrystallization mechanisms. This severely deformed layer resulted from intense localized plastic strain caused by repeated shot impacts, leading to a significant increase in dislocation density and, consequently, enhanced surface hardness. Beneath this layer, a transition zone was formed, characterized by partially deformed grains. The depth and intensity of this transition zone varied depending on the coverage rates and became more pronounced as the coverage rate increased. At the deeper part of the sample surface, the microstructure remained unchanged, maintaining the equiaxed grains typical of the T6 temper treatment, indicating that the effect of shot peening is primarily confined to the near-surface region. In sample SP100 (100% coverage), the surface showed limited plastic deformation, resulting in a relatively thin deformed layer with slight grain elongation and minimal substructure development. In SP200 (200% coverage), the severity of surface deformation increased, producing a more clearly defined transition zone and more noticeable grain distortion in the surface region. However, subgrain formation remained limited, and overall refinement was still moderate. In contrast, SP500 (500% coverage) exhibited significantly more pronounced deformation, with the formation of much thicker deformed layers. The transition zone become broader, indicating deeper penetration of plastic strain. Finally, in SP1500 (1500% coverage), the surface was subjected to intense and repeated impacts, resulting in extensive grain refinement, lamellar and elongated grain structure, and dense subgrain networks, typical indicators of severe plastic deformation. This coverage rate produced the deepest deformed layer among all coverage rates, suggesting the highest surface hardening potential. These gradual microstructural changes from SP100 to SP1500 enabled a clear correlation between increasing shot peening coverage and the extent of microstructural evolution, which directly contributed to improvements in surface-related mechanical properties, such as wear resistance and hardness.
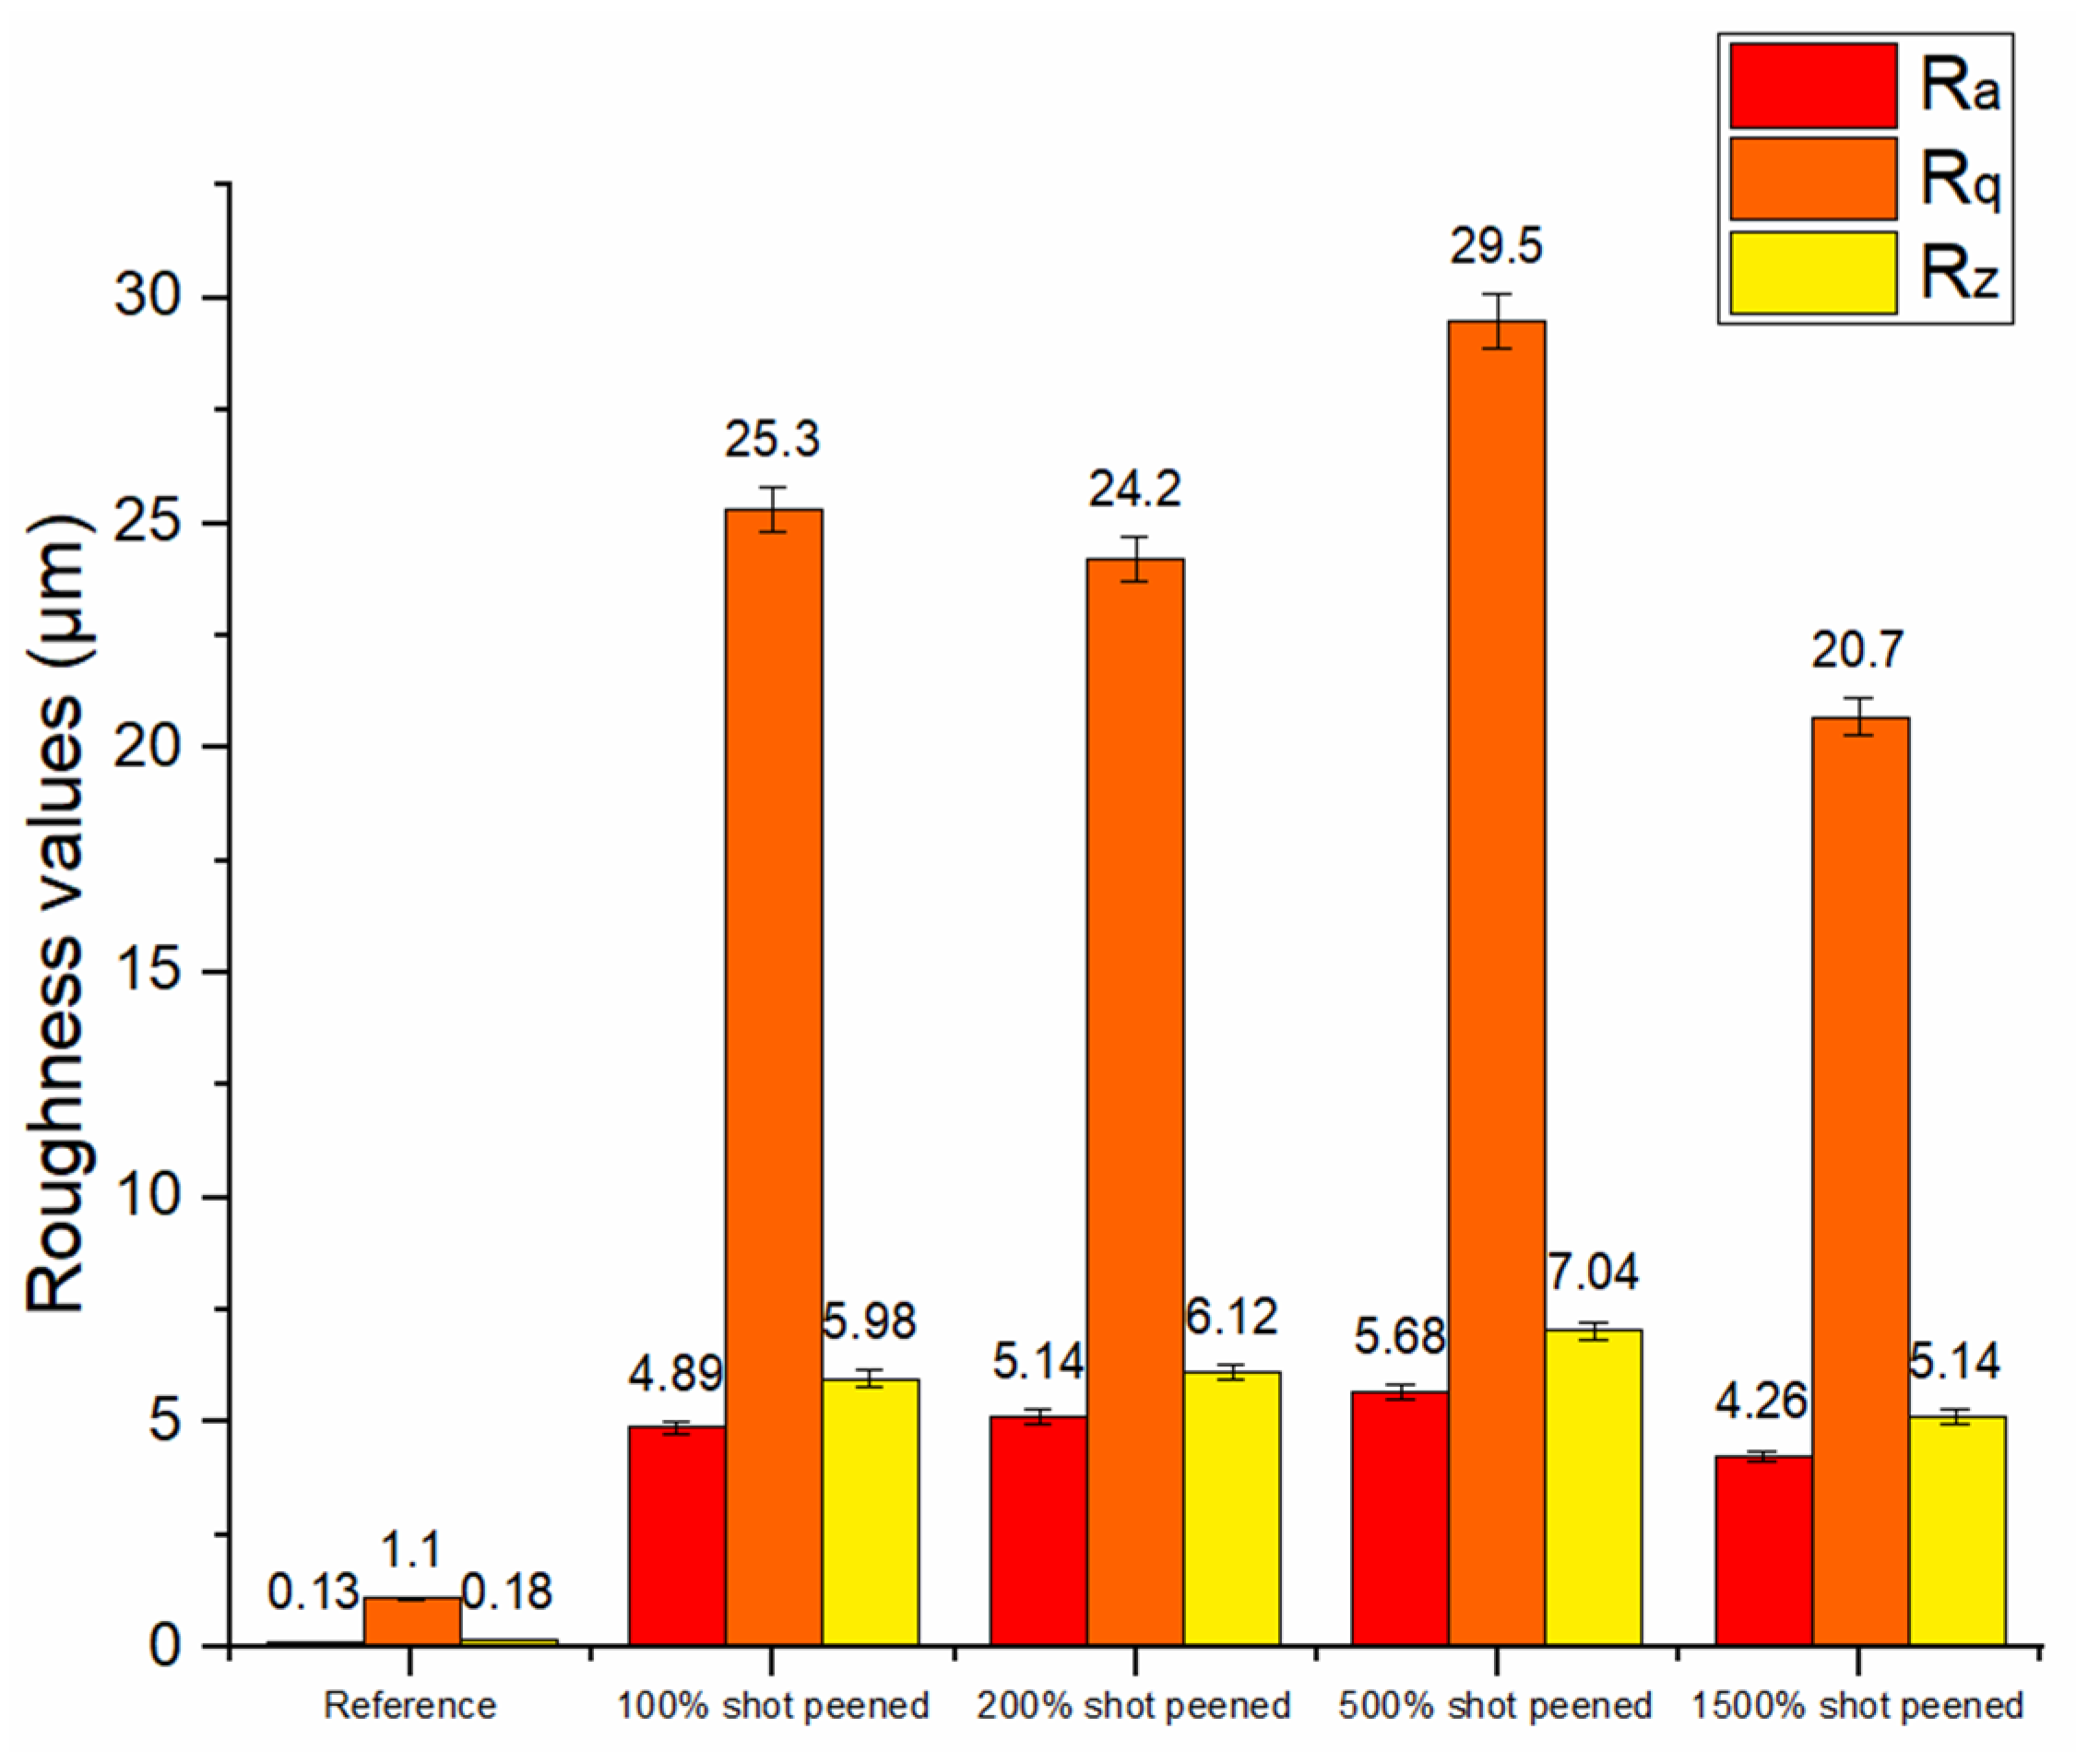
Surface morphological changes were characterized by using optical microscopy, scanning electron microscopy (SEM), and 3D surface topography analysis. Figure 8 shows a comparative analysis of the surface topography of the samples subjected to shot peening at 100%, 200%, 500%, and 1500% coverage rates. Dense distributed dimples seen across the surface are the result of localized plastic flow caused by repeated impacts of steel shots. These small impacts formed depressions surrounded by slight material pile-ups. As a result, the surface became substantially rougher compared to the untreated sample. The observed dimples are characteristic of shot-peening-induced surface features, each representing the imprint of steel shots. Their diameter and depth were mainly governed by steel shot size and process pressure. Interestingly, this textured surface may also be advantageous in lubricated sliding contacts, where the dimples can act as oil reservoirs, reducing friction and wear rates. Surface roughness parameters Ra (arithmetical mean roughness), Rz (maximum height of the profile), and Rq (root mean square roughness) exhibited a non-monotonic trend with increasing shot peening coverage rates on 6061-T6 aluminum alloy, as presented in Figure 9. Specifically, Ra and Rz values increased progressively from 100% to 500% coverage rates but decreased at 1500% coverage. Similarly, Rq followed the same trend, with its lowest value obtained at 1500% coverage. This behavior can be explained by considering the surface deformation mechanisms activated at different peening intensities. As the coverage rates increased, the impact density rose, leading to the formation of more pronounced peaks and valleys on the surface. These irregularities increased the average vertical deviations (Ra) and the maximum height difference between the five highest peaks and the five deepest valleys (Rz). The accumulation of plastically deformed zones contributed to a rougher surface texture, resulting in higher Ra and Rz values. At 1500% coverage, however, the surface exposed severe shot peening, and the same surface regions were shot-peened multiple times. This led to a smoothing phenomenon due to the material flow and plastic flattening of sharp asperities, as shown in Figure 10. The repeated shot peening caused the surface to become more homogenized and flatter. This case had reduced average roughness values. The same behavior was observed and reported by Bao et al. [23]. At lower coverage rates, sharp peaks and deep valleys contributed significantly to the Rq value. However, at 1500% coverage, repeated peening flattened these asperities, which led to a marked reduction in the Rq value. In design applications, the balance between surface finish, hardness, and residual stress should be considered depending on the specific service requirements. If a high-quality surface finish is required, subsequent surface polishing can be applied, thus ensuring both mechanical integrity and surface quality.
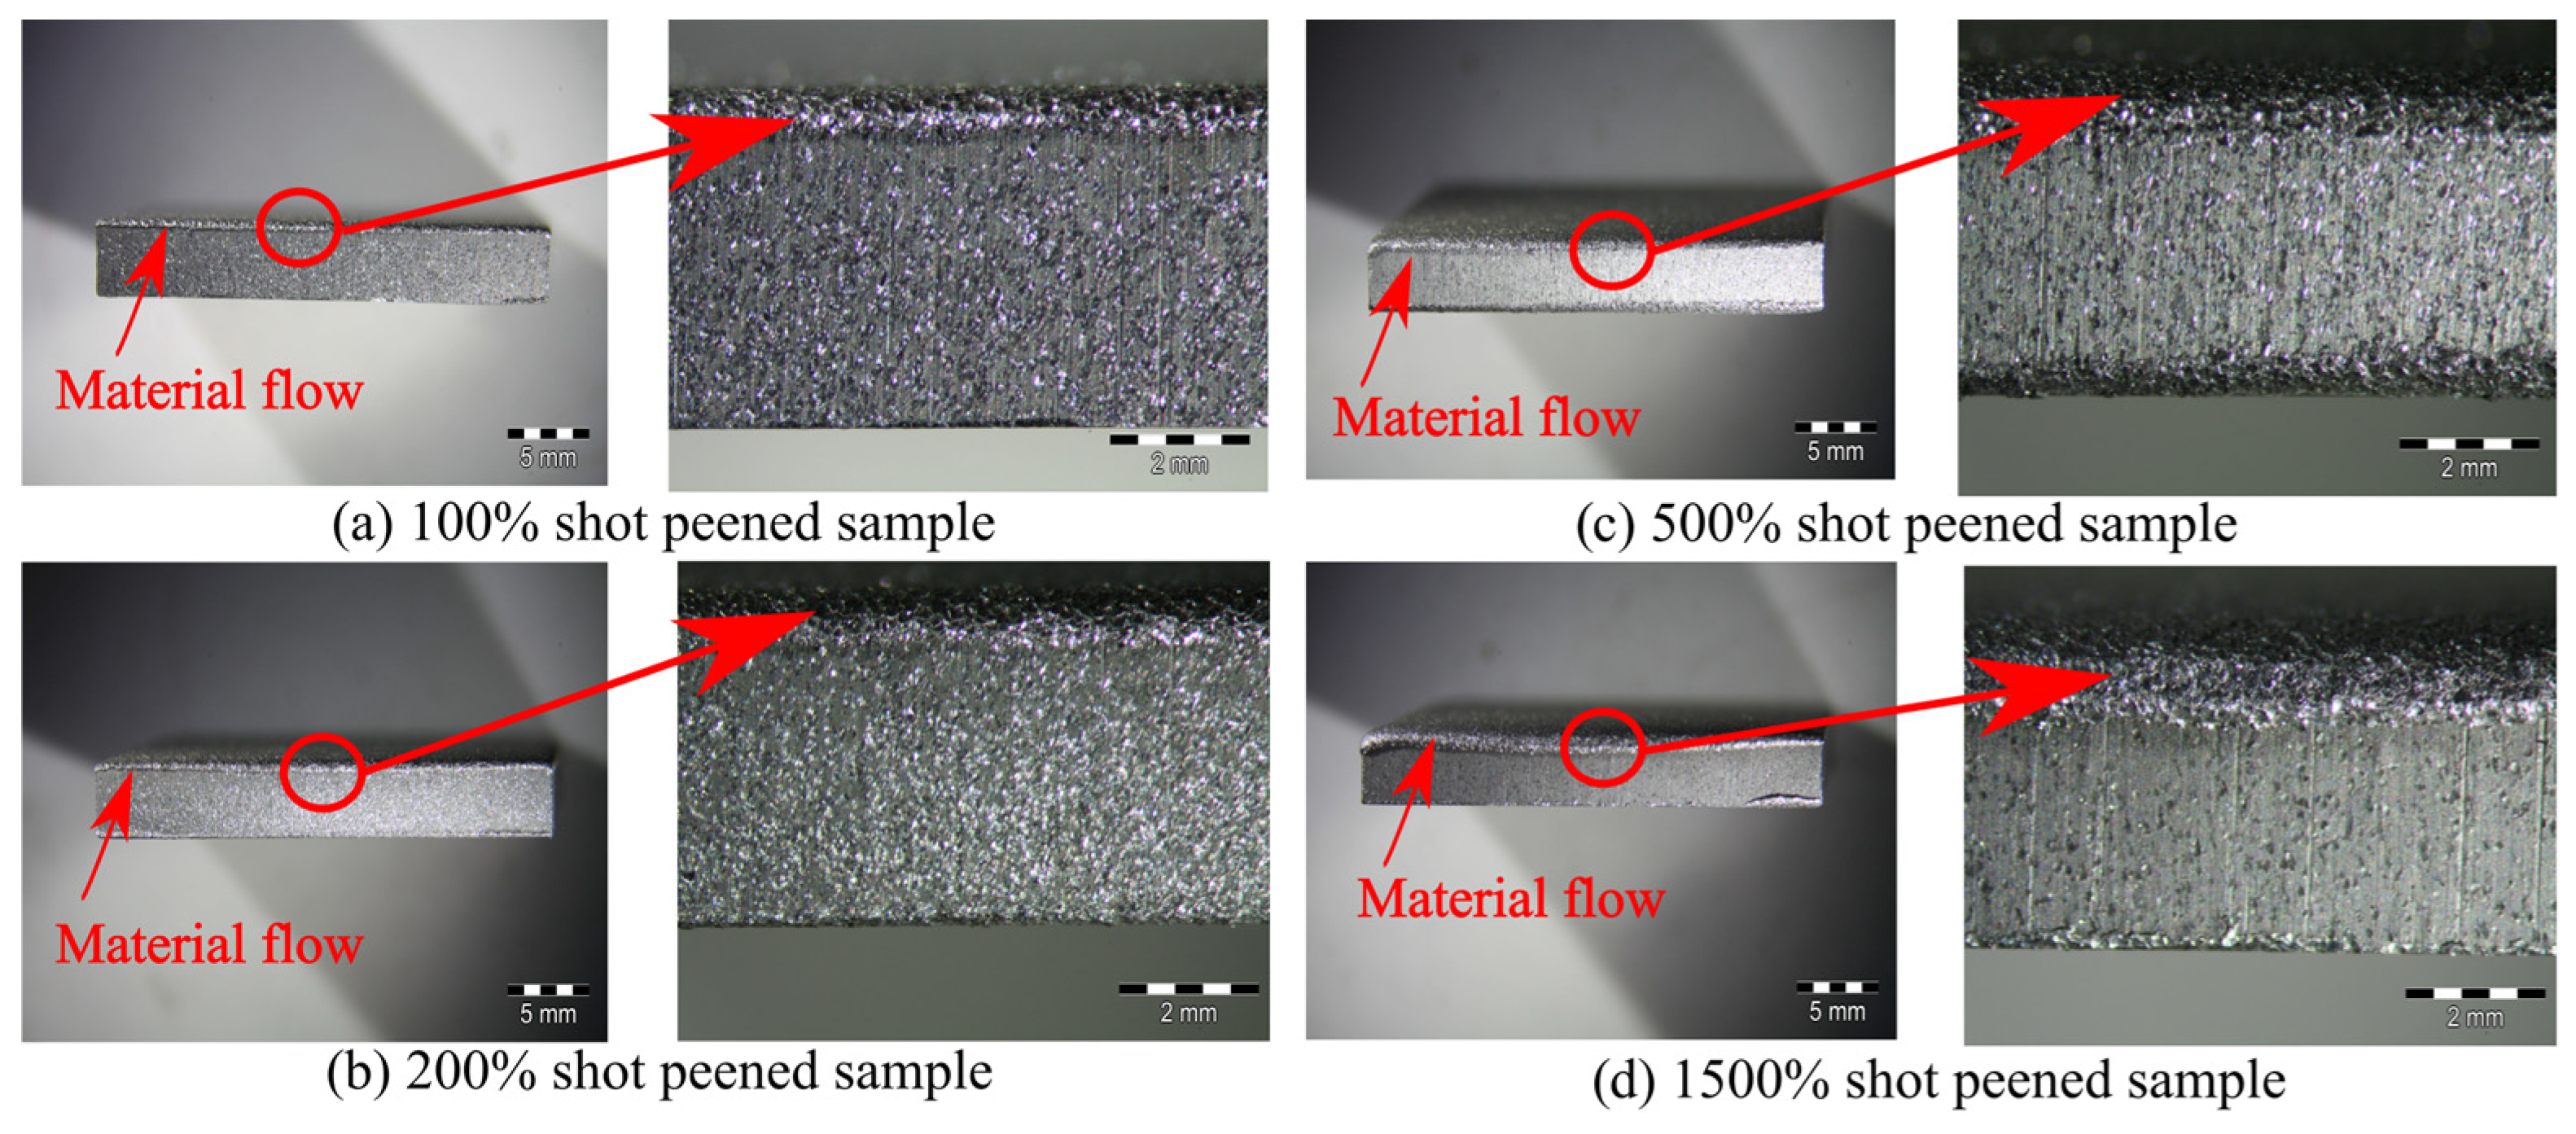
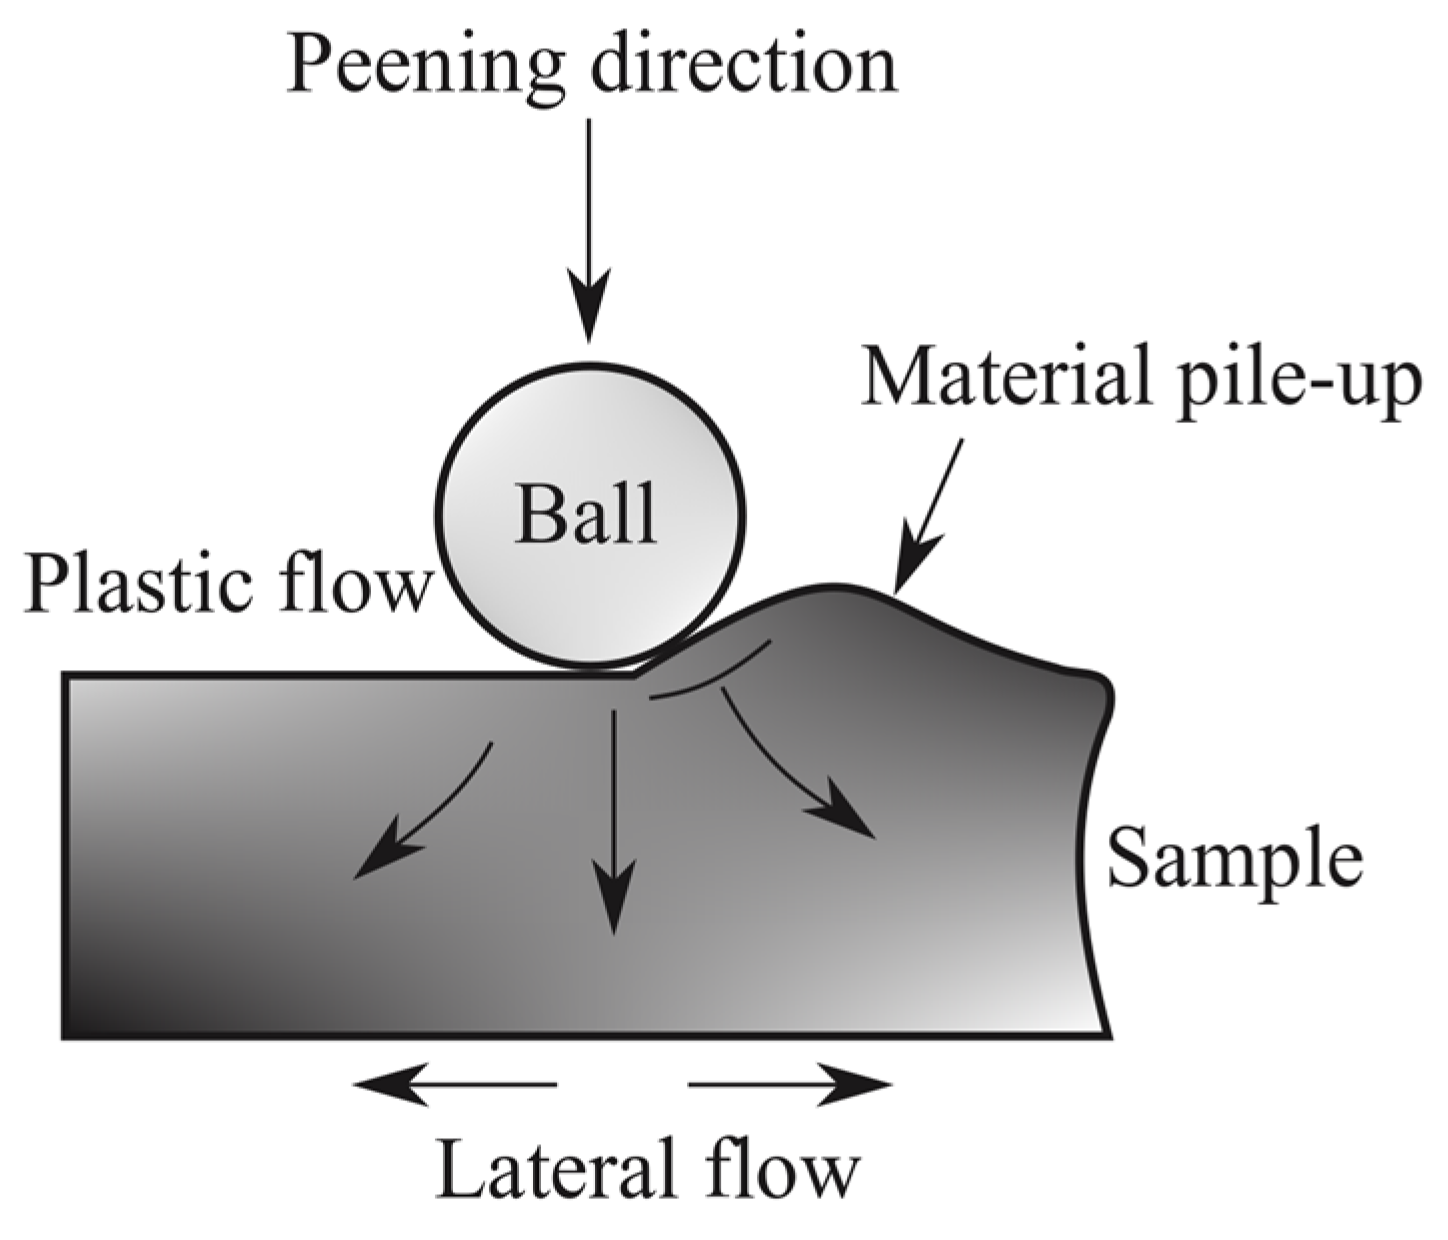
During shot peening of 6061-T6 aluminum alloy at increasing coverage rates (100%, 200%, 500%, and 1500%), a distinct phenomenon of material pile-up was observed, particularly near the sample edges, as shown in Figure 11. This effect became more visible and pronounced as the coverage rate increased, and it can be attributed to the cumulative plastic deformation induced by repetitive shot peening. The repeated cold working of the sample generated compressive stress and plastic flow, causing lateral material displacement. Because the central regions of the sample are more constrained, the plastically deformed material tends to flow toward regions of lower mechanical resistance, namely, the free edges of the sample. This lateral material flow results in the accumulation or “pile-up” of material near the edges, and these regions can be visible even to the naked eye. Furthermore, the ductility and relatively low yield strength of 6061-T6 aluminum alloy make it more sensitive to such surface deformation behavior. The schematic pile-up and material flow mechanism are depicted in Figure 12. In summary, edge pile-up in shot-peened 6061-T6 samples at high coverage rates is primarily driven by excessive plastic deformation, stress gradients, and lack of boundary constraints, resulting in lateral flow and accumulation of material toward the edges. In practical applications, the observed pile-up can affect dimensional tolerances or surface fatigue performance. It can act as a stress concentrator and influence surface fatigue behavior. Nevertheless, the beneficial compressive residual stresses introduced by shot peening can suppress these effects. If necessary, a post-peening surface finishing process can be performed to minimize pile-up and ensure both dimensional accuracy and reliable fatigue performance.

3.2. Hardness Results

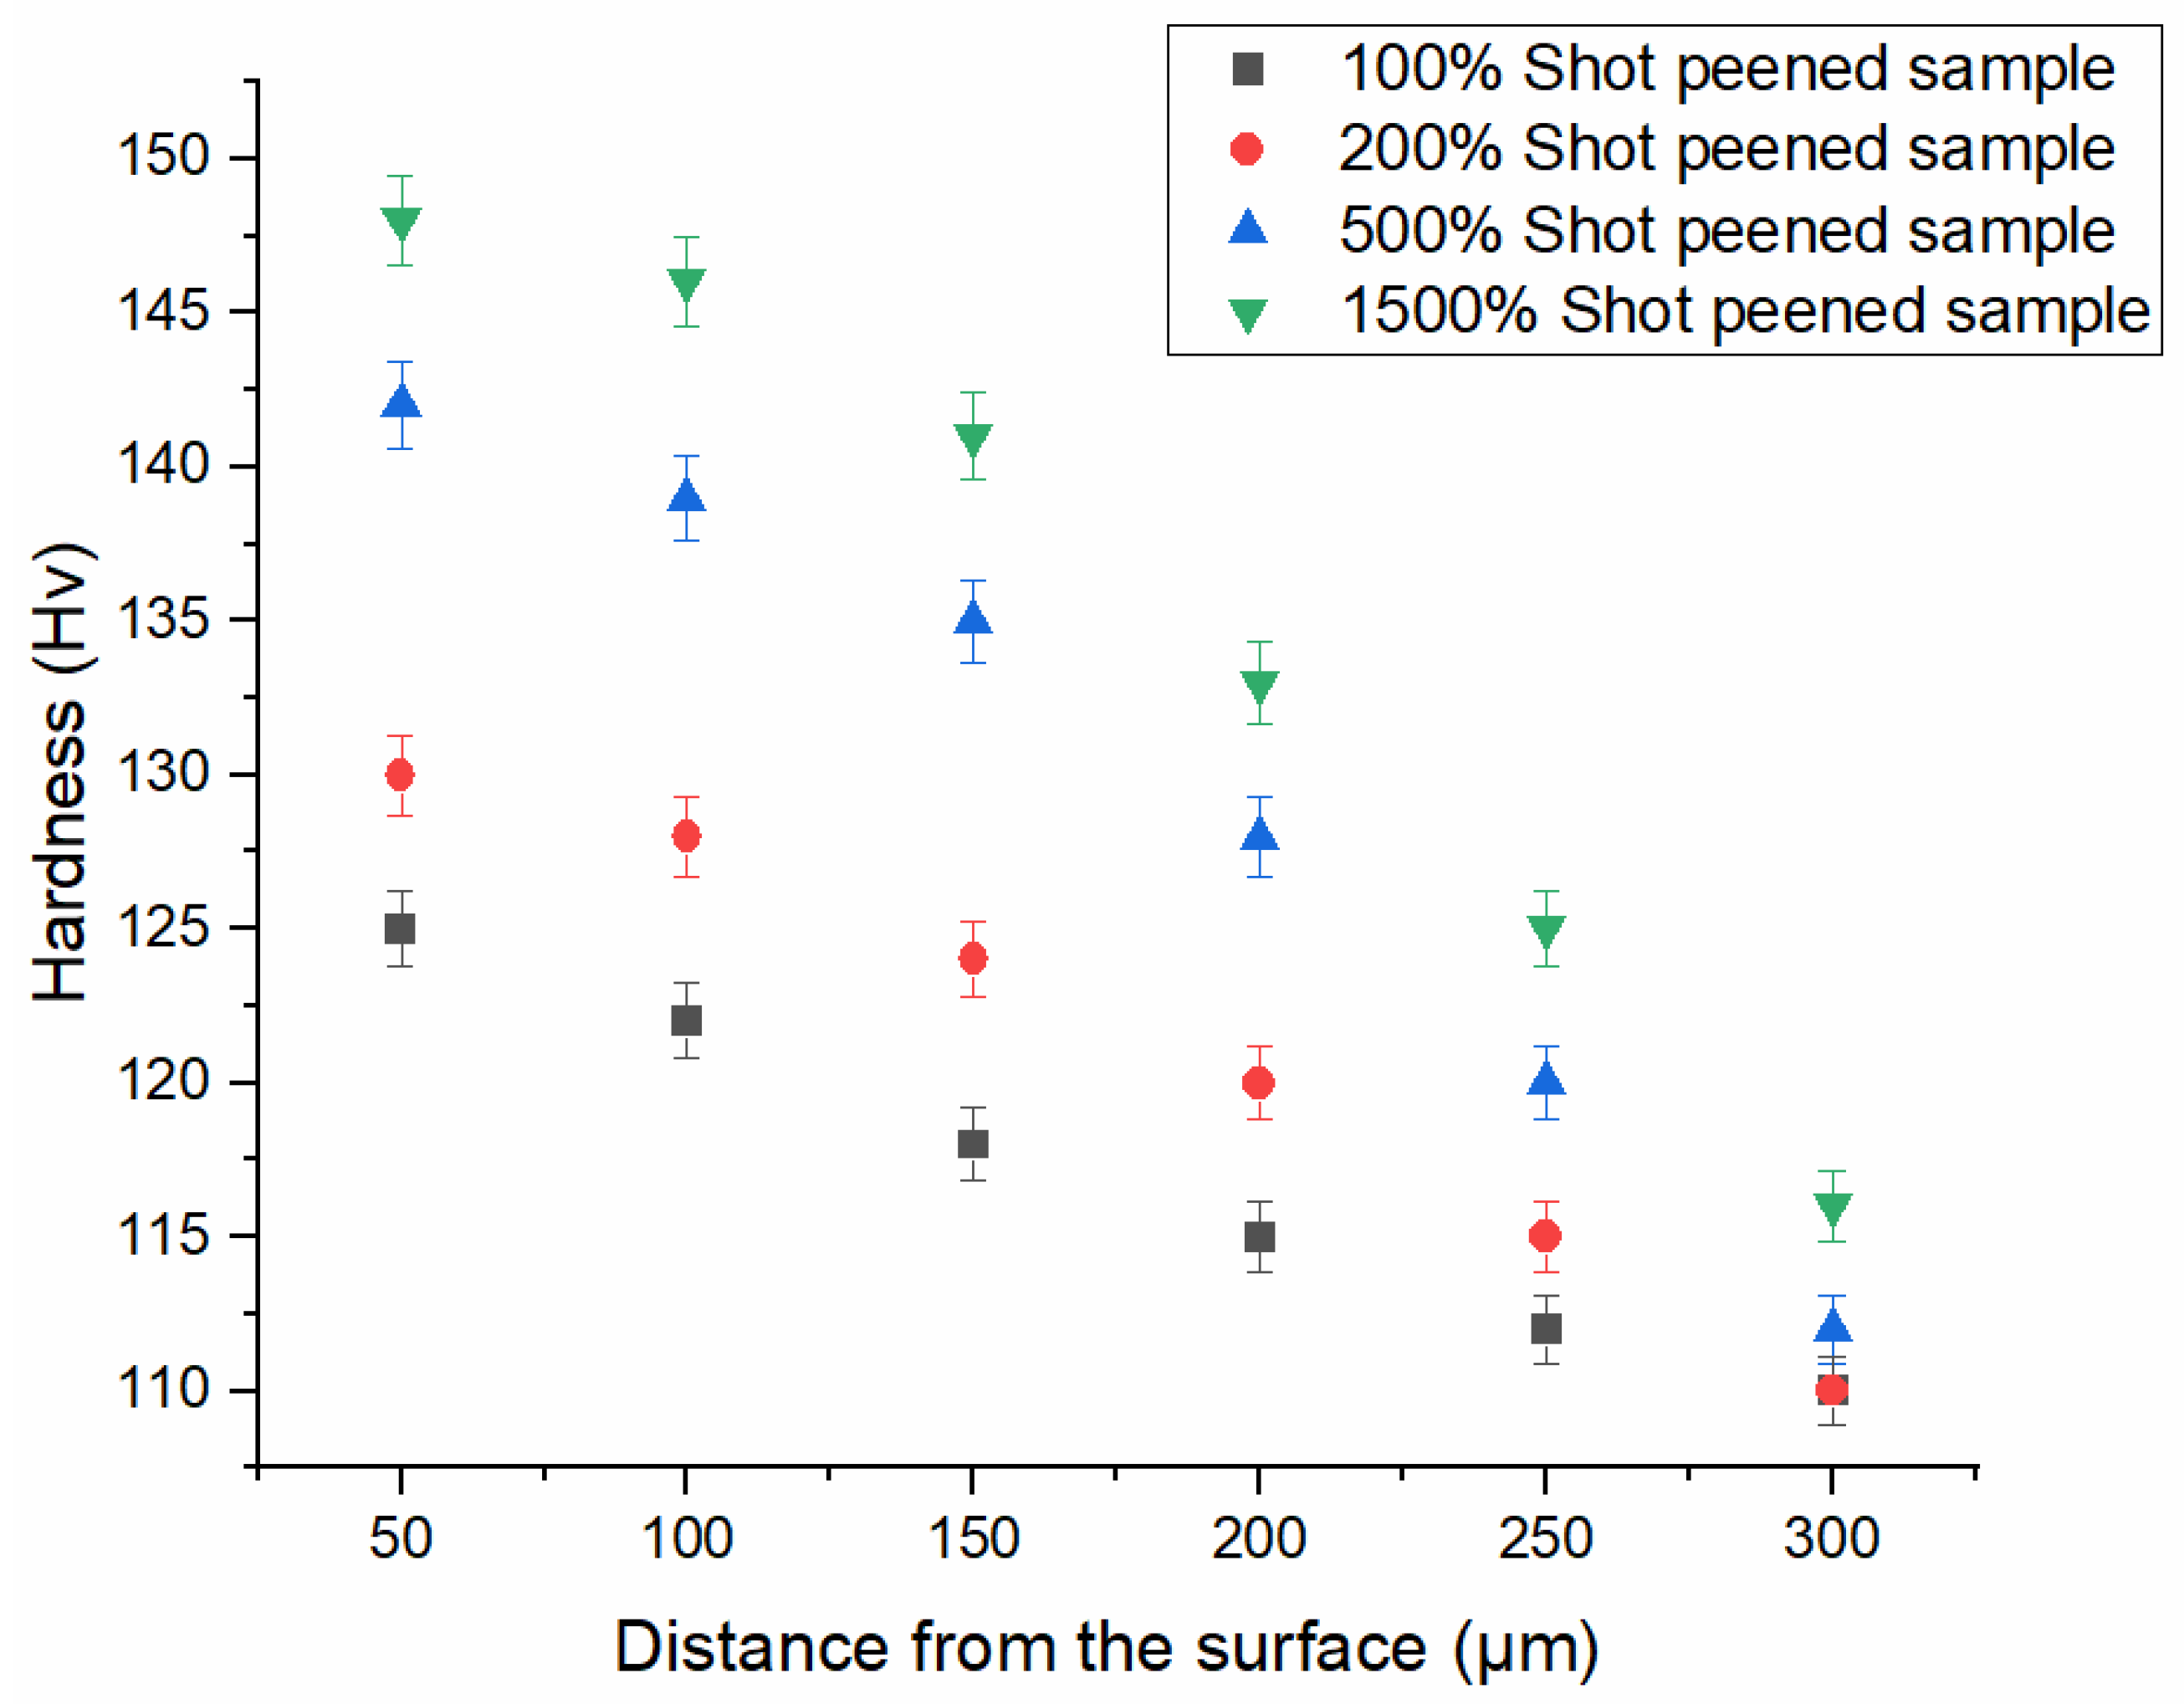
At least five measurements were performed for hardness measurements for each sample, and average hardness values are given in Figure 13. Cross-sectional hardness measurements were carried out from the shot-peened surface into the subsurface until the values approached the hardness of the untreated sample (110 ± 2 HV). The surface hardness results reveal a clear trend among the four tested samples. For the SP100 sample, a moderate increase in hardness was observed, indicating the initial onset of surface strain hardening. As the coverage increased to 200% and then 500%, the hardness values continued to rise, reflecting the cumulative effect of higher shot peening density and plastic deformation, which likely promoted grain refinement and elevated dislocation density near the surface. Grain refinement was observed and gradually increased as the coverage rate increased on the top of the cross-sectional samples. According to the Hall–Petch relationship, grain refinement is associated with the enhancement of mechanical properties, such as hardness, tensile strength, and fatigue resistance [24,25]. Another factor that improves mechanical properties, an increase in the grain boundary, helps prevent the movement of dislocation [15,16,26,27]. The maximum hardness value was obtained as 142 ± 3 HV for the SP500 sample, and it was increased by 1.09 times in comparison to the SP200 sample. Interestingly, the SP1500 sample did not exhibit a significant increase in hardness compared to the SP500 sample. This behavior is attributed to a surface saturation effect, where further impacts no longer contribute to significant work hardening and may even lead to local thermal softening or subsurface microstructural relaxation. Overall, these results highlight a strong correlation between shot peening coverage rates and surface hardening. Moreover, beyond a coverage rate of 500%, the hardness value did not show considerable enhancement.

3.3. Residual Stress Analysis

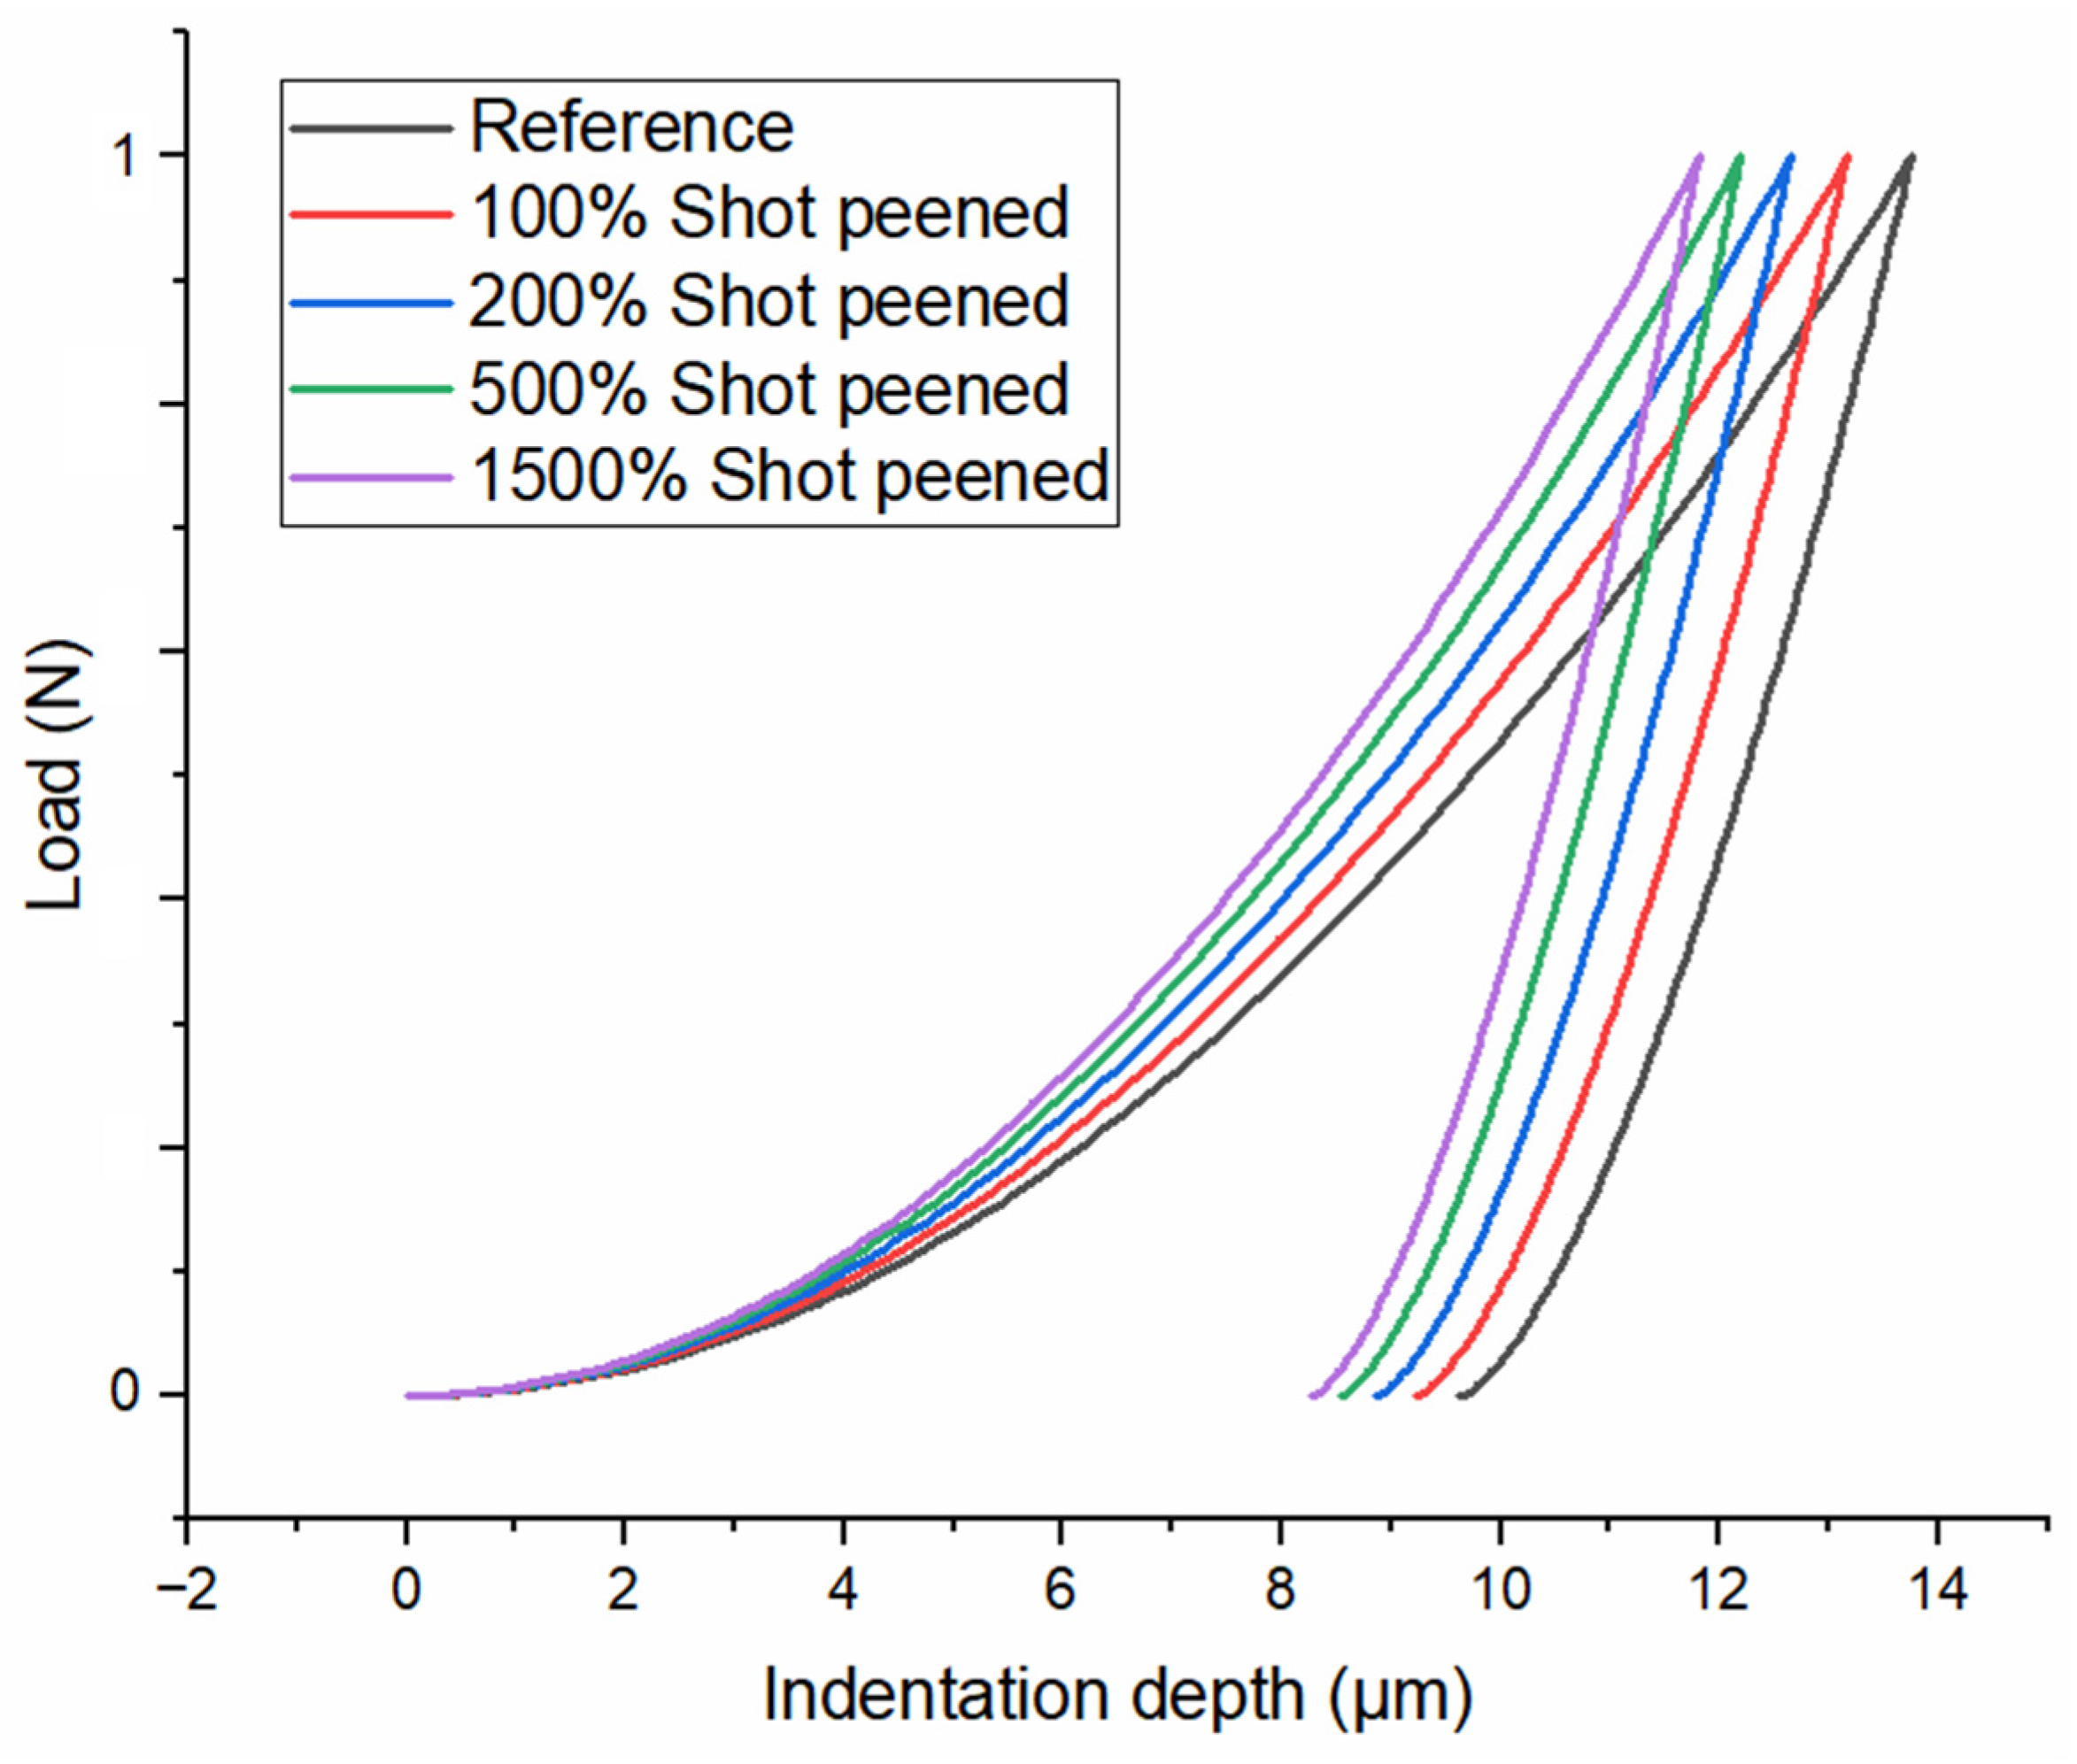
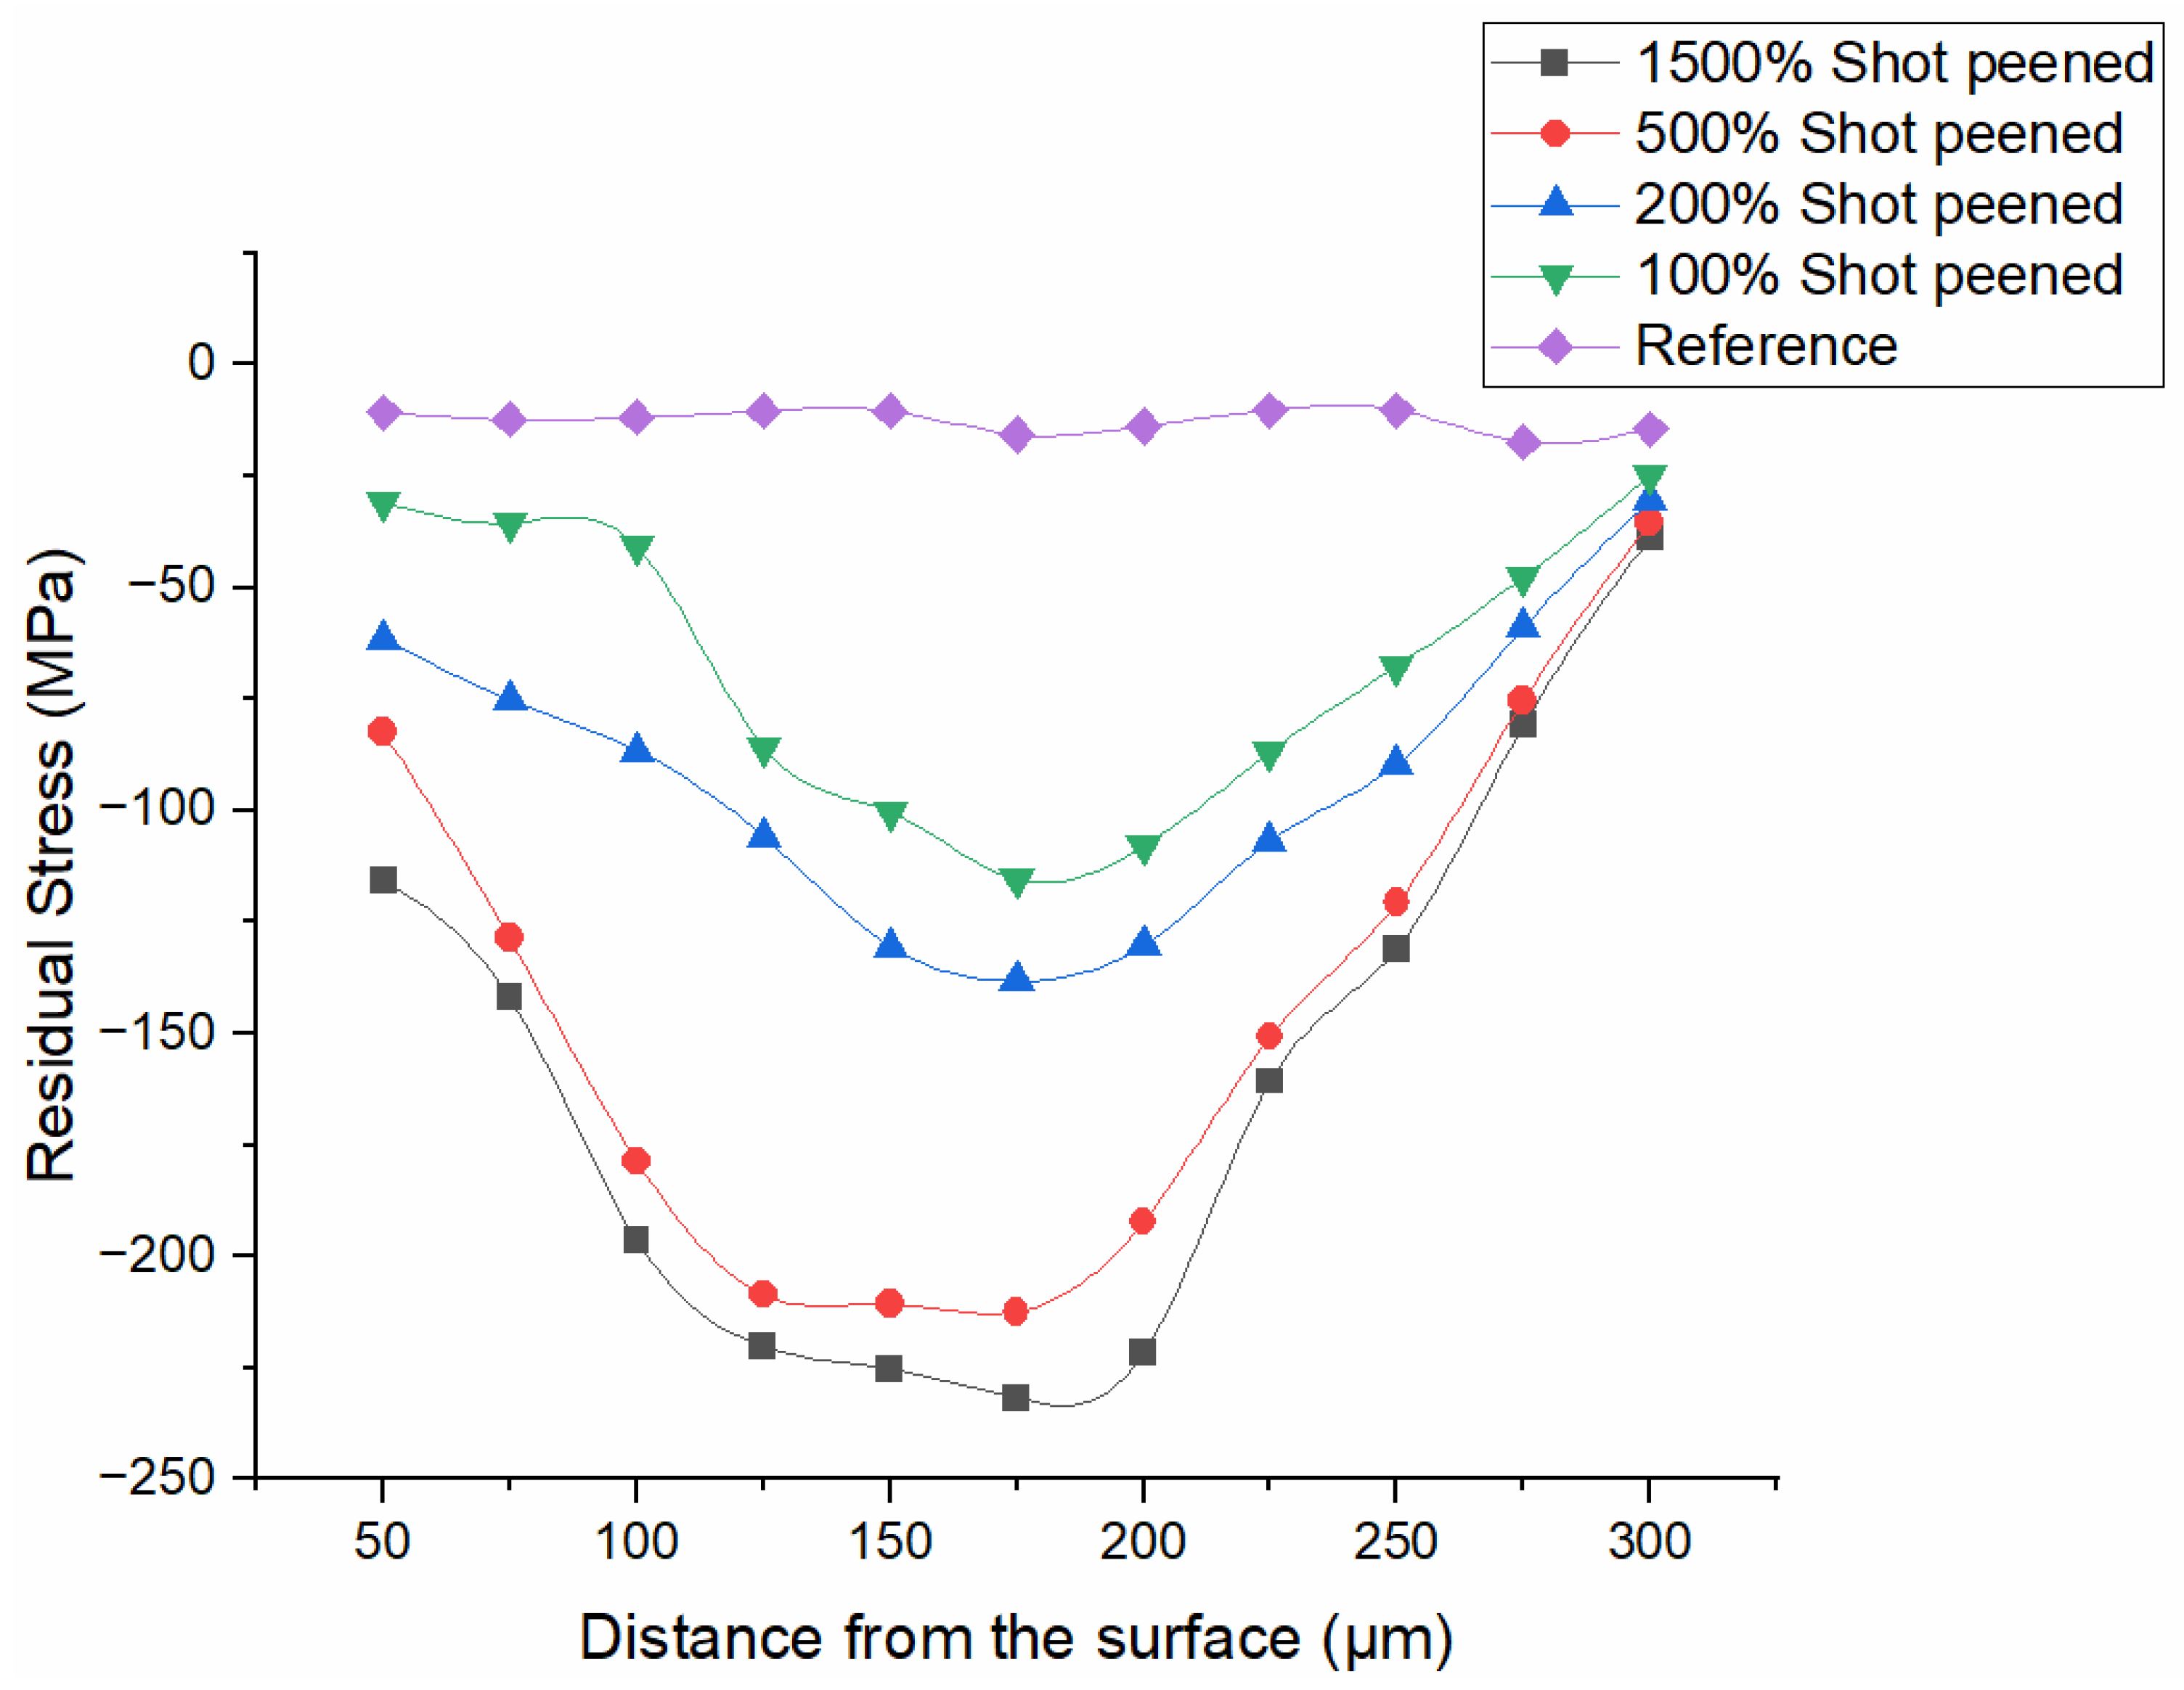
The residual stress behavior of 6061-T6 aluminum alloy was extensively analyzed using the indentation method. The measurements were performed on five different samples, including a reference sample without any surface treatment and four samples that underwent shot peening at different coverage rates: 100% (SP100), 200% (SP200), 500% (SP500), and 1500% (SP1500). The representative loading–unloading plots are shown in Figure 14 for reference, SP100, SP200, SP500, and SP1500 samples. The aim was to investigate how increasing the intensity of shot peening affects the magnitude and depth of compressive residual stresses. In Figure 15, residual stress measurements are shown for all samples. Firstly, the most significant finding is that Ravnikar et al. obtained almost the same residual stress profile for 6082-T651 aluminum alloy [15]. The Sref sample exhibited low magnitude and nearly uniform residual stresses ranging between −10 MPa and −17 MPa throughout the measured depth. This lower residual stress can be attributed to a combination of factors related to the material’s processing history and surface conditions. During the extrusion process followed by solution heat treatment and artificial aging (T6 temper treatment), thermal gradients and non-uniform cooling may induce residual stresses within the material. Moreover, surface preparation techniques, such as cutting, grinding, or polishing, can introduce localized plastic deformation near the surface, leading to the development of shallow compressive stresses. These residual stresses, although significantly lower in magnitude and depth compared to those generated by shot peening, are commonly observed in untreated metallic samples due to internal stress redistribution during manufacturing and surface finishing. Therefore, the measured compressive stresses in the reference sample are likely a result of combined effects and should be considered as a baseline when evaluating the enhancement provided by mechanical surface treatments. In contrast, the shot-peened samples exhibited significant increases in both magnitude and depth of compressive residual stresses as a direct result of surface plastic deformation caused by high-velocity metallic shot media. SP100 displayed a maximum compressive stress of −115 MPa at approximately 175 µm depth, with a noticeable decline in stress magnitude toward both surface and deeper regions. SP200 showed a further increase, reaching −138 MPa at the same depth, indicating that doubling the impact coverage rate enhances subsurface deformation and stress accumulation. SP500 presented a considerable enhancement, attaining a peak of −212 MPa at 175 µm and reflecting a deeply penetrating plastic zone. SP1500 yielded the highest peak value of approximately −231 MPa, also at 175 µm depth, and maintained compressive stress throughout the entire measured region. However, the difference between SP500 and SP1500 was relatively minor despite the threefold increase in coverage rate, suggesting a diminishing return in residual stress enhancement beyond a critical threshold. This plateauing behavior is likely attributed to mechanical saturation, which may limit further dislocation accumulation. Furthermore, the residual stress profiles of SP500 and SP1500 follow a very similar trend beyond 100 µm, indicating comparable subsurface stress states. These findings strongly suggest that while increasing shot peening coverage rates improves surface compressive stress and mechanical performance, excessively high coverage rates may lead to inefficient energy utilization without proportional benefit. Therefore, optimal coverage rates, likely around 500% in this study, can be identified, balancing effective stress generation and processing efficiency. In industrial applications, this coverage rate represents a practical limit for shot peening processes. Exceeding a 500% coverage rate may increase processing time and cost without providing measurable benefits. Furthermore, at a fixed load of 1 N (Figure 14), penetration depth decreased by 4.4%, 8%, 11.7%, and 13.9% for SP100, SP200, SP500, and SP1500 in comparison to the Sref sample, indicating increased near-surface resistance; ductility was assessed approximately using indentation curves, and this assessment should be regarded as qualitative rather than quantitative.
In summary, the comprehensive compressive stress data not only provide insight into the materials’ response to surface treatment but also play a crucial role in predicting improvements in fatigue life, crack initiation resistance, and overall surface integrity in lightweight, high-strength aluminum alloys used in demanding structural applications.

3.4. Wear Test Results

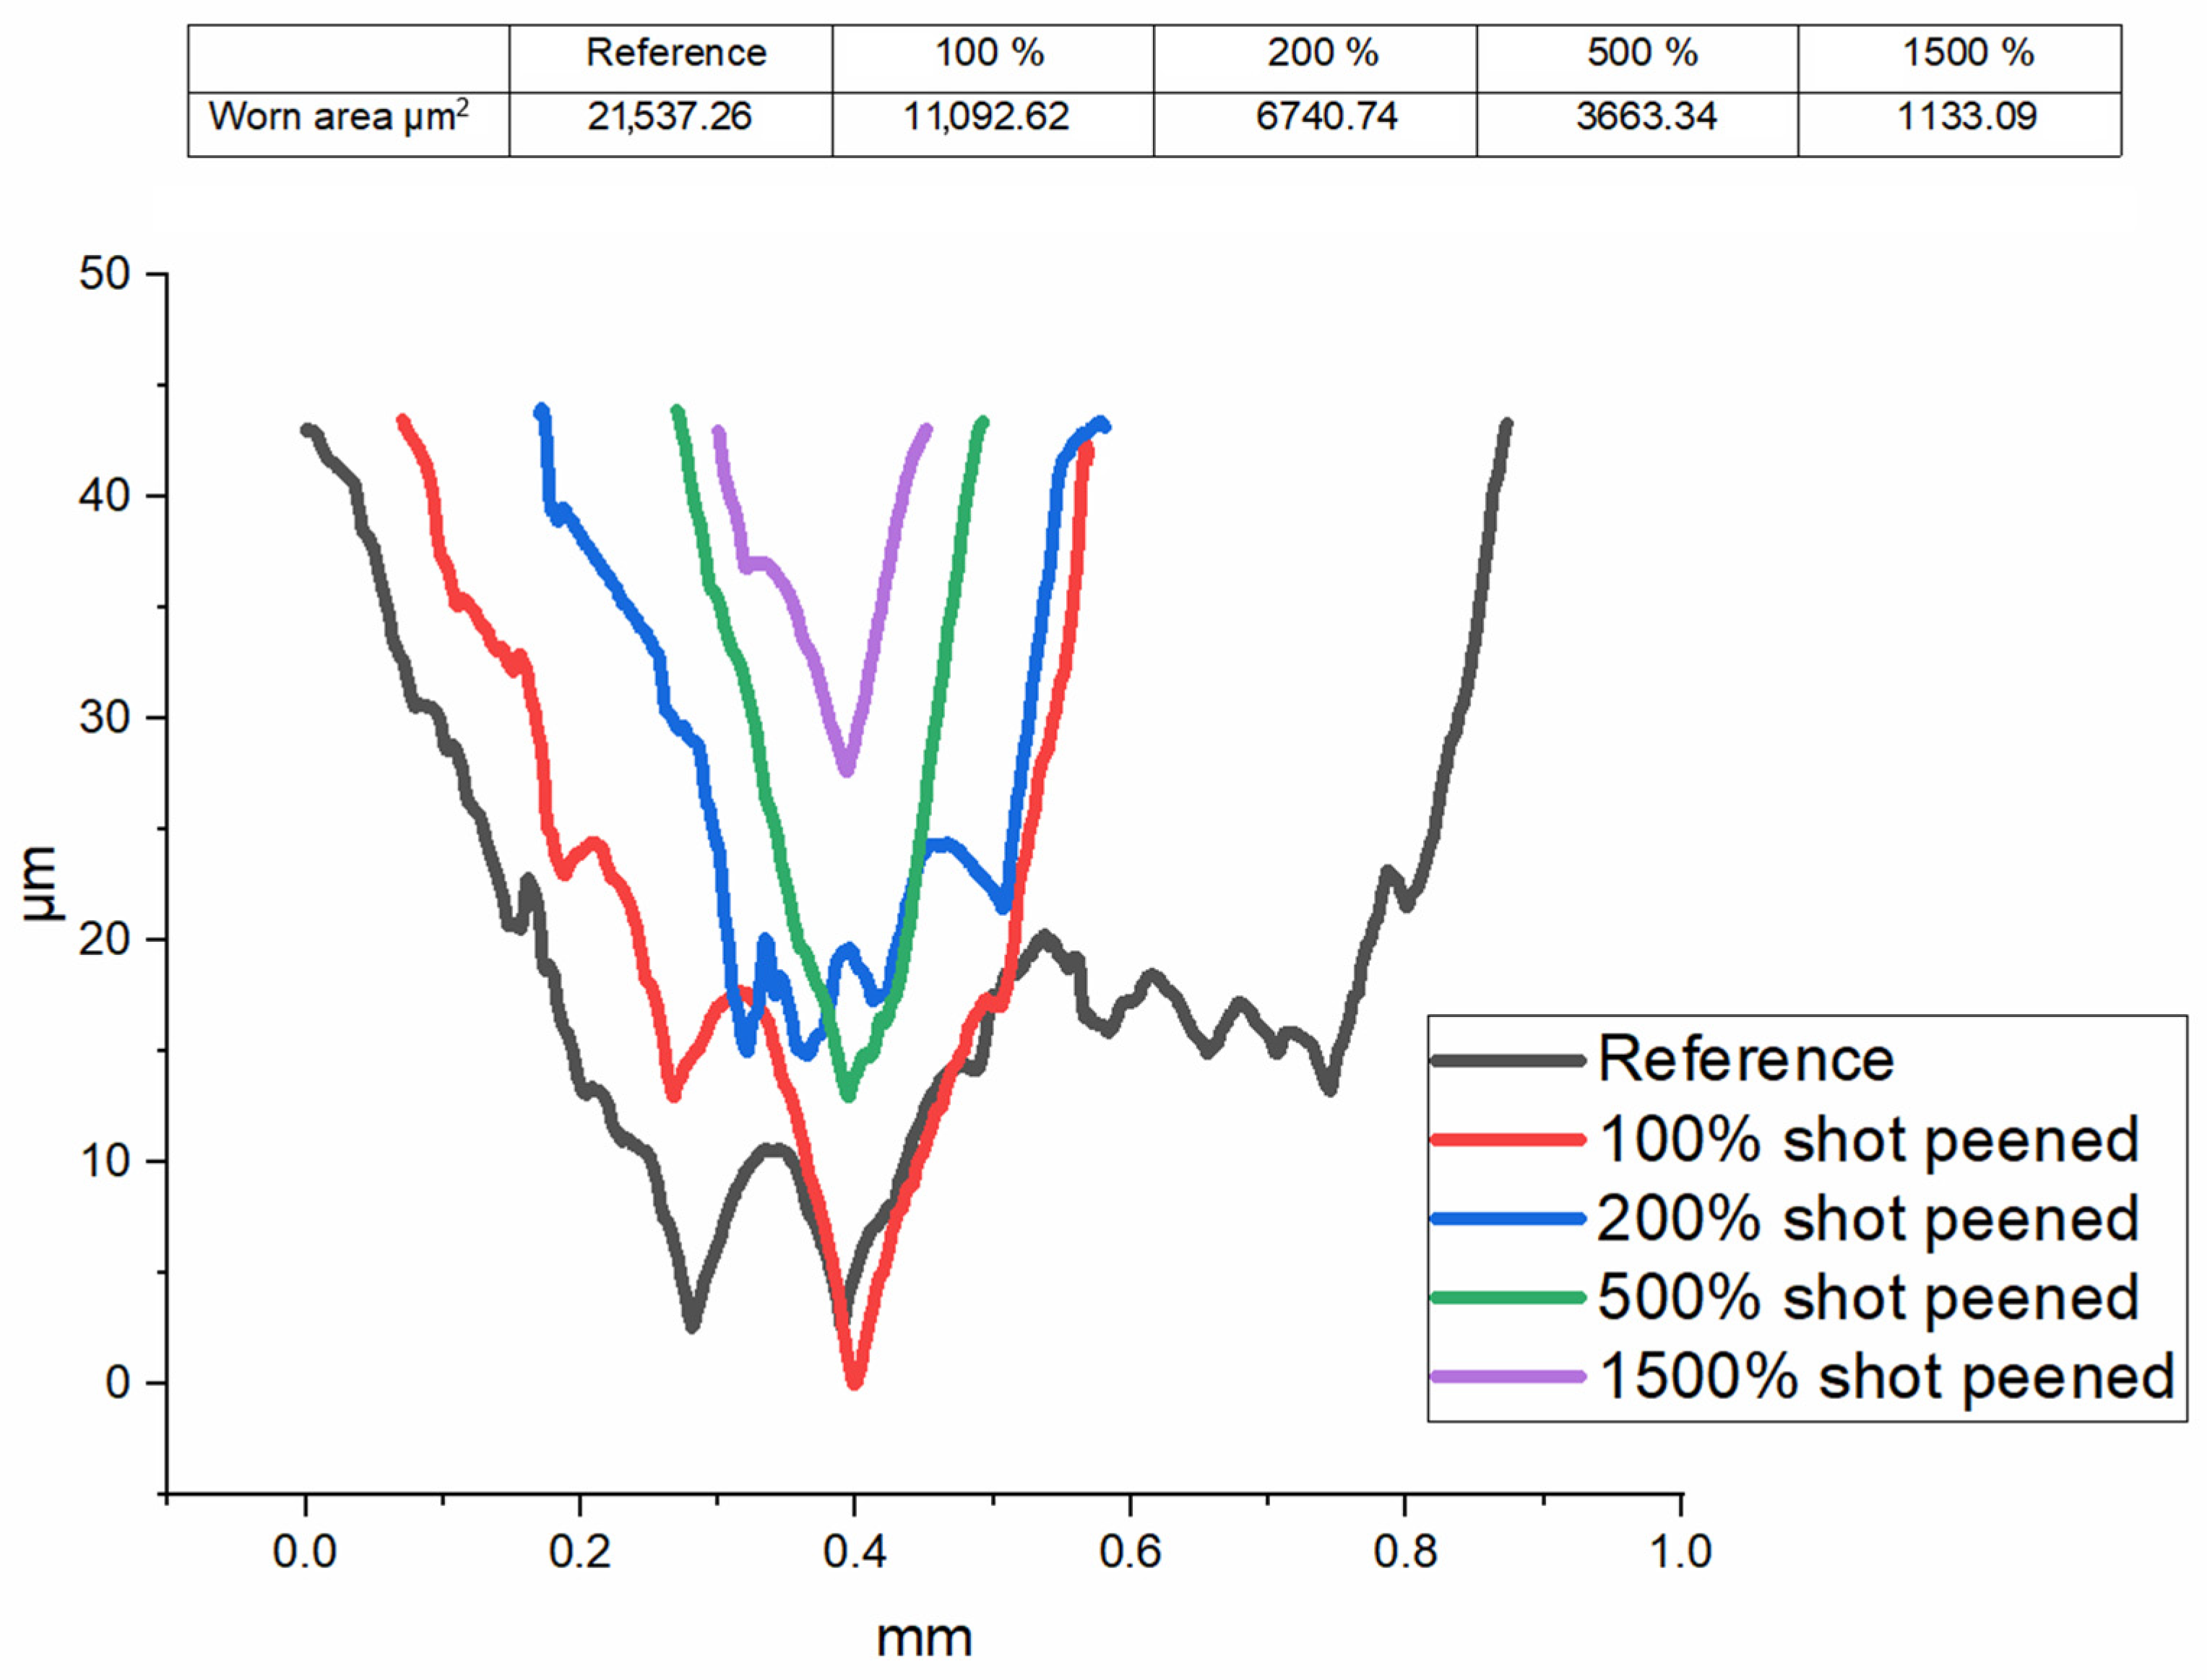
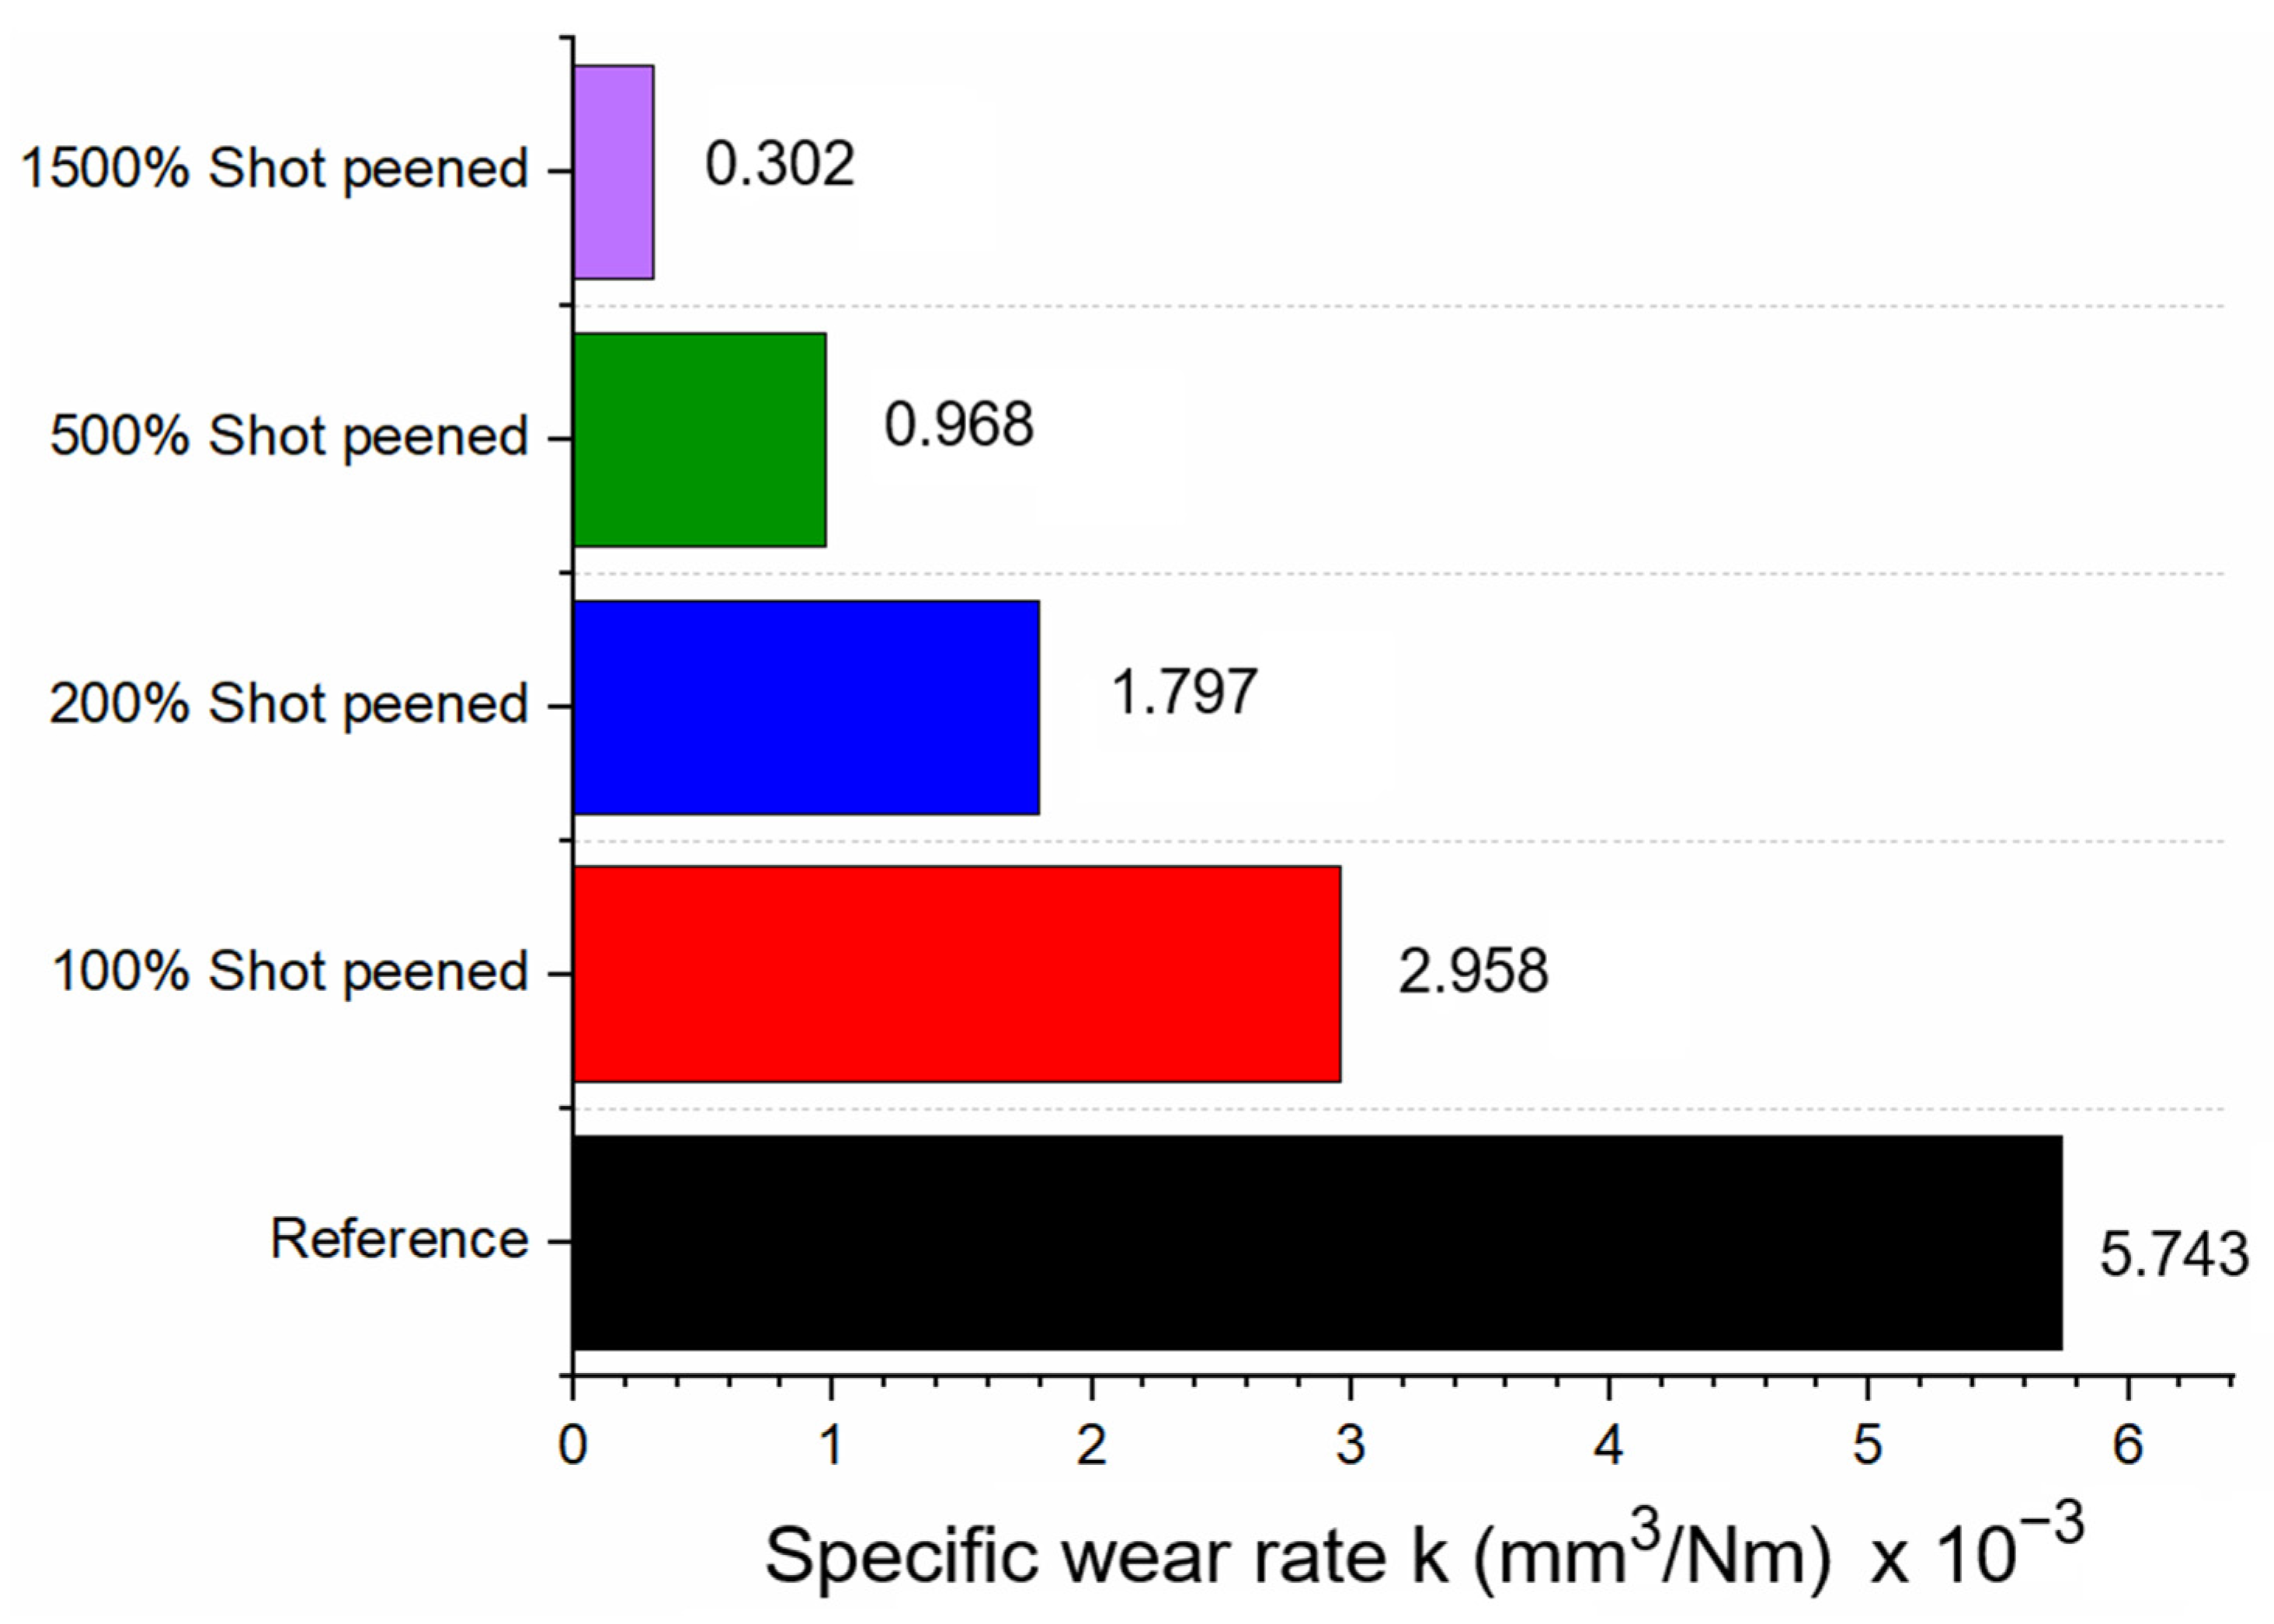
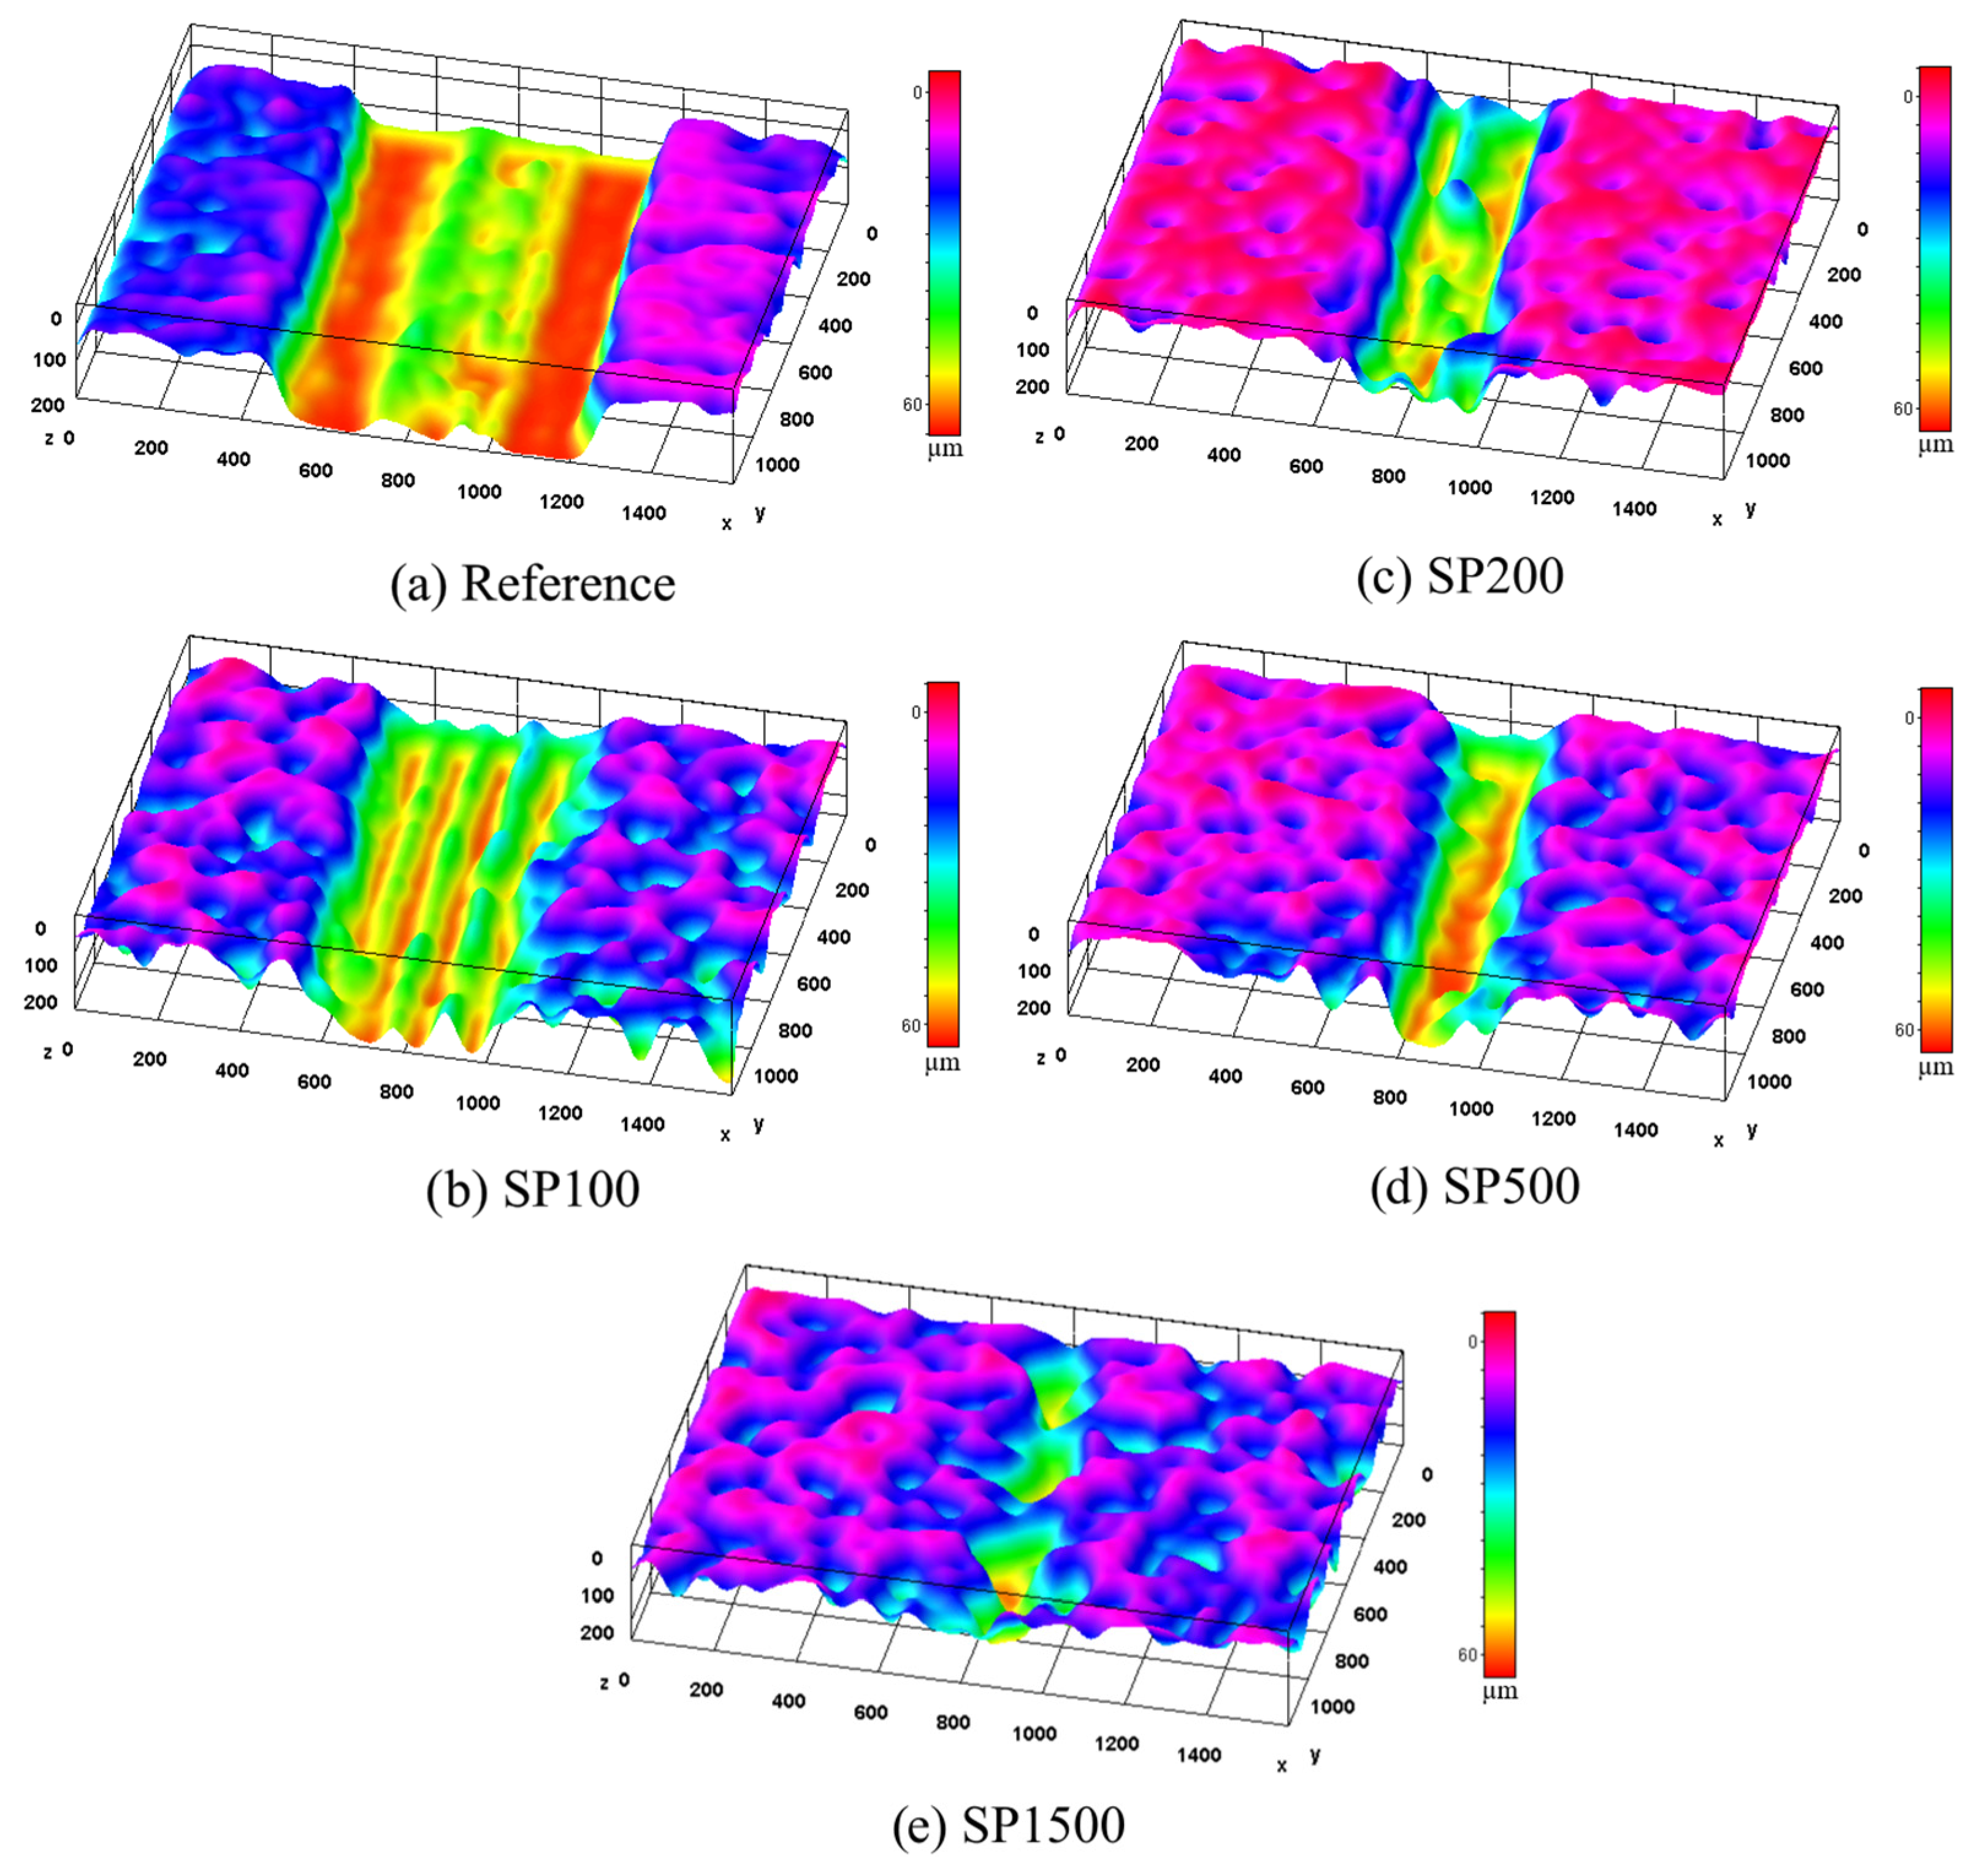
Ball-on-plate wear tests were conducted in dry sliding conditions by using a CSM wear tester. The wear scar profiles for Sref, SP100, SP200, SP500, and SP1500 samples are shown in Figure 16. The specific wear rates k (mm3/Nm) were calculated using the Archard equation for each sample, shown in Figure 17. Taking into account specific wear rates, it is clear that the highest worn area and also the highest wear rate were observed for sample Sref, as expected. The hardness value of sample Sref was almost 112 HV, and because the sample with the lowest hardness value among the tested samples was the Sref sample, it was expected that the specific wear value would be the highest. As the shot peening coverage rates increased, a gradual increase in residual stress from the surface to greater depths, together with the enhancement in hardness, significantly contributed to an observed improvement in wear resistance. Consequently, the specific wear rate declined, which can be attributed to the strong evidence of an inverse proportionality between hardness and the specific wear rate [10,16,28]. According to the results of the wear scar profiles and specific wear rates, it was determined that the wear resistance of the SP1500 sample increased by approximately 19 times compared to the Sref sample. In comparison to the untreated Sref sample, the wear resistance of the SP100, SP200, and SP500 samples increased by approximately 1.94, 3.2, and 5.93, respectively, after the shot peening process. In order to highlight the differences in wear volume, Figure 18 shows the 3D surface topography of each sample. The 3D surface topography also revealed that the Sref sample exhibited the highest wear volume. The Sref sample showed a deeper and wider wear track, with clear groove-like features. Its wear type was proof that the hard counter face indented and displaced the softer matrix. As the coverage rate of the shot peening increased, the width and depth of the linear wear tracks gradually decreased for the SP100, SP200, SP500, and SP1500 samples. All shot-peened samples exhibited narrower wear scars with less pronounced grooves. This demonstrated that the shot peening process effectively altered the dominant wear mechanism in addition to reducing the wear volume.
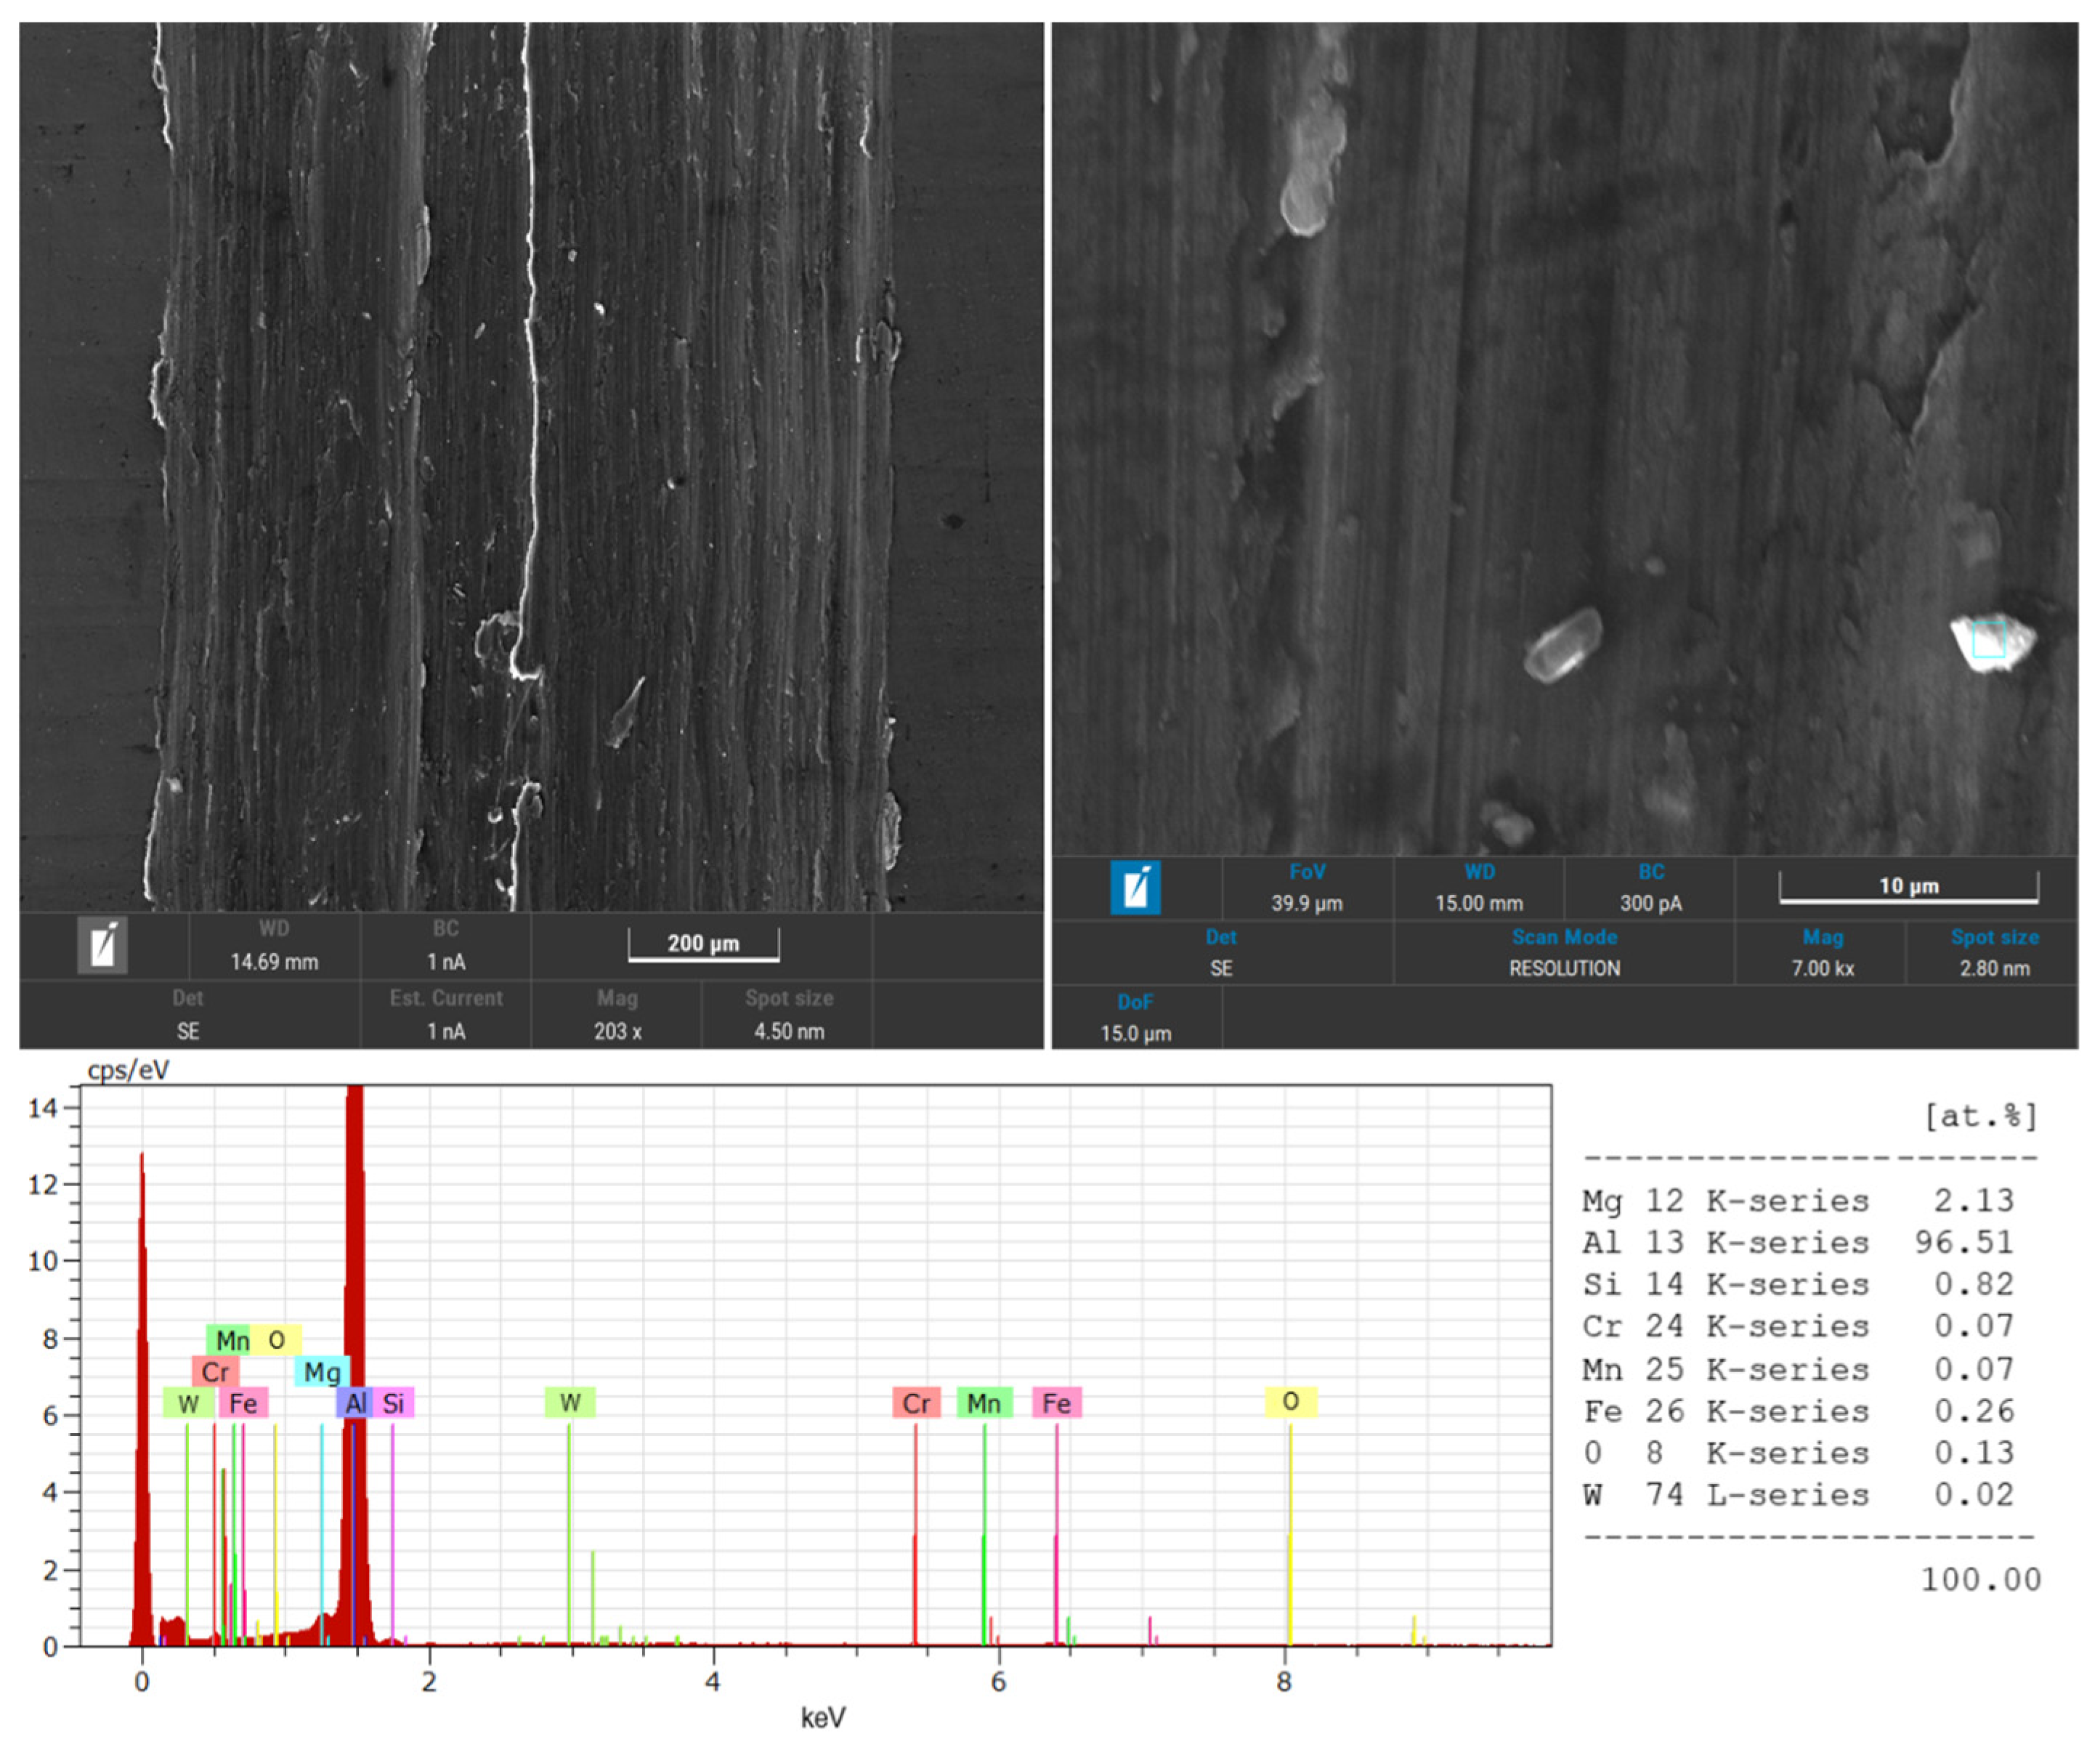
Figure 19 illustrates the worn surface of the untreated 6061-T6 aluminum alloy (Sref). The wear mechanisms, which can be seen in the ball-on-plate wear test, include plastic flow, adhesive wear, ploughing, and accumulated wear debris. The presence of plastic flow is evident based on elongated surface distortions aligned with the sliding direction, indicating significant surface softening and deformation due to inadequate hardness. Adhesive wear is marked by localized material transfer and detachment zones, where strong interfacial boding between the aluminum and the WC-Co ball led to microscale tearing and material loss. Ploughing marks and deep grooves oriented along the sliding track suggest abrasive interaction as the hard counter face indented and displaced the softer matrix. Additionally, dispersed wear debris across the surface points to repeated surface fracture and particle accumulation, which can further act as third-body abrasives. These features confirm that the untreated sample undergoes a combination of severe adhesive and abrasive wear mechanisms under dry sliding conditions. According to EDS analysis, oxides and tungsten were detected, and the presence of oxide was likely due to surface oxidation caused by frictional heating.
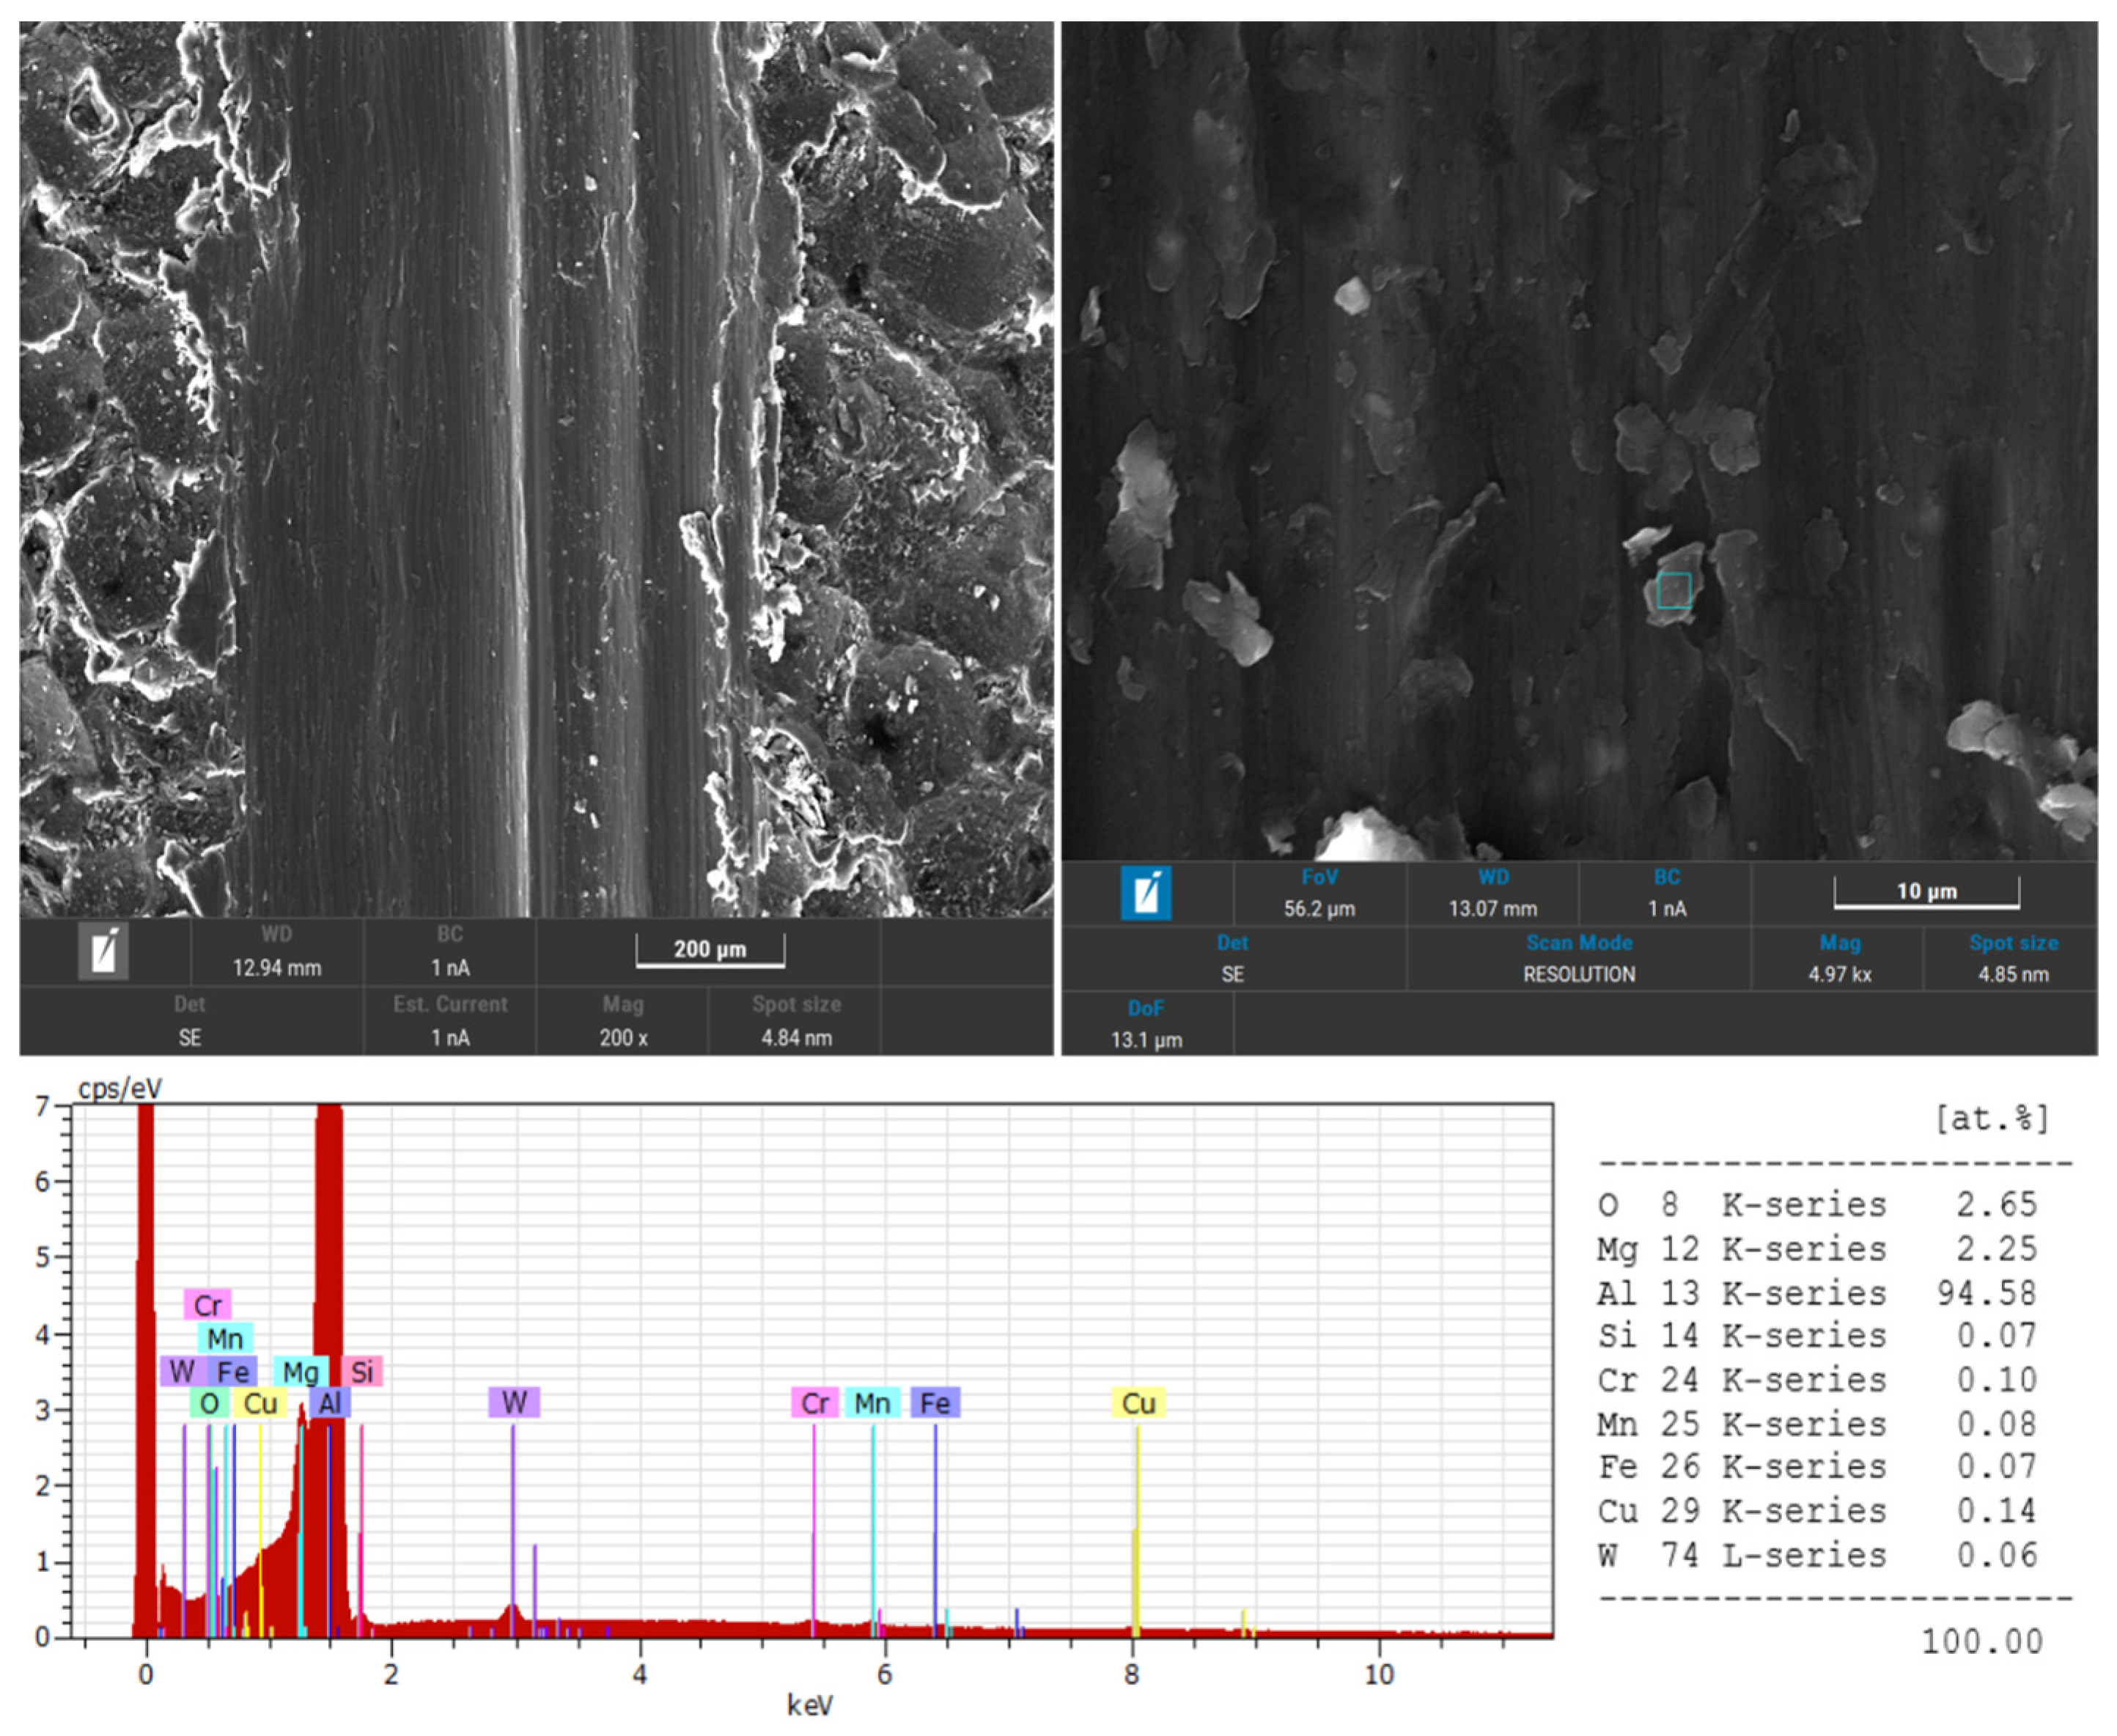
In Figure 20, SEM and EDS analysis of the SP100 sample is shown. Smearing zones are visible at the edge of the wear track and also across the surface, suggesting localized adhesion between the surface and the counter face WC-co ball. This indicates the presence of adhesive wear mechanisms during sliding. Fine crack-like features and small tears are evident in some regions, likely caused by repeated mechanical interactions. The wear tracks appear aligned, indicating the directionality of the reciprocating sliding motion. Some regions exhibit more pronounced damage, which may be due to surface inhomogeneities. EDS analysis showed that oxides and tungsten were observed.
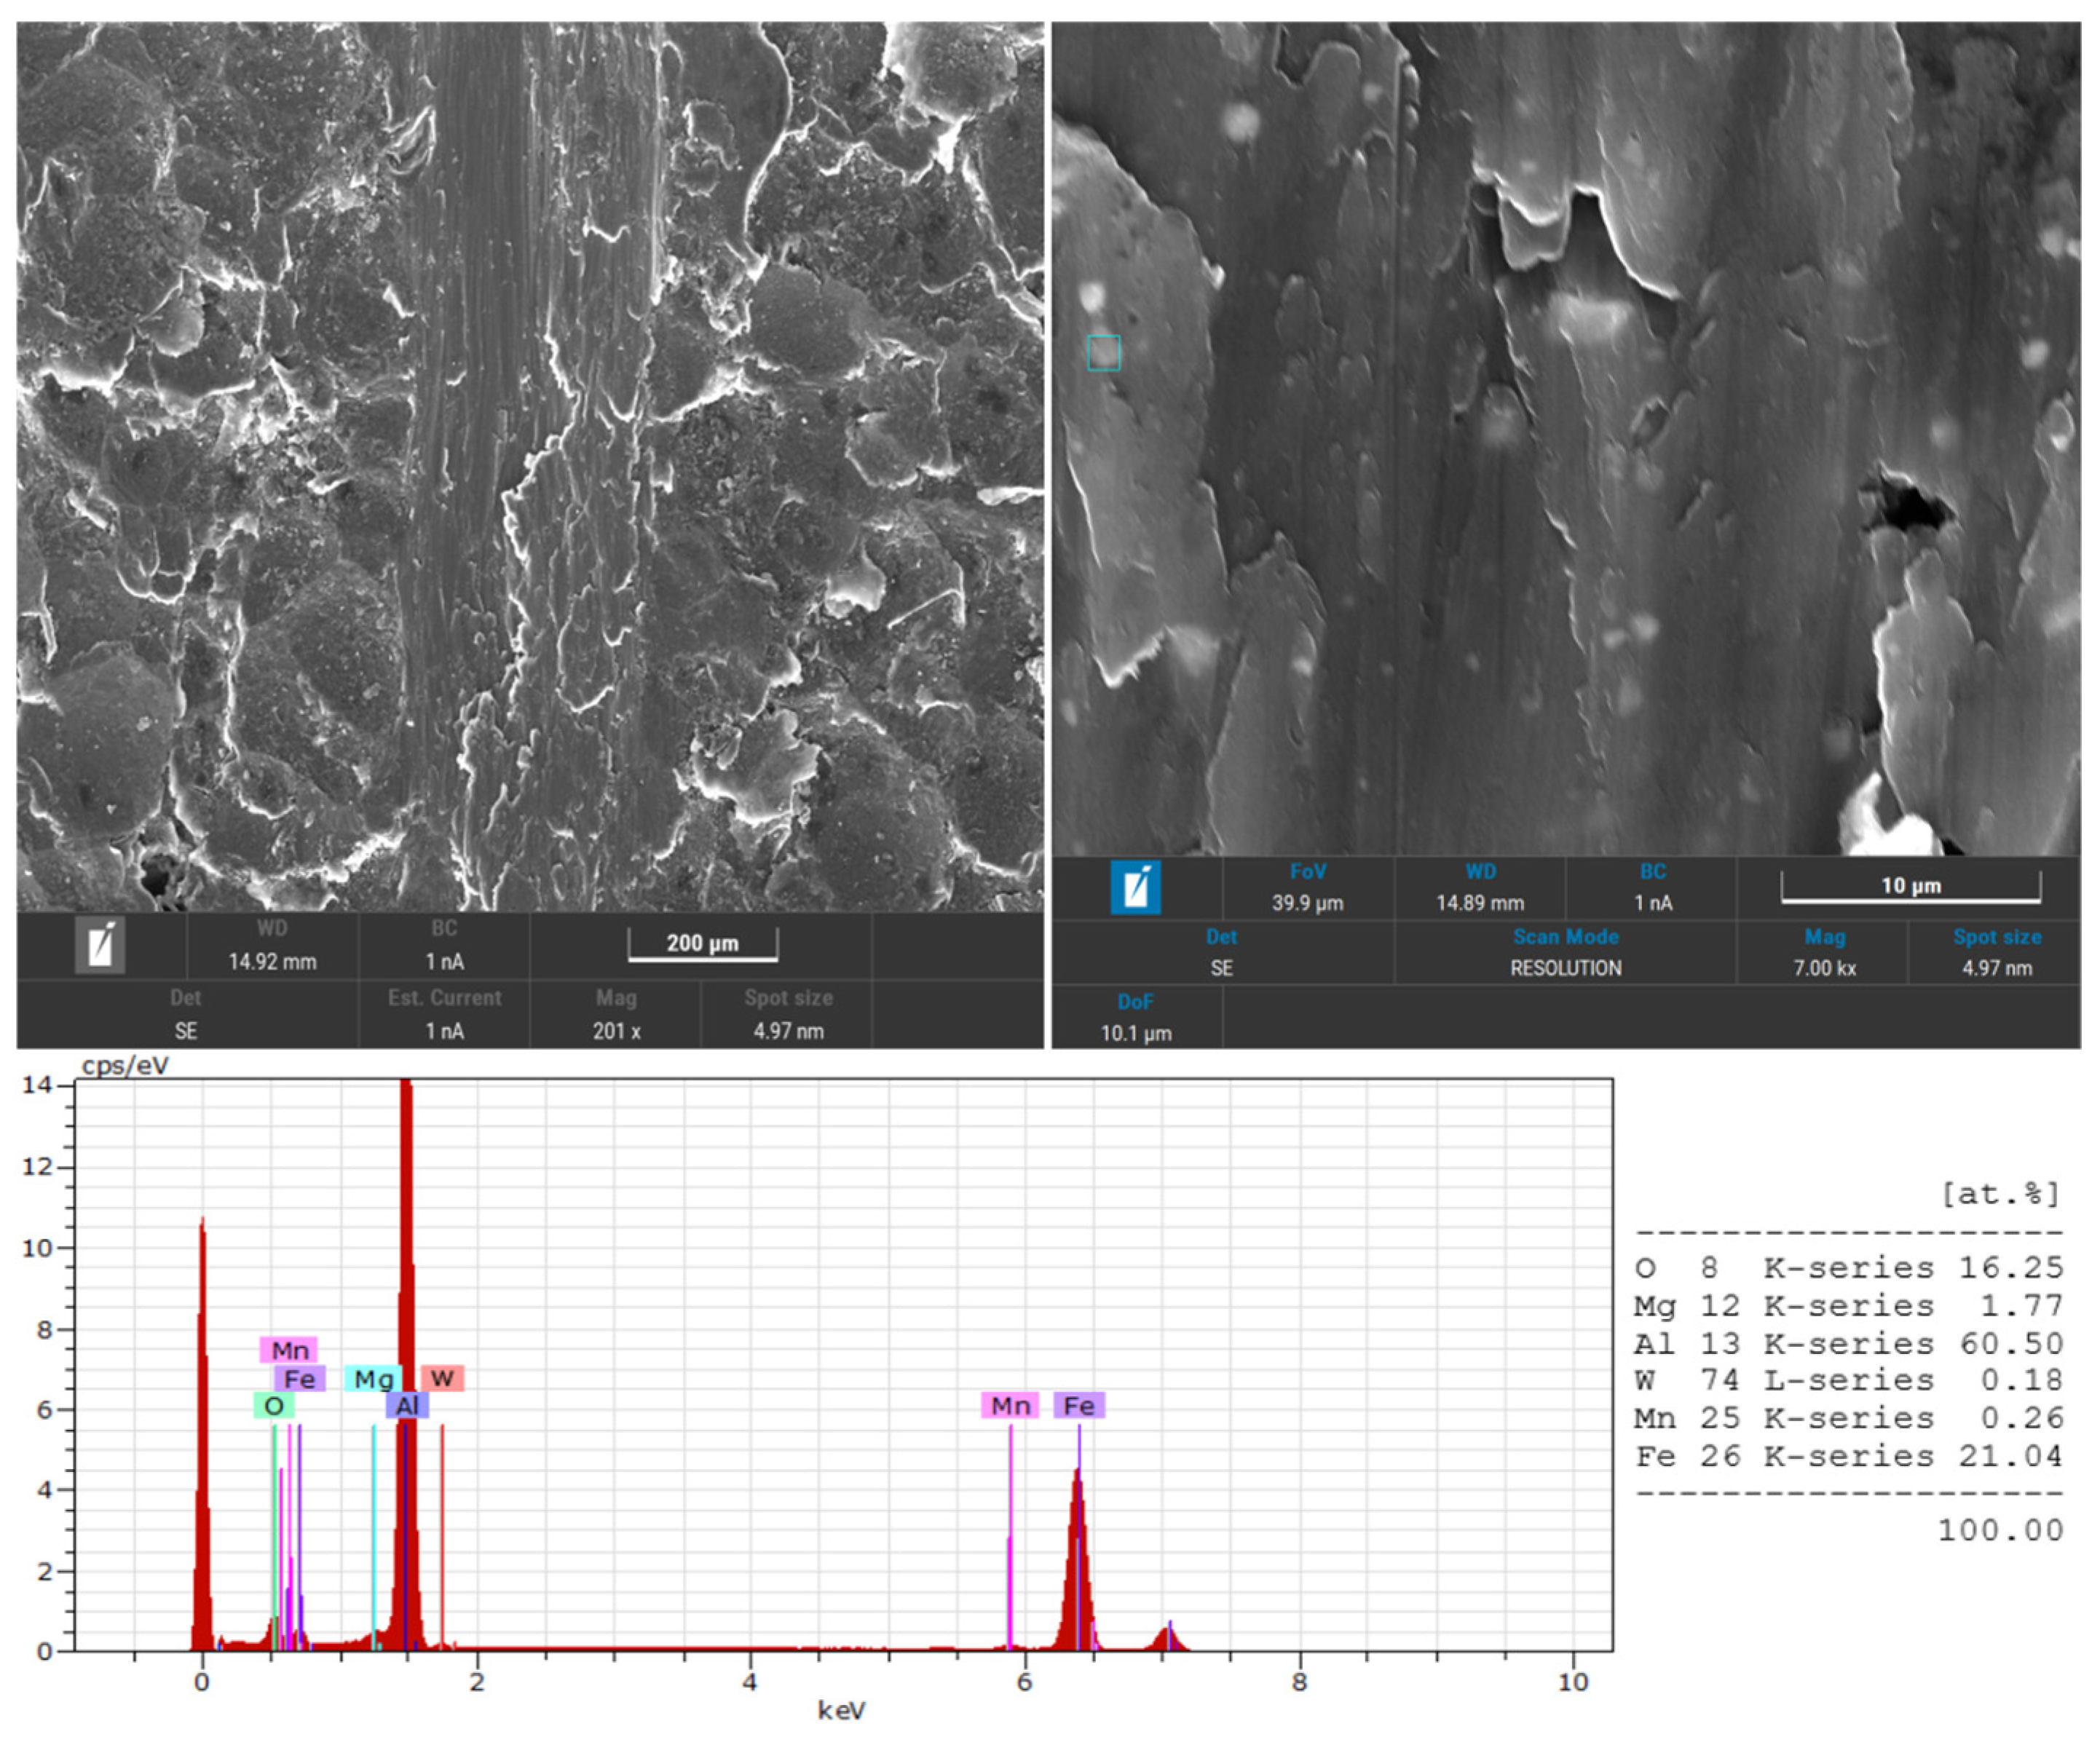
Higher amounts of smearing and clear plastic deformation were observed in the SP200 sample, as shown in Figure 21. This case was attributed to severe surface interaction between the sample and the WC-Co ball. Parallel groove formation was observed during reciprocating sliding motions. Additionally, sharp edge surface breakings formed due to possible localized brittleness. EDS analysis showed that tungsten (W) was detected. It is possibly from wear debris from the WC-Co ball during sliding motions, high contact pressure, and high temperature.
The wear track observed on the SP500 sample appeared smoother and less worn in comparison to the SP200 sample, as shown in Figure 22. This indicated that increased surface hardness and also residual stress limited plastic deformation because of the increased coverage rate. Although parallel grooves were still present, they were narrower and more uniform. This case suggested that the wear mechanism transformed into an abrasive type. The EDS spectrum showed a tungsten peak, indicating debris from the WC-Co ball. Due to the formation of work-hardened surface layers, wear resistance increased.
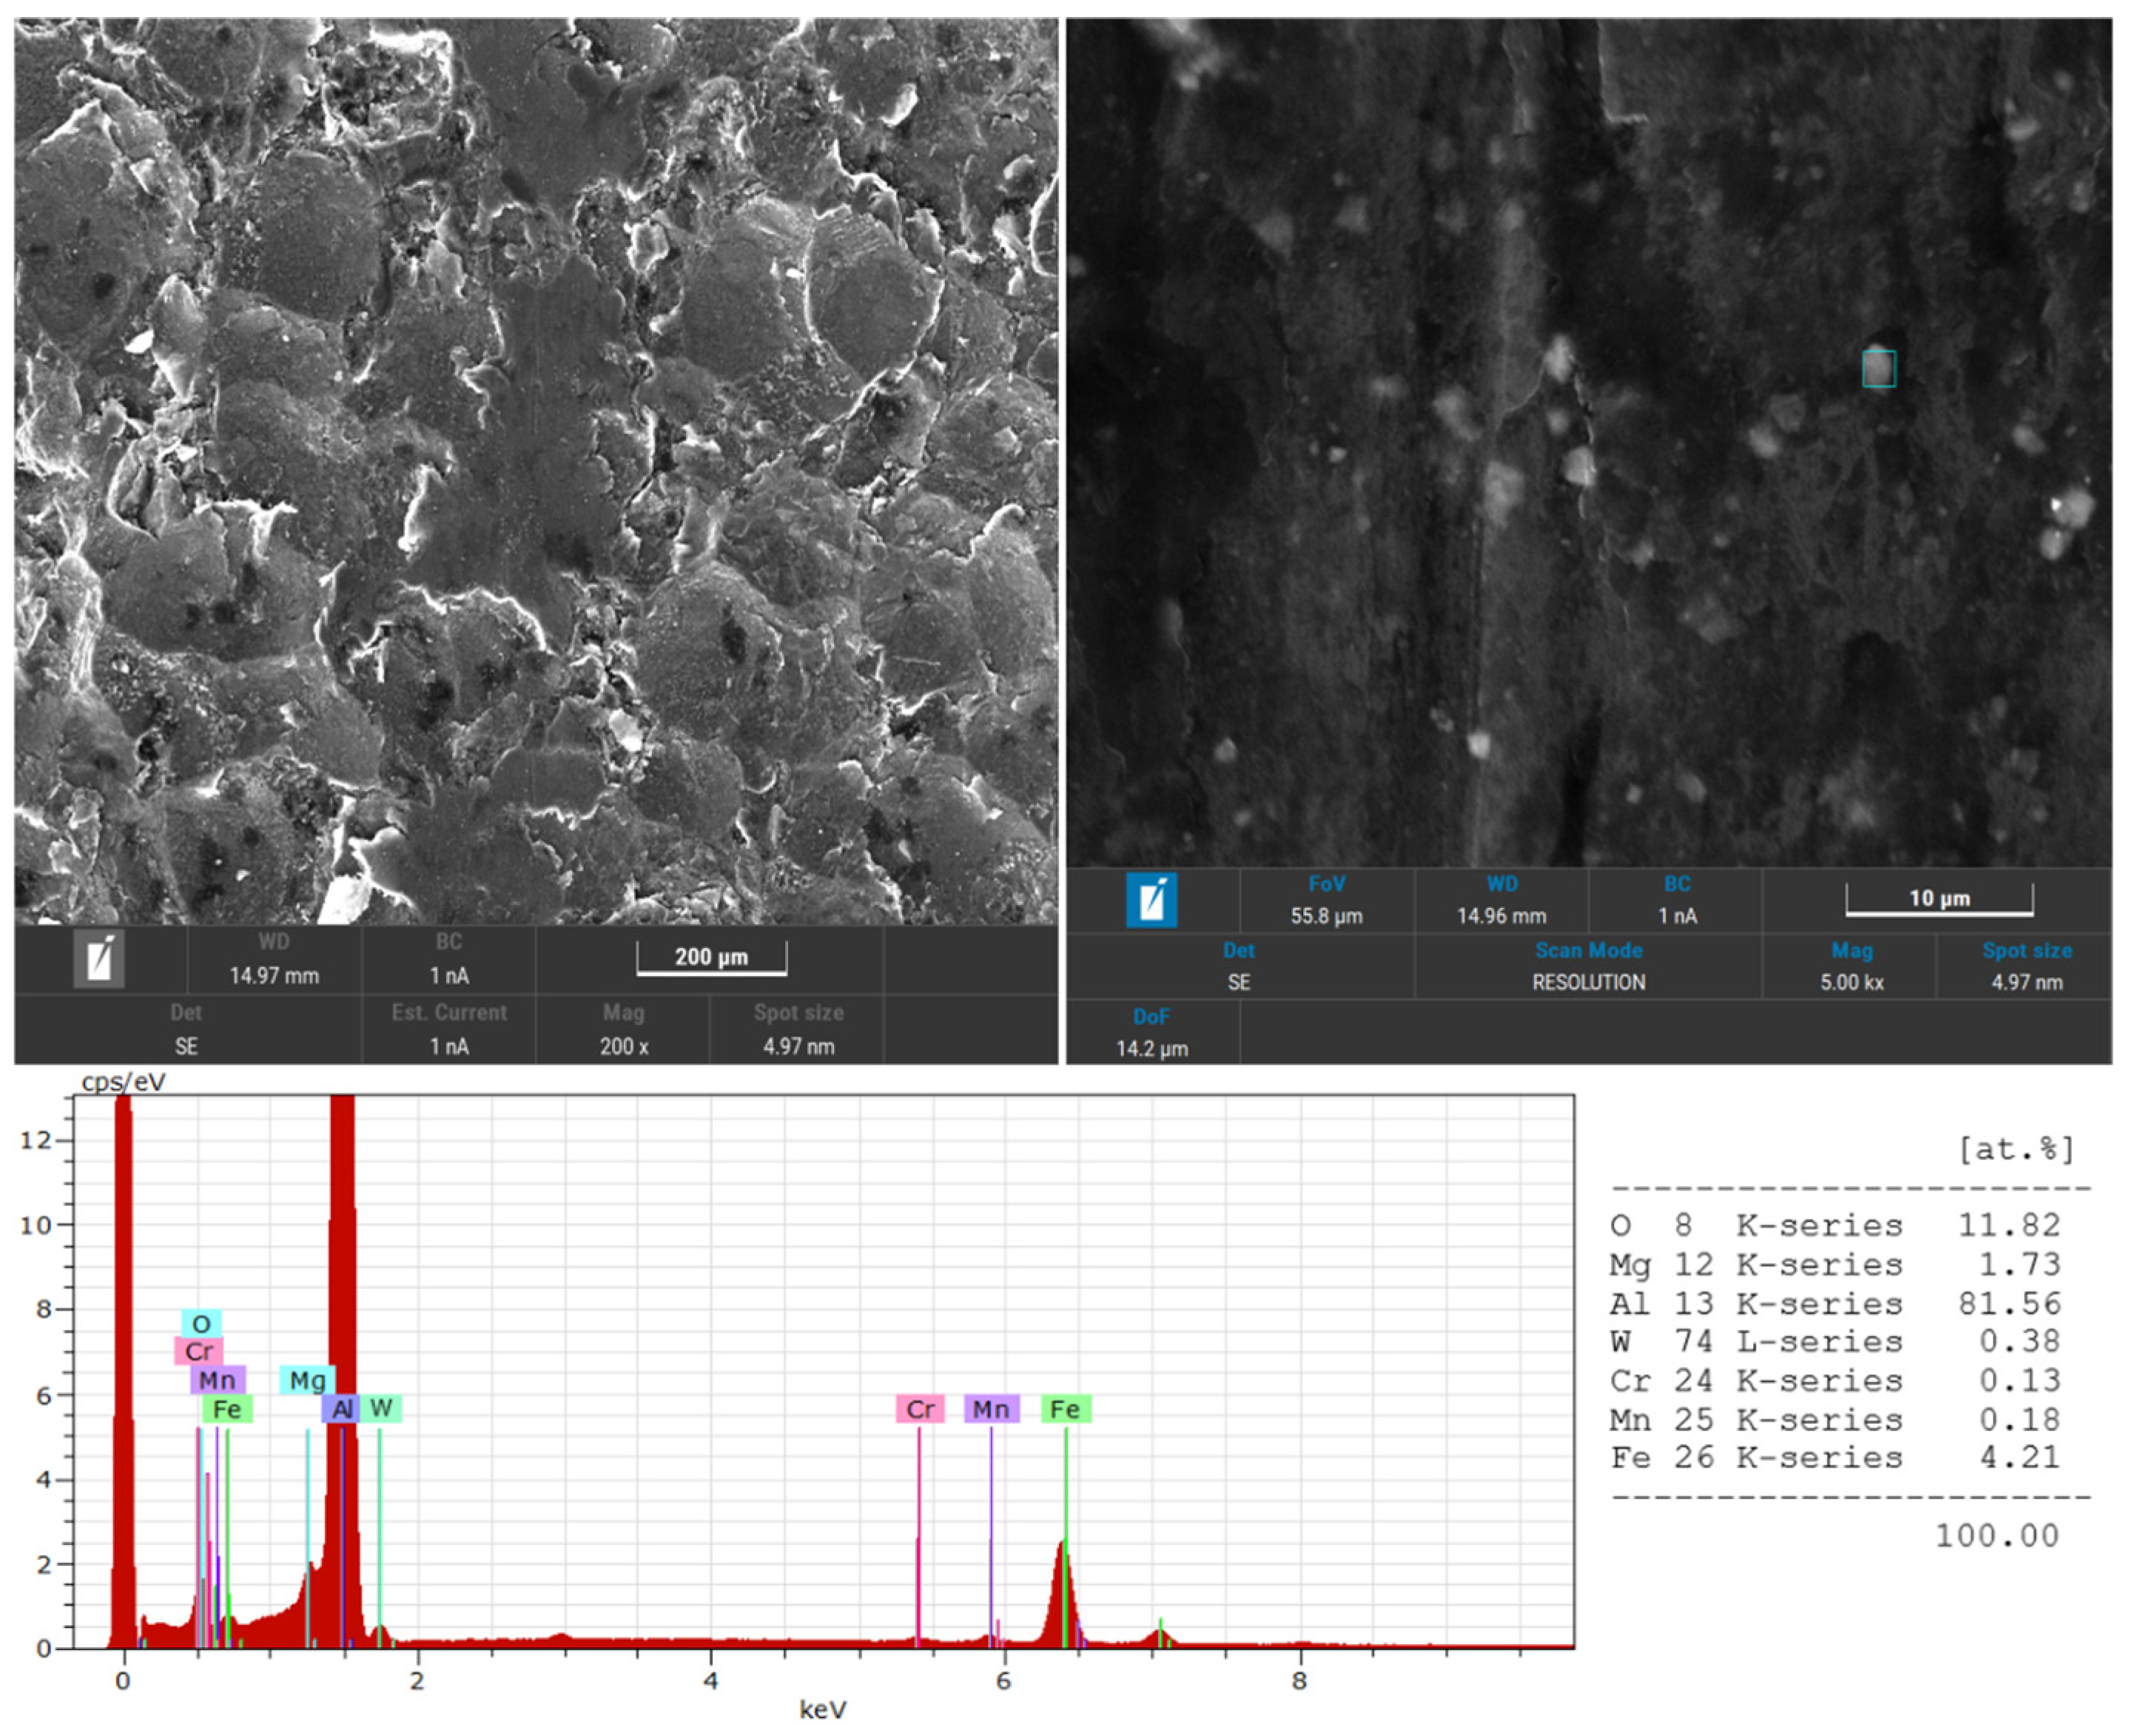
Figure 23 presents the SEM and EDS analyses of the SP1500 sample, which exhibited the highest wear resistance among all samples. As the SP1500 sample had the highest coverage rate, excessive shot peening caused excessive impact energy and accumulated strain on the surface. In comparison to the other samples, the SP1500 sample had the narrowest wear track, which was also obtained through 3D surface topography. The wear grooves were not observed on the surface, and the dominant wear mechanism was limited smearing, which indicated that the wear mechanism was from abrasive to adhesive wear. Tungsten was again detected, as observed in other samples.
Based on the EDS results, together with SEM, the main wear mechanisms were adhesive and abrasive and their combinations. The transition from an adhesive to an abrasive wear mechanism is related to microstructural and topographical changes induced by different coverage rates. At lower coverage rates, the surface has relatively lower hardness, favoring adhesive wear due to localized material transfer. As the coverage rate increases, shot peening introduces refined grains, higher dislocation density, and compressive residual stress, which enhance hardness and reduce the tendency toward adhesion. Increased surface roughness promotes micro-cutting and ploughing, thereby leading to a transition of the dominant wear mechanism from adhesive to abrasive. Another important finding was that primary precipitation was likely Mg2Si, according to EDS analysis. This precipitation is the main strengthening mechanism for 6061 aluminum alloy, and the enhancement of hardness, tensile strength, and fatigue and wear resistance can be attributed to Mg2Si [29,30]. It is possible that after the shot peening process, the distribution of Mg2Si is more uniform, which enhances the hardness and wear resistance of the sample by hindering the movement of the dislocation [16]. Further optimization of their distribution can be achieved through controlled heat treatment and process parameter adjustment prior to or after shot peening, which may promote finer and more homogeneous precipitation. Moreover, oxygen content in the EDS analysis suggests that an oxide layer on the surface provides corrosion and wear resistance.
The evolution of COF for all investigated sample reveals distinct tribological behavior patterns that closely align with the classical wear stages, run-in and steady state, as shown in Figure 24. The mean COF values were evaluated considering steady-state conditions. The untreated sample Sref exhibited the highest and most unstable frictional behavior among all tested groups. The COF showed a prolonged and unstable run-in phase with sharp fluctuations, ultimately increasing to values close to 0.67, and the same behavior and COF value were obtained in the literature [31,32,33]. This behavior is attributed to the relatively soft and ductile nature of the 6061-T6 aluminum surface, which facilitated strong adhesive interactions, extensive plastic deformation, and direct metal-to-metal contact without the formation of a protective tribolayer. No steady-state regime was observed, and the wear rate appeared to accelerate continuously due to the progressive breakdown of the native aluminum oxide (Al2O3) film and the repeated exposure of fresh aluminum to the WC-Co counter face. This oxide film, although initially present, likely fractured rapidly under load, initiating a cycle of oxide rupture and regrowth that contributed to unstable tribological behavior. The result was a complete lack of surface integrity and resistance, with repeated bonding–rupture mechanisms and material transfer dominating the wear process. The SP100 sample demonstrated an improved tribological response compared to the untreated sample, reflected by significantly lower initial COF. This reduction is attributed to the effects of mild surface hardening, increased compressive residual stress, and the presence of micro dimples that reduced the real contact area and limited the severity of adhesive wear. During the first 5 m of sliding, the COF remained relatively stable, indicating initial resistance to wear and oxide film breakdown. However, beyond this distance, a noticeable increasing trend in COF emerged, signaling the onset of surface fatigue and insufficient subsurface support. Although oxide layer degradation was delayed due to shot-peening-induced strengthening, the mechanical and microstructural barriers were eventually overcome under continued loading. As a result, the frictional performance declined, highlighting that low-intensity shot peening, while beneficial in the early stages, may not provide sufficient durability for extended sliding applications. The SP200 sample exhibited enhanced tribological behavior. The COF remained low and stable up to 9 m of sliding, indicating a more robust steady-state regime compared to SP100. This improvement arises from a more effective balance of surface hardness, deeper compressive residual stresses, and more uniform dimple distribution. The oxide film formed on this surface can possess greater durability and resistance to rupture. However, similarly to SP100, a gradual increase in COF was observed after 9 m, suggesting that wear mechanisms, such as oxide film degradation and subsurface fatigue, began to dominate beyond this point. While SP200 offered a significant improvement in both frictional stability and wear resistance, it still demonstrated a finite tribological lifetime, especially under extended sliding conditions. The SP500 sample demonstrated the favorable and optimized tribological profile of all investigated samples. It has a short or negligible run-in phase, followed by a prolonged and stable steady-state regime that extended up to 12 m of sliding, with only a marginal increase in COF near the end of the test. Despite having the lowest surface roughness and consistently low average COF values (the mean COF value was 0.19), the SP1500 sample did not exhibit a distinct steady-state regime. Instead, it showed persistent and bounded COF fluctuations throughout the wear test, indicating dynamic tribological instability. In summary, the COF trends reveal that while shot peening effectively enhances tribological performance by modifying surface and subsurface characteristics, its benefits are highly dependent on the coverage rate of the shot peening process. After the run-in period, the mean COF values for the Sref, SP100, SP200, SP500, and SP1500 samples were determined to be 0.67, 0.66, 0.62, 0.57, and 0.19, respectively. The mean COF exhibited a gradual decrease after the shot peening process. The obtained COF values for each sample are in good agreement with findings reported in the literature, which consistently, due to surface hardening and the surface dimples, can act as micro reservoirs for lubrication [16]. Moderate coverage rates (SP200-SP500) provide a balance between mechanical strengthening and structural stability, resulting in reduced and stable friction. In contrast, SP1500 fluctuated, but it had the lowest COF plot during the wear test.

4. Conclusions

Aluminum alloys, such as 6061-T6, offer a favorable strength-to-weight ratio, making them ideal for lightweight structural applications. However, their relatively poor wear resistance limits long-term performance in harsh environments. The shot peening process, a mechanical surface treatment that introduces beneficial compressive residual stresses and surface hardening, significantly improves both wear and fatigue resistance. Unlike conventional surface coatings or chemically intensive treatments, shot peening has positive properties, as it consumes relatively little energy, involves no hazardous chemicals, and utilizes recyclable media, such as steel shot, which can be reused multiple times. The combination of 6061-T6 aluminum’s lightweight nature and the wear resistance improvements achieved through shot peening supports the development of green technologies and sustainable engineering solutions. The following conclusions can be drawn from the present work:
(1)
As the coverage rates increased, the thickness of the severely plastically deformed surface layer gradually increased.
(2)
The mean surface roughness value increased progressively from 100% to 500% coverage but decreased at 1500% coverage because of the repeated shot peening process.
(3)
The material flow along the top edge of the sample increased as the coverage rates increased.
(4)
The highest hardness value was obtained for the SP1500 sample, but it did not exhibit a significant increase in comparison to the SP500 sample. The same behavior was also observed for residual stress profiles.
(5)
According to the results of the specific wear rates, the sample with the highest wear resistance was SP1500.
(6)
During the ball-on-plate wear tests in dry sliding conditions, the main wear mechanisms were adhesive and abrasive and their combinations.
(7)
The obtained COF values showed that shot peening effectively enhanced tribological performance by altering surface characteristics, although its benefits were highly dependent on the coverage rate of the shot peening process. The mean COF values for the Sref, SP100, SP200, SP500, and SP1500 samples were obtained as 0.67, 0.66, 0.62, 0.57, and 0.19, respectively.

Author Contributions

Conceptualization, O.C. and F.B.; methodology, O.C. and F.B.; investigation, O.C. and F.B.; preparation of the original written draft, O.C. and F.B.; writing—review and editing, O.C. and F.B. All authors have read and agreed to the published version of the manuscript.

Funding

This research received no external funding.

Data Availability Statement

The original contributions presented in this study are included in the article. Further inquiries can be directed to the corresponding author.

Acknowledgments

The authors would like to express their sincere gratitude to the Turkish Air Force 1st Air Supply and Maintenance Centre Command in Eskişehir for their support in conducting the shot peening process. Appreciation is further extended to the members of the Tribology Laboratory at the Department of Mechanical Engineering, Eskişehir Osmangazi University, for their continuous support and collaboration throughout this study. During the preparation of this manuscript, the authors used Grammarly for the purposes of proofreading and language correction.

Conflicts of Interest

The authors declare no conflicts of interest.

References

  1. Gao, H.; Dong, P.; Wei, Z. Microstructure and Properties of 6061 Aluminum Alloy by Additive Friction Stir Deposition. Metals 2025, 15, 539. [Google Scholar] [CrossRef]
  2. Al-Qutub, A.; Al-Hamed, A.A.S.; Mohammed, A.S. Elevated Temperature Tribological Performance of Submicron Alumina Particle-Reinforced 6061 Aluminum Alloy Under Dry Conditions. Arab. J. Sci. Eng. 2024, 49, 1597–1610. [Google Scholar] [CrossRef]
  3. Anand, S.H.; Venkateswaran, N.; Sathishkumar, B.; Rajeshkumar, L. Microstructural, Mechanical and Tribological Analysis of TiB2 Ceramic-Reinforced Al6061 Aluminum Alloy Composites. Arab. J. Sci. Eng. 2024, 49, 1827–1842. [Google Scholar] [CrossRef]
  4. Qu, L.; Ma, N.; Xiao, X.; Zhang, K.; Li, H. Microstructure and Properties of Nonlinear Lap Joint of 6061 Aluminum Alloy by Friction Stir Welding. Metals 2023, 13, 1494. [Google Scholar] [CrossRef]
  5. Rajeshshyam, R.; Venkatraman, R.; Raghuraman, S. Process Optimisation and Tribological Behaviour Studies on Surface Modified Al 6061-T6 Alloy Deposited with WS2 Solid Lubricant Layer Through Electrical Discharge Approach. Arab. J. Sci. Eng. 2022, 47, 8009–8030. [Google Scholar] [CrossRef]
  6. Oberreiter, M.; Horvath, M.; Stoschka, M.; Fladischer, S. Effect of Surface Finishing State on Fatigue Strength of Cast Aluminum and Steel Alloys. Materials 2023, 16, 4755. [Google Scholar] [CrossRef] [PubMed]
  7. Žagar, S.; Mrvar, P.; Grum, J.; Šturm, R. The Influence of Shot Peening and Artificially Ageing Aluminum Alloy 7075 on Corrosion Behaviour. Materials 2022, 15, 3094. [Google Scholar] [CrossRef] [PubMed]
  8. Žagar, S.; Markoli, B.; Naglič, I.; Šturm, R. The Influence of Age Hardening and Shot Peening on the Surface Properties of 7075 Aluminum Alloy. Materials 2021, 14, 2220. [Google Scholar] [CrossRef] [PubMed]
  9. Tekkalmaz, M.; Er, Ü.; Çakir, F.H.; Bozkurt, F. A New Approach to Monitoring the Operational Success of Shot Peening with Electromechanical Impedance Technique. Int. J. Adv. Manuf. Technol. 2021, 117, 3503–3513. [Google Scholar] [CrossRef]
  10. Çakir, F.H.; Öteyaka, M.Ö.; Er, Ü.; Bozkurt, F. Enhancing Wear Resistance of AISI 304 Alloy with Shot Peening and Investigation of Corrosion Behaviour in Marine Water. Trans. IMF 2021, 99, 194–202. [Google Scholar] [CrossRef]
  11. Wang, T.; Wang, J.B.; Zhang, X.J.; Liu, C. A Study on Prediction of Process Parameters of Shot Peen Forming Using Artificial Neural Network Optimized by Genetic Algorithm. Arab. J. Sci. Eng. 2021, 46, 7349–7361. [Google Scholar] [CrossRef]
  12. Chen, B.; Huang, B.; Liu, H.; Li, X.; Ni, M.; Lu, C. Surface Nanocrystallization Induced by Shot Peening and Its Effect on Corrosion Resistance of 6061 Aluminum Alloy. J. Mater. Res. 2014, 29, 3002–3010. [Google Scholar] [CrossRef]
  13. Mohammadi, S.; Irani, M.; Taheri, A.K. The Effects of Combination of Severe Plastic Deformation and Shot Peening Surface Treatment on Fatigue Behavior of 6082 Aluminum Alloy. Russ. J. Non-Ferr. Met. 2015, 56, 206–211. [Google Scholar] [CrossRef]
  14. Sun, Q.; Han, Q.; Wang, S.; Xu, R. Microstructure, Corrosion Behaviour and Thermal Stability of AA 7150 after Ultrasonic Shot Peening. Surf. Coat. Technol. 2020, 398, 126127. [Google Scholar] [CrossRef]
  15. Ravnikar, D.; Šturm, R.; Žagar, S. Effect of Shot Peening on the Strength and Corrosion Properties of 6082-T651 Aluminum Alloy. Materials 2023, 16, 4976. [Google Scholar] [CrossRef] [PubMed]
  16. Mathi, P.; Prasad, C.R.; Chembuly, V.V.M.J.S.; Sai, A.N.; Chekuri, R.B.R.; Penmetsa, R.V.; Gudaru, K.R. Effect of Shot Peening-Induced Microstructure and Precipitate Evolutions on the Surface Residual Stresses, Hardness, and Wear Behavior of Al 6061 Alloy. J. Inst. Eng. India Ser. D 2025. [Google Scholar] [CrossRef]
  17. Park, S.J.; Heogh, W.; Yang, J.; Kang, S.; Jeong, W.; Lee, H.; Jang, T.-S.; Jung, H.-D.; Jahazi, M.; Han, S.C.; et al. Meta-Structure of Amorphous-Inspired 65.1Co28.2Cr5.3Mo Lattices Augmented by Artificial Intelligence. Adv. Compos. Hybrid Mater. 2024, 7, 224. [Google Scholar] [CrossRef] [PubMed]
  18. ASTM E384-22; Standard Test Method for Microindentation Hardness of Materials. ASTM International: West Conshohocken, PA, USA, 2022.
  19. Wang, Q.; Ozaki, K.; Ishikawa, H.; Nakano, S.; Ogiso, H. Indentation Method to Measure the Residual Stress Induced by Ion Implantation. Nucl. Instrum. Methods Phys. Res. Sect. B Beam Interact. Mater. Interact. 2006, 242, 88–92. [Google Scholar] [CrossRef]
  20. ASTM G133-22; Standard Test Method for Linearly Reciprocating Ball-on-Flat Sliding Wear. ASTM International: West Conshohocken, PA, USA, 2022.
  21. Ji, H.; Hu, Y.; Yu, R.; Liu, S.; Pei, W.; Wang, B. Experimental Study on TIG Full Welding and Single Pass Welding Quality of 6061-T6 Aluminum Alloy Sheet. J. Mater. Res. Technol. 2023, 27, 5965–5976. [Google Scholar] [CrossRef]
  22. Jiang, Y.; Qiu, X.; Song, Z.; Dai, S.; Chen, Z.; Wang, X.; Wu, C.; Ren, X.; Meng, C. New Insights into Enhancing the Mechanical Properties of 6061-T6 Aluminum Alloy MIG Welded Joints by Constructing Bionic Heterostructure. Mater. Sci. Eng. A 2024, 912, 147009. [Google Scholar] [CrossRef]
  23. Bao, L.; Li, K.; Zheng, J.; Zhang, Y.; Zhan, K.; Yang, Z.; Zhao, B.; Ji, V. Surface Characteristics and Stress Corrosion Behavior of AA 7075-T6 Aluminum Alloys after Different Shot Peening Processes. Surf. Coat. Technol. 2022, 440, 128481. [Google Scholar] [CrossRef]
  24. Su, C.-H.; Chen, T.-C.; Ding, Y.-S.; Lu, G.-X.; Tsay, L.-W. Effects of Micro-Shot Peening on the Fatigue Strength of Anodized 7075-T6 Alloy. Materials 2023, 16, 1160. [Google Scholar] [CrossRef]
  25. Wang, Z.; Xie, L.; Zhang, Q.; Ali, R.A.; Chen, W.; Zhou, L. Surface Layer Strengthening Mechanism of 2060 Aluminum–Lithium Alloy after Shot-Peening. J. Mater. Res. Technol. 2023, 23, 4615–4633. [Google Scholar] [CrossRef]
  26. Si, C.; Sun, W.; Tian, Y.; Cai, J. Cavitation Erosion Resistance Enhancement of the Surface Modified 2024T351 Al Alloy by Ultrasonic Shot Peening. Surf. Coat. Technol. 2023, 452, 129122. [Google Scholar] [CrossRef]
  27. John, M.; Ralls, A.M.; Misra, M.; Menezes, P.L. Effect of Ultrasonic Impact Peening on Stress Corrosion Cracking Resistance of Austenitic Stainless-Steel Welds for Nuclear Canister Applications. J. Nucl. Mater. 2023, 584, 154590. [Google Scholar] [CrossRef]
  28. Er, Ü.; Bozkurt, F. Investigation of the Effects of Cryogenic Treatment on the Friction and Wear Properties of 36CrB4 Boron Steel. Arab. J. Sci. Eng. 2022, 47, 16209–16221. [Google Scholar] [CrossRef]
  29. Liu, X.; Yang, M.; Zhou, D.; Zhao, Y. Microstructure and Wear Resistance of Mg2Si–Al Composites Fabricated Using Semi-Solid Extrusion. Metals 2020, 10, 596. [Google Scholar] [CrossRef]
  30. Tebib, M.; Samuel, A.M.; Ajersch, F.; Chen, X.-G. Effect of P and Sr Additions on the Microstructure of Hypereutectic Al–15Si–14Mg–4Cu Alloy. Mater. Charact. 2014, 89, 112–123. [Google Scholar] [CrossRef]
  31. Bozkurt, F. The Effect of Anodizing Time on the Tribological Properties of 6061-T6 Aluminum Alloy. In Proceedings of the 33rd International Conference on Metallurgy and Materials, Brno, Czech Republic, 22–24 May 2024; pp. 373–379. [Google Scholar]
  32. Amanov, A.; Sasaki, S.; Kim, D.; Penkov, O.V.; Pyun, Y. Improvement of the Tribological Properties of Al6061–T6 Alloy under Dry Sliding Conditions. Tribol. Int. 2013, 64, 24–32. [Google Scholar] [CrossRef]
  33. Chang, Y.-P.; Liu, C.-T.; Chu, L.-M.; Chou, H.-M. Wear Mechanisms of Aluminum 5083/6061/7075 with and without T6 Treatment. Adv. Mech. Eng. 2023, 15, 16878132231201000. [Google Scholar] [CrossRef]
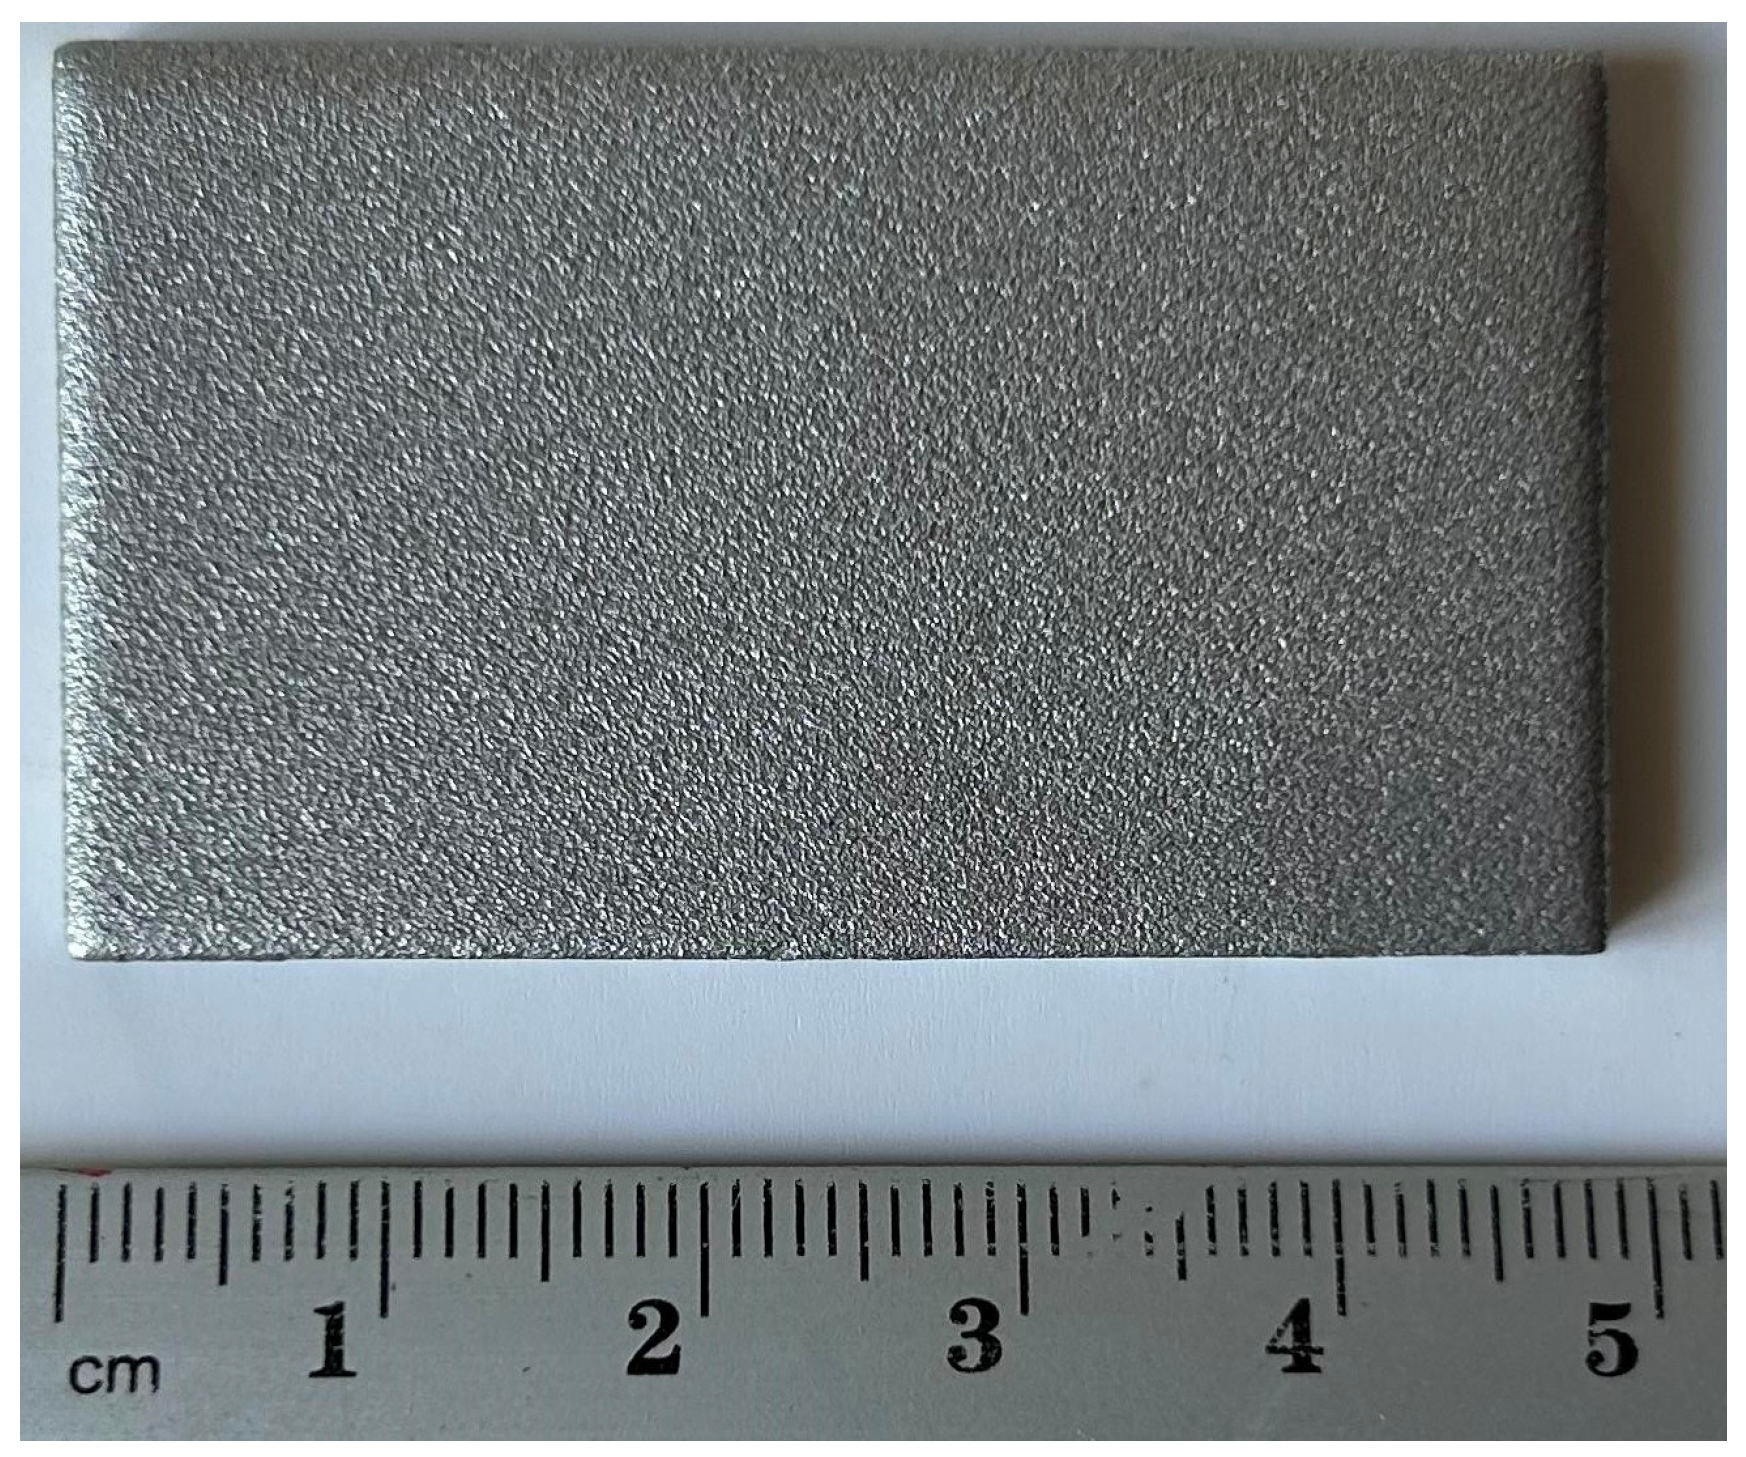
Figure 1. Dimensions of shot-peened sample.
Metals 15 00964 g001
Figure 2. Load–depth indentation curves obtained from both stressed and stress-free surfaces were utilized to estimate residual stress using the energy-based method. Reprinted with permission from ref. [19]. 2025 Elsevier.
Metals 15 00964 g002
Figure 3. CSM wear tester and schematic illustration of the ball-on-plate linear reciprocating wear test.
Metals 15 00964 g003
Figure 4. Representative worn area of the sample.
Metals 15 00964 g004
Figure 5. The microstructure of (a) SP100, (b) SP200, (c) SP500, and (d) SP1500 samples. Arrows show the formation of the dimples on the surface, 125× magnification.
Metals 15 00964 g005
Figure 6. The precipitation of Mg2Si particles.
Metals 15 00964 g006
Figure 7. The microstructure of (a) SP100, (b) SP200, (c) SP500, and (d) SP1500 samples. Severe plastic deformation on the top of the surfaces, 400× magnification.
Metals 15 00964 g007
Figure 8. Surface topography of shot-peened samples, with optical microscopy (left), SEM (middle), and 3D surface profile (right).
Metals 15 00964 g008
Figure 9. The roughness values (Ra, Rq, and Rz) of Sref, SP100, SP200, SP500, and SP1500 samples.
Metals 15 00964 g009
Figure 10. The schematic roughness changes during shot peening.
Metals 15 00964 g010
Figure 11. The macro images show material flow along the top edge of the sample for SP100, SP200, SP500, and SP1500 samples.
Metals 15 00964 g011
Figure 12. The schematic pile-up and material flow mechanism observed during shot peening.
Metals 15 00964 g012
Figure 13. The microhardness profile of reference, SP100, SP200, SP500, and SP1500 samples.
Metals 15 00964 g013
Figure 14. The representative loading–unloading curves for Sref, SP100, SP200, SP500, and SP1500 samples.
Metals 15 00964 g014
Figure 15. The residual stress profiles for Sref, SP100, SP200, SP500, and SP1500 samples.
Metals 15 00964 g015
Figure 16. The wear scar profiles for Sref, SP100, SP200, SP500, and SP1500 samples.
Metals 15 00964 g016
Figure 17. The calculated specific wear rates for Sref, SP100, SP200, SP500, and SP1500 samples.
Metals 15 00964 g017
Figure 18. The 3D surface topography of Sref, SP100, SP200, SP500, and SP1500 samples after ball-on-plate wear testing.
Metals 15 00964 g018
Figure 19. SEM and EDS analysis of worn surfaces of the Sref sample.
Metals 15 00964 g019
Figure 20. SEM and EDS analysis of worn surfaces of the SP100 sample.
Metals 15 00964 g020
Figure 21. SEM and EDS analysis of worn surfaces of the SP200 sample.
Metals 15 00964 g021
Figure 22. SEM and EDS analysis of worn surfaces of the SP500 sample.
Metals 15 00964 g022
Figure 23. SEM and EDS analysis of worn surfaces of the SP1500 sample.
Metals 15 00964 g023
Figure 24. The coefficient of friction vs. distance plots for Sref, SP100, SP200, SP500, and SP1500 samples.
Metals 15 00964 g024
Table 1. Chemical composition analysis of 6061-T6 alloy wt. %.
FeSiMnCrTiCuMgZnAl
0.410.700.140.170.040.240.860.05Balance
Table 2. Linear reciprocating wear test parameters.
Counter BodyLoadDistanceStrokeSpeedTemperatureCondition
Ø3 mm, WC-%6 Co2 N15 m8 mm2.5 cm/s21 °CDry
Disclaimer/Publisher’s Note: The statements, opinions and data contained in all publications are solely those of the individual author(s) and contributor(s) and not of MDPI and/or the editor(s). MDPI and/or the editor(s) disclaim responsibility for any injury to people or property resulting from any ideas, methods, instructions or products referred to in the content.