Article

Numerical Simulation of the Solid Particle Entrainment Behavior in Bottom-Blown Ladle

1
National Engineering Research Center for Advanced Manufacturing Technology and Equipment of Heavy Castings and Forgings (Erzhong (Deyang) Heavy Equipment Co., Ltd.), Deyang 618000, China
2
School of Metallurgy, Northeastern University, Shenyang 110819, China
*
Author to whom correspondence should be addressed.
Metals 2025, 15(9), 963; https://doi.org/10.3390/met15090963 (registering DOI)
Submission received: 23 July 2025 / Revised: 22 August 2025 / Accepted: 28 August 2025 / Published: 29 August 2025

Abstract

The entrainment behavior of solid particles from the top liquid surface into molten steel exerts a crucial influence on rapid slagging and efficient desulfurization during the refining process. A Euler–Euler mathematical model was established to describe the multiphase flow field and the entrainment behavior of solid particles in a bottom-blown ladle. This model was validated by comparison with water model experiments. The effects of bottom-blowing tuyere number, gas flow rate, and solid particle size on the flow field and particle entrainment behavior were investigated. It was found that increasing the gas flow rate enhances the participation of particles in the ladle; however, the entrainment effect changes minimally when the gas flow rate exceeds 192 Nm3/h. Increasing the number of tuyeres adversely affects particle entrainment and mixing efficiency, while simultaneously expanding the size of the “open eyes”. The particle size of the refining slag has a significant impact on the entrainment effect: when the particle size exceeds 10 mm, the particles are hardly entrained in the ladle. Reducing the particle size is more conducive to increasing the entrainment amount, but excessively small particles will significantly enlarge the size of the “open eyes”.

1. Introduction

Ladle refining is critical for the smelting of clean steel. To enhance refining efficiency and shorten smelting time, achieving rapid slag formation and desulfurization in the early stage of ladle refining has become a key requirement for iron and steel enterprises. In actual production, large quantities of solid materials—including desulfurizers and slag formers—are directly added to the liquid surface of the ladle immediately after tapping from the converter. As shown in Figure 1a, these solid materials float and accumulate on the surface of the molten steel, making it difficult for them to be rapidly heated and melted into liquid slag. Therefore, bottom blowing stirring is typically employed to fully entrain the accumulated materials on the surface into the molten steel, thereby promoting heat transfer and slag formation (as shown in Figure 1b). In current industrial production, the slag formation process generally requires 5–10 min, and slagging efficiency shows a significant correlation with the entrainment and mixing effectiveness of solid particles.
Currently, numerous researchers have investigated the flow behavior [1,2,3,4,5,6,7,8,9,10,11,12], bubble dynamics [11,12,13,14,15], inclusion removal [1,2,13,14,15,16,17,18,19,20,21,22,23,24], and desulfurization processes [25,26,27,28,29] in bottom-blown ladle operations through physical experiments or numerical simulations. This has led to an increasingly mature understanding of transport phenomena in bottom-blown ladles. Li et al. [1,2] applied the Discrete Phase Model (DPM) to simulate bubble movement in a ladle furnace, examining the effect of a novel gas injection mode on mixing behavior and inclusion removal efficiency. Ji et al. [3] developed a three-dimensional water–oil–air multiphase model to investigate mass transfer phenomena at the slag–metal interface in ladles. Li et al. [16] provided a comprehensive review of current advancements in the numerical simulation of inclusion behavior. In a combined modeling approach, Tao et al. [17] conducted both mathematical and physical simulations to study the behavior of inclusions in molten steel. Gordon Irons et al. [9] highlighted the significance of slag–steel interfacial reactions through their studies on bubble dynamics. Senguttuvan and Irons [10] simulated the process of particles entering molten metal and discussed the relationship between the extent of slag entrainment and interfacial mass transfer rates. Llanos et al. [11] examined how gas injection methods influence mixing time and the formation of slag “open eyes” during ladle refining. Huang et al. [12] analyzed slag droplet entrainment in the “open eyes” region. Zhu et al. [13,15,23] characterized the slag–steel interfacial reactions and inclusion behavior in ladle reactors.
Existing research has primarily concentrated on the mid and late stages of ladle refining, whereas the behavior of solid slag particles immediately following converter tapping and during the initial refining stage has been largely overlooked, thereby creating a distinct gap in the literature. With increasingly stringent economic constraints, steel enterprises are placing greater emphasis on cost-effective production methods. A key challenge lies in achieving rapid slag formation without relying on expensive pre-melted particles, and this issue has attracted growing attention from scholars. Therefore, this study investigates the entrainment behavior of solid particles during the initial slag-forming stage under bottom-blowing stirring conditions through simulation. During the bottom argon blowing process, when metallurgical solid particulate materials are directly added to the ladle surface, parameters such as the number, arrangement, and flow rate of bottom-blowing tuyeres, as well as the particle size of the added materials, influence the flow behavior at the molten steel–particle interface. These factors directly determine the entrainment amount and depth of solid materials, thereby affecting metallurgical efficiency.
In this work, numerical simulation and physical simulation are used to study the entrapment behavior of solid particles in a bottom-blown argon ladle. On the basis of validating the numerical simulation, the effects of the bottom tuyere number, arrangement and gas flow rate, and the particle size of powder on the flow field and entrainment behavior of solid particle are investigated. This study provides deeper insight into the distribution and migration patterns of slag particles within molten steel. On one hand, the entrainment of solid slag materials accelerates slag formation and enhances the reaction rate between molten slag and liquid steel. On the other hand, the incorporation of the slag phase into the molten steel significantly expands the reactive interfacial area beyond the top slag layer, thereby intensifying mass transfer. However, it should be noted that excessive slag entrainment may lead to retained slag within the molten steel, potentially increasing the number of inclusions in the final product during the later refining stages. The findings of this research establish a solid foundation for industrial applications aimed at efficient and rapid slagging.

2. Mathematical Modeling

Based on the Euler–Euler method, a mathematical model is established to describe the liquid steel–gas–particle multiphase flow behavior in a bottom-blown ladle. The interphase forces between gas and liquid, and between solid and liquid, including drag force and turbulent diffusion force, are added into the model to consider the influence of flow field on the movement and distribution of bubbles and particles.

2.1. Assumptions

Complex physicochemical reactions coexist in the ladle reactor, rendering direct simulation infeasible. Given this study’s primary focus on internal flow structures and slag particle entrainment behavior, chemical reactions within the gas–steel–slag system are consequently neglected. Under actual high-temperature industrial conditions, both molten steel and slag exhibit Newtonian fluid characteristics. During bottom-blown argon stirring, temperatures of molten steel and slag phases demonstrate uniform distribution throughout the bath. With argon flow rate maintained constant, the injected gas instantaneously attains thermal equilibrium within the bath upon penetrating the steel phase through the porous plug and remains stable. This thermal homogenization stabilizes temperature-dependent properties (e.g., density and viscosity). To enhance computational efficiency, the following modeling assumptions are established:
  • Heat transfer among argon gas, molten steel, and refining slag is neglected.
  • Both molten steel and refining slag are assumed to be Newtonian fluids, and the turbulence is considered isotropic.
  • The three phases coexist stably without any chemical reactions.
  • The densities of molten steel, argon gas, and refining slag are constant, and the effects of temperature and hydrostatic pressure on the phase densities are neglected.
  • The velocity of bottom-blown gas entering the molten pool is assumed to be constant.

2.2. Hydrodynamic Equation

2.2.1. Continuous Phase Equation

The tracking of the internal interface(s) between multiphases is achieved by solving the continuity equation for one or more phases. For phase k, the corresponding equation is expressed as follows:
Mass conservation equation:
t α k ρ k + α k ρ k u k = 0
where ρ k is the density, (kg/m3), α k is the volume fraction, and u k is the velocity vector of liquid phase (k = l), gas phase (k = g), and particle phase (k = p), (m/s), respectively.
Momentum conservation:
t α k ρ k u k + α k ρ k u k u k = α k p + α k μ e f f u k + u k T + α k ρ k g + M k
μ e f f = μ m + μ t , m
μ m = α l μ l + α g μ g + α p μ p
μ t , m = C μ ( α l ρ l + α g ρ g + α p ρ p ) k 2 ε
α l + α g + α p = 1
where μ m , μ t , m , and μ e f f are the molecular viscosity, turbulent viscosity, and effective viscosity of the mixture phase respectively, (kg/(m·s)); p is the pressure, (Pa), which is shared by gas and liquid phases; M k is interaction force among the three phases, representing the momentum transfer between the gas bubble, liquid, and particle, which is important for accurate prediction of the steel flow in the LF. A large number of scholars have studied the forces between the gas, liquid, and particle phases and concluded that the drag force and turbulent dispersion force play a major role in the flow [22].
Thus, M g , M l , and M p can be expressed as follows:
M g = F D g l + F T D g l
M p = F D p l + F T D p l
M l = M g + M p
where F D and F T D are the drag force and turbulent dispersion force, respectively.
The drag force generally plays a dominant role in the interphase force between gas and liquid, and the general form of drag force may be expressed as follows:
F D g l = K g l u g u l
F D p l = K p l u p u l
K g l = C D g l 3 α g α l ρ l 4 d g u g u l
K p l = C D p l 3 α p α l ρ l 4 d p u p u l
where K g l and K p l are the interphase momentum exchange coefficients and d g and d p are the diameters of the bubbles and particles (m). The diameter change of the bottom-blown bubble in the ladle has a small effect on the steel flow in the ladle [21]. Therefore, the bubbles in the numerical model are of the same size. According to the study of Sano and Mori [22], the bubble diameter is calculated as follows:
d g = 0.0091 σ l ρ l 0.5 u g , 0 0.44
where σ l is the gas–liquid surface tension coefficient, and N/m, u g , 0 is the gas velocity at the nozzle exit, m/s.
In Equations (12) and (13), C D g l and C D p l are the drag force coefficients, which can be expressed as follows:
C D v i s g l = 24 / Re 1 + 0.1 Re 0.75 C D d i s g l < C D v i s g l C D d i s g l = 2 / 3 g ¯ ρ l 0.5 d g σ 0.5 1 + 17.67 1 α g 1.286 18.67 1 α g 1.5 C D v i s g l < C D d i s g l < C D c a p g l C D c a p g l = 3 / 8 1 α g 2 C D d i s g l > C D c a p g l
Re g l = ρ l u g u l d g μ l
C D p l = 24 / Re p l 1 + 0.15 Re 0.687 Re p l < 1000 0.44 Re p l 1000
Re p l = ρ l u p u l d p μ l
The turbulent dispersion force F T D can act on a bubble (or a particle) due to the turbulent fluctuation of liquid:
F T D , l = F T D , g = C T D K g l μ t , m ρ m g l σ α g α g α l α l
F T D , l = F T D , p = C T D K p l μ t , m ρ m p l σ α p α p α l α l
ρ m g l = α l ρ l + α g ρ g
ρ m p l = α l ρ l + α p ρ p
where σ is the dispersion Prandtl number ( σ = 9); turbulent dispersion coefficient C T D = 1 ; ρ m is the mixture density, kg/m3.

2.2.2. Turbulence Model

This study adopts the standard k–ε turbulence model. By introducing two transport equations—for turbulent kinetic energy (k) and turbulent dissipation rate (ε)—this model closes the Reynolds-averaged Navier–Stokes (RANS) equations, thereby enabling effective simulation of turbulent flows at high Reynolds numbers. The governing transport equations for turbulence kinetic energy k , and its dissipation rate ε , can be represented as:
t ρ m k + ρ m u m k = μ m + μ t , m σ k k + G k , m ρ m ε + S k
t ρ m ε + ρ m u m ε = μ m + μ t , m σ ε ε + ε k C 1 ε G k , m + C 1 ε ρ m ε + S ε
The turbulence viscosity, μ t , is computed as:
μ t = ρ C μ k 2 ε
The production of turbulence kinetic energy ( m 2 s 3 ), G k , is computed as:
G k = μ t u ¯ + u ¯ T : u ¯

2.3. Mesh and Boundary

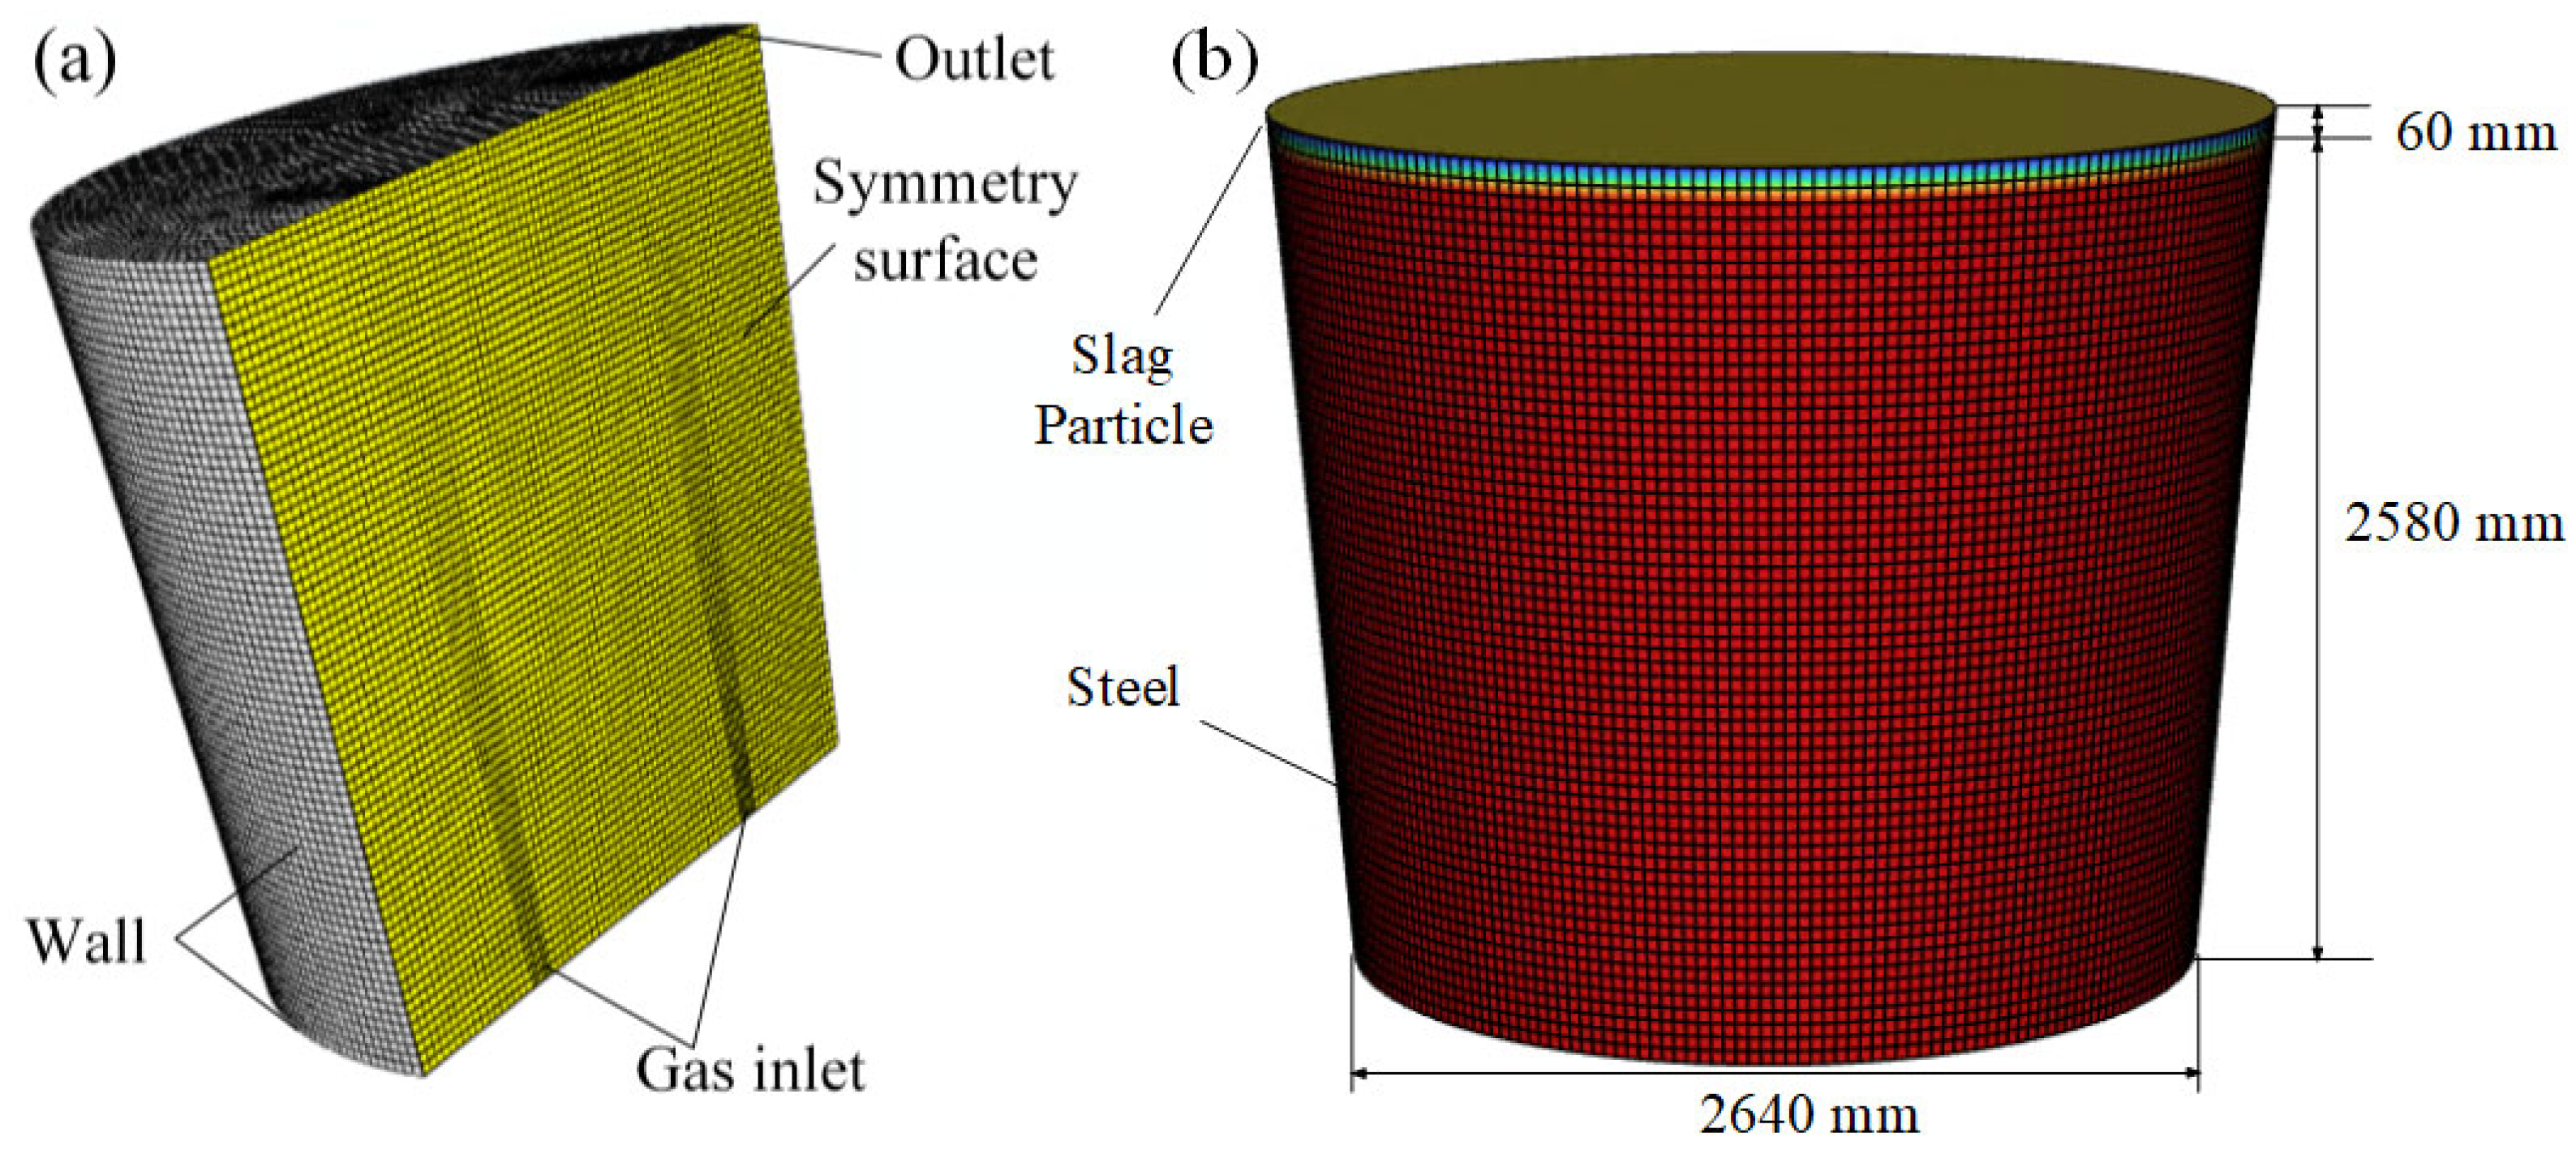
This study employs Gambit—a pre-processing tool coupled with Ansys Fluent 2024R2—to construct the ladle geometry and generate the computational mesh. Numerical simulations were performed using Ansys Fluent (commercial CFD software), and post-processing was conducted in Tecplot 2022R1 for data visualization and analysis. The Figure 2 shows the model of a 120-ton steel ladle and the mesh division diagram. The model is divided into two computational domains: molten steel and solid particle, separated by an internal interface. During mesh generation, the model’s air inlet region was refined with a mesh size of 18 mm, while the remaining domains were discretized using a coarser resolution of 30 mm. To save computational resources, when the permeable components are symmetrically arranged, only half of the model is meshed and calculated, resulting in a total of 260,052 mesh elements.
In the simulation, the inlet was set as a velocity inlet. The initial gas content at the inlet was calculated based on the ratio of the blowing hole area on the permeable components to the total surface area of the components, yielding a gas content of 0.01. Given the involvement of multiphase flow behaviours in the mathematical model, the top surface could not be directly defined as a degassing boundary. Thus, the outlet boundary is configured as a wall, and a user-defined function (UDF) is implemented to remove gas phases reaching the top surface. (Note: Fluent’s default degassing boundary condition is only designed for gas–liquid two-phase flows. In the present work, the default degassing boundary will remove both particles and gas phase from the computational domain). The UDF ensures only gas removal at the boundary while retaining solid particles and molten steel within the computational domain.

2.4. Physical Model

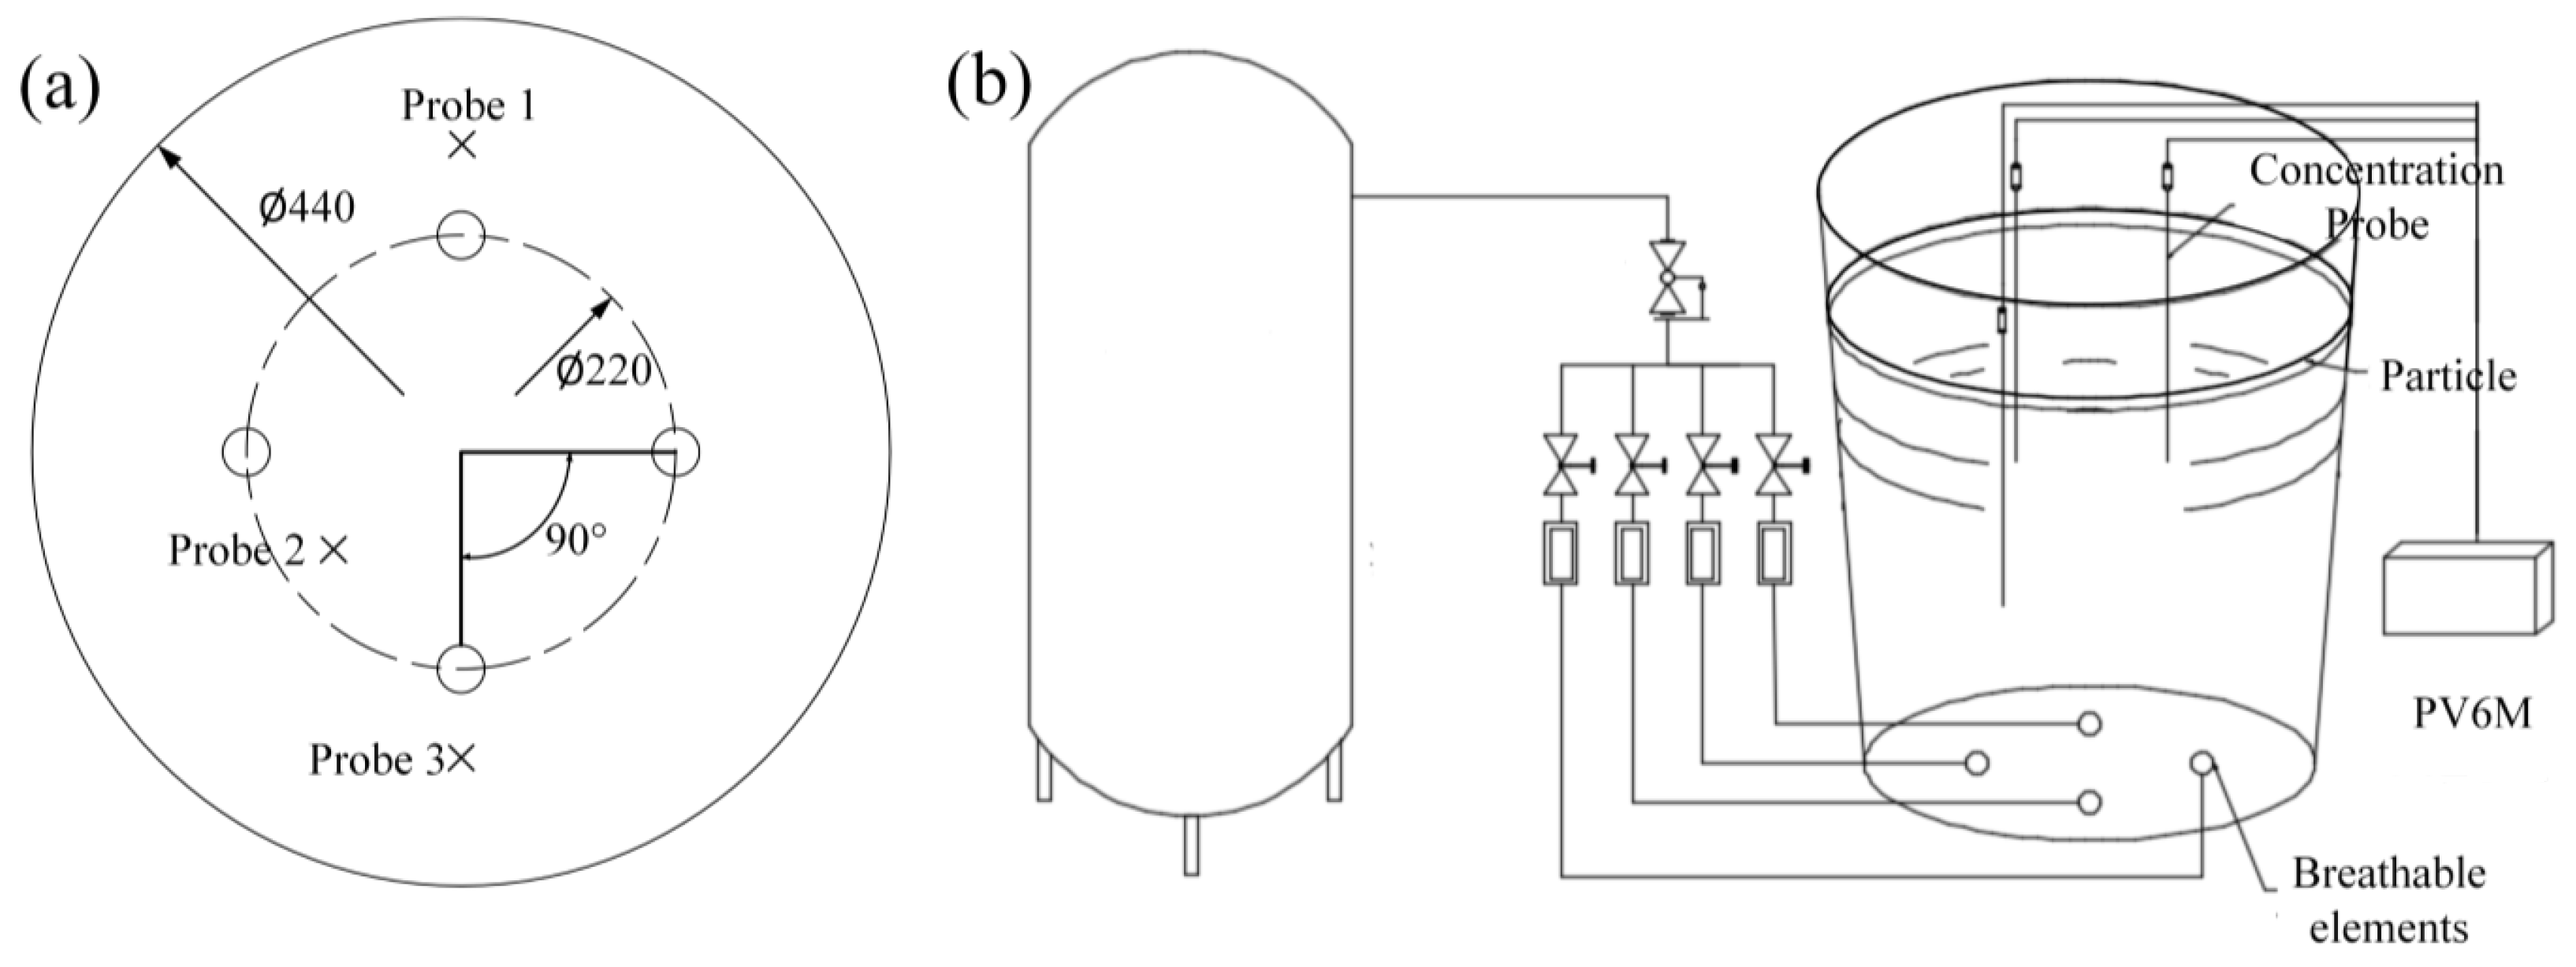
In this study, a 120-ton industrial ladle from a steel plant served as the prototype for a scaled-down water model. The model was constructed at a geometric similarity ratio of 1:6 (model:prototype). Detailed dimensional specifications of the scaled model are provided in Table 1.
To maintain dynamic similarity between the prototype and its water model, equivalence of the modified Froude criterion must be satisfied.
F r = ρ g d 2 v 2 ( π / 4 ) ρ l g D 2 H ( π / 4 )
where F r is modified Fred criterion (dimensionless); v is gas injection speed (m/s); g is gravitational acceleration (9.81 m/s2); d is diameter of the bottom-blown air-permeable brick (mm); D is diameter of the molten pool (m); and H is depth of the molten pool (m).
Through the calculation:
Q m = ρ g , p ρ l , p ρ g , m ρ l , m d m d p 4 H m H p 0.5 Q p
where ρ g , p is density of argon (1.6228 kg/m3), ρ g , m is density of air (1.225 kg/m3), ρ l , m is density of water (1000 kg/m3), ρ l , p is density of steel (7020 kg/m3), d m / d p = H m / H p is equal to the characteristic length L m / L p , i.e., 1:6. Bring in the numerical value and find:
Q m = 0.005 Q p
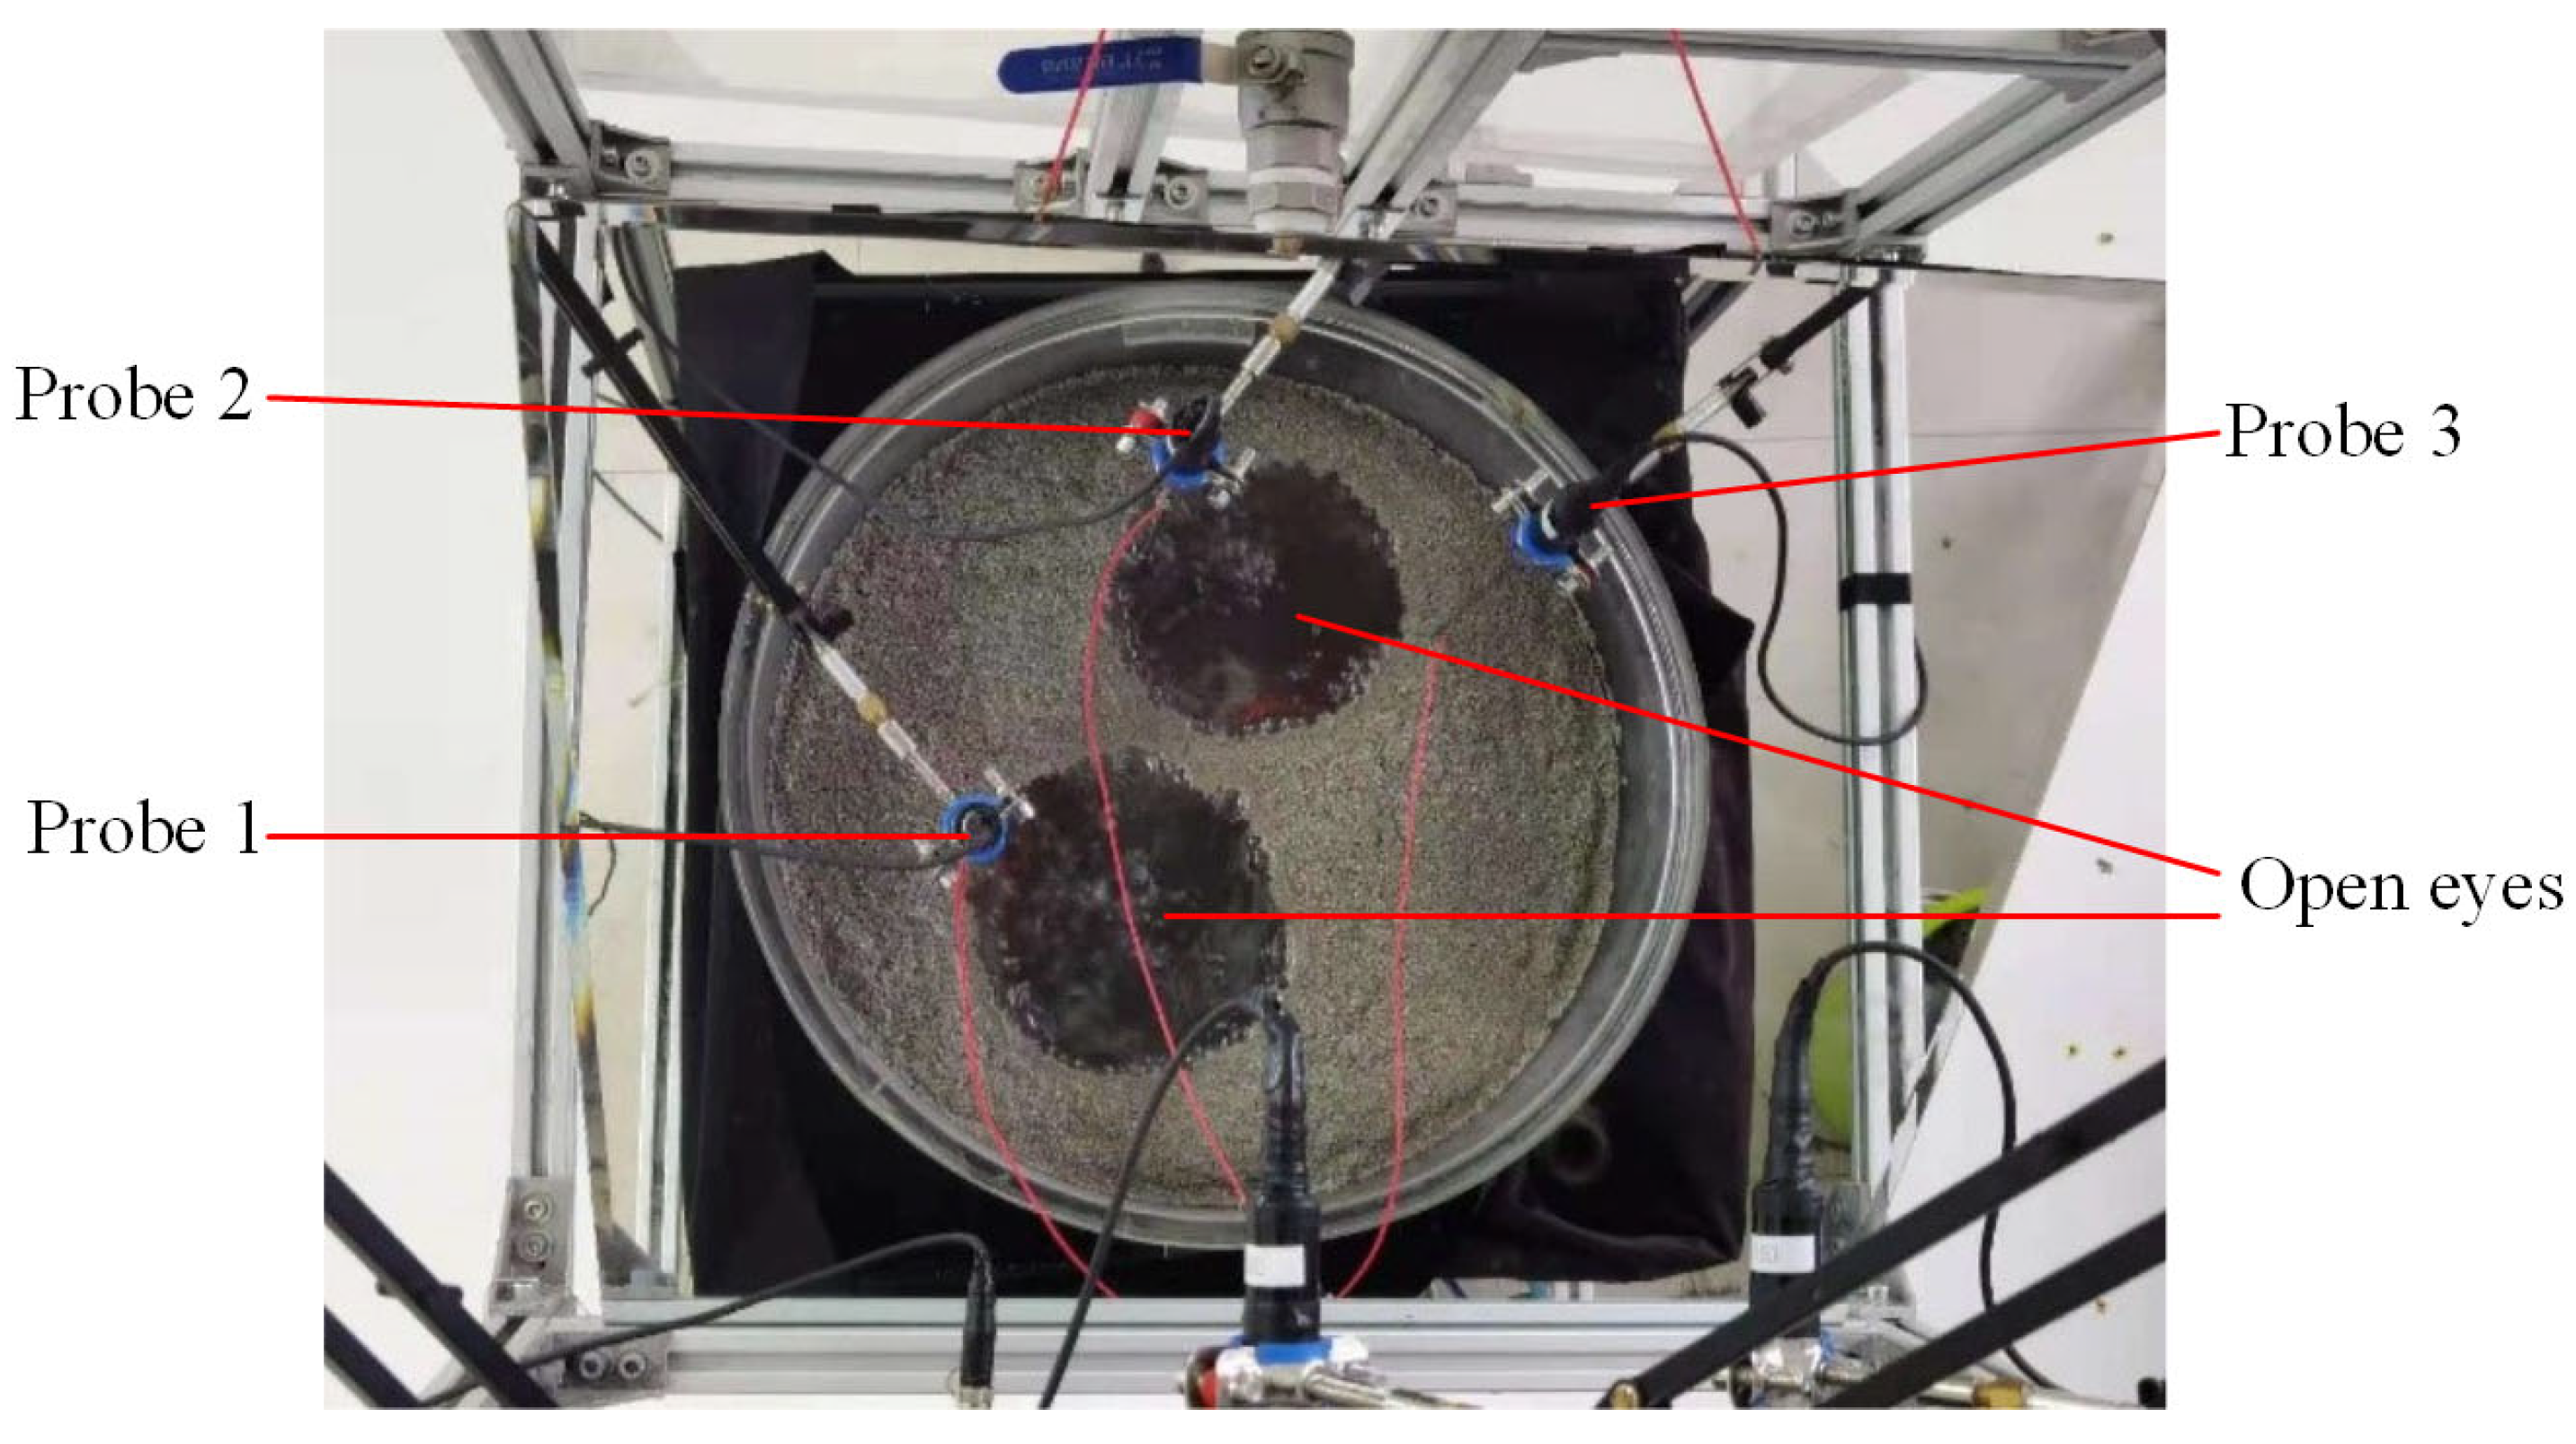
Figure 3 presents a schematic diagram of the physical model, and Figure 4 shows the top view of the water model. In these figures, Probe 1 is positioned 200 mm below the water surface, while Probes 2 and 3 are located at a depth of 100 mm below the water surface. The particle layer has a thickness of 10 mm. The mixing effect of the particle layer is evaluated by varying the gas flow rate, the number of permeable components, and the size of slag particles. Measurements are conducted using a particle concentration meter. To minimize the impact of external factors on the results and reduce systematic errors, each experiment is repeated three times, with each trial having a measurement duration of 260 s. The average value is recorded as the particle concentration.

2.5. Parameter

The relevant computational parameters involved in the model are shown in Table 2.
The main chemical compositions of the steel and slag are shown in Table 3 and Table 4, respectively.

2.6. Methodology

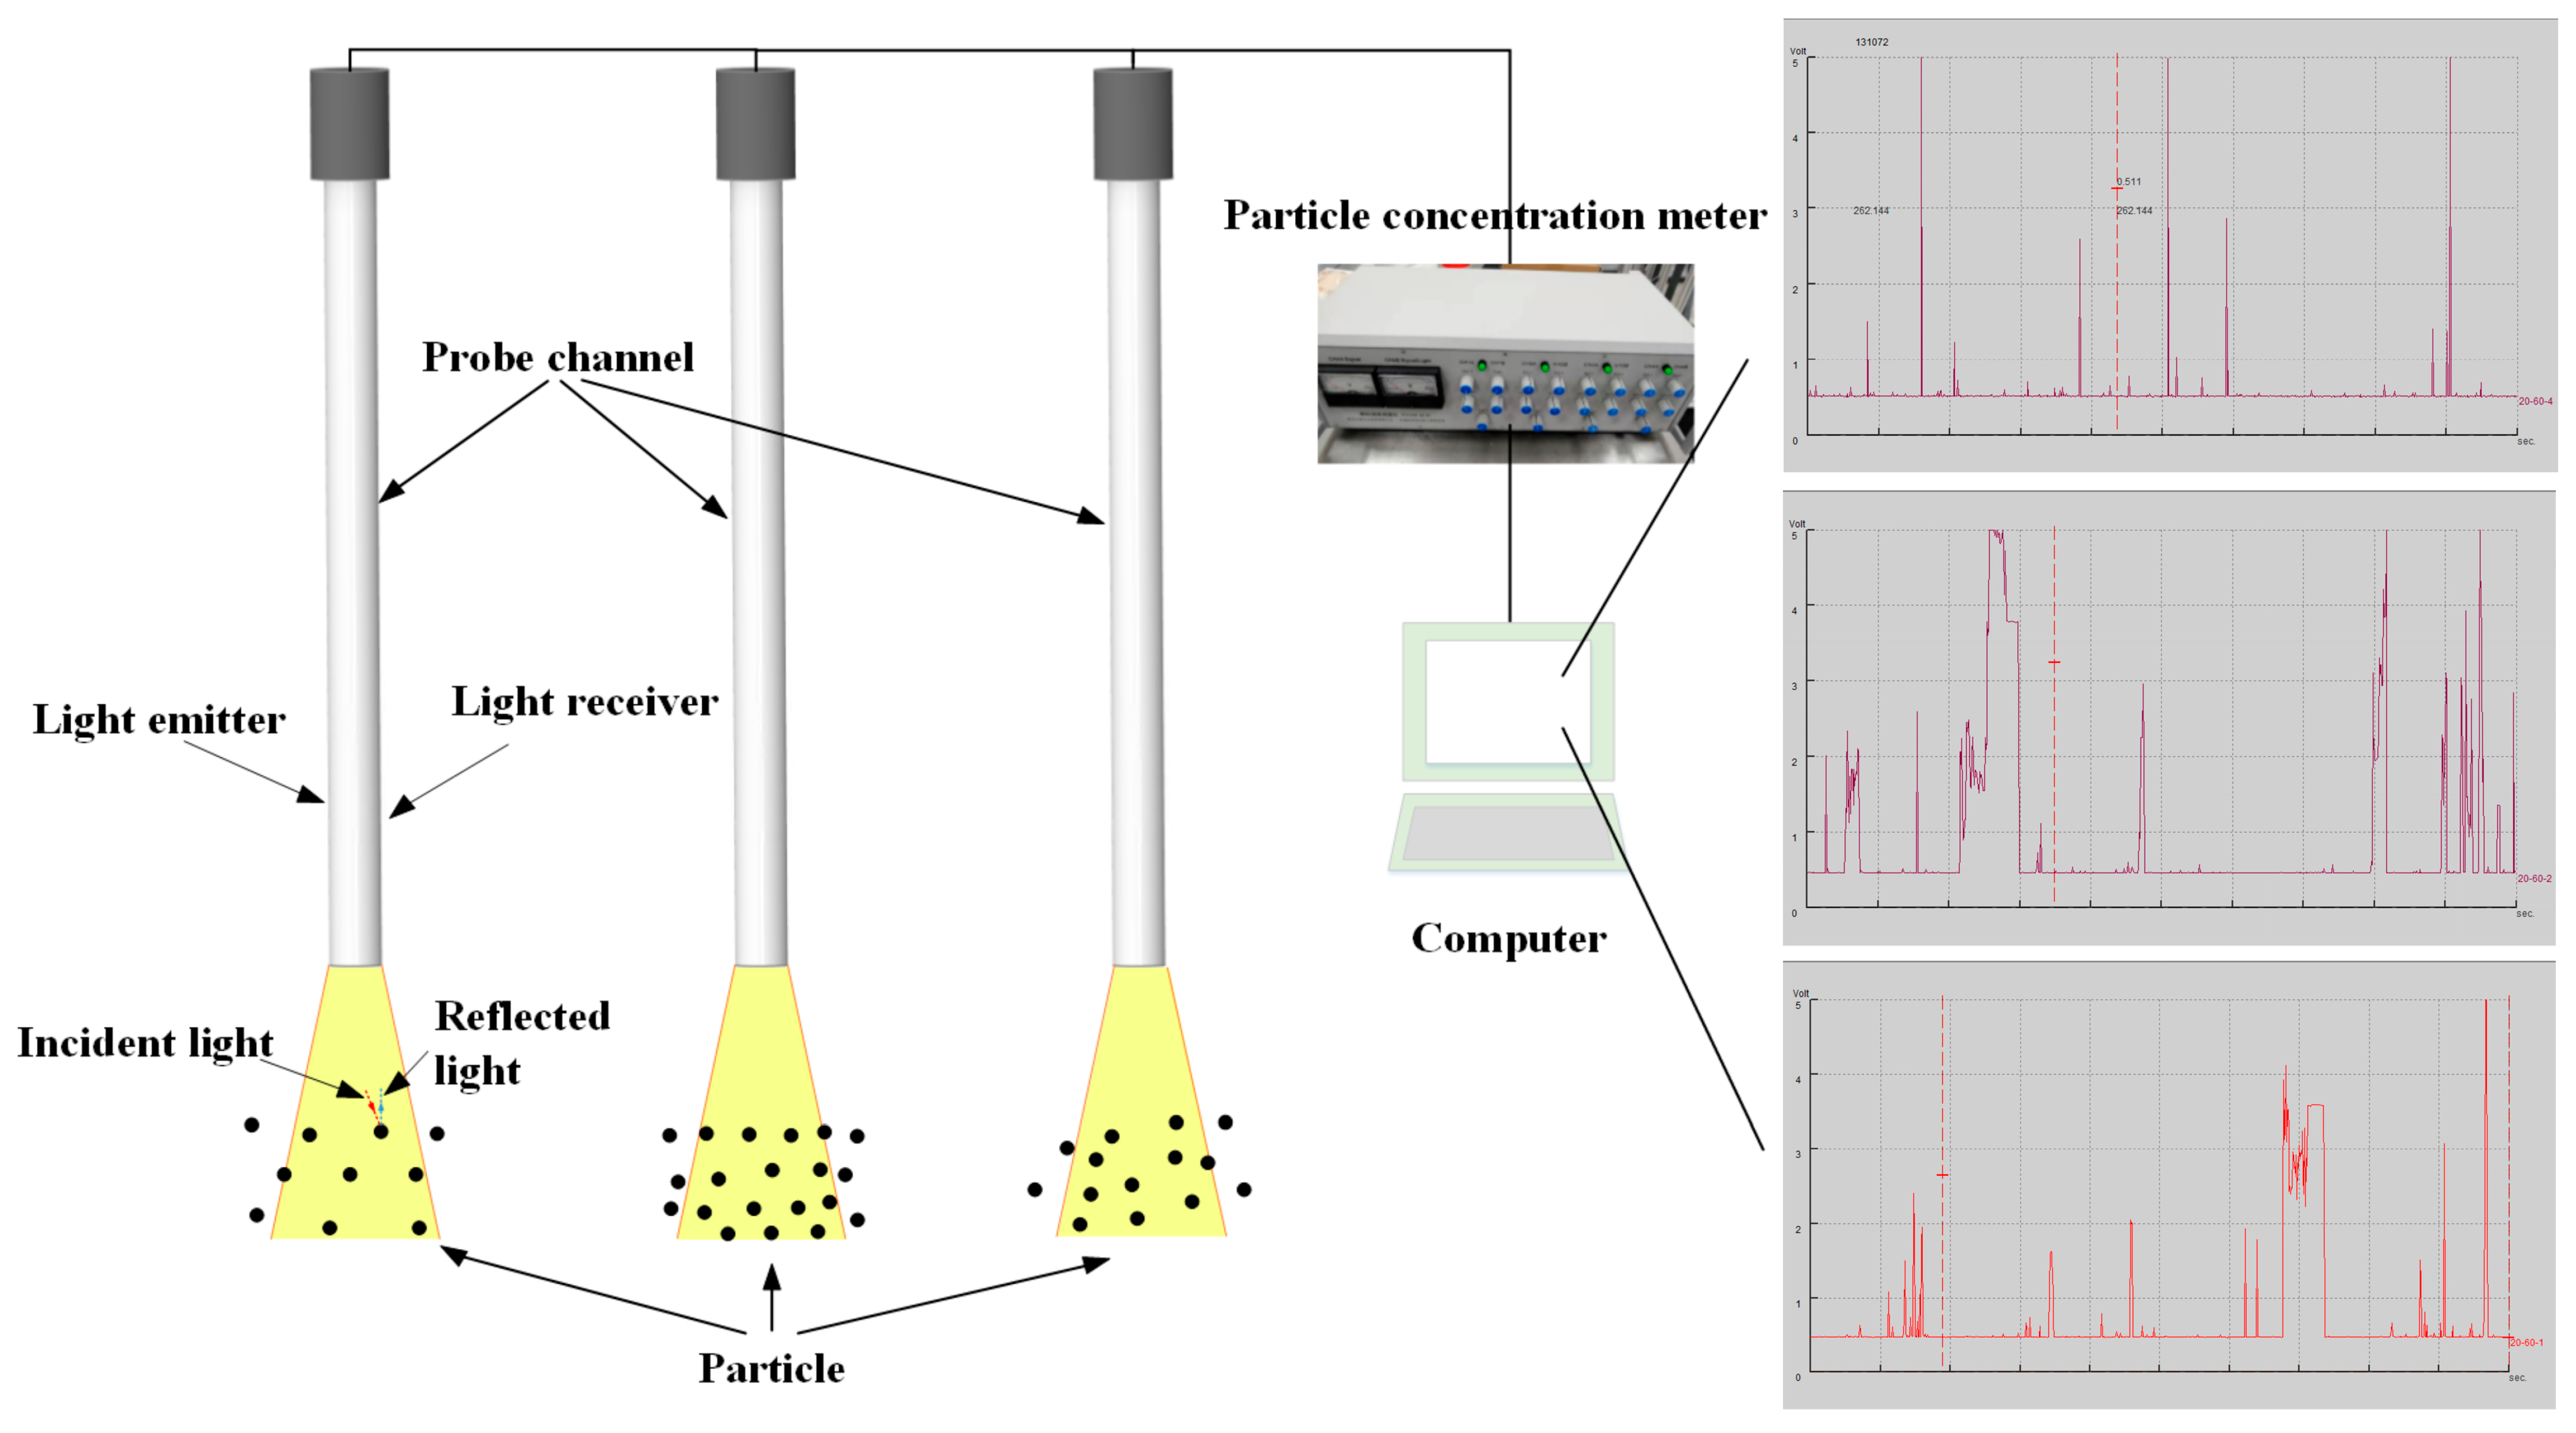
In accordance with the similarity principle, a water model experiment was conducted. The particle entrainment behavior in the molten pool was monitored using a PV6M multi-channel particle concentration meter and a high-speed camera. A schematic diagram of the particle concentration measurement system is shown in Figure 5. Each probe channel consists of a light emitter and a light receiver. The light emitter emits light outward, and the light receiver receives light. When the particle passes through the probe, the particle concentration meter will receive different light signals and display different voltage values. Based on the working principle of the method, natural light can significantly affect the experimental results. Therefore, all experiments were conducted under light-shielded conditions to eliminate external optical interference.
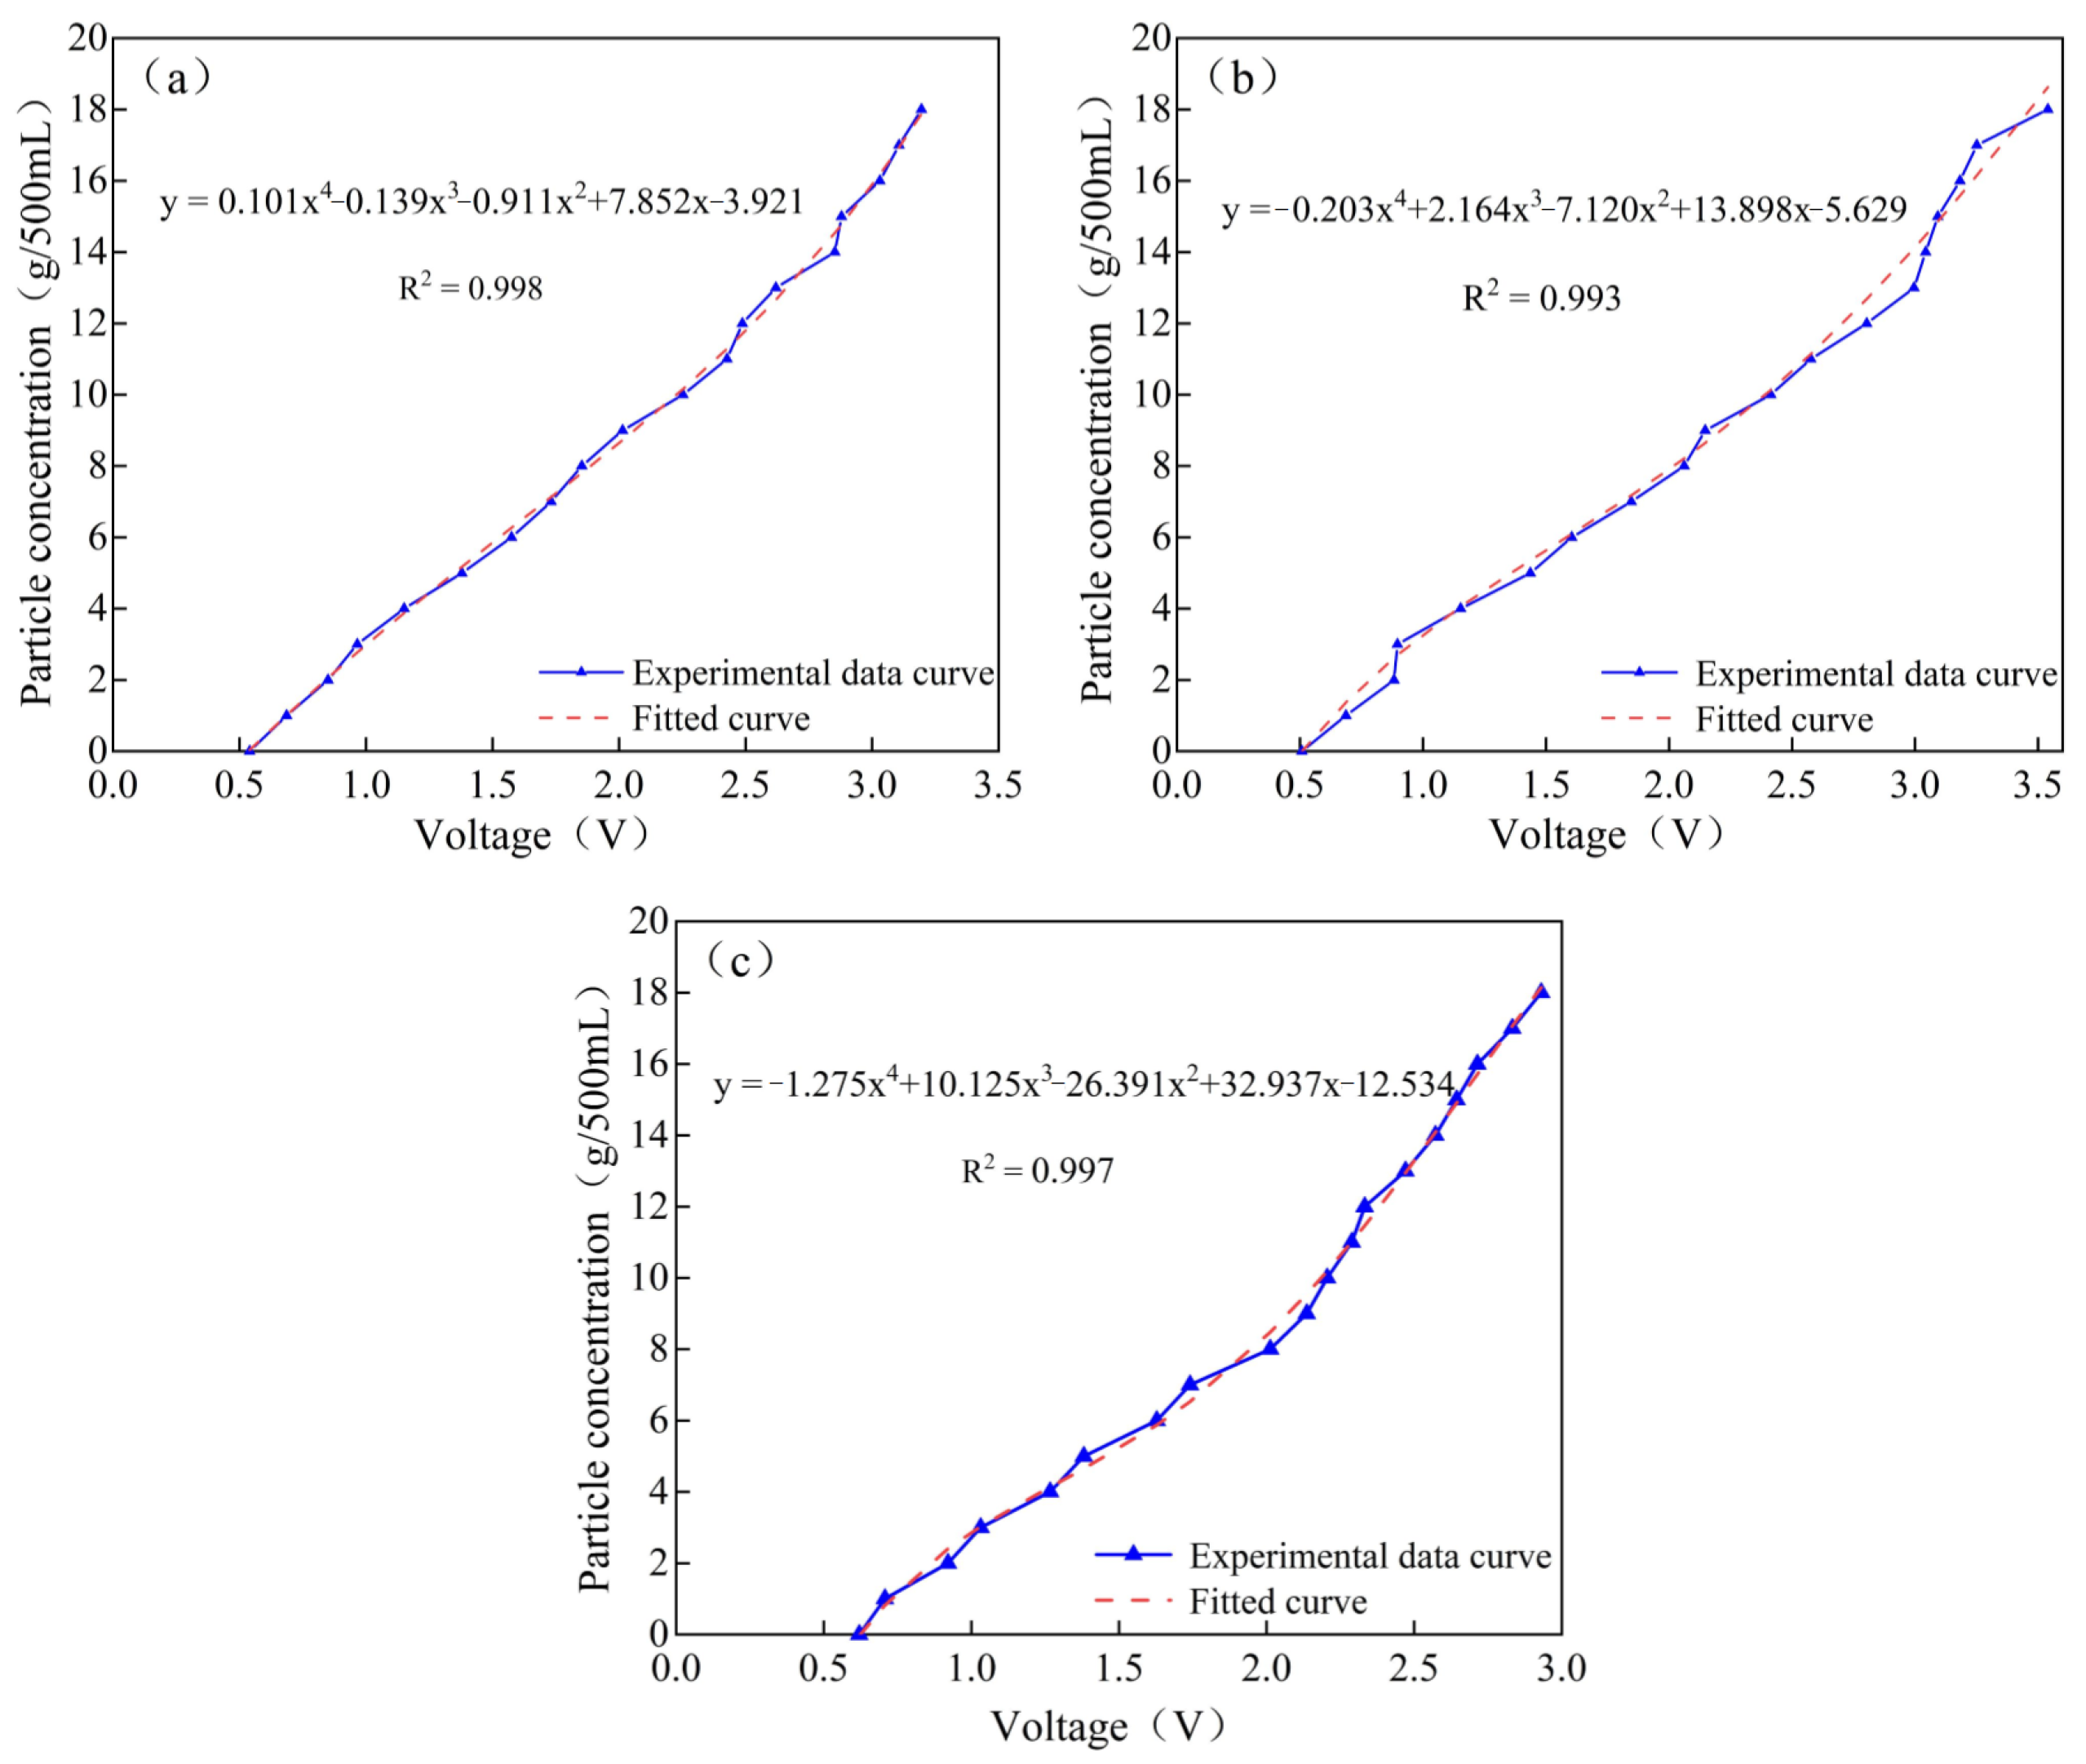
To obtain accurate and reliable particle concentration measurements, the instrument was calibrated prior to the experiment using the actual particles to establish a relationship between the particle concentration and the corresponding signal voltage (V) derived from reflected light intensity. Since the device converts optical signals reflected by the particles into electrical outputs, ambient light significantly affects measurement accuracy. To minimize the influence of natural light during calibration, the procedure was conducted at night, and the calibration container (a 1 L beaker) was wrapped in black light-absorbing fabric to eliminate external illumination. For each calibration point, 500 mL of clean water (half the container’s volume) was measured, and particles weighing between 0 and 18 g were added incrementally. A stirring device was used to homogenize the mixture before each measurement. The resulting calibration curve is presented in Figure 6.

3. Results and Analysis

3.1. Verification of Model Correctness

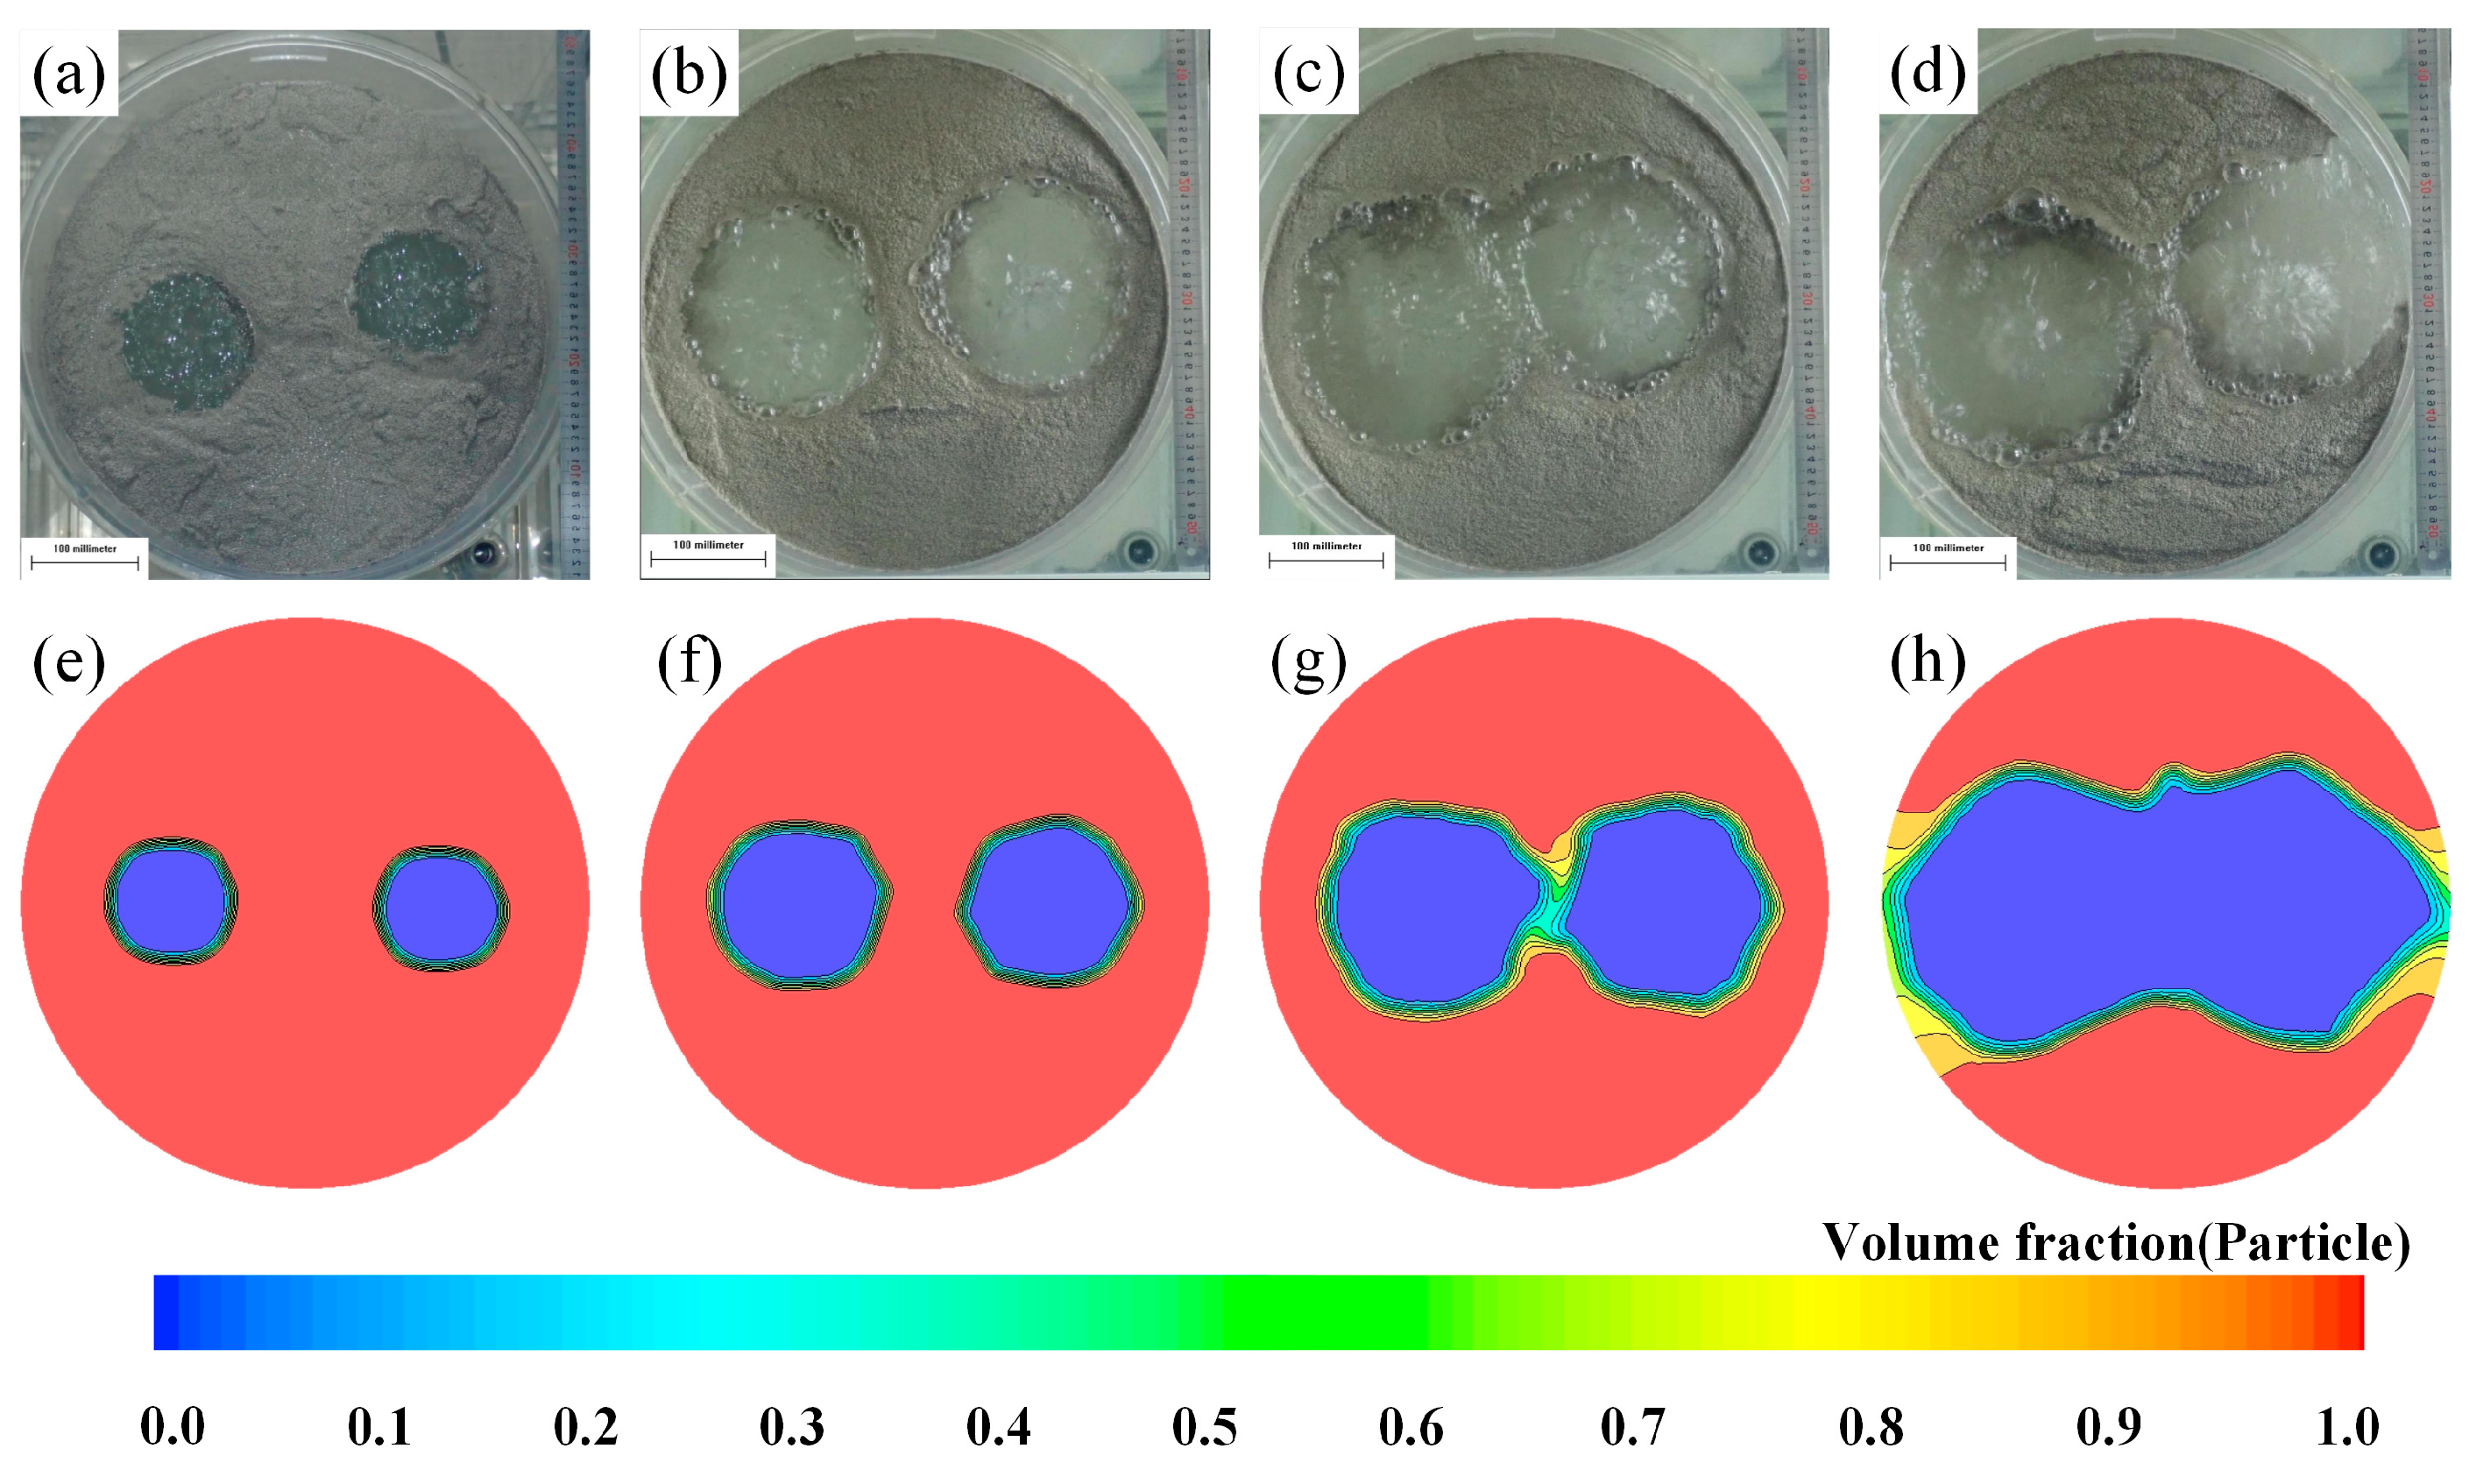
The solid particles accumulated on the liquid surface in the ladle will form “open eyes” under bottom blowing, which is also easy to observe in actual production, as shown in Figure 1a. To verify the mathematical model, the “open eyes” data predicted by the model and the measured data were compared. Figure 7 and Figure 8 presents the “open eyes” sizes obtained from both experiments and simulations at bottom-blowing gas flow rates of 4 NL/min, 8 NL/min, 12 NL/min, and 16 NL/min, with a maximum error of 12.2%. The good agreement between the simulation predictions and experimental results confirms the reliability of the model.
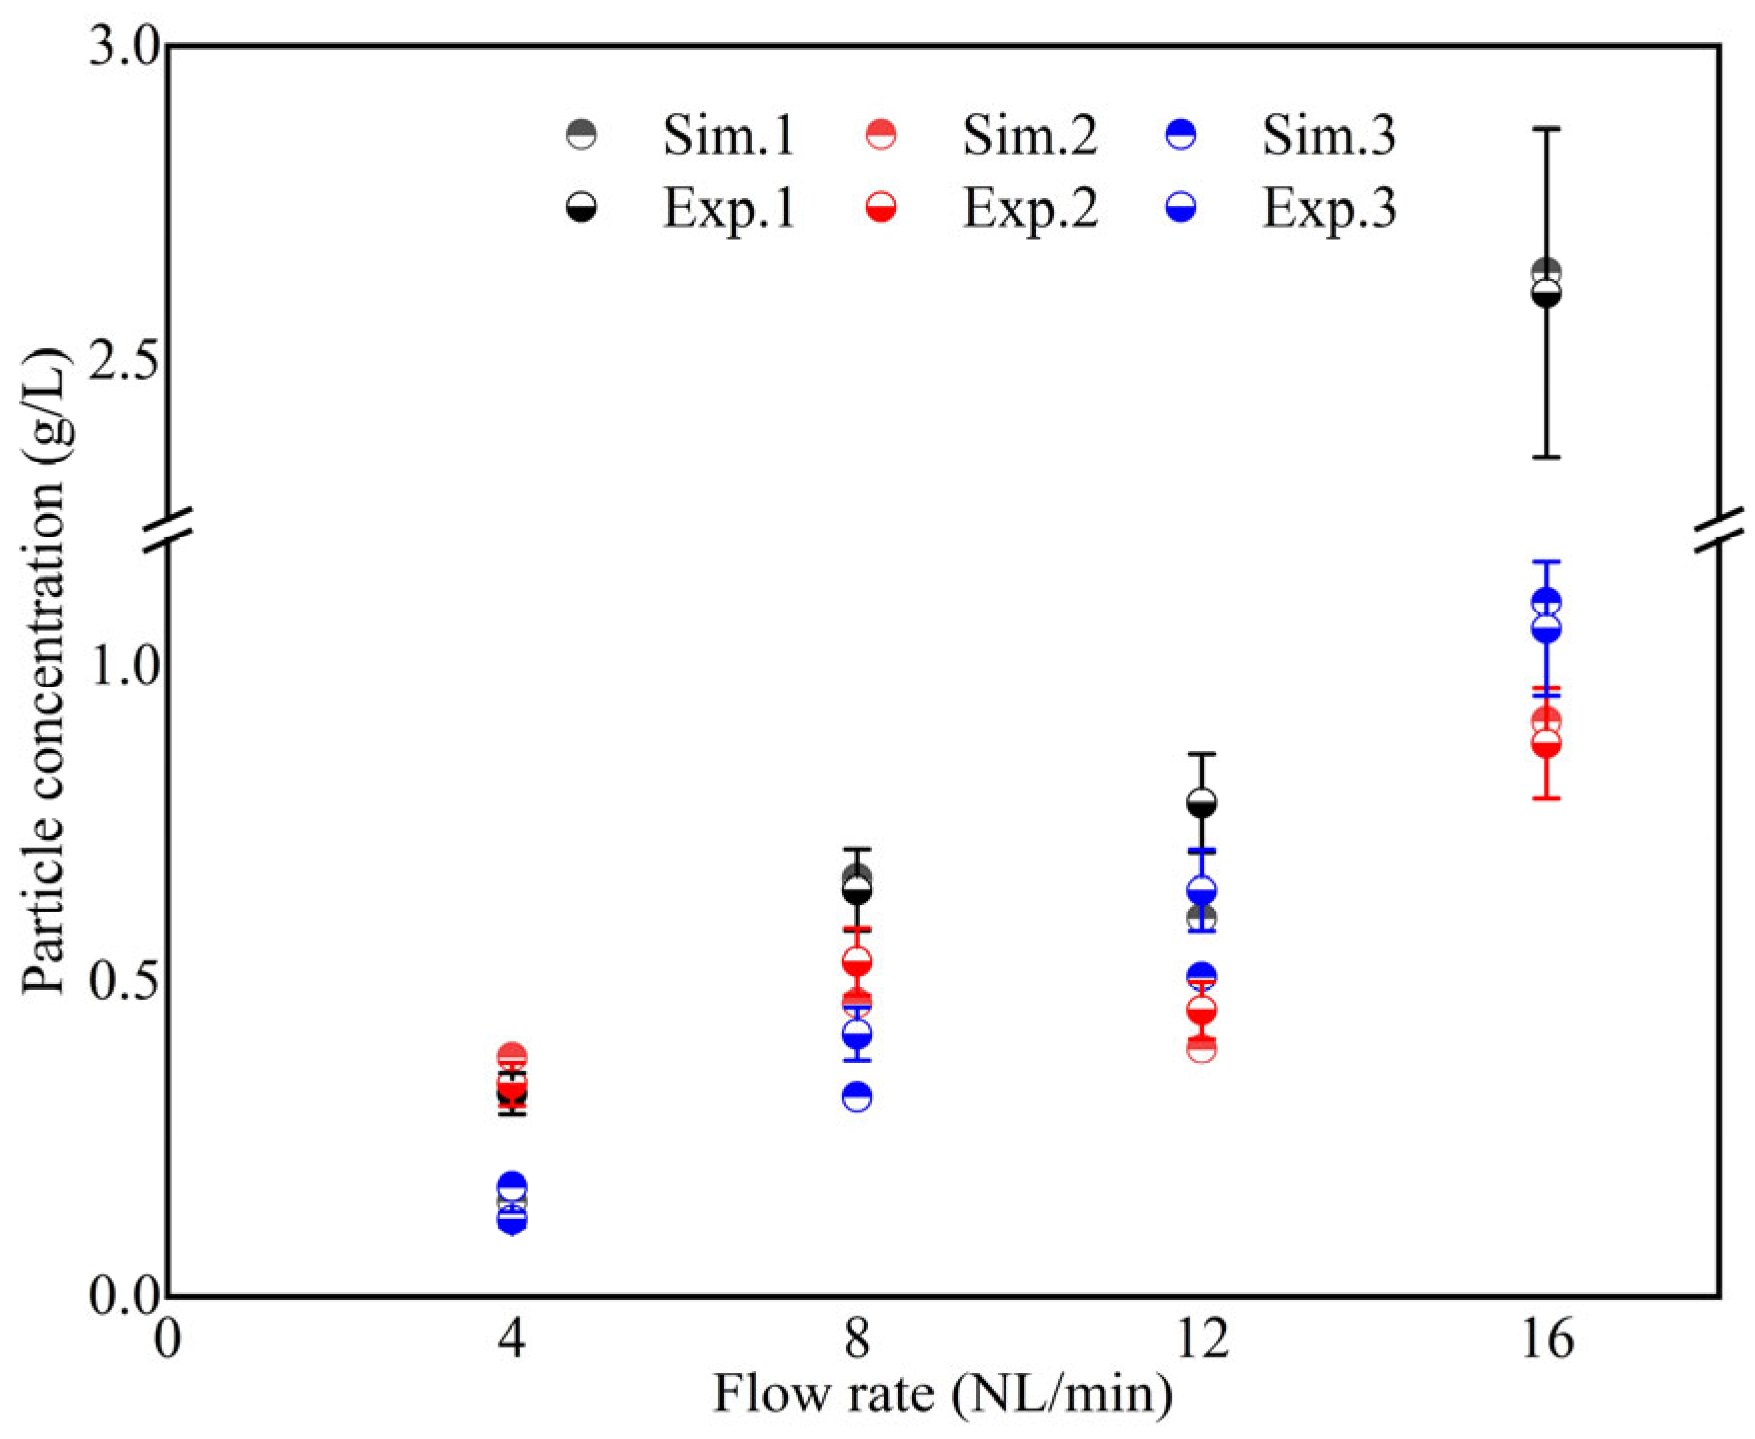
Figure 9 presents the particle concentrations measured in experiments and predicted by simulations at various flow rates, where numbers 1, 2, and 3 correspond to the positions of the three probes. Overall, the results demonstrate a good agreement between the simulation predictions and the experimental measurements, with an average error within 10%.
To validate mesh independence, multiple mesh resolutions were created, and their predicted particle entrainment mass over time is shown in Figure 10. The distribution trend of solid particle entrainment remains consistent across mesh resolutions. At 4 s, coinciding with the bubble reaching the top surface, the entrained particle mass increases sharply before gradually stabilizing within a specific range. The average entrained mass between 10 s and 100 s was calculated as follows: 28.35 kg for the 183k-cell mesh, 30.81 kg for the 260k-cell mesh, and 31.18 kg for the 437k-cell mesh. The predicted results show negligible differences when the mesh count exceeds 260k. Balancing computational accuracy and efficiency, the 260k-cell mesh model was selected for subsequent simulations in the present work.

3.2. Effect of Bottom Blowing Flow Rate

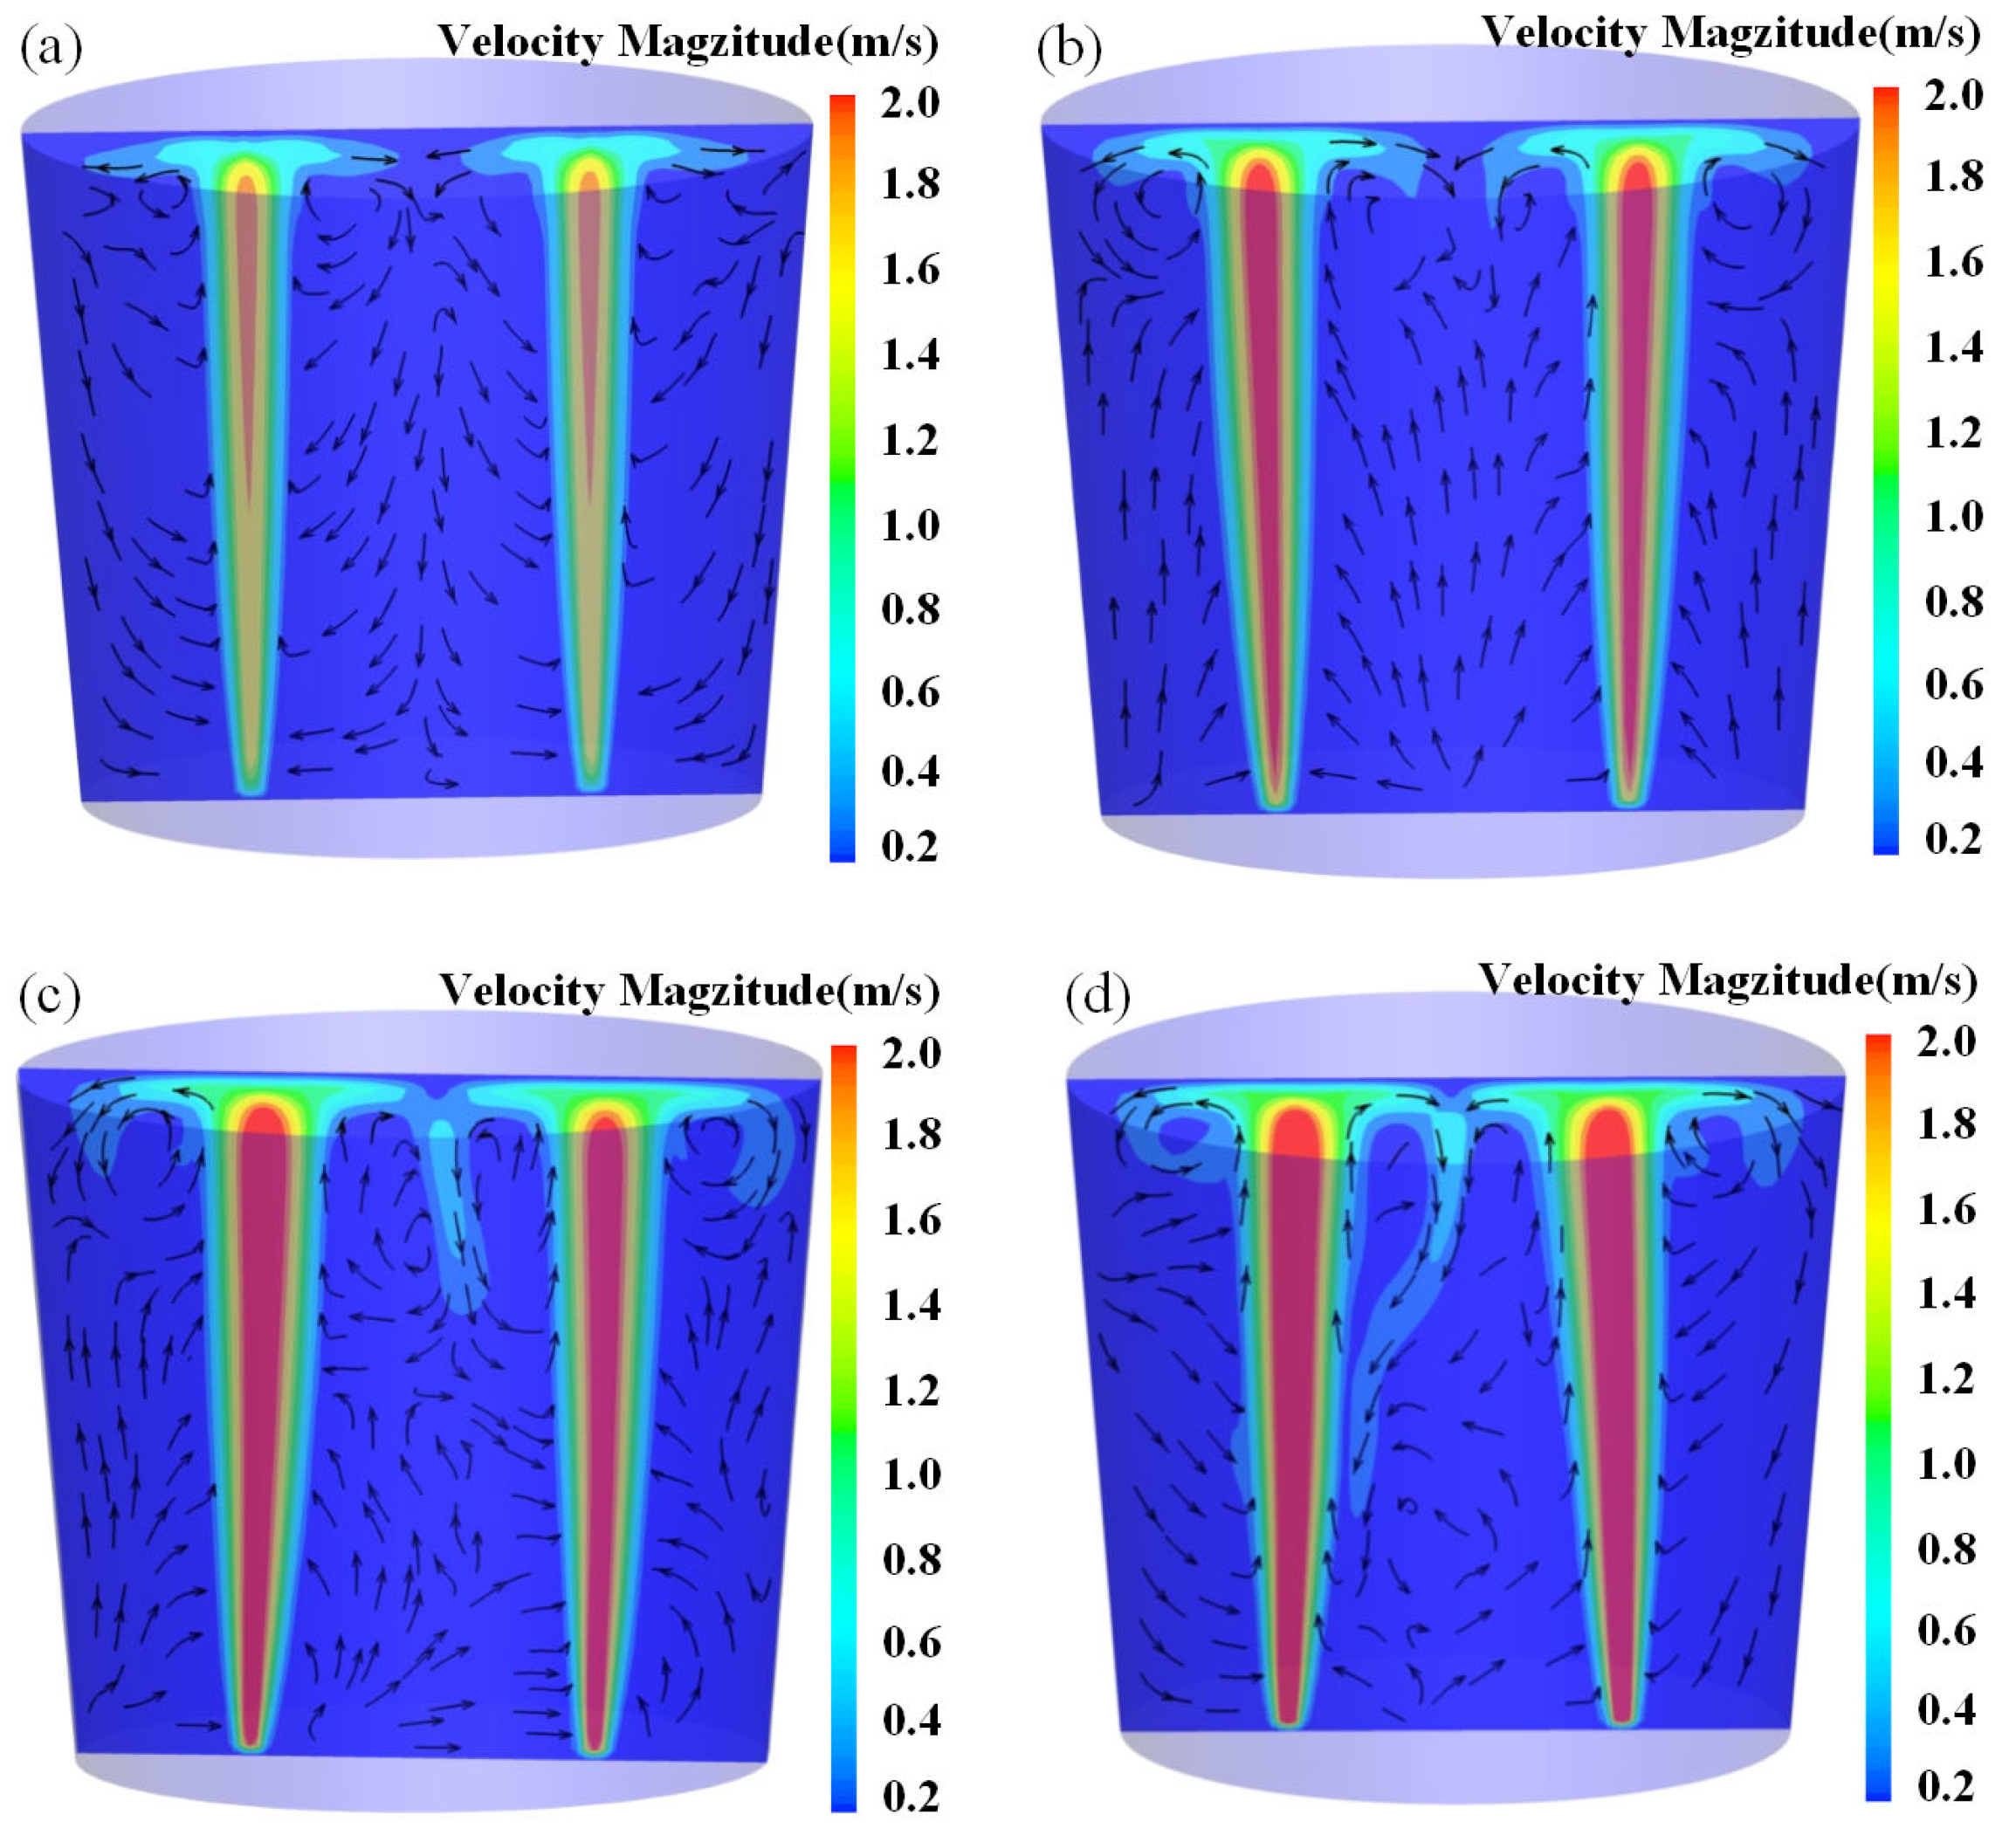
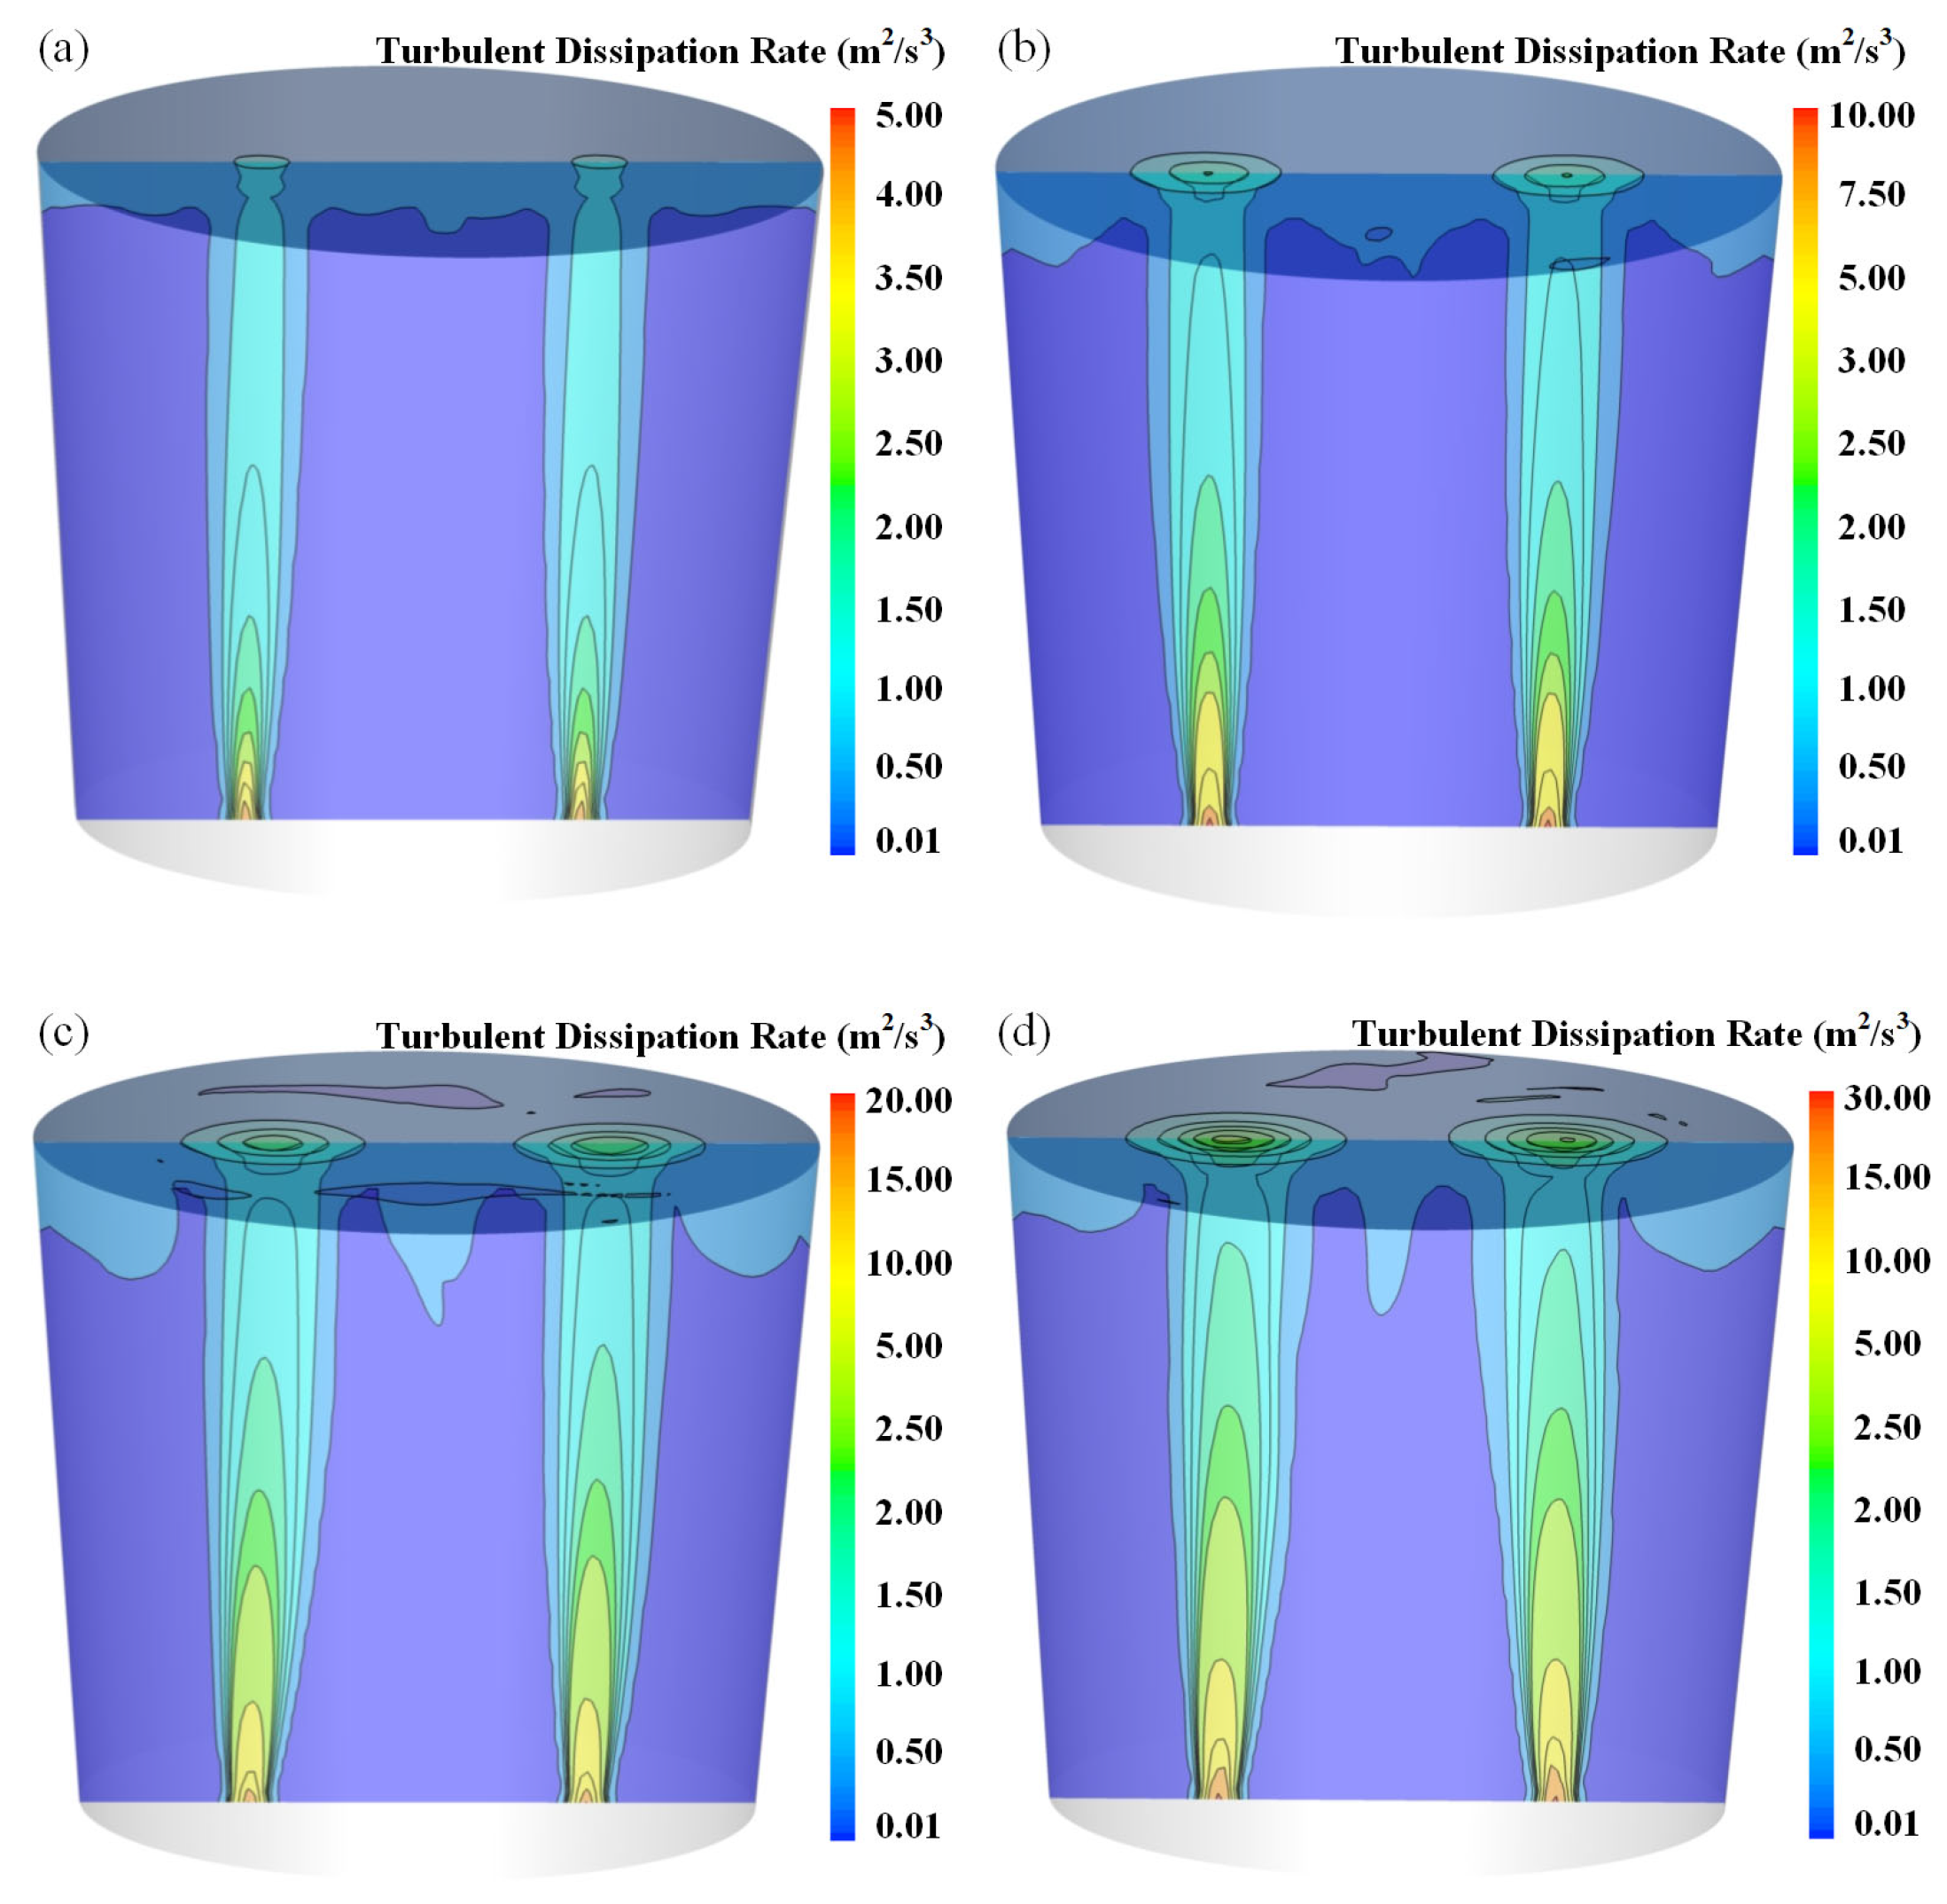
Gas flow rate directly influences the flow field of molten steel and the behavior of particles, while turbulence within the ladle is the key factor triggering particle pulsation and entrainment. Figure 11 and Figure 12 illustrate the flow field structure and turbulent dissipation rate distribution in the ladle under different gas flow rates. In these simulations, a 180° dual-tuyere configuration is adopted, and the particle diameter and packing thickness are 5 mm and 60 mm, respectively. As shown in Figure 11 and Figure 12, at a low gas flow rate (48 Nm3/h), the flow within the ladle is relatively weak, the circulation center is located near the liquid surface, and the turbulence intensity is also low. As the gas flow rate increases, the center velocity of the gas plume rises and the interactions between plumes intensify, leading to an expansion of the vortex region and increased flow instability. Figure 12 also reveals that when the bottom-blowing gas flow rate exceeds 192 Nm3/h, the turbulence intensity near the surface increases significantly, which is more favorable for particle entrainment and mixing behavior.
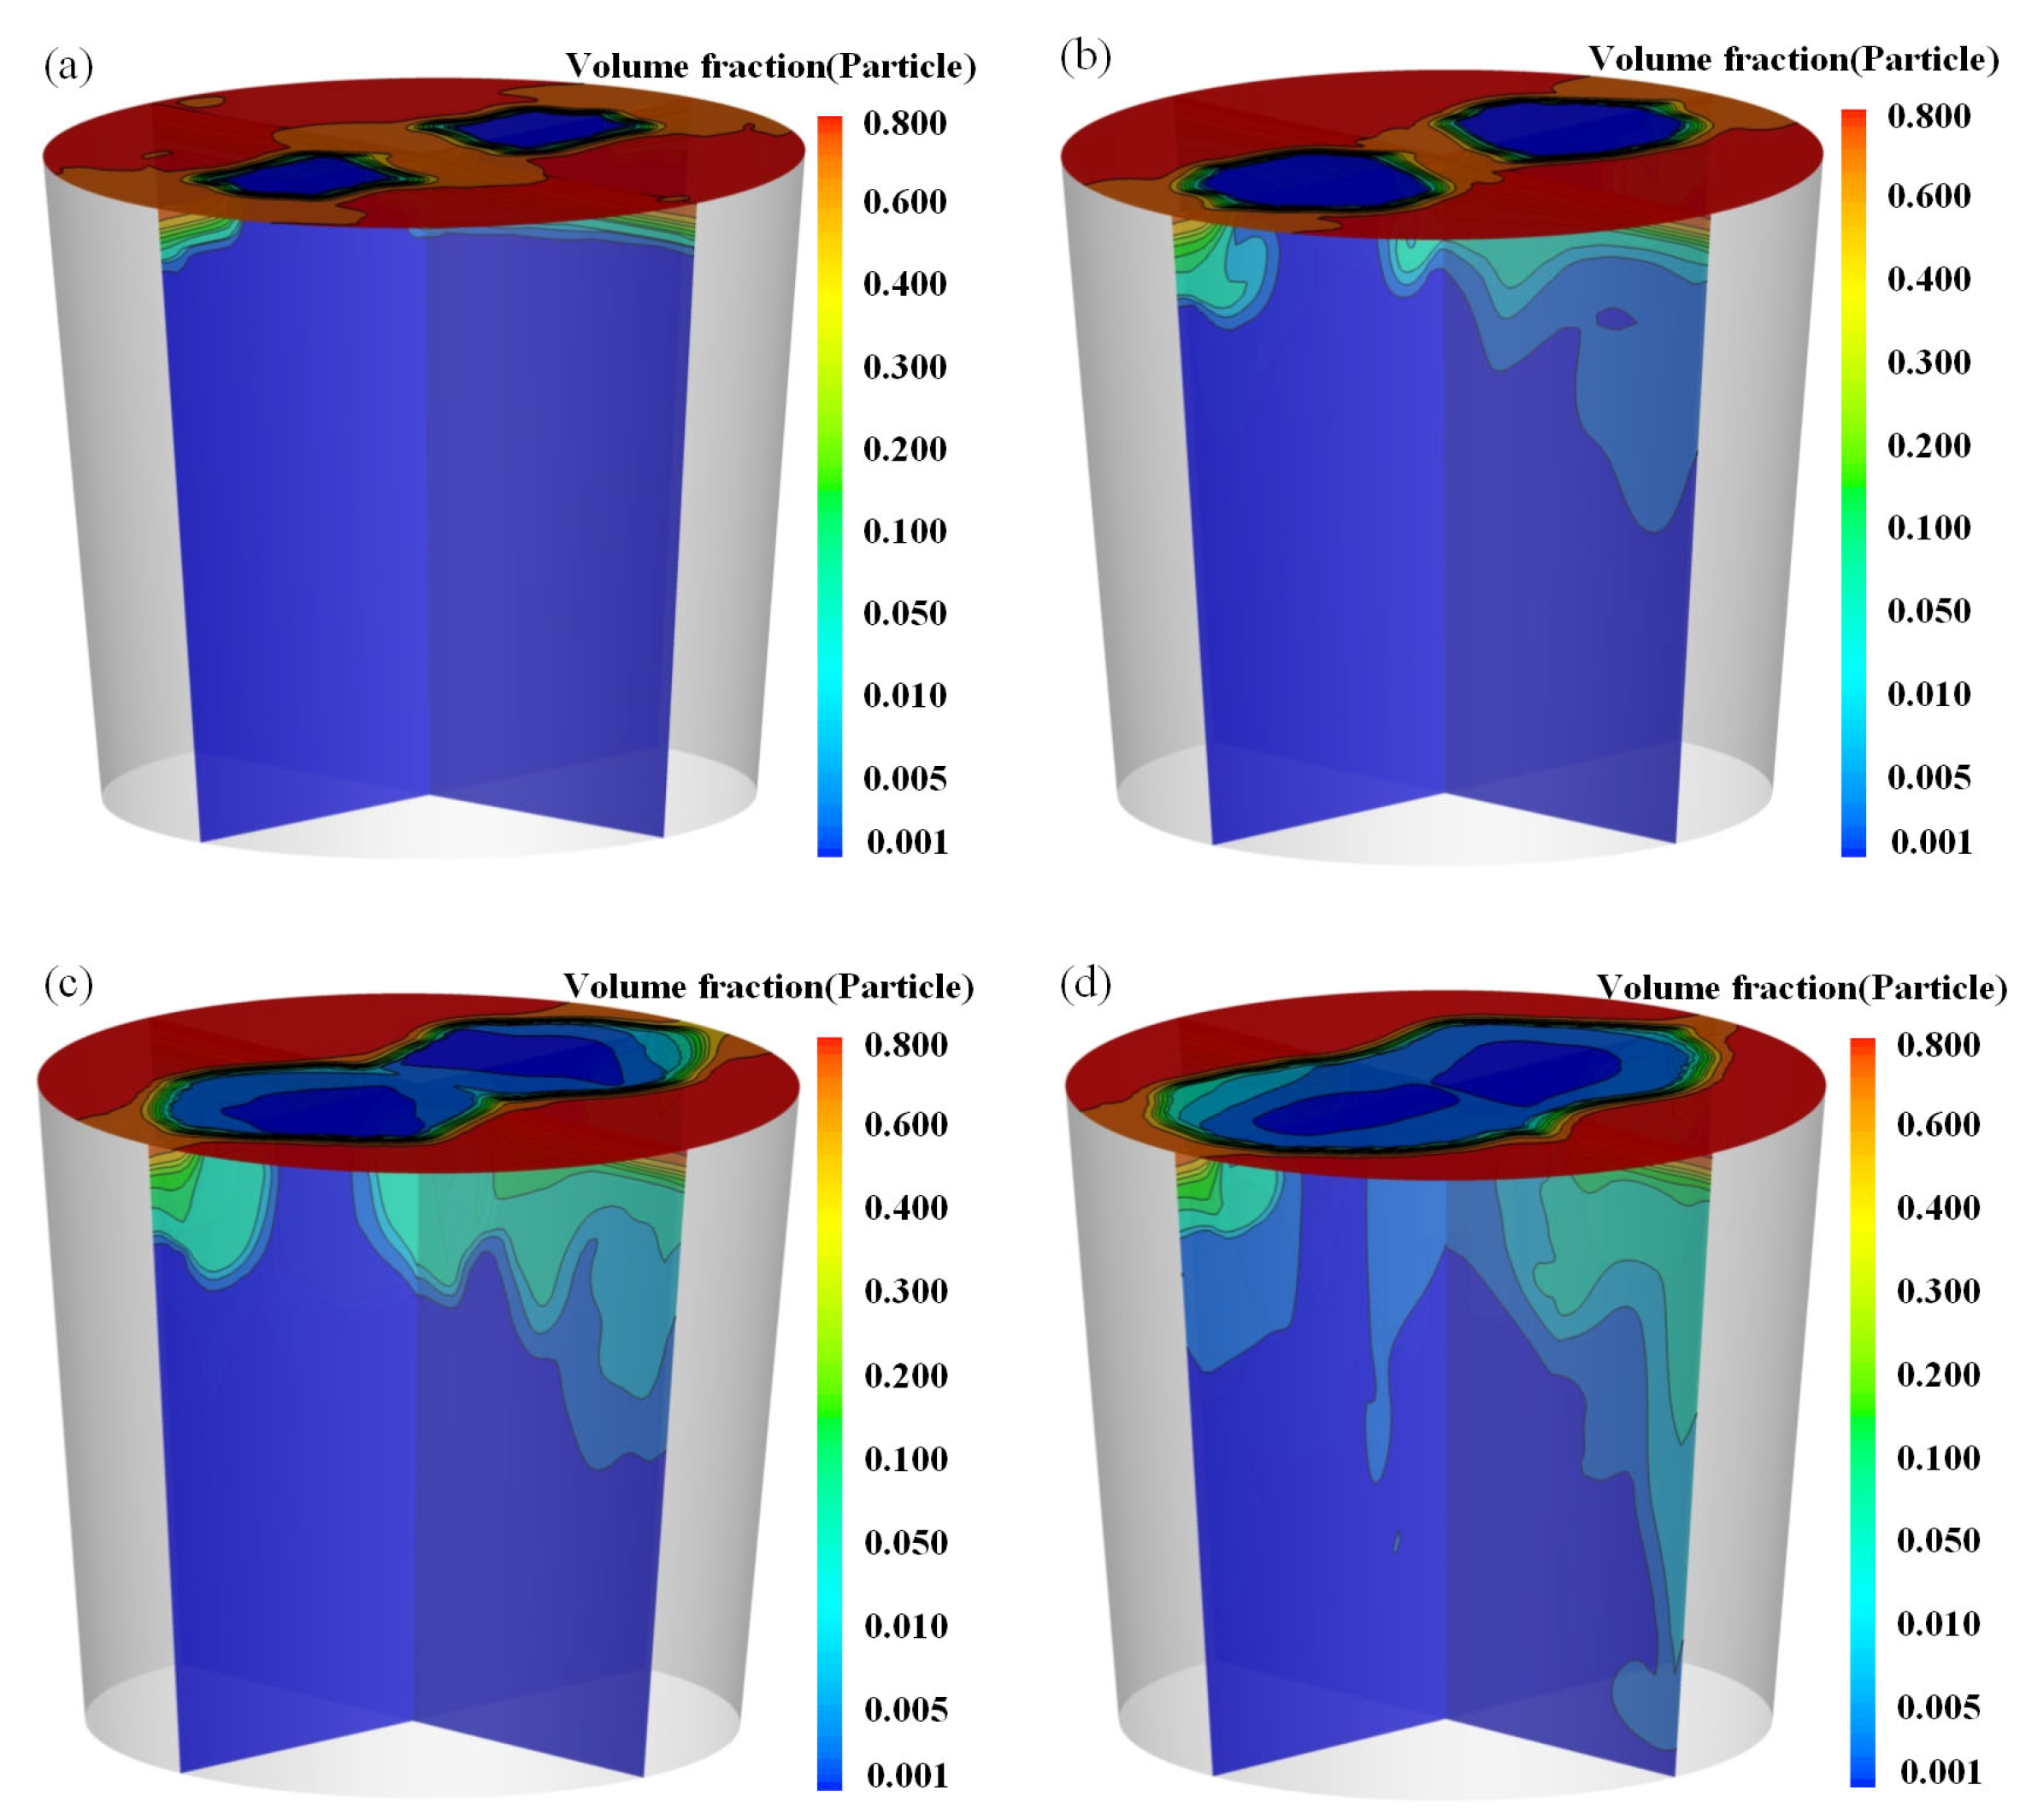
Figure 13 illustrates the contours of the solid volume fraction of the particle phase under various gas flow rates. At lower flow rates, the particles tend to accumulate near the steel–particle interface and are seldom entrained into the molten steel. As the gas flow rate increases, the extent of particle entrainment into the molten steel becomes significantly more pronounced, particularly in the near-wall regions surrounding the “open eyes” area.
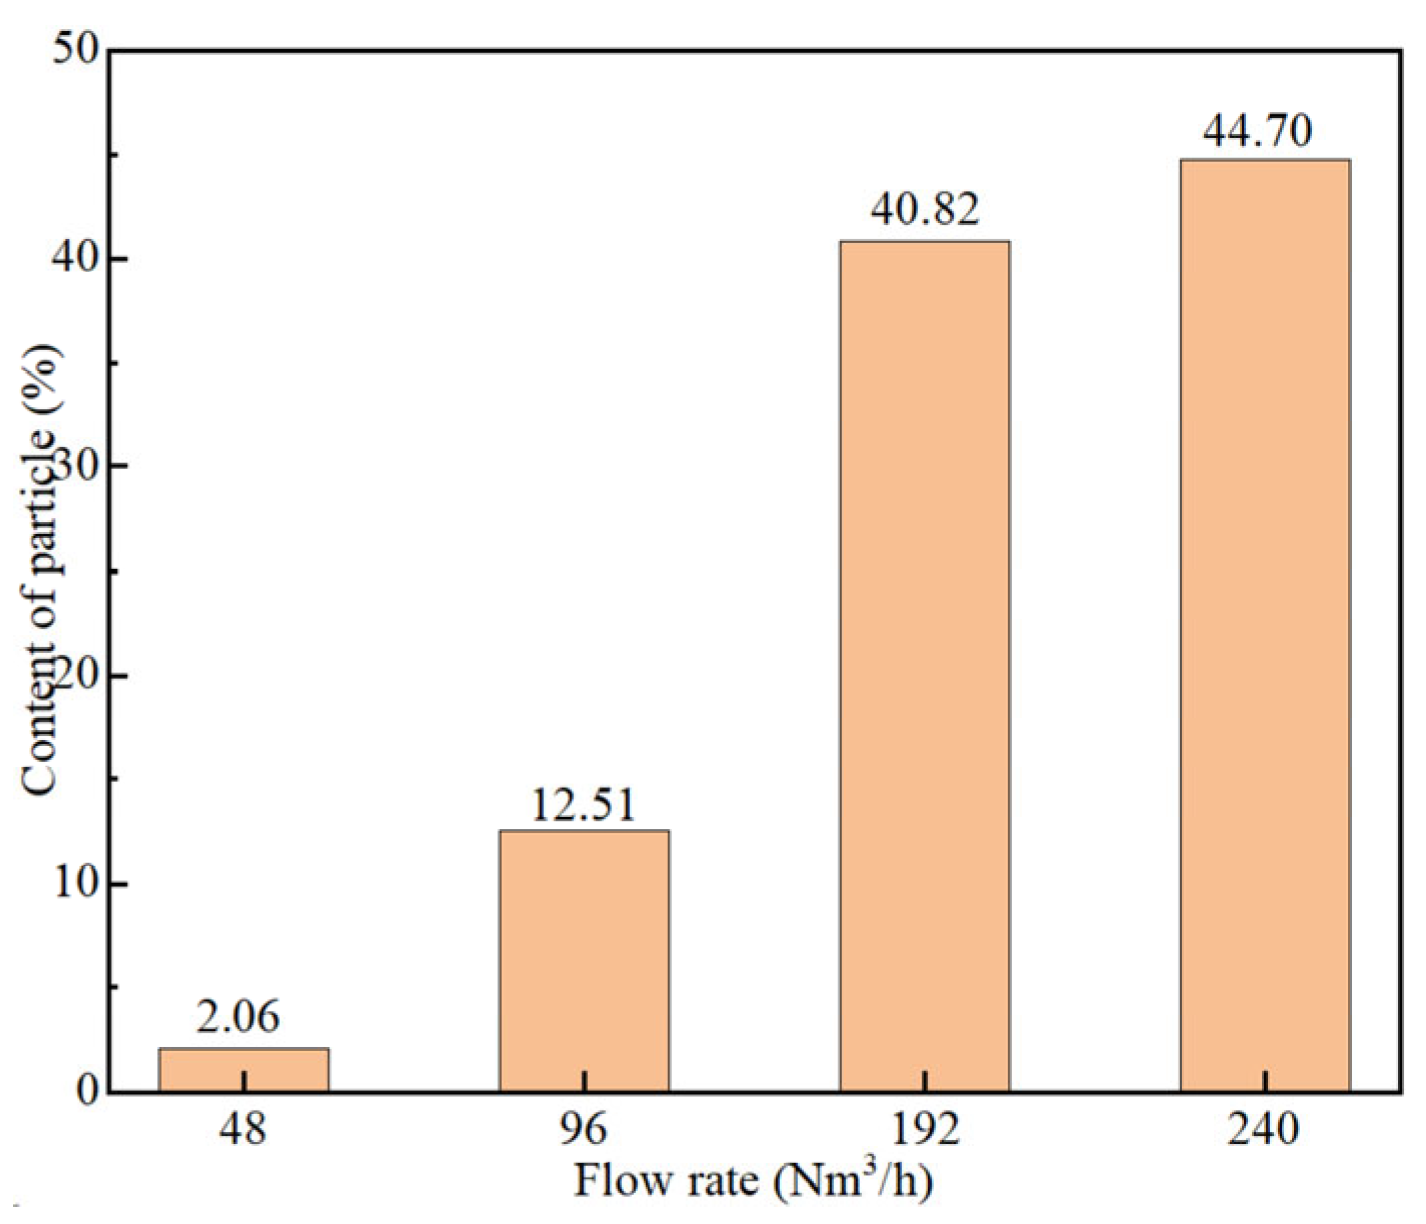
Figure 14 and Figure 15 quantitatively show the influence of gas flow rate on the total particle entrainment and the size of the “open eyes”, respectively. The results indicate that at lower gas flow rates, the total particle entrainment increases significantly with rising flow rate. However, once the flow rate reaches 192 Nm3/h, the growth in entrainment begins to plateau. Meanwhile, the size of the “open eyes” continues to expand with increasing gas flow rate. It is worth noting that an excessively large “open eyes” may intensify temperature loss and increase the risk of secondary oxidation, thereby negatively affecting the cleanliness of the molten steel. Considering both particle entrainment and “open eyes” control, a bottom-blowing gas flow rate of 192 Nm3/h is identified as the optimal operating parameter.

3.3. Effect of Bottom-Blowing Arrangement

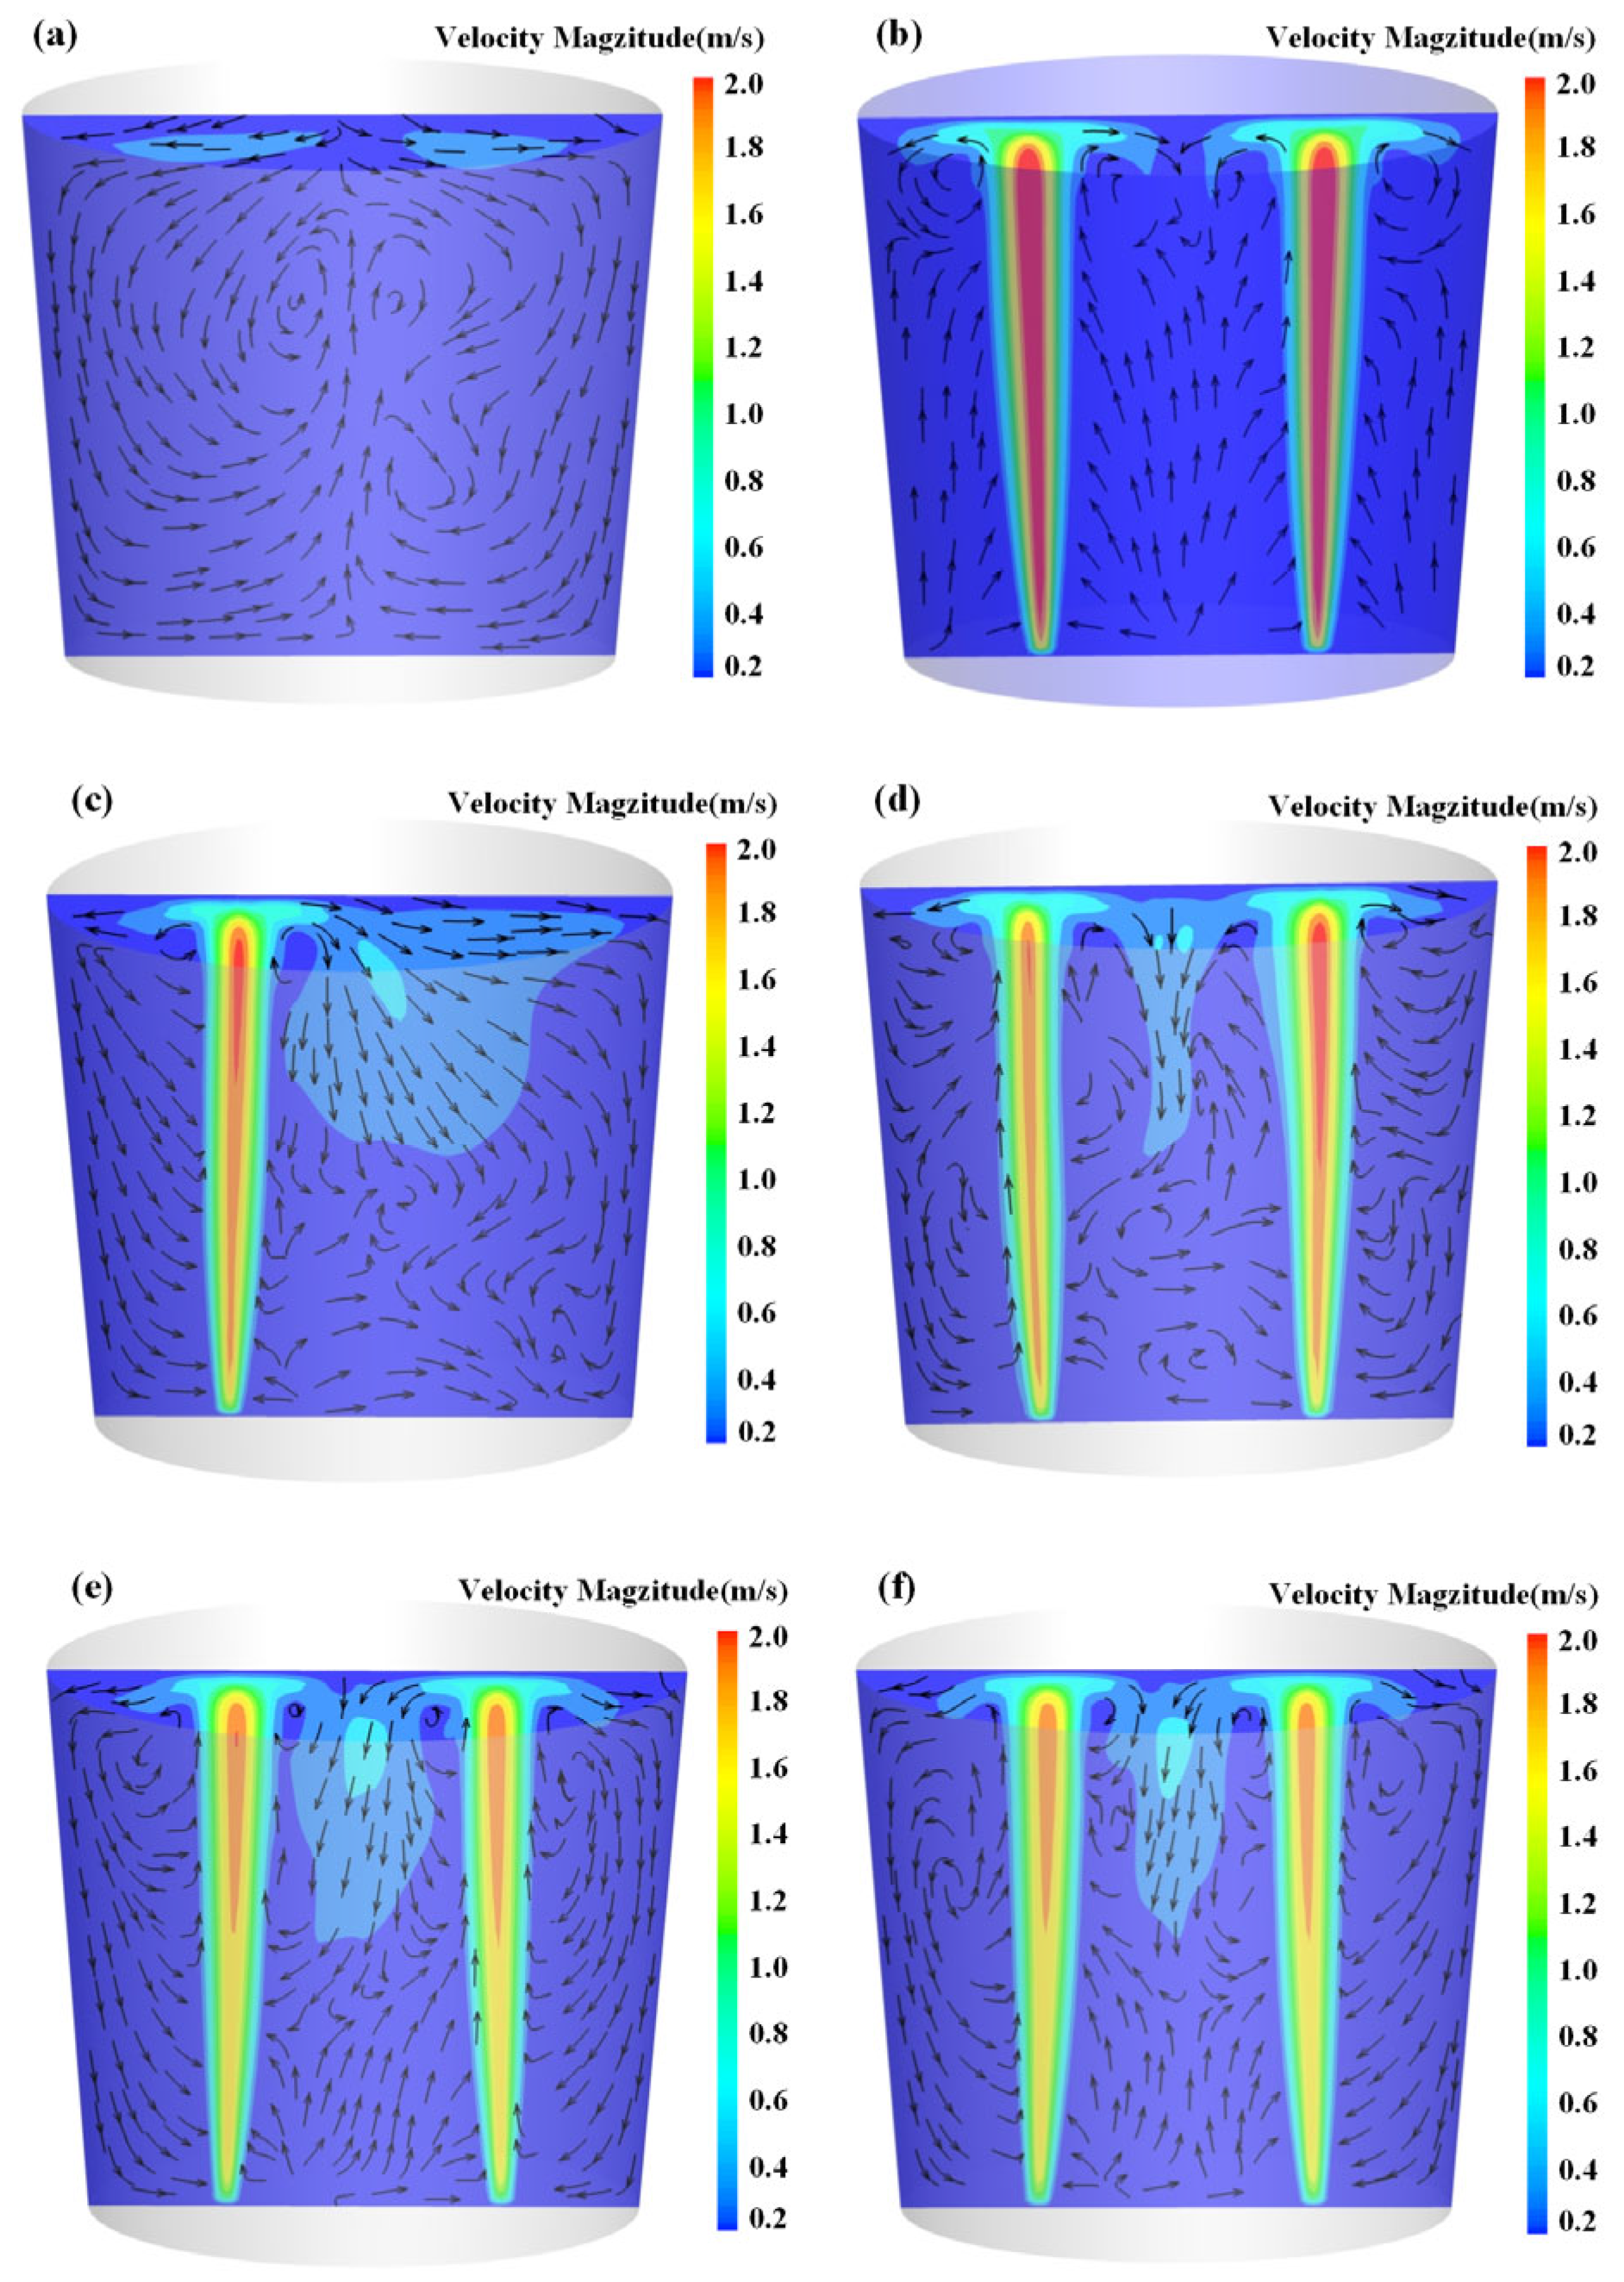
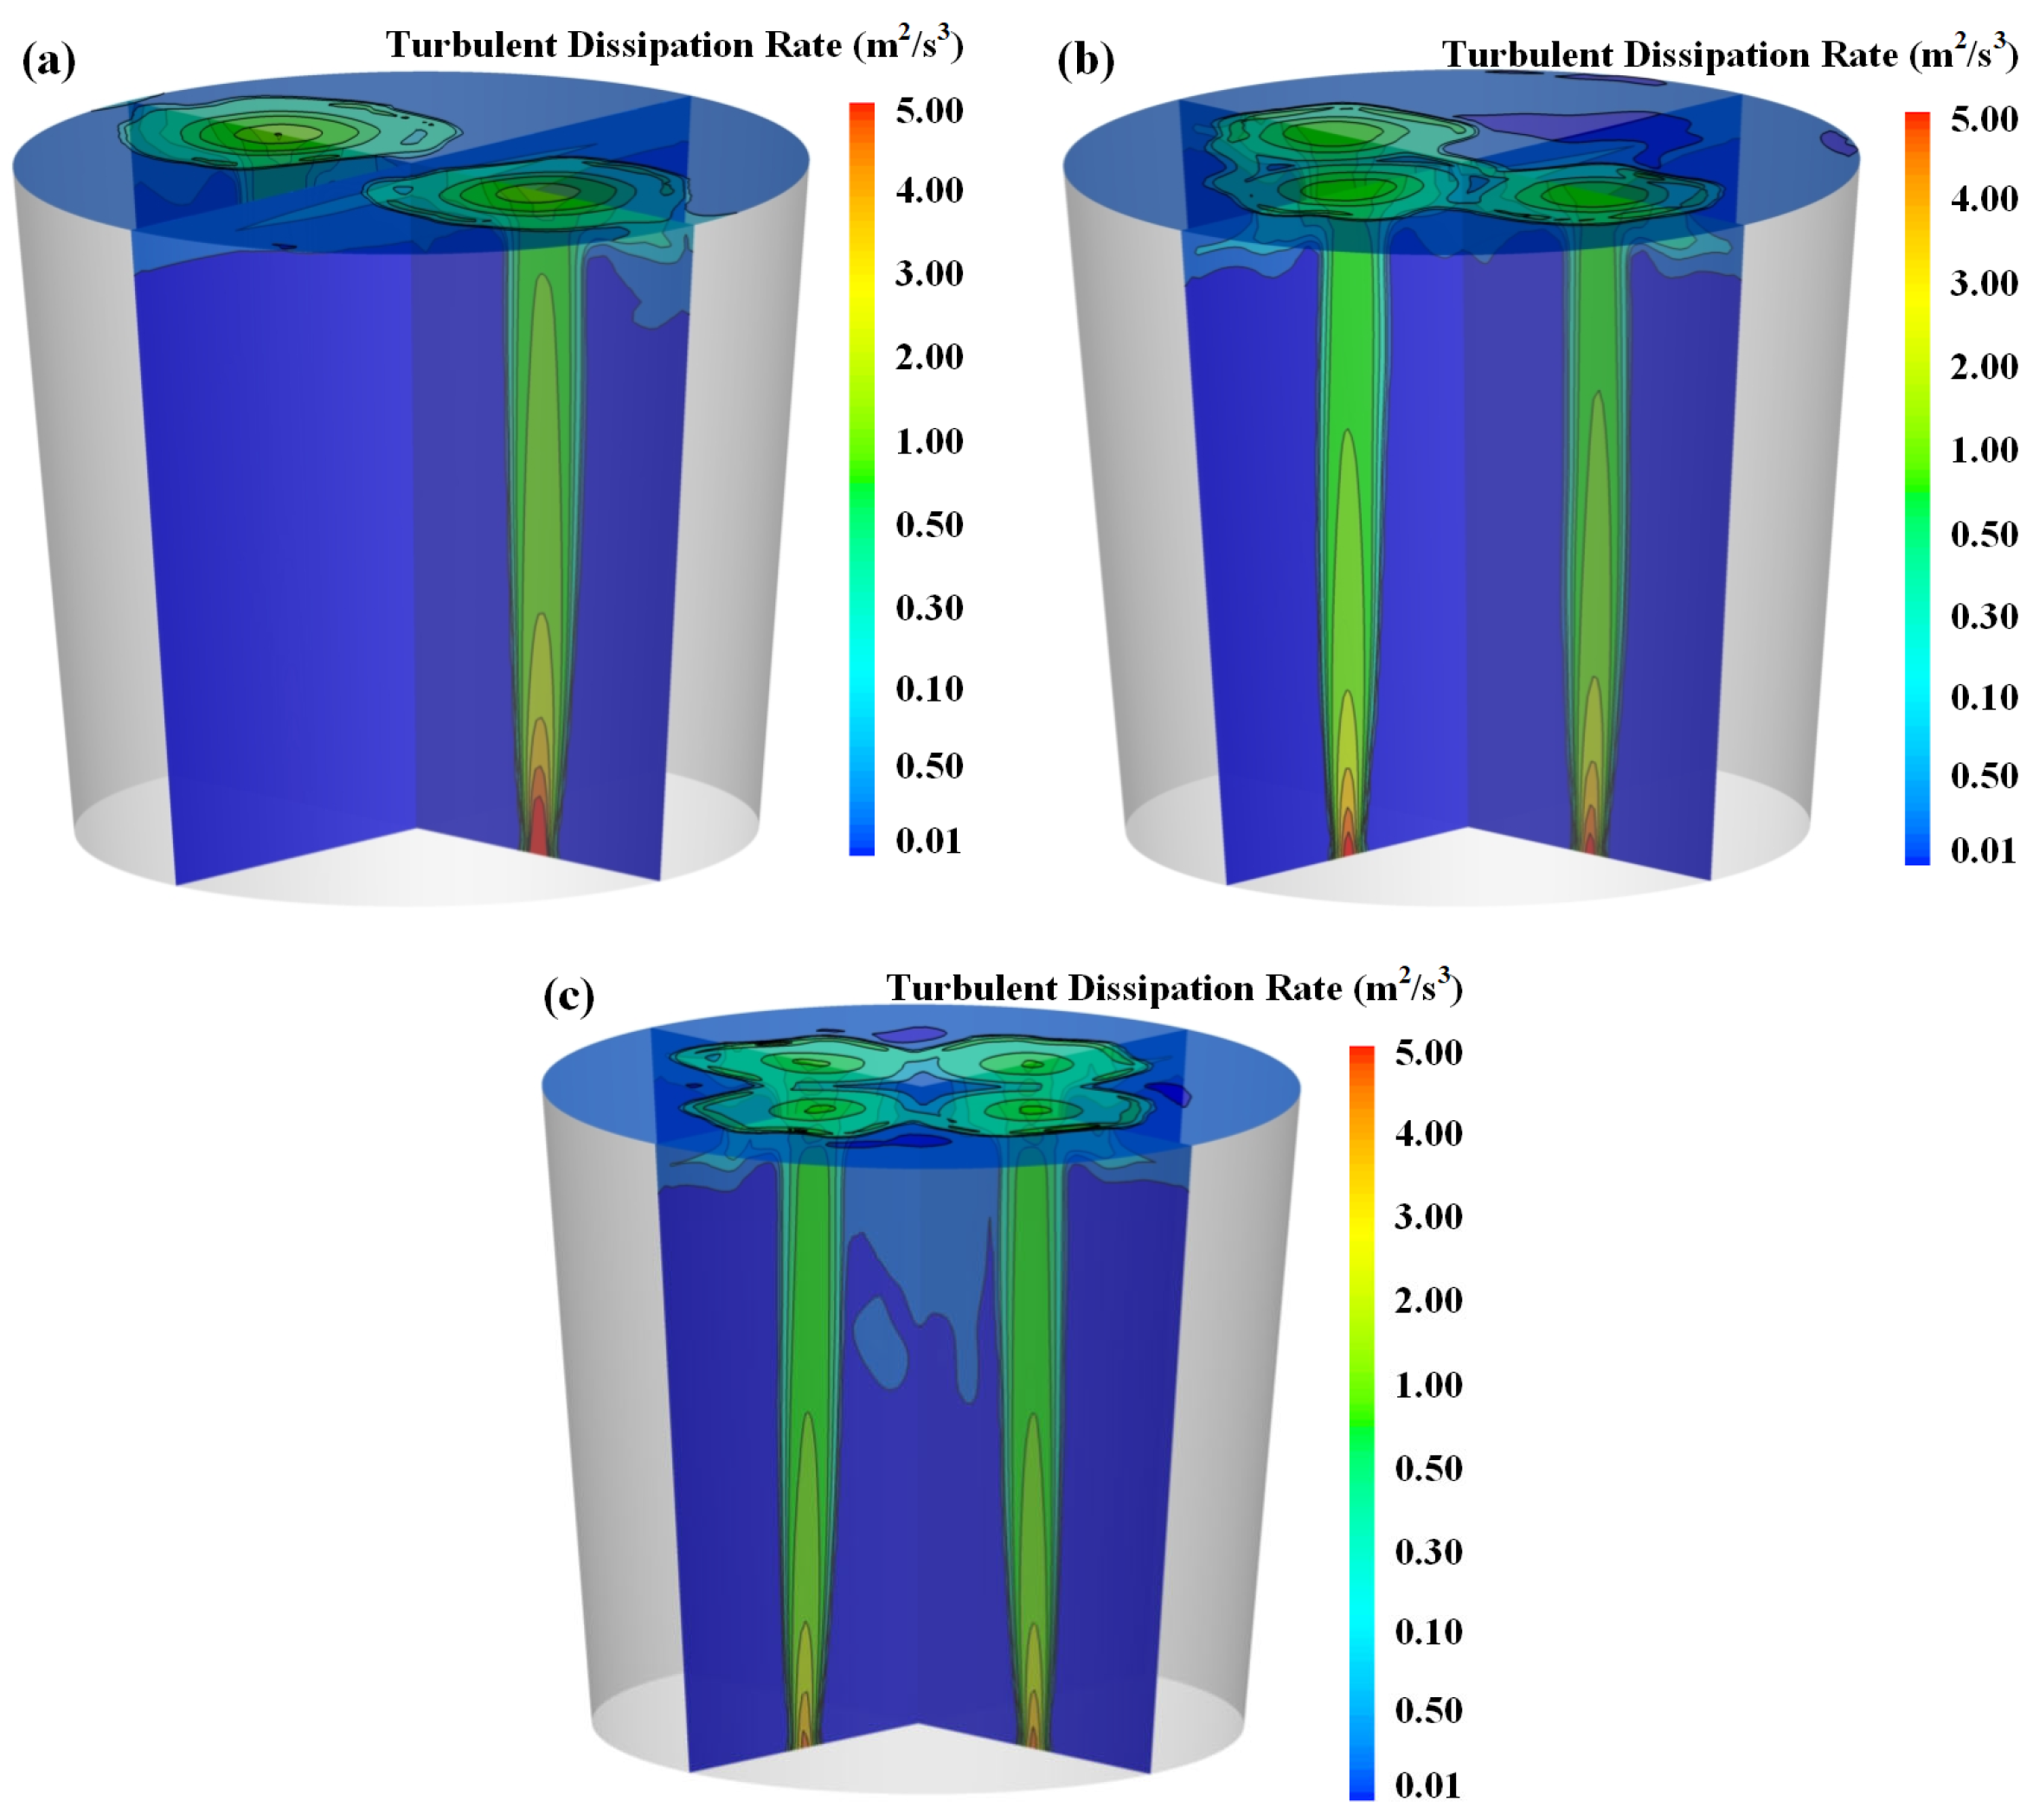
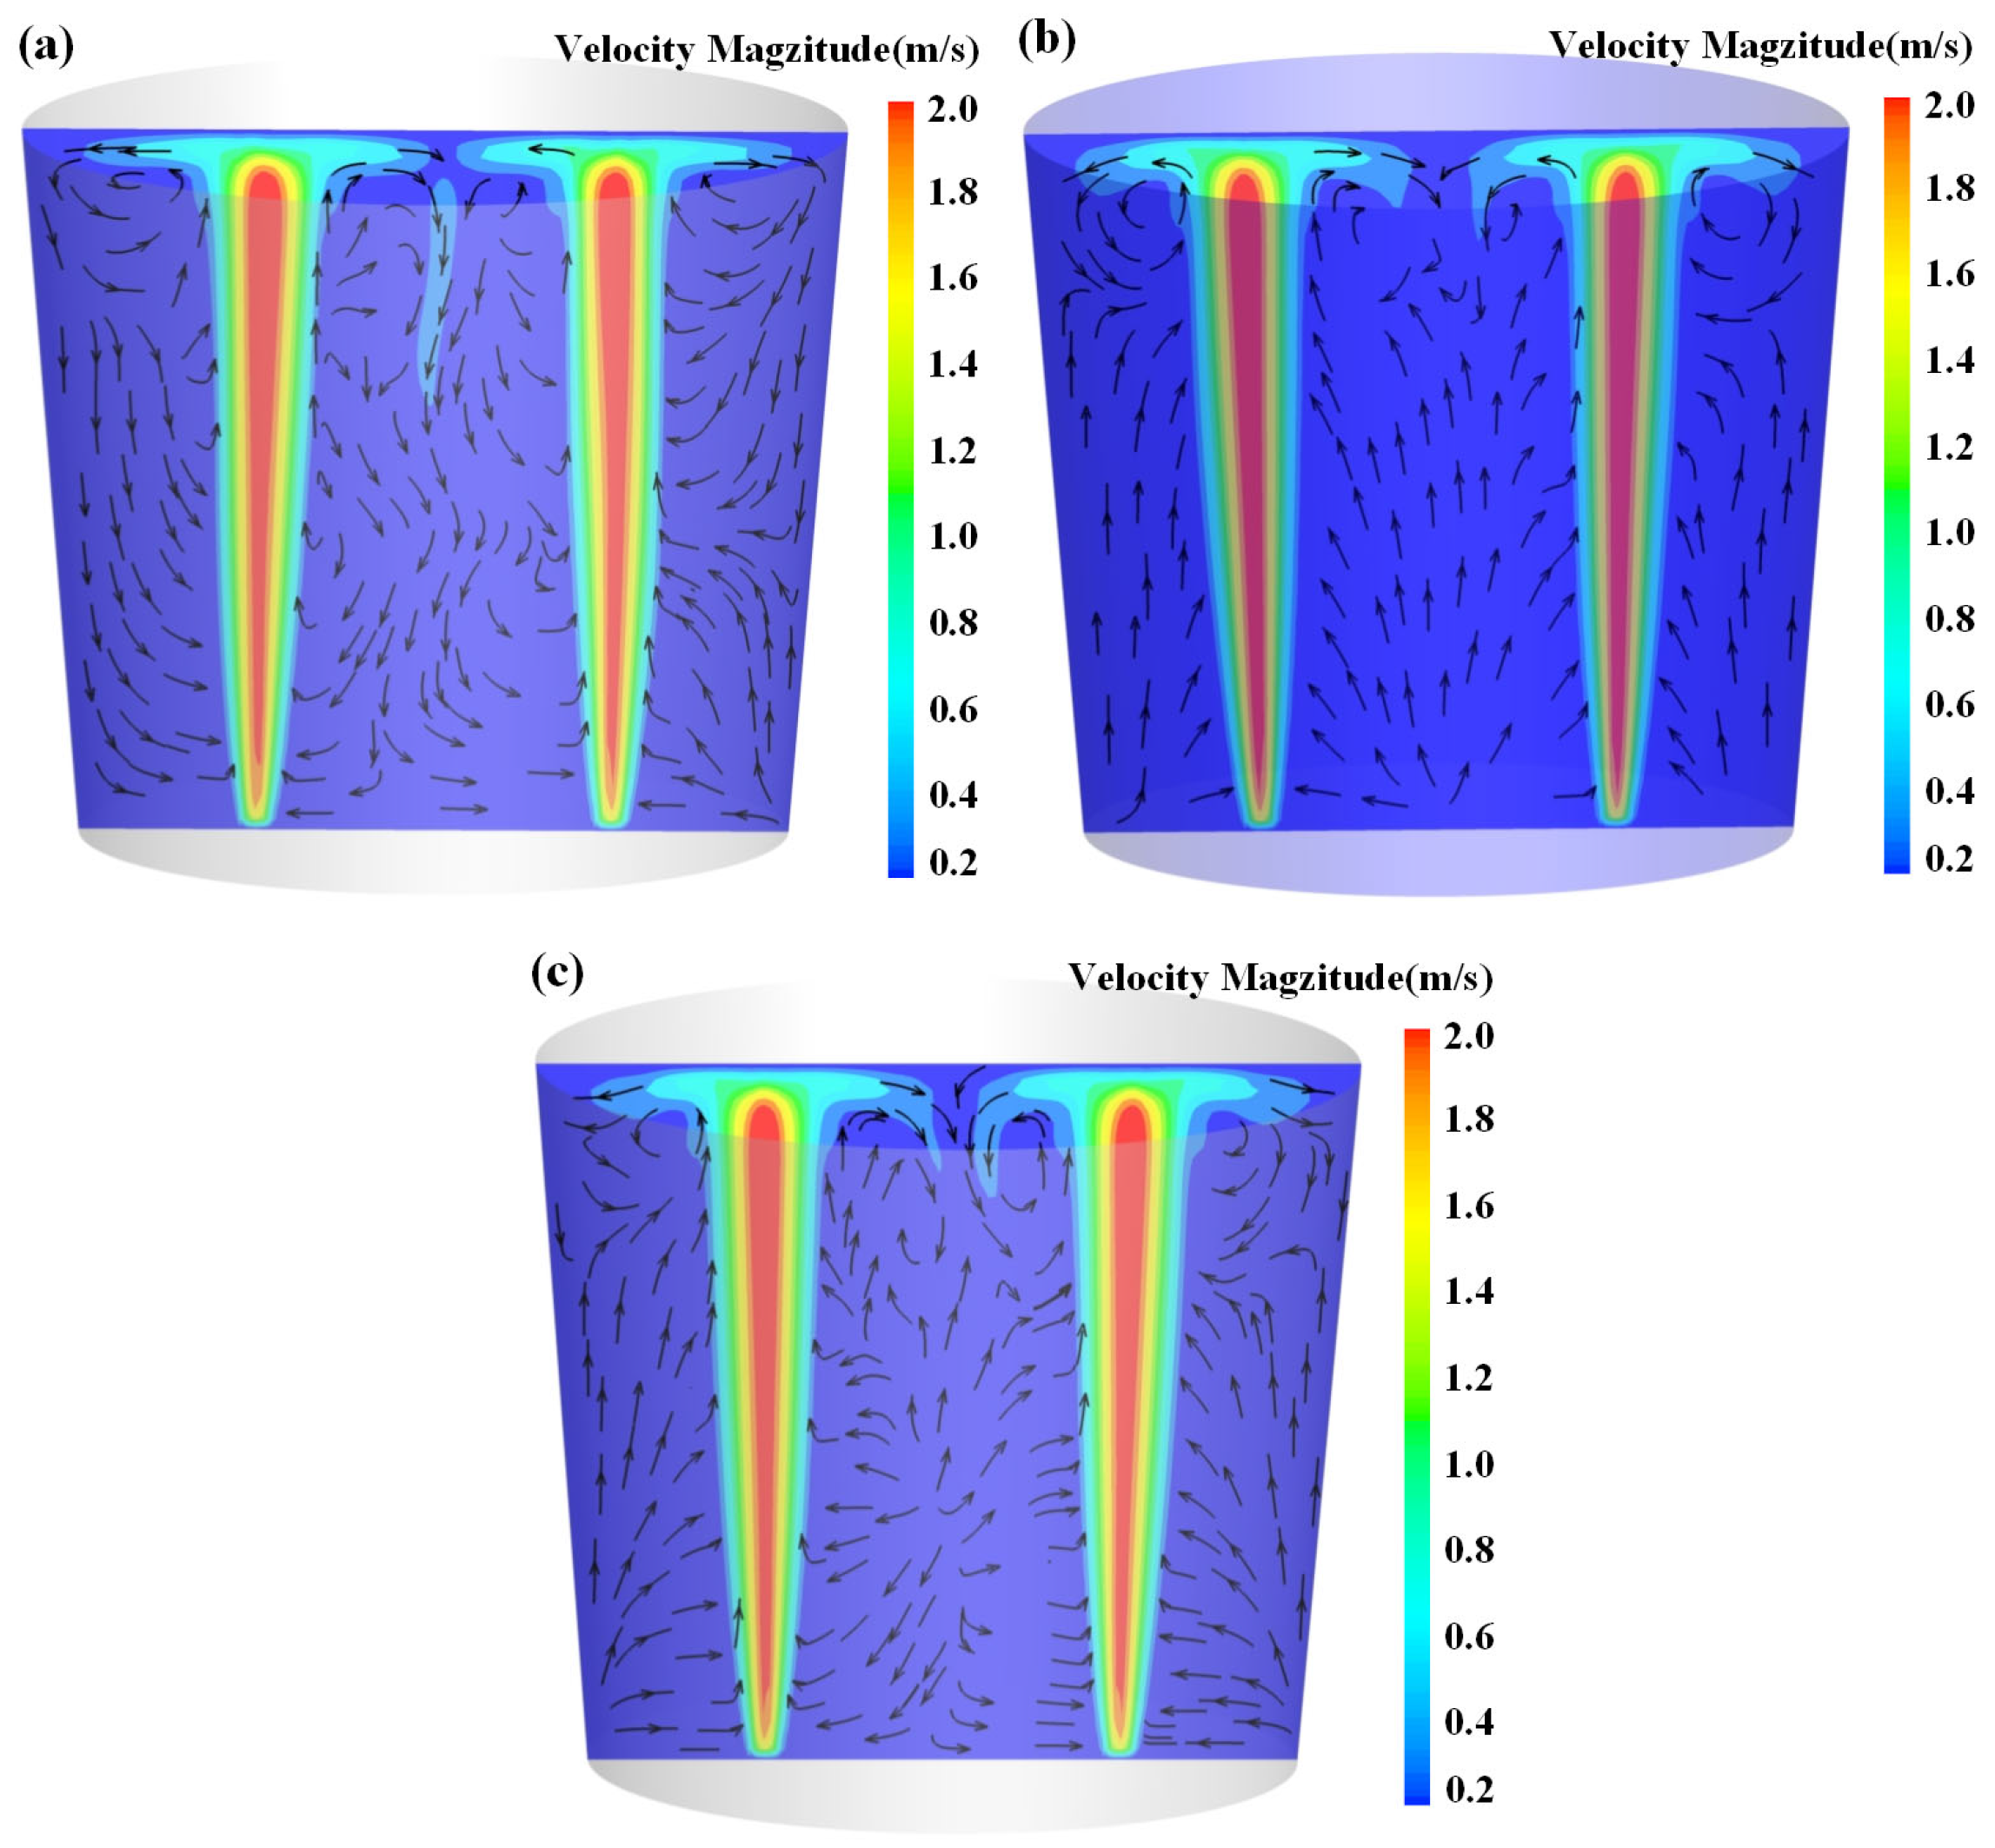
To further investigate the factors influencing particle entrainment behavior, the effects of different bottom-blowing arrangements are considered. Figure 16 and Figure 17 present the predicted results of molten steel flow characteristics and turbulence behavior under various bottom-blowing arrangements. As the number of tuyeres increases from 2 to 4, the overall flow field transitions from two high-velocity zones to multiple medium-velocity regions. Despite a reduction in maximum velocity within the plume zone, the velocity distribution becomes significantly more extensive. Meanwhile, the flow activity in the regions between gas plumes is significantly enhanced. The interaction among multiple gas jets notably intensifies turbulence in the central region, thereby promoting more pronounced particle entrainment behavior in this area.
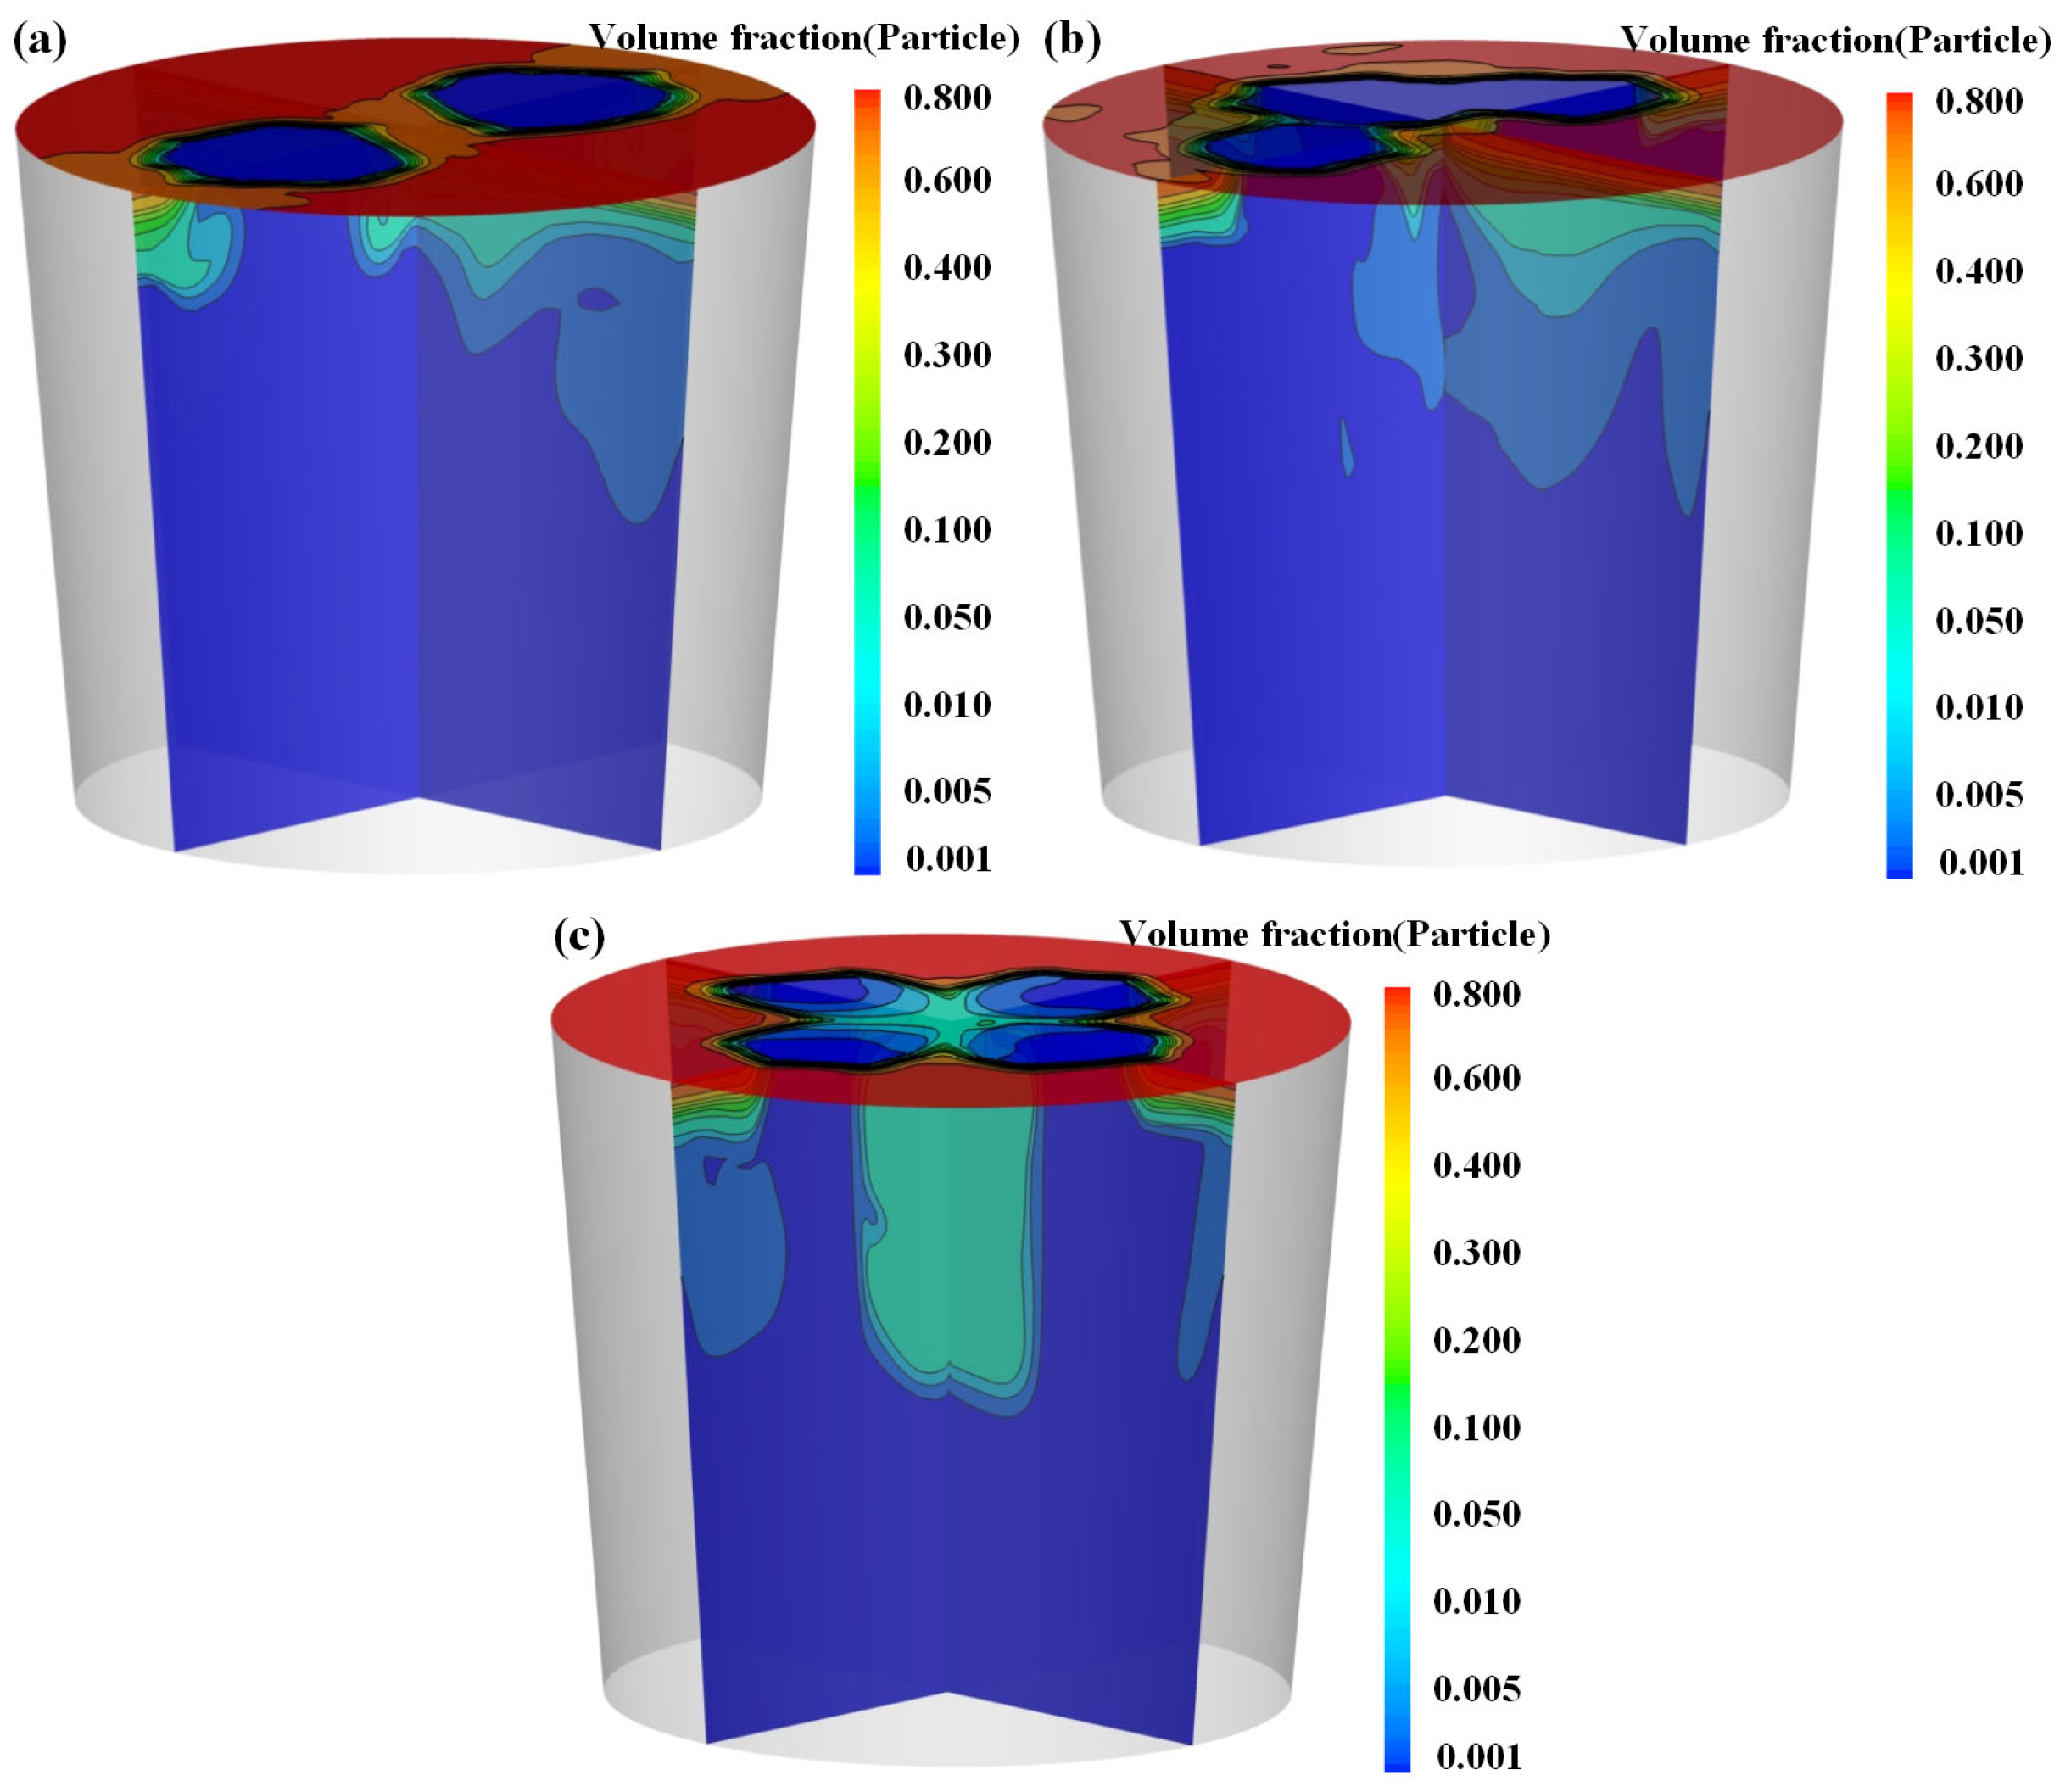
Figure 18 illustrates the distribution characteristics of the particle phase solid volume fraction under varying numbers of tuyeres. It is evident from the figure that as the number of tuyeres increases, the morphology of the “open eyes” undergoes significant changes: evolving from an initial dual circular pattern to a trefoil shape with three tuyeres and a quatrefoil shape with four tuyeres. Moreover, multiple “open eye” regions become interconnected, forming a continuous overall area. Concurrently, the primary particle entrainment locations shift from near-wall regions toward the central areas between the gas plumes.
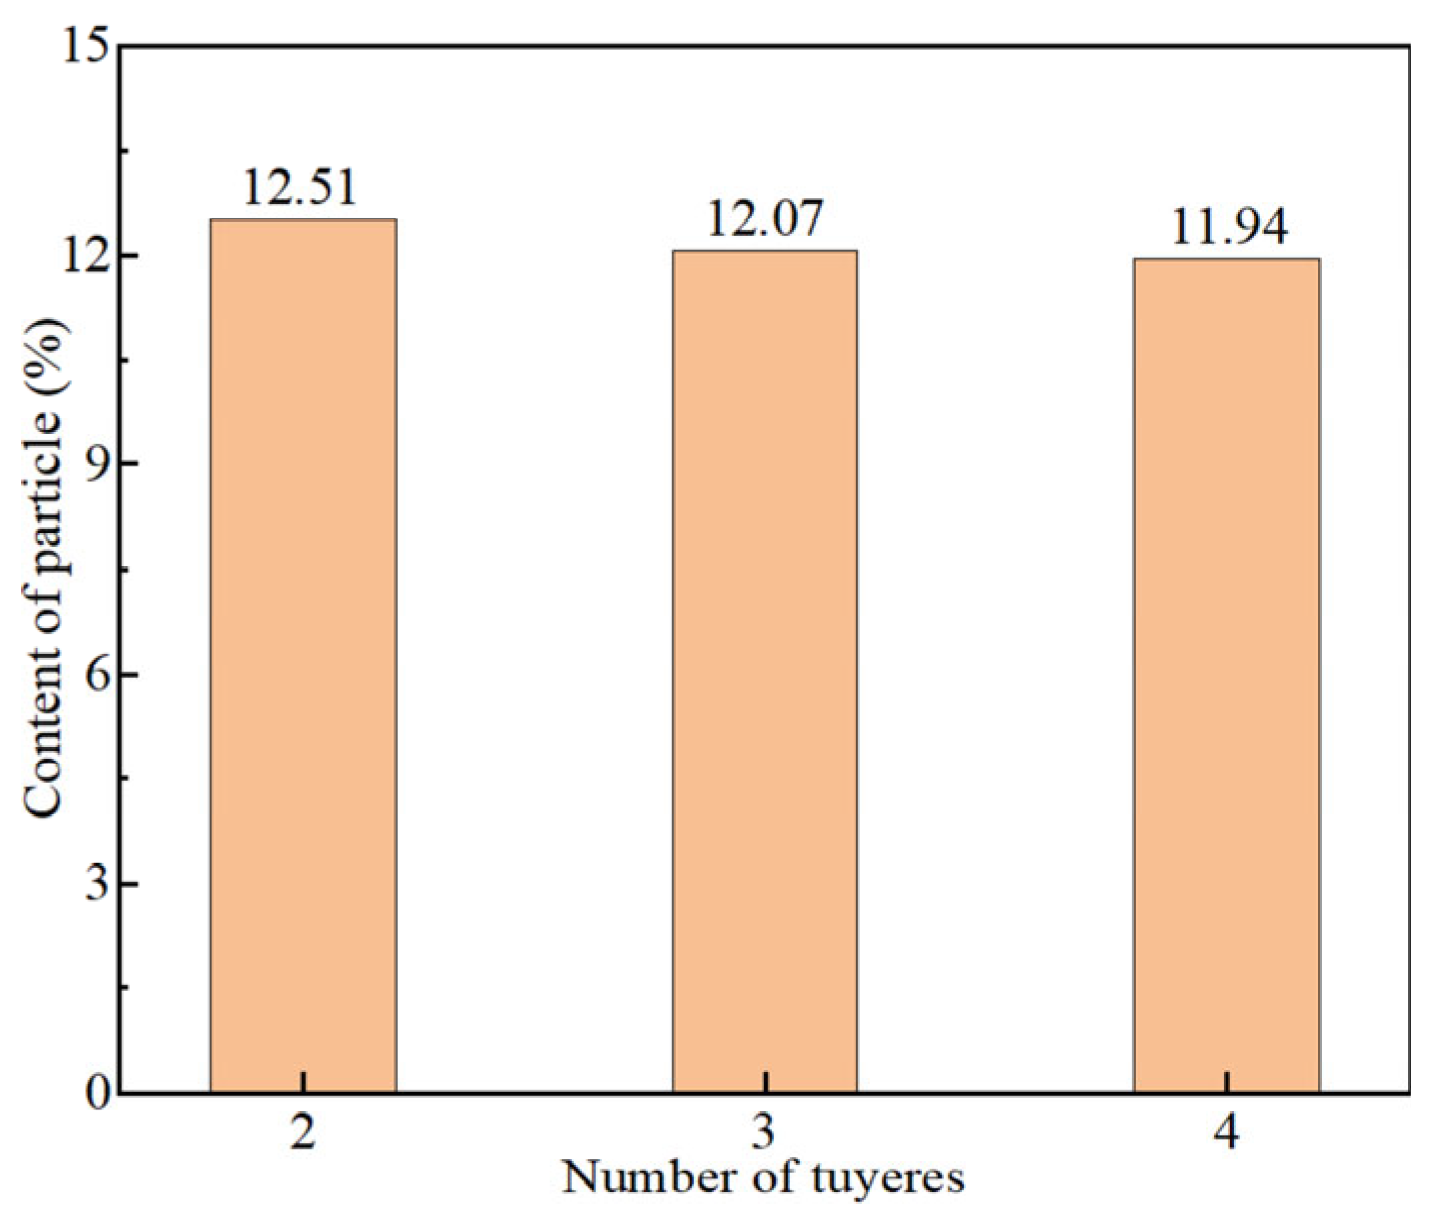
Based on the quantitative analyses presented in Figure 19 and Figure 20, increasing the number of tuyeres from two to four results in the following changes: the total mass of entrained particles decreases by 4.77%, primarily due to the dispersion of gas kinetic energy, which reduces the entrainment capacity at individual injection points; the total area of the “open eyes” increases by 9%, a change directly associated with intensified surface disturbances caused by the interaction of multiple gas plumes. These findings indicate that although increasing the number of tuyeres can enhance the uniformity of particle distribution within the molten pool, it simultaneously leads to decreased entrainment efficiency and enlargement of the “open eyes”—an effect that may introduce quality issues such as secondary oxidation of the molten steel. Considering both particle entrainment behavior and “open eyes” control, the two-tuyere configuration exhibits the best overall performance and is thus identified as the optimal bottom-blowing arrangement.

3.4. Effect of Particle Diameter

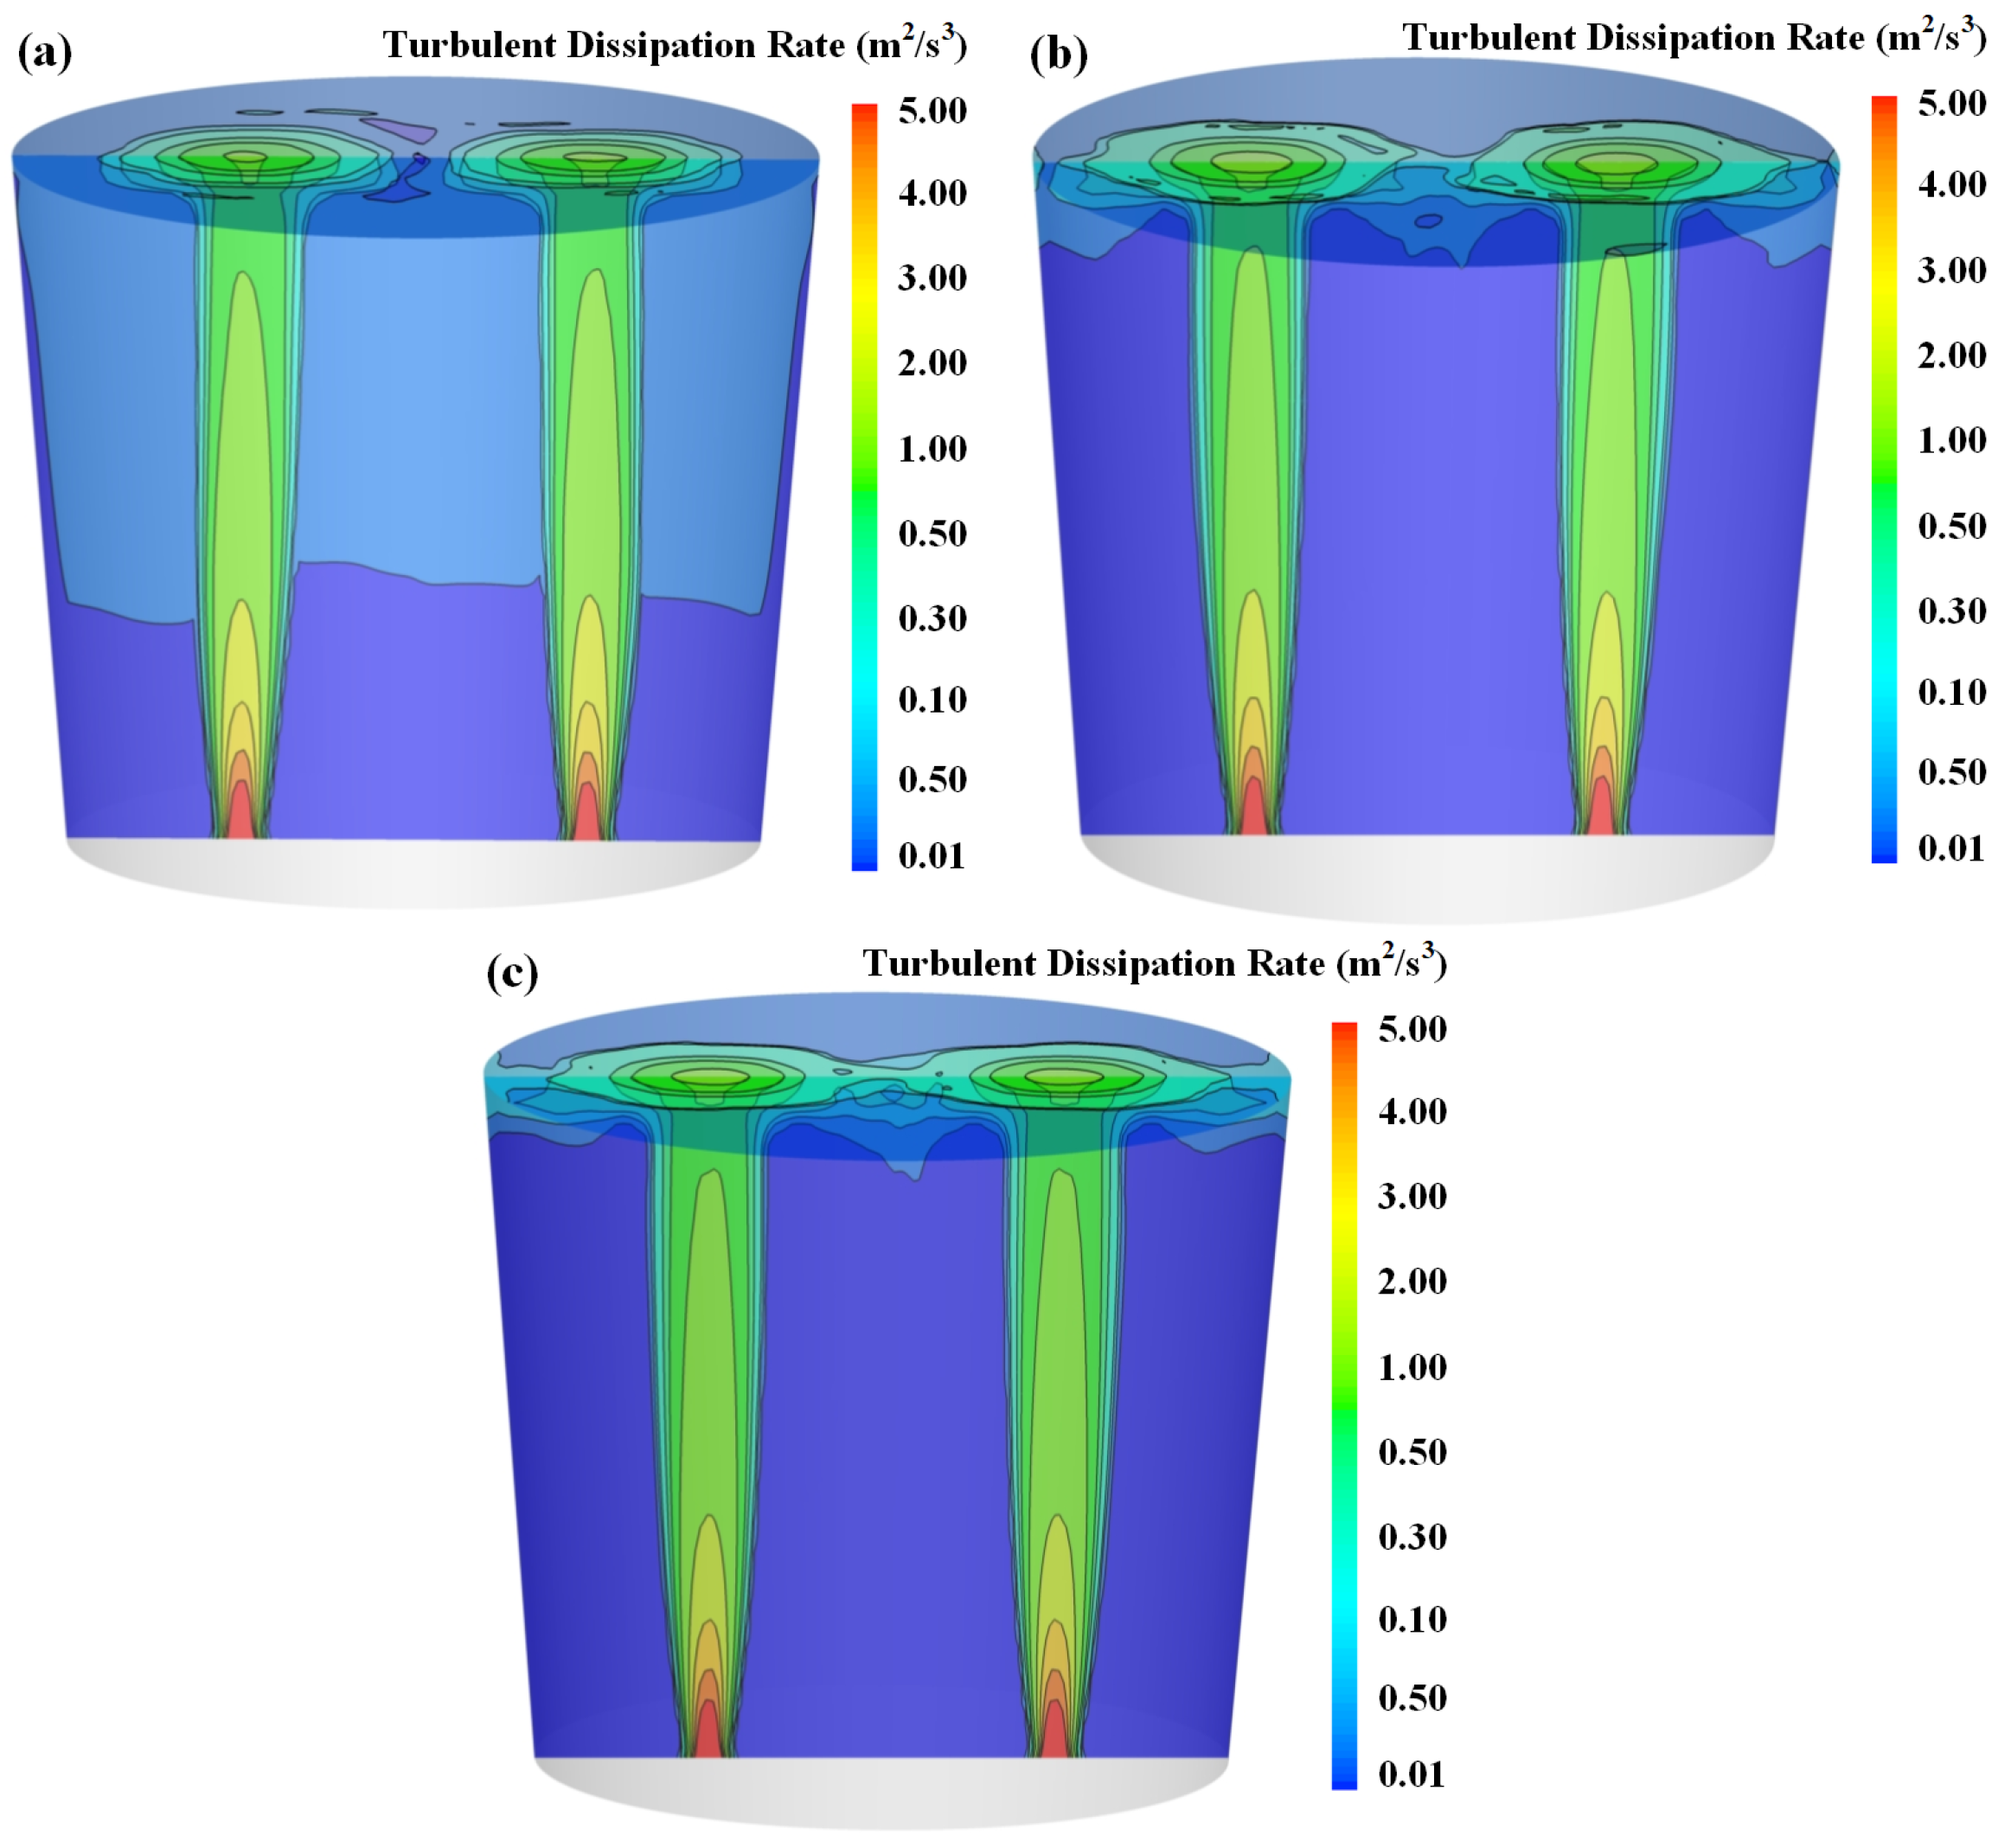
Figure 21 and Figure 22 compare the flow field structure and turbulent dissipation rate distributions for characteristic particle sizes of 1 mm, 5 mm, and 10 mm. The results indicate that the velocity distribution in the plume region remains relatively stable within the studied particle size range (1–10 mm), showing minimal sensitivity to particle size variation. However, as particle size increases, the vortex structures between gas plumes exhibit a distinct upward shift. In addition, larger particle sizes markedly suppress turbulence development, concentrating the turbulent energy dissipation zones closer to the steel–particle interface.
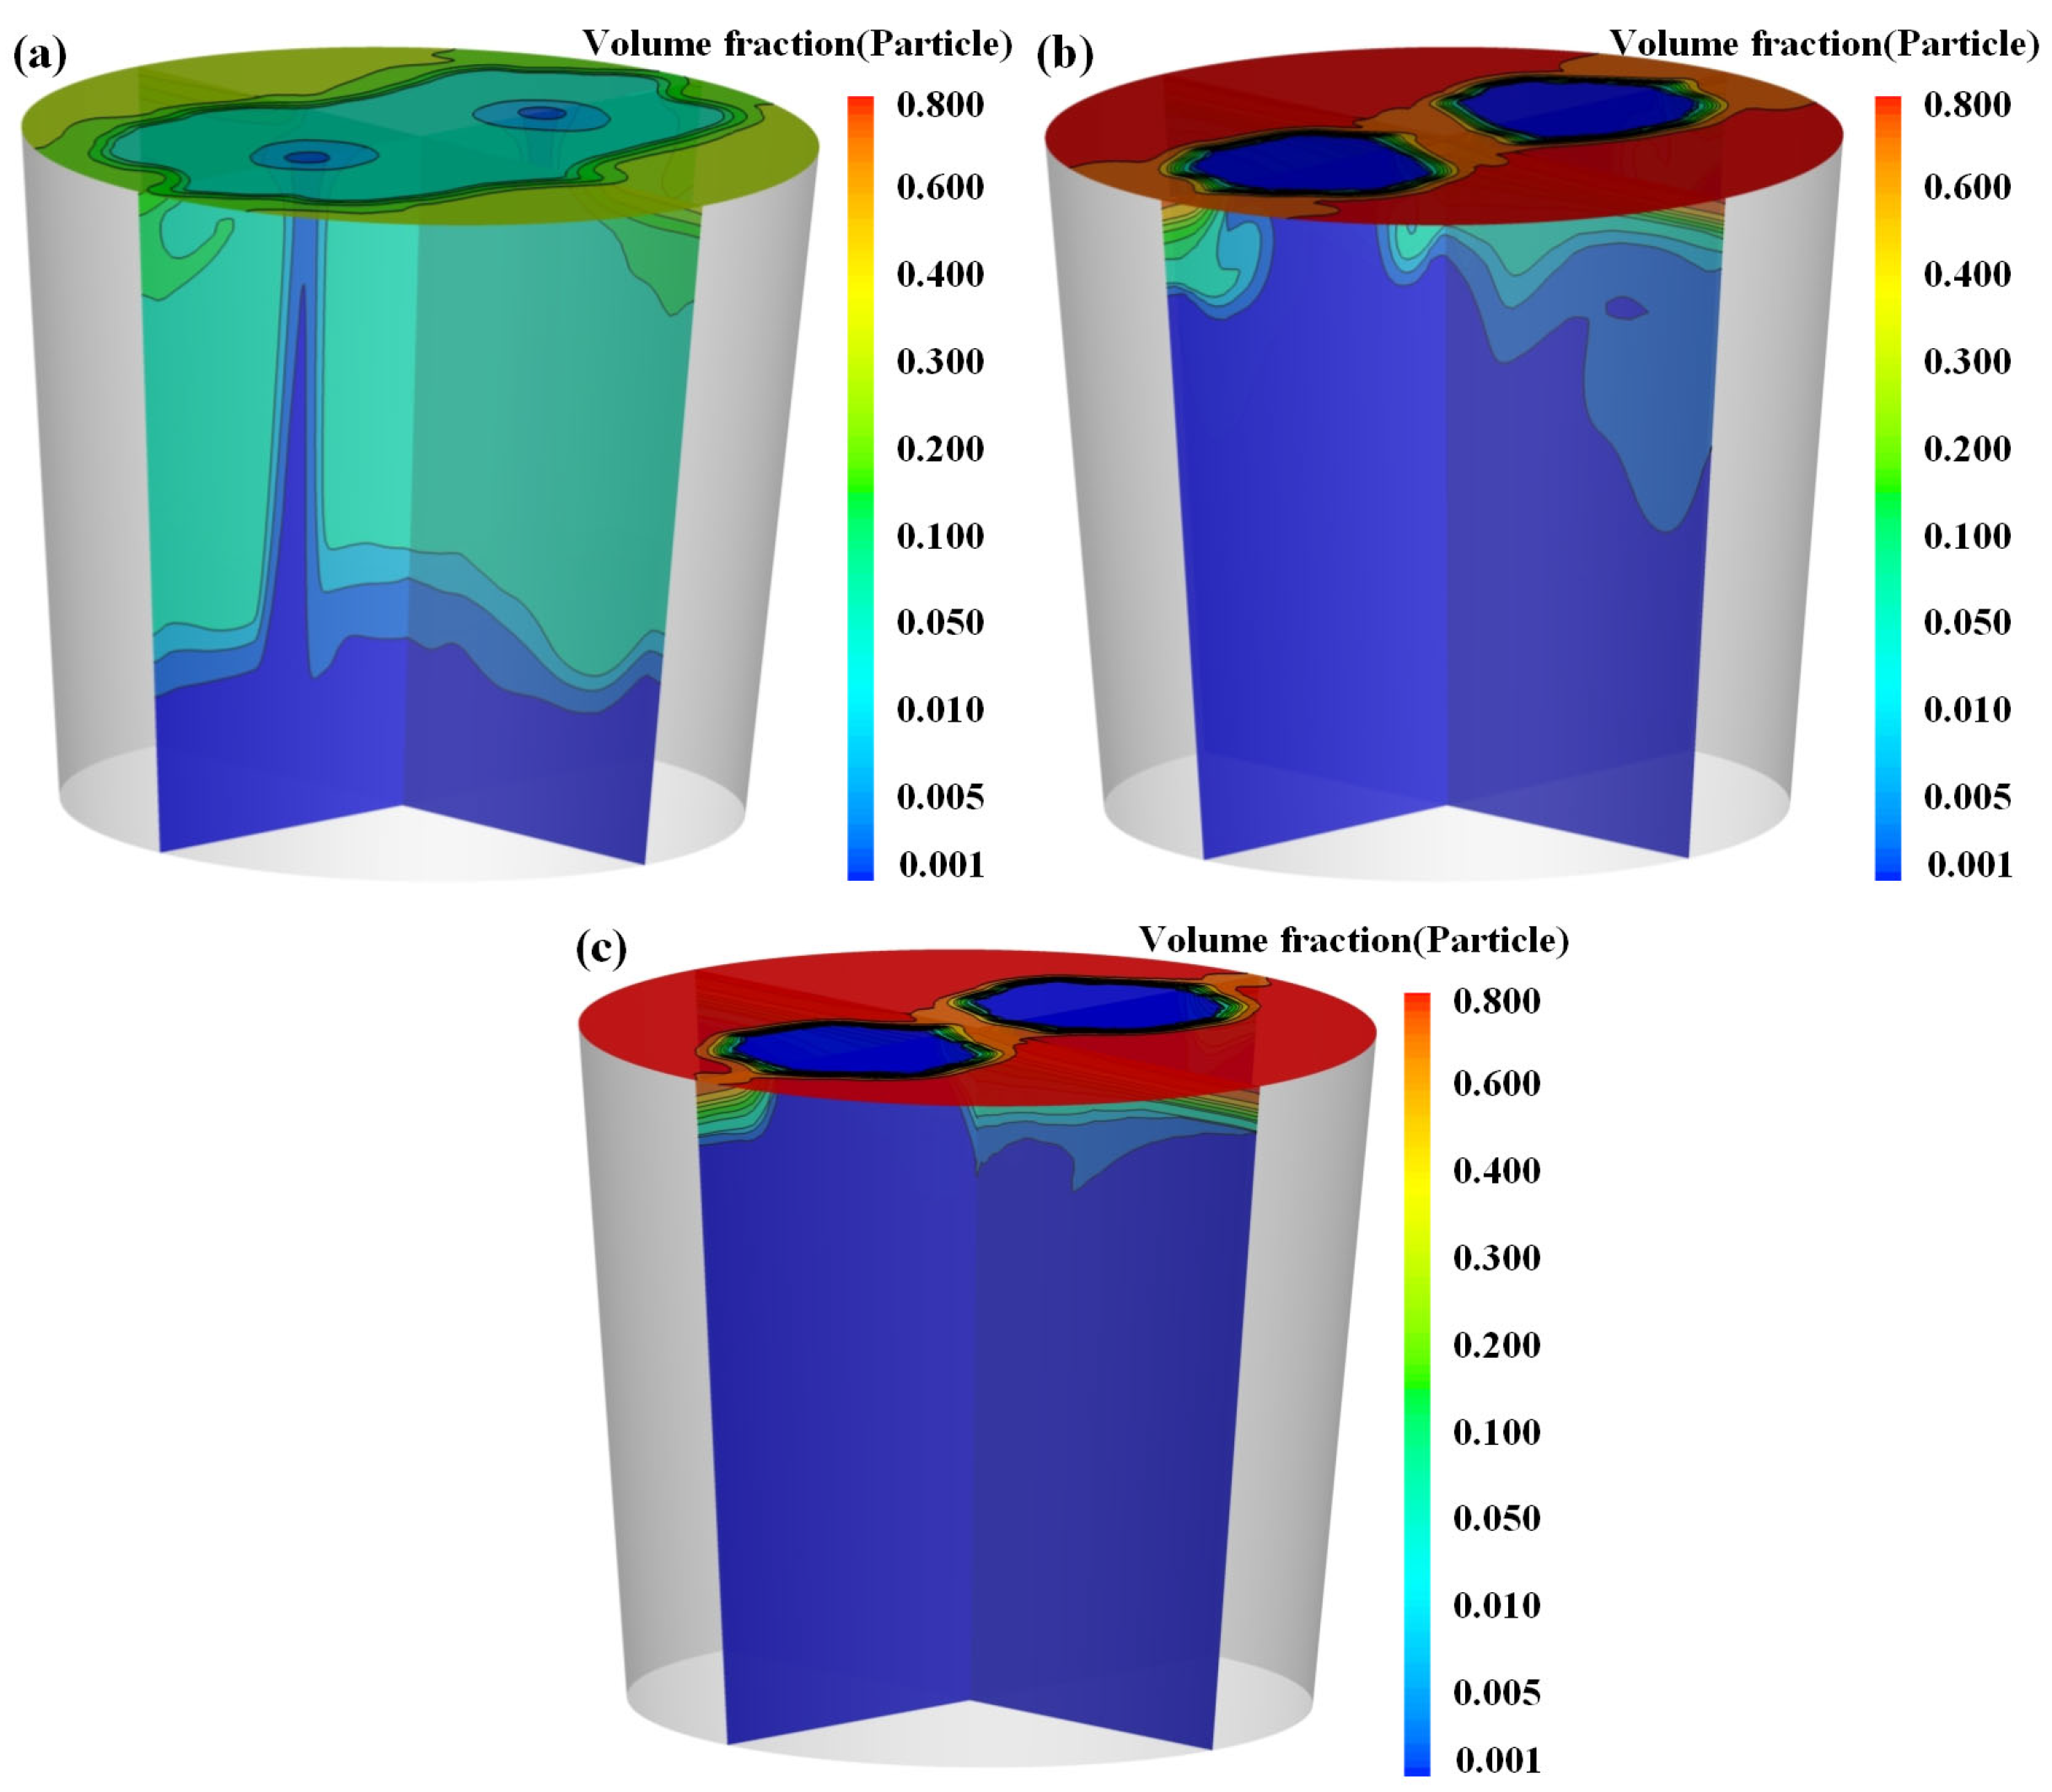
Figure 23 illustrates the solid volume fraction contours of particles with different sizes. It is evident that as the particle size increases, both the entrainment depth and the total quantity of entrained particles decrease significantly, while the size of the “open eyes” is also notably reduced. A comparative analysis further indicates that under bottom-blowing conditions, smaller particles tend to be more uniformly distributed upon entrainment, whereas larger particles are more likely to accumulate near the steel–particle interface.
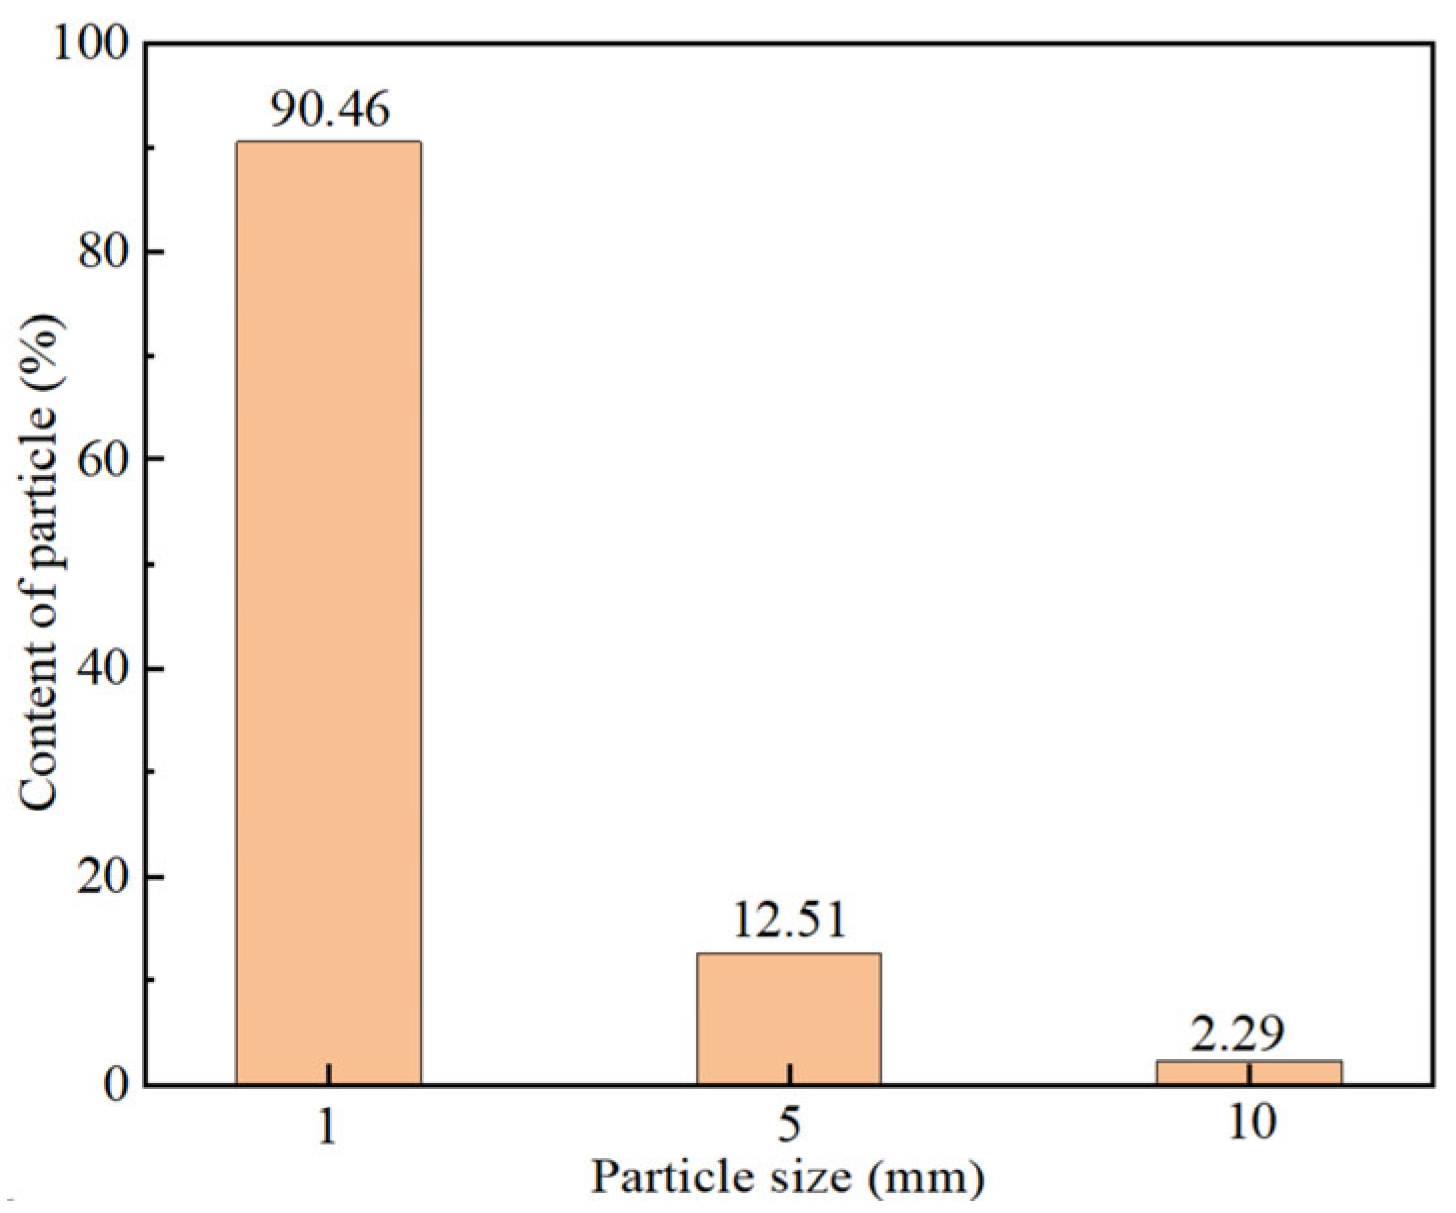
The statistical results shown in Figure 24 and Figure 25 indicate that particle size has a significant impact on both the total entrained mass and the size of the “open eyes,” with particularly pronounced effects observed at smaller particle sizes. Specifically, when the particle size is 1 mm, the entrained particle mass reaches 90.46%, which is 7.23 times and 39.5 times greater than that for 5 mm and 10 mm particles, respectively. Meanwhile, the “open eyes” area fraction corresponding to the 1 mm particles accounts for 81.70%, which is 2.86 times that of the 5 mm particles. Notably, when the particle size exceeds 5 mm, further increases in size result in only marginal changes in the “open eyes” dimensions. These results unequivocally demonstrate that particle size critically governs particle entrainment behavior.

4. Conclusions

  • As the gas flow rate increases, the work imparted by the gas on the molten steel correspondingly rises, resulting in intensified agitation of the liquid phase. This enhanced flow promotes particle entrainment, with the proportion of entrained particles increasing markedly from 2.06% at 48 Nm3/h to 44.7% at 240 Nm3/h, thereby significantly improving the overall mixing efficiency. However, when the gas flow rate exceeds 192 Nm3/h, the incremental enhancement in particle entrainment becomes marginal, suggesting a saturation effect in the entrainment behavior at high flow rates.
  • With an increasing number of tuyeres, the kinetic energy of bottom-blown gas is distributed among multiple gas plumes, thereby weakening the entrainment capacity of each individual plume. Meanwhile, interactions between multiple plumes enhance the turbulence intensity in the free surface region. Quantitative analysis shows that when the number of tuyeres increases from two to four, the total mass of entrained particles decreases by 4.77%, while the area of the “open eyes” expands by 9%.
  • The particle size exerts a significant influence on the mixing behavior: as the particle size increases, greater momentum is required to achieve effective entrainment and mixing. Consequently, smaller particles result in higher average particle concentrations under bottom-blowing conditions. However, excessively fine particles can enlarge the “open eyes” area, potentially causing adverse effects such as increased nitrogen absorption and accelerated temperature loss.

Author Contributions

Conceptualization, C.W. and W.L.; methodology, J.Z., Z.W. and J.X.; software, W.L.; vali-dation, C.W., W.L., Z.W. and J.Z.; formal analysis, W.L.; investigation, J.X.; resources, W.L.; data curation, J.Z.; writing—original draft preparation, Z.W.; writing—review and editing, W.L. and Z.W.; visualization, C.W.; supervision, W.L.; project administration, C.W.; funding acquisition, W.L. All authors have read and agreed to the published version of the manuscript.

Funding

This work was supported by a development project from the National Engineering Research Center for Advanced Manufacturing Technology and Equipment of Heavy Castings and Forgings (Erzhong (Deyang) Heavy Equipment Co., Ltd.) as well as the National Natural Science Foundation of China (Grant No. 52474354).

Data Availability Statement

The original contributions presented in the study are included in the article, further inquiries can be directed to the corresponding author.

Conflicts of Interest

Authors Cheng Wang, Jie Zeng and Jianfeng Xie were employed by the National Engineering Research Center for Advanced Manufacturing Technology and Equipment of Heavy Castings and Forgings (Erzhong (Deyang) Heavy Equipment Co., Ltd.). The remaining authors declare that the research was conducted in the absence of any commercial or financial relationships that could be construed as a potential conflict of interest.

Nomenclature

ρ k density α k volume fraction
u k velocity vectork = lliquid phase
k = ggas phasek = pparticle phase
μ m molecular viscosity μ t , m turbulent viscosity
μ e f f effective viscosity F D drag force
M k interaction force F T D turbulent dispersion force
K g l , K p l Interphase momentum exchange coefficients d g diameters of the bubbles
d p diameters of the particles
σ l gas-liquid surface tension coefficient C D g l , C D p l drag force coefficients
σ dispersion Prandtl number C T D turbulent dispersion coefficient
k turbulence kinetic energy ε turbulence dissipation rate

References

  1. Li, X.; Wang, H.; Tian, J.; Wang, D.; Qu, T.; Hou, D.; Hu, S.; Wu, G. Investigation on the Alloy Mixing and Inclusion Removement through Using a New Slot-Porous Matched Tuyeres. Metals 2023, 13, 667. [Google Scholar] [CrossRef]
  2. Li, X.; Wang, D.; Tian, J.; Wang, H.; Qu, T.; Hou, D.; Hu, S.; Zhang, Z.; Zhou, X.; Wu, G. Modeling of Bubble Transportation, Expansion, as Well as Adhesion of Inclusions in a Ladle With Different Tuyeres. Met. Mater. Trans. B 2024, 55, 14–31. [Google Scholar] [CrossRef]
  3. Ji, S.; Niu, K.J.; Conejo, A.N. Multiphase Modeling of Steel-slag Mass Transfer through Distorted Interface in Bottom-stirred Ladle. ISIJ Int. 2024, 64, 52–58. [Google Scholar] [CrossRef]
  4. Xing, L.; Xiao, W.; Bao, Y.; Wang, M.; Ai, X. Process optimization of bottom-blown argon for 130t ladle furnace. Ironmak. Steelmak. 2023, 50, 894–899. [Google Scholar] [CrossRef]
  5. Lou, W.T.; Zhu, M.Y. A Mathematical Model for the Multiphase Transport and Reaction Kinetics in a Ladle with Bottom Powder Injection. Met. Mater. Trans. B 2017, 48, 3196–3212. [Google Scholar] [CrossRef]
  6. Guo, X.; Liu, Y.; Jojo-Cunningham, Y.; Silaen, A.; Walla, N.; Zhou, C. Mixing Time Prediction in a Ladle Furnace. Metals 2024, 14, 518. [Google Scholar] [CrossRef]
  7. Tao, X.; Qi, H.; Guo, Z.; Wang, J.; Wang, X.; Yang, J.; Zhao, Q.; Lin, W.; Yang, K.; Chen, C. Assessment of Measured Mixing Time in a Water Model of Eccentric Gas-Stirred Ladle with a Low Gas Flow Rate: Tendency of Salt Solution Tracer Dispersions. Symmetry 2024, 16, 1241. [Google Scholar] [CrossRef]
  8. Li, X.; Bao, Y.P.; Lin, L.; Yan, X.; Wang, L. 150 t ladle porous plug bottom argon blowing optimization and industrial tests. Steelmaking 2014, 30, 10–13+17. Available online: https://d.wanfangdata.com.cn/periodical/lg201406003 (accessed on 15 February 2023).
  9. Irons, G.; Senguttuvan, A.; Krishnapisharody, K. Recent Advances in the Fluid Dynamics of Ladle Metallurgy. Trans. Iron Steel Inst. Jpn. 2015, 55, 1–6. [Google Scholar] [CrossRef]
  10. Senguttuvan, A.; Irons, G.A. Modeling of Slag Entrainment and Interfacial Mass Transfer in Gas Stirred Ladles. ISIJ Int. 2017, 57, 1962–1970. [Google Scholar] [CrossRef]
  11. Llanos, C.A.; Garcia, S.; Ramos-Banderas, J.A.; Barreto, J.D.J.; Solorio, G. Multiphase Modeling of the Fluidynamics of Bottom Argon Bubbling during Ladle Operations. ISIJ Int. 2010, 50, 396–402. [Google Scholar] [CrossRef]
  12. Huang, A.; Harmuth, H.; Doletschek, M.; Vollmann, S.; Feng, X. Toward CFD Modeling of Slag Entrainment in Gas Stirred Ladles. Steel Res. Int. 2015, 86, 1447–1454. [Google Scholar] [CrossRef]
  13. Lou, W.T.; Zhu, M.Y. Numerical Simulations of Inclusion Behaviour and Mixing Phenomena in Gas-stirred Ladles with Different Arrangement of Tuyeres. ISIJ Int. 2014, 54, 9–18. [Google Scholar] [CrossRef]
  14. Dong, P.L. Physical modeling for optimization of bottom blowing argon process in a 210 t ladle. Iron Steel 2016, 51, 41–44. [Google Scholar] [CrossRef]
  15. Zhu, M.Y.; Xiao, Z.Q. Mathematical and Physical Simulation of Steel Refining Process; Metallurgical Industry Press: Beijing, China, 1998. [Google Scholar]
  16. Li, J.; Sun, Y.; Yang, S.; Liu, W. Research Status of Numerical Simulation of Nonmetallic Inclusions Interfacial Removal. Steel Res. Int. 2023, 94, 2200631. [Google Scholar] [CrossRef]
  17. Tao, X.; Cao, J.; Wang, J.; He, X.; Meng, L.; Guo, Y.; Wang, T.; Li, D.; Fan, J.; Chen, C. Physical Model of Inclusions Removal at Static Steel–Slag Interface. Meterials 2024, 17, 2244. [Google Scholar] [CrossRef]
  18. Zhang, L.; Taniguchi, S.; Cai, K. Fluid flow and inclusion removal in continuous casting tundish. Met. Mater. Trans. B 2000, 31, 253–266. [Google Scholar] [CrossRef]
  19. Lei, H.; Nakajima, K.; He, J.C. Mathematical model for nucleation, Ostwald ripening and growth of inclusion in molten steel. ISIJ Int. 2010, 50, 1735–1745. [Google Scholar] [CrossRef]
  20. Bouris, D.; Bergeles, G. Investigation of inclusion re-entrainment from the steel-slag interface. Met. Mater. Trans. B 1998, 29, 641–649. [Google Scholar] [CrossRef]
  21. Miki, Y.; Thomas, B.G. Modeling of inclusion removal in a tundish. Met. Mater. Trans. B 2008, 39, 639–654. [Google Scholar] [CrossRef]
  22. Zhang, L.; Wang, Y.; Zuo, X. Flow transport and inclusion motion in steel continuous-casting mold under submerged entry nozzle clogging condition. Met. Mater. Trans. B 2008, 39, 534–550. [Google Scholar] [CrossRef]
  23. Zhu, M.; Zheng, S.; Huang, Z.; Gu, W. Numerical simulation of nonmetallic inclusions behaviour in gas-stirred ladles. Steel Res. Int. 2005, 76, 718–722. [Google Scholar] [CrossRef]
  24. Wang, L.T.; Zhang, Q.Y.; Deng, C.H.; Li, Z.B. Mathematical model for removal of inclusion in molten steel by injecting gas at ladel shroud. ISIJ Int. 2005, 45, 1138–1144. [Google Scholar] [CrossRef]
  25. Iwamasa, P.K.; Fruehan, R.J. Effect of FeO in the slag and silicon in the metal on the desulfurization of hot metal. Met. Mater. Trans. B 1997, 28, 47–57. [Google Scholar] [CrossRef]
  26. Roy, D.R.; Pistorius, P.C.; Fruehan, R.J. Effect of silicon on the desulfurization of Al-killed steels: Part II. Experimental results and plant trials. Met. Meter. Trans. B 2013, 44, 1086–1094. [Google Scholar] [CrossRef]
  27. Roy, D.R.; Pistorius, P.C.; Fruehan, R.J. Effect of silicon on the desulfurization of Al-killed steels: Part I. Mathematical model. Met. Meter. Trans. B 2013, 44, 1095–1104. [Google Scholar] [CrossRef]
  28. Shibata, E.; Sun, H.; Mori, K. Kinetics of simultaneous reactions between liquid iron-carbon alloys and slags containing MnO. Met. Mater. Trans. B 1999, 30, 279–286. [Google Scholar] [CrossRef]
  29. Andersson, M.; Hallberg, M.; Jonsson, L.; Jönsson, P. Slag-metal reactions during ladle treatment with focus on desulfurization. Ironmak. Steelmak. 2002, 29, 224–232. [Google Scholar] [CrossRef]
Figure 1. Schematic diagram of the solid particle entrainment behavior in a bottom-blown ladle: (a) ladle photograph; (b) schematic diagram.
Metals 15 00963 g001
Figure 2. Boundary conditions and mesh of model: (a) Boundary; (b) Dimension.
Metals 15 00963 g002
Figure 3. Schematic diagram of physical model: (a) bottom of ladle; (b) water model.
Metals 15 00963 g003
Figure 4. Top view of water model.
Metals 15 00963 g004
Figure 5. Schematic diagram of PV6M multi-channel particle concentration meter.
Metals 15 00963 g005
Figure 6. Calibration curve of particle concentration with different probe channel: (a) channel 1; (b) channel 2; (c) channel 3.
Metals 15 00963 g006
Figure 7. Size diagram of “open eyes” under different gas volumes in physical cold state experiment and mathematical simulation: (ad) Experimental results at 4, 8, 12, and 16 NL/min, respectively; (eh) Corresponding numerical simulation results at 4, 8, 12, and 16 NL/min, respectively.
Metals 15 00963 g007
Figure 8. Comparison of “open eyes” size between water model and numerical simulation.
Metals 15 00963 g008
Figure 9. Comparison of particle concentration measured by experiment and predicted by simulation under different flow rates.
Metals 15 00963 g009
Figure 10. Variation of particle entrainment mass with time at different meshes.
Metals 15 00963 g010
Figure 11. Velocity vectors of steel at different bottom-blowing flows: (a) 48 Nm3/h; (b) 96 Nm3/h; (c) 192 Nm3/h; (d) 240 Nm3/h.
Metals 15 00963 g011
Figure 12. Contours of turbulent dissipation rate in steel at different bottom-blowing flows: (a) 48 Nm3/h; (b) 96 Nm3/h; (c) 192 Nm3/h; (d) 240 Nm3/h.
Metals 15 00963 g012
Figure 13. Contours of volume fraction (particle) under different flow rates: (a) 48 Nm3/h; (b) 96 Nm3/h; (c) 192 Nm3/h; (d) 240 Nm3/h.
Metals 15 00963 g013
Figure 14. Prediction of particle entrainment under different flow rates.
Metals 15 00963 g014
Figure 15. Size proportion of “open eyes” under different flow rates.
Metals 15 00963 g015
Figure 16. Velocity vectors of steel with different numbers of tuyeres: (a) xz plane of 2 tuyeres; (b) yz plane of 2 tuyeres; (c) xz plane of 3 tuyeres; (d) yz plane of 3 tuyeres; (e) xz plane of 4 tuyeres; (f) yz plane of 4 tuyeres.
Metals 15 00963 g016
Figure 17. Contours of turbulent dissipation rate in steel with different numbers of tuyeres: (a) 2 tuyeres; (b) 3 tuyeres; (c) 4 tuyeres.
Metals 15 00963 g017
Figure 18. Contours of volume fraction (particle) in steel with different numbers of tuyeres: (a) 2 tuyeres; (b) 3 tuyeres; (c) 4 tuyeres.
Metals 15 00963 g018
Figure 19. Prediction of particle entrainment under different numbers of tuyeres.
Metals 15 00963 g019
Figure 20. Size proportion of “open eyes” under different numbers of tuyeres.
Metals 15 00963 g020
Figure 21. Velocity vectors of steel with different particle sizes of refining slag particle: (a) 1 mm; (b) 5 mm; (c) 10 mm.
Metals 15 00963 g021
Figure 22. Contours of turbulent dissipation rate in steel with different particle sizes of refining slag particle: (a) 1 mm; (b) 5 mm; (c) 10 mm.
Metals 15 00963 g022
Figure 23. Contours of volume fraction (particle) with different sizes of refining slag particle: (a) 1 mm; (b) 5 mm; (c) 10 mm.
Metals 15 00963 g023
Figure 24. Prediction of particle entrainment under different particle sizes.
Metals 15 00963 g024
Figure 25. Size proportion of “open eyes” under different particle sizes.
Metals 15 00963 g025
Table 1. Ladle and water model dimensions.
ParameterLadleWater Model
Height/mm3300550
Top opening dimension/mm3180530
Bottom diameter/mm2640440
Molten pool height/mm2580430
Particle thickness/mm6010
Table 2. Parameter table.
ParameterValue
Physical property parameter
SteelDensity (kg/m3)7020
Viscosity (kg/(m s))0.0055
ParticleDensity (kg/m3)3400
Viscosity (kg/(m s))0.06
ArgonDensity (kg/m3)1.6228
Viscosity (kg/(m s))2.125 × 10⁻⁵
Smelting parameters
Tapping Temperature (K)1873
Slag Layer Thickness (mm)60
Argon Flow Rate (Nm3/h)48, 96, 192, 240
Table 3. Chemical composition of the steel.
CompositionCSiMnPSAlsAlt
Content (%)0.5220.0010.170.0690.0150.0010.008
Table 4. Chemical composition of the slag.
CompositionCaOSiO2MgOAl2O3FeOMnOR
Content (%)48.369.085.2329.694.351.885.33
Disclaimer/Publisher’s Note: The statements, opinions and data contained in all publications are solely those of the individual author(s) and contributor(s) and not of MDPI and/or the editor(s). MDPI and/or the editor(s) disclaim responsibility for any injury to people or property resulting from any ideas, methods, instructions or products referred to in the content.