Article

Distribution of Residual Stresses in Dissimilar Ferritic Steel Weld Joints and Their Modification via Mechanical Hammer Peening

1
School of Mechanical Engineering and Automation, Northeastern University, Shenyang 110819, China
2
Ship Standardization Research Center, China Institute of Marine Technology & Economy, Beijing 100081, China
*
Authors to whom correspondence should be addressed.
Metals 2025, 15(9), 961; https://doi.org/10.3390/met15090961 (registering DOI)
Submission received: 29 July 2025 / Revised: 24 August 2025 / Accepted: 26 August 2025 / Published: 29 August 2025
(This article belongs to the Special Issue Metal Forming and Additive Manufacturing)

Abstract

Dissimilar steel welding is a necessary means for engineering structures to meet complex service conditions. However, residual stress becomes a challenge for the service properties of dissimilar welded joints (DWJs), as it can reduce fatigue strength and trigger cracking in welded components. Therefore, accurately estimating the distribution of residual stress and efficiently eliminating it is of great importance. This study investigated the evolution of residual stress during the welding process of two commonly used ferritic steels through experimental and numerical analyses. The results show that different thermal cycle behaviors between DWJs have a significant impact on the formation of residual stress. Longitudinal tensile residual stress is predominant in the weld and heat-affected zone (HAZ), with higher longitudinal tensile and compressive stresses in the Q390 side than in the Q690 side, while the maximum transverse tensile stress occurs in the HAZ of the Q690 side. Hammer peening shows excellent ability to eliminate residual stress after welding, with a maximum elimination rate of approximately 62%, and converts the stress state from tensile to compressive at a certain welding depth. The analysis of process parameters reveals that peening velocity is the most influential factor. Under the present experimental configuration, the peening velocity should be set between 4.5 m/s and 5.5 m/s.

1. Introduction

High-strength low-alloy (HSLA) steels are widely used in infrastructure projects due to their excellent combination of high strength and toughness, good weldability, and low cost [1]. In some engineering structures, different strength HSLA steels need to be welded together to adapt to various service environments [2]. However, due to the differences in chemical composition, temperature-related factors (such as thermal conductivity), and microstructure between different materials, welding different materials is more complex than using the same material [3]. These differences can lead to uneven residual stress in the welded joints of the different materials. Existing studies have confirmed that the presence of welding residual stress has adverse effects on strength, structural stiffness, stress corrosion, and fatigue performance, especially when external loads are superimposed [4]. Yan et al. [5] investigated the influence of welding residual stress on the bending resistance of hollow spherical joints, and through the analysis of multiple parameters of structural dimensions, they found that residual stress could reduce the bending stiffness by more than 10%. Luo et al. [6] emphasized that effectively controlling the welding heat input can reduce residual stress, which significantly improves the stress corrosion cracking resistance of stainless-steel welded joints. Webster et al. [7] pointed out that as the welding seam residual stress increases, fatigue life significantly decreases, and based on an accurate understanding of the distribution of residual stress, fatigue performance can be reliably predicted. Zhang et al. [8] proved that residual stress significantly affects the average stress in the fatigue estimation of the DWJ between SAF2205 duplex stainless steel and 304 austenitic stainless steel, and fatigue failure occurs on the surface of the heat-affected zone close to the SAF2205 side.
Since residual stress is of great significance for structural design and safety assessment, there are various experimental methods for detecting its distribution, including destructive methods (such as drilling blind holes to measure the relaxation strain) and non-destructive methods (based on physical principles, such as X-ray diffraction (XRD), neutron diffraction, and ultrasonic methods) [9]. However, most experimental methods are usually time-consuming or costly, and the internal stress state is difficult or inconvenient to fully detect. With the development of computer science, the finite element method has become an auxiliary tool for revealing the evolution of residual stress and guiding the actual welding process. Lee et al. [10] used the thermal finite element model (FEM) to study the temperature fields and residual stress states in DWJs between carbon steel and stainless steel, and observed that the temperature on the carbon steel side was lower than that on the stainless-steel side during the welding and cooling stages. Bajpei et al. [11] established a thermo-mechanical coupled model to simulate the transient temperature, residual stresses, and deformation in welding AA5052 and AA6061 plates. Their analysis showed that the maximum tensile or compressive stress level borne by the AA6061 surface was higher than that of the AA5052 surface. Furthermore, Ranjbarnodeh et al. [12] considered the influence of welding sequence and reduction on residual stresses in TIG welds of low–carbon and ferritic stainless steel in the numerical solution, and concluded that higher residual stress would be found in carbon steel parts with higher yield strengths.
During the welding process, the uneven temperature distribution and temperature gradient can lead to local thermal stress and plastic deformation, inevitably resulting in residual stress [13]. To reduce welding residual stress, various techniques have been proposed, including heat treatment, ultrasonic impact, hammering strengthening, shot peening strengthening, and vibration aging [14]. Among them, hammering strengthening has the advantages of simple operation, low cost, energy saving, and environmental friendliness [14]. Through hammering strengthening with high impact energy, the weld with deep penetration undergoes plastic deformation, which can counteract the shrinkage deformation during cooling after welding and reduce tensile residual stress. Moreover, the new compressive residual stress formed on the weld surface can effectively inhibit the expansion of fatigue cracks and optimize the performance [15].
Based on experimental measurements of residual stress and plastic deformation after hammering reinforcement, Miki et al. [16] concluded that plastic deformation causes local compression stress to be generated, and a new stress equilibrium state is established within the material. Similarly, Jean-Loup Curtat et al. [17] investigated the effect of hammer peening on the residual stresses and fatigue strength of E309L steel by implementing hammering tests at the weld, and the results demonstrated that hammer peening can effectively increase the surface hardness to a level similar to the HAZ, generate compressive residual stresses on the weld surface, and improve the fatigue strength. Simoneau et al. [18] studied the effect of hammering reinforcement on the elimination of residual stress in the welding of high-strength steel A514 and stainless steel S41500. The results showed that the residual stress on the high-strength steel side decreased more significantly after hammer peening, while this was not obvious on the stainless-steel side. This indicates that the effect of hammer peening on modifying the residual stress in DWJs is different. It is thus necessary to further study the different effects of hammer peening on the modification of residual stress in DWJs.
In addition to studying the hammering machine and the qualitative stress correction mechanism [19], considering the characteristics of its deterministic process dynamics, multiple key process parameters, including hammering velocity, hammer head diameter, overlap distance, and spacing, should also be explored and clarified to investigate their effects on the post-welding treatment of the welded components [20]. Parameter analysis not only helps to enhance the structural integrity of high-strength low-alloy steel weldments but also promotes the development of standardized formulas for hammering technology and facilitates its application in emerging manufacturing technologies (such as additive manufacturing). Therefore, this study uses XRD measurements to investigate the residual stress distribution in two types of ferritic steel with strength mismatch in the butt weld. Subsequently, hammering treatment is carried out using a mechanical shot peening system to eliminate the residual stress. In this study, a model based on the continuous coupled finite element method is established to simulate the welding process and hammering peening strengthening treatment, and a thorough analysis of the stress distribution after the strengthening treatment and the process parameters is conducted. The accuracy of the numerical results is verified via comparison with the experimental results.

2. Experimental Procedure

2.1. MAG Welding Experiment

The two base metals (BMs) of HSLA steel plates were Q390 and Q690 steels (designated by the National standard of GB/T 3077-2015 [21]). Their chemical compositions and mechanical properties were measured and are listed in Table 1 and Table 2, respectively [22]. They were prepared in dimensions of 200 mm (length) × 120 mm (width) × 14 mm (thickness) and butt-welded through Metal Active-Gas (MAG) welding. The welding was performed using an OTC-DP400 gas-shielded arc welding machine (Odex Electromechanical (Qingdao) Co., Ltd., Qingdao City, China) with the shielding gas consisting of a mixture of 20% CO2 and 80% Ar. In accordance with our previous research [23], the strength of the weld metal (WM) was adjusted to match that of the Q690 steel. This significantly improved both yield and tensile strength, and was ascribed to the strengthening effect of fine acicular ferrite. Based on the reported conclusion, a filling wire ER-76 with a 1.2 mm diameter was used; its chemical composition and mechanical properties are listed in Table 1 and Table 2, respectively.
The actual specimen size and weldment layout are shown in Figure 1. According to the recommended processes in the National standard of GB/T 985.1-2008 [24], the joint’s groove angle is 60°, with a double bevel V-type (higher joining strength than other designed grooves that have been reported [25,26]). The root gap is 1 mm, and 4-pass weld processes were carried out to fill the weld. No additional mechanical constraints were applied.
The welding parameters are shown in Table 3. The welding parameters are shown in Table 3, and the heat input is given by:
Q = h U I v
where Q is the heat input, h is the arc efficiency factor, U is welding voltage, I is the welding current and v is the welding velocity. The η is assumed as 0.85 for MAG welding.

2.2. Measurement of Welding Thermal Cycles

To monitor the thermal cycles during welding, an S-type thermocouple (bolt sheathed) with a diameter of 6 mm is inserted into the hole drilled into the side of the Q390 steel. The thermocouple is connected to the HAZ and is located 15 mm away from the centerline of the weld. The position of the thermocouple (TC) is marked in red, as shown in Figure 1a. This type of thermocouple can be used within a wide temperature range of 0 °C to 1600 °C. The sampling rate for the data acquisition system is once every second. The dynamic signal acquisition of the HIOKI Memory Hicorder (HIOKI, Uneo City, Japan) was connected to the thermocouple to record the temperature evolution curves promptly. The real-time temperature signal data were extracted for subsequent analysis.

2.3. Hammer Peening Experiments

Peening treatment was conducted using a self-built pneumatic machine whose structure is shown in Figure 2a. According to the pneumatic impact principle, input energy is provided by the kinetic energy of a moving mass driven by the pneumatic actuator [26]. During the nonlinear loading process with the contact-impact characteristics, the peening effect is related to hammer mass, driving pressure, and friction force of motion [27]. Since instantaneous contact and force are difficult to measure accurately, the peening energy input is expressed quantitatively based on the definition of peening velocity [27,28]. In this mechanical peening system, the high-pressure gas is provided by an air pump, with a maximum pressure of 0.7 MPa.
In order to determine the blasting parameters, the initial instantaneous velocity was monitored by a high-velocity camera (HF Agile Device Co., Ltd., Hefei City, China) (with a maximum acquisition velocity of 3000 FPS and a resolution of 12 megapixels), as reported in our previous research [29]. The gas pressure was divided into four grades through the control valve in the peening system, corresponding to the blasting velocity of the hammer head at 2.5, 3, 3.5, and 4 m/s under the experimental settings. A cylindrical steel hammer head with a height of 30 mm and a diameter of 25 mm was employed in the peening experiments. The butt-welded plate was placed on the test plate and clamped in a vise. The peening energy input E can be expressed by the following equation:
E = 1 2 m v 2
where m is the mass of the hammer head and v is the impact velocity. The assessment of forming power was addressed by simply monitoring the velocity and calculating the conversion energy. The energy levels E1 = 0.36 J, E2 = 0.52 J, E3 = 0.70 J, and E4 = 0.92 J in single peening were applied in the system.
Based on the dimensions of the weldment, to ensure the entire weld region is completely peened and to account for the difference between the indentation diameter and hammer diameter, the pitch distance between two consecutive peening points was set at approximately 18 mm, and the single weld was peened 12 times. The peening process is shown in Figure 2b. During the experiment, the hammering velocity at the first level of the control valve was 2.5 m/s.

2.4. Residual Stress Measurements

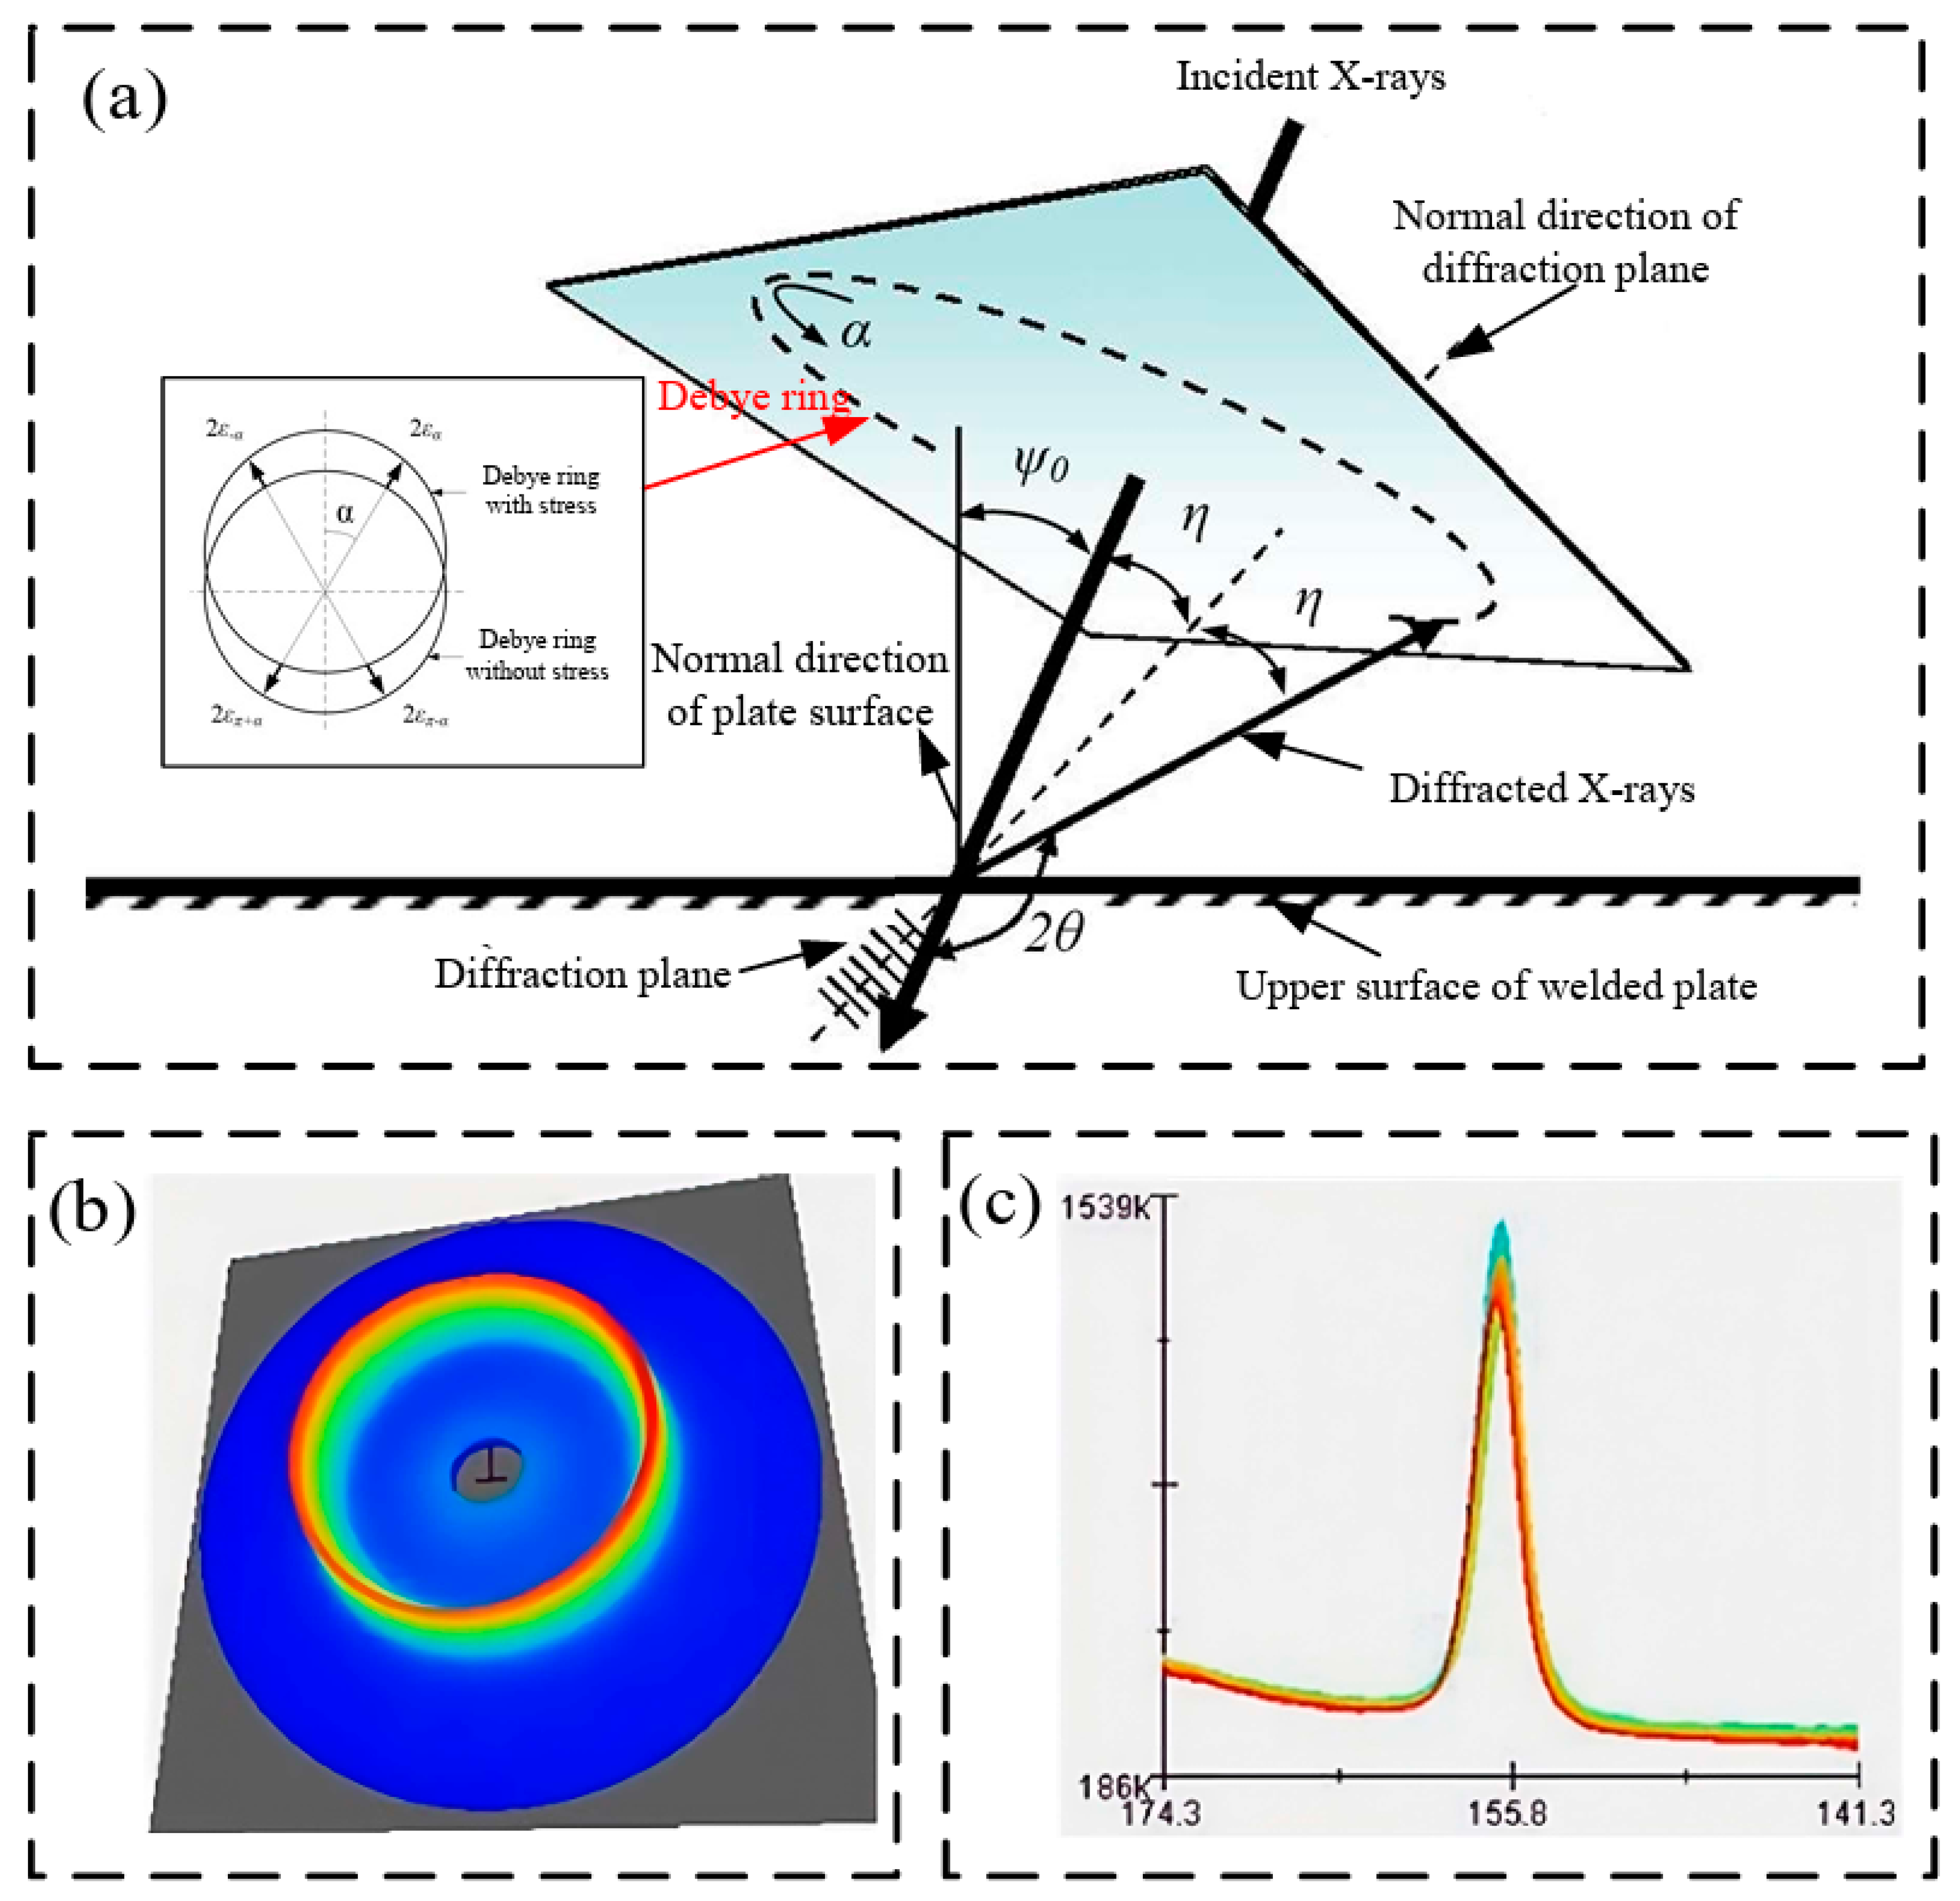
Residual stresses were measured on the welded plate after welding and hammer peening treatment. The μ-X360s portable XRD residual stress analyzer, developed by Pulstec Industrial Co. Ltd. (Hamamatsu-City, Japan), was employed to measure the residual stress on the surface of the butt-welded plate using the cosα method. Compared with the sinα method based on Bragg’s equation for calculating the lattice distance and thus reflecting the crystal strain, the cosα method directly detects the distortion of the Debye ring due to the variation in the diffraction angle. It is more dependable because more measurement points on the Debye ring are effectively used to determine the residual stress [30]. Using the μ-X360s XRD analyzer, the distortion in the Debye ring was automatically detected using a two-dimensional X-ray detector, and the stress values were calculated based on the variations in the diffraction ring radius at different angles. Figure 3a shows the fundamental principles of Debye ring collections, and the formulas for the calculations are as follows:
e a = s x E n 1 2 m n 2 2 + n 3 2 + s y E n 2 2 m n 3 2 + n 1 2 + 2 ( 1 + m ) E t x y n 1 n 2
e a 1 = 1 2 e a e p + a + e a e p a
σ x = E 1 + μ 1 sin 2 η 1 sin 2 ψ 0 ε α 1 cos α
where n1, n2, n3 are the orientation cosines; σx and σy are the residual stresses at orientations x and y, respectively; τxy is the shear residual stress; E is Young’s Modulus; μ is Poisson’s ratio. Ψ0 represents the angle between the measurement direction and the stress direction, η is the diffraction angle in the stress-free state, and a represents the different measurement angles in Figure 3a. The diameter of the X-ray exposure was 2 mm, and the exposure time was set to 15 s. The incident angle was set to 35°, and the distance between the welded plate and the area detector was 51 mm. These settings were adjusted based on the crystal structure of ferrite so that the X-ray cursor could align with the position of measurement points. The diffraction plane was chosen at the {211} crystal plane, and HSLA macroscopic constants (E = 204 GPa and μ = 0.3 of Q390 and Q690 steels) were applied in the stress analysis. The measurement points are distributed as illustrated in Figure 1a and recorded every 10 mm from the upper surface of the weldment. Each point was measured 5 times and the average value taken.
A homogeneous and complete Debye ring was obtained when the measurement regions were diffracted by X-rays (Figure 3b), indicating that the crystal structure on the surface of the weld material is relatively homogeneous and single. Figure 3c shows that only one diffraction peak appeared at approximately 155.8°, which is consistent with the diffraction plane of {211} (with a diffraction angle of 156°). The error range of the test results is 20 megapascals.
Notably, due to the measurement requirements of XRD for surface roughness, the upper surface of the welded plate was adequately polished before welding to avoid the introduction of new stress layers during the subsequent processing after welding. Additionally, an electrolytic corrosion treatment (in a saturated NaCl electrolyte with a DC power supply providing a voltage of 10 V) was conducted on the upper surface of the welded plate to remove the oxidation layer and weld slag. Following Article 7.2.2.2 of GB/T 7704-2017 [31], only local peeling treatment was performed on the samples in this study; therefore, the stress relaxation phenomena caused by electrolysis or chemical peeling were not taken into account.

3. Numerical Procedure

According to the experimental procedure for MAG welding and the hammer peening treatment, a 3D thermoelastic–plastic FEM was established using the ABAQUS 2021 software to investigate the evolution of residual stress throughout the process. Herein, considering the influence of transient heat on the formation of residual stress and the negligible effect of structural response on thermal analysis, the welding behavior was determined using a sequential coupling calculation method, in which thermal analysis and mechanical problems were solved independently. For the post-welding hammer peening treatment, a highly nonlinear dynamic response occurs with short increment times, encompassing the mechanical behaviors of impact, contact, bounce, and elastic–plastic deformation [32,33].
Based on the explicit analysis with multiple time increments, the ABAQUS/Explicit Dynamics module was used to simulate the peening treatment. The peening process was treated as a secondary coupled superposition process, i.e., the results of mechanical analysis were taken as predefined fields. It should be emphasized that the superposition coupling process requires consistent model dimensions and meshes.
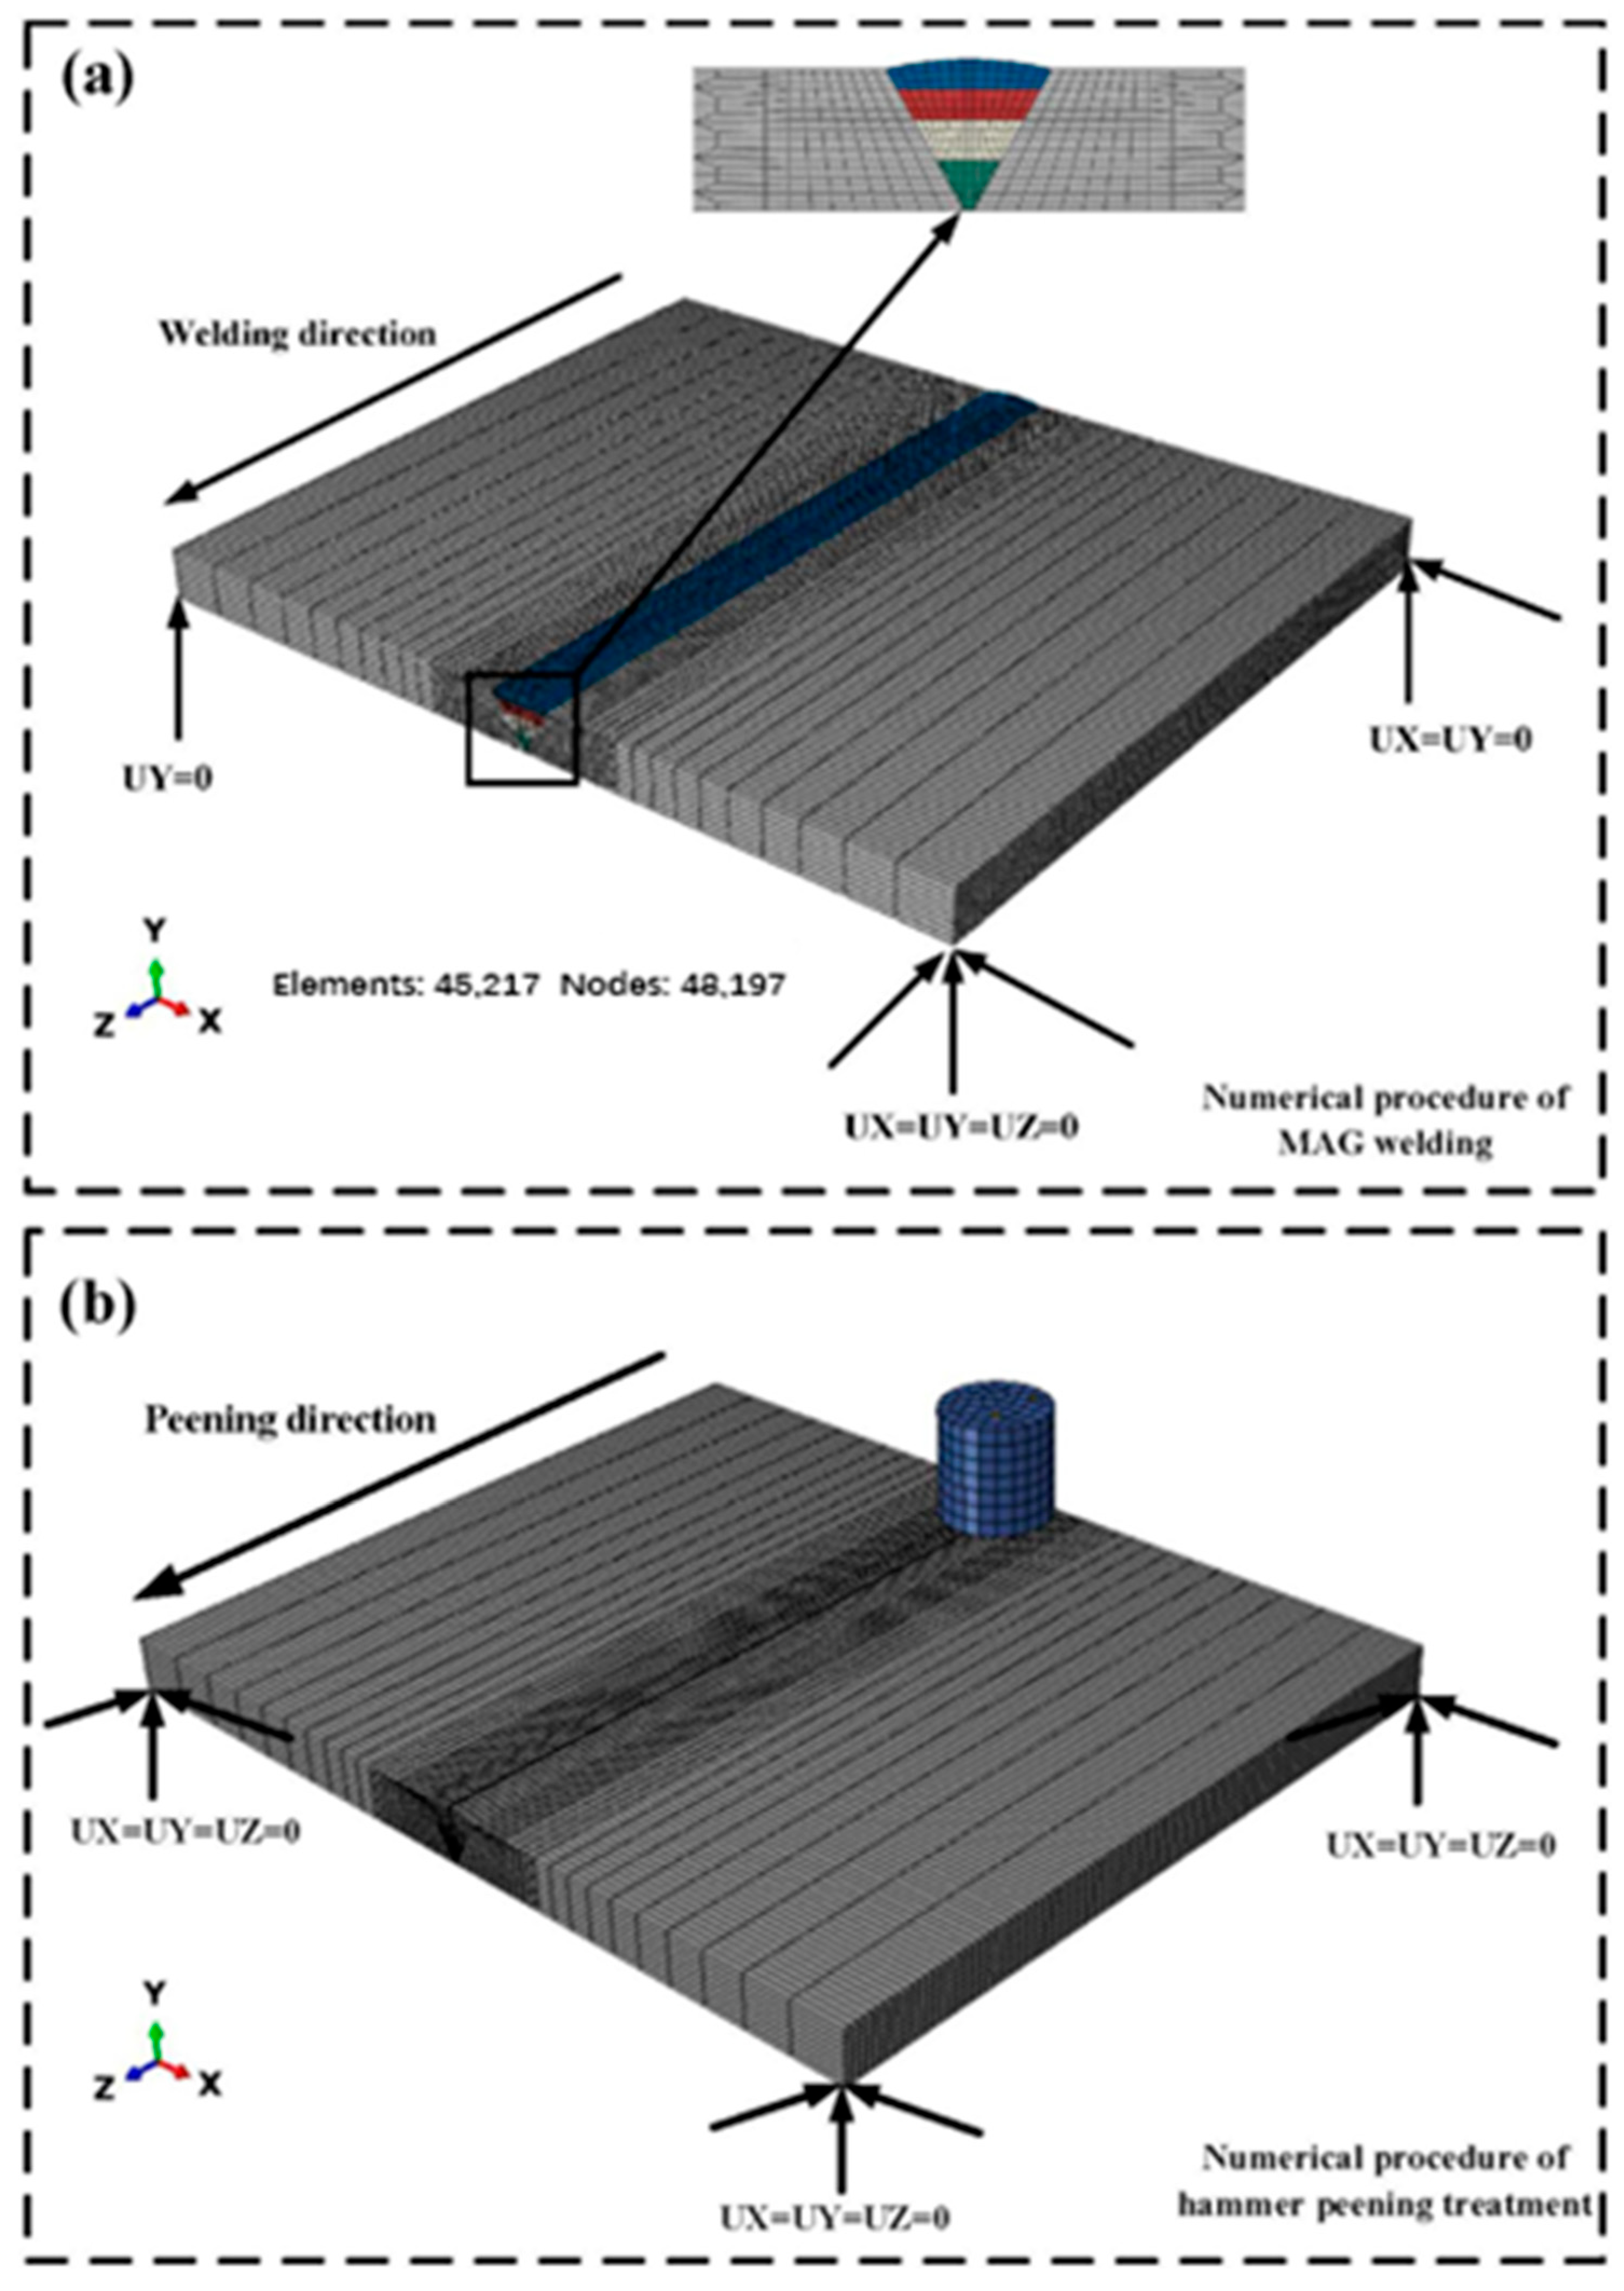
Due to the similarity in the properties of the filler wire and Q690 BM materials (as designed in the welding experiments), the welding materials were assigned the same characteristics as Q690. The interaction between the welding residual stress of AISI304 steel and the thermal cycle curve was studied using the unit life and death technique, as well as numerous failure criterion theories [34]. Elemental birth–death techniques were used to simulate the 4-pass filler deposition. The non-uniform mesh of the single-precision offset method was used to define the size, including the sizing control of 1 mm (weld zone), 2 mm (HAZ), and 4 mm. The element type used for thermal analysis was the 8-node linear heat transfer brick element (DC3D8), which had one temperature degree of freedom (DOF), whereas the 8-node linear brick element with reduced integration (C3D8R), which had three displacement DOFs, was used for mechanical analysis. Sensitivity analysis based on the maximum temperature was conducted using a different mesh strategy. The total number of elements and nodes was 45,217 and 48,197, respectively, and attained rational accuracy and convergence. The mechanical boundary conditions and meshes in the two simulation processes above are shown in Figure 4a and b, respectively.
To improve the calculation accuracy and simplify the simulation process, the following were considered:
  • Temperature-dependent thermal and mechanical properties of Q390 and Q690 steels were considered to determine a more accurate thermal distribution. These are presented in Figure 5 [35,36,37].
  • Thermal conductivity was artificially increased to simulate the convective stirring effect of fluid flow in the weld pool (above 1500 °C). This was also referred to as effective heat conductivity based on the thermo-capillary flow or the Marangoni effect [36].
  • As Young’s modulus and yield strength decreased to 5 GPa and 5 MPa, respectively, the mechanical performance losses caused by the solid–liquid transition were addressed to ensure convergence within the melt zone temperature range (Figure 5) [38,39].
  • The solidus temperature of 1450 °C was used to validate the geometry of the weld.
  • Boundary conditions were consistent with those in the experiments. That is, being in a free state during the MAG welding process does not affect the deformation and rigid slip of the sheet material; whereas, the model is completely fixed during the impact treatment process, as shown in Figure 4.
  • BM and WM obey the Von-Mises yield criterion, and isotropic hardening was considered based on elastic–plastic material with rate-independent behavior.

3.1. Thermal Analysis

Heat input should be considered as a volumetric heat source distribution during MAG welding [40]. By combining Fourier’s laws and the law of energy conservation, 3D transient nonlinear heat transfer is defined through the partial differential equation [10,41]:
x K x T x + y K y T y + z K z T z + Q = ρ c T t
where x, y, and z represent the direction of the coordinate system (as shown in Figure 4), Ki (i = x, y, z) is the thermal conductivity in x, y, and z directions, respectively, t represents the time, T (x, y, z, t) is the current temperature, c is the specific heat, ρ is the material density, and Q’ is volumetric heat generation.
In this work, the double-ellipsoidal volumetric heat source model proposed by Goldak et al. was used due to the large depth of the molten zone in MAG welding [42]. The moving heat source, consisting of the front and rear half ellipsoids, was defined in the DFLUX subroutine using FORTRAN language. The heat flux distribution is described by the following equations:
q 1 x , y , z = 6 3 f 1 Q a 1 b c π π exp 3 x 2 a 1 2 3 y 2 b 2 3 z 2 c 2 , x 0 q 2 x , y , z = 6 3 f 2 Q a 2 b c π π exp 3 x 2 a 2 2 3 y 2 b 2 3 z 2 c 2 , x < 0
where q1,2 (x, y, z) is the heat flux density at (x, y, z), a1,2 is the length of front and rear ellipsoidal, b is the width, c is the depth of the double-ellipsoid heat source model, f1,2 is the fraction of volumetric heat input precipitated in the front and rear ellipsoidal, with f1 + f2 = 2, f1 = 0.8, and f2 = 1.2 in this work. Q is the heat input, as expressed by Equation (1). Based on the comparative analysis of the thermal history in the experimental data and the simulation results, the parameters of the heat source can be gradually adjusted and optimized. Thermal boundary conditions describe heat loss during welding and the continuous cooling stage, including radiation loss that dominates in the molten pool and convection loss that dominates in the weldment. Radiation loss can be expressed using Stefan–Boltzmann’s law [43]:
Q r = ε σ t s + 273.15 4 t 0 + 273.15 4
where Qr is the radiation loss, ε is the emissivity, σ is the Stefan–Boltzmann constant, ts is the external temperature of the weldment, and t0 is the environment temperature, which is set to 20 °C in this model. The convection loss is taken into account through Newton’s law:
Q c = h c t s t 0
where Qc is the convection loss, hc is the coefficient of heat convection, ts and t0 have the same definitions as in Equation (8). The heat effect of solidification in the weld pool was determined based on the calculation of latent heat, and the latent heat of fusion was assumed to be 270 J/g between the solidus temperature 1450 °C and the liquidus temperature 1500 °C.

3.2. Mechanical Analysis

The thermal cycles induce volumetric strain, which ultimately leads to the formation of residual stress. The total strain rate can be decomposed into various strain components:
ε ˙ t o t a l = ε ˙ e + ε ˙ p + ε ˙ t + ε ˙ υ + ε ˙ c
where ε ˙ t o t a l is the total strain rate, ε ˙ e is the elastic strain rate, ε ˙ p is the plastic strain rate, ε ˙ t is the thermal strain rate, ε ˙ v is the volumetric strain rate due to the phase transformation, and ε ˙ c is the creep strain rate. The components of elastic, plastic, and thermal strain rates were calculated by inverting the generalized Hooke’s law, Von Mises criterion, and isotropic hardening, respectively [44]. It has been reported that the volumetric strain induced by low-temperature phase transformations, such as martensite transformation, has a significant effect on the total strain, whereas high-temperature phase transformations, e.g., bainite or ferrite transformation, have been shown to exhibit minimal effect [37]. As reported in our previous research [23], the microstructural evolution of Q390/Q690 DWJs showed the formation of pearlite and ferrite in the weld and HAZ, including degenerated pearlite and polygonal ferrite in the weld. This demonstrates that bainite or ferrite transformation dominates during the welding process; thus, the volumetric strain rate due to the high-temperature phase transformation was excluded in this work. Additionally, due to the transient thermal cycles in MAG welding, creep has an insignificant effect on the total strain [26], and hence it can be excluded. This simplification enhances calculation efficiency and guarantees accurate computation, as outlined in the Discussion Section. Combined with the above strain rate components, the total strain rate can be described as follows:
ε ˙ t o t a l = 1 E [ ( 1 + μ ) σ ˙ μ σ ˙ i i δ ] + λ ( 1 1 3 σ i i δ ) + α t ˙ δ
where δ is the Kronecker delta function, σ is the stress tensor, λ is the plastic flow factor, t ˙ is the rate of temperature change, and α is the thermal expansion coefficient shown in Figure 5. E and μ have the same definitions as in Equation (3).

3.3. Peening Treatment Analysis

Based on the ABAQUS/Explicit Dynamics module, the results of the mechanical analysis were secondary coupled to the hammer peening model through predefined fields, where the dimensions, meshes, and element types in the mechanical analysis remained consistent. The Johnson–Cook model, with strain-rate-dependent properties, replaced the isotropic hardening in the computation of strain hardening. The classical Johnson–Cook model can be used to describe the stress–strain behavior at different temperatures or strain rates, and has been frequently applied in impact investigations [28,45]. Because the peening treatment was conducted at room temperature, the effect of thermal softening on material behavior was not considered. The reduced Johnson–Cook model was used to represent the impact behavior of the hammer head and the weld at high strain rates:
σ e q = ( A + B × ε p n ) × ( 1 + C × ln ε ˙ ε ˙ 0 )
where A is the quasi-static yield stress, B is the strain hardening coefficient, C is the strain rate hardening parameter, and n is the strain hardening exponent. σeq is equivalent stress, εp is true plastic strain, ε ˙ is the strain rate taken into account, and ε ˙ 0 is the reference strain rate (assumed as 1 s−1); the definitions and material constants were obtained from [46] on the influence of strain rate on S690QL (Q690 steel in China) high-strength steel. Herein, A = 768 MPa, B = 1230 MPa, C = 0.02572, and n = 0.8496 are defined in ABAQUS.
In general, the interactions between the hammer head and the weldment are divided into displacement load and velocity load. The former determines the deformation situation in the thickness direction, while the latter determines the initial impact velocity [47]. To maintain consistency with the peening experiment, the velocity load was defined as the movement of the hammer head to achieve a specific impact energy with the nodal coupling in the Y-direction. Simultaneously, the movement of the hammer head in the Z-direction was set to achieve peening of the entire weld. The velocity function in the Y-direction is defined as a periodic amplitude function, expressed as the following Fourier series equation:
a = A 0 + n = 1 N A n cos n ω t 1 t 0 + B n sin n ω t 1 t 0 t 1 t 0 a = A 0 t 1 < t 0
where a is the velocity in the Y-direction, N is the number of Fourier series terms, ω is the circular frequency, t0 is the beginning moment, t1 is the current moment, A0 is the initial amplitude, An is the coefficient of the cos term, and Bn is the coefficient of the sin term. Since the peening velocity was set to 2.5 m/s with the first grade of the control valve in the experiment, in the Fourier series, w = 3927 rad/s, A0 = 0, t 0= 0, An = 31.416, and Bn = 0. The equally spaced amplitude function was adopted to control hammer head movement in the Z-direction. Based on the indentation spacing of 18 mm used in the experiments, the amplitude value was set to 0.018 at each step time. For interaction properties, the contact between the bottom of the hammer head and the upper surface of the plate was set to face-to-face contact with a friction coefficient of 0.25, and the hammer head was modeled as a rigid body. For the butt-welded plate clamped by a vise in the experiments (as shown in Figure 4b), the model was fully restrained at the bottom of the plate without considering the bounce.

4. Results and Discussion

4.1. Welding Thermal Analysis

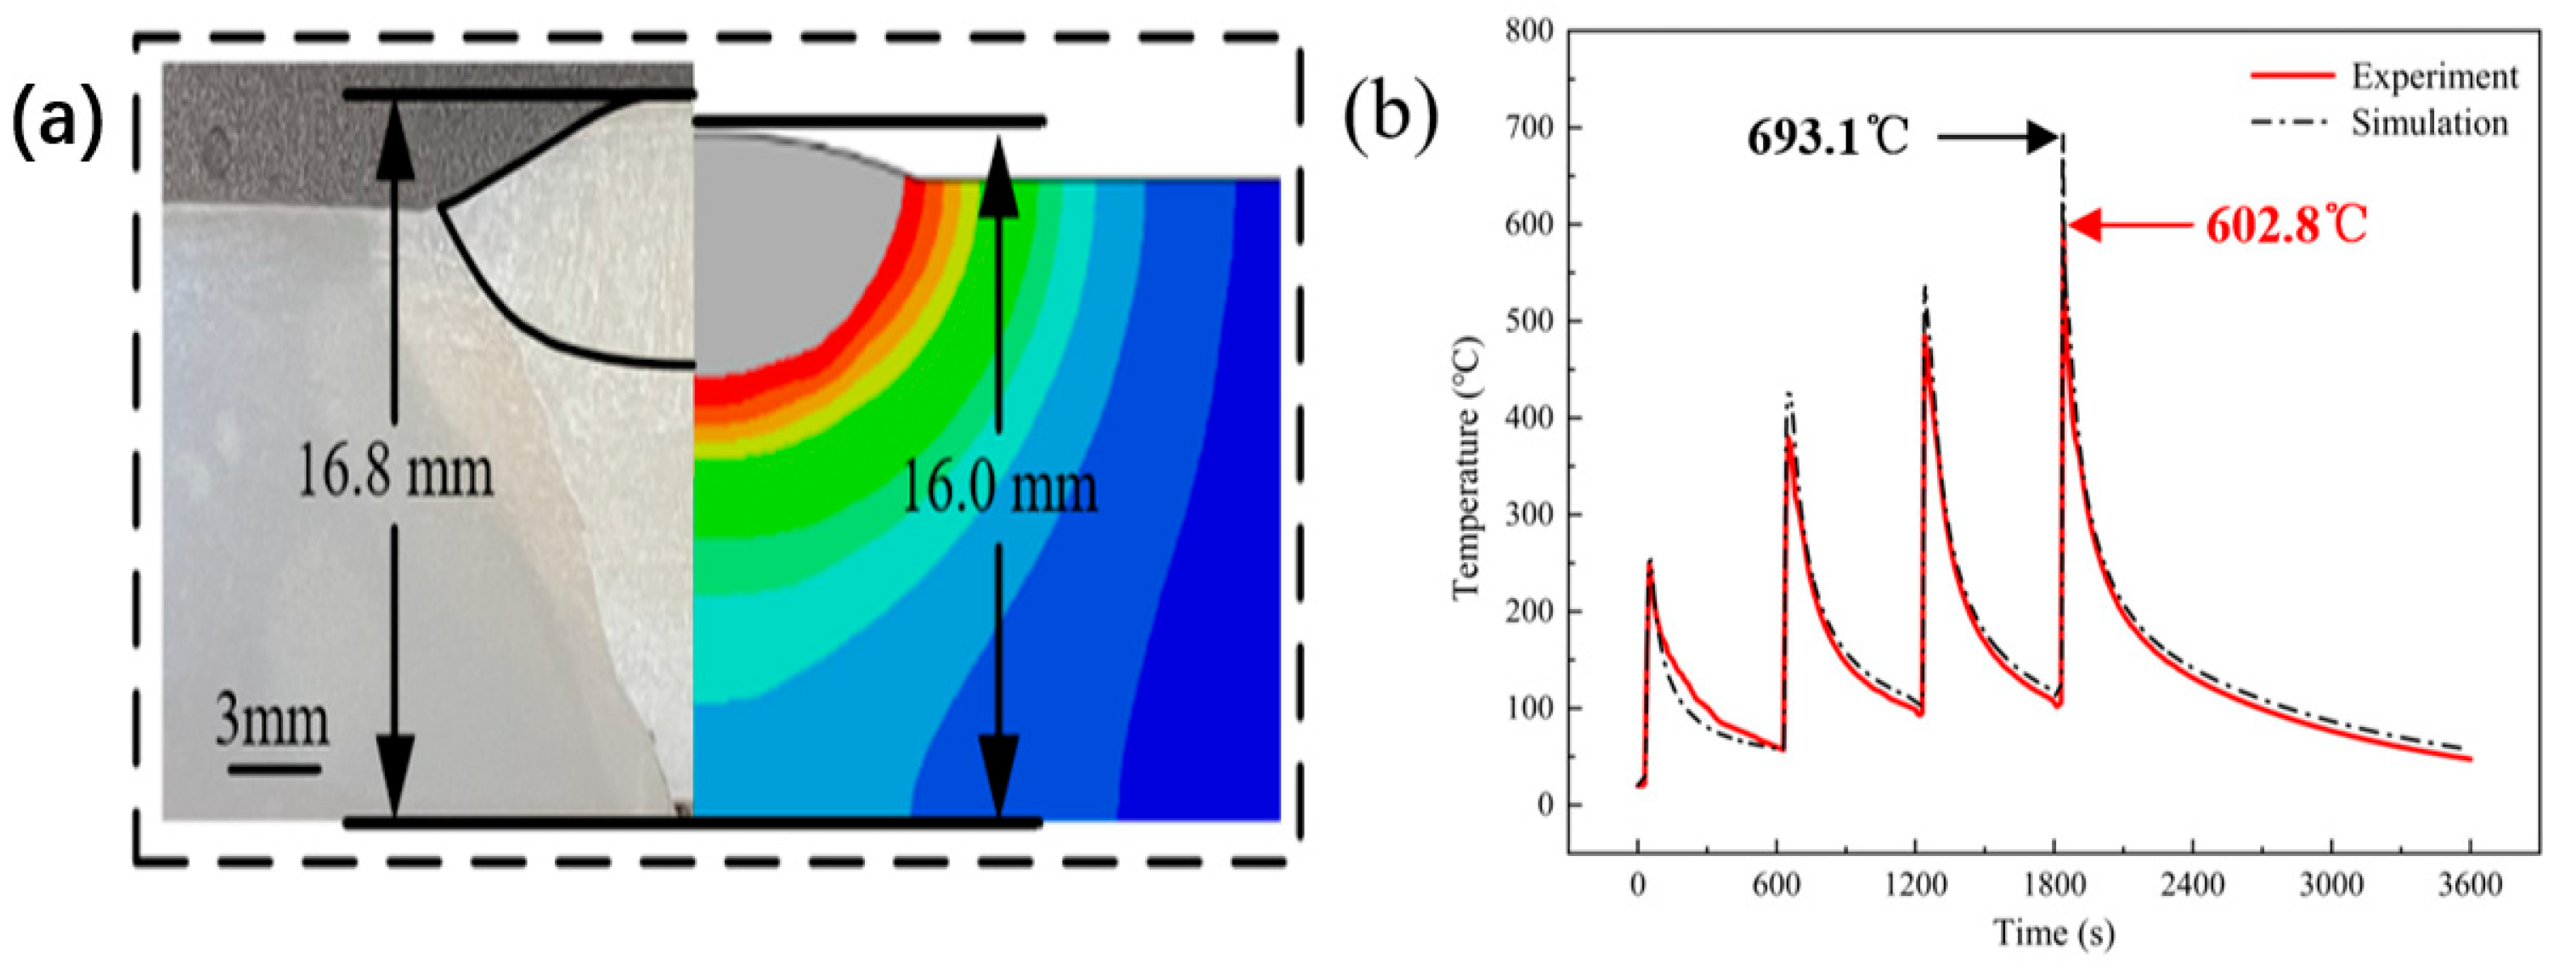
The definitions of thermal source models have a significant effect on the formation and evolution of residual stress. Here, the morphology of the weld pool and the transient thermal cycle collected in the measurement position were employed to compare the experimental and numerical results, and Goldak’s heat source parameters were adjusted accordingly. The actual and simulated geometry characteristics of the weld pool in the cross-section are given in Figure 6a. The depth of penetration and the height and width of the weld bead are measured and depicted. The twice-melting and solidification phenomena that occur in the WM increase verification difficulty during multi-pass welding; thus, only the measurement indicators in the final welding pass are considered. The geometrical shapes in the simulation results (Figure 6a) are in excellent agreement with the weld profiles obtained using optical microscopy. The error of the weld width is within 4.1%, and the error of the weld height is within 4.8%, both of which are within the acceptable ranges. The actual thermal cycling conditions are measured by a thermocouple located at the TC position on the top surface, as shown in Figure 1a. According to the established welding plan, the experimental temperature assessment curve (Figure 6b) depicts the process of four thermal cycles. The temperature peak gradually increased, reaching a maximum value of 602.8 °C. The temperature change during the cooling stage was also recorded. The model parameters were adjusted based on two indicators in the evaluation curve, namely the peak temperature and the duration of cooling. The temperature history curve extracted at TC in the finite element analysis is in good agreement with the experimental measurement values; however, the element node position errors within the radius (3 mm) of bolt sheathed hole used for thermocouple measurements, as well as the other inaccurate parameters definition and inaccurate treatments (for example without considering heat loss from droplet splashing during welding), led to the obvious differences in peak temperature, especially during the second and subsequent thermal cycles, with higher discrepancies in maximum value. The calculated peak temperatures were found to be 13.4%, 10.7%, and 15.0% higher than the peak temperature of the measurement values at the second, third, and fourth thermal cycles, respectively. Although the errors are within the allowable range [3,10,11,12], this inevitably leads to a discrepancy between the actual measured value of residual stress and the simulated value of residual stress. This difference will be further examined in the subsequent mechanical analysis.
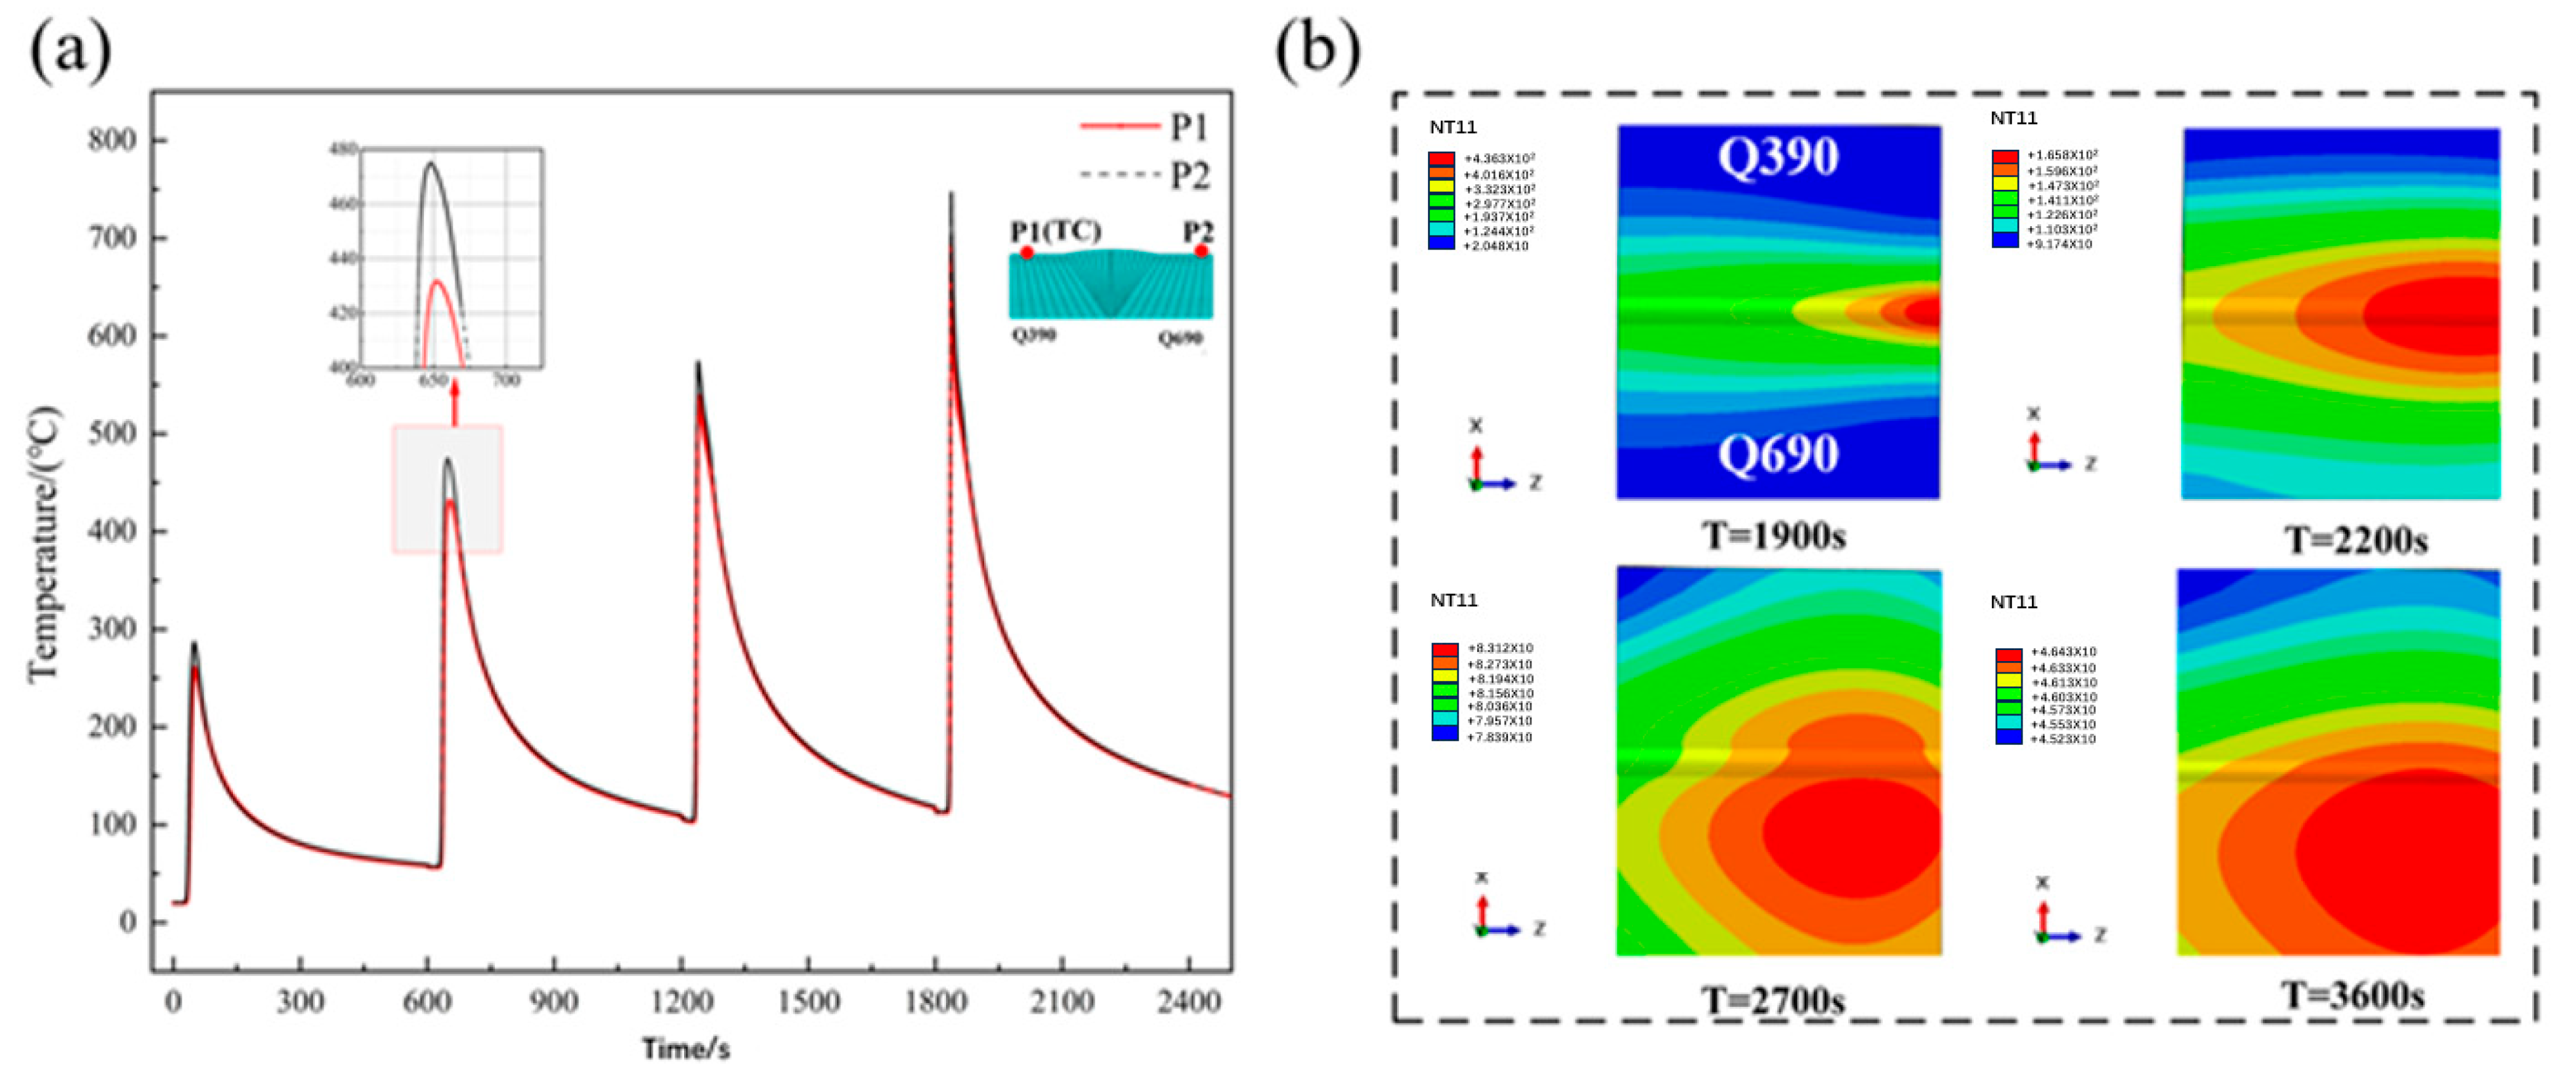
The strength mismatch phenomenon observed during dissimilar steel welding is attributed to the thermal mismatch induced by different material properties, especially heat conductivity. Figure 7a illustrates the thermal cycle characteristics in P1 (TC in Q390) and P2 (in Q690) on the upper surface of the welded plate. Significant differences are mainly observed in peak temperatures, particularly evident during the second thermal cycle, as highlighted in Figure 7a, with no noticeable differences in the rapid heating and sharp cooling stages between adjacent welding passes. Figure 7b illustrates the temperature distribution during the post-welding cooling stage; notably, after 2200 s, there is an obvious shift in the peak temperature towards the Q690 steel side. This high temperature on the Q690 steel side is maintained for more than 3600 s, whereas an apparent thermal gradient is observed on the upper surface of the Q390 steel side. In conclusion, the differential behavior of the two steels in terms of temperature is clearly outlined. It had been widely reported [3,11,12,13] that during the continuous cooling stages, the materials in the weld or HAZ experience sharp shrinkages, constrained by adjacent zones, and the discrepancy in material properties leads to the formation of differentiated plastic deformation and tensile residual stress in the corresponding region, which turns to an asymmetric residual stress state in the dissimilar steels weld.

4.2. Welding Residual Stress Analysis

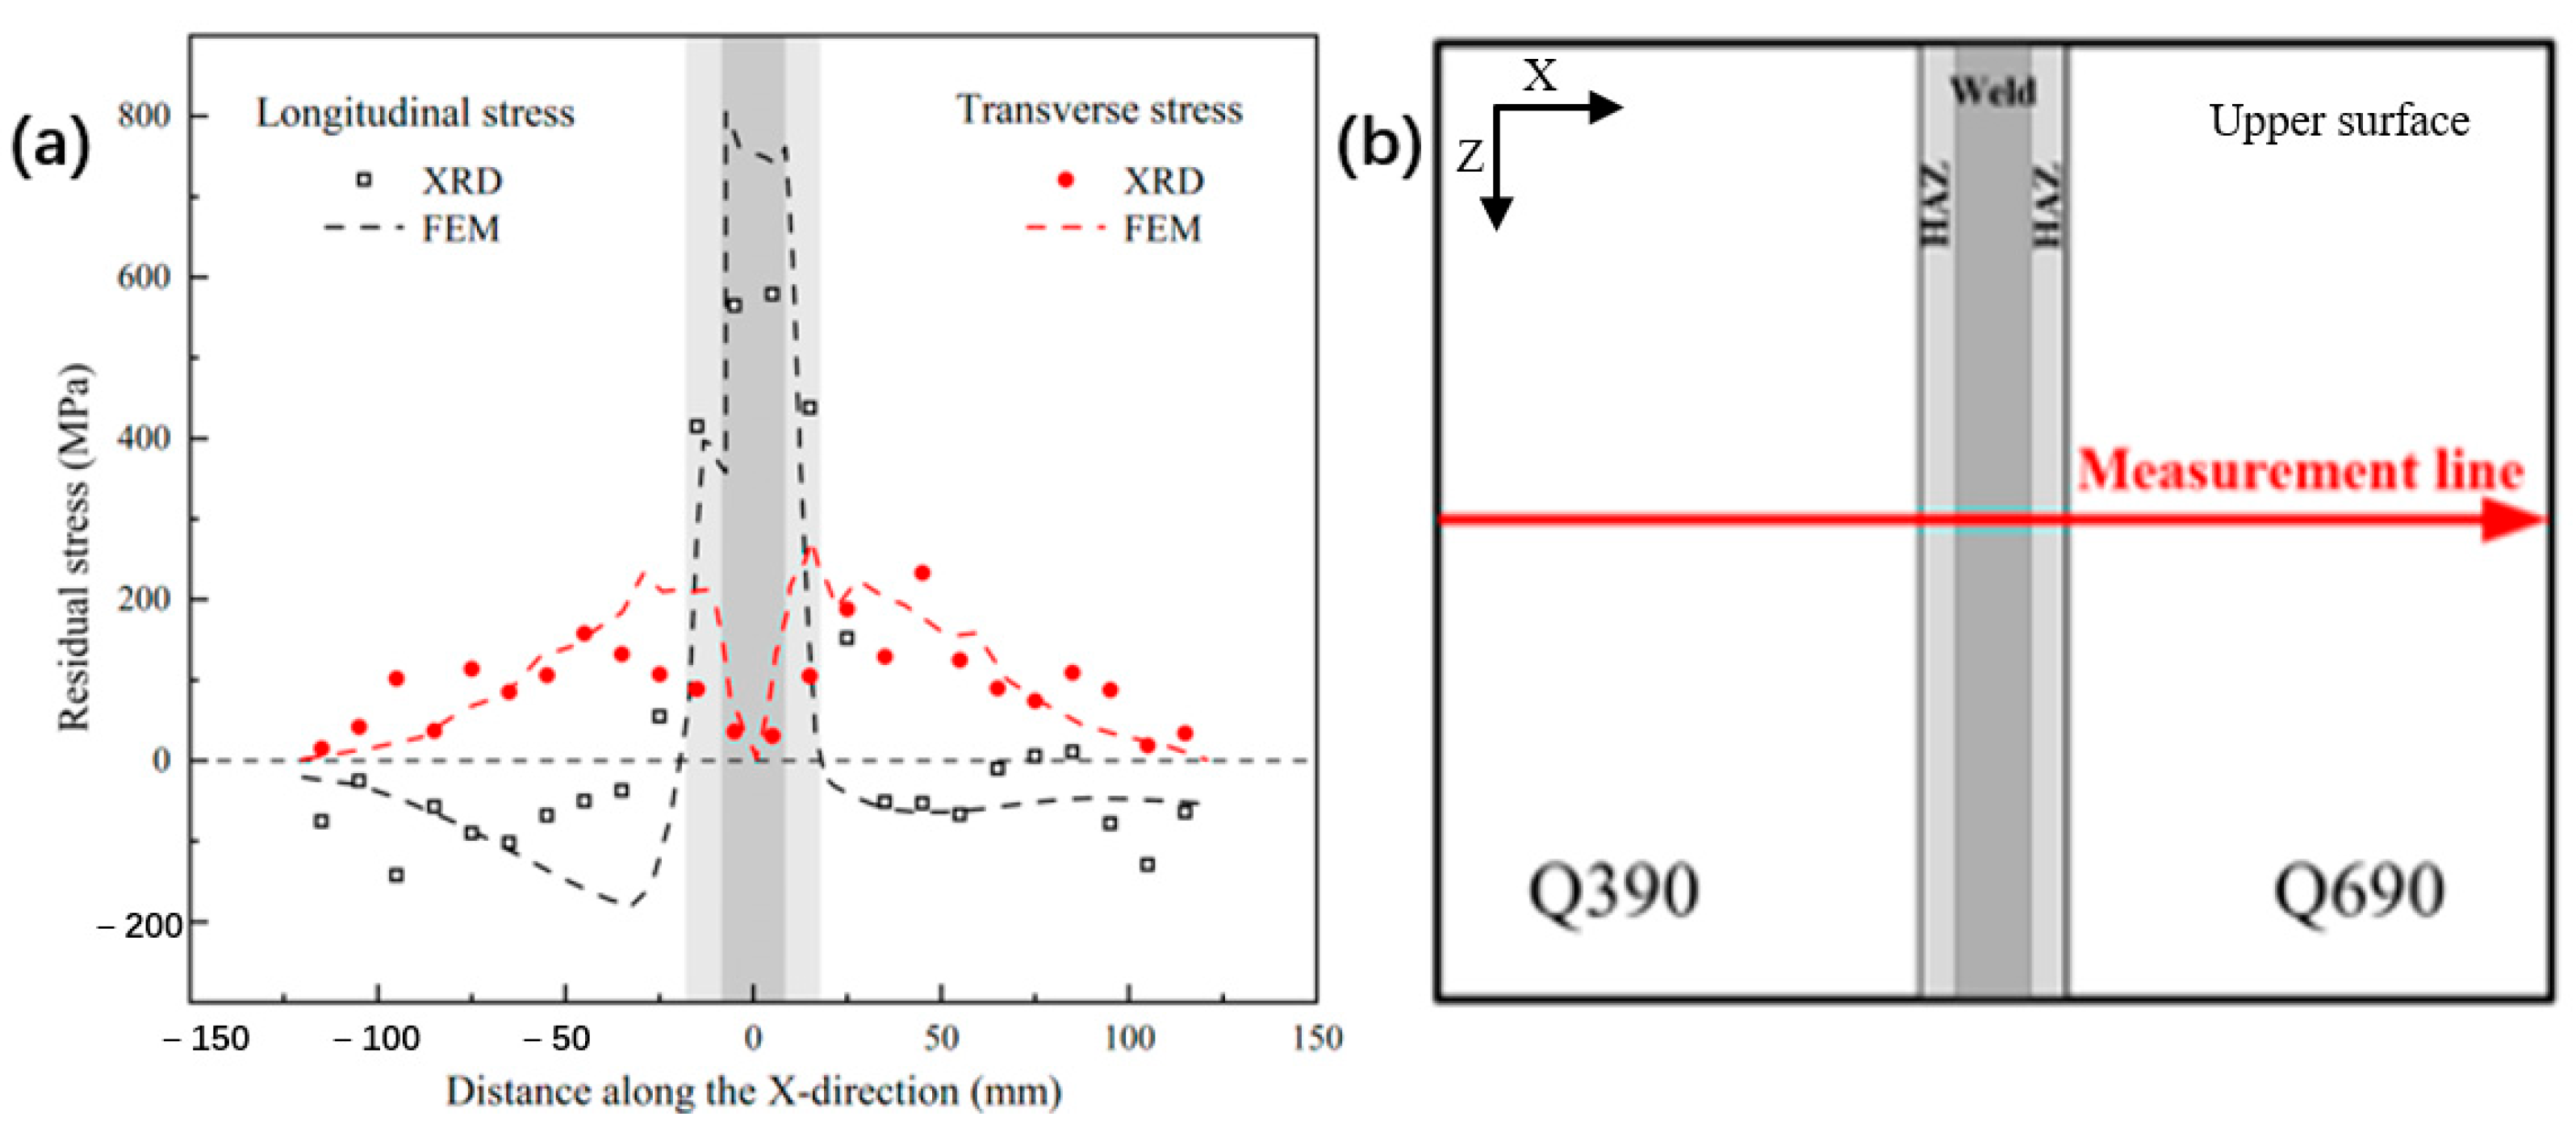
Since the internal stress of the butt-weld plate is concentrated within the plane, this study focuses on the distribution and evolution of the longitudinal and transverse residual stresses on the upper surface of the welding plate. During the research process, particular attention was paid to the different stress states generated by different materials during the welding process. Figure 8 and Figure 9 illustrate the XRD measurements and numerical results of longitudinal and transverse stress along the measurement line on the upper surface. The numerical results are extracted from the surface nodes in FEM. The division of HAZ shown in Figure 1a is based on the HSLA yield temperature [48], in accordance with the results of thermocouple measurements. The longitudinal stress, as measured by XRD, induces tensile stress in the weld and HAZ, and converts into compressive stress outside the HAZ. The maximum tensile stress in the weld was 579 MPa, lower than the yield strength of WM. The stress drops sharply to approximately 100 MPa in the region below the yield temperature, forming a W-shaped distribution. The numerical results obtained using FEM are consistent with those measured using XRD, as indicated by the stress trends and the specific data points. Notably, higher peak stress was measured using FEM in the weld zone. This can be attributed to the thermal analysis, where the peak temperature calculated by FEM is higher than that measured during the four thermal cycles. The longitudinal stress is primarily attributed to cooling shrinkage, i.e., hindered by the cold zone, which has a temperature that is lower than the yield temperature. Therefore, the high longitudinal values can be attributed to the errors in peak temperatures, thus verifying the reliability of FEM.
The evolution curves generated by FEM are used to evaluate the significant differences in residual stress after the welding of two different types of steel. The numerical results (Figure 8) indicate that the maximum longitudinal tensile stress and compressive stress are concentrated on one side of the Q390 material. The range of tensile stress on the Q390 side is slightly larger than on the Q690 side; this can be explained by the following equation [49]:
T Y = σ Y / α E
where TY is the yield temperature, σY is the yield strength, α is the thermal expansion coefficient, and E is Young’s modulus. The yield temperature of Q690 steel is higher than that of Q390; however, the temperature required to generate tensile stress in Q390 steel is lower than its yield temperature, resulting in a wider tensile stress distribution compared to Q690 steel. Meanwhile, thanks to the continuity in the FEM results, the distribution width of the tensile stress is shown to be around 38.0 mm, which is approximately 2.2 times the width of the weld (17.2 mm) and covers the entire HAZ (36.0 mm) on the upper surface, indicating that tensile stress affects the weld zone and the HAZ, with some extension on the two sides. In addition, the two sides are under compressive stress. The maximum stress is approximately 179.6 MPa on the Q390 side and 64.5 MPa on the Q690 side. The ratio of the maximum stress of the two materials is nearly 2.78. The greater compressive stress distribution on the Q390 side, in conjunction with the corresponding wider tensile stress distribution, results in balanced stress.
Transverse stress exhibits a typical M-shaped distribution, attributed to the superimposed effect of cooling shrinkage in both longitudinal and transverse directions [48]. The experimental values generated using XRD reveal that the transverse stress is predominantly tensile, with no compressive stress present. Transverse stress is lowest at the centerline of the weld and reaches its maximum near the toe of the weld. Apart from the errors caused by the thermal cycle, the results of FEM analysis are in agreement with those of X-ray diffraction, showing a consistent distribution pattern. Based on the lateral stress evolution curve obtained using FEM, the tensile stress at the toe of the weld in the Q690 material reaches a maximum value of 275.1 MPa, which is higher than the maximum tensile stress value of 232.3 MPa recorded at the toe of the weld in the Q390 material. This indicates that as the yield strength increases, the maximum transverse residual stress also increases, to a certain extent. During welding, the value of longitudinal stress is usually greater than that of transverse stress [50]. In this study, the post-welding treatment and the elimination of residual stress require the longitudinal stress to be controlled.
In order to investigate the impact of high residual stress resulting from rapid cooling contraction on the structural integrity of butt-welded plates, the residual stress on both sides of Q390 and Q690 steel was measured and calculated. The distributions of longitudinal and transverse stress measurements, obtained using XRD and FEM, are shown in Figure 9 and are both lower than 100 MPa. The level of contraction in the longitudinal and transverse directions during the cooling process is not the same [48]. The distribution patterns of the longitudinal stress and the transverse stress are opposite at the same position along the measurement line in Figure 8, and the residual stress in the middle of the measurement line is slightly higher than on both sides, indicating that stress analysis along the measurement line is representative in mechanical analysis. The scan speed used in XRD measurements is 0.5°/min.
Compared with the results obtained by XRD, the values simulated by FEM show a certain degree of deviation at both ends of the plate. This can be explained by the fact that the residual stress was introduced at the edge of the plate during wirecutting. The error in the XRD measurements was 20 megapascals. The stress values obtained by the XRD were consistent with those obtained through FEM (Figure 9), except at the ends of the plate. Therefore, the accuracy of the FEM was confirmed, showing that FEM is an effective method for studying the control effect of hammering strengthening on residual stress. The above analysis indicates the rationality of conducting directional shot peening on the weld seam and the heat-affected zone in this study.
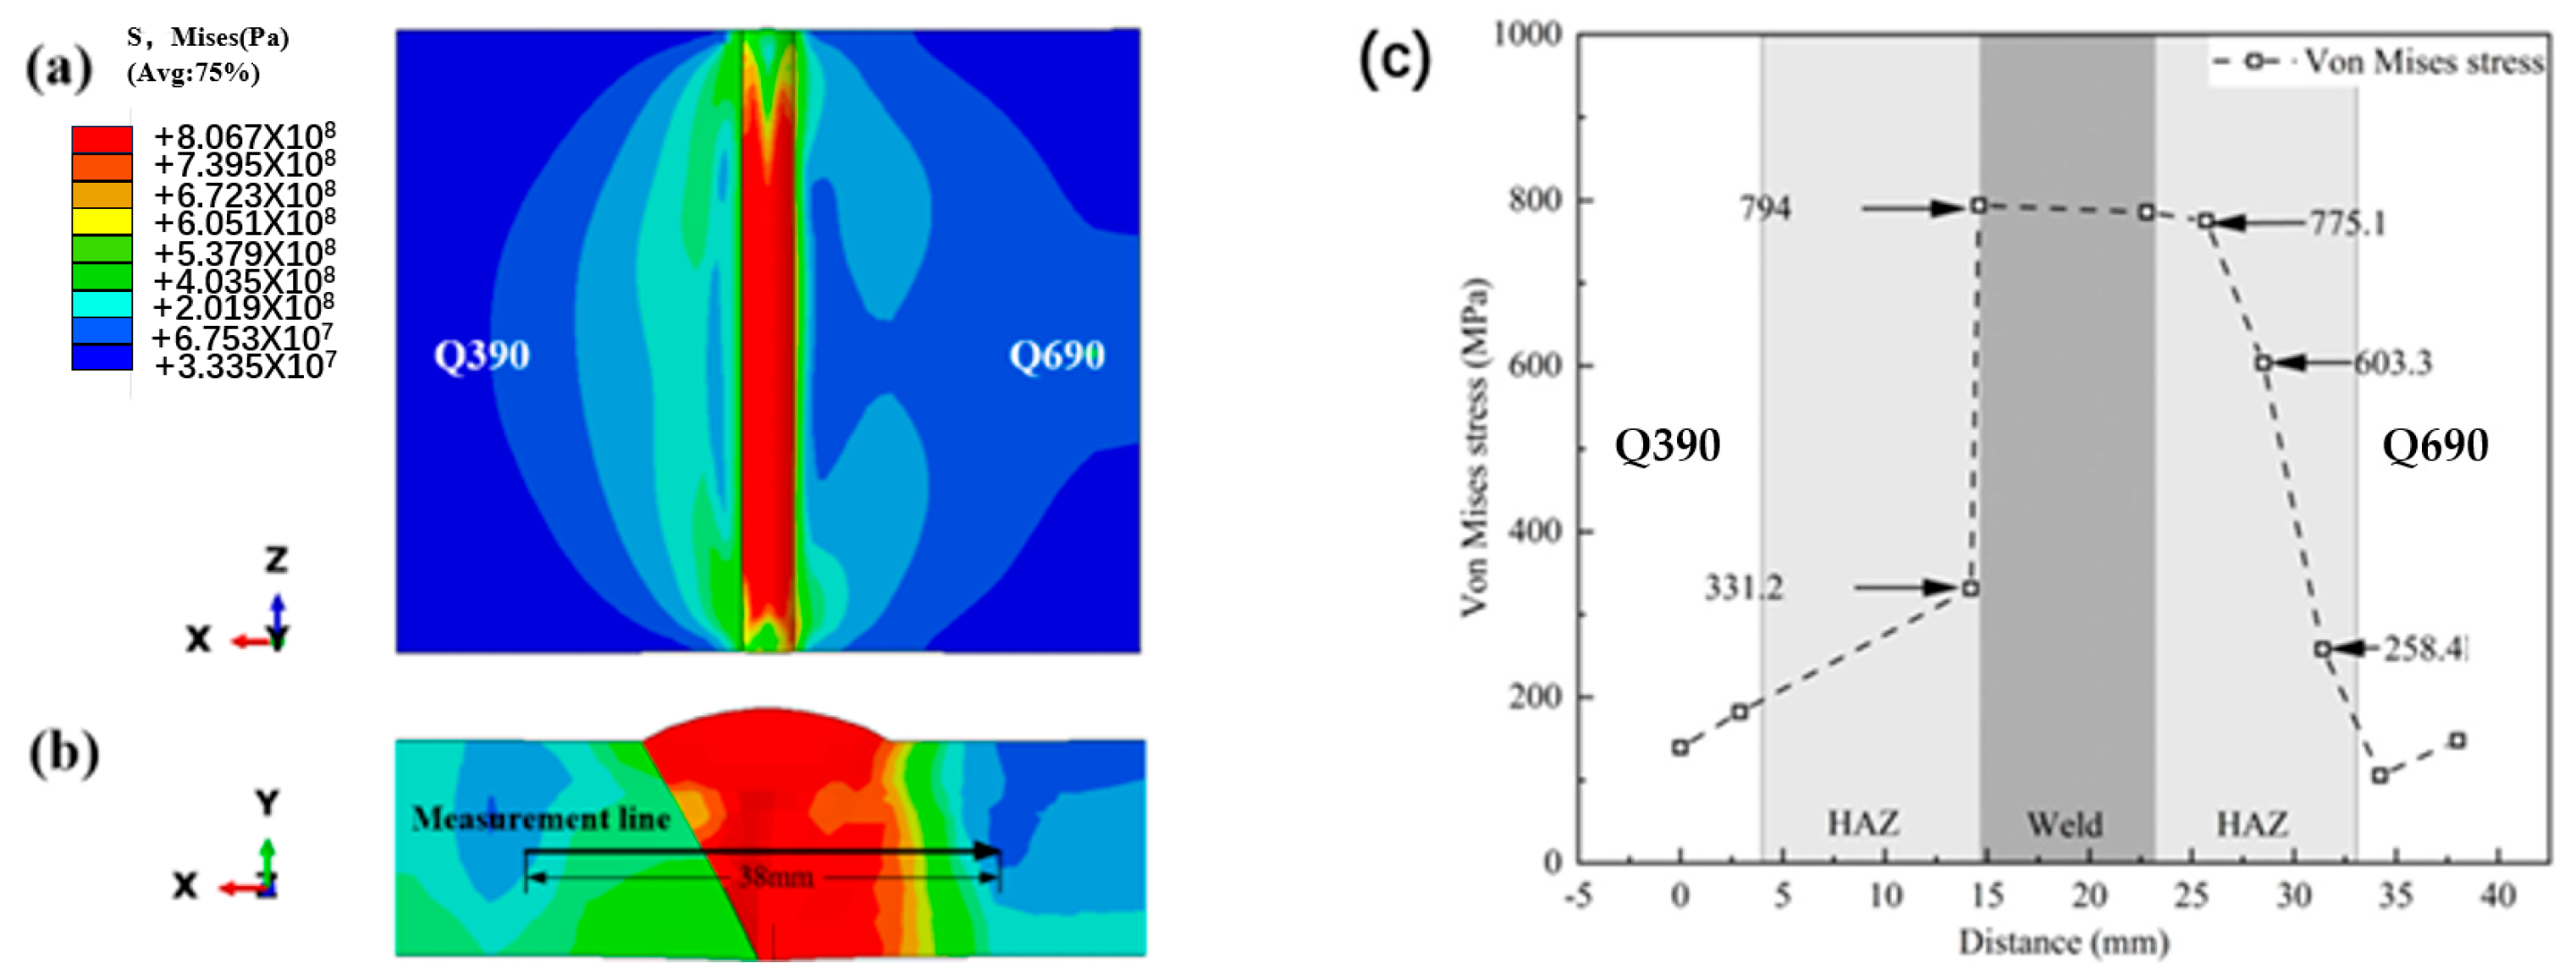
Based on the mechanical analysis in FEM, the localized stress state and dissimilar behaviors of stress gradient caused by strength mismatch were discussed through the equivalent stress. As illustrated in Figure 10a, the equivalent stress is distributed in an elliptical shape and asymmetrically on both sides of the weld, and the maximum stress value reaches 806 MPa, which is higher than the yield strength of the filler wire at room temperature. This is the result of the overestimation of longitudinal and transverse residual stresses in FEM. The stress distribution of the weld and the heat-affected zone extracted from the central cross-section is shown in Figure 10b. The high-stress areas are mainly concentrated at the weld and shift to the right, with some extending to the interior of the Q690 steel base material. This phenomenon is quite interesting. As shown in Figure 9, considerable tensile stress accumulates at the root of the weld. Indeed, as elaborated in [51,52], high stress intensification in the root region was thought to lead to much higher fatigue damage. Simultaneously, the strength mismatch between the weld filler material (Q690) and Q390 results in a different stress gradient, as shown in Figure 10b. The stress gradient is a significant factor influencing local deformation, crack propagation, and eventual fatigue fracture [53]. To quantitatively compare the stress gradient differences, the stress values in the weld and HAZ are extracted along the centerline, as shown in Figure 10b,c. The results demonstrate that the weld zone maintains a stable and high-stress state, while the HAZs on both sides have large stress gradient variations. The value of the maximum stress gradient on the left side is calculated to be about 1.157 × 10¹² (unit Pa/m), and that on the right side is calculated to be about 1.189 × 10¹¹ (unit Pa/m), i.e., the value of the stress gradient on the Q390 side is approximately ten times that on the Q690 side. When welding different materials with varying material strengths, it is necessary to conduct further research on the relationship between the yield strength of the materials and the stress gradient in the HAZ.

4.3. Effect of Hammer Peening Treatment on Residual Stress

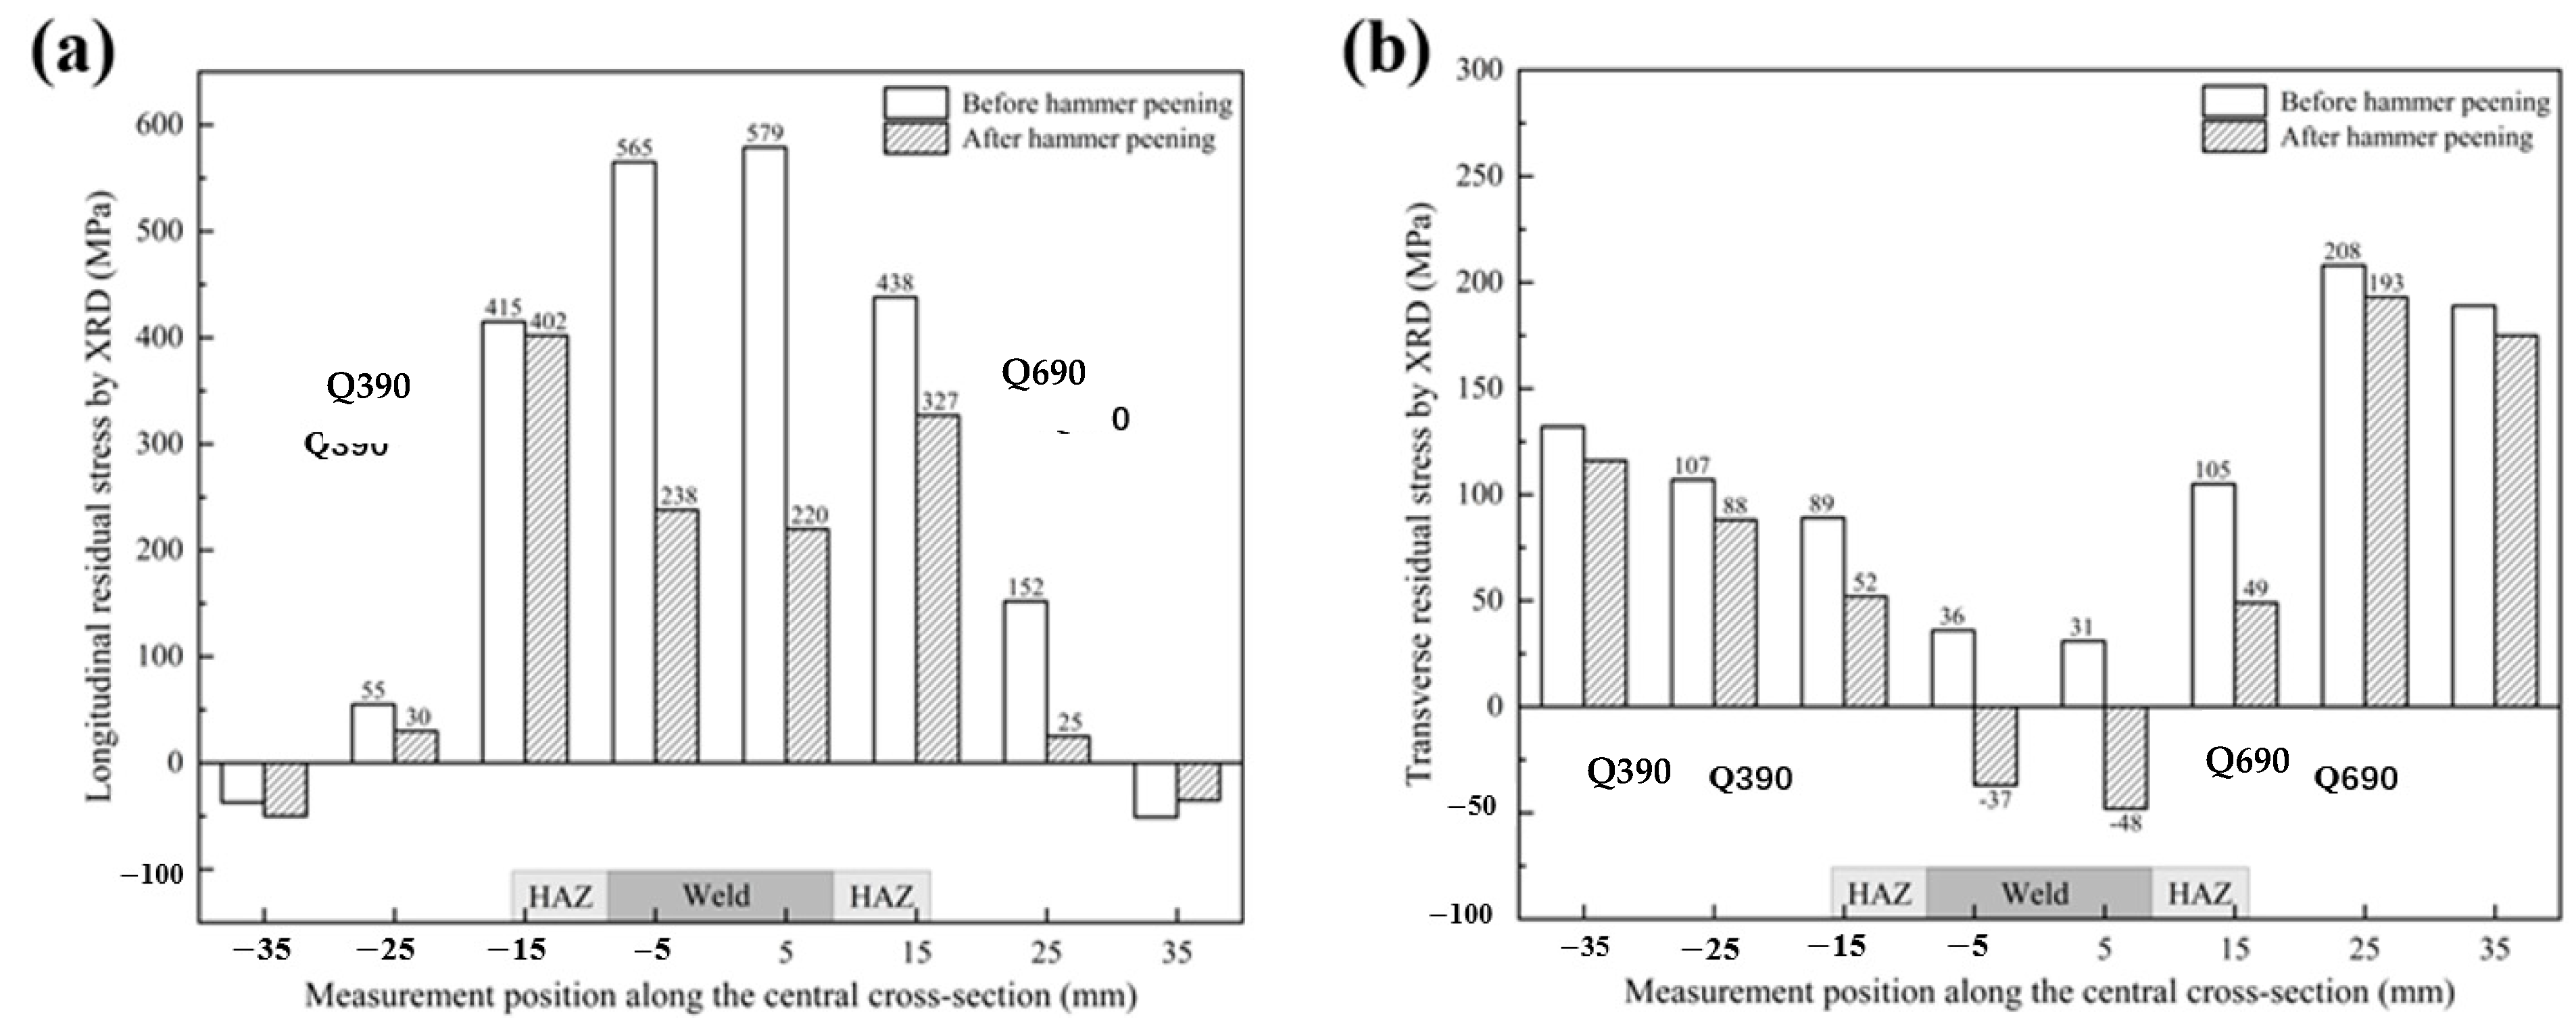
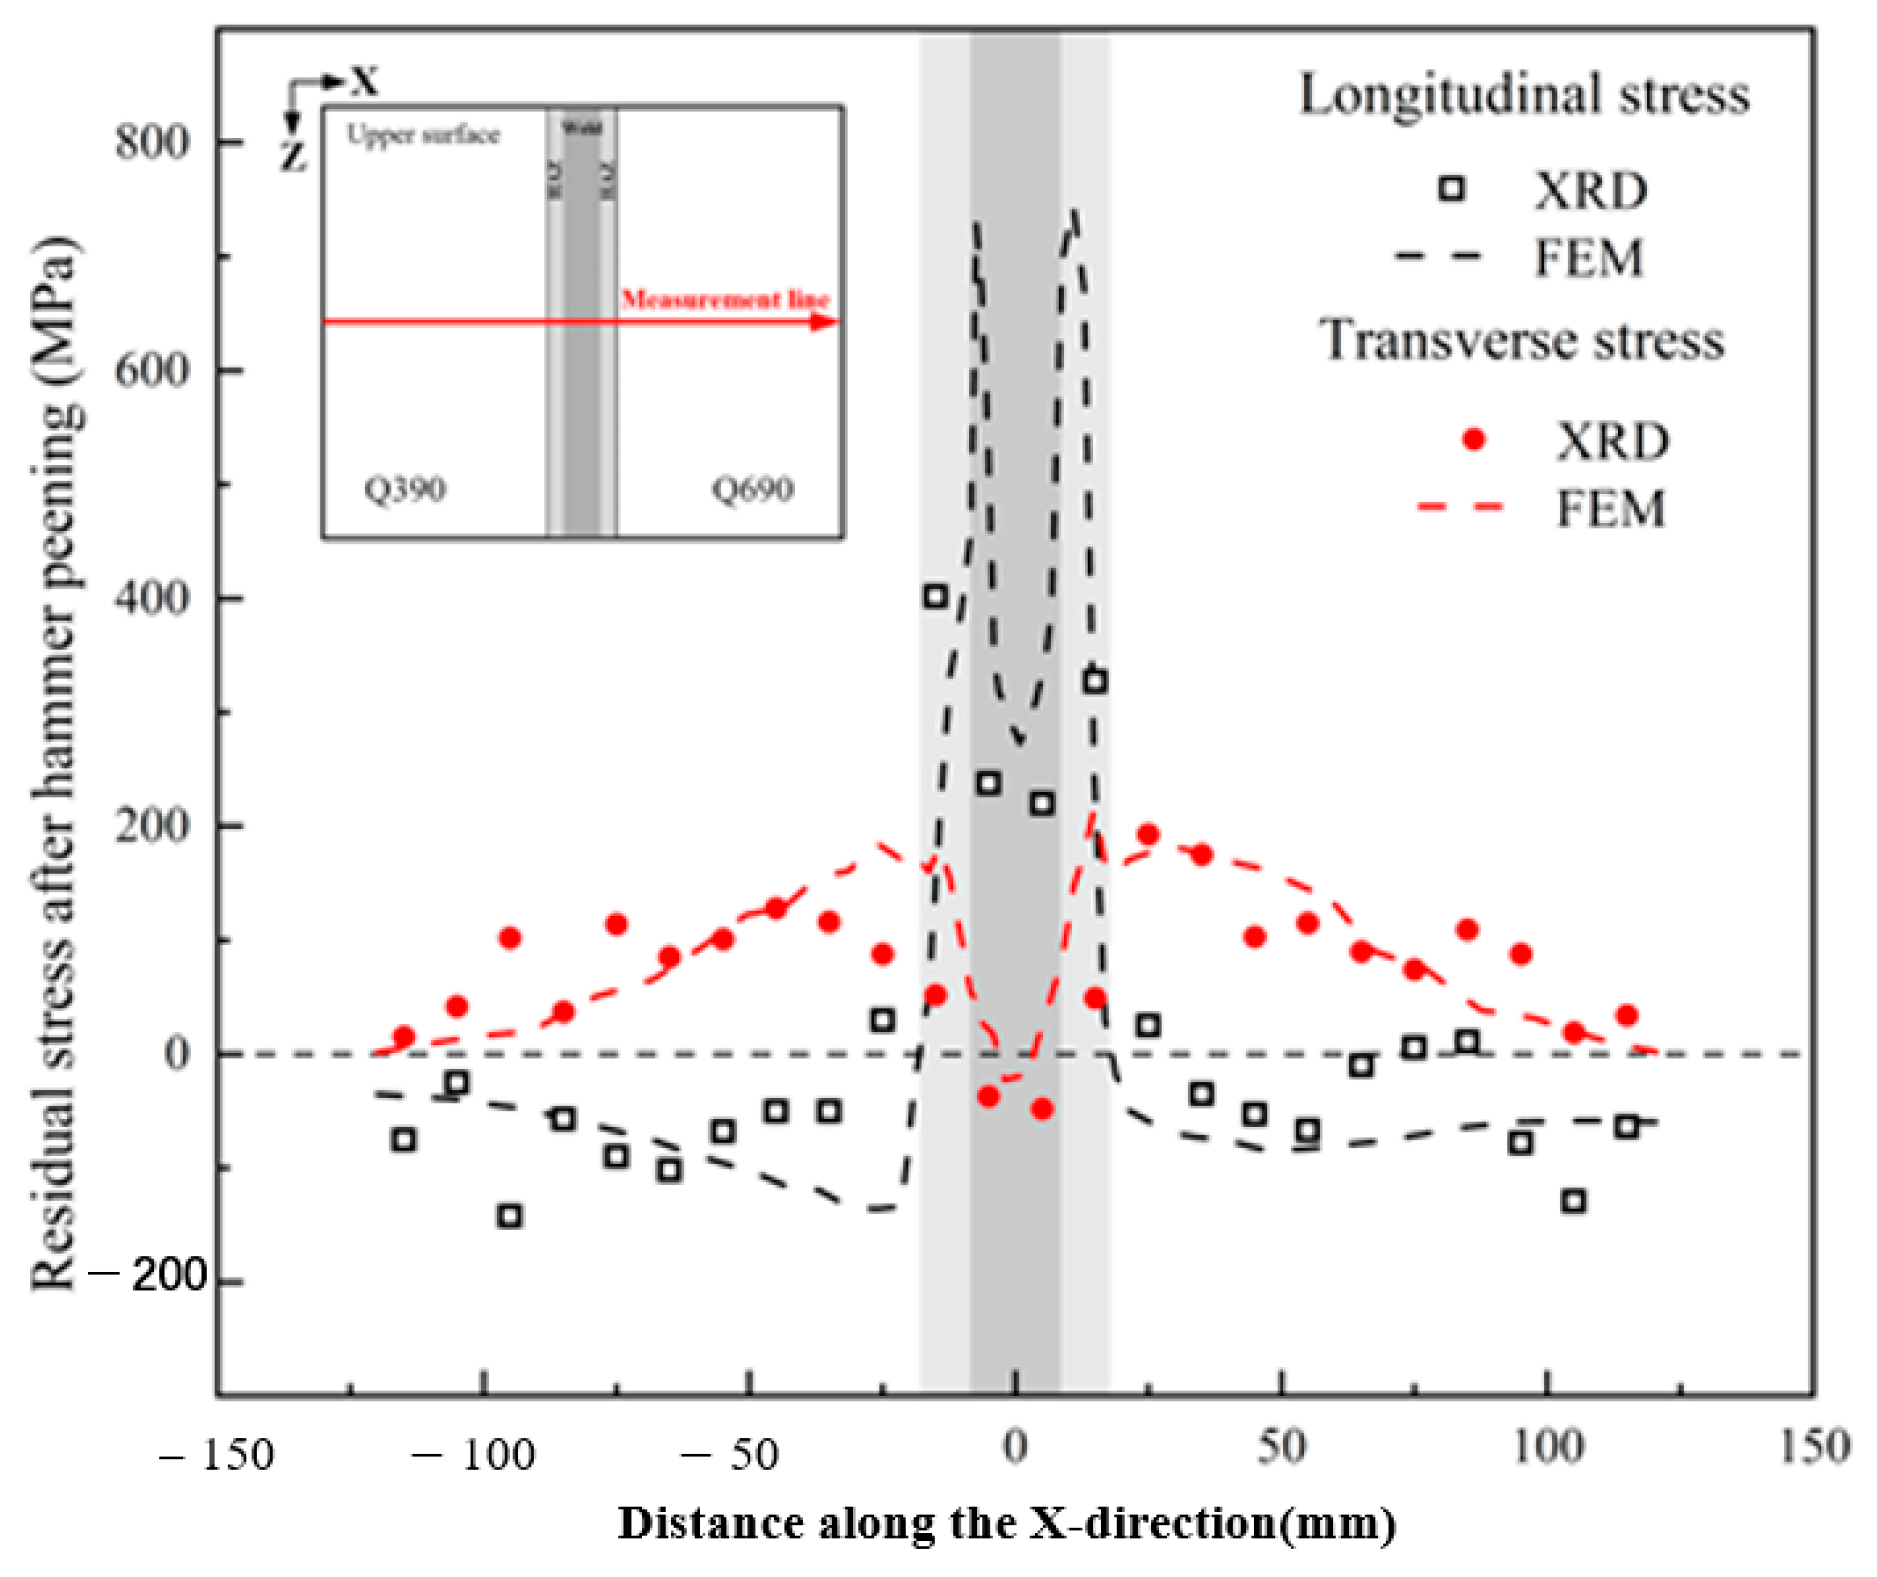
Using the pneumatic hammer peening machine, the weld seam and the HAZ were hammered according to the set process parameters proposed in Section 2.3. Subsequently, longitudinal and transverse residual stresses were measured again using XRD along the measurement line shown in Figure 8. A comparison and analysis of the stress changes before and after the peening treatment are shown in Figure 11. The directional and localized hammering treatment carried out on the weld seam and some HAZs significantly decreased the stress in the weld seam, heat-affected zones, and their surrounding areas, leading to the emergence of beneficial compressive stress. In terms of longitudinal stress, the measurement points in the weld area exhibited a significant reduction in stress, with the maximum reduction rate being approximately 62%. In this study, the reduction rate was defined as the ratio of the change amount to the original stress value. However, the reduction in tensile stress in the heat-affected zone is not significant. Two main causes are considered. The first cause is that in the vicinity of the center of the impact point, the plastic deformation caused by the impact treatment on the two steel plates decreases as the distance increases. The second cause is that the plastic flow characteristics of the material in the welding area result in tensile stress at the toe of the weld, which, to some extent, offsets the strain energy generated by the hammering [15]. As for the transverse stress, its stress state changes from low tensile stress to compressive stress. Studies have shown that residual compressive stress is beneficial for reducing corrosion, improving fatigue resistance, and enhancing the stiffness of the structure [17]. The tensile stress in the HAZ is released during the hammering treatment process, as this process counteracts the tensile strain caused by the initial lateral contraction. The FEM based on the hammering strengthening model yields satisfactory prediction results (Figure 12), which can offer reliable continuous stress evolution curves to evaluate the effect of the hammering treatment and its process parameters in eliminating residual stress.
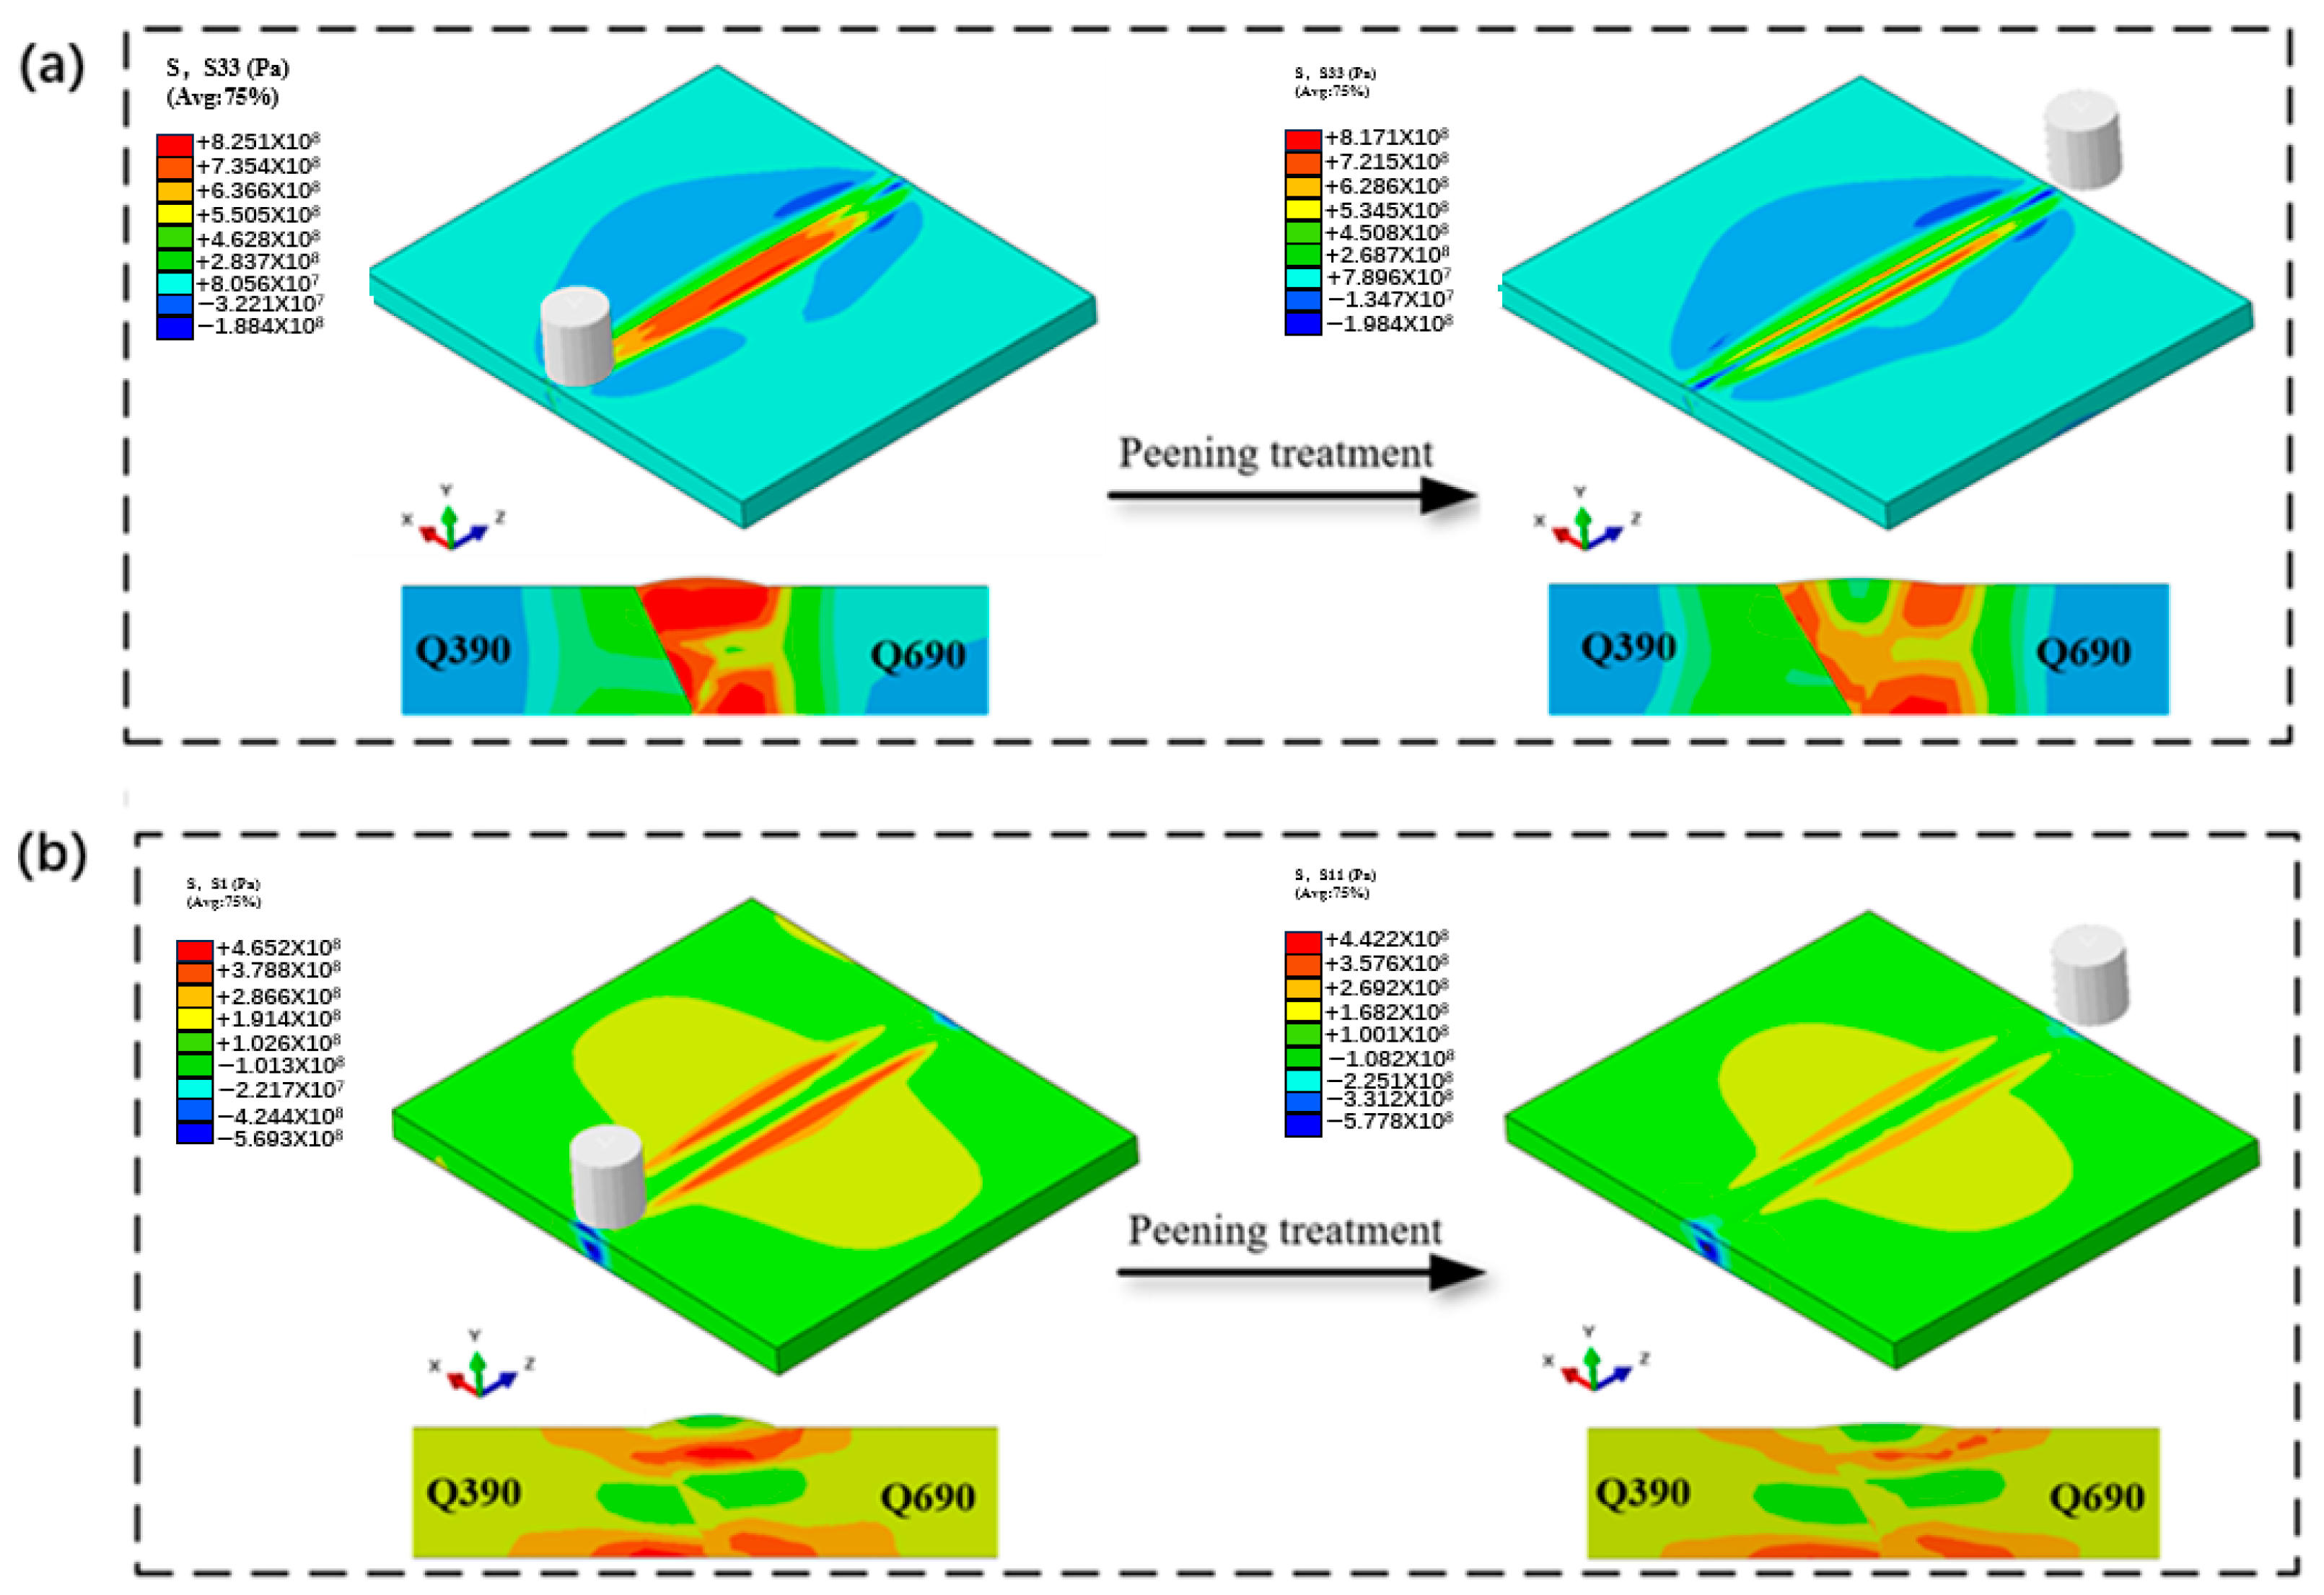
The stress distribution map obtained through the finite element method clearly demonstrates the outstanding effect of the hammering strengthening technique in eliminating residual stress after welding. This effect is particularly evident in the upper surface area, as shown in Figure 13. In addition to the quantitative analysis of surface stress conducted using XRD, the finite element model also provides a simple and cost-effective solution for investigating the evolution pattern of internal stress under impact treatment. The comparison of longitudinal and transverse stress in the central part of the welded plate is shown in Figure 13. The longitudinal tensile stress zone in the central section was significantly reduced after hammer peening, with the effect extending from the surface to the mid-depth position, whereas the tensile stress at the bottom of the welded plate did not change significantly. As for transverse stress, stress elimination is mainly in the HAZ on both sides, and the initial tensile stress distributed in the weld is converted into compressive stress at a certain depth. Due to the differences in yield strength, the stress relief effect of the Q390 steel side is superior to that of the Q690 steel side at a certain depth within the entire cross-sectional range in terms of the degree of stress relief and the peak value of the residual stress after treatment. The higher residual stress on the Q690 steel side should be a primary focus during the subsequent service of weldments.

4.4. Effect of Peening Velocity

Impact energy is the most important indicator for determining the outcome of hammering strengthening treatment [29]. The output of hammering energy depends on various process parameters, such as the actual hammering velocity, hammer head mass, and hammer head diameter. Based on the characteristics of the experimental machine designed by our team and the finite element hammering model, we studied and discussed the effects of process parameters, including hammering velocity, hammer head diameter, and spacing distance, on the elimination of residual stress.
Under the simulation parameter setting of a 20 mm hammer head diameter and a 15 mm pitch distance, the weld zone is hammered at velocities of 2.5 m/s, 3.5 m/s, 4.5 m/s, and 5.5 m/s along the welding direction. The stress variation on the upper surface is presented through the evaluation curve extracted from the weld centerline. The results are shown in Figure 14. Compared with the initial residual stress states post-welding, the longitudinal and transverse residual stresses are continuously reduced as the peening velocity increases, except for relatively low reduction at both ends. The longitudinal stress on the surface is completely transformed into compressive stress within the weld area when the peening velocity is greater than 3.5m/s. As the velocity continues to increase, the limit of processing hardening caused by the impact shifts towards the direction of compressive stress. Due to the effect of the isotropic hardening mechanism, at the corresponding peening velocity, the stress level of the transverse stress, which was initially in a compressive state, remains consistent with the longitudinal component. Since the overlapping of stamping processes leads to stress superposition and results in a significant reduction in stress, the stress curve exhibits a jagged fluctuation; that is, the greater plastic elongation can counteract the tensile residual strain in the overlapping area, and this counteracting effect varies between the overlapping area and the non-overlapping area [54].
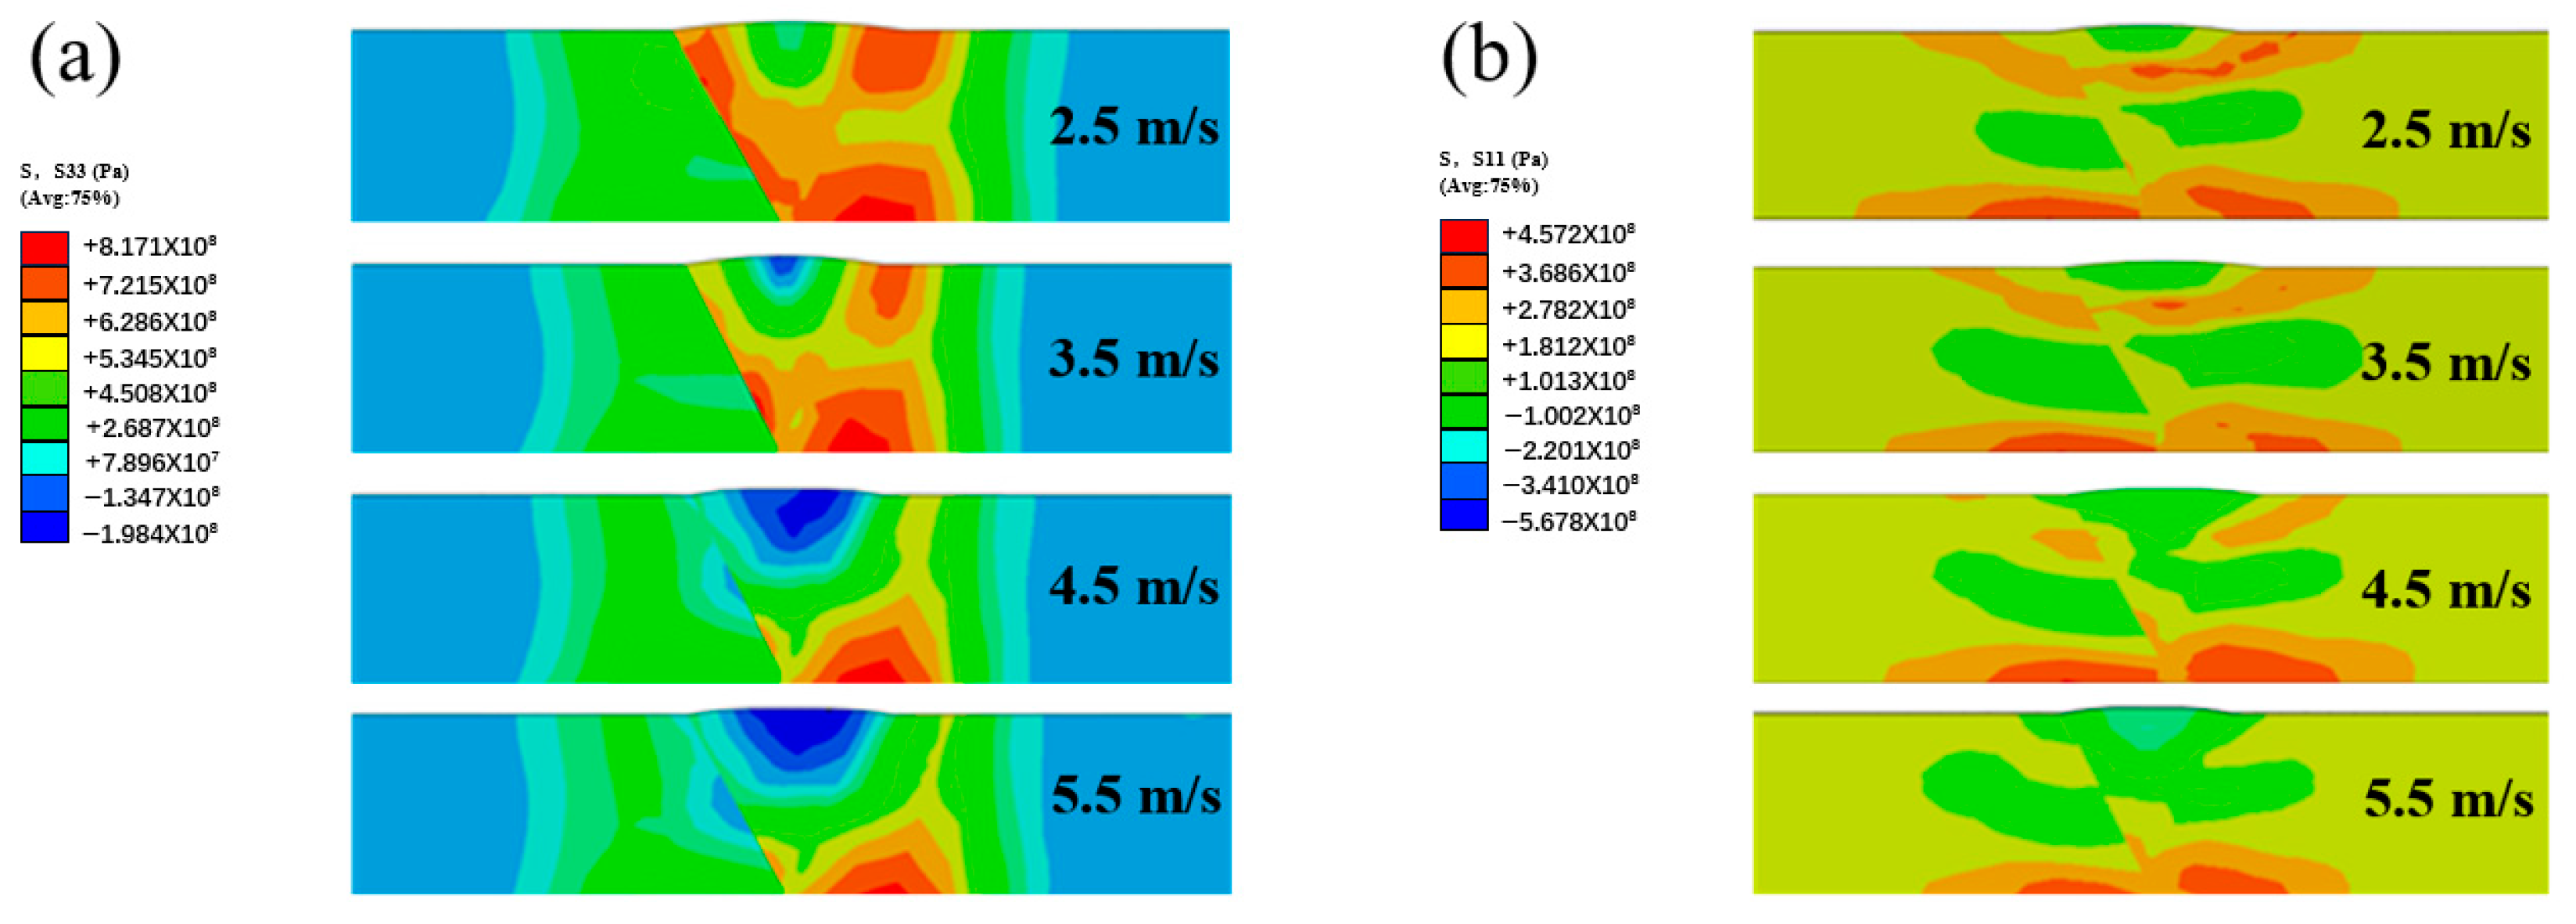
The internal stress variations in the center cross-section of the plate are shown in Figure 15. In terms of longitudinal stress, as the peening velocity increases, the range of compressive stresses gradually expands and eventually covers about half the thickness of the WM. Meanwhile, the high stress in weld toes on both sides is significantly reduced, and the stress elimination effect of the HAZ on the Q390 side is higher than that on the Q690 side. High stress was concentrated at the bottom HAZ on the Q690 steel side at a velocity of 5.5 m/s.
The transverse tensile stress area at the upper part of the weld gradually decreases and disappears as the velocity increases. In contrast, the tensile stress accumulates only at the bottom of the weld. This study has shown that a higher peening velocity can effectively promote the formation of compressed structures and eliminate tensile stress. Considering that overload velocity is more likely to cause mechanical stress and corrosion cracks, this research suggests that a blasting velocity of 4.5–5.5 m per second should be included in the optimal parameter selection range. When the hammering velocity changes from 2.5 m/s to 5.5 m/s, the average change values of the longitudinal and transverse residual stresses are 224.6 megapascals and 55.6 megapascals, respectively.

4.5. Effect of Hammer Head Diameter

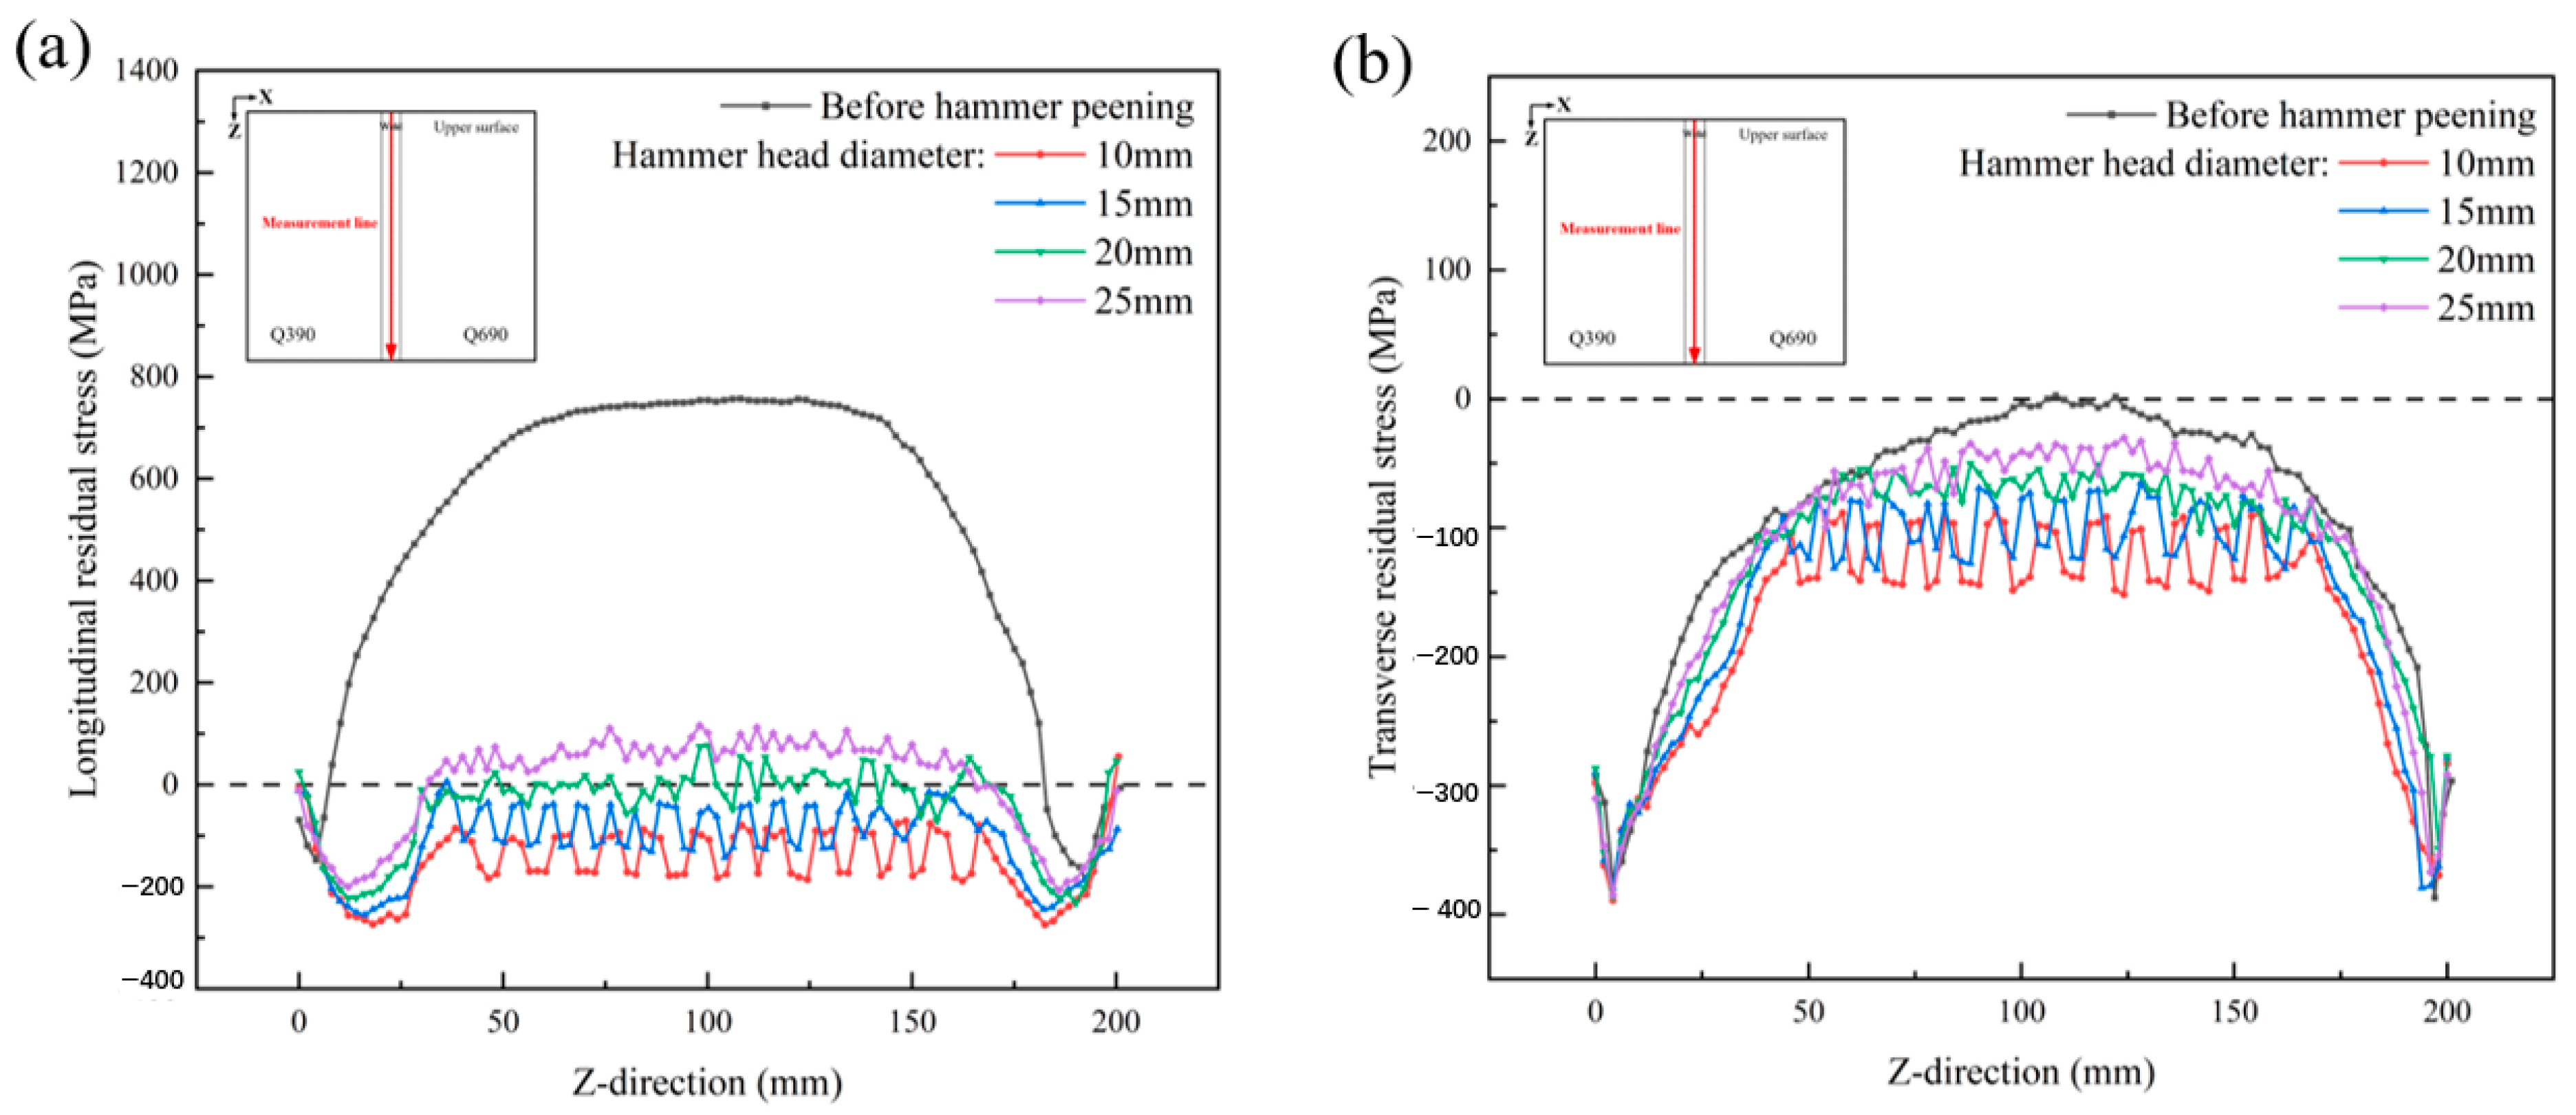
The hammer head diameter determines the area of peening and the single impact energy density. In FEM, the diameters of the cylindrical hammer heads were selected as 10 mm, 15 mm, 20 mm, and 25 mm, while other process parameters were set as follows: pitch spacing of 15 mm and hammering velocity of 3.5 m/s. The weld stress evolution curve shown in Figure 16 exhibits a jagged distribution for the same reason as explained in Section 4.4. When the weld diameter is less than 25 mm, the longitudinal stress on the weld begins to transform into compressive stress. As the diameter of the hammer head decreases, the residual stress on the weld gradually decreases, and the top and bottom of the sawtooth curve change from point-like to smooth, resulting in a step-like change. The reduction in the diameter of the hammer head is equivalent to an increase in the impact energy density, enhancing the plastic ductility of the weld and leading to the aforementioned changes.
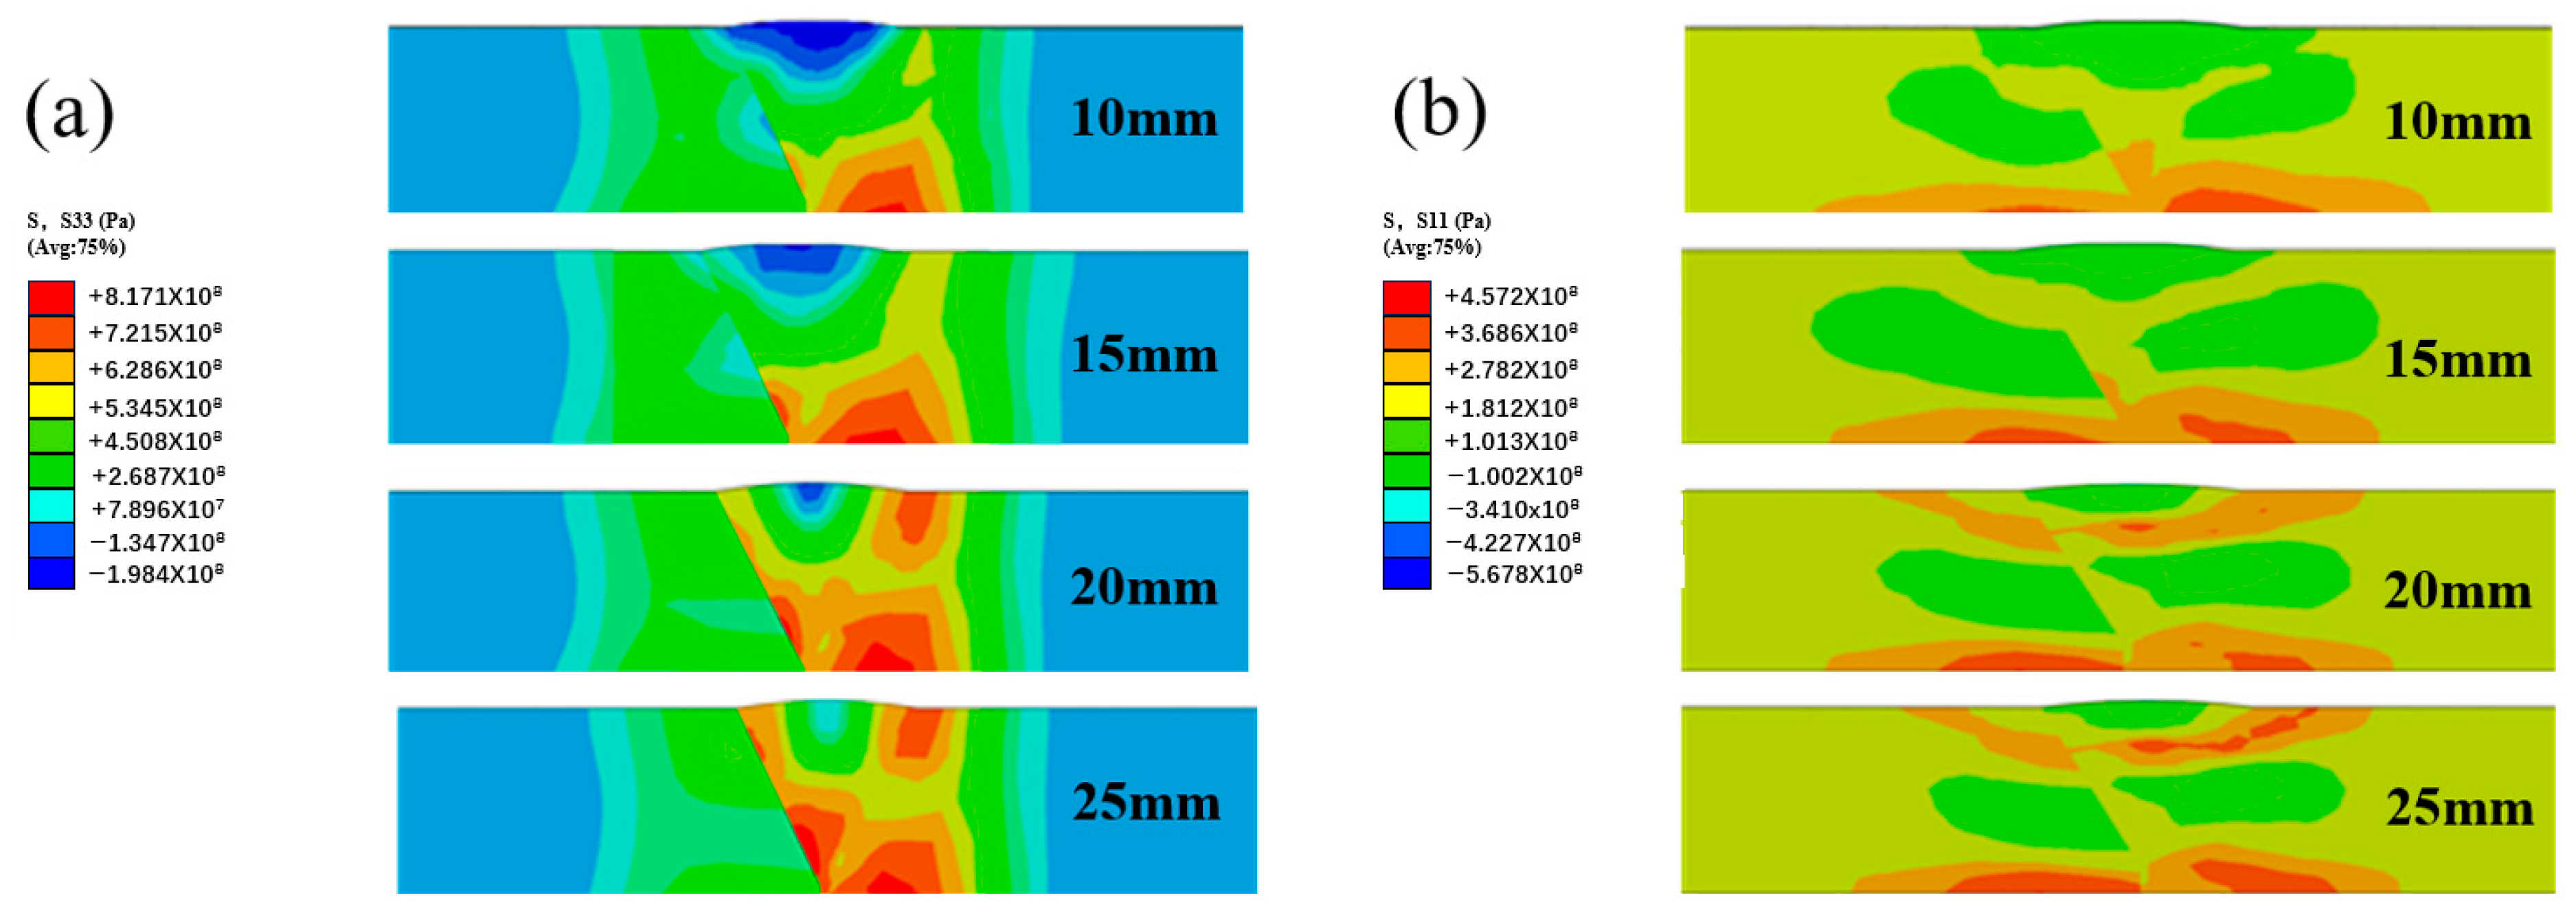
As shown in Figure 17, the effect of different head diameters on the release of tensile stress does not seem as significant as that caused by the change in hammering velocity. As the diameter of the hammer head decreases, the tensile stress of the longitudinal and transverse components in the weld toe and the HAZ gradually decreases, while the compressive stress area continuously expands outward from the weld surface at a certain weld depth. Overall, compared with the results on the Q690 steel side, the decrease in tensile stress on the Q390 steel side was more significant. The average stress values calculated by the FEM indicate that, other parameters remaining constant, the average changes in longitudinal and transverse residual stresses are 146.1 MPa and 28.1 MPa, respectively, within the diameter range from 25 mm to 10 mm. Due to the overly large hammer head diameter, which is not conducive to eliminating residual stress, and a too small diameter that produces stress concentration, resulting in mechanical damage, the range 10–15 mm can be regarded as the appropriate parameter.

4.6. Effect of Pitch Distance

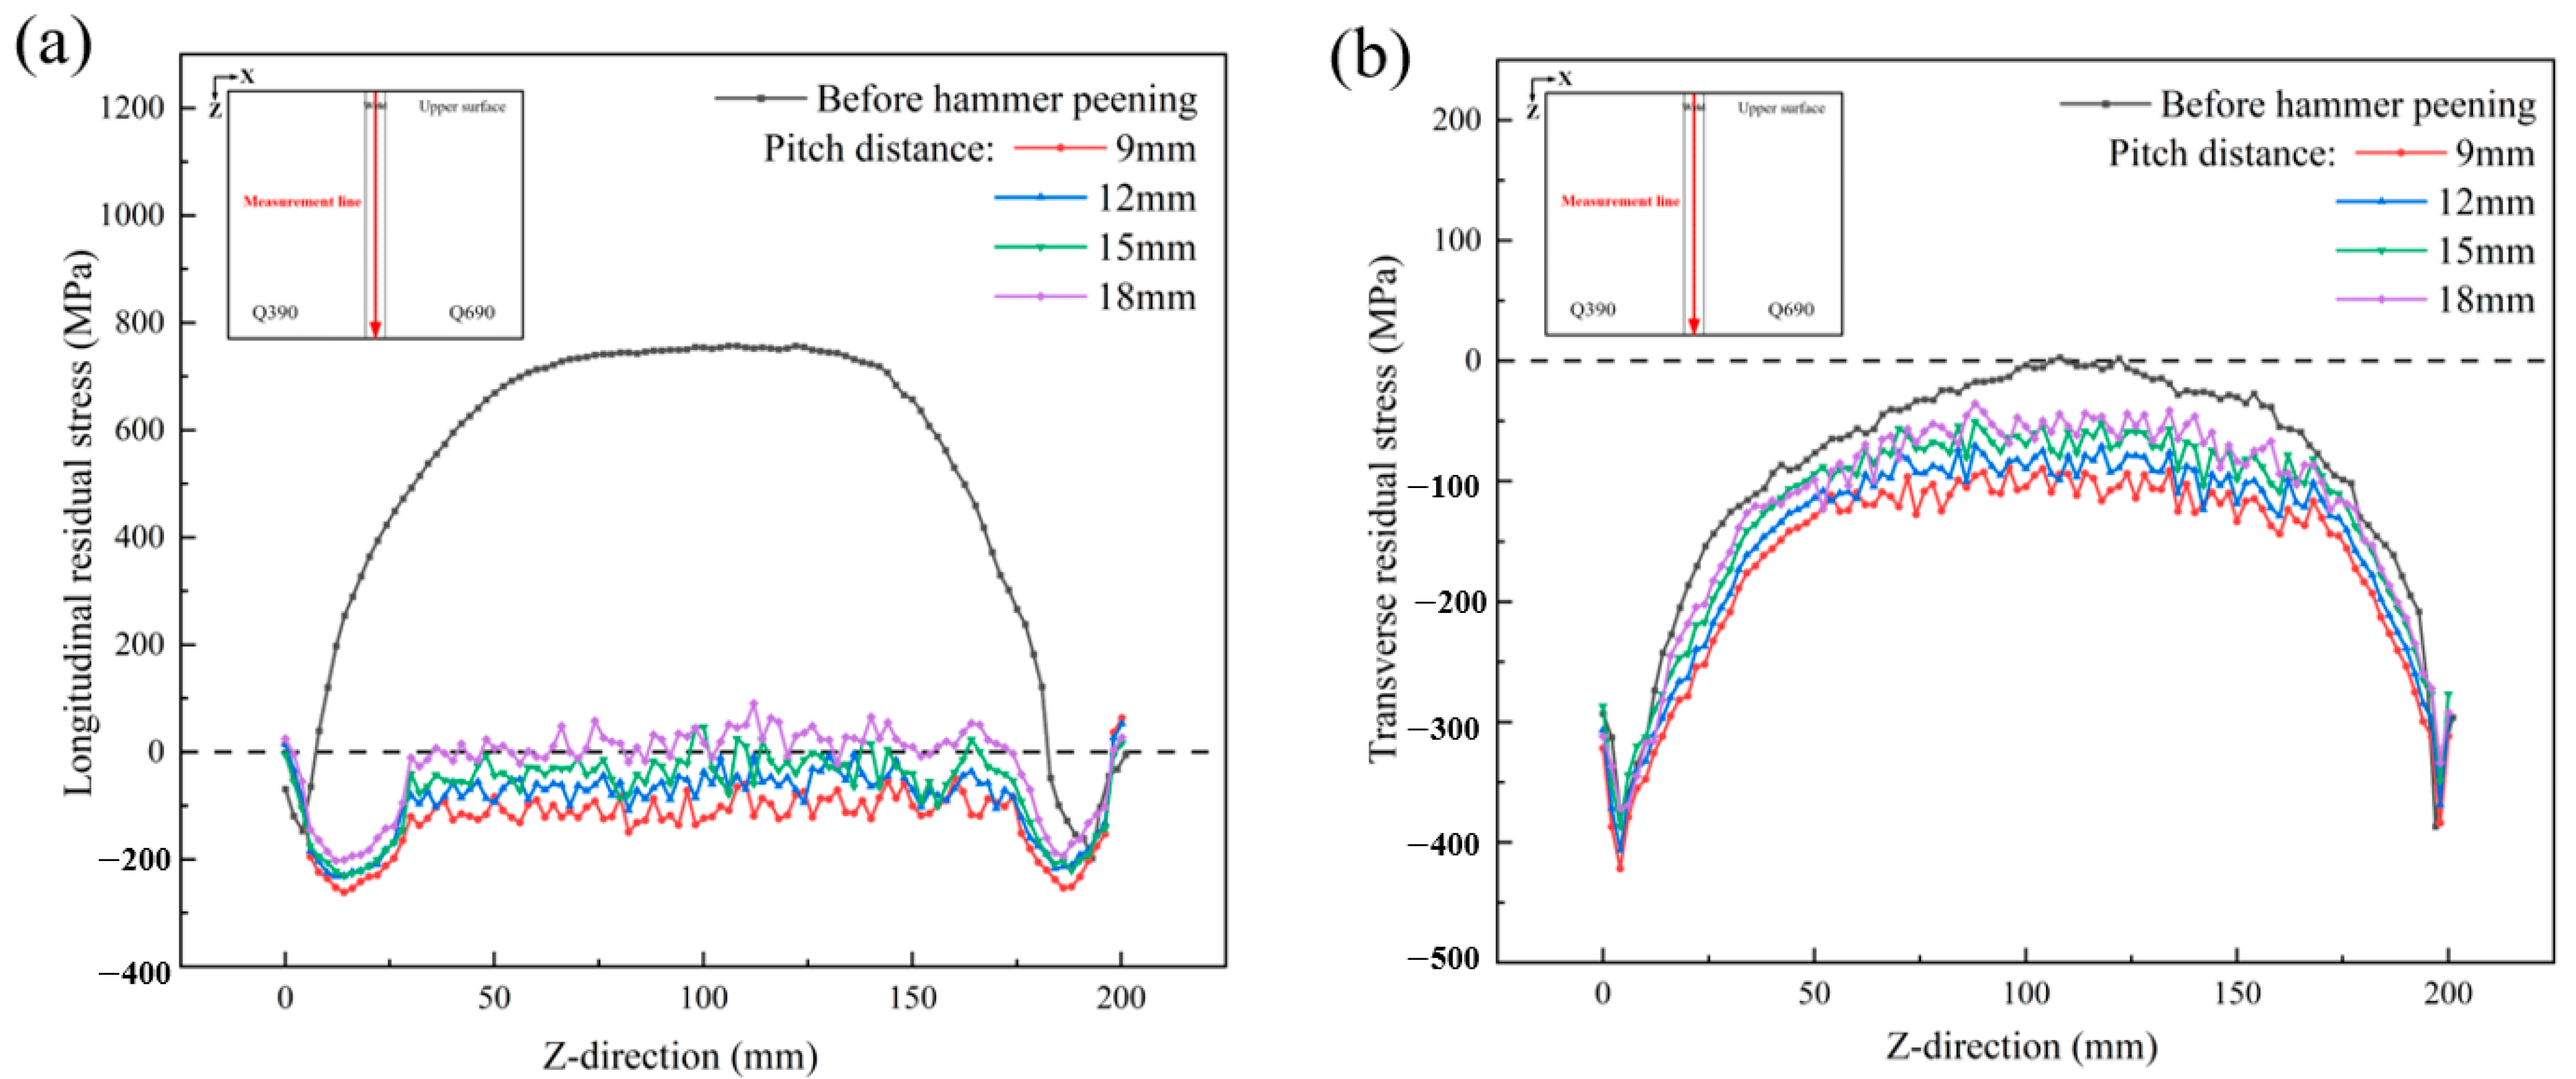
The pitch distance, i.e., indentation spacing, plays an important role in simplifying effective overlap and enhancing peening efficiency. As shown in Figure 18, the stress evolution curve continues to display a sawtooth shape. Based on the degree of decline, when the pitch distance is set to 18 mm, 15 mm, 12 mm, and 9 mm (and other parameters remain unchanged), the average stress values are −10 MPa, −50 MPa, −90 MPa, and – 130 MPa, respectively. This demonstrates that every 3 mm reduction in pitch distance corresponds to a decrease of 40 MPa in average stress; the same is true for transverse stress. The linearized relationship between stress variation and pitch distance originates from the peening overlap effect.
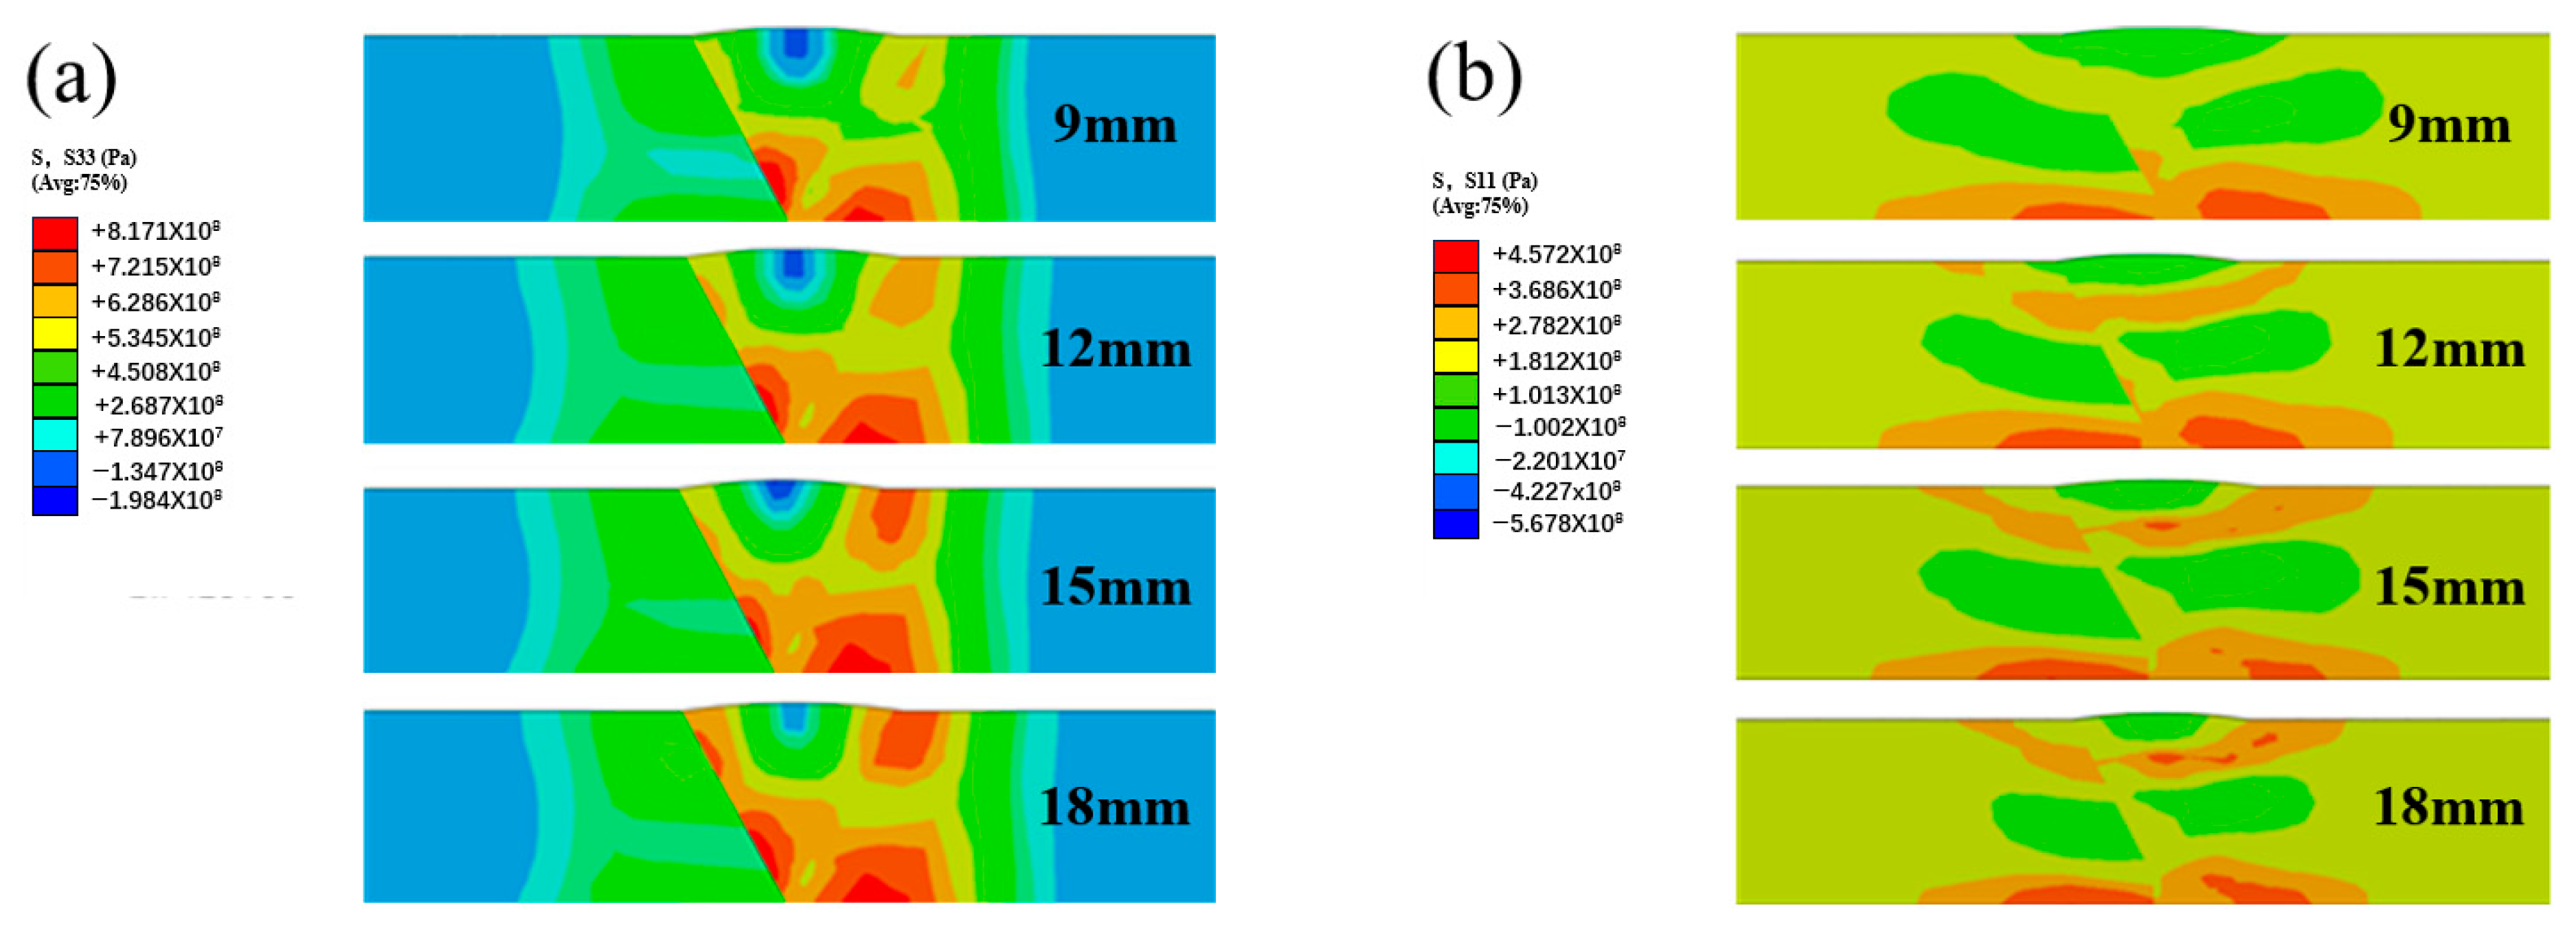
As shown in Figure 19, under different pitch distances, the stress variation characteristics of the weld zone and the heat-affected zone in the central cross-section are the same as those of the previous two parameters. However, evaluation of the longitudinal and transverse components shows that the range of the compressive stress zone and the degree of elimination of high tensile stress are not significant.

5. Conclusions

In this work, a combination of experimental and FEM investigations was used to ascertain the distribution of residual stress and the effect of controlling hammer peening on Q390 and Q690 steels DWJs. The main conclusions are summarized as follows:
  • The results of the finite element analysis are consistent with the measurements obtained using XRD, and the validity of the finite element model is fully verified.
  • The residual stress in longitudinal and transverse components is mainly tensile. Lateral residual stress, on the other hand, exhibits the opposite trend due to different cooling shrinkage effects. Overall, longitudinal residual stresses dominate in welds and heat-affected zones. The difference in strength results in different equivalent stress gradients on both sides of the fusion zone.
  • After hammering treatment, the residual stress in the welding area is significantly reduced, with a maximum elimination rate of about 62%. The finite element analysis results indicate that hammering technology has significant effects on controlling residual stresses after welding.
  • When the hammering speed and pitch are fixed, the change in the hammering diameter results in the most significant change in residual stress after hammering treatment.

Author Contributions

Conceptualization, Z.H. and L.L.; methodology, Z.H.; software, J.H.; validation, Z.H., J.H., and L.L.; formal analysis, E.S.; investigation, Z.H. and L.L.; resources, L.L.; data curation, Y.C.; writing—original draft preparation, E.S.; writing—review and editing, Z.H.; visualization, Y.C.; supervision, Z.H.; project administration, L.L. All authors have read and agreed to the published version of the manuscript.

Funding

This research received no external funding.

Data Availability Statement

The original contributions presented in this study are included in the article. Further inquiries can be directed to the corresponding author.

Conflicts of Interest

The authors declare no conflicts of interest.

References

  1. Li, X.H. New Low Alloy High Strength Steel Welding Procedure Evaluation. Key Eng. Mater. 2019, 814, 238–241. [Google Scholar] [CrossRef]
  2. Liu, J.-Z.; Chen, S.; Chan, T.-M. Experimental and numerical investigations of hybrid high strength steel welded T-section stub columns with Q690 flange and Q460 web. Thin-Walled Struct. 2022, 177, 65–89. [Google Scholar] [CrossRef]
  3. Chen, Q.; Yang, J.; Liu, X.; Tang, J.; Huang, B. Effect of the groove type when considering a thermometallurgical-mechanical model of the welding residual stress and deformation in an S355JR-316L dissimilar welded joint. J. Manuf. Process. 2019, 45, 290–303. [Google Scholar] [CrossRef]
  4. Zhang, K.; Dong, W.; Lu, S. Finite element and experiment analysis of welding residual stress in S355J2 steel considering the bainite transformation. J. Manuf. Process. 2021, 62, 80–89. [Google Scholar] [CrossRef]
  5. Yan, R.; Yu, Z.; Wang, S.; Liu, J. Influence of welding residual stress on bending resistance of hollow spherical joints. J. Constr. Steel Res. 2023, 208, 108004. [Google Scholar] [CrossRef]
  6. Luo, Y.; Gu, W.; Peng, W.; Jin, Q.; Qin, Q.; Yi, C. A Study on Microstructure, Residual Stresses and Stress Corrosion Cracking of Repair Welding on 304 Stainless Steel: Part I-Effects of Heat Input. Materials 2020, 13, 2416. [Google Scholar] [CrossRef]
  7. Webster, G.A.; Ezeilo, A.N. Residual stress distributions and their influence on fatigue lifetimes. Int. J. Fatigue 2001, 23, 375–383. [Google Scholar] [CrossRef]
  8. Zhang, W.; Jiang, W.; Zhao, X.; Tu, S.-T. Fatigue life of a dissimilar welded joint considering the weld residual stress: Experimental and finite element simulation. Int. J. Fatigue 2018, 109, 182–190. [Google Scholar] [CrossRef]
  9. Guo, J.; Fu, H.; Pan, B.; Kang, R. Recent progress of residual stress measurement methods: A review. Chin. J. Aeronaut. 2021, 34, 54–78. [Google Scholar] [CrossRef]
  10. Lee, C.-H.; Chang, K.-H. Temperature fields and residual stress distributions in dissimilar steel butt welds between carbon and stainless steels. Appl. Therm. Eng. 2012, 45–46, 33–41. [Google Scholar] [CrossRef]
  11. Bajpei, T.; Chelladurai, H.; Ansari, M.Z. Experimental investigation and numerical analyses of residual stresses and distortions in GMA welding of thin dissimilar AA5052-AA6061 plates. J. Manuf. Process. 2017, 25, 340–350. [Google Scholar] [CrossRef]
  12. Ranjbarnodeh, E.; Serajzadeh, S.; Kokabi, A.H.; Fischer, A. Effect of welding parameters on residual stresses in dissimilar joint of stainless steel to carbon steel. J. Mater. Sci. 2011, 46, 3225–3232. [Google Scholar] [CrossRef]
  13. Lee, C.; Chang, K. Numerical investigation of the residual stresses in strength-mismatched dissimilar steel butt welds. J. Strain Anal. Eng. Des. 2008, 43, 55–66. [Google Scholar] [CrossRef]
  14. Coules, H.E. Contemporary approaches to reducing weld induced residual stress. Mater. Sci. Technol. 2013, 29, 75–86. [Google Scholar] [CrossRef]
  15. Quan, G.; Shi, R.; Liu, Q.; Zhao, J.; Zhou, J.; Wang, Y. Analysis and elimination of residual stress in arc fuse single layer and single channel volume. Mater. Rev. 2020, 34, 1–15. (In Chinese) [Google Scholar]
  16. Miki, C.; Tai, M. Fatigue strength improvement by hammer peening treatment—Verification from plastic deformation, residual stress, and fatigue crack propagation rate. Weld. World 2014, 58, 307–318. [Google Scholar] [CrossRef]
  17. Curtat, J.L.; Lanteigne, J.; Champliaud, H.; Liu, Z.; Lévesque, J.-B. Influence of hammer peening on fatigue life of E309L steel used for 13%Cr-4%Ni blade runner repairs. Int. J. Fatigue 2017, 100, 68–77. [Google Scholar] [CrossRef]
  18. Simoneau, M.R.; Thibault, M.D.; Fihey, J.L. A comparison of residual stress in hammer-peened, multi-pass steel welds-A513 (S690Q) and S41500. Weld. World 2009, 53, 124–134. [Google Scholar] [CrossRef]
  19. Hacini, L.; Van Lê, N.; Bocher, P. Effect of impact energy on residual stresses induced by hammer peening of 304L plates. J. Mater. Process. Technol. 2008, 208, 542–548. [Google Scholar] [CrossRef]
  20. Chan, W.L.; Cheng, K.F. Hammer peening technology—The past, present, and future. Int J Adv Manuf Tech 2022, 118, 683–701. [Google Scholar] [CrossRef]
  21. GB/T3077-2015; Standard for Alloy Structure Steels. Standards Press of China: Beijing, China, 2015.
  22. Zhang, Y.T. Research on Organization Regulation and Mechanical Behavior of Q390/Q690 Dissimilar Welded Joints. Master’s Thesis, Northeastern University, Shenyang, China, 2021. [Google Scholar]
  23. Zhang, Y.; Lan, L.; Shao, G. Influence of Strength Mismatch on Microstructural Evolution and Mechanical Behaviors for Q390/Q690 Ferritic Steel Dissimilar Welded Joints. Steel Res. Int. 2022, 93, 2100592. [Google Scholar] [CrossRef]
  24. GB/T 985.1-2008; Standard for Recommended Bevels for Gas Welding, Electrode Arc Welding, Gas Shielded Welding and High Energy Beam Welding. Standards Press of China: Beijing, China, 2019.
  25. Sattari-Far, I.; Farahani, M.R. Effect of the weld groove shape and pass number on residual stresses in butt-welded pipes. Int. J. Press. Vessel. Pip. 2009, 86, 723–731. [Google Scholar] [CrossRef]
  26. Jiang, B.; Li, Z.; Chen, Q. Influence of bevel angle on the welding-induced residual stress and distortion based on a thermometallurgical-mechanical model in a Q345-316L dissimilar butt welded joint. J. Adhes. Sci. Technol. 2021, 35, 2249–2273. [Google Scholar] [CrossRef]
  27. Schulze, V.; Bleicher, F.; Groche, P.; Guo, Y.B.; Pyun, Y.S. Surface modification by machine hammer peening and burnishing. CIRP Ann. Manuf. Technol. 2016, 65, 809–832. [Google Scholar] [CrossRef]
  28. Lan, L.; Niu, H.; Cui, Y.; Chen, X. Local shape adjustment and residual stresses of integrally stiffened panel induced by mechanical hammer peening. J. Manuf. Process. 2023, 91, 99–109. [Google Scholar] [CrossRef]
  29. Niu, H. Simulation and Experimental Study on Hammering and Deformation of High Reinforcement Monolithic Wall Plate in Grid Format. Master’s Thesis, Northeastern University, Shenyang, China, 2022. [Google Scholar]
  30. Lin, J.; Ma, N.; Lei, Y.; Murakawa, H. Measurement of residual stress in arc welded lap joints by cosα X-ray diffraction method. J. Mater. Process. Technol. 2016, 243, 387–394. [Google Scholar] [CrossRef]
  31. GB/T 7704-2017; Standard for the Determination Method of Non-Destructive Testing X-Ray Stress. Standards Press of China: Beijing, China, 2017.
  32. Atluri, S.N. Finite element-perturbation analysis of nonlinear dynamic response of elastic continua. Finite Elem. Methods Eng. 2023, 11, 581–595. [Google Scholar]
  33. Wang, F.J. Contact force algorithm in explicit transient analysis using finite-element method. Finite Elem. Anal. Des. 2007, 43, 580–587. [Google Scholar] [CrossRef]
  34. Meena, P.; Anant, R. On the Interaction to Thermal Cycle Curve and Numerous Theories of Failure Criteria for Weld-Induced Residual Stresses in AISI304 Steel using Element Birth and Death Technique. J. Mater. Eng. Performance 2024, 33, 2024–2279. [Google Scholar] [CrossRef]
  35. Qiang, X.H.; Bijlaard, F.; Kolstein, H. Dependence of mechanical properties of high strength steel S690 on elevated temperatures. Constr. Build. Mater. 2012, 30, 73–79. [Google Scholar] [CrossRef]
  36. Xu, Q.F. Deterioration of mechanical properties of high strength structural steel S460N under steady state fire condition. Mater. Des. 2012, 100, 116–122. [Google Scholar]
  37. Mehran, G.; Joseph, A.; Juho, M.; Timo, B.; Jari, L. Finite element simulation of welding distortions in ultra-high strength steel S960 MC including comprehensive thermal and solid-state phase transformation models. Eng. Struct. 2020, 219, 110804. [Google Scholar]
  38. Chang, K.-H.; Lee, C.-H.; Park, K.-T.; Um, T.-H. Experimental and numerical investigations on residual stresses in a multi-pass butt-welded high strength SM570-TMCP steel plate. Int. J. Steel Struct. 2011, 11, 315–324. [Google Scholar] [CrossRef]
  39. Taljat, B.; Radhakrishnan, B.; Zacharia, T. Numerical analysis of GTA welding process with emphasis on post-solidification phase transformation effects on residual stresses. Mater. Sci. Eng. A 1998, 246, 45–54. [Google Scholar] [CrossRef]
  40. Incropera, F.; Dewitt, D.; Bergman, T.; Lavine, A. Fundamentals of Heat and Mass Transfer; John Wiley & Sons Inc.: Chichester, UK, 2007; Volume 71–72, pp. 571–583. [Google Scholar]
  41. Deng, D.; Kiyoshima, S. Numerical simulation of welding temperature field, residual stress and deformation induced by electro slag welding. Comp. Mater. Sci. 2012, 62, 23–24. [Google Scholar] [CrossRef]
  42. Goldak, J.; Chakravarti, A.; Bibby, M. A new finite element model for welding heat sources. Metall. Trans. B 1984, 15, 299–305. [Google Scholar] [CrossRef]
  43. Cai, X.; Lin, S.; Cheng, Y.; Yang, D.; Yang, C.; Fan, C. The effects of double groove type on the backing weld penetration in swing arc vertical-up MAG welding. Weld. World 2019, 28, 75–86. [Google Scholar] [CrossRef]
  44. Taraphdar, P.K.; Mahapatra, M.M.; Pradhan, A.K.; Singh, P.K.; Sharma, K.; Kumar, S. Effects of groove configuration and buttering layer on the through-thickness residual stress distribution in dissimilar welds. Int. J. Press. Vessel. Pip. 2021, 192, 104392. [Google Scholar] [CrossRef]
  45. Zhu, H.; Zhang, C.; Chen, S.; Wu, J. A modified Johnson-Cook constitutive model for structural steel after cooling from high temperature. Constr. Build. Mater. 2022, 340, 127746. [Google Scholar] [CrossRef]
  46. Cadoni, E.; Forni, D. Strain-rate effects on S690QL high strength steel under tensile loading. J. Constr. Steel Res. 2020, 175, 106348. [Google Scholar] [CrossRef]
  47. Liu, Q.; Chen, S.; Xu, X.; Jin, S.; Li, Y.; Wang, Y.; Shen, B. Multi-objective optimization of the subsurface residual stress field of TC4 alloy in machine hammer peening. J. Manuf. Process. 2023, 104, 98–107. [Google Scholar] [CrossRef]
  48. Sun, J.; Nitschke-Pagel, T.; Dilger, K. Generation and distribution mechanism of welding-induced residual stresses. J. Mater. Res. Technol. 2023, 27, 3936–3954. [Google Scholar] [CrossRef]
  49. Ma, N.; Ueda, Y.; Murakawa, H. Welding Deformation and Residual Stress Prevention; Butterworth-Heinemann: Oxford, UK, 2012; Volume 46, pp. 169–207. [Google Scholar]
  50. Huang, B.; Liu, J.; Zhang, S.; Chen, Q.; Chen, L. Effect of post-weld heat treatment on the residual stress and deformation of 20/0Cr18Ni9 dissimilar metal welded joint by experiments and simulations. J. Mater. Res. Technol. 2020, 9, 6186–6200. [Google Scholar] [CrossRef]
  51. Cai, J.P.; Ye, Y.H.; Zhang, Y.J.; Deng, D. Effect of bevel form on residual stress and deformation in Q345/SUS304 dissimilar steel butt joints. J. Mech. Eng. 2015, 51, 7–13. [Google Scholar] [CrossRef]
  52. Zhu, S.-P.; Ye, W.-L.; Correia, J.A.F.O.; Jesus, A.M.P.; Wang, Q. Stress gradient effect in metal fatigue: Review and solutions. Theor. Appl. Fract. Mech. 2022, 121, 103513. [Google Scholar] [CrossRef]
  53. Gates, N.; Fatemi, A. Notch deformation and stress gradient effects in multiaxial fatigue. Theor. Appl. Fract. Mech. 2016, 84, 3–25. [Google Scholar] [CrossRef]
  54. Ma, G.; Zhang, L.; Wang, C.; Liu, X.; Meng, Q. Effect of Ultrasonic Impact Treatment on Residual Stress and Fatigue Properties of Q345 Welded Joints. IOP Conf. Ser. Mater. Sci. Eng. 2018, 452, 67–79. [Google Scholar] [CrossRef]
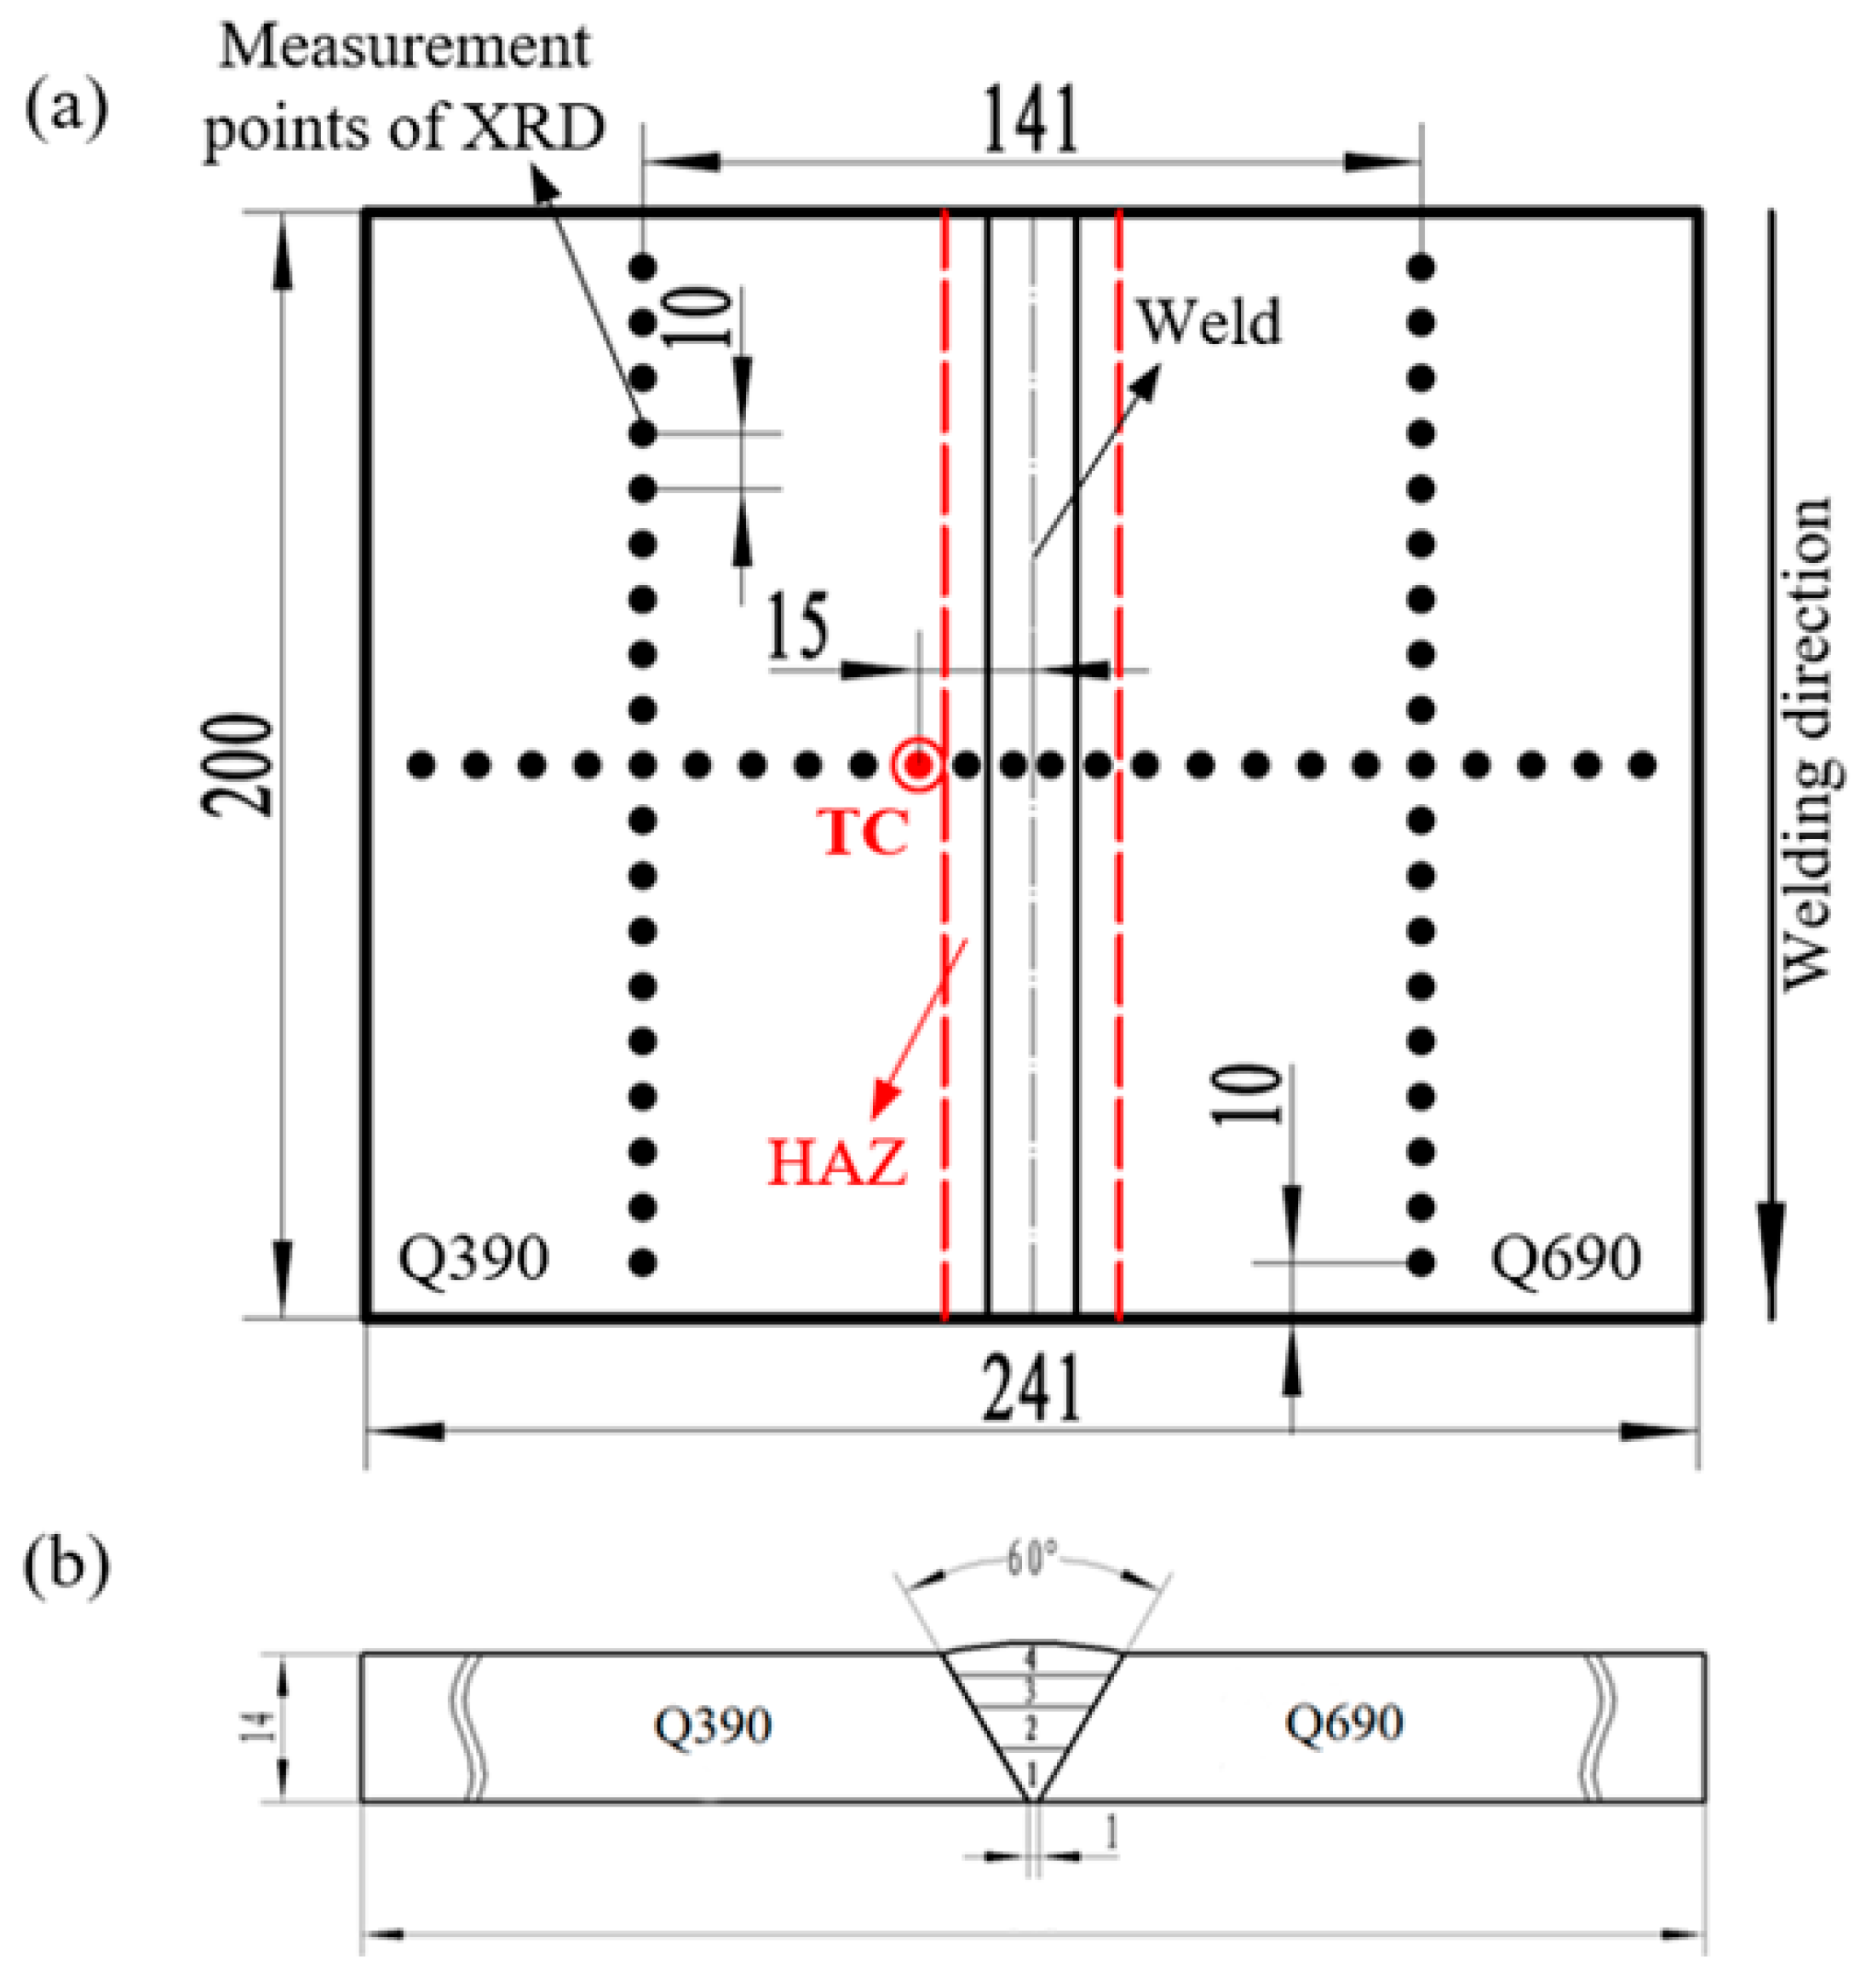
Figure 1. Actual specimen size and weldment layout: (a) dimensions of the actual specimen, weld position, and measurement locations of thermal cycles and XRD; (b) groove type and arrangements of weld passes.
Metals 15 00961 g001
Figure 2. The structure of a self-built pneumatic machine and the peening treatment process: (a) the actual structure of the mechanical peening system; (b) the hammer peening pattern for a single process.
Metals 15 00961 g002
Figure 3. The principle and result of XRD measurement: (a) the fundamental principle of XRD measurement based on the cosα method; (b) detection of the Debye ring; (c) position of the diffraction peak.
Metals 15 00961 g003
Figure 4. Simulation of welding behavior and the hammer peening treatment: (a) simulation of the MAG welding procedure; (b) simulation of the hammer peening treatment.
Metals 15 00961 g004
Figure 5. Temperature-dependent material properties: (a) curves of temperature-dependent material properties of Q390; (b) curves of temperature-dependent material properties of Q690.
Metals 15 00961 g005
Figure 6. Comparison of weld morphology and temperature curve: (a) comparison of weld pool geometry in the cross-section; (b) comparison of temperature curves of four thermal cycles.
Metals 15 00961 g006
Figure 7. Temperature differences: (a) temperature differences between Q390 and Q690 steel sides during thermal cycles; (b) temperature distribution differences between Q390 and Q690 steels in the continuous cooling stage.
Metals 15 00961 g007
Figure 8. Results of welding residual stress analysis: (a) longitudinal and transverse residual stress distribution measured by XRD and FEM on a specific measurement line; (b) the measurement line.
Metals 15 00961 g008
Figure 9. Longitudinal and transverse stress distributions measured by XRD and FEM: (a) longitudinal and transverse residual stress distribution in the Q390 side; (b) longitudinal and transverse residual stress distribution in the Q690 side.
Metals 15 00961 g009
Figure 10. Equivalent Mises stress distribution: (a) stress distribution on the upper surface; (b) stress distribution in the center cross-section; (c) variation of the stress gradient in the measurement line shown in (b).
Metals 15 00961 g010
Figure 11. Stress change before and after peening treatment: (a) longitudinal stress change before and after peening treatment; (b) transverse residual stress change before and after peening treatment.
Metals 15 00961 g011
Figure 12. Validation of FEM for hammer peening treatment.
Metals 15 00961 g012
Figure 13. The stress elimination effect in FEM under experimental parameters: (a) longitudinal stress elimination effect; (b) transverse stress elimination effect.
Metals 15 00961 g013
Figure 14. Stress variations at different peening velocities: (a) longitudinal stress variation at different peening velocities; (b) transverse residual stress variations at different peening velocities.
Metals 15 00961 g014
Figure 15. Internal stress variations in the center cross-section of the plate at different peening velocities: (a) internal longitudinal stress evolution; (b) transverse stress evolution.
Metals 15 00961 g015
Figure 16. Stress evolution curves with different hammer head diameters: (a) longitudinal stress evolution curves; (b) transverse residual stress variation curves.
Metals 15 00961 g016
Figure 17. Internal stress variations in the center cross-section of the plate at different hammer head diameters: (a) internal longitudinal stress evolution in the center cross-section; (b) transverse stress evolution in the center cross-section.
Metals 15 00961 g017
Figure 18. Stress evolution curves at different pitch distances: (a) longitudinal stress curves at different pitch distances; (b) transverse residual stress curves at different pitch distances.
Metals 15 00961 g018
Figure 19. Internal stress evolution in the center cross-section with different pitch distances: (a) longitudinal stress evolution in the center cross-section with different pitch distances; (b) transverse stress evolution in the center cross-section with different pitch distances.
Metals 15 00961 g019
Table 1. Chemical composition (wt%) of the BMs and wire.
MaterialCMoMnPSVNbNiCrTiSiCu
Q3900.1600.0081.3600.0120.0090.0390.0280.0100.01---
Q6900.1490.1151.2200.0190.0050.001--0.190.0150.24-
ER76-10.0900.5501.4000.0100.010--2.600.500.1000.20~0.550.25
Table 2. Mechanical properties of the BMs and wire.
MaterialYoung’s Modulus (GPa)Yield Strength (MPa) Tensile Strength (MPa)Elongation at Break (%)
Q39020242656132
Q69020277581917
ER76-1-≥660≥760≥15
Table 3. Welding parameters.
Groove TypeLayer No.Welding Current I/AWelding Voltage U/VWelding Velocity v (mm/s)Welding Heat Input Q (kJ/mm)
V-groove11502030.85
21802231.12
32002331.30
42202531.56
Disclaimer/Publisher’s Note: The statements, opinions and data contained in all publications are solely those of the individual author(s) and contributor(s) and not of MDPI and/or the editor(s). MDPI and/or the editor(s) disclaim responsibility for any injury to people or property resulting from any ideas, methods, instructions or products referred to in the content.