Article

Numerical Simulation on the Influence of Oxygen Content and Coke Size on the Performance of Fuel Layered-Distribution Sintering Process

1
Jiangxi Provincial Key Laboratory of Particle Technology, Jiangxi University of Science and Technology, Nanchang 330013, China
2
Key Laboratory of Energy Thermal Conversion and Control of the Ministry of Education, School of Energy and Environment, Southeast University, Nanjing 210096, China
3
Fangda Special Steel Technology Co., Ltd., Nanchang 330012, China
*
Author to whom correspondence should be addressed.
Metals 2025, 15(9), 953; https://doi.org/10.3390/met15090953
Submission received: 8 July 2025 / Revised: 17 August 2025 / Accepted: 26 August 2025 / Published: 27 August 2025

Abstract

Fuel layered-distribution sintering (FLDS) is a technology that can effectively reduce fuel consumption and achieve a more uniform temperature distribution within the sintering bed compared to traditional iron ore sintering. In this study, the melting quality index, combined with the maximum temperature and the duration of melting temperature, are used as performance indicators to investigate the effects of coke size and oxygen content on sintering characteristics under layered fuel distribution conditions. The results indicate that increasing the oxygen content can enhance the velocity of the flame front in the sinter pot, thereby accelerating the sintering process. However, excessive oxygen content may lead to fluctuations in the quality of the sinter. Small coke sizes provide higher melting quality in the upper region of the sinter pot, while large coke sizes perform better in the lower region. For a 600 mm sintering bed layer, an oxygen enrichment time of 6 min with oxygen concentration of 27% and coke particle diameter of 2.0 mm can balance sintered ore quality, sintering time, and flame front speed, ensuring the yield of sintered ore. These findings provide an effective pathway for energy saving and emission reduction in iron ore sintering plants.

1. Introduction

The sintering process involves mixing of iron ore fines, flux, fuel, return fines, and other raw materials in specific proportions, followed by granulation, ignition, and high-temperature melting to produce sinter cake with stable chemical composition and excellent metallurgical properties. The sintering process not only enhances the utilization efficiency of iron ore and provides suitable raw materials for blast furnace ironmaking but also removes certain harmful elements [1,2,3]. In conventional iron ore sintering (CS) processes, fuel is uniformly distributed along the height of the sinter bed. Due to the “self-regenerative” effect, heat distribution is uneven with more heat accumulating in the lower part of the sinter bed, resulting in excessively high temperatures and over-melting, which has negative impacts on the quality and yield of the sinter while increasing fuel consumption and pollutant emissions. Such a process is not well-suited to the current requirements for sustainable development and high productivity with low energy consumption [4]. The fuel layered-distribution sintering process (FLDS) [5] can effectively address this issue by controlling the uniform heat transfer during the sintering process through an reasonable distribution of fuel layers. Gao et al. [6] divided the fuel into upper and lower layers and found that different layer thicknesses had a significant effect on the sintering rate, with the efficiency of the FLDS being about 20% higher than that of the CS. Furthermore, when the fuel was divided into upper, middle, and lower layers, reducing the thickness of the regions from top to bottom allowed for a stepwise increase in heat transfer [7]. Simultaneously, a reasonable increase in fuel content in the upper layer can reduce temperature fluctuations, and produce sinter with more stable quality [5,8].
Oxygen content and coke size are two important influencing factors of FLDS. Adequate oxygen content can promote the complete combustion of coke, thus providing sufficient heat for the sintering process. However, excessive oxygen content will lead to over-oxidation, reducing the reducibility of the sintered ore. Many researchers [9,10,11] have studied the effect of oxygen content on the sintering process under different conditions. Cheng et al. [12] studied the sintering behavior of low-grade iron ore and found that under high-oxygen conditions, the porosity between iron ore particles was higher, reducing the performance of iron ore sintering. Dharmendra et al. [13] observed that at an oxygen concentration of 9%, the sintering time was reduced by approximately 60 s, and the yield of sintered ore increased from 76.1% to 80.6%. However, excessive oxygen concentrations may have negative effects, such as reduced bed permeability and excessive melting of the sintered ore [14]. Kenta et al. [15] increased the oxygen content to 40%, which improved productivity but did not enhance the quality of the sintered ore. Conversely, when the oxygen content was reduced to around 30%, the porosity distribution of the bed was the most uniform, and the density of the sintered ore was further improved. Gan et al. [16] found that with increasing oxygen concentration, the vertical sintering speed improved, but it caused uneven heat distribution and reduced the strength of the sintered ore.
Coke size, as another important factor, also has a significant impact on sintering performance. Smaller coke sizes result in larger fuel contact areas, thereby promoting combustion. However, excessively small particle sizes can lead to uncontrollable combustion rates. Ni et al. [17] simulated the effect of coke size on sintering quality and found that as the coke size decreased, the combustion rate and flame front speed (FFS) increased, while sintering time and oxygen concentration in the exhausting gas decreased. Masoud et al. [18] compared the effects of uniform fuel distribution and layered distribution on sintering quality and reached similar conclusions. They also observed that smaller coke sizes in uniform distribution could improve sintering efficiency, but increase NOx emissions. In addition, in FLDS process, excessively small coke sizes can cause the upper layer to burn too quickly, generating localized high temperatures that hinder heat transfer, and leading to insufficient temperatures in the lower layer. Proper particle sizes can improve combustion efficiency and enhance overall sintering performance [19]. Coke size is also significantly correlated with oxygen concentration. Larger coke particles exhibit more stable combustion performance under low oxygen concentrations and help improve the permeability of the sintering bed, though at the cost of reduced combustion efficiency [20]. Zhao et al. [21] found that smaller coke particles under low oxygen conditions tend to form regions of concentrated high temperatures. They also noted that coke size greatly influences the temperature distribution within the sintering bed, with smaller coke particles causing rapid temperature rises but resulting in uneven distribution. Moreover, as the coke content increases, the degree of over-melting in the sintered ore also rises, leading to a reduction in the quality and yield of the sintered ore. Therefore, appropriate coke content is critical for ensuring sintering output [22].
The aforementioned studies indicate that oxygen concentration and coke size have significant effects on the sintering process. Appropriate oxygen content in a uniformly distributed bed layer is generally conducive to improving the quality of sintered ore. However, there has been no research exploring the mechanism of oxygen content’s effect on melt quality index (MQI) and duration time in melting temperature (DTMT) under layered fuel distribution conditions. In a bed layer with uniformly distributed fuel particle sizes, reducing coke size can enhance sintering performance, but it may pose environmental pollution risks, which are not aligned with the current requirements for sustainable development. To optimize the sintering process to meet these requirements, the layered fuel distribution technique has garnered significant attention. However, there is currently no detailed collaborative research on the behavior of small and large coke particles in different bed layers, nor on how to balance their effects on FFS, MQI and DTMT. Therefore, this study conducts an in-depth investigation into the effects of oxygen content and coke size on the sintering process under layered fuel distribution conditions, aiming to reveal how these two factors influence MQI, FFS, DTMT, maximum temperature, and sintering time. Furthermore, considering the specific requirements of layered fuel distribution, an optimal coke distribution scheme is proposed.
There are two main methods for studying the sintering process. One is based on experiments using sinter pot, and the other is based on numerical modeling by computational fluid dynamics (CFD). CFD has been widely adopted by researchers to describe process phenomena because it can depict the physical and chemical reactions and investigate the mechanisms of various critical parameters in the process [7,8,18,23,24,25]. For example, Pahlevaninezhad et al. [18] used CFD to simulate the sintering process by considering mass, energy, and momentum conservation equations; Zhou et al. [26] used CFD to analyze gas flow, pressure drop, and bed permeability; Chen et al. [27] used CFD to simulate gas–solid phase reactions, combustion, and melting, and their results revealed that layered distribution of solid fuel improved heat transfer in the upper regions and enhanced the quality of sintered ore. Dai et al. [7] studied the distribution of bed layers and fuel particle sizes using the CFD method combined with the particle swarm optimization algorithm. In conclusion, CFD technology not only effectively simulates dynamic changes during the sintering process but also provides critical theoretical support for layered fuel distribution.
Optimizing the sintering process and improving energy utilization efficiency are the current focuses of iron ore sintering research. At present, most simulation studies focus on the flow field and chemical reaction simulations of the sintering process, while fuel layered distribution primarily emphasizes the dynamic characteristics of fuel. Therefore, based on FLDS technology, this study uses the CFD method to do a research on the relationships between oxygen content, coke size, and various physical parameters, while matching different coke sizes to different bed layers. The findings can provide scientific basis for optimizing the sintering process and reducing fuel consumption.

2. Mathematical Model

CFD (computational fluid dynamics) treats fluids as systems composed of small volumetric units that interact with each other, resulting in the exchange of heat, momentum, and mass, which has been widely applied to study multiphase flow in various fields. In this study, CFD is employed to describe the fluid dynamics behavior of the fluid, and the chemical reactions between gas and solid phase are also taken into account.

2.1. Gas Phase Conservation Equations

To accurately describe gas flow, energy transfer, and chemical reactions, the gas-phase mass conservation equation, momentum conservation equation, and gas-phase component conservation equation are established. The governing equations are briefly introduced as follows:
Gas-phase mass conservation equation [8]:
ε ρ g t + ε ρ g v = S m , g s + S m , g g
where ε, v, and ρg represent the bed porosity, gas velocity, and gas density, respectively. The two terms on the right side represent gas–solid chemical reactions (coke combustion producing CO2 or CO) and gas–gas chemical reactions (the reaction of CO and O2 producing CO2).
Gas-phase momentum conservation equation [8]:
ε ρ g v i t + · ε ρ g v i v j = p + μ v i S m t
where p and μ represent the pressure of the gas in its stationary state and viscosity, respectively. Smomentum represents the frictional resistance generated when the gas-phase material comes into contact with the solid-phase material and surfaces, which varies according to porosity, particle size, and bed height contraction. Specifically, it is expressed as follows [28,29]:
ε p = ε 0 + ξ 0 ξ ξ 0 0.07 + f s 1 f s 1 ε 0 + i = 1 2 ( n i 4 π 3 r 0 3 r c 3 )
d p = d p , i + d p , f d p , i f m ω  
Equation (3) [28] describes the variation in porosity, which directly affects gas flow, as well as heat and mass transfer. Here, ε and ε0 represent the current and initial porosity, respectively, ς and ς0 represent the current and initial compression states, respectively, fs represents the solid-phase volume fraction, ni represents the number of coke or limestone particles, and r0 and rc represent the initial and final particle sizes, respectively. Equation (4) [29] describes the geometric changes in particles during the sintering process, where dp, dp,initial, and dp,final represent the current, initial, and final particle diameters, respectively.
Gas-phase component conservation equation [8,18]:
ρ g ε Y g ( i ) t + ε ρ g v Y i = ρ g D g i Y g i + S g s + S g g  
where Yi and Di represent the mass fraction and diffusion coefficient of a specific gas. The terms Sgs and Sgg represent the reaction rates of gas–solid chemical reactions and gas–gas chemical reactions, respectively. In this work, seven gases are considered: O2, water vapor, CO, CO2, CH4, H2, and N2.
Gas-phase energy conservation equation [8]:
ρ g ε C P g T g t + ε ρ g v C P g T g = λ g T g + h V T s T g + S h , g s + S h , g g
where the left side represents the temporal changes in gas energy and the spatial changes caused by convection effects. The right side of the equation corresponds to the energy changes during the heat conduction process, the convective heat transfer between gas–solid chemical reactions, and the heat generation and consumption during gas–solid and gas–gas chemical reactions.

2.2. Solid-Phase Conservation Equations

The solid-phase components include iron ore, coke, and limestone, and the mass of each component dynamically changes as gas–solid chemical reactions proceed.
The solid-phase component conservation equation can be written as [8]:
( 1 ε ρ s Y j ) t = S g s
where the left side of the equation represents the changes in solid-phase components over time, while the source term on the right side indicates the production and consumption rate of the solid phase during gas–solid reactions.
During the sintering process, the solid-phase components undergo physical and chemical reactions, accompanied by energy release and absorption.
The solid-phase energy conservation Equation (8) can be written as [8,22]:
( ρ s 1 ε C P s T s ) t = λ s e T s + h V T g T s + S h , g s
where the left side of the equation represents the rate of change in energy over time. Specifically, Ts and Cps represent the temperature and specific heat capacity of the solid phase, while 1 − ε reflects the effect of porosity on the effective volume. The right side of the equation sequentially represents heat conduction, heat exchange, and additional heat generated by gas–solid chemical reactions. λs.eff represents the effective thermal conductivity of the solid phase.

2.3. Chemical Reactions

In this study, five types of gas–solid chemical reactions were considered [18,22,30,31,32,33,34], as shown in Table 1. During coke combustion process, O2, H2O, CO2, and H2 participate as reactants. The coke reactions occur on the particle surface. The decomposition process of limestone is modeled using the unreacted shrinking core model. The melting and solidification of the raw material mixture are described using empirical formulas. It is assumed that melting begins when the melt temperature exceeds the melting point, while solidification starts when the temperature drops below the melting point. For gas combustion and gasification reactions in the sintering bed, the reaction rates are described using Fluent’s built-in reaction model. The relevant reactions and kinetic parameters are primarily based on the reaction rate parameters provided in reference [18] to ensure the accuracy and reliability of the model calculations, as listed in Table 2 [17,18,35].

3. Model Construction and Simulation Conditions

3.1. Model Construction

To reduce computational costs, the sinter pot was simplified into a 2D computational domain of 0.205 m × 0.600 m, as shown in Figure 1, the grid size was set to 0.0025 m × 0.0025 m, with a total of 19,680 grids. Three temperature measurement points were set at three different heights (y = 0.11, y = 0.30, y = 0.49) to observe the temperature changes inside the sinter pot. The top of the model served as the inlet, while the bottom served as the outlet. The boundary conditions were set as a velocity inlet and a pressure outlet. For the fuel distribution in the sinter pot, Huang et al. [36] divided the total bed layer into units and quantified the heat input and consumption. Based on the units, they calculated the heat required to reach the set temperature and combined it with the heat generation characteristics of each unit to determine the optimal fuel distribution ratio. Following this calculation method, the fuel distribution proposed in our previous work [8], and the fuel layered distribution shown in Figure 1 was ultimately adopted in this study. To accelerate the temperature rise in the sintering process, the upper layer coke content was set to 4.3%, while the middle layer was set to 3.5% to extend the heat retention time. To avoid increased fuel consumption caused by self-regenerative heat, the lower layer coke content was reduced to 3.1%. Compared with previous studies [5,7,8], reducing the top layer fuel ratio sufficiently maintains ignition performance while lowering fuel consumption. Additionally, reducing the fuel ratios in the middle and lower layers effectively reduces the temperature difference between layers, making the heat distribution more uniform and resulting in more stable sintered ore quality.
In this study, numerical simulations of oxygen-enriched combustion were conducted by means of the established geometric and physical model. To quickly reach the combustion temperature, the initial temperature of coke particles was set at 300 K, and the ignition temperature was set at 1400 K. To reduce the impact of sudden cooling on the quality of sintered ore after the ignition process, a holding stage was set after ignition. The holding stage temperature was 1073 K, and the holding time was 30 s. For oxygen-enriched cases, the oxygen-enrichment time was set to 360 s, and the oxygen content was set to 0.235, 0.270, 0.300, and 0.350, a baseline case without additional oxygen in the hot air was also set up, with an average inlet air velocity of 0.45 m/s. The coke particle diameters of 1.6 mm, 2.0 mm, and 2.4 mm was used for the simulations, primarily considering the computational complexity of the model. The main simulation parameters are shown in Table 3.

3.2. Model Validation

In this study, ANSYS FLUENT 19.2 software was used for simulation, incorporating a custom-developed particle-phase model, including coke combustion and gasification reactions. The heat transfer in the sinter pot occurs from top to bottom, as shown in Figure 2. As illustrated in the figure, during the evolution of combustion in the sintering bed over 0–1.5 min, the high-temperature gas generated by ignition enters from the inlet, and the bottom fan creates a negative pressure that drives the high-temperature gas to move from top to bottom. Since the coke in the upper part of the sintering bed has been consumed and the ignition period ends, the inlet gas changes to ambient temperature air. The entry of ambient temperature air cools the sintering bed where combustion has ended, forming sintered ore. The sintering process begins immediately after ignition and continues for approximately 25 min. As shown in the figure, the high-temperature reaction zone begins to form at 1.5 min, then gradually moves downward through the bed, reaching the bottom at 25 min.
To test the accuracy of the heat transfer model and the custom-developed combustion and gasification reaction model, the experimental data from Yang et al. [37] were compared with the simulation data of this study. The comparison was conducted using the CS process with an average coke content of 3.8%. The temperature variations at three temperature measurement points (y = 0.11, y = 0.30, y = 0.49) within the sintering bed were compared, as shown in Figure 3. The model accurately simulates the temperature variation trends and peak temperatures at different heights of the material bed over time under the CS process. At y = 0.49, the simulation results are close to the experimental data, effectively predicting the peak temperature and its variation trend, indicating that the current model has better predictive capabilities for peak temperatures and combustion behavior. At y = 0.30 and y = 0.11, the temperature variations are similar to those in the upper layer, but the peak temperature is slightly higher, and its occurrence is delayed. This indicates that heat gradually propagates downward during the sintering process, and the simulation results can relatively accurately predict peak temperatures and the trends of temperature rise and fall. Overall, the numerical simulation data align well with the experimental measurements, with small errors. Minor discrepancies may be due to simplifications in the numerical simulation process, but the errors are within an acceptable range. This demonstrates the accuracy and reliability of the currently established heat transfer model.

3.3. Sintering Performance Indicators

The commonly used sintering performance indicators [38,39] include melt quality index (MQI), flame front speed (FFS) [17,40], duration time in melting temperature (DTMT) [5,41,42], sintering time [43,44], and maximum temperature (MaxT) [6,27,45,46]. MQI, DTMT, and MaxT are commonly used to characterize the quality and strength of sintered ore. MQI is represented by the shaded area in Figure 4, defined as MQI =   t 1 t 2 ( T s T m 1 ) d t DTMT refers to the time above the solidus temperature in the sintering bed as t2t1. MaxT represents the peak temperature of solid materials at a certain height. FFS is defined as the ratio of the distance between two points at 1000 K to the time required for the flame front to propagate. Sintering time refers to the time required for the sinter pot outlet temperature to reach its peak. FFS and sintering time characterize the speed of the sintering process and production efficiency. These physical parameters directly reflect the physical and chemical properties of sintered ore. Operational parameters can effectively adjust these physical parameters, thereby optimizing the sintering process, reducing fuel consumption, and minimizing environmental pollution.

4. Results and Discussion

4.1. Effect of Oxygen Content

The oxygen-enriched sintering refers to the addition of a certain amount of oxygen to the air at the inlet during the sintering process to facilitate more complete fuel combustion. In this study, five oxygen concentrations were considered: 21%, 24%, 27%, 30%, and 35% with enrichment time of 6 min for all cases.
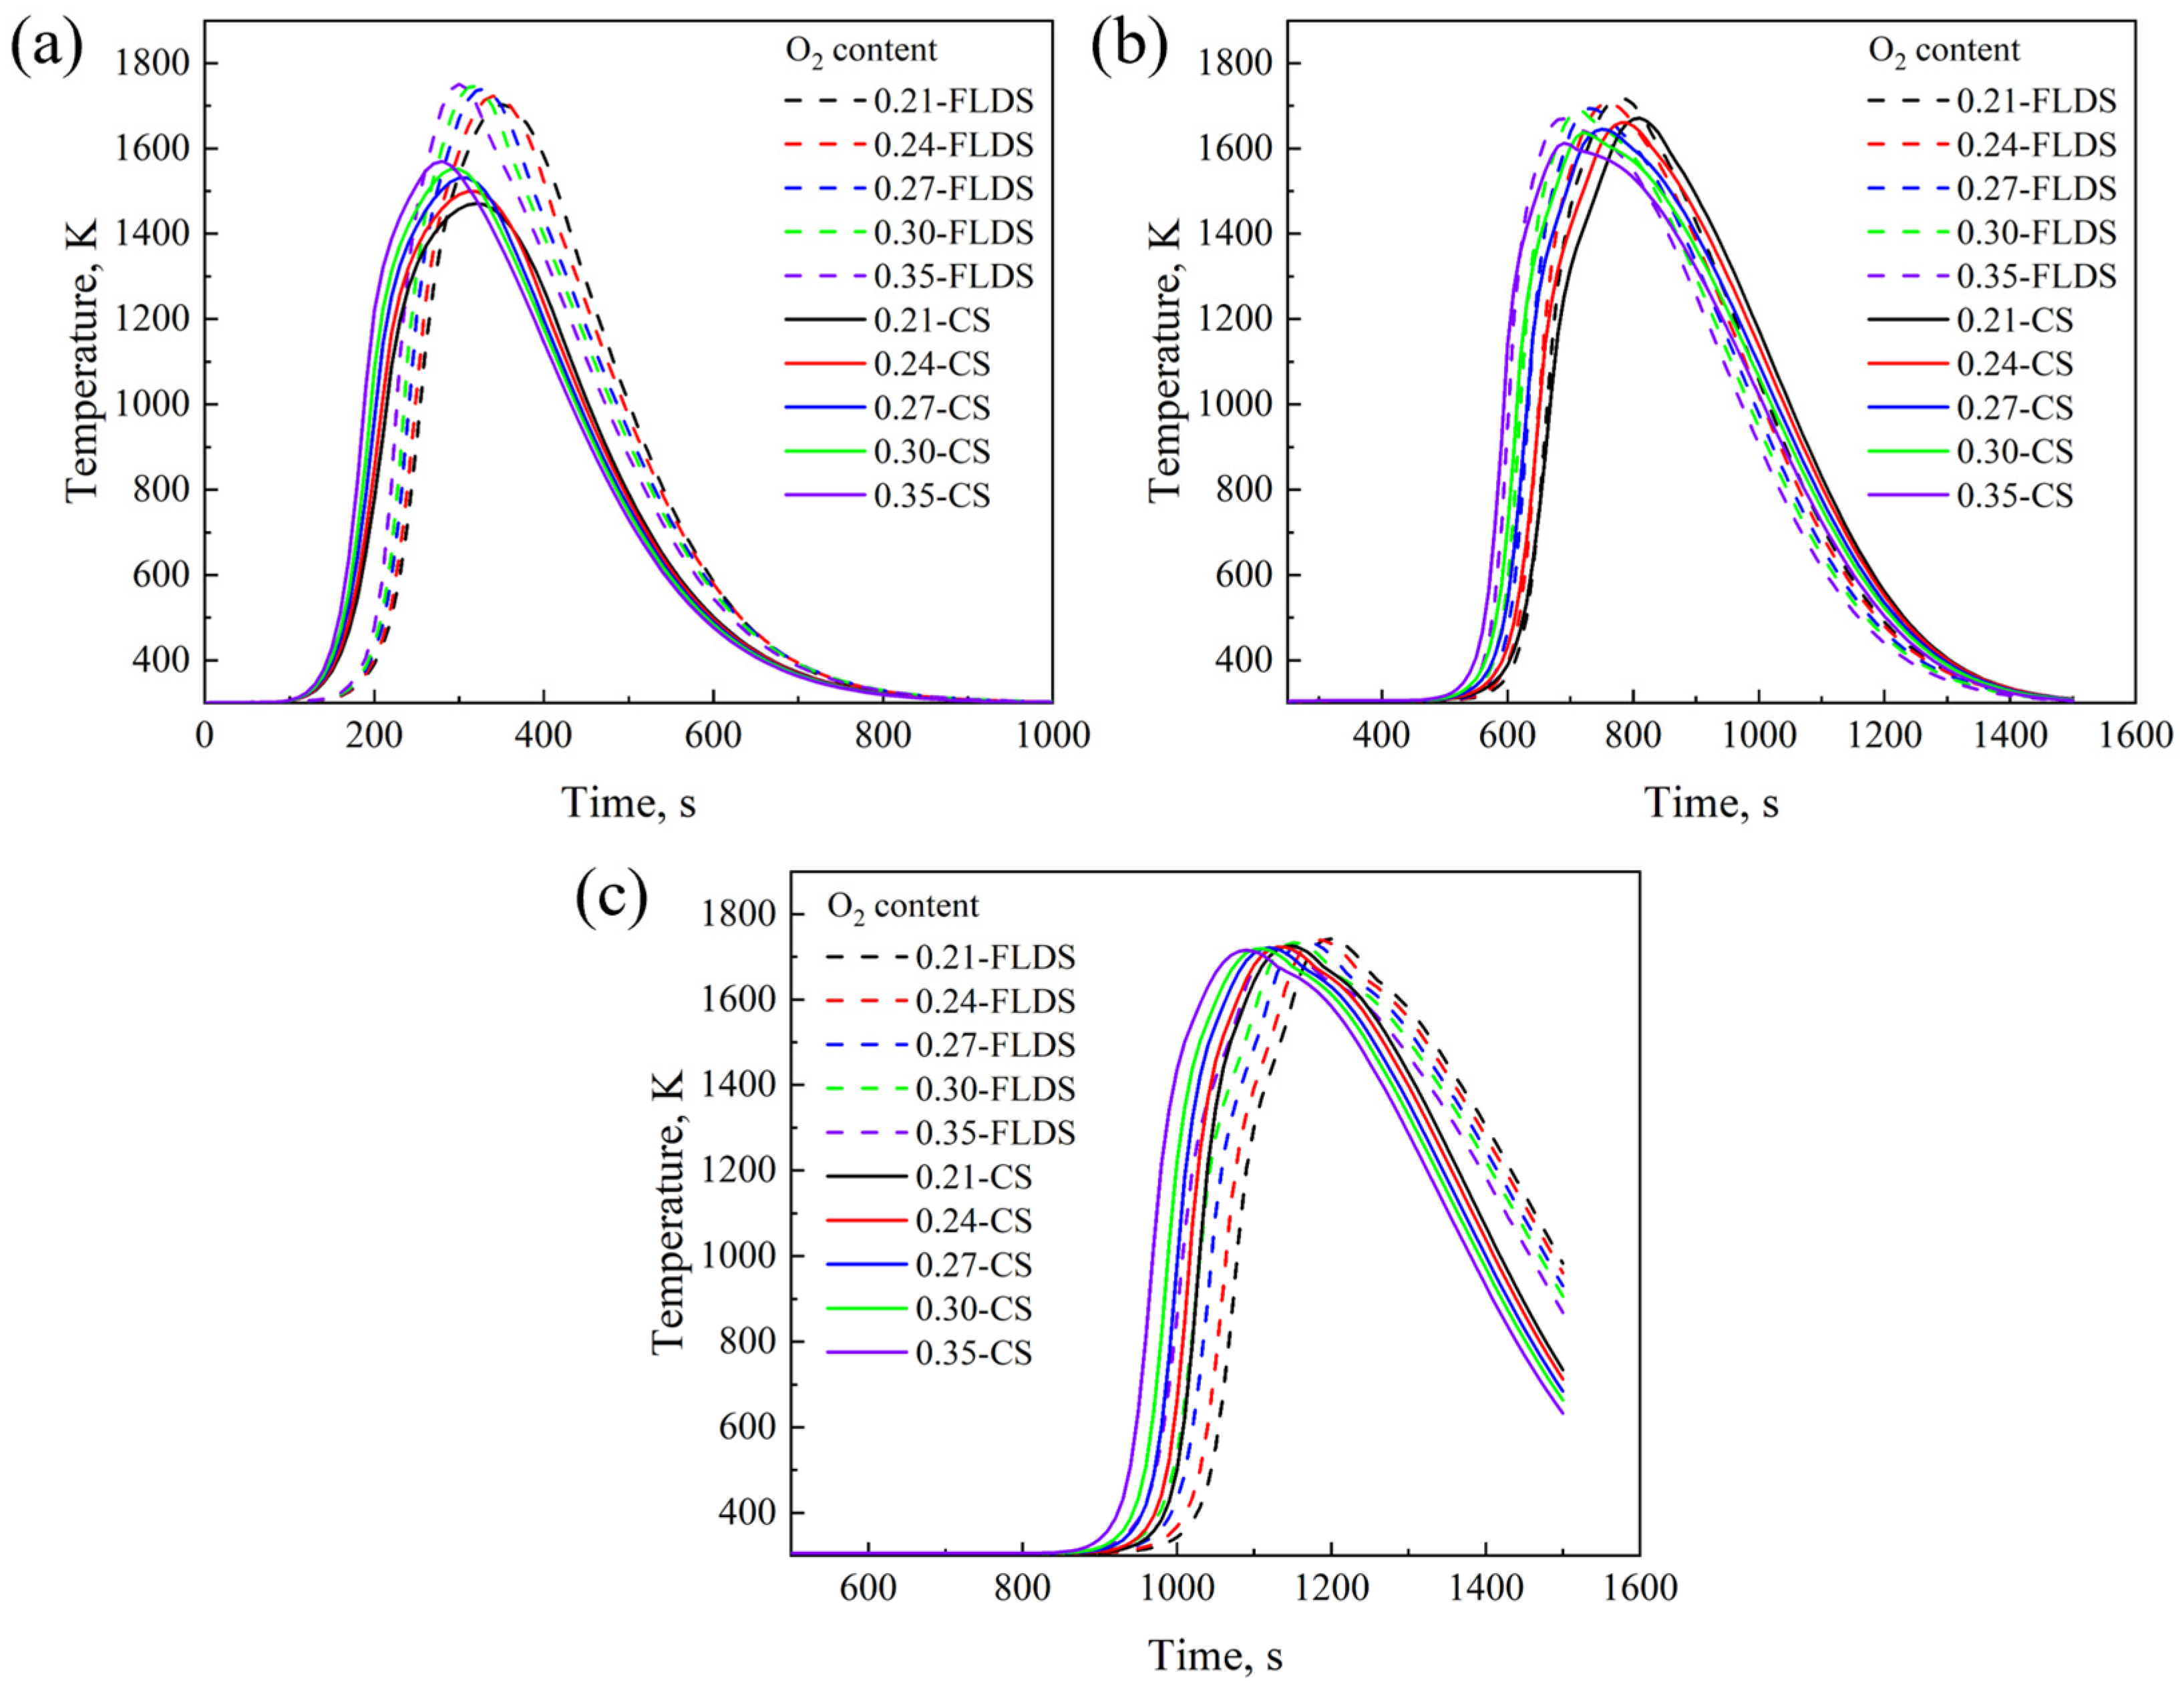
Figure 5 shows the comparison of temperature variations between FLDS and CS under different oxygen content conditions. Subfigures (a), (b), and (c) represent the temperature variation curves for the upper layer (y = 0.49), middle layer (y = 0.30), and lower layer (y = 0.11), respectively. In CS, the coke distribution is uniform at 3.8%, while in FLDS, the coke distribution is as shown in Figure 1. Through reasonable fuel partitioning, FLDS reduces fuel usage by approximately 4.2% or 1.59 kg/t. It can be observed that as oxygen content increases, both of the sintering methods vary in the peak temperature and reaction times. Under the same oxygen conditions, the peak temperature and the trends of temperature rise/decline between FLDS and CS show slight differences. In the upper part of the sinter pot, the maximum temperature of FLDS is significantly higher than that of CS, which is due to the distribution of more fuel in the upper layer in FLDS, providing sufficient heat during the initial stage of sintering. In terms of the temperature rise rate, FLDS and CS exhibit similar trends, but CS reaches its peak temperature slightly earlier than FLDS, especially at higher oxygen contents. It indicates that CS reacts more rapidly under high-oxygen conditions, while FLDS is relatively more moderate. During the cooling stage, the temperature decline rate of FLDS is slightly faster than that of CS, which could be related to the heat distribution and dissipation characteristics of the FLDS process, leading to a quicker temperature drop, while CS maintains high temperatures for a longer period.
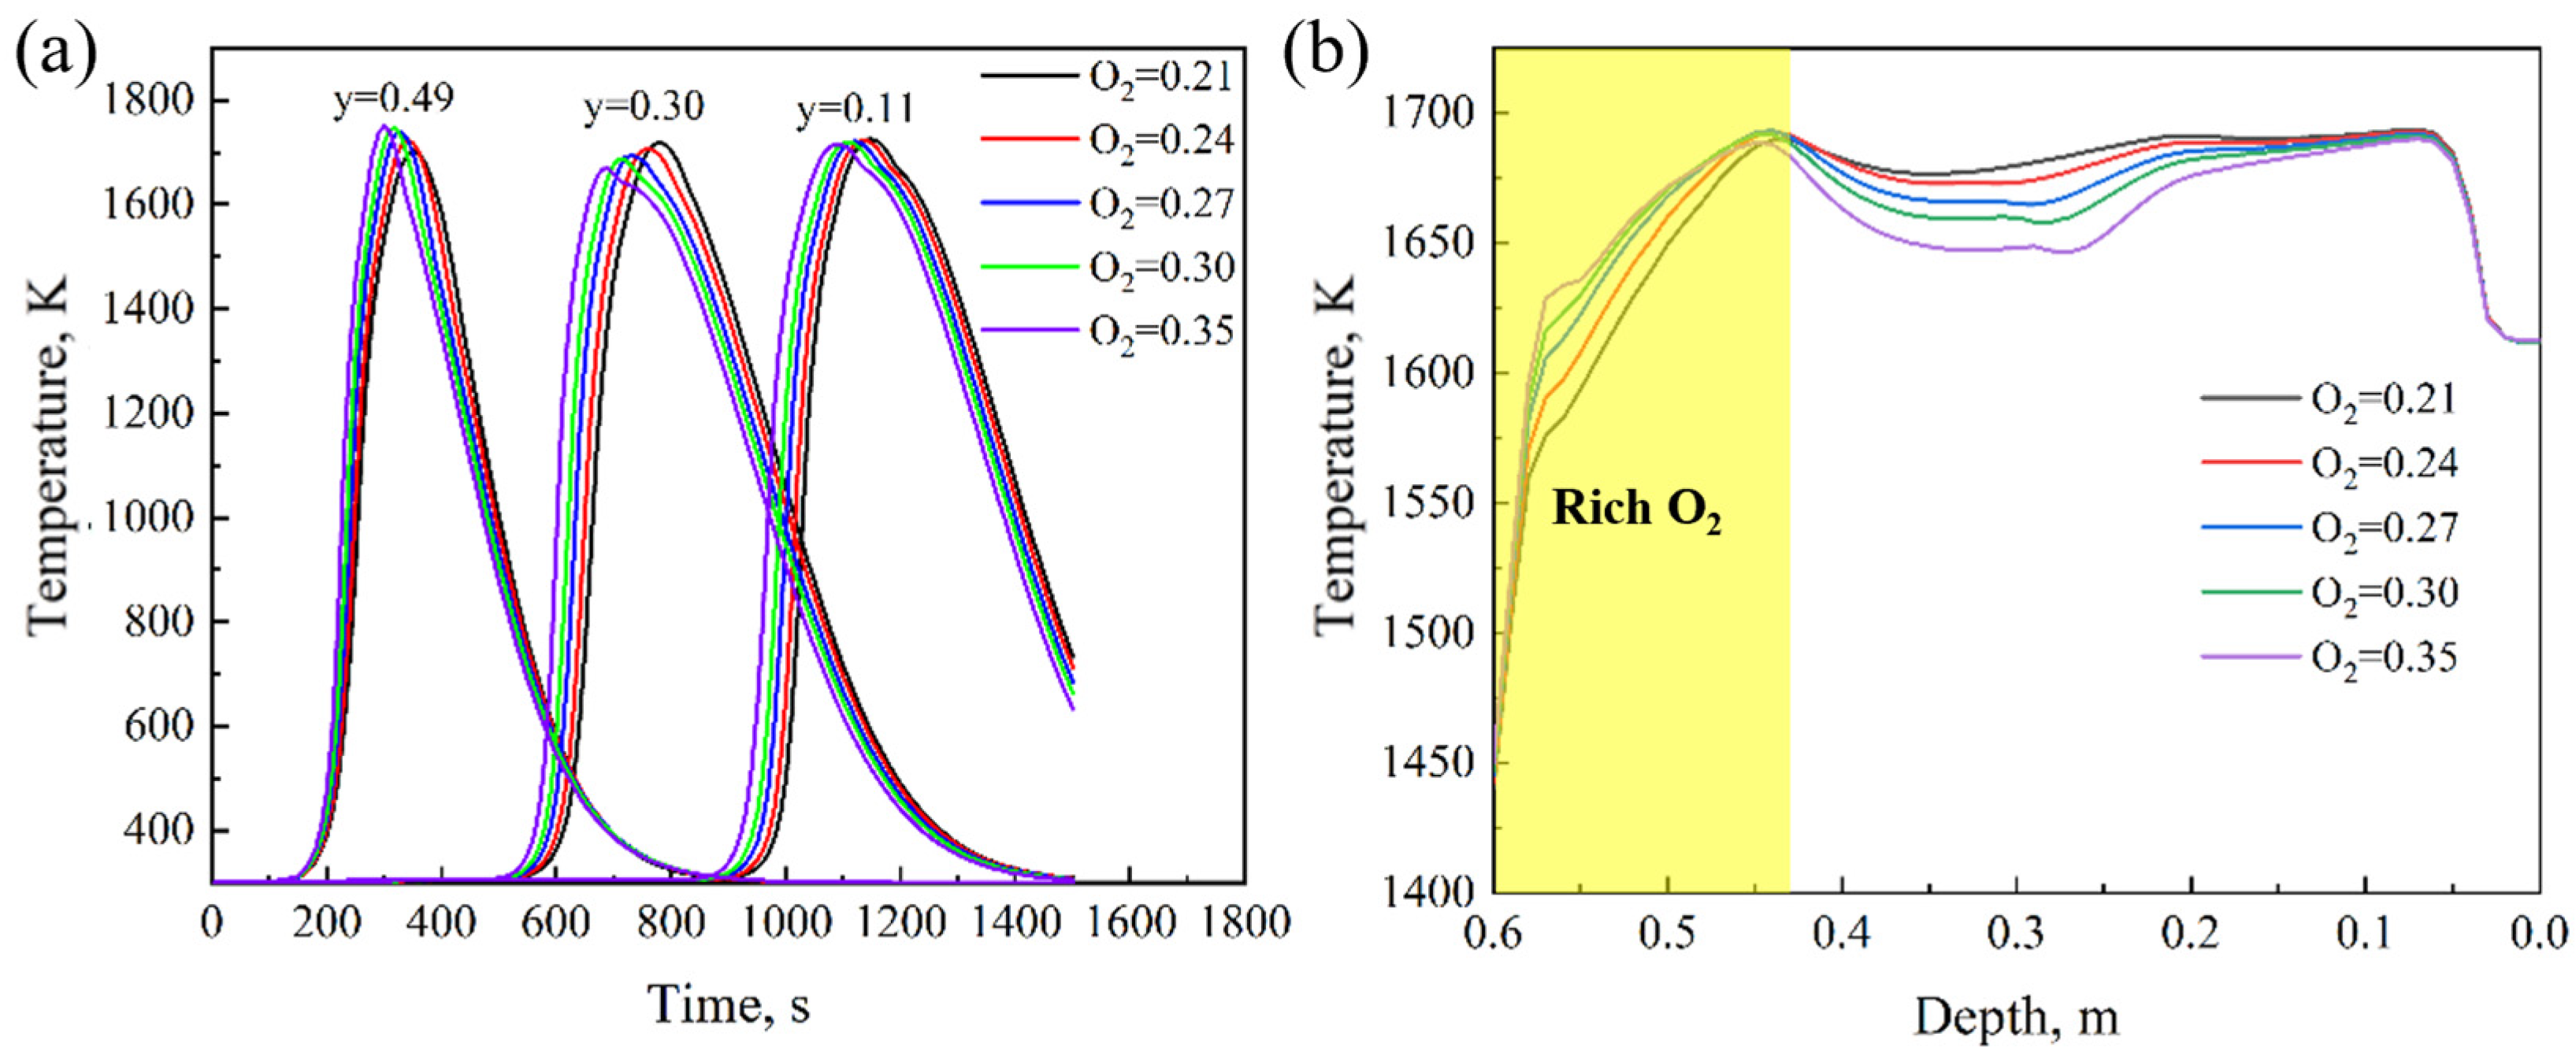
Figure 6a shows the effect of different oxygen concentrations on the temperature variation during the sintering process. From the figure, it can be observed that as the oxygen concentration increases, the maximum temperature in the upper part of the sinter pot (y = 0.49 m) rises from 1702 K without oxygen enrichment to 1751 K with oxygen enrichment at 0.35. It is due to a higher oxygen concentration intensifies the combustion reaction, resulting in an increase in temperature. It can also be seen from Figure 6a that as the oxygen concentration increases, the rate of temperature rise in the sinter pot also increases to a certain extent. The trend is more pronounced in the upper part of the sintering bed (y = 0.49 m, y = 0.30 m). At y = 0.49 m, the time to reach the peak temperature without oxygen enrichment is 350 s, while with oxygen enrichment, it is advanced to 300 s, which is due to higher oxygen concentration accelerates the combustion of coke particles in the sintering bed, leading to a faster temperature rise. With the increase in oxygen concentration, the cooling process becomes more rapid, indicating that the reaction is more intense and the heat released after combustion dissipates more quickly. Figure 6b shows the relationship between the maximum temperature and the oxygen concentration. It can be observed that the maximum temperature reaches its highest point in the oxygen-enriched region, followed by a reversal and decline, eventually stabilizing at the bottom of the sintering bed. This finding is similar to the results reported by Ni et al. [47]. In the oxygen-enriched region, as the oxygen concentration increases, the maximum temperature curves for oxygen-enriched cases are significantly higher than those without oxygen enrichment. Moreover, the rate of temperature rise also increases noticeably. This is because the increased oxygen concentration accelerates the reaction rate of coke in the sintering bed. After the oxygen enrichment period ends, the temperature curve reverses, and the maximum temperature in the sintering bed becomes inversely proportional to the oxygen content, which is because oxygen enrichment causes the coke particles in the upper part of the sintering bed to react too quickly and be excessively consumed, resulting in insufficient reaction intensity after the oxygen-enrichment period. Additionally, excessive heat is consumed in the upper part, leading to a reversal in the temperature curve.
The average melt fraction is a key indicator for evaluating the quality of sintered ore. Figure 7 illustrates the effect of oxygen concentration on this parameter. As oxygen concentration increases, the melt formation rate accelerates, and the reaction time shortens. At a lower oxygen concentration (O2 = 0.21), the melt formation rate is slower, whereas at a higher concentration (O2 = 0.35), the melt forms more rapidly, and the reaction ends earlier. However, excessively high oxygen concentrations (O2 = 0.3 and O2 = 0.35) accelerate fuel consumption, causing fluctuations in melt mass during the mid-stage of sintering, which affects the stability of sintered ore quality.
Figure 8 shows the relationship between oxygen concentration and the average melt fraction (The average melt mass fraction is calculated using the formula: f m = T s T m 1 T m 2 T m 1 ). By comparing the average melt fractions of the CS and FLDS, it can be observed that under the same oxygen concentration, FLDS can improve the average melt fraction during the early stage of sintering. The average melt fraction curve of FLDS is more stable, indicating that FLDS can produce more stable and high-quality sintered ore. Oxygen enrichment has little effect on improving the melt fraction during the early stage of CS. In the early stage of the oxygen-enriched of FLDS, the curves for high oxygen concentrations (O2 = 0.3, O2 = 0.35) are significantly higher than those of the others. It can be inferred that an increase in oxygen concentration in the upper part of the sintering bed is beneficial to melt formation. However, due to the overly intense reaction, excessive fuel consumption occurs in the sintering bed. In the middle of the sintering bed (0.45 m–0.2 m), insufficient heat leads to inadequate melt formation, which negatively impacts the quality and yield of the final sintered ore product.
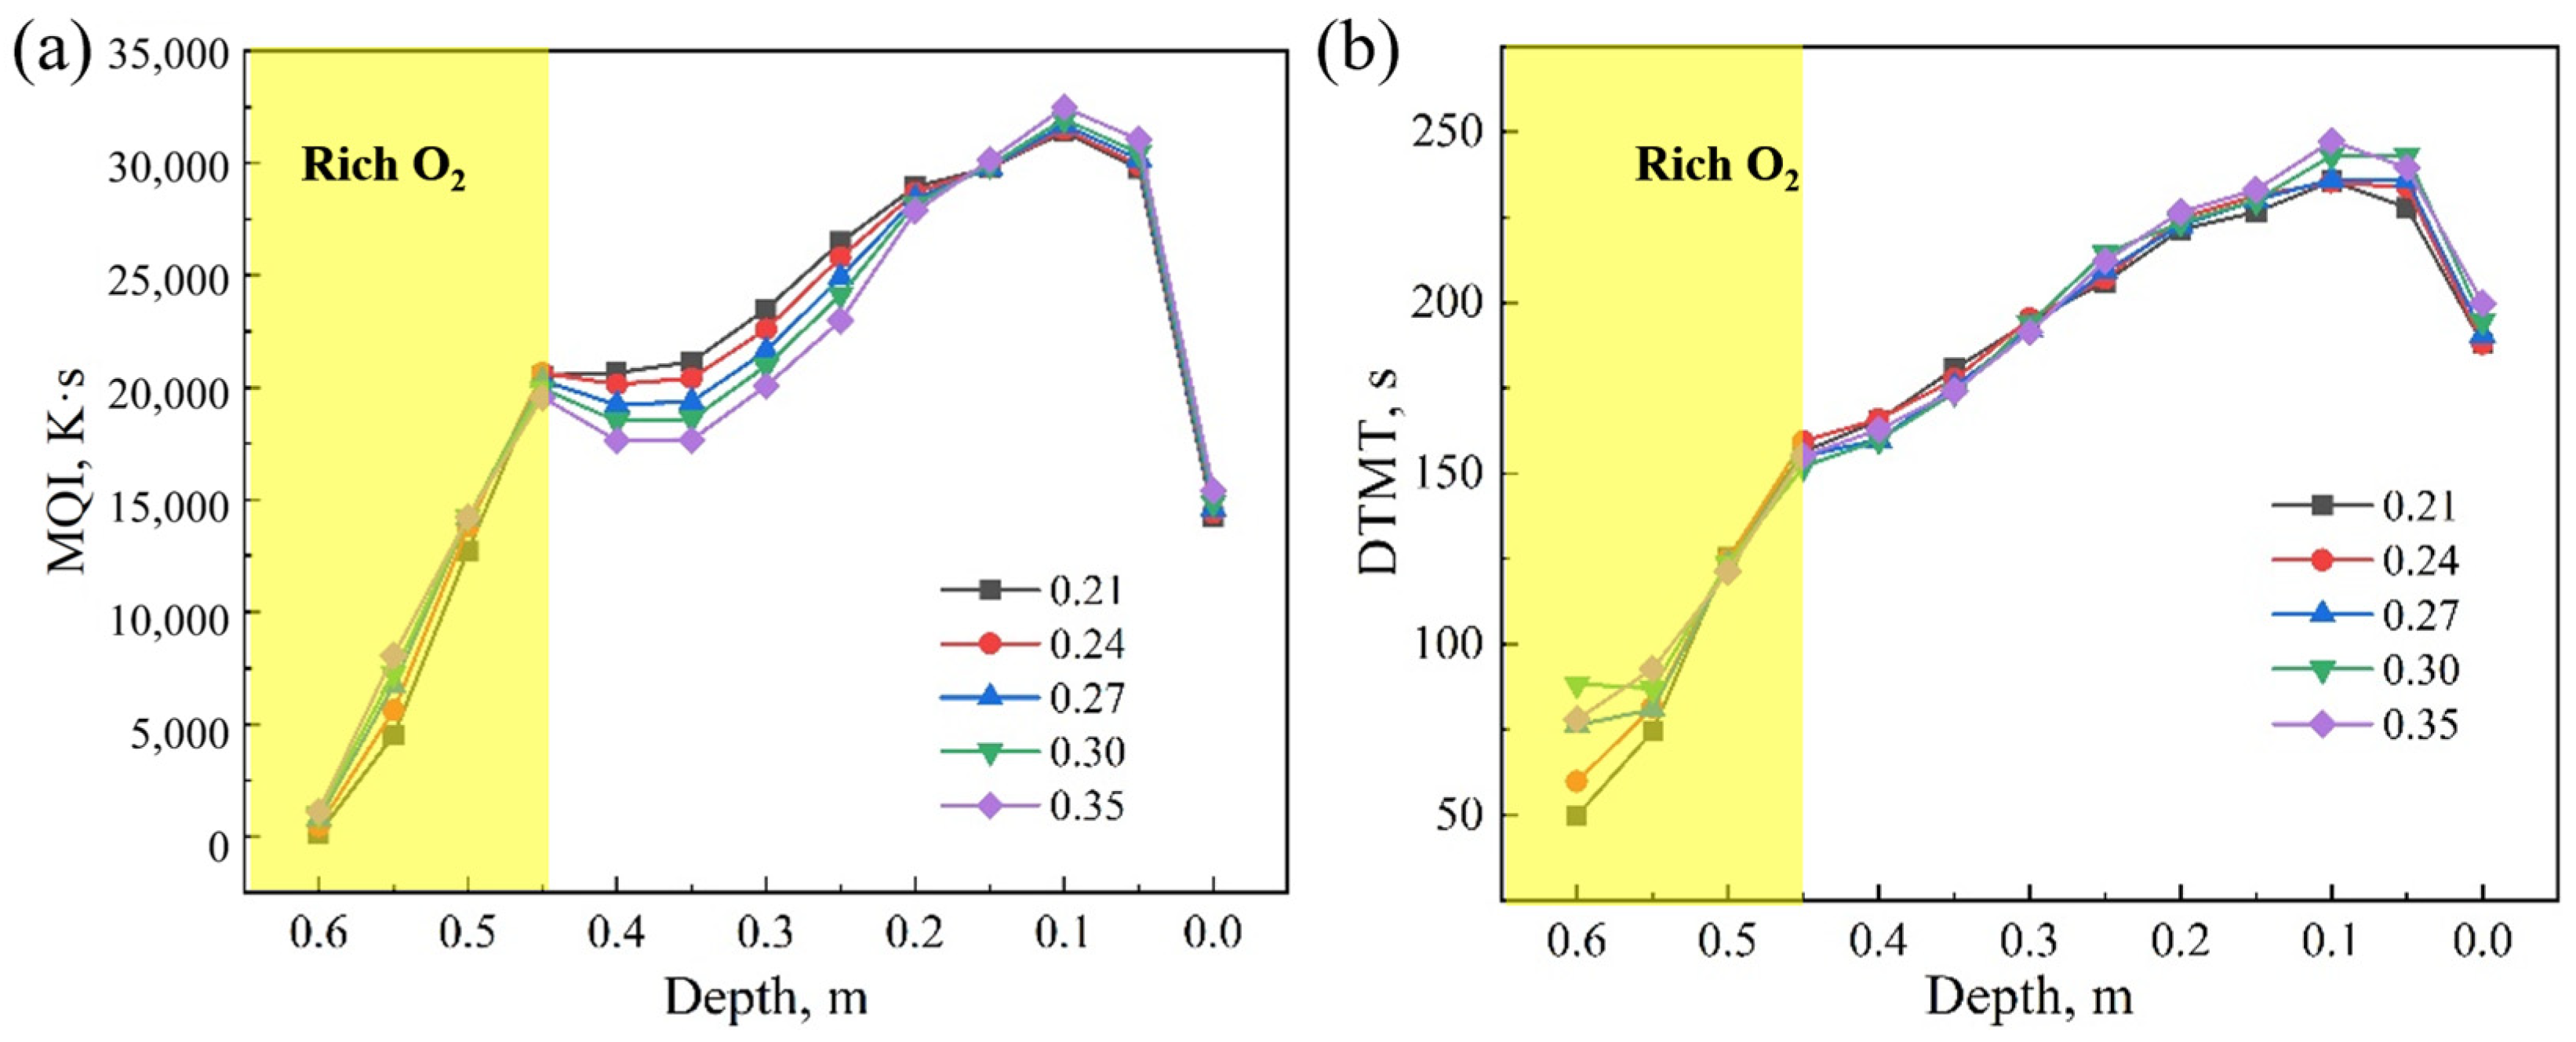
Figure 9a shows the effect of oxygen concentration on MQI. Similarly to the melt fraction, oxygen concentration has a comparable influence on the MQI. High oxygen concentrations can accelerate the rate of melt formation, causing the MQI to reach its peak earlier. However, in deeper regions, as the reactants and oxygen are depleted, the melt formation rate decreases, resulting in a reversal of the MQI. The reversal indicates that the impact of oxygen concentration on the MQI is depth-dependent during the sintering process, particularly in the sintering reactions following the oxygen-enriched region, which become more sensitive. As the flame front moves downward during the sintering process, i.e., in the lower part of the sintering bed, the DTMT increases. From Figure 9b, it can also be observed that as the sintering process progresses, the DTMT shows a trend of proportional increase with depth. In the oxygen-enriched region, due to the sufficient oxygen supply, the upper part of the sintering bed reacts more fully. The coke in the sintering bed continuously provides heat for the sintering process, thereby extending the DTMT. After the oxygen-enriched period ends, excessive fuel consumption slows the increase in the DTMT in the middle part of the sintering bed. Finally, the DTMT reaches its peak at the bottom of the sintering bed (y = 0.05 m) and then begins to decline.
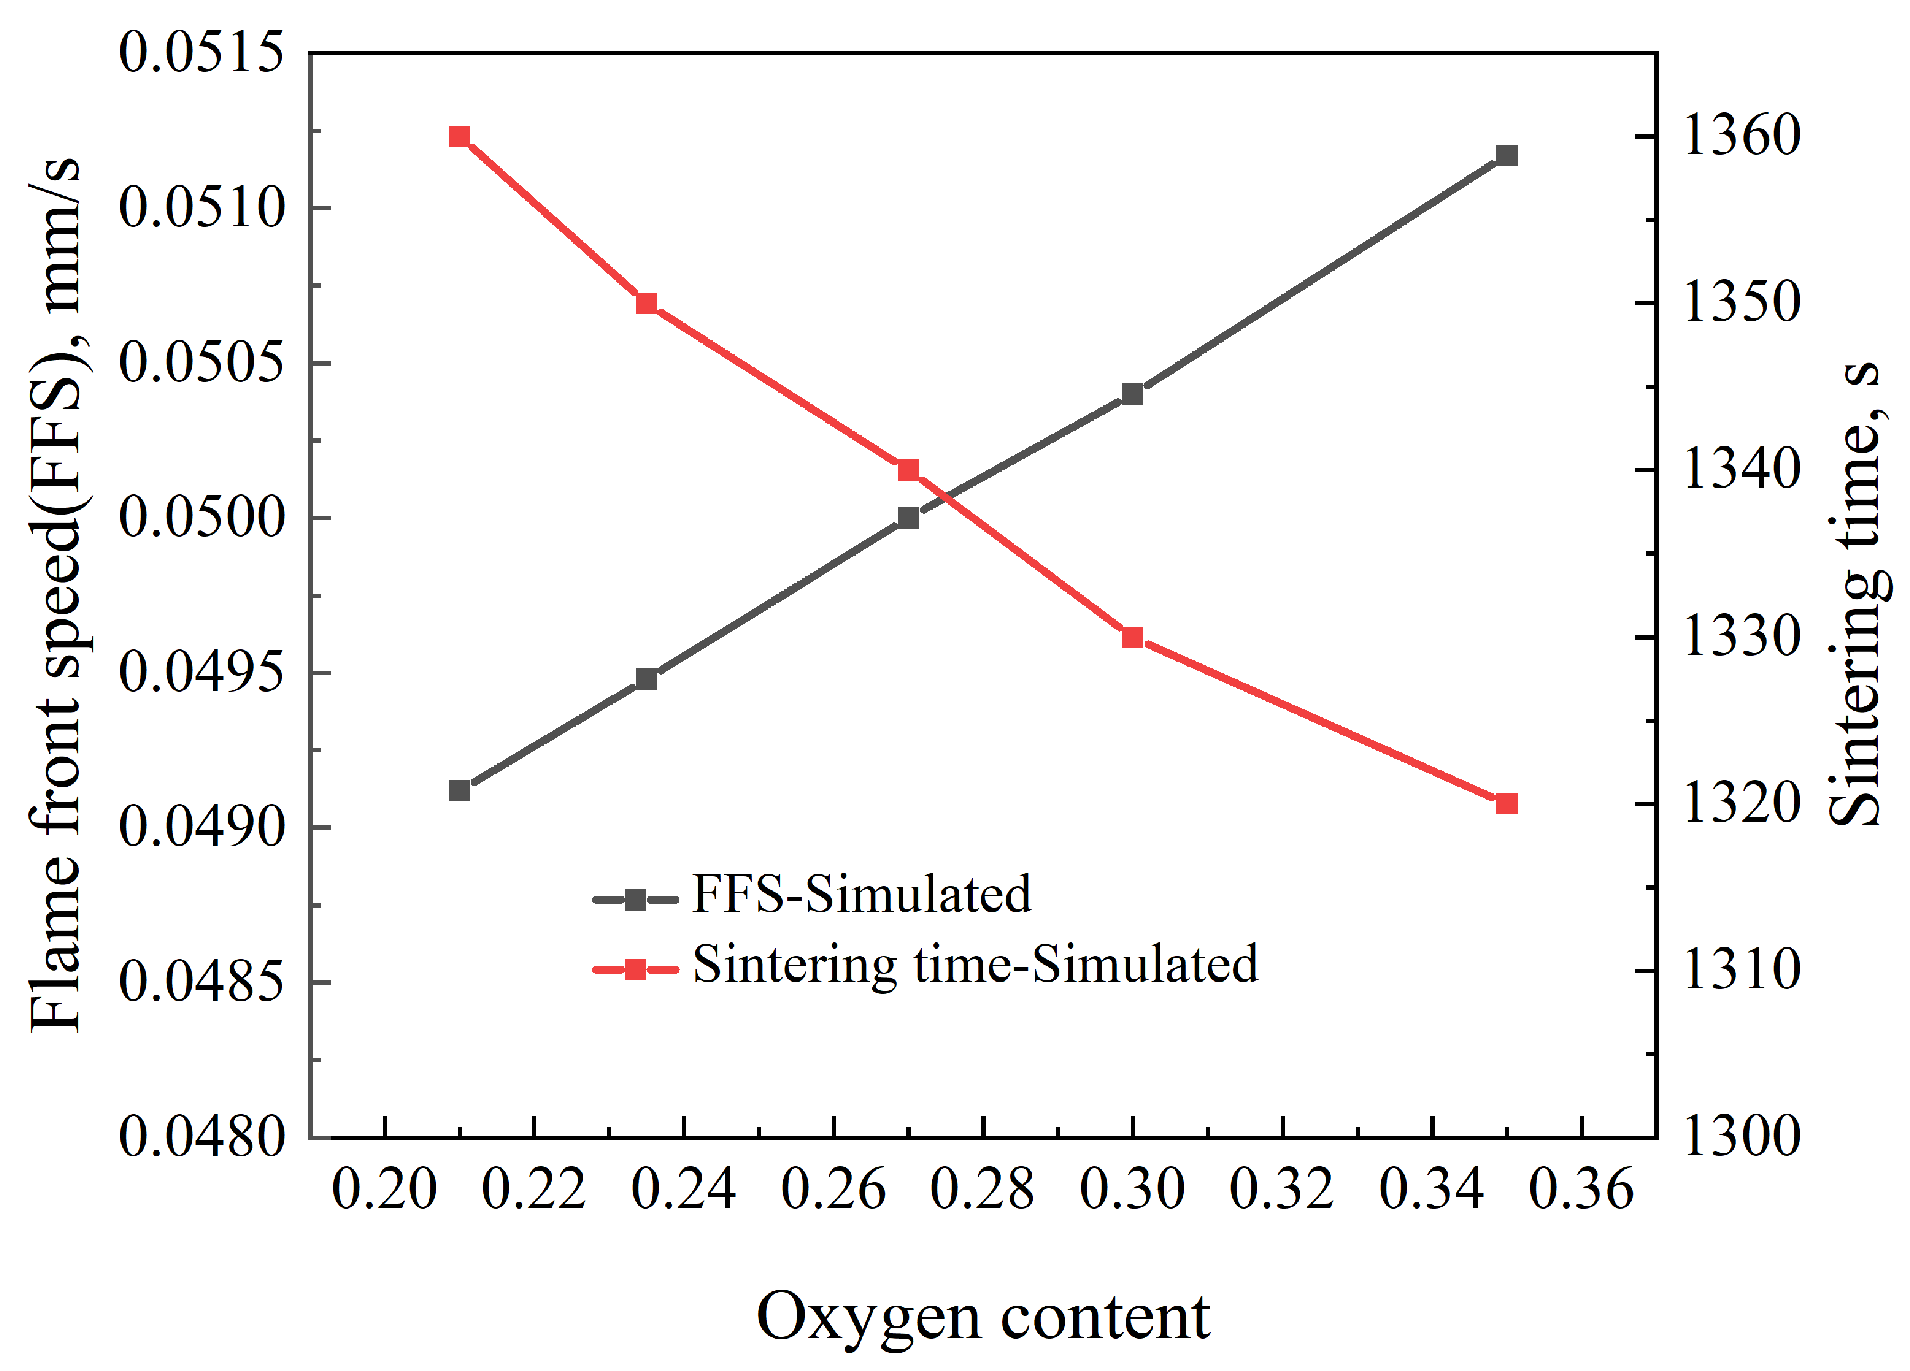
Figure 10 illustrates the effect of oxygen concentration on the flame front speed (FFS) and sintering time. As the oxygen concentration increases, the FFS shows a gradual upward trend, while the sintering time decreases correspondingly. This indicates that higher oxygen concentrations help accelerate the sintering process and reduce the total sintering time. The higher oxygen concentration intensifies the fuel reaction in the sintering bed, leading to a more vigorous reaction in the sintering zone. This relationship is significant for optimizing the sintering process, as controlling oxygen concentration can improve efficiency and reduce the time of the sintering process. The intersection point of the two curves in the figure, at O2 = 0.27, represents the balance point between sintering time and FFS, which can maximize production efficiency by optimizing both factors.

4.2. Effect of Coke Size

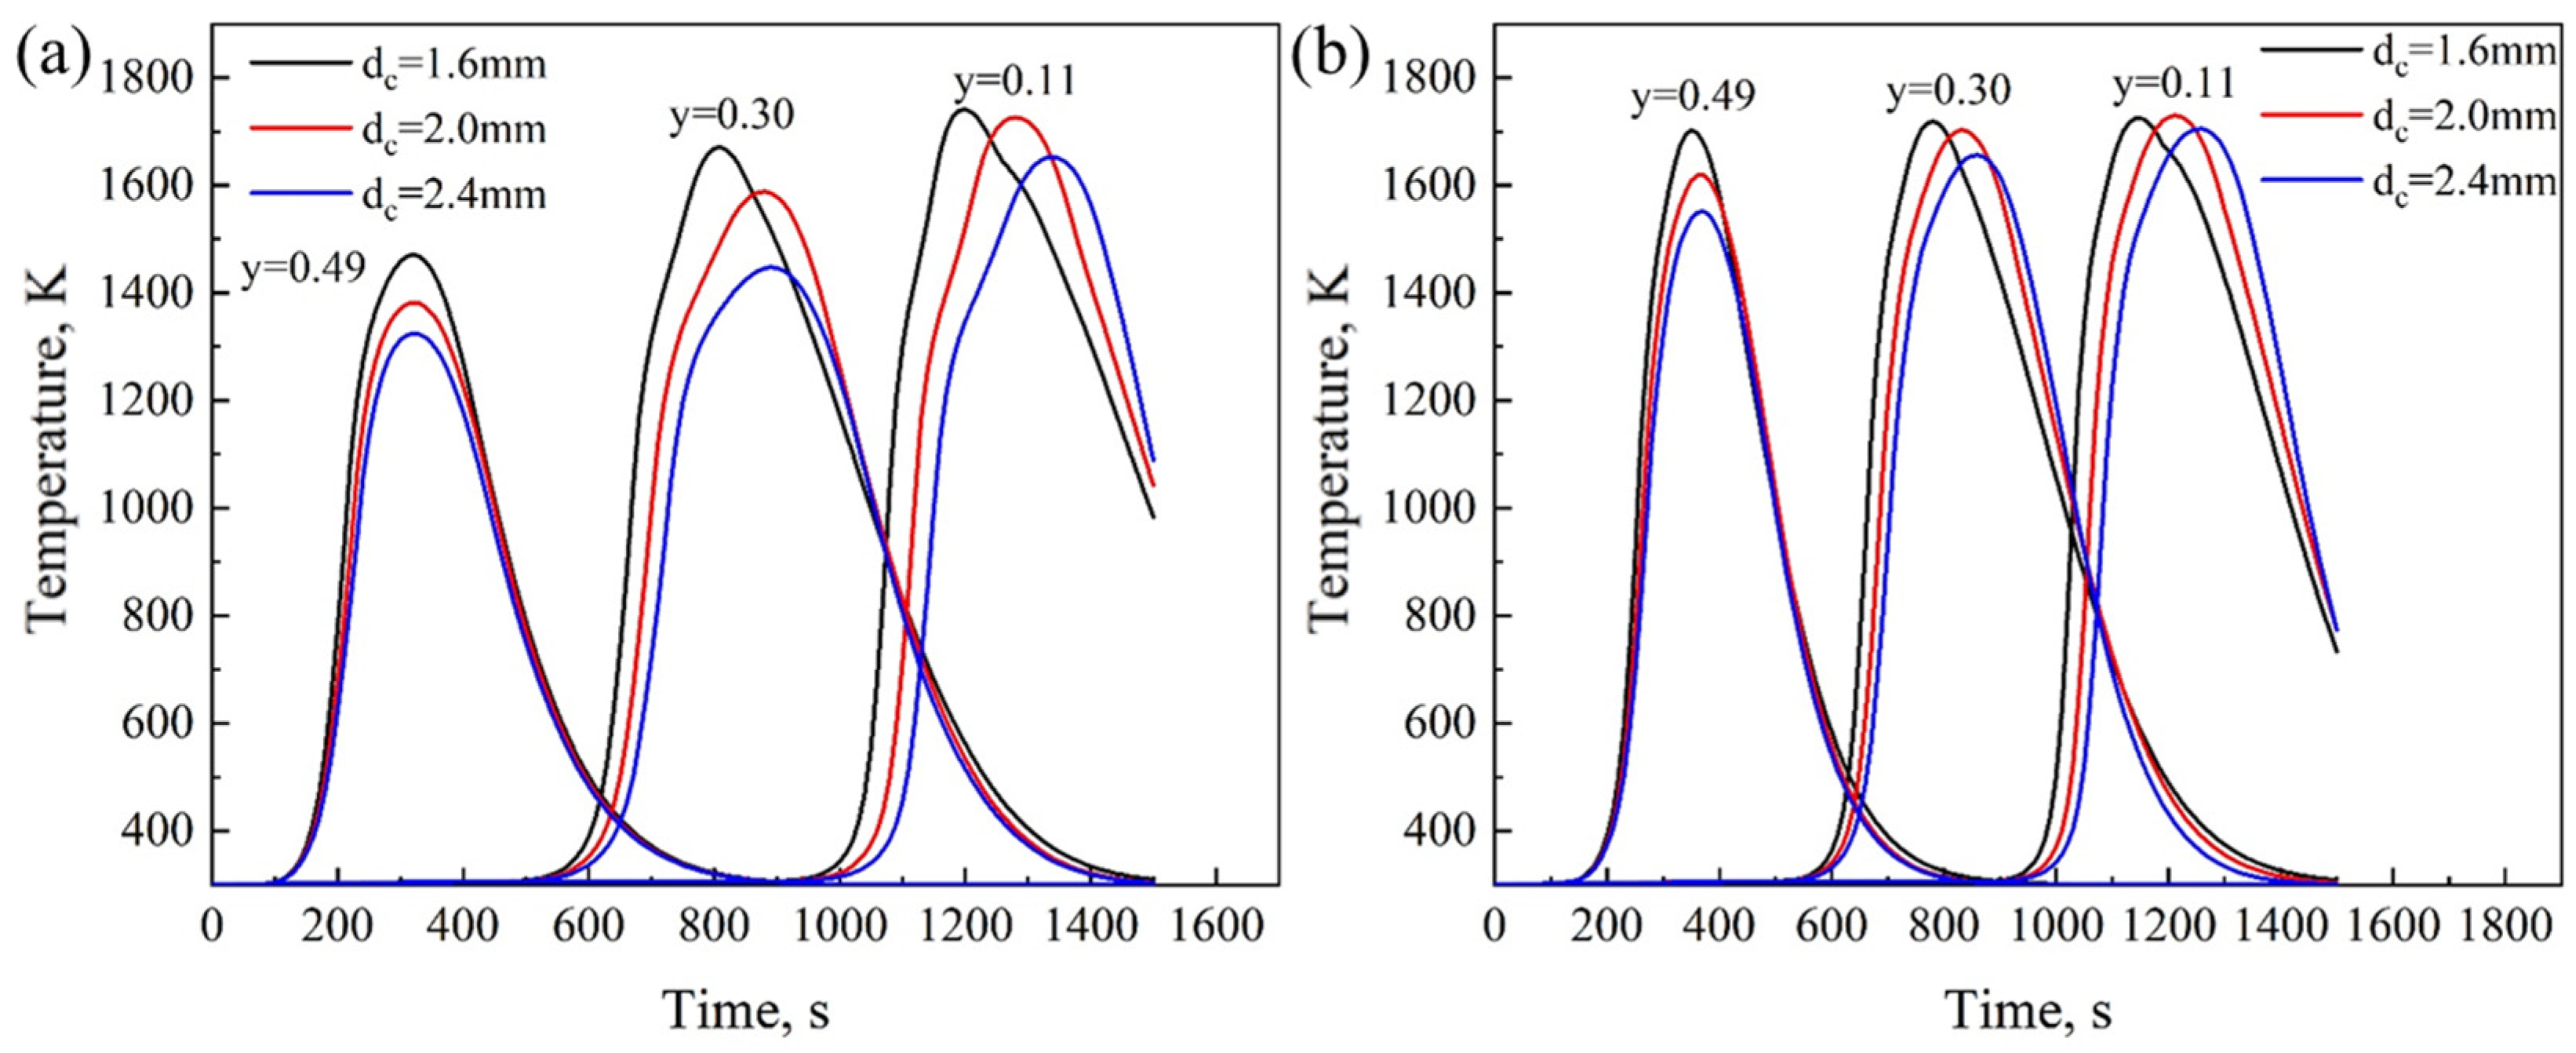
The degree of fuel combustion has a significant impact on the quality and yield of sintered ore, and the size of solid fuel coke particles greatly influences the chemical reactions during the sintering process. Figure 11 shows the effect of coke size (1.6 mm, 2.0 mm, and 2.4 mm) on temperature during the sintering process. Under the same coke size, the FLDS can provide more sufficient heat to the upper part of the sintering bed. Additionally, with FLDS, the maximum temperatures in the upper, middle, and lower layers differ only slightly, indicating that FLDS can provide more stable heat for the sintering process, which is beneficial to the quality of the sintered ore. Furthermore, as seen from the curves in the figure, as the coke size increases, the time required to reach the peak temperature in the sintering bed is gradually delayed. It indicates that an increase in coke size slows down the temperature rise during the sintering process, which is because of the combustion rate of coke is related to its surface area. The larger the surface area, the slower the reaction rate. It can also see that the increase in coke size leads to a decrease in the peak temperature in the sintering bed, particularly in the upper part (y = 0.49). The peak temperature decreases from a maximum of 1702 K to a minimum of 1552 K, which suggests that the increase in coke size slows down the reaction rate in the sintering bed, resulting in a corresponding reduction in peak temperature.
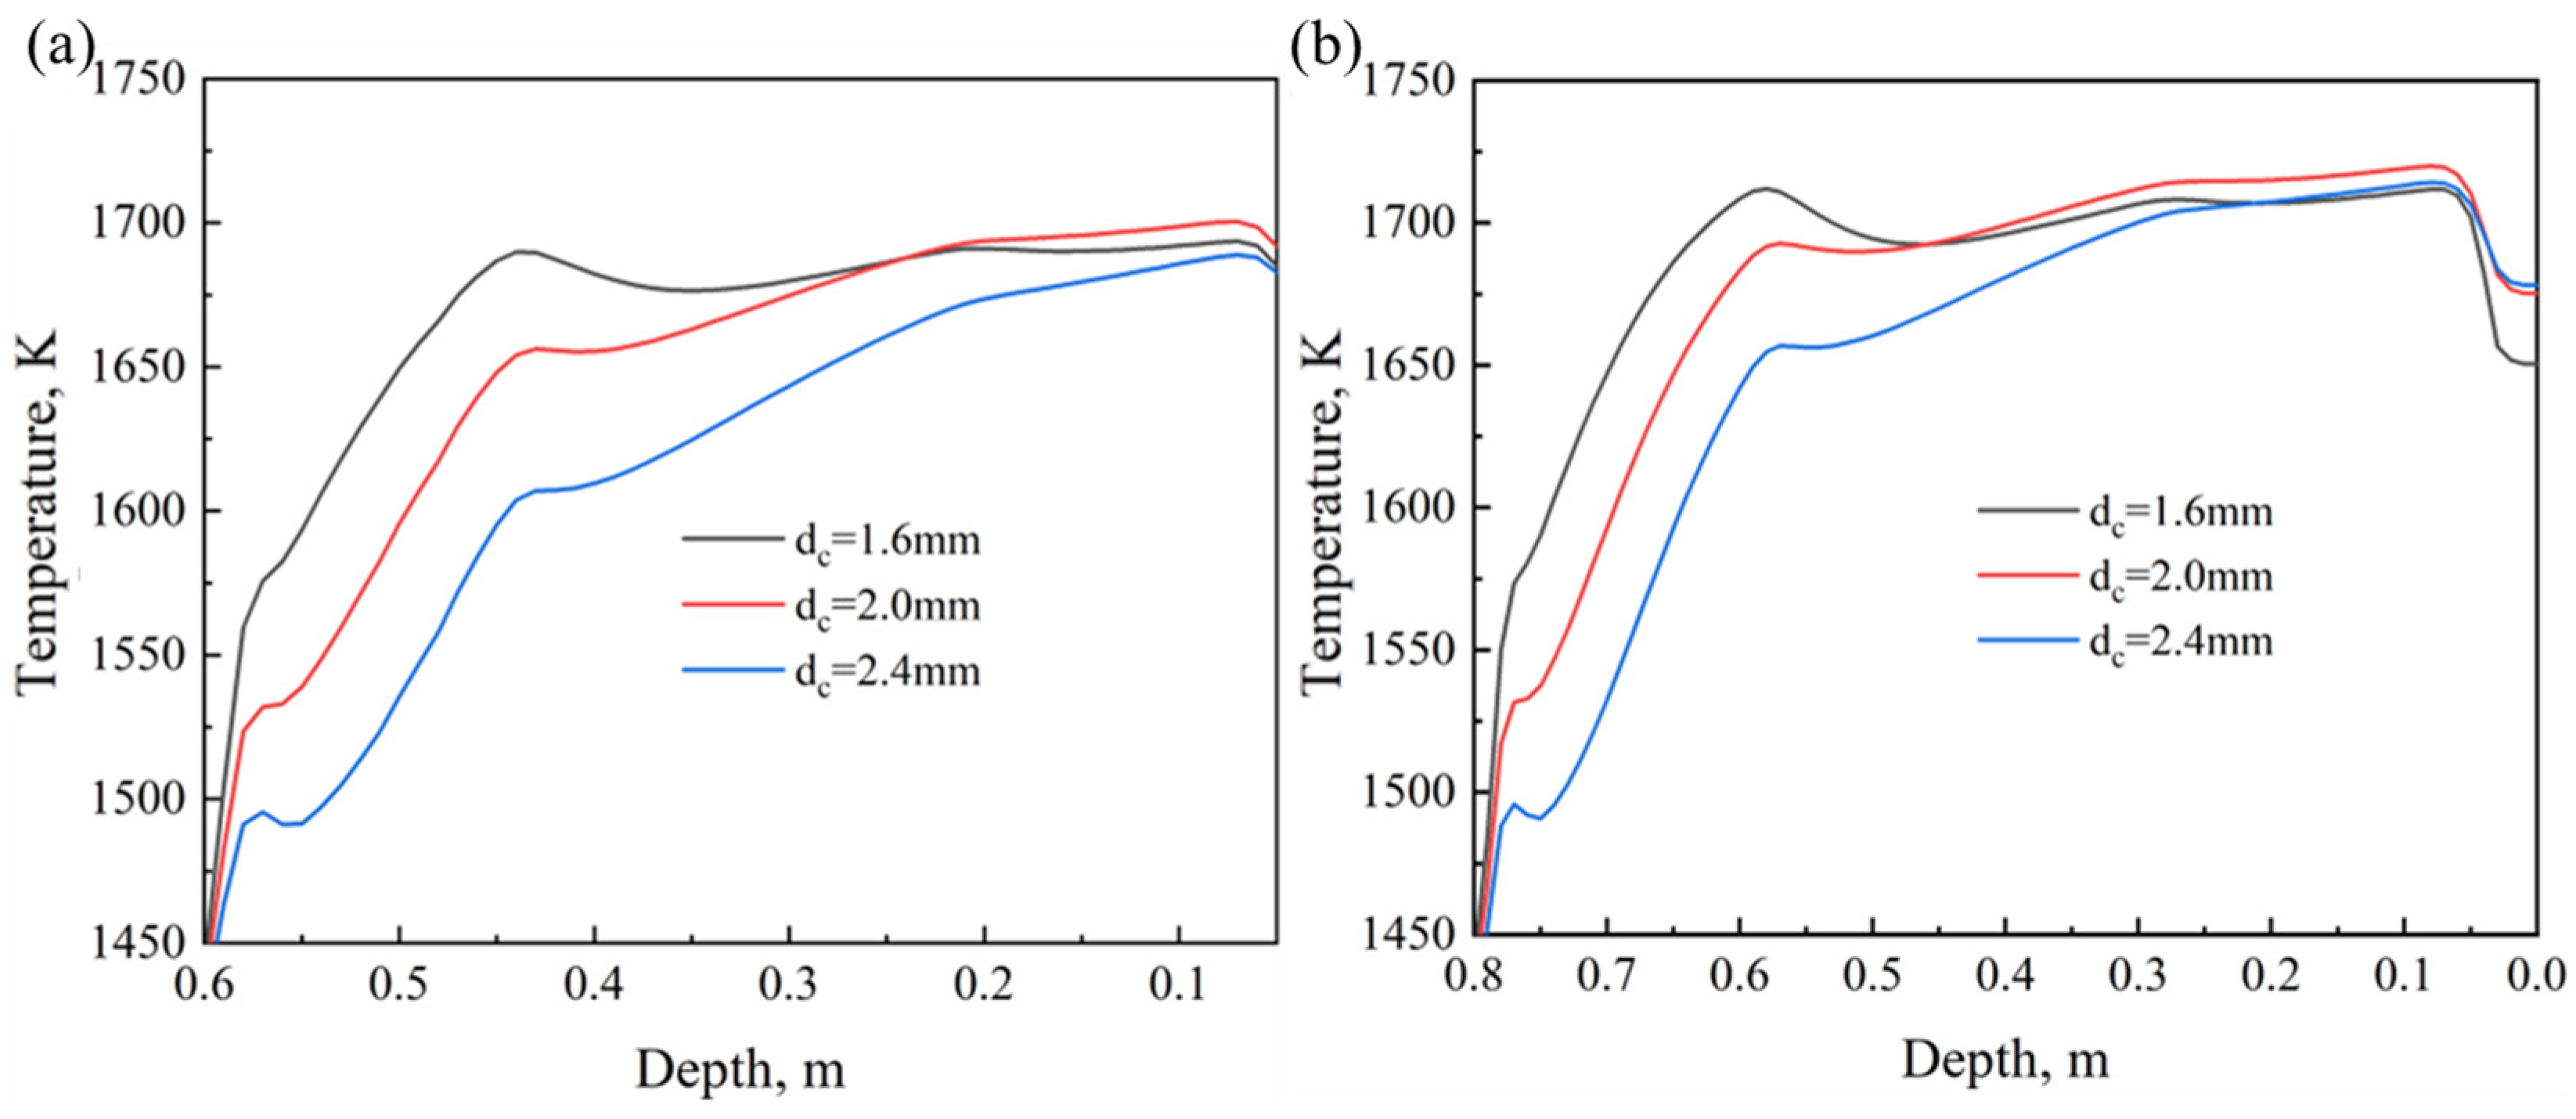
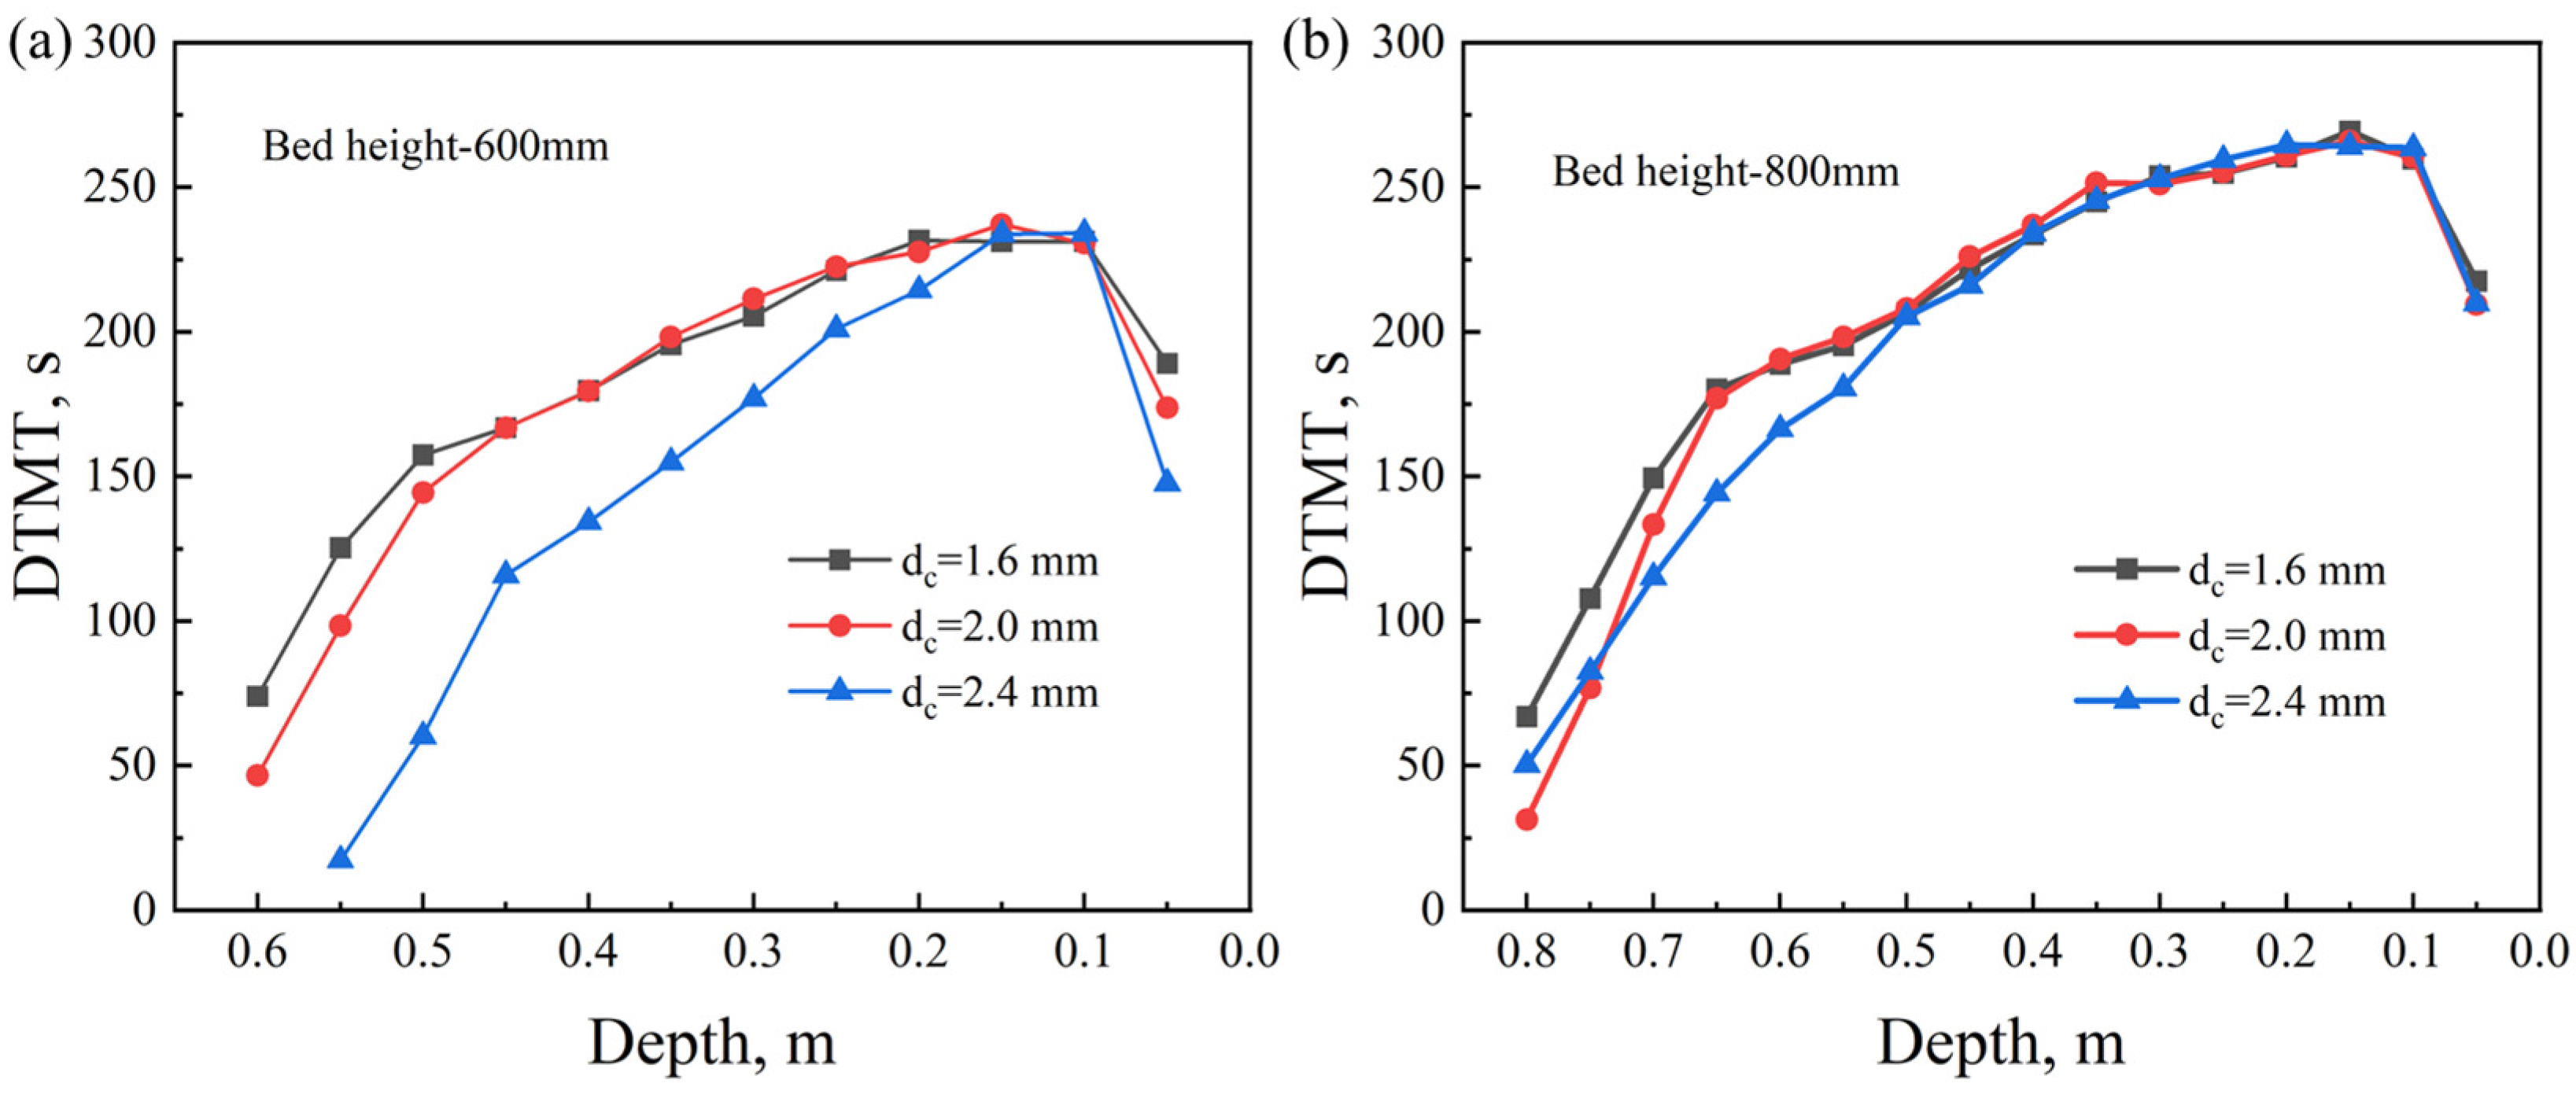
Figure 12 shows the effect of coke size on the maximum temperature in the sintering bed. It can be seen that as the coke size increases, the heating rate decreases, and the maximum temperature shows a downward trend. It indicates that an increase in coke size slows the reaction rate of coke, leading to a decrease in the maximum temperature. The red curve (dc = 2.0 mm) surpasses the black curve (dc = 1.6 mm) at the bottom of the sintering bed, which is due to the slower reaction rate of larger coke particles. Smaller coke particles (dc = 1.6 mm) react more quickly, resulting in higher maximum temperatures in the upper part of the sintering bed compared to larger coke particles. However, as the sintering progresses, smaller coke particles are consumed faster than larger ones, leaving insufficient fuel to supply heat in the lower part of the sintering bed. Larger coke particles can continuously provide heat for the sintering process, making them more effective in supplying heat to the bottom of the sintering bed. This phenomenon is also observed in thick material layers (as shown in Figure 12). At the bottom of the thick material layer (near the depth of 0.2 m), larger coke particles with a size of 2.4 mm can provide heat more effectively.
Figure 13 illustrates the relationship between coke size, flame front speed, and sintering time. It can be seen that as the coke size increases, the flame front speed gradually decreases, while the sintering time increases. It indicates that an increase in coke size slows the sintering process. This is because coke size is inversely proportional to its surface area, and a larger surface area reduces the combustion rate of the coke, and the decrease in flame front speed results in a longer sintering time. The choice of coke size has a significant impact on the sintering process. It is essential to find a balance between maintaining flame propagation speed and controlling sintering time. The point where the trends of flame front speed and sintering time intersect in the figure indicates a balanced particle size. At this size, the flame propagation speed is not significantly reduced, and the sintering time is not significantly prolonged.
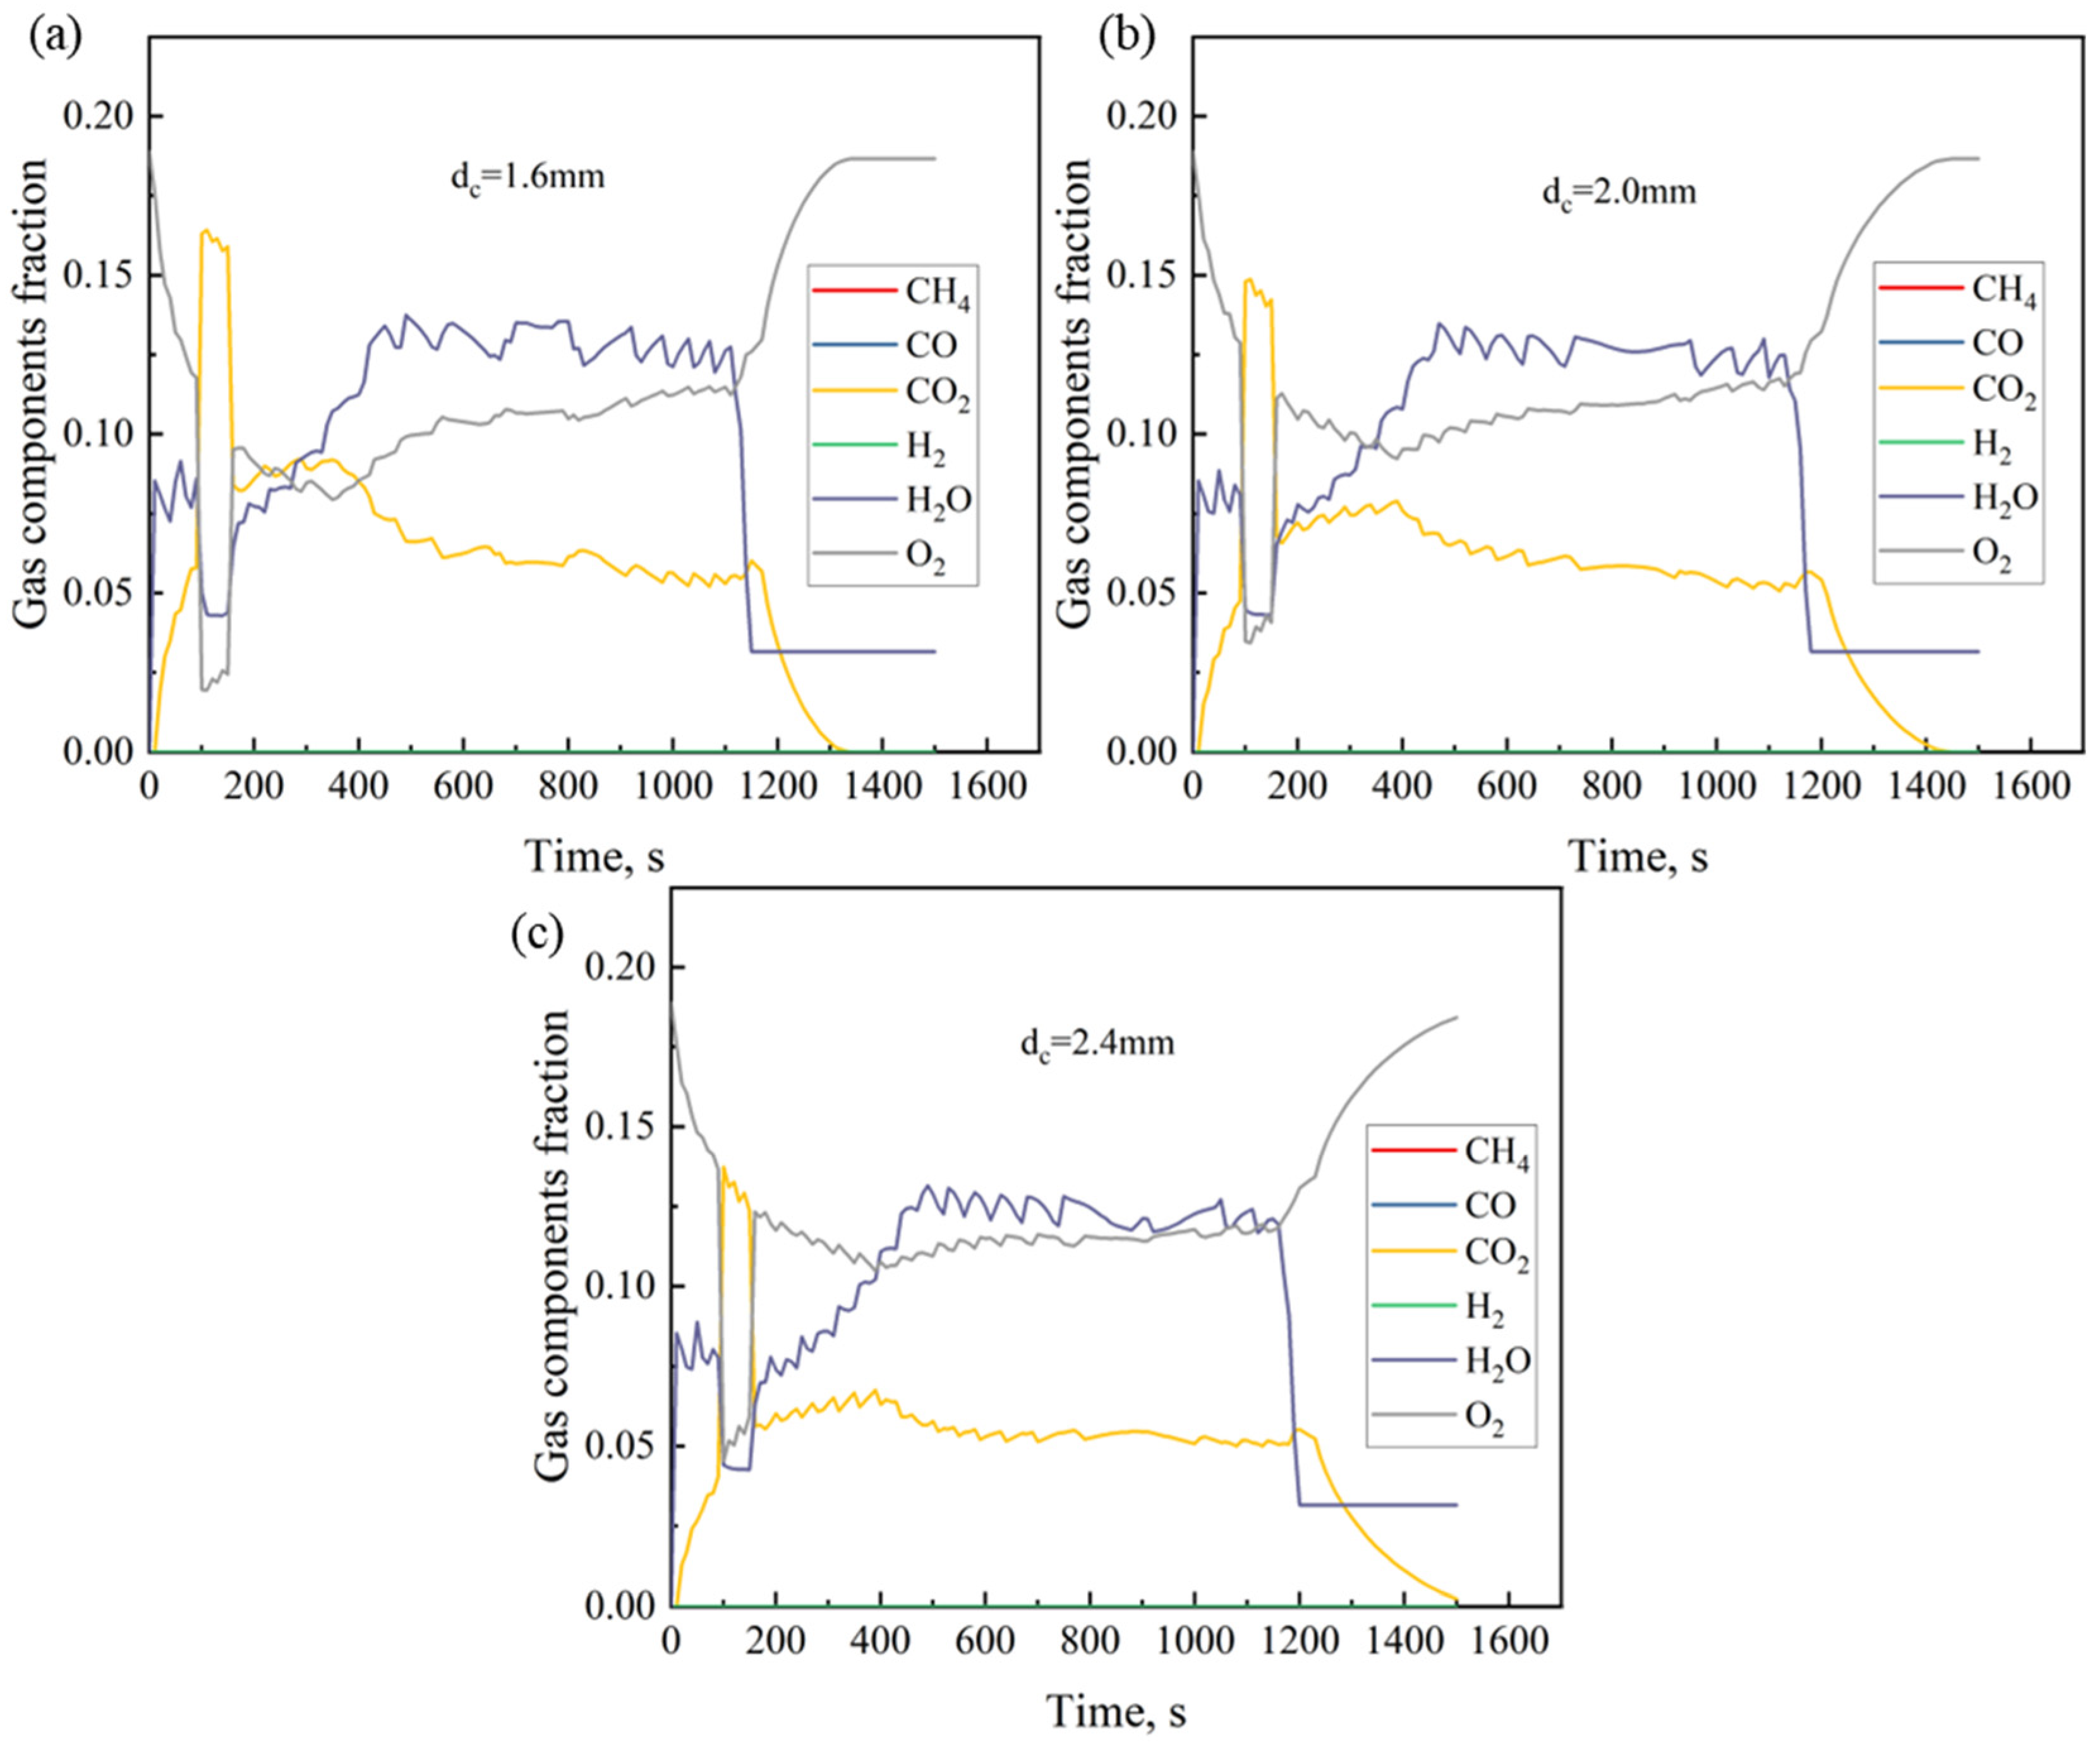
During the sintering process, coke size also has impact on gas reaction behavior and the concentration of gas components at the outlet. The changes in gas composition reflect the progression of various reactions during the sintering process, further influencing the energy efficiency and reaction uniformity of the process. As shown in Figure 14, during the initial stage (0–200 s), the oxygen concentration exhibits a noticeable decreasing trend, followed by a gradual recovery to a stable value. For small coke particles (dc = 1.6 mm), the oxygen concentration drops more rapidly, indicating a faster combustion reaction. In contrast, when the particle size increases to 2.4 mm, the oxygen concentration decreases more gradually, and the recovery speed is delayed, reflecting a slower combustion rate. Meanwhile, the CO2 peak for 1.6 mm coke appears earlier, indicating that the combustion reaction starts faster. For 2.4 mm coke, the CO2 generation is smoother and the concentration is lower, but in the later stages of the reaction, the CO2 concentration for larger coke particles is slightly higher than for smaller ones, suggesting that larger coke particles burn more slowly but more thoroughly. Under conditions with smaller coke particles, the H2O concentration is slightly higher because the higher reaction rate of small coke particles allows the high-temperature zone to expand downward more quickly. As a result, more moisture evaporates from the bed layer and moves to the outlet, causing the H2O concentration peak at the outlet to be higher and to appear earlier.
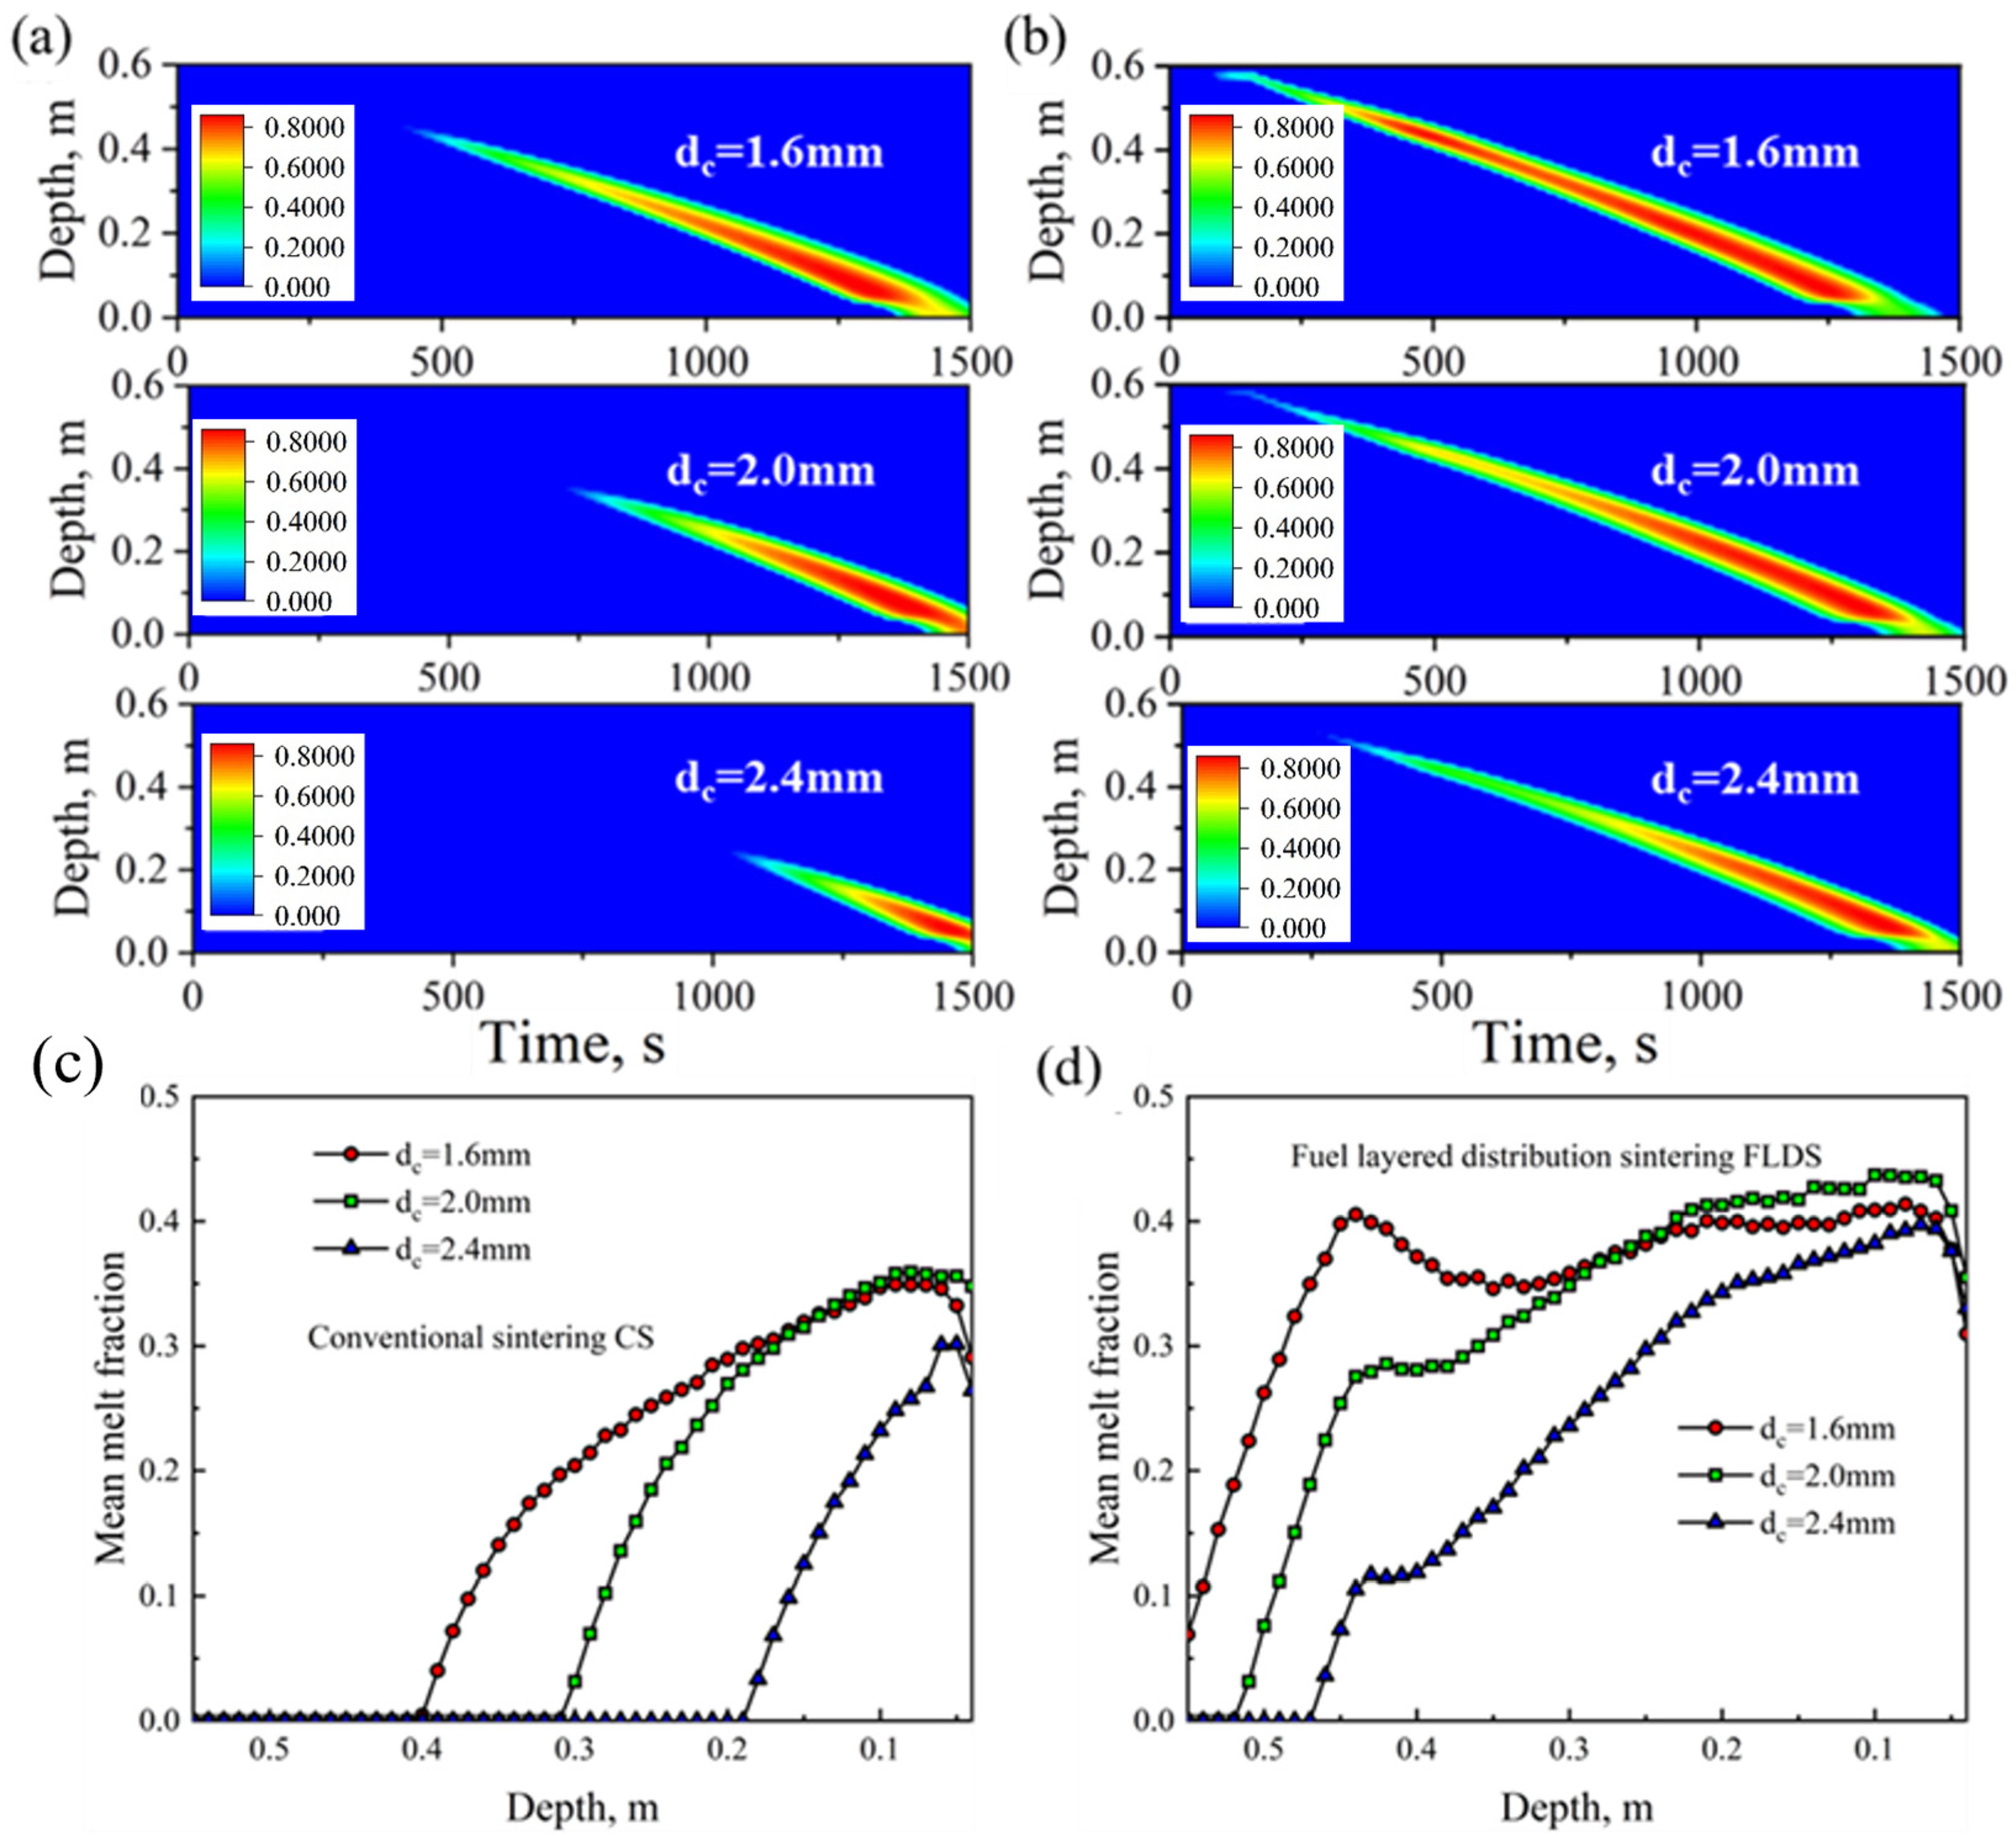
Figure 15 shows the effect of coke size on the average melt fraction under different sintering methods. It is evident that, under the same particle size, FLDS provides a higher and more stable melt fraction. For CS, there are varying degrees of insufficient melt fractions in the upper part of the sintering bed for all three coke sizes. Across the entire bed depth, smaller coke particles (dc = 1.6 mm) result in a higher average melt fraction. As the coke size increases, the overall melt fraction decreases, especially for dc = 2.4 mm, where the melt fraction is significantly lower than for other particle sizes. The dotted line graph in Figure 15 further illustrates that, in the upper part of the sintering bed, CS clearly exhibits insufficient melt fraction. Moreover, throughout the entire sintering process, CS fails to provide a stable melt fraction, while FLDS ensures more stable melt quality, which is beneficial to improve the quality of sintered ore. For dc = 2.4 mm, no melt is generated in the upper part of the sintering bed, ultimately leading to a decline in the quality of the sintered ore. Therefore, smaller coke sizes are more conducive to the formation of melt in the upper part of the bed layer and help achieve a more stable melt fraction throughout the sintering process, ensuring the final quality of the sintered ore.
Figure 16 illustrates the effect of coke size on the MQI. It can be observed that under different coke sizes, the MQI increases as the bed depth decreases and reaches its maximum near 0.1 m. It is due to the heat accumulation effect at the bottom of the sintering bed, where higher temperatures extend the reaction time, and the widened combustion zone facilitates the formation of the melt. The smaller the coke size, the higher the overall MQI value, indicating that smaller coke particles can more effectively enhance the melt mass fraction of the sintered ore, contributing to the formation of more high-quality sintered ore.
Figure 17a shows the effect of coke size on the duration time in melting temperature (DTMT). It can be seen that larger coke sizes result in a longer DTMT. This is because that larger coke particles extend the reaction time in the sintering bed, with a slower flame front advancement and combustion rate. Larger particles maintain high temperatures in the sintering bed for a longer period, thereby increasing the DTMT. When coke particles are smaller, combustion occurs more rapidly, allowing heat to quickly transfer to the deeper layers of the sintering bed. However, due to the rapid combustion, the temperature quickly drops after reaching its peak, completing the melting process in a short time and resulting in a shorter DTMT. At y = 0.35 m, the DTMT for dc = 1.6 mm exceeds that for dc = 2.0 mm. It is that larger coke particles can sustain the high-temperature state of the melting zone for a longer time through prolonged combustion within a certain particle size range. Although the combustion rate is slower, the continuous heat supply results in a longer DTMT. In contrast, smaller coke particles consume more fuel due to their intense reactions, and in the middle of the sintering bed, they fail to provide sufficient heat, leading to a reversal in the DTMT trend. A similar trend is observed in the sintering process for an 800 mm thick bed layer, as shown in Figure 18b. It can also be seen that, as the reaction progresses in the sintering bed, at y = 0.5 m, the DTMT for large coke particles (dc = 2.4 mm) exceeds that for dc = 1.6 mm, and subsequently, at the bottom of the sintering bed, it surpasses dc = 2.0 mm to become the highest. This indicates that larger coke particles can provide more heat at the bottom of the sintering bed, thereby extending the DTMT.
Figure 18a illustrates the effect of coke size on the combustion zone during the sintering process. It shows that smaller coke particles provide higher temperatures in the upper part of the sintering bed, with a wider combustion zone, which can be corresponded to the longer DTMT duration for smaller coke particles (dc = 1.6 mm) in the upper part of the sintering bed. Figure 18b shows the relationship between coke size and coke combustion time. It indicates that in the upper part of the sintering bed, where the sintering process has just started, smaller coke particles (dc = 1.6 mm) have a longer combustion time. While larger coke particles experience shorter combustion times due to the introduction of cold air after ignition. In the middle and lower parts of the sintering bed, the coke size is proportional to its combustion time. Larger coke particles require longer reaction times and can continuously provide heat for the sintering process. This also indirectly demonstrates the relationship between coke size and the duration of the melting zone.

5. Conclusions

In this work, the influences of oxygen content and coke size on the performance of fuel layered-distribution sintering process was investigated by numerical simulation. Each case was evaluated based on sintering time, maximum temperature, duration time in melting temperature (DTMT), flame front speed (FFS), and melt quality index (MQI). The main research conclusions are as follows:
(1)
With the increase in oxygen concentration, the FFS increases and the sintering time decreases. At the same time, the maximum temperature in the bed layer and the MQI both improve. During the oxygen-enriched period, as the flame front advances downward, the DTMT increases with the amount of oxygen enrichment, ultimately reaching its maximum at the bottom of the bed. The results indicate that for a 600 mm sintering bed layer, an oxygen enrichment time of 6 min and an oxygen concentration of 27% can balance sintered ore quality, sintering time, and flame front speed, ensuring the yield of sintered ore.
(2)
As the coke size increases, the heating rate during the sintering process slows down, the FFS decreases, and the sintering time increases. Smaller coke particles (dc = 1.6 mm) perform better in the upper part of the sintering bed. However, in the middle and lower parts of the sintering bed, slightly larger coke particles (dc = 2.0 mm) can provide a longer DTMT and higher melt quality. Under thick bed-layer conditions, larger coke particles perform better at the bottom of the sintering bed. Based on the 600 mm sintering bed case, smaller coke particles with dc = 2.0 mm represent the balance point between flame front speed and sintering time, enabling the sintering process to be accelerated to the greatest extent while ensuring the quality of the sintered ore.
(3)
Under different oxygen concentrations and coke sizes, The FLDS technology can provide more sufficient heat during the initial stage of sintering, promoting the generation of more melt in the upper part of the sintering bed compared to CS. Meanwhile, the FLDS technology can provide a more uniform melt mass, which helps improve the quality of the sintered ore. Currently, sintering technologies for thick bed layers of 800 mm, 900 mm, and 1000 mm have already been applied in actual production. Identifying suitable operating conditions for thick bed layers can help enterprises optimize production. Similar conclusions can be drawn for 800 mm thick bed layers compared to that of 600 mm. As the bed-layer thickness increases, using appropriately sized coke particles at different heights within the sintering bed can improve the quality of the sintered ore.

Author Contributions

Conceptualization, J.X., X.Y., Z.T., Z.Z., Y.W. and Q.Z.; methodology, J.X.; software, J.X. and X.Y.; validation, X.Y. and Q.Z.; formal analysis, Y.W. and Z.T.; writing—original draft preparation, J.X.; writing—review and editing, Z.Z.; supervision, Z.Z. All authors have read and agreed to the published version of the manuscript.

Funding

This research was funded by the Jiangxi Provincial Natural Science Foundation (No. 20232BAB214043) and National Natural Science Foundations of China (No. 52276154).

Data Availability Statement

The original contributions presented in this study are included in the article. Further inquiries can be directed to the corresponding author.

Acknowledgments

The authors sincerely thank the postdoctoral workstation of Fangda Special Steel Co., Ltd. for providing experimental and technical support for this project.

Conflicts of Interest

Author Qibin Zhan was employed by the company of Fangda Special Steel Co., Ltd. The remaining authors declare that the research was conducted in the absence of any commercial or financial relationships that could be construed as a potential conflict of interest.

References

  1. Yamaoka, H.; Kawaguchi, T. Development of a 3-D sinter process mathematical simulation model. ISIJ Int. 2005, 45, 522–531. [Google Scholar] [CrossRef]
  2. Eggersdorfer, M.L.; Kadau, D.; Herrmann, H.J.; Pratsinis, S.E. Multiparticle sintering dynamics: From fractal-like aggregates to compact structures. Langmuir 2011, 27, 6358–6367. [Google Scholar] [CrossRef]
  3. Cho, K.; Biswas, P. A geometrical sintering model (GSM) to predict surface area change. J. Aerosol Sci. 2006, 37, 1378–1387. [Google Scholar] [CrossRef]
  4. Yu, J.Y.; Xu, R.S.; Zhang, J.L.; Zheng, A.Y. A review on reduction technology of air pollutant in current China’s iron and steel industry. J. Cleaner Prod. 2023, 414, 137659. [Google Scholar] [CrossRef]
  5. Zhang, X.H.; Feng, P.; Xu, J.R.; Feng, L.B.; Qing, S. Numerical research on combining flue gas recirculation sintering and fuel layered distribution sintering in the iron ore sintering process. Energy 2020, 192, 116660. [Google Scholar] [CrossRef]
  6. Gao, Q.J.; Bao, L.; Zhu, P.X.; Jiang, X.; Zheng, H.Y.; Shen, F.M. Mathematical simulation of iron ore fines sintering process with solid fuel segregation distribution and corresponding heat pattern study. Metals 2022, 12, 2126. [Google Scholar] [CrossRef]
  7. Dai, F.L.; Fan, X.H.; Huang, X.X.; Chen, X.L.; Gan, M.; Ji, Z.Y.; Sun, Z.Q. Fuel-appropriate distribution of the material layer based on numerical model of sintering with particle swarm optimization algorithm. Minerals 2023, 13, 511. [Google Scholar] [CrossRef]
  8. Shrestha, S.; Xu, J.; Yu, A.B.; Zhou, Z.Y. Numerical simulation of fuel layered distribution iron ore sintering technology. Ironmak. Steelmak. 2022, 49, 83–100. [Google Scholar] [CrossRef]
  9. Menapace, C.; Cipolloni, G.; Hebda, M.; Ischia, G. Spark plasma sintering behaviour of copper powders having different particle sizes and oxygen contents. Powder Technol. 2016, 291, 170–177. [Google Scholar] [CrossRef]
  10. Kurinskiy, P.; Kim, J.H.; Nakamichi, M. Effect of plasma sintering on densification and oxygen content of beryllium powder. Nucl. Mater. Energy 2018, 17, 206–210. [Google Scholar] [CrossRef]
  11. Feng, D.; Ren, Q.X.; Ru, H.Q.; Wang, W.; Jiang, Y.; Ren, S.Y.; Zhang, C.P. Effect of oxygen content on the sintering behaviour and mechanical properties of SiC ceramics. Ceram. Int. 2019, 45, 23984–23992. [Google Scholar] [CrossRef]
  12. Cheng, P.C.; Chang, K.C.; Shiau, J.S.; Liu, S.H.; Hsieh, K.C.; Lin, S.K. Impact of low-grade iron ore on sintering reactions: Rapid heating experiments and thermodynamic modeling. J. Taiwan Inst. Chem. Eng. 2024, 165, 105817. [Google Scholar] [CrossRef]
  13. Rajak, D.K.; Ballal, N.B.; Viswanathan, N.N.; Singhai, M. Effect of oxygen enrichment on top layer sinter properties. ISIJ Int. 2021, 61, 79–85. [Google Scholar] [CrossRef]
  14. Peng, S.H.; Liu, H.; Sun, Z.Z.; Li, C.W.; Qin, Y.L.; Liu, W.Q.; Wang, G. Effect of oxygen enrichment on sintering behavior of high proportion vanadium–titanium magnesite concentrates. J. Iron Steel Res. Int. 2023, 30, 2122–2132. [Google Scholar] [CrossRef]
  15. Takehara, K.; Higuchi, T.; Yamamoto, T. Effect of oxygen enrichment on melting behavior in sintering process. ISIJ Int. 2024, 64, 521–529. [Google Scholar] [CrossRef]
  16. Gan, M.; Zheng, H.X.; Fan, X.H.; Ji, Z.Y.; Li, Q.; Wu, M.; Wang, Y.F.; Wang, X.L.; Wu, Y.F.; Chen, X.L.; et al. Influence of oxygen-rich hot air composite gas medium on sintering performance and function mechanism. J. Iron Steel Res. Int. 2024, 31, 1071–1081. [Google Scholar] [CrossRef]
  17. Ni, W.J.; Li, H.F.; Zhang, Y.Y.; Zou, Z.S. Effects of fuel type and operation parameters on combustion and NOx emission of the iron ore sintering process. Energies 2019, 12, 213. [Google Scholar] [CrossRef]
  18. Pahlevaninezhad, M.; Emami, M.D.; Panjepour, M. The effects of kinetic parameters on combustion characteristics in a sintering bed. Energy 2014, 73, 160–176. [Google Scholar] [CrossRef]
  19. Zhou, H.; Liu, Z.; Cheng, M.; Zhou, M.X.; Liu, R.P. Influence of coke combustion on NOx emission during iron ore sintering. Energy Fuels 2015, 29, 974–984. [Google Scholar] [CrossRef]
  20. Xiong, L.; Peng, Z.W.; Gu, F.Q.; Ye, L.; Wang, L.C.; Rao, M.J.; Zhang, Y.B.; Li, G.H.; Jiang, T. Combustion behavior of granulated coke breeze in iron ore sintering. Powder Technol. 2018, 340, 131–138. [Google Scholar] [CrossRef]
  21. Zhao, J.P.; Loo, C.E.; Dukino, R.D. Modelling fuel combustion in iron ore sintering. Combust. Flame 2015, 162, 1019–1034. [Google Scholar] [CrossRef]
  22. Zhang, B.; Zhou, J.M.; Li, M. Prediction of sinter yield and strength in iron ore sintering process by numerical simulation. Appl. Therm. Eng. 2018, 131, 70–79. [Google Scholar] [CrossRef]
  23. Park, J.; Lee, S.J.; Park, J.Y. Review of computational fluid dynamics modeling of iron sintering process. J. Mech. Sci. Technol. 2022, 36, 4501–4508. [Google Scholar] [CrossRef]
  24. Liu, Z.J.; Li, Z.; Wang, Y.Z.; Zhang, J.L.; Wang, J.B.; Niu, L.L.; Li, S.D.; Feng, B. Numerical simulation of heat and mass transfer behavior during iron ore sintering: A review. Metals 2023, 13, 1277. [Google Scholar] [CrossRef]
  25. Zhang, B.; Zhou, J.M.; Li, M.; Li, Y. Modeling and simulation of iron ore sintering process with consideration of granule growth. ISIJ Int. 2018, 58, 17–24. [Google Scholar] [CrossRef]
  26. Zhou, H.; Zhou, M.X.; Cheng, M.; Guo, W.S.; Cen, K.F. Experimental study and X-ray microtomography based CFD simulation for the characterization of pressure drop in sinter bed. Appl. Therm. Eng. 2017, 112, 811–819. [Google Scholar] [CrossRef]
  27. Cheng, Z.L.; Fu, P.; Guo, Z.G.; Yang, J.; Wang, Q.W. CFD prediction of heat/mass transfer in multi-layer sintering process assisted with gaseous fuel injection. Int. Commun. Heat Mass Transf. 2021, 128, 105654. [Google Scholar] [CrossRef]
  28. Wang, G.; Wen, Z.; Lou, G.F.; Dou, R.F.; Li, X.W.; Liu, X.W.Y.; Su, F. Mathematical modeling and combustion characteristic evaluation of a flue gas recirculation iron ore sintering process. Heat Mass Transf. 2016, 97, 964–974. [Google Scholar] [CrossRef]
  29. Castro, J.A.D.; Sazaki, Y.; Yagi, J.I. Three dimensional mathematical model of the iron ore sintering process based on multiphase theory. Mater. Res. 2012, 15, 848–858. [Google Scholar] [CrossRef]
  30. Hobbs, M.L.; Radulovic, P.T.; Smoot, L.D. Combustion and gasification of coals in fixed-beds. Prog. Energy Combust. Sci. 1993, 19, 505–586. [Google Scholar] [CrossRef]
  31. Patisson, F.; Bellot, J.P.; Ablitzer, D. Study of moisture transfer during the strand sintering process. Metall. Trans. B 1990, 21, 37–47. [Google Scholar] [CrossRef]
  32. Rangarao, G.C.P.; Chetana, U.V.; Veerraju, P. Mathematical model for computer simulation of moisture transfer in multiple package systems. LWT 1995, 28, 38–42. [Google Scholar] [CrossRef]
  33. Yi, M.; Wang, W.X.; Xue, M.; Gong, Q.H.; Xu, B.X. Modeling and simulation of sintering process across scales. Arch. Comput. Methods Eng. 2023, 30, 3325–3358. [Google Scholar] [CrossRef]
  34. Ramos, M.V.; Kasai, E.; Kano, J.; Nakamura, T. Numerical simulation model of the iron ore sintering process directly describing the agglomeration phenomenon of granules in the packed bed. ISIJ Int. 2000, 40, 448–454. [Google Scholar] [CrossRef]
  35. Pahlevaninezhad, M.; Emami, M.D.; Panjepour, M. Identifying major zones of an iron ore sintering bed. Appl. Math. Model. 2016, 40, 8475–8492. [Google Scholar] [CrossRef]
  36. Huang, X.X.; Fan, X.H.; Chen, X.L.; Zhao, X.Z.; Gan, M. Optimisation model of fuel distribution in materials bed of iron ore sintering process. Ironmak. Steelmak. 2018, 46, 649–655. [Google Scholar] [CrossRef]
  37. Yang, W.; Ryu, C.; Choi, S.; Choi, E.; Lee, D.; Huh, W. Modeling of combustion and heat transfer in an iron ore sintering bed with considerations of multiple solid phases. ISIJ Int. 2004, 44, 492–499. [Google Scholar] [CrossRef]
  38. Cheng, Z.L.; Yang, J.; Zhou, L.; Liu, Y.; Wang, Q.W. Sinter strength evaluation using process parameters under different conditions in iron ore sintering process. Appl. Therm. Eng. 2016, 105, 894–904. [Google Scholar] [CrossRef]
  39. González, D.F.; Ruiz-Bustinza, I.; Mochón, J.; González-Gasca, C.; Verdeja, L.F. Iron ore sintering: Quality indices. Miner. Process. Extr. Metall. Rev. 2017, 38, 254–264. [Google Scholar] [CrossRef]
  40. Zhou, H.; Liu, Z.H.; Cheng, M.; Liu, R.P.; Cen, K.F. Effect of flame-front speed on the pisolite-ore sintering process. Appl. Therm. Eng. 2015, 75, 307–314. [Google Scholar] [CrossRef]
  41. Than, V.T.; Wang, C.C.; Ngo, T.T.; Lin, C.H. Thermal behavior of polytetrafluoroethylene in the sintering process. Therm. Sci. Eng. Prog. 2022, 30, 101247. [Google Scholar] [CrossRef]
  42. Chen, Y.A.; Tan, J.L.; Sun, J.X.; Guo, H.S.; Bai, J.M.; Zhou, P.; Zhang, D.Y.; Liu, G. Effect of sintering temperature on the microstructures and mechanical properties of ZrO2 ceramics fabricated by additive manufacturing. Ceram. Int. 2024, 50, 11392–11399. [Google Scholar] [CrossRef]
  43. Wang, J.K.; Meng, H.X.; Zhou, H. Effect of biochar substitution on iron ore sintering characteristics based on optimization of fuel distribution through the bed. Fuel Process. Technol. 2023, 247, 107817. [Google Scholar] [CrossRef]
  44. Cheng, Z.L.; Tan, Z.T.; Guo, Z.G.; Yang, J.; Wang, Q.W. Recent progress in sustainable and energy-efficient technologies for sinter production in the iron and steel industry. Renew. Sustain. Energy Rev. 2020, 131, 110034. [Google Scholar] [CrossRef]
  45. Ji, M.; Xu, J.Y.; Yu, D.D.; Chen, M.; Mansori, M.E. Influence of sintering temperatures on material properties and corresponding milling machinability of zirconia ceramics. J. Manuf. Process. 2021, 68, 646–656. [Google Scholar] [CrossRef]
  46. Dai, F.L.; Huang, X.X.; Fan, X.H.; Chen, X.L.; Gan, M.; Ji, Z.Y.; Sun, Z.Q.; Zhao, G.G. Mathematical modeling and distribution characteristics evaluation of fuel particles in iron ore sintering process. Adv. Powder Technol. 2022, 33, 103688. [Google Scholar] [CrossRef]
  47. Ni, W.J.; Jiang, L.L.; Zhu, X.F.; Yi, X.; Li, H.F.; Shao, L.; Meng, F.C.; Zou, Z.S. Numerical simulation of iron ore sintering process with coke oven gas injection and oxygen enrichment. Int. J. Chem. React. Eng. 2022, 20, 1035–1051. [Google Scholar] [CrossRef]
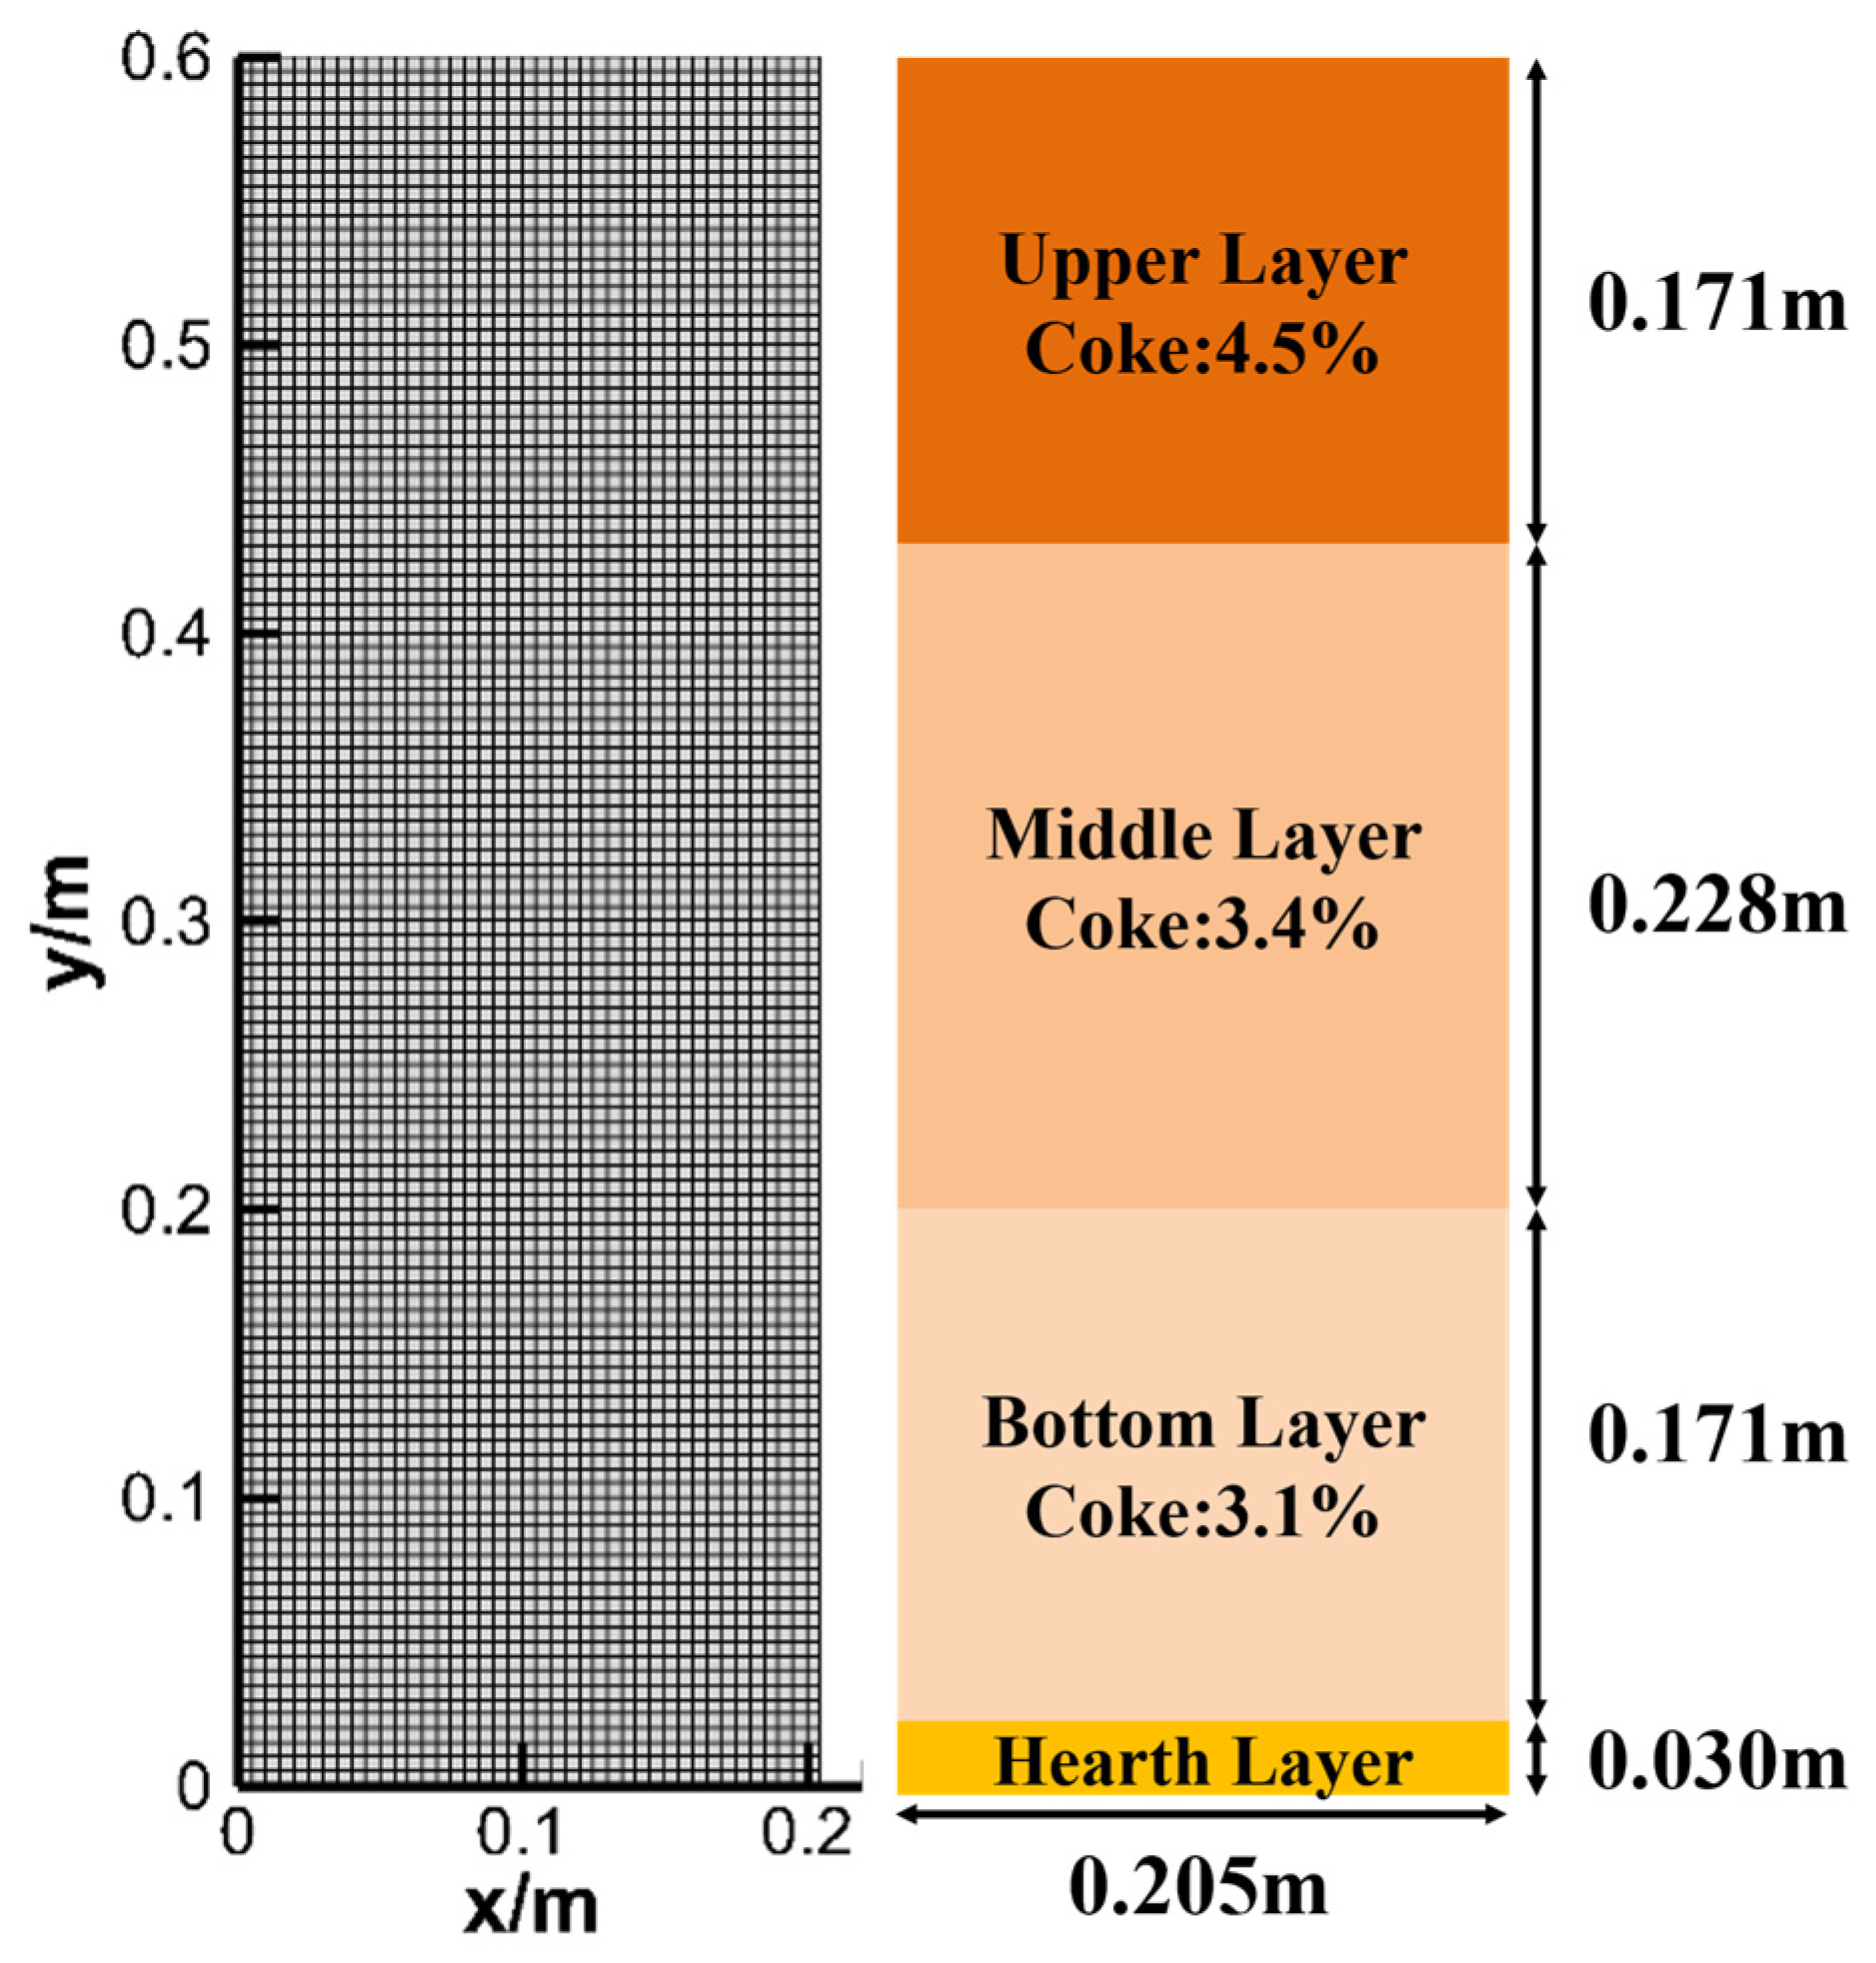
Figure 1. A schematic diagram of the 2D model and fuel layering content along the bed height.
Metals 15 00953 g001
Figure 2. (a) The variation process of the combustion zone over time; (b) the continuous temperature variation process in the sintering bed.
Metals 15 00953 g002
Figure 3. Comparison of the simulated bed temperature distribution with the experimental results.
Metals 15 00953 g003
Figure 4. Extraction of characteristic parameters from the solid temperature curve in the sintering pot.
Metals 15 00953 g004
Figure 5. The relationship between oxygen concentration and temperature in the sintering bed under different fuel distributions: (a) upper (y = 0.49 m), (b) middle (y = 0.30 m), and (c) lower (y = 0.11 m).
Metals 15 00953 g005
Figure 6. (a) Effect of oxygen content on the temperature distribution at different heights under FLDS conditions, and (b) effect of oxygen content on the maximum temperature distribution along the bed height.
Metals 15 00953 g006
Figure 7. The effect of oxygen concentration on the average melt mass fraction during the sintering process.
Metals 15 00953 g007
Figure 8. The effect of oxygen concentration on the average melt fraction: (a) CS; (b) FLDS.
Metals 15 00953 g008
Figure 9. The effect of oxygen concentration on (a) melt indicators and (b) duration of the melting zone.
Metals 15 00953 g009
Figure 10. The relationship between oxygen concentration, sintering time, and flame front velocity.
Metals 15 00953 g010
Figure 11. Effect of coke size on the temperature in the sintering bed: (a) CS, (b) FLDS.
Metals 15 00953 g011
Figure 12. Effect of coke size on the maximum temperature in the sintering bed with different height under FLDS conditions: (a) 600 mm, (b) 800 mm.
Metals 15 00953 g012
Figure 13. The effect of coke size on sintering time and flame front velocity under FLDS conditions.
Metals 15 00953 g013
Figure 14. The effect of coke size on gas composition at the outlet under FLDS conditions.
Metals 15 00953 g014
Figure 15. The effect of coke size on the average melt fraction under CS conditions (a,c) and FLDS conditions (b,d).
Metals 15 00953 g015
Figure 16. The effect of coke size on melt performance indicators under FLDS conditions.
Metals 15 00953 g016
Figure 17. The effect of coke size on the duration of the melting zone for different bed height (a) 600 mm and (b) 800 mm.
Metals 15 00953 g017
Figure 18. (a) Effect of coke size on the combustion zone, and (b) the relationship between coke size and combustion time.
Metals 15 00953 g018
Table 1. Gas–solid chemical reactions.
Expressions of ReactionReaction Rate
Coke combustion [18,30] R c = A p n c C ( i ) 1 ξ K r , c ( i ) + 1 K g ( i ) + 1 K e f f ( i )
Drying and condensation [31,32,33] r R = A k w t r R u T g ( P s a t P H 2 O )
Decomposition of limestone [22,34] R ( C a C O 3 ) = π d l 2 ( C ( C O 2 ) e C ( C O 2 ) ) n l d p S h D ( C O 2 ) + d p ( d p d l ) d l D e f f ( C O 2 ) + 2 × 4.1868 K l K r , l R g T s ( d p d l ) 2
Iron oxide reduction and oxidation R ( i ) = 4 π r o 2 ( C ( i ) C ( i ) e ) n h 1 K g ( i ) + r 0 ( r 0 r c ) r D e f f ( i ) + 1 K r , c ( i ) ( K h ( i ) 1 + K h ( i ) ) ( r o r ) 2
Melting and solidification [35] q m = t ( f m Δ H m ρ b ) , f m = T s T m 1 T m 2 T m 1
Table 2. Rates of gas–gas reactions.
Expressions of ReactionReaction Rate
CO + 0.5O2 → CO2 1.3 × 10 11 C O 2 0.5 10 11 C H 2 O 0.5 C ( C O ) e x p ( 15,100 / T s )
H2 + 0.5O2 → H2O 10 11 C ( H 2 ) C ( O 2 ) e x p ( 5050 / T s )
CO + H2O → H2 + CO2 2.78 C ( H 2 O ) C ( C O ) e x p ( 1510 / T s )
CO2 → CO + 0.5O2 7.5 × 10 11 C ( C O 2 ) e x p ( 46,500 / T s )
CH4 + 1.5O2 → CO + 2H2O 99.2 × 10 6 C ( C H 4 ) 0.5 C ( C O 2 ) e x p ( 9622 / T s )
H2 + CO2 → CO + H2O 93.96 C ( C O 2 ) C ( H 2 ) e x p ( 5604 / T s )
Table 3. Boundary and initial conditions.
ParametersValueParametersValue
Coke diameter0.0008 mInlet Air Velocity0.45 m/s
Limestone diameter 0.0008 mMass fraction of Coke3.6%
Iron ore diameter0.0016 mMass fraction of Limestone13%
Coke apparent density1200 kg/m3Mass fraction of Iron ore83.4%
Limestone apparent density1600 kg/m3Outlet pressure during ignition10,000 Pa
Iron ore apparent density2000 kg/m3Outlet Pressure 15,000 Pa
Initial porosity0.43Grid size0.0025 m × 0.0025 m
Sintering bed height0.6 mIgnition temperature1400 K
Disclaimer/Publisher’s Note: The statements, opinions and data contained in all publications are solely those of the individual author(s) and contributor(s) and not of MDPI and/or the editor(s). MDPI and/or the editor(s) disclaim responsibility for any injury to people or property resulting from any ideas, methods, instructions or products referred to in the content.