Article

Fatigue Prediction Method of Superalloy Based on the Improved Largest Lyapunov Exponent

School of Information Science and Engineering, Shenyang University of Technology, Shenyang 110870, China
*
Author to whom correspondence should be addressed.
Metals 2025, 15(9), 945; https://doi.org/10.3390/met15090945
Submission received: 9 July 2025 / Revised: 19 August 2025 / Accepted: 20 August 2025 / Published: 26 August 2025

Abstract

The crack growth process in metals can be continuously monitored and recorded in real time using highly sensitive acoustic emission technology. To predict this complex behavior, an improved largest Lyapunov exponent method, enhanced by a small data optimization approach named the small data method, is applied. Meanwhile, experimental results reveal that the acoustic emission signals collected during the fatigue crack growth process display distinct chaotic characteristics. By employing the small data method and cross-comparison analysis with the traditional Wolf method, the prediction accuracy and efficiency are significantly enhanced, even when only a limited amount of data is available. Compared to conventional techniques, this method demonstrates higher reliability and robustness, offering a powerful tool for early-stage monitoring and life prediction of metallic materials.

1. Introduction

Superalloys are extensively utilized for critical high-temperature components like heated end parts and turbine disks in aerospace, energy, and nuclear industries owing to their exceptional mechanical properties, high creep resistance, and robust oxidation resistance [1,2]. These components operate under extreme conditions of high temperature, high pressure, and high rotational speed, and are subjected to alternating and complex loading, making them particularly vulnerable to low-cycle fatigue damage. Fatigue fracture represents the predominant failure mode in metallic materials (accounting for approximately 50% to 90% [3]). Monitoring the propagation of cracks, conducting damage assessment, and issuing early warnings to prevent the occurrence of fatigue failure accidents are important means to ensure safe operation.
Acoustic emissions (AEs) are essentially elastic stress waves generated by a rapid release of energy from a localized source within a stressed material that can be detected by sensors [4,5]. AE sensors record data about the structure either periodically or continuously, making it possible to measure the response of the structure against damages and offering the advantages of high sensitivity, large information volume, and dynamic detection capability [5,6]. It is not limited by the geometric shape of the specimen or structure, nor does it require the knowledge of the precise location of cracking [6]. Therefore, AE detection technology as an important non-destructive testing method [7] and an ideal method for evaluating structural integrity and material degradation [8] has been applied to different engineering applications, such as equipment condition monitoring [9], manufacturing processes [10], and damage detection and characterization of composite materials [11]. Combining AE detection technology with fatigue fracture theory to monitor the fatigue crack growth and fracture of metals has both theoretical significance and application value.
AE monitoring involves the utilization of sensors and preamplifiers to detect elastic waves propagated inside a material [12]. The waves are directly transmitted to the AE instrument, where they can be recorded, stored, analyzed, and transferred to digital signals [12,13]. AE signals are often composed of parameters such as rise time, duration, counts, amplitudes, energy, and absolute energy [7,8,12]. The definitions of these typical AE parameters are illustrated in Figure 1.
The oscillation curve in Figure 1 represents the detected burst AE wave. The threshold voltage that is higher than the background noise is called the threshold, and each time the signal exceeds the threshold, it is called a hit. The time interval from the first time the signal exceeds the threshold to the maximum amplitude is called rise time, which is often used to identify noise. The time interval from the first time the signal exceeds the threshold to the last time it drops to the threshold is called duration, which is also used for noise discrimination. The number of times the signal amplitude exceeds the threshold is called counts, which roughly reflects the intensity and frequency of the signal and is used to evaluate acoustic emission activities. The maximum amplitude value of the signal waveform is called amplitude, which is used for the type identification of the wave source, as well as the measurement of intensity and attenuation. Energy usually refers to energy count, which is the area below the envelope of the signal amplitude, reflecting the relative energy or intensity of the event. Absolute energy is the area of the envelope formed by the square of the signal amplitude, which can truly reflect the energy released by the AE source in the form of elastic waves.
Early and accurate identification of the upcoming critical damage stage is crucial for avoiding premature failure [14,15,16]. At present, a large number of works have qualitatively evaluated the damage during the fatigue crack growth process based on the characteristics of AE parameters [8,13,17,18,19,20]. Among the many AE parameters, count has been selected as primary candidate for fatigue damage assessment [8,13,16,17], such as ringing count, energy count, and event count. The advantage of count lies in its simplicity in processing and its ability to roughly reflect the signal strength and frequency. Count can be used to evaluate the activity of AE, but it is affected by thresholds and noise. Some scholars have comprehensively analyzed the fatigue crack growth characteristics of metal using count, duration, rise time, energy, and amplitude [13]. Absolute energy as an AE signal parameter is also used to detect [18] and predict [6] fatigue crack growth.
Nemati et al. [18] indicated that the absolute energy has a relatively small dependence on the threshold setting. Yu et al. [6] found that the absolute energy rate was more suitable than count rate for crack length and fatigue life prediction. Researchers have also proposed new acoustic emission parameters. For instance, Aggelis et al. [21] used the RA value (the ratio of rise time to amplitude) to evaluate the fatigue damage of metal plates. Keshtgar et al. [20] proposed that AE intensity is a combination of count, amplitude, and amplitude threshold for evaluating the growth of small cracks. However, in the monitoring processes, such as fatigue tests or the operation of engineering structures, the traditional AE parameters used to evaluate fatigue damage rely heavily on thresholds and parameter settings and are affected by the wave propagation medium and attenuation characteristics [7,8,12]. In particular, the dispersion of parameters such as count and energy is very large. These parameters, if set inappropriately under complicated loading conditions, could greatly affect the AE results and consequently lead to more uncertainties in the assessment of fatigue damage and fatigue life [22].
In the scenario of period load, the rotational speed of rotating machinery is often fixed, and the fatigue caused in the metal components is periodic. Some experimental results show that the signals generated during the metal fatigue fracture process are usually nonlinear, random, and dissipative. The traditional linear theory analysis methods are limited in the study of the metal fatigue damage process, while the chaos theory can better reveal the dynamic characteristics of the metal fatigue damage process. Therefore, it is of great significance to study the AE chaotic characteristics of metal fatigue under periodic loading conditions. The largest Lyapunov exponent, as one of the common chaotic characteristic parameters, provides qualitative and quantitative representations of dynamic behaviors and also serves as a good predictive parameter for chaotic systems. Some scholars have established prediction models based on the largest Lyapunov exponent, which can achieve good results in various fields. The changing trend of the largest Lyapunov exponent has a certain correlation with the degree of metal fatigue damage and can be used as a characteristic parameter for monitoring and predicting the state of metal fatigue damage.
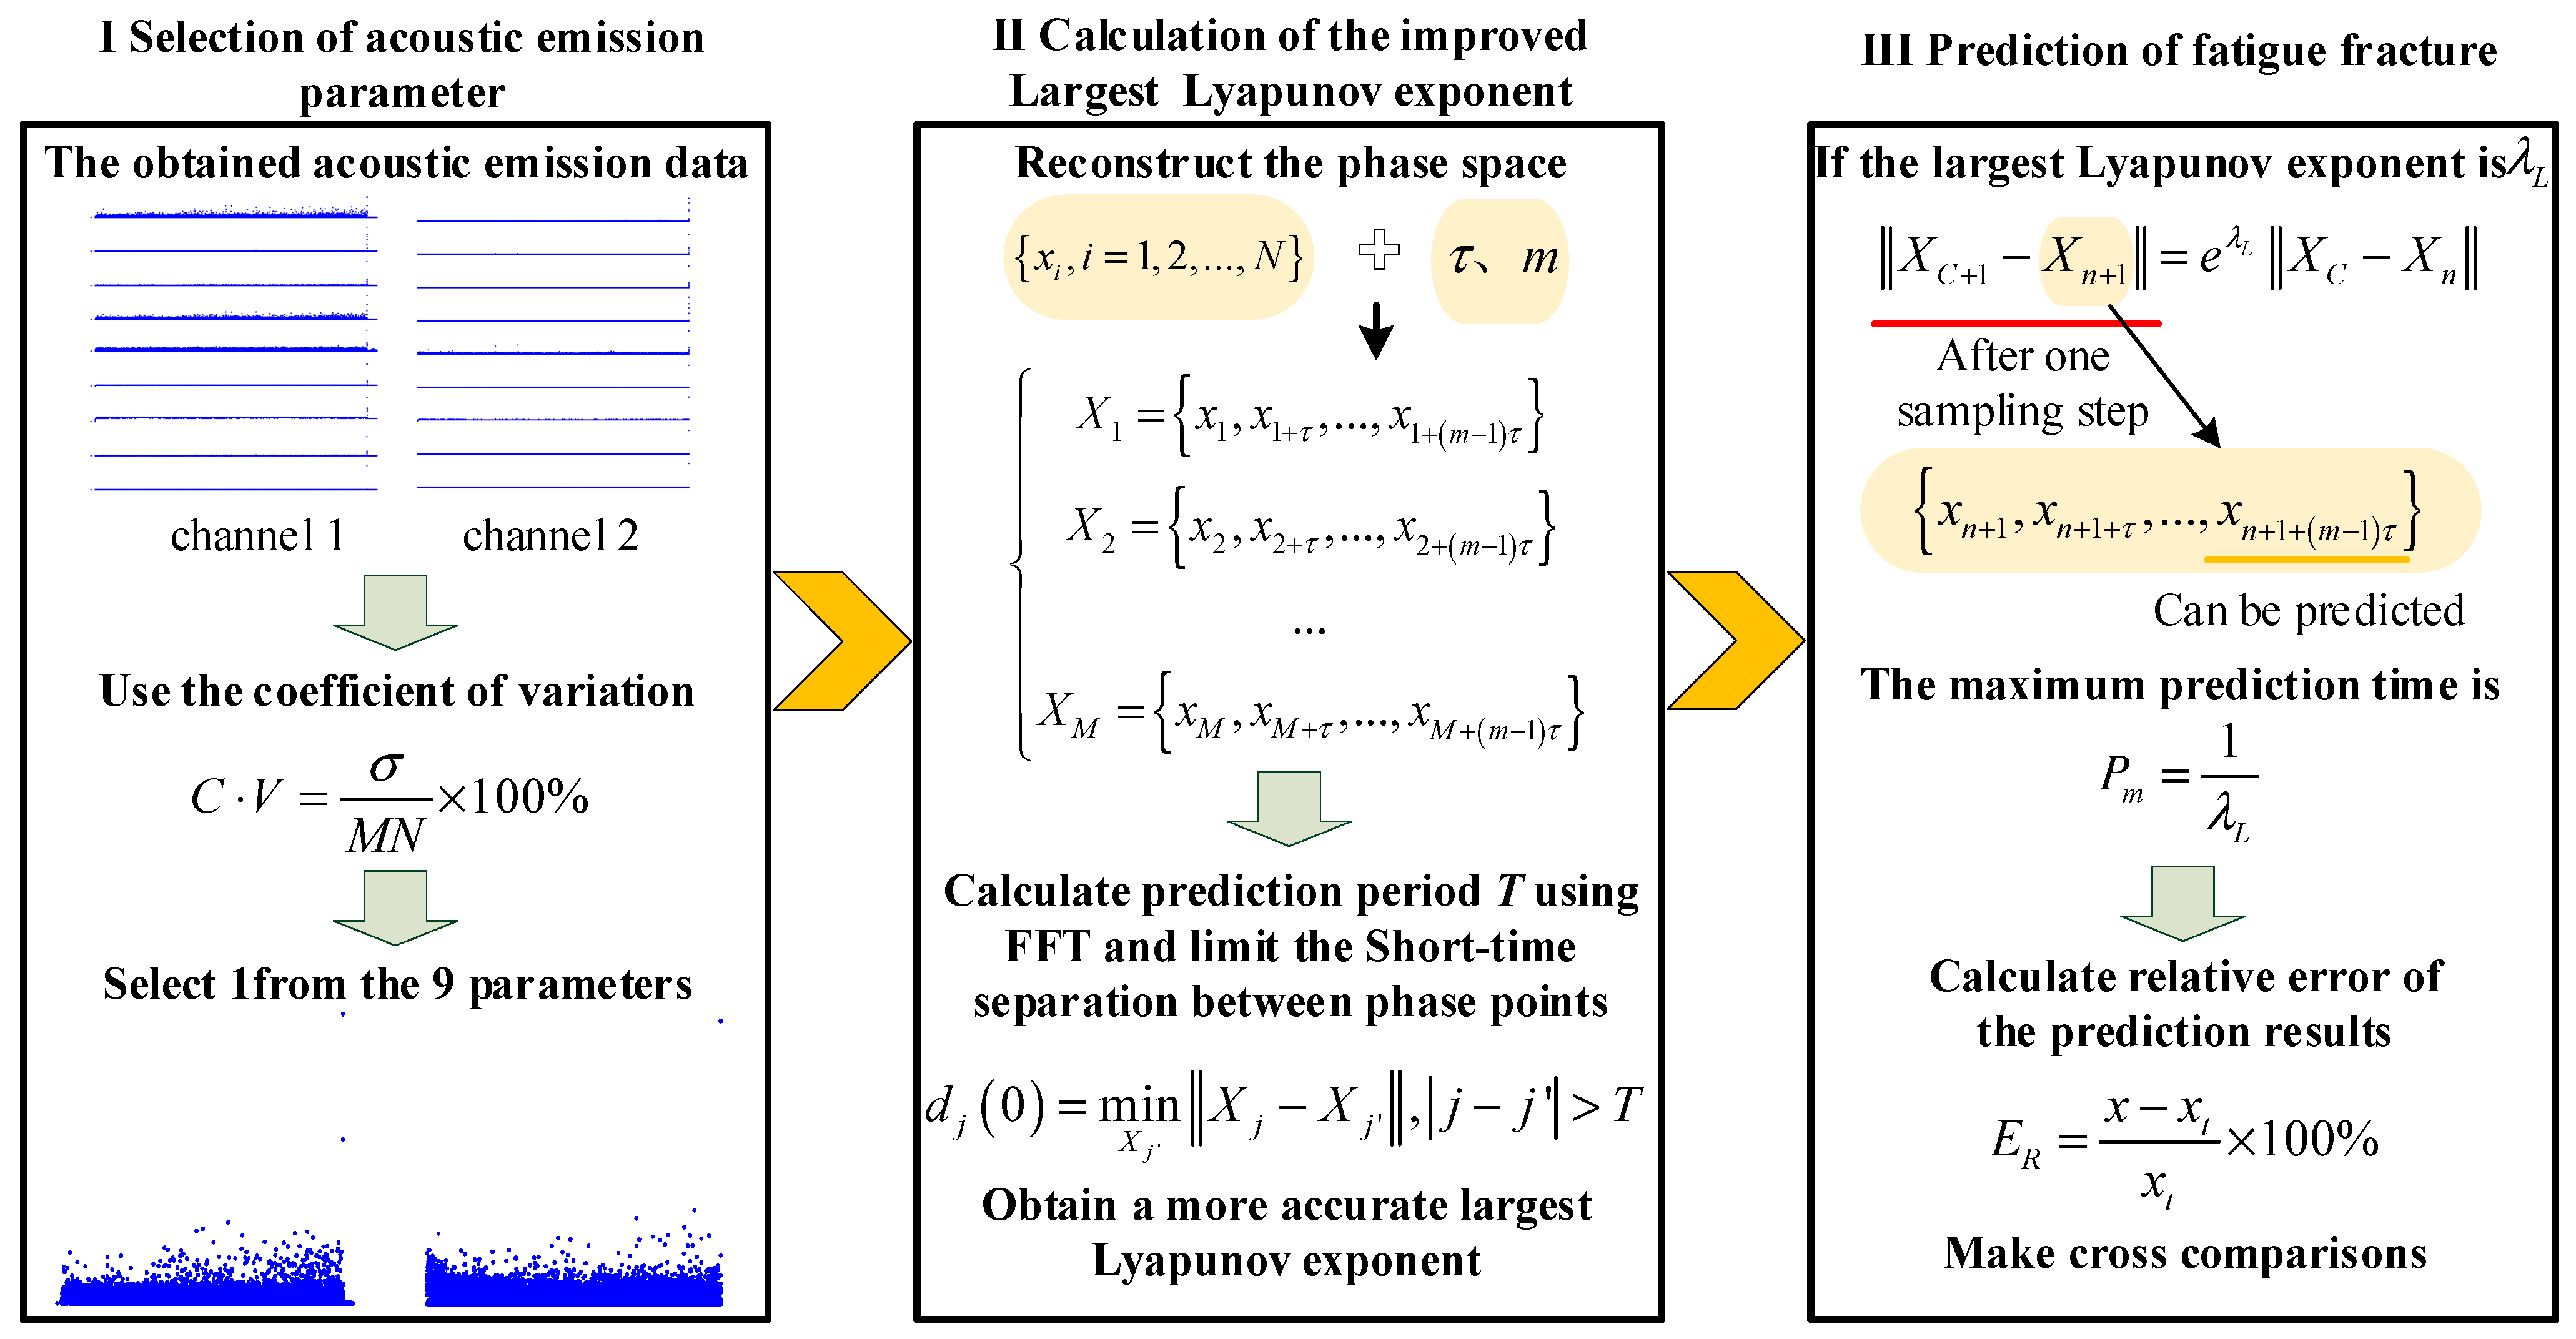
As stated above, chaos theory has been widely introduced into the prediction research of various materials. In this paper, we mainly adopt the small data method based on the largest Lyapunov exponent (parameter of chaos theory) in order to predict the fatigue crack growth process of superalloys. The results of cross-comparison analysis of two samples suggest that the small data method can indeed make the prediction of the fatigue crack growth process of superalloys more efficient and accurate and is more applicable in cases with a small amount of data. The process of the proposed method is shown in Figure 2.

2. The Largest Lyapunov Exponent and Prediction

2.1. The Improved Algorithm for the Maximum Lyapunov Exponent

The Lyapunov exponent is an important quantitative indicator for measuring dynamic characteristics that characterizes the average exponential rate of convergence or divergence between adjacent trajectories of a system in the phase space. When solving practical problems, it is unnecessary to determine whether there is chaos in the system by calculating all Lyapunov exponents, only the largest Lyapunov exponent needs to be calculated. If the largest Lyapunov exponent λ is greater than 0, chaotic attractors exist, and the system is a chaotic system. If the largest Lyapunov exponent λ is less than 0, the system is a random system or a deterministic system. If the largest Lyapunov exponent λ is equal to 0, the system is a periodic system. Therefore, as long as the largest Lyapunov exponent is greater than 0, it can be affirmed that chaos exists in the system.
Based on the largest Lyapunov exponent, that is, the average divergence rate of the trajectories, combined with the phase space reconstruction technique [23], the small data method adopted in this paper is able to determine separation limit distance of phase points more appropriately through the fast Fourier transform (FFT), which tracks the evolution of the nearest neighbor points adaptively to obtain a better value of Lyapunov exponent and then make predictions. The specific steps [24] are as follows:
1.
Suppose { x i ,   i = 1 , 2 , , N } is a time series whose sampling interval is Δ t ;
2.
Time delay τ is determined using the autocorrelation function method, and embedding dimension m is determined using the G-P method [25];
3.
Reconstruct the phase space according to the calculated τ and m to obtain the m-dimensional phase space with M phase points { x j , j = 1 , 2 , , M } as follows:
X 1 = x 1 ,   x 1 + τ ,   ,   x 1 + m 1 τ X 2 = x 2 ,   x 2 + τ ,   ,   x 2 + m 1 τ X M = x M ,   x M + τ , , x M + m 1 τ
4.
Find the nearest neighbor points X j , of each phase point X j , and limit their short-term separation by the average period T obtained by using FFT to prevent them from being on the same trajectories as follows:
d j 0 = min X j X j X j ,   j j > T
5.
Determine the distance between each phase point X j and its nearest neighbor point X j , after the sth discrete-time step, as follows:
d j s = X j + s X j + s ,   s = 1 ,   2 ,   ,   m i n   M j , M j
6.
Suppose there exists an exponential divergence rate λ between the phase point X j and its nearest neighbor point X j , then obtain the following:
d j s = C j e λ s · t ,   C j = d j 0
The logarithms of both sides of the above equation are obtained as follows:
ln d j s =   ln C j + λ s · t
It can be seen that the relationship between ln d j s and s is linear, and the slope of the curve is λt;
7.
For each s, find the average value p(s) of all ln d j s corresponding to j as follows:
p s = 1 f t j = 1 f ln d j s
where f is the number of non-zero d j s ;
8.
Determine the linear region of curve p ( s ) ~ s , and use the least square method to draw a regression line, the slope of which is the largest Lyapunov exponent λ L .
Compared with the traditional Wolf method [26], the small data method does not need to consider the included angle between phase points and uses FFT to limit the short-term separation, which reduces the amount of calculation while minimizing the interference of subjective factors, thereby enhancing the efficiency and accuracy of prediction.

2.2. Prediction Method and the Maximum Prediction Time

As a characteristic quantity for quantifying the exponential divergence of the initial trajectory and estimating the chaos level of the system, the Lyapunov exponent can serve as an effective prediction parameter for the system.
Suppose X C is the center point in the phase space and X n is the nearest neighbor point of X C , the distance between these two points is expressed as follows:
d C 0 = min X C X j = X C X n
If the largest Lyapunov exponent is λ L , then after one sampling time, the distance between the two points increases by e λ L times as follows:
X C + 1 X n + 1 = e λ L X C X n
In Equation (8), only the last component x C + 1 + m 1 τ of phase point X C + 1 is unknown, which can be predicted through the above steps.
Furthermore, the maximum prediction time [27] is generally defined as follows:
P m = 1 λ L
It represents the maximum time required for the system state error to double and can be used as a reliability indicator for short-term prediction.

3. Results

3.1. Experimental Method

The material of the test rod used in the low-cycle fatigue tension test is standard superalloy. Tests were conducted on 30 samples, and two of which were used as the experimental samples that meet the experimental requirements, namely sample 1 and sample 2. The R values of sample 1 are 1.55 and 2.27 in the two channels, separately, and the R values of sample 2 are 1.55 and 2.38 in the two channels, separately. The samples were prepared in accordance with the national standard GB/T 15248-2008 [28] in China, which is shown in Figure 3.
The test was conducted on a static hydraulic universal testing machine of Instron-300DX, with a maximum load of 300 kN and an error of less than 1%, the manufacturer of which is Instron from Boston, MA, USA. Two sensors were separately placed on the test fixture. In this experiment, load and load frequency are 30 kN and 10 Hz, respectively, indicating that this is a low-cycle fatigue experiment.
The AE signals during the process of fatigue crack growth are monitored using the third-generation fully digital SAMOS (PCI-8) AE detection system produced by Physical Acoustics Corporation (PAC), West Windsor Township, NJ, USA. Each channel has four high-pass and four low-pass analog filters, with 16-bit A/D accuracy. The threshold value is 40 dB, the preamplifier gain is 40 dB, the bandwidth is 100 kHz to 400 kHz, and the sampling rate is 1 MHz. Eight basic characteristic parameters can be collected, among which the six common ones include rise time, count, energy, amplitude, signal strength, and absolute energy. The acquisition process of the acoustic emission signal is shown in Figure 4.

3.2. Experimental Results

In this experiment, superalloy test rods were used as samples for low-cycle fatigue tests, and two sets of AE signals were measured separately by two sensors on each sample called sensor 1 and sensor 2. Data were recorded from the start of the low-cycle fatigue tests on the intact samples to the fracture, which lasted for 862.8 s for sample 1 and 1930.4 s for sample 2. According to the load frequency 10 Hz, the number of cycles are 8628 and 19,304.
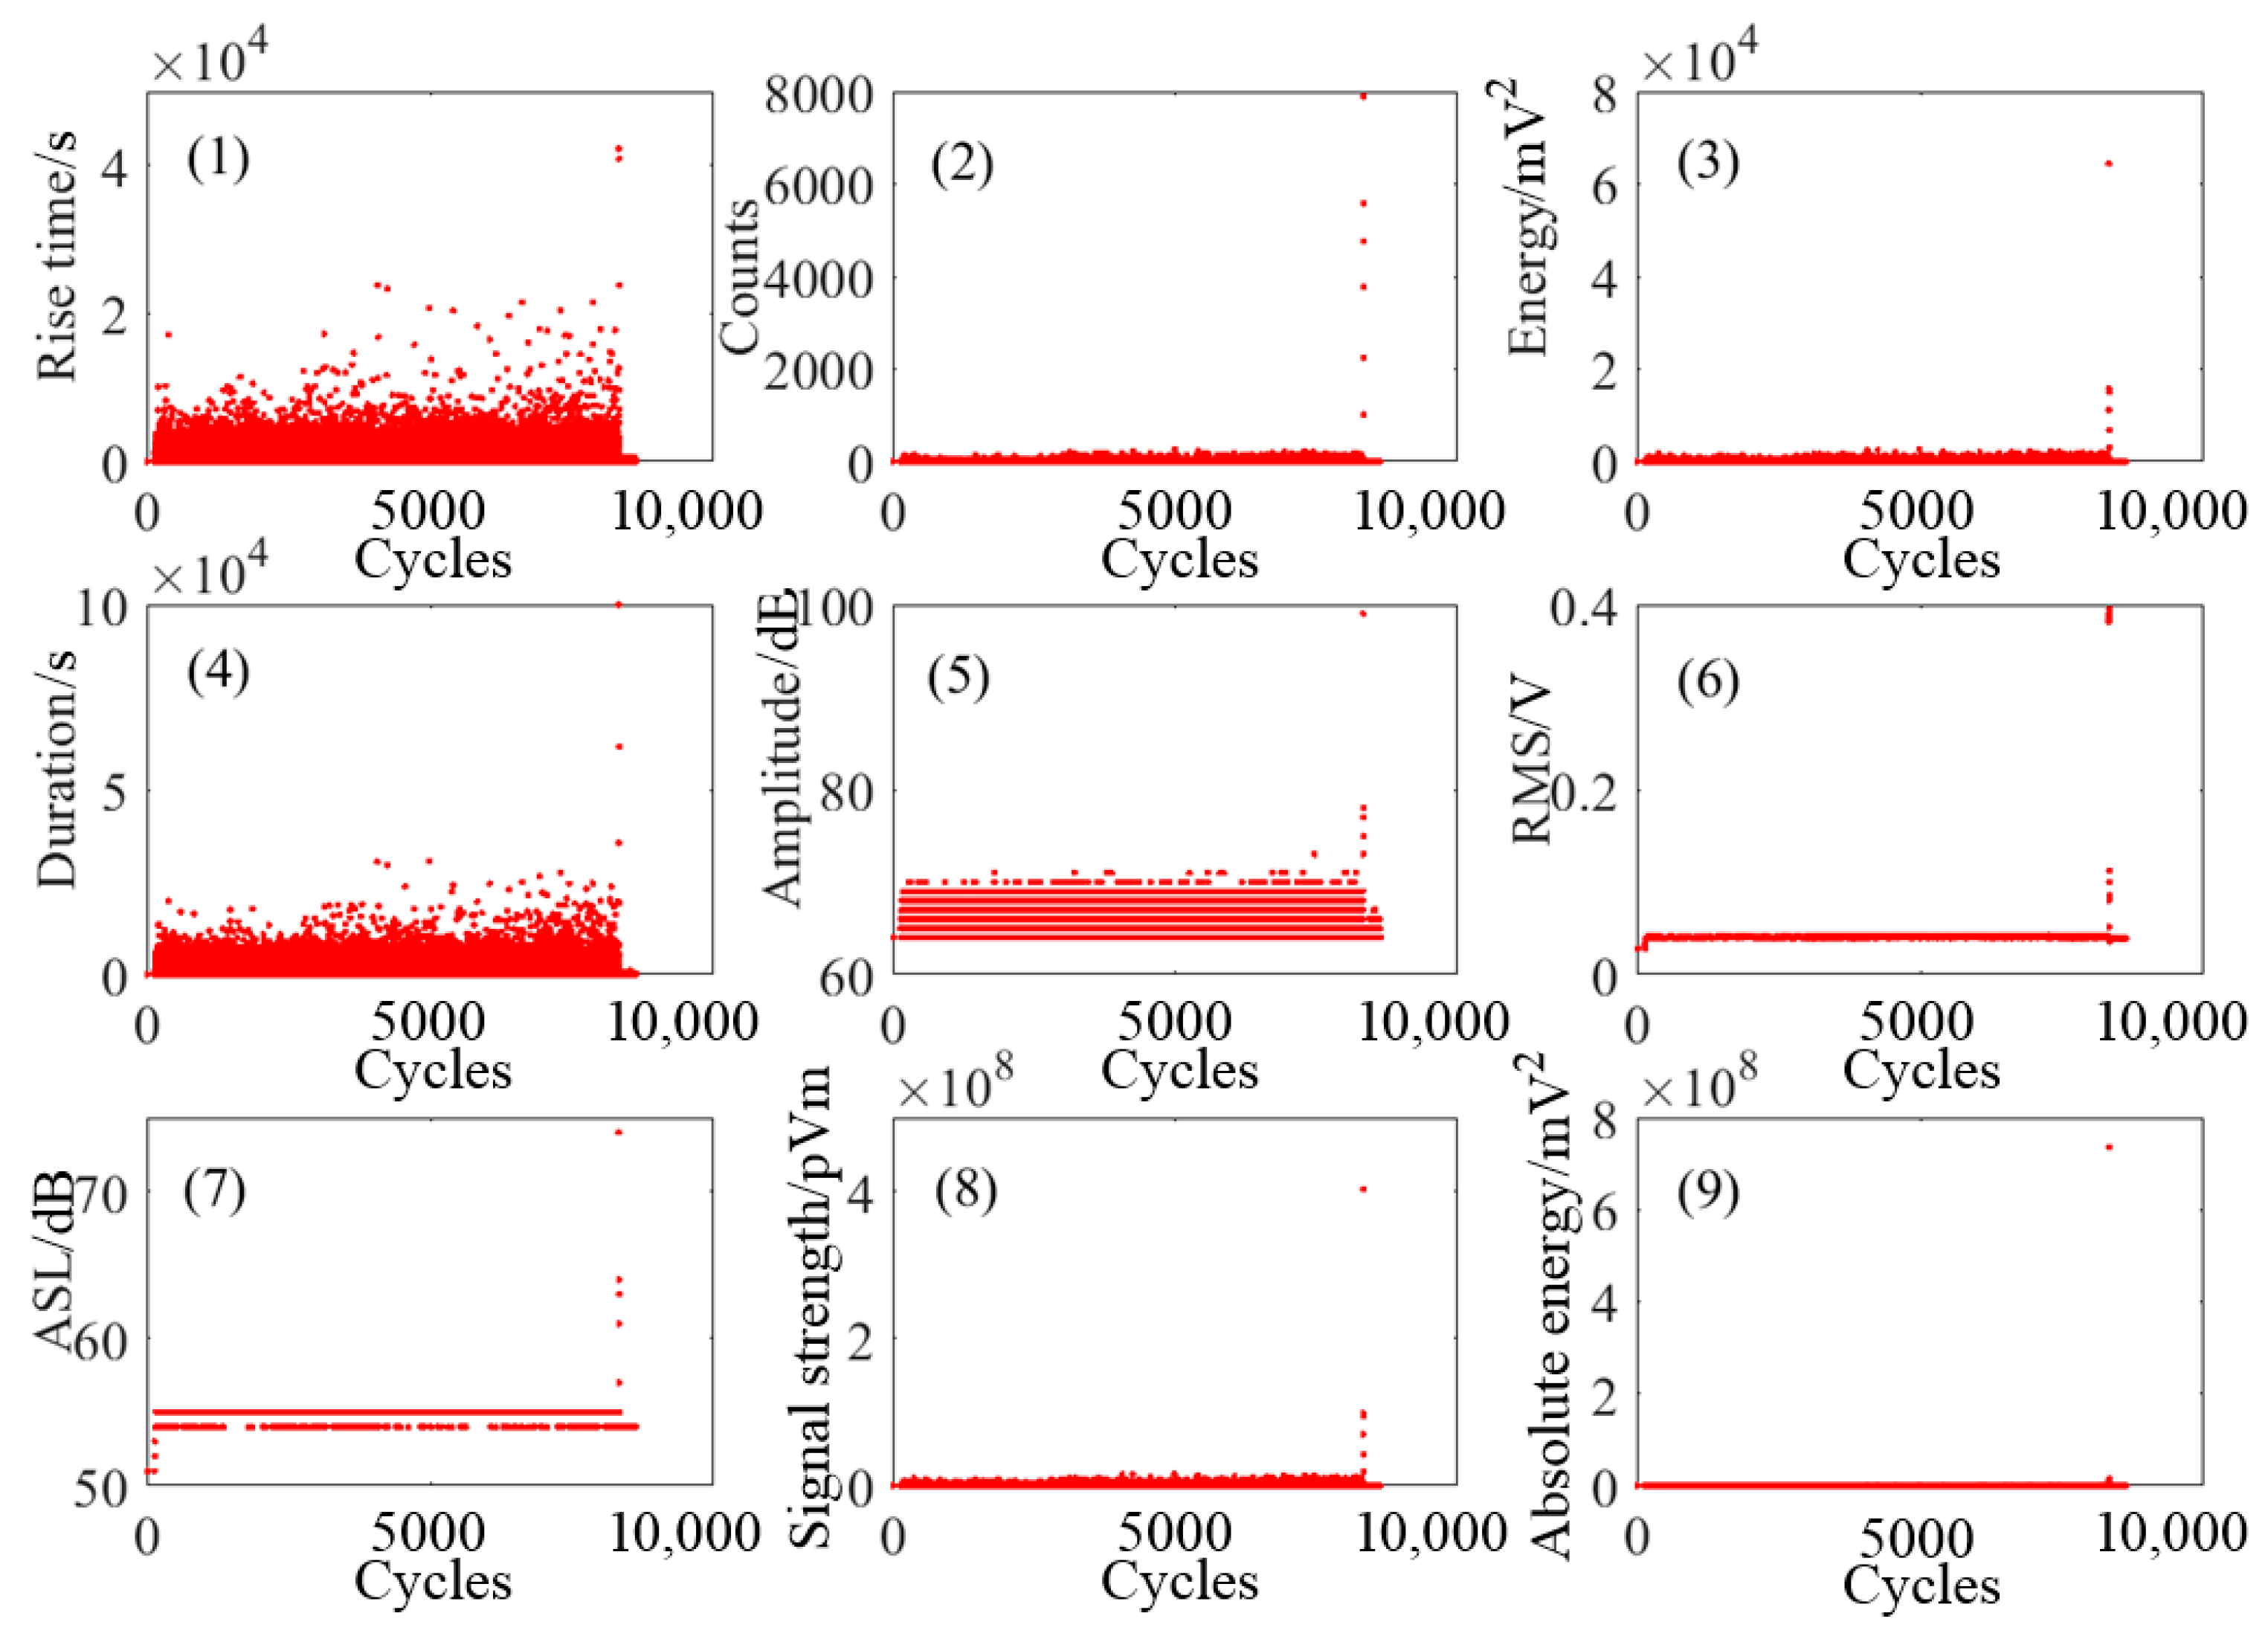
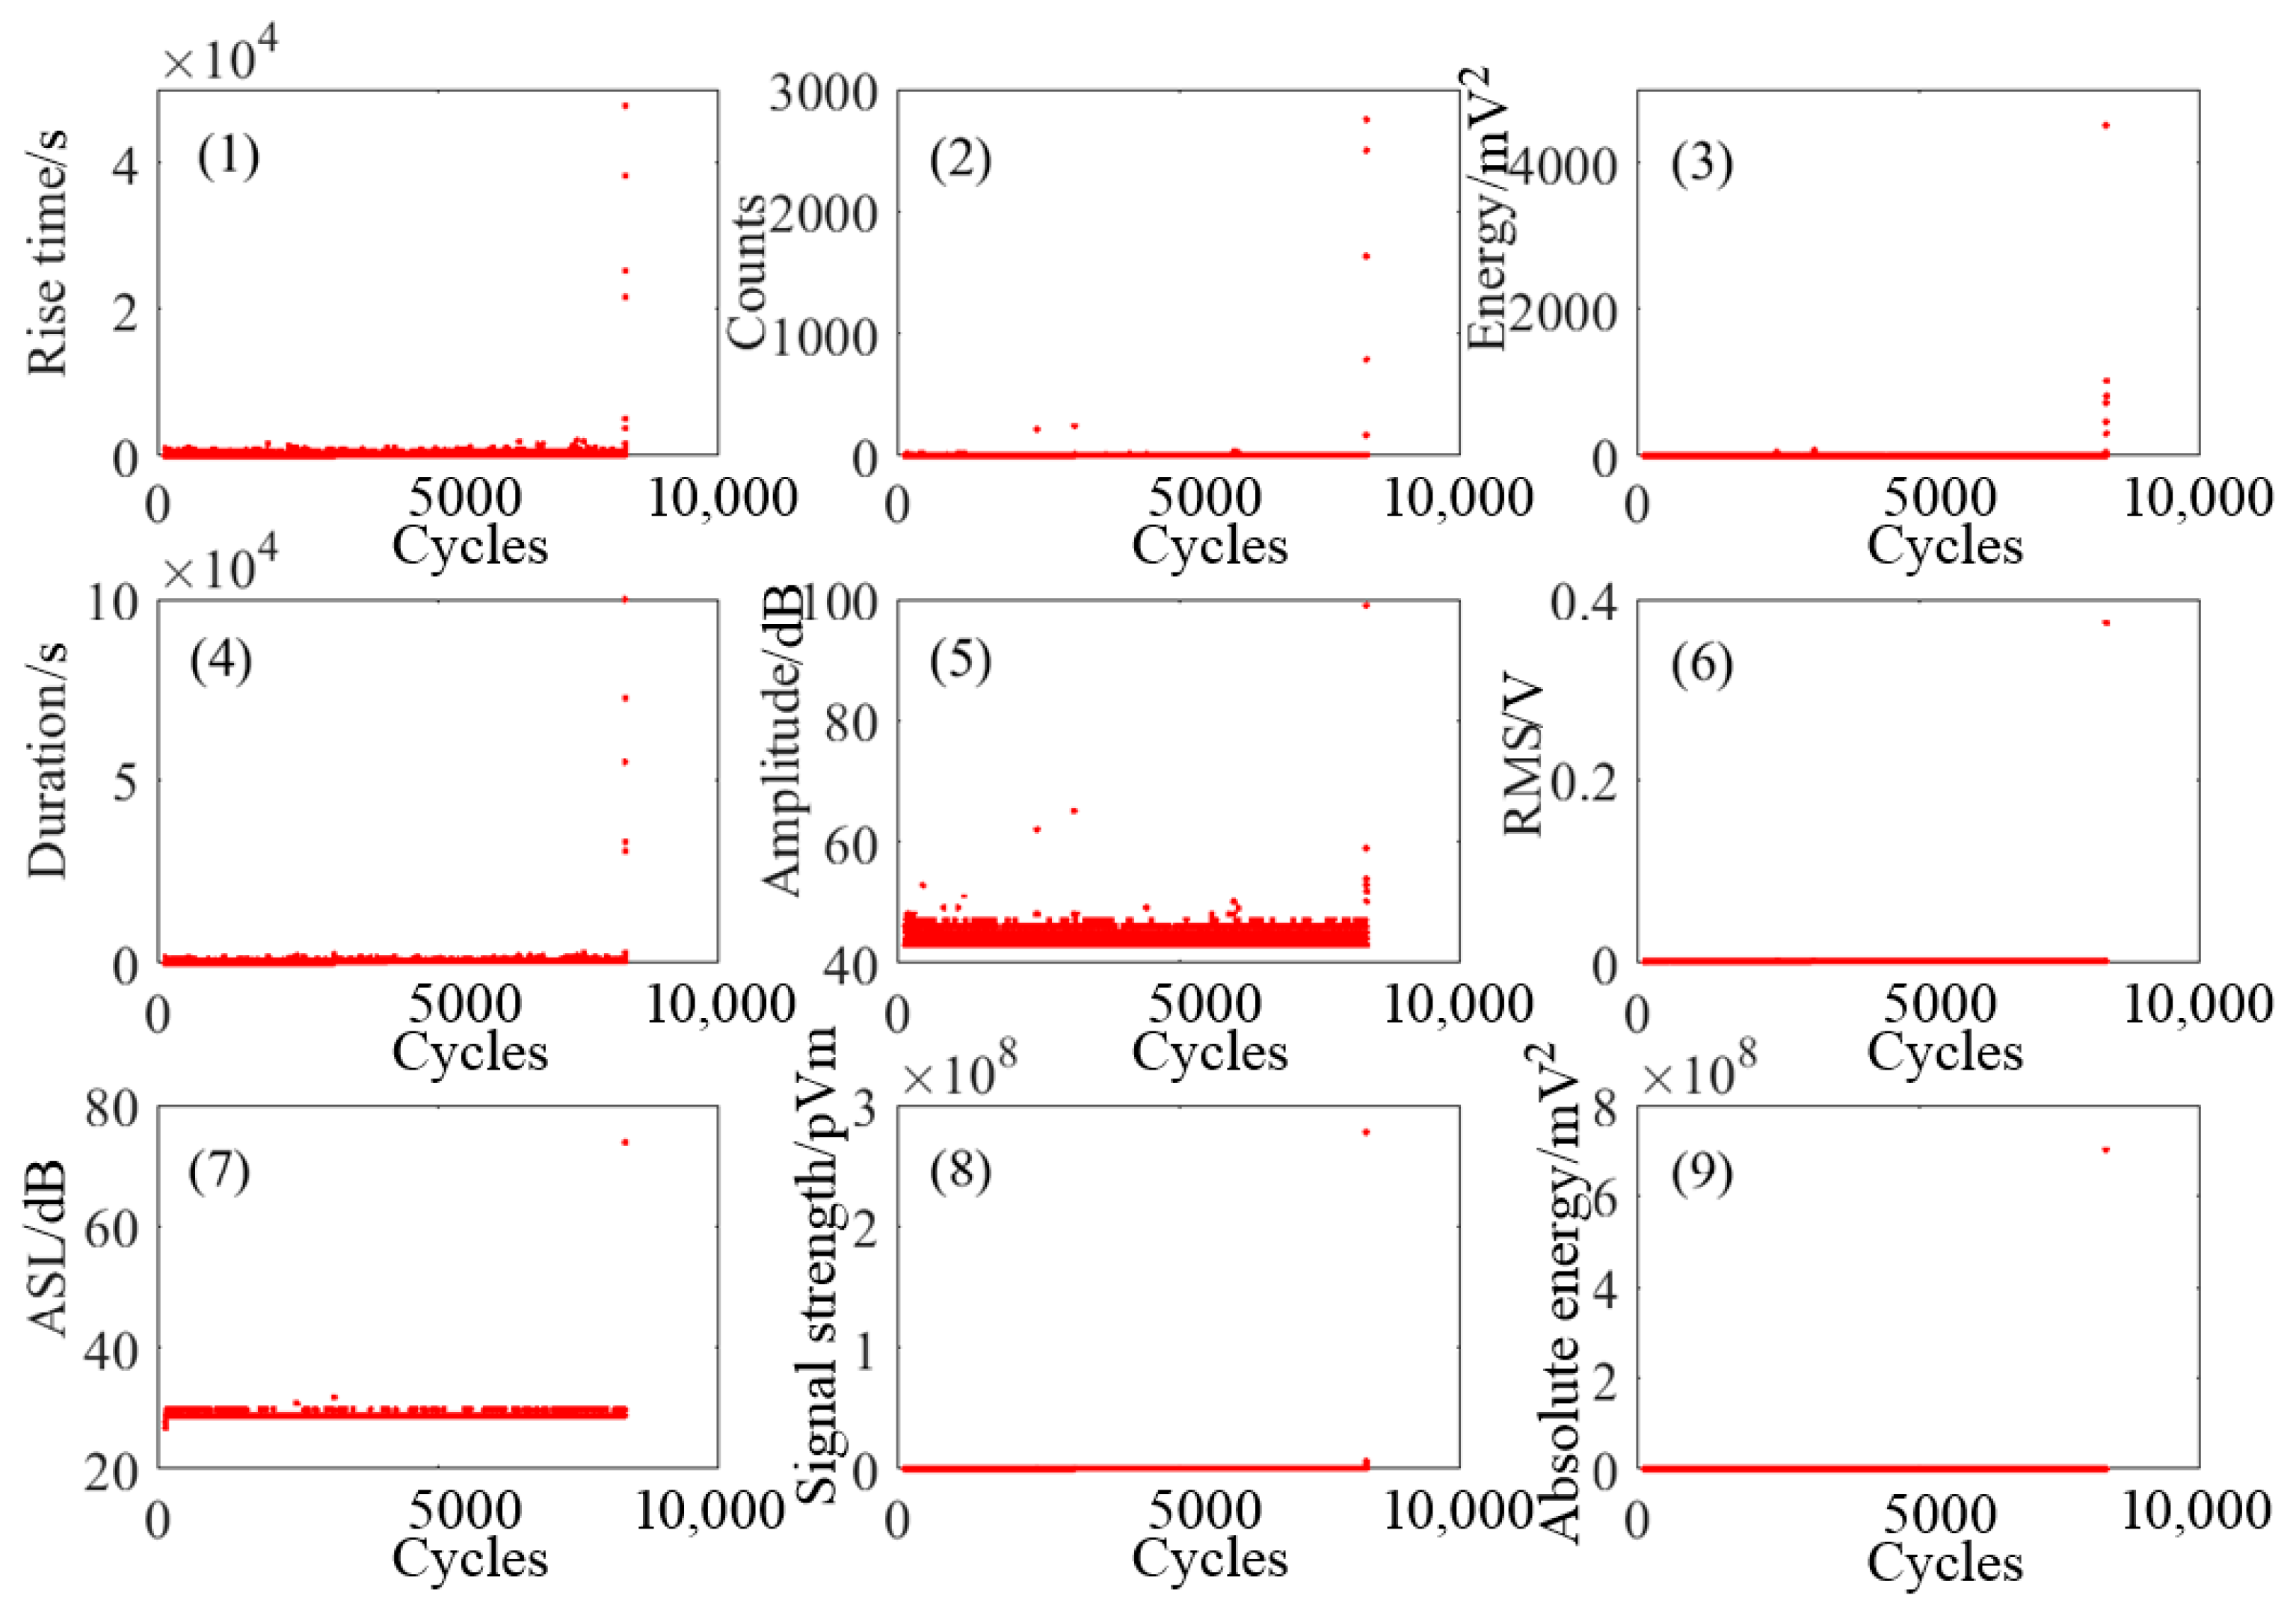
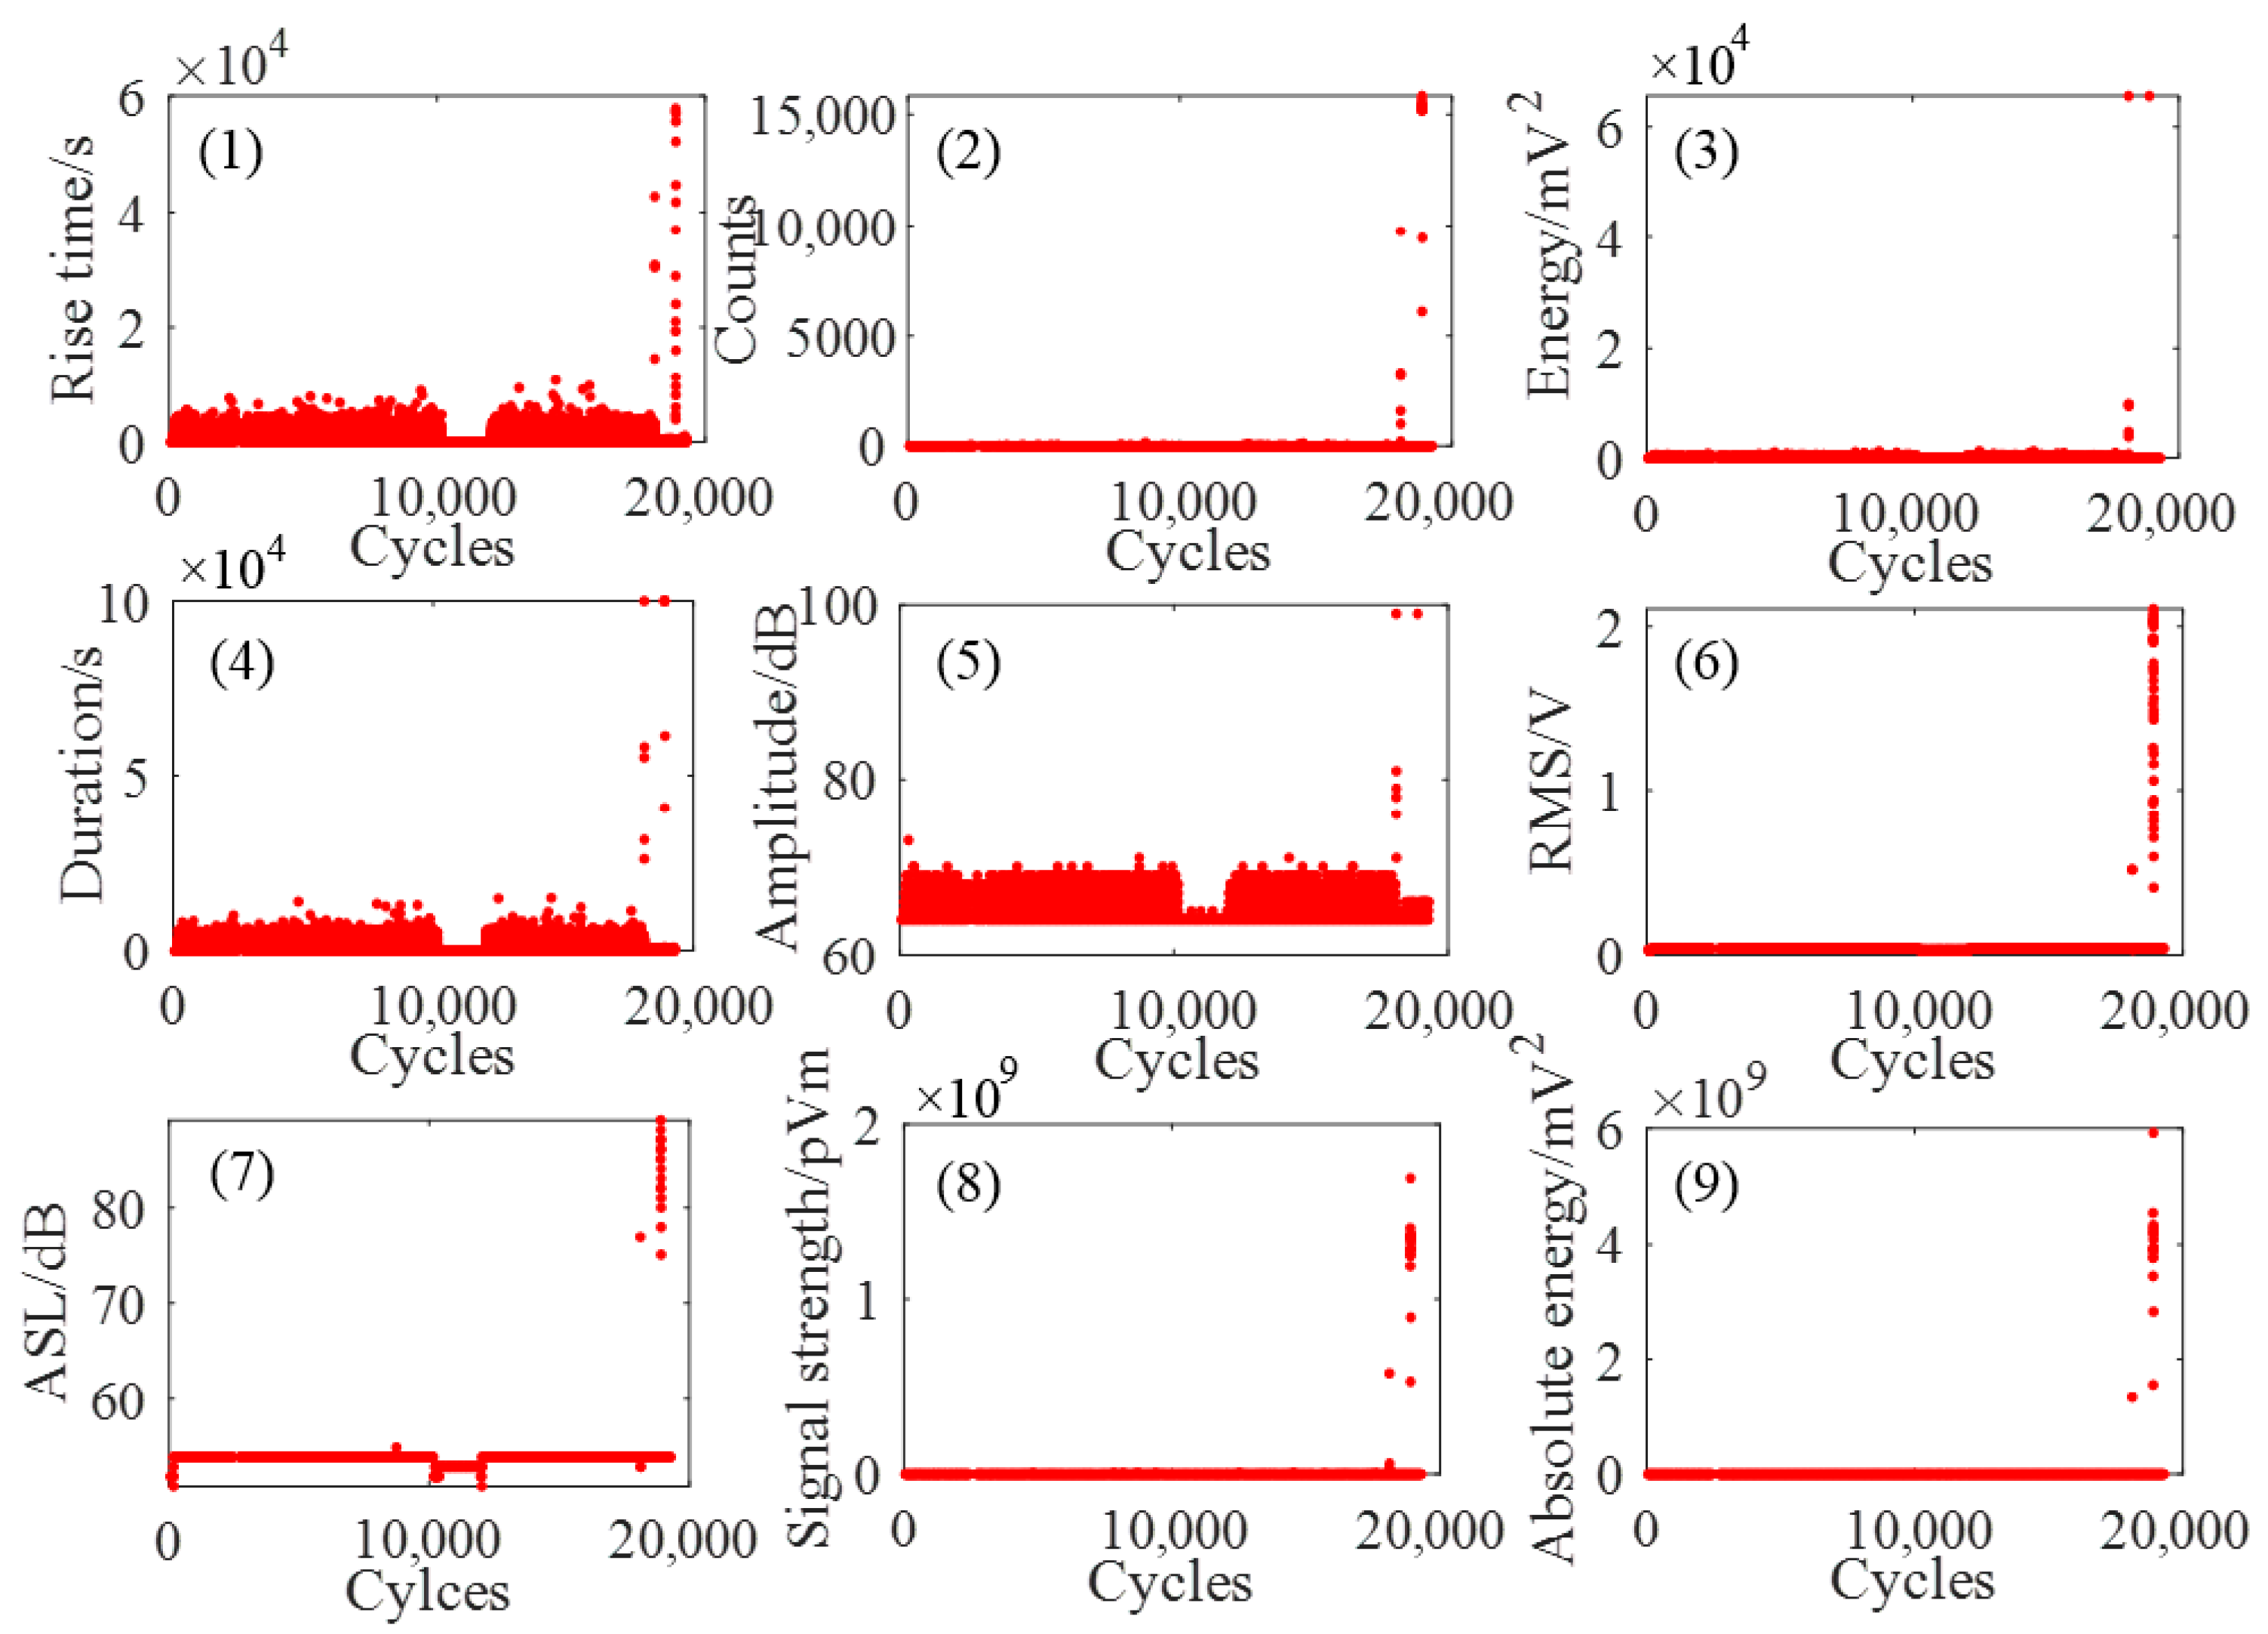
Based on a sampling rate of 1 MHz, after a series of processing such as noise filtering, sensor 1 received 105,816 data points and sensor 2 received 13,120 data points for sample 1. In addition, sensor 1 received 177,380 data points and sensor 2 received 41,468 data points for sample 2. The received data contain nine AE parameters, namely rise time, count, energy, duration, amplitude, RMS, ASL, signal intensity, and absolute energy. Since the two sensors are connected to channel 1 and channel 2, the data collected are represented by channel 1 and channel 2. The overall trends are shown in Figure 5, Figure 6, Figure 7 and Figure 8 represented by red dots.
By analyzing the parameters collected in this experiment, the following conclusions can be drawn:
AE is sensitive to the initial value. AE signals are weak, and the duration is short in the initial stage of fatigue crack generation; however, the signals still can be detected, providing a data basis for early prediction.
The trend characteristics of AE signals at each stage before fracture are not obvious, and the fluctuation span range is large, making it impossible to make an effective real-time determination of the situation of fatigue damage, thereby increasing the difficulty of analysis and prediction.
The fatigue source of metal test rod is extremely small and almost breaks instantaneously. Only in the tens to hundreds of cycles before fatigue fracture, the abnormality of AE signal is relatively obvious, and it is difficult to achieve effective early fatigue warning using traditional methods.
The quantity of valid data collected by different sensors in the same experiment may also be quite different. Especially when the amount of data is small, it is even more difficult to ensure the prediction accuracy.
Therefore, it is necessary to take advantage of AE technology and adopt efficient and precise methods to make real-time predictions of the metal fatigue process and fracture, thereby reducing the harm and losses it brings.

4. Discussion

4.1. Selection and Description of AE Parameters

The coefficient of variation is calculated to select 1 of the 9 parameters that can best characterize the metal fatigue process, which is expressed as follows:
C · V = σ M N × 100 %
where σ is the standard deviation, and MN is the mean value of all the data.
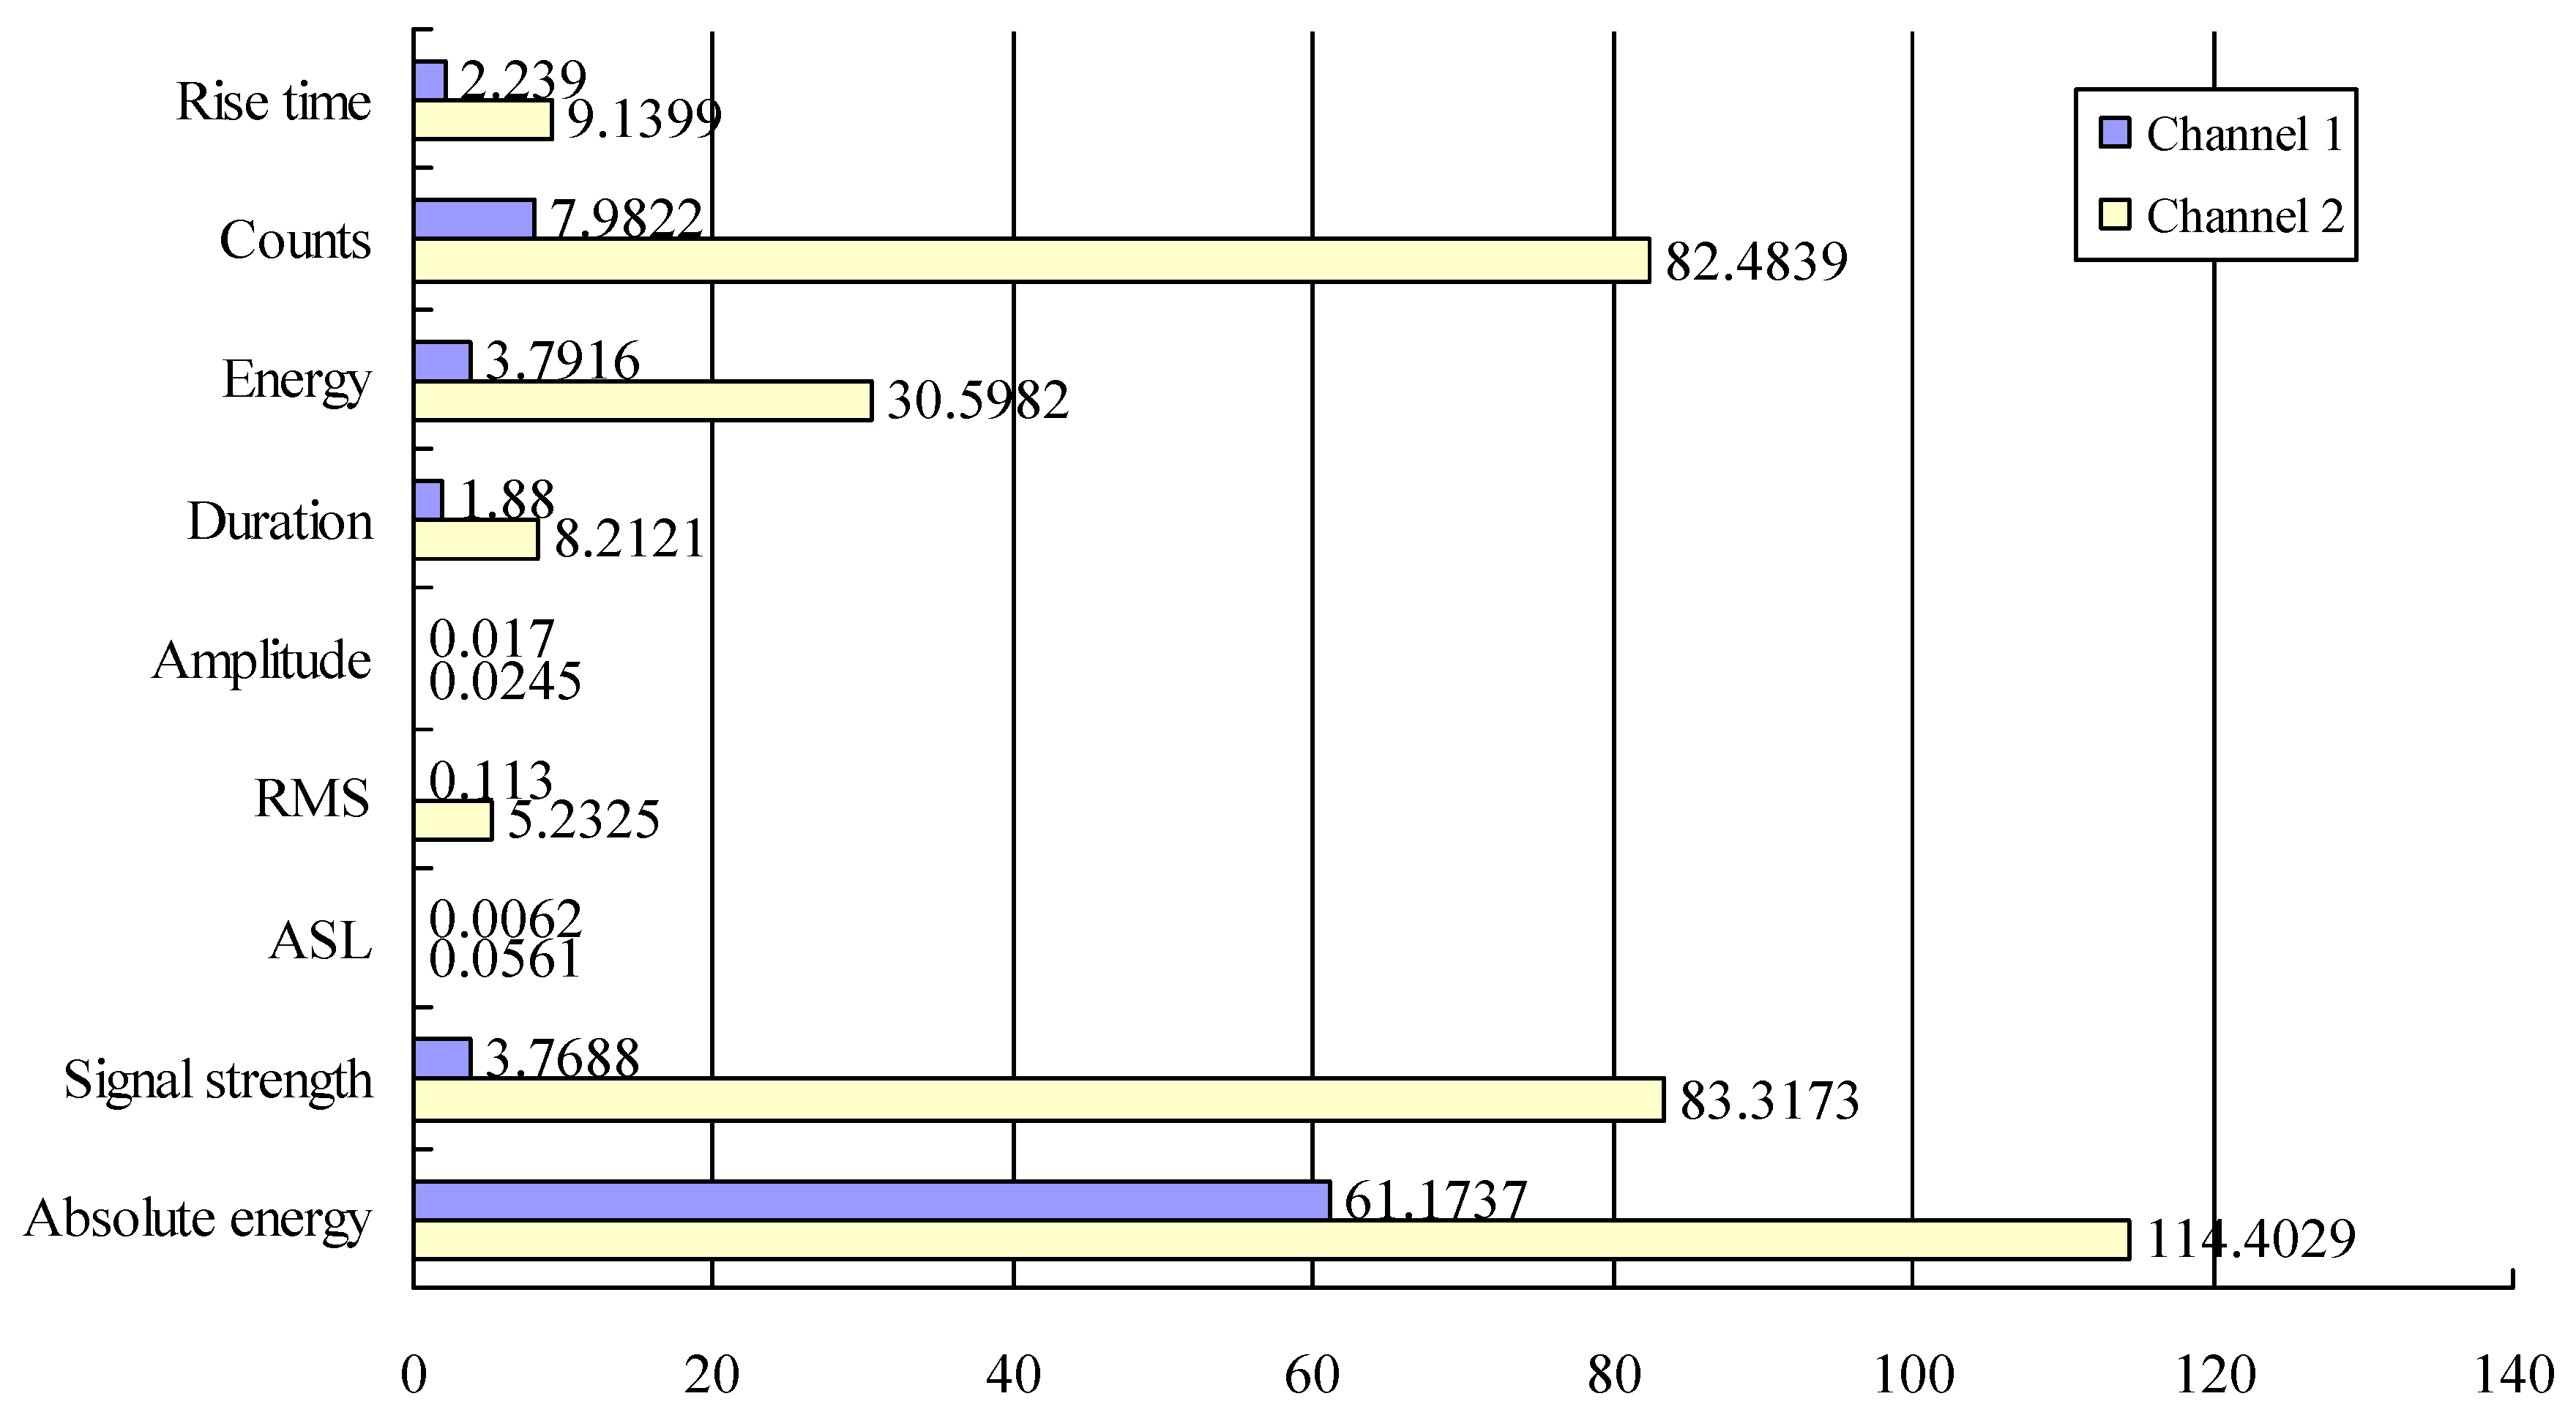
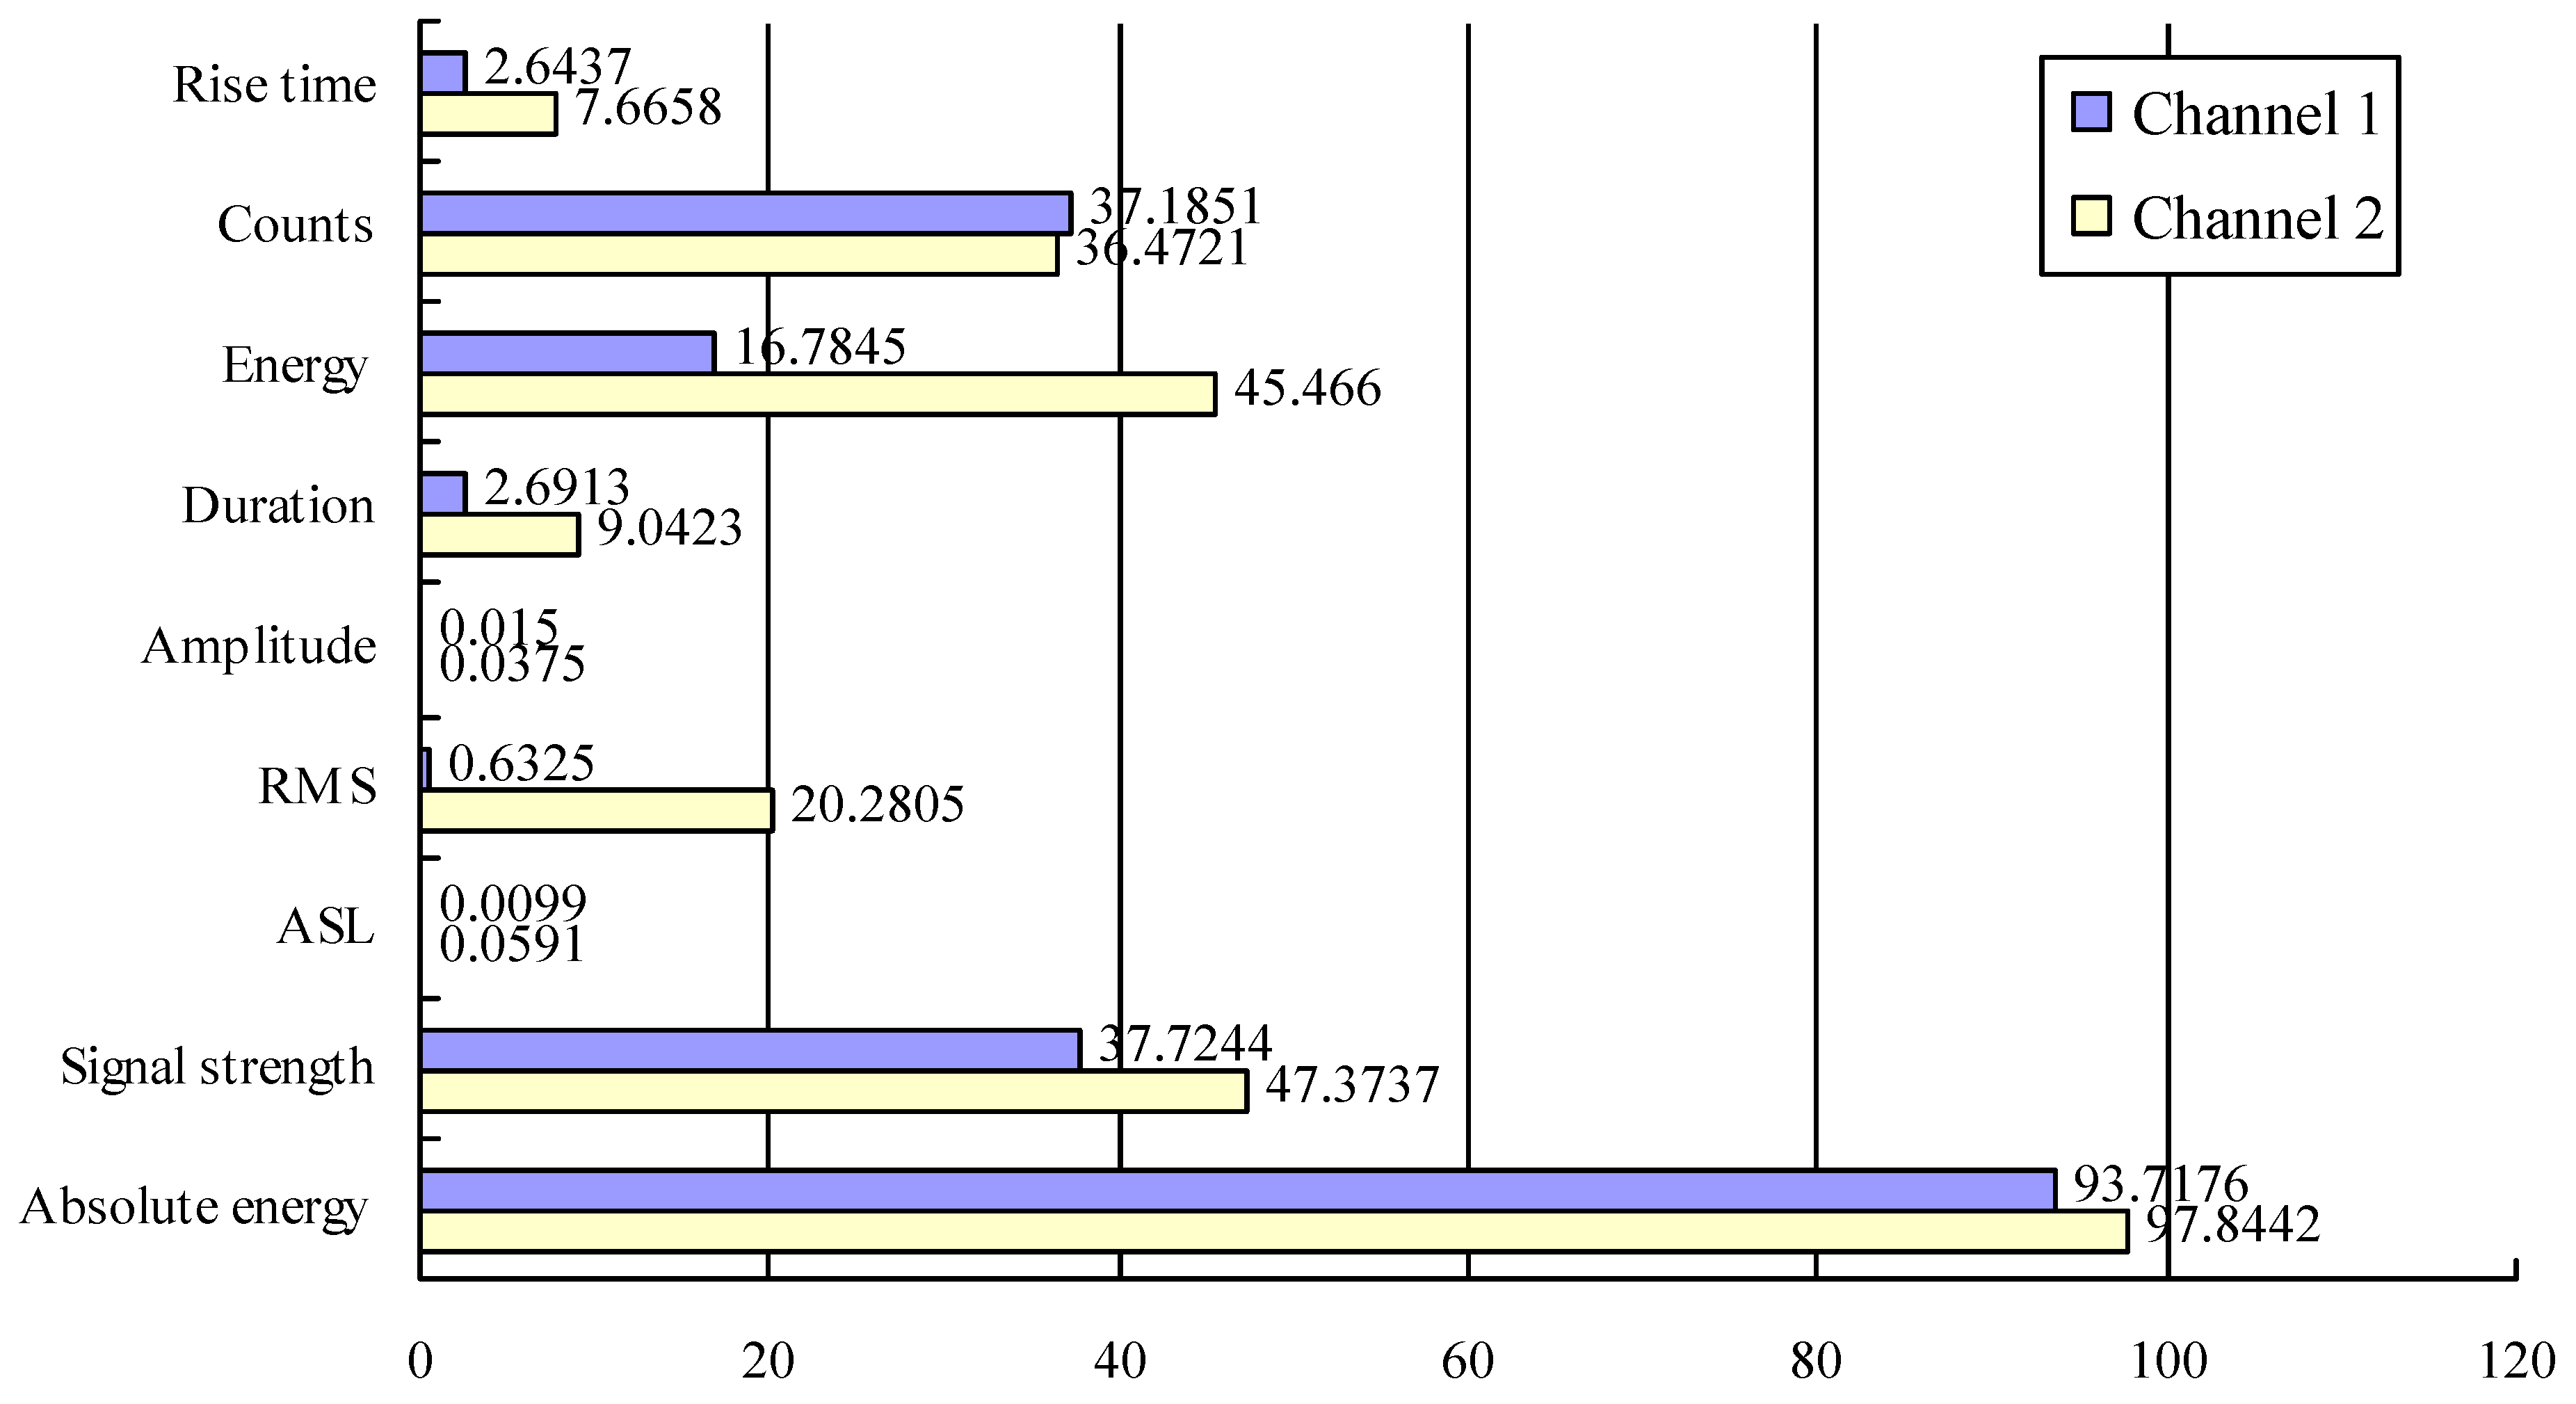
The calculation results of the coefficient of variation are listed in Figure 9 and Figure 10. It can be seen that for both samples, the coefficients of variation of absolute energy are both the largest in the two AE channels among the none parameters, which indicates that absolute energy contains the most dynamic information and possesses the highest degree of irregularity. Compared with the other eight parameters, absolute energy is most suitable for characterizing chaotic states, so that enables the dynamic information it contains to better characterize the growth of metal fatigue cracks. Therefore, absolute energy is used as the representative of AE signals to analyze the experimental data in this paper, so as to better represent chaotic states and make effective predictions.
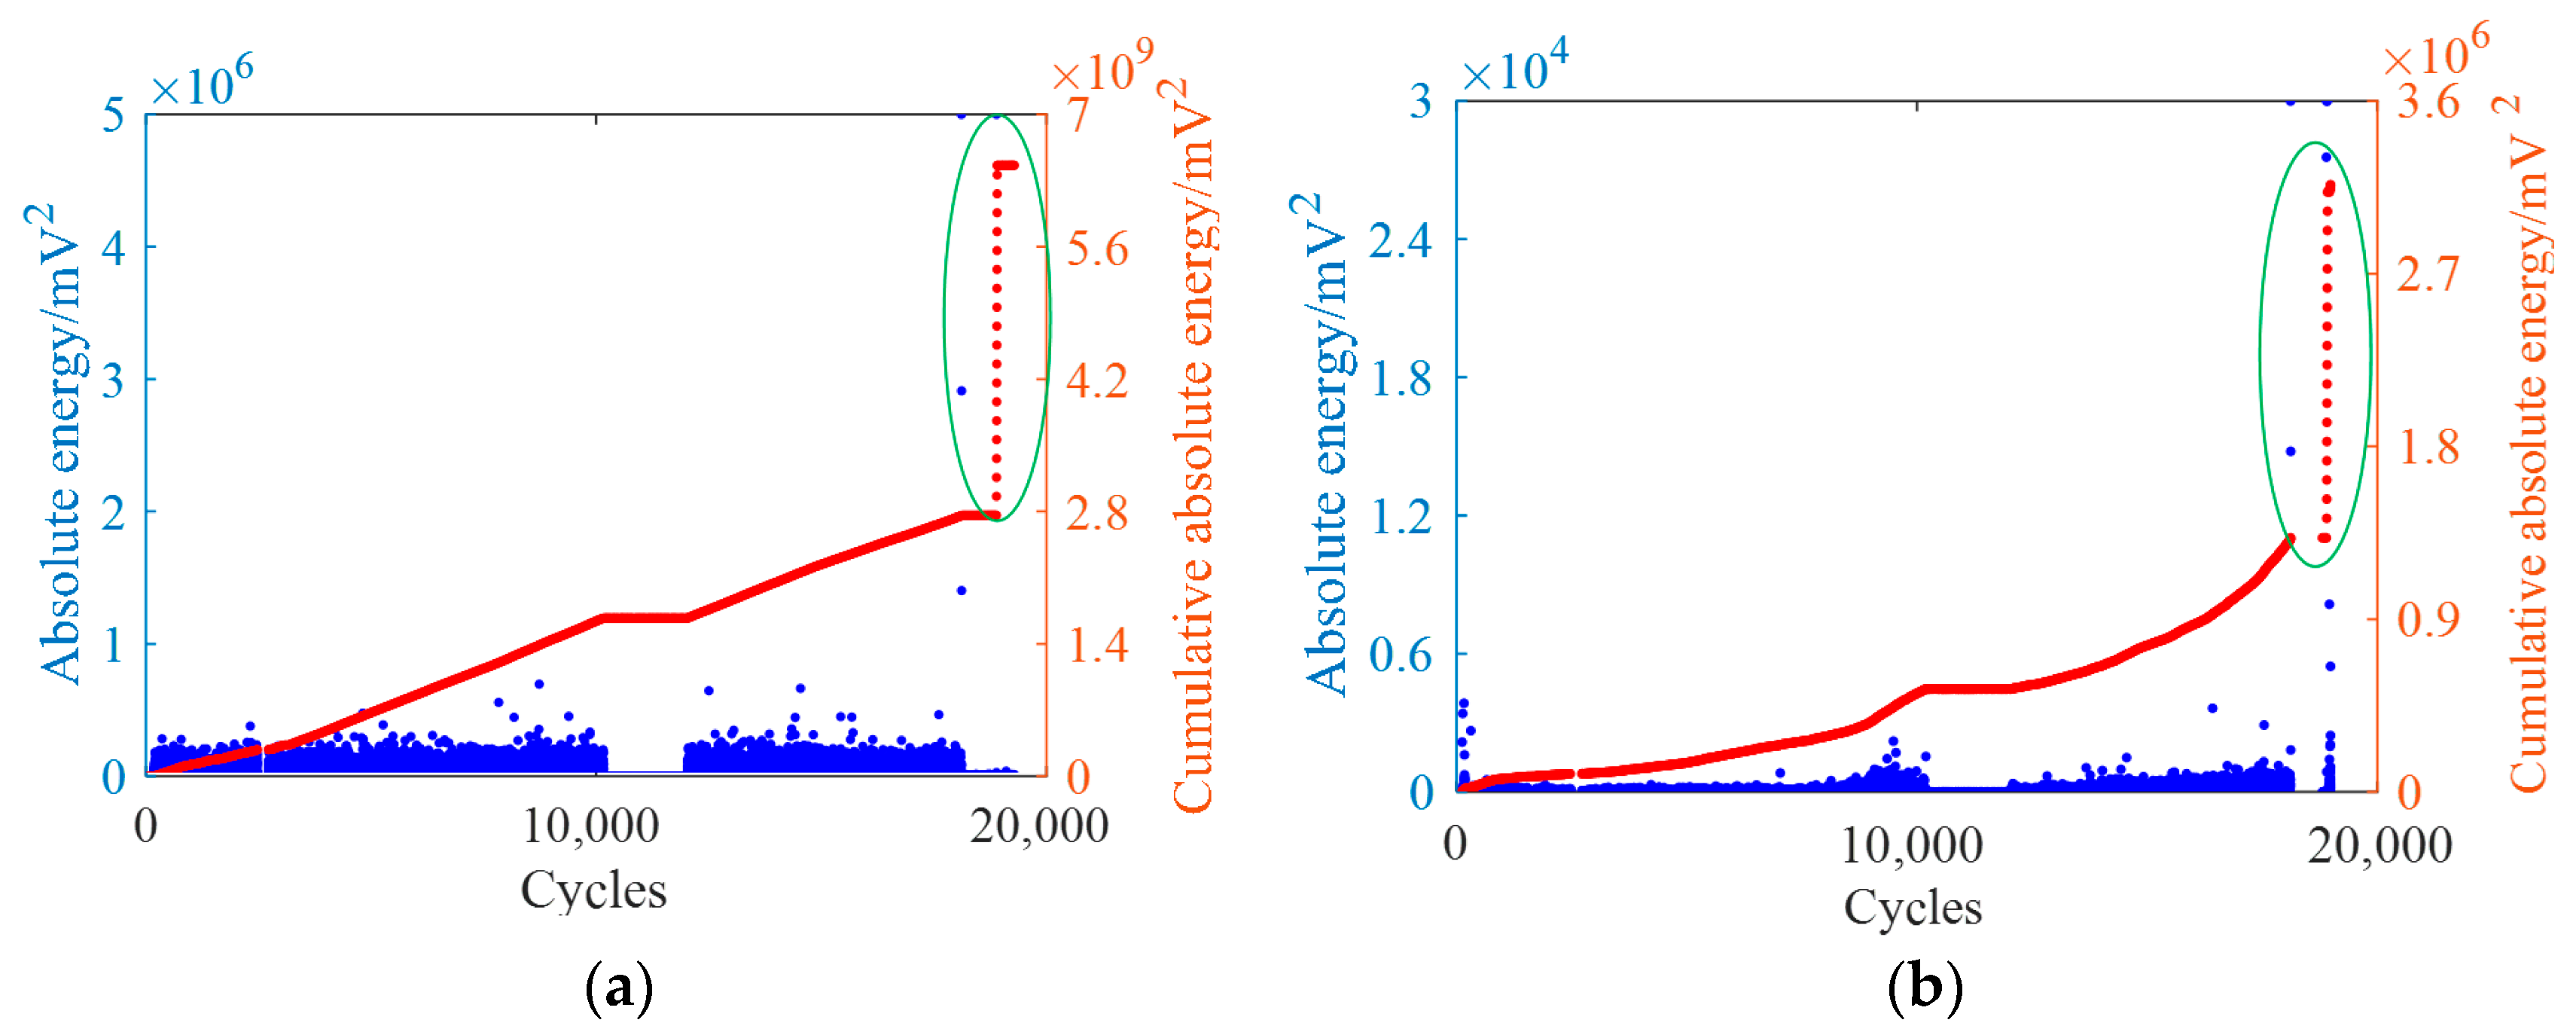
According to the introduction in Part 3, in this experiment, the number of AE data measured in channel 1 is 105,816 and in channel 2 is 13,120 for sample 1 and in channel 1 is 177380 and in channel 2 is 41468 for sample 2. It can be known that under the same experimental subject and experimental conditions, the number of data measured in channel 2 is one order of magnitude smaller than that in channel 1. Figure 11 and Figure 12 present the main parts of absolute energy in the two channels using blue dots and the cumulative characteristics using red dots. Since the values of the acoustic emission signals at the fracture points are too large and highly concentrated compared to those at the main part, their values are all limited here for the convenience of observation and description.
As can be seen from the above figures, the accumulative curves of the entire fatigue process are positively linearly correlated with cycles. Due to the short fatigue process, an obvious step phenomenon can only be observed when fatigue fracture occurs as seen in the green circles in Figure 11 and Figure 12. This process occurs almost instantaneously, making it difficult to make a direct prediction from the data. Therefore, an effective prediction method is needed to prevent the hazards caused by fatigue fracture.
It is worth noting that AE technology can detect the whole process of fatigue crack growth in real time and non-destructively, and its information is representative. However, since this experiment focuses on the prediction of the stage of fatigue fracture, the information of the earlier stages were not analyzed here.

4.2. The Largest Lyapunov Exponent Fatigue Prediction

To verify the effectiveness of the small data method proposed in this paper, the AE parameters of fatigue fracture in the two channels of the two samples will be predicted by largest Lyapunov exponent using the traditional Wolf method and the small data method, respectively. The comparison of the prediction results in the two channels shows that in the case of a smaller amount of data, the results of the small data method is more accurate.
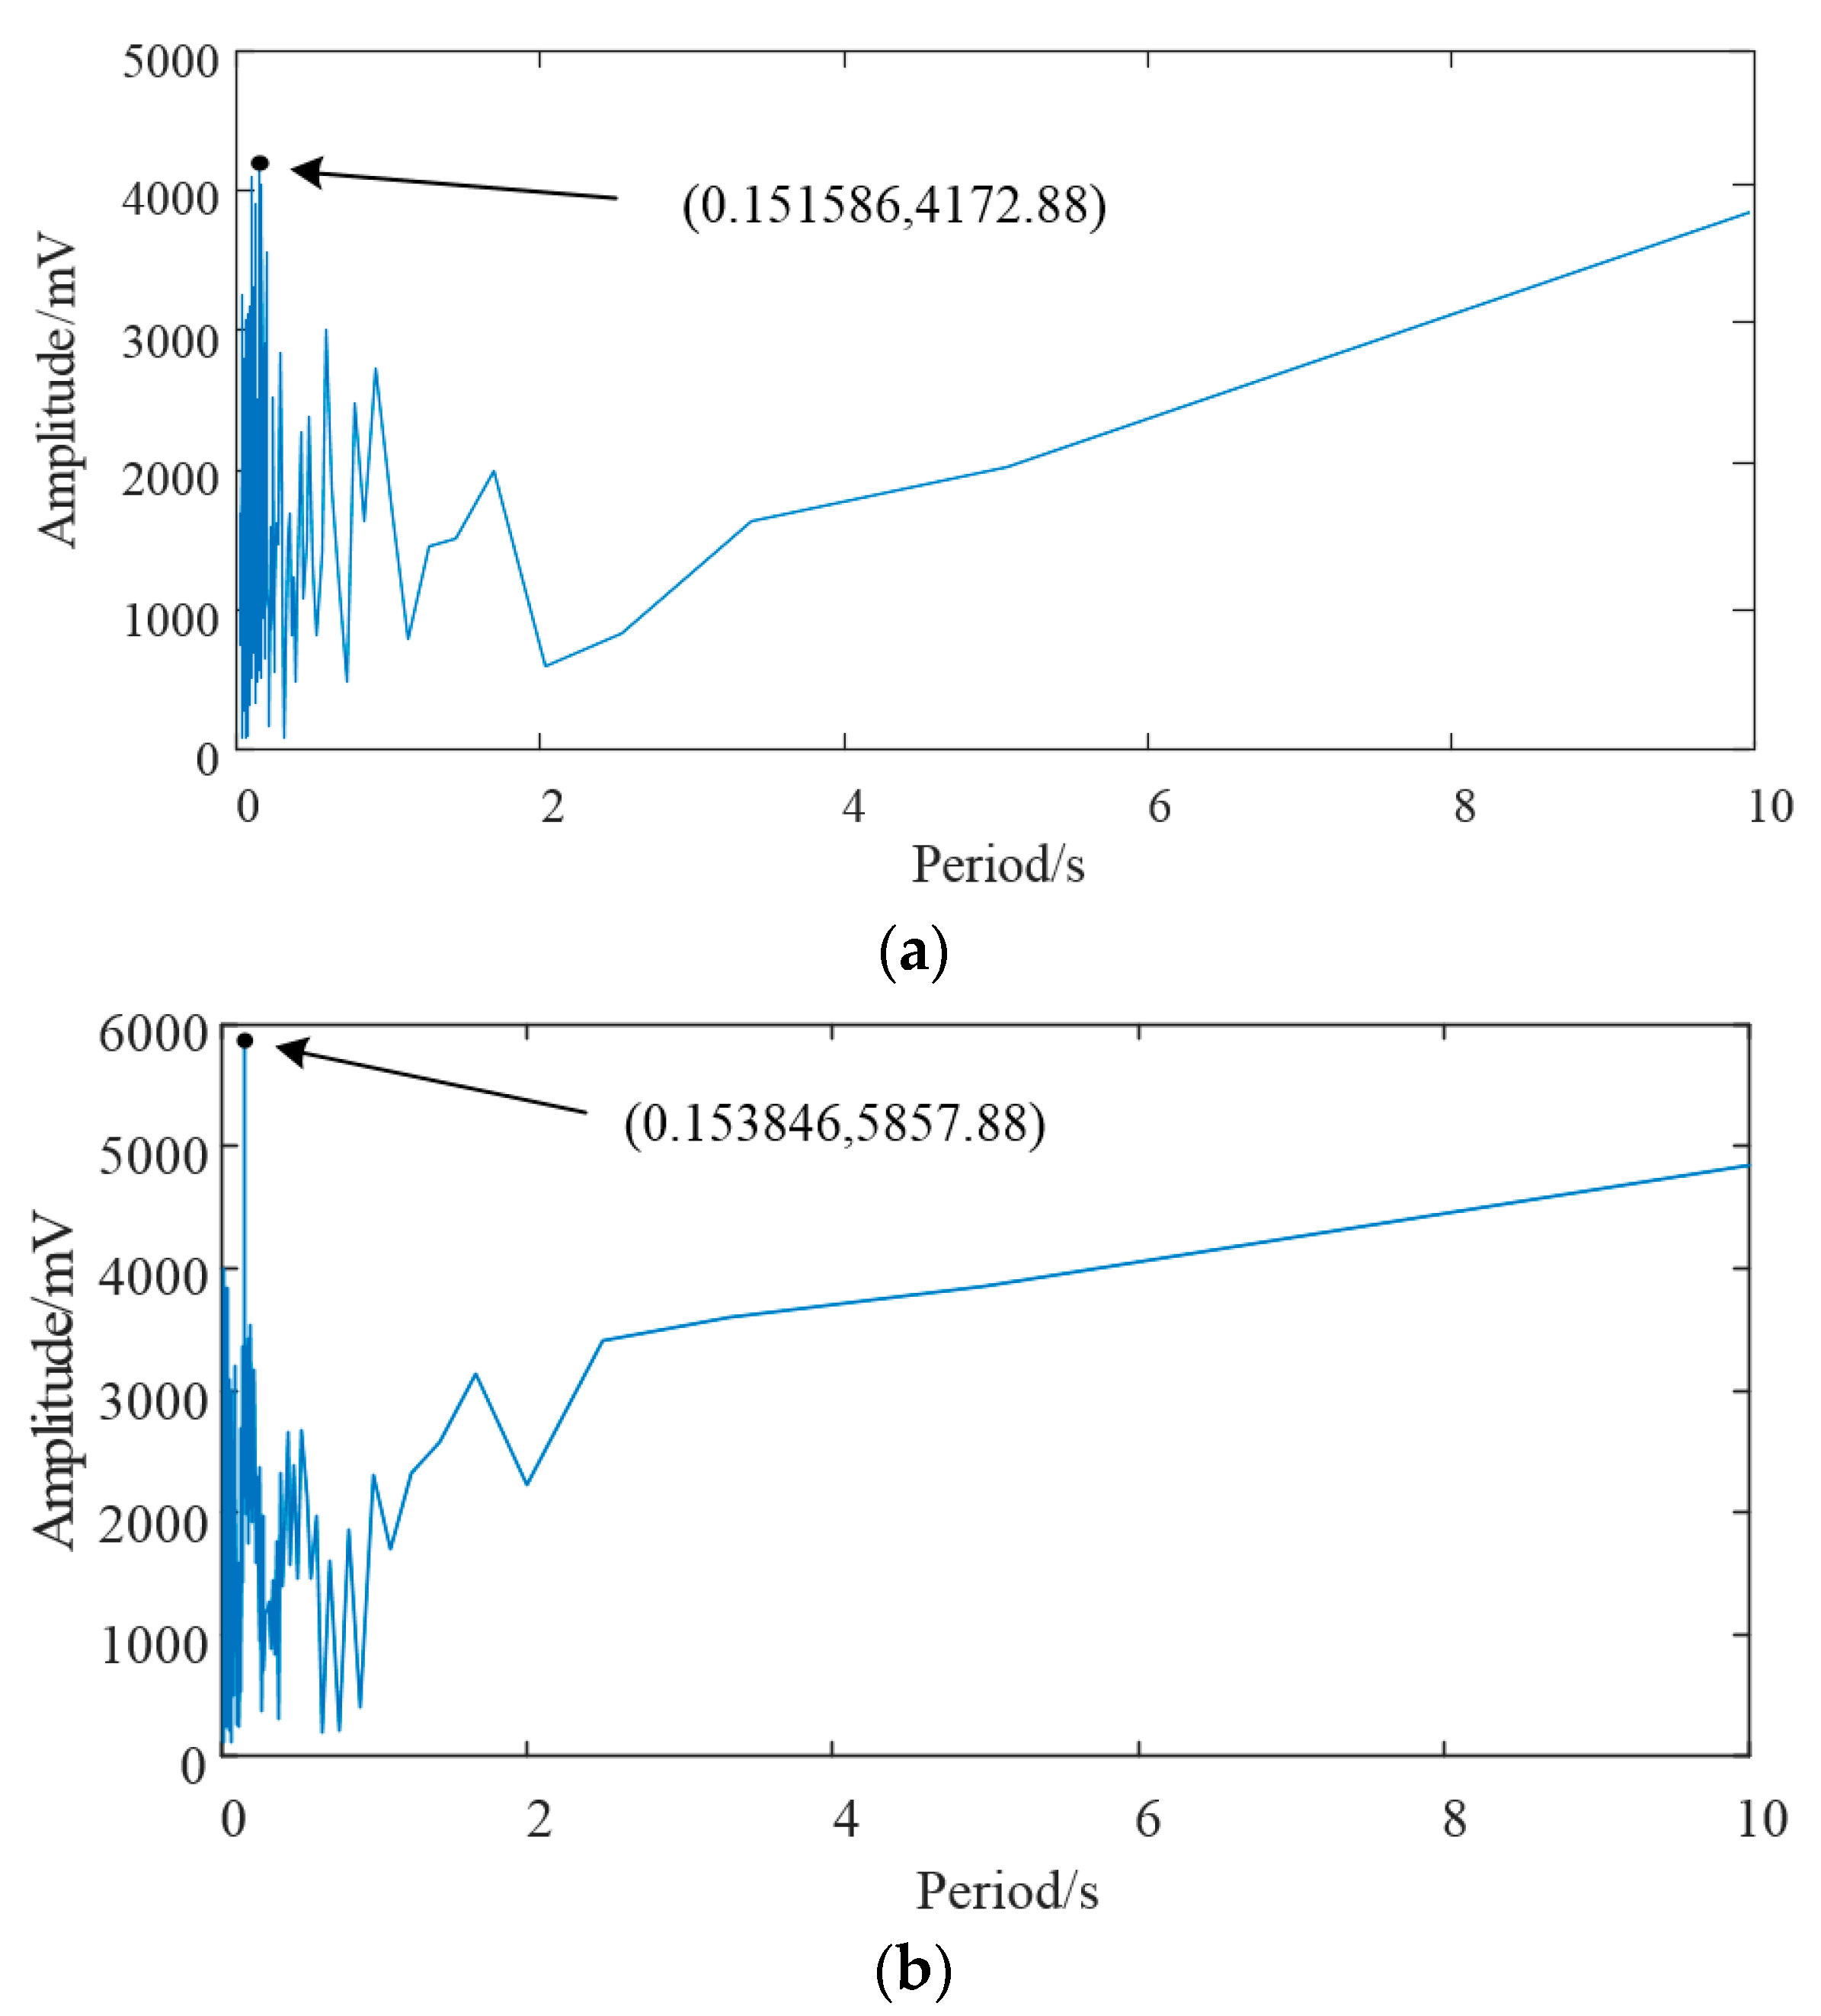
First, FFT is used on the fatigue AE parameters in the two channels of the two samples. The prediction period in Channel 1 is 0.1991 s and in Channel 2 is 0.1665 s for sample 1, while the prediction period in Channel 1 is 0.1991 s and in Channel 2 is 0.1665 s for sample 1. These are used to limit the short-time separation of phase points when calculating the largest Lyapunov exponent. The results are shown in Figure 13 and Figure 14.
Second, calculate the largest Lyapunov exponents of the AE parameters in the two channels of the two samples. The AE parameters in both channels were divided into five groups in chronological order, and the largest Lyapunov exponent was calculated using small data method. In channel 1, take m = 8 and τ = 6. In channel 2, take m = 5 and τ = 3. The calculation results of the largest Lyapunov exponent are shown in Table 1 and Table 2. It can be seen that the five largest Lyapunov exponents at different stages in the two channels and the overall largest Lyapunov exponent are all greater than 0, indicating that there is a chaotic phenomenon in the fatigue crack growth process and the AE parameters in the two channels are in accordance with chaotic characteristics.
Then, the fatigue fracture stages in channel 1 and channel 2 are predicted using the small data method. Combining the overall largest Lyapunov exponent in Table 1 and Table 2 with Equation (9), the longest prediction times in the two channels are 255.1020 s and 398.4064 s for sample 1 and 185.5288 s and 308.6420 s for sample 2. Since the prediction accuracy of this method would decrease with the increase of the prediction duration, it is only suitable for short-term prediction and cannot rely on the longest prediction duration. Therefore, the reasonable prediction duration selected in this paper is 100 s. According to the fatigue AE data collected in this experiment, the fracture time is approximately at 833 s and 1890 s for the two samples. As a result, a time interval ∆t = 10 s is taken for the 100 s before fracture and a 10-step prediction is proposed to predict the mean value of the fatigue AE data around each time interval. Meanwhile, the prediction results were compared with those of the Wolf method in Table 3 and Table 4.
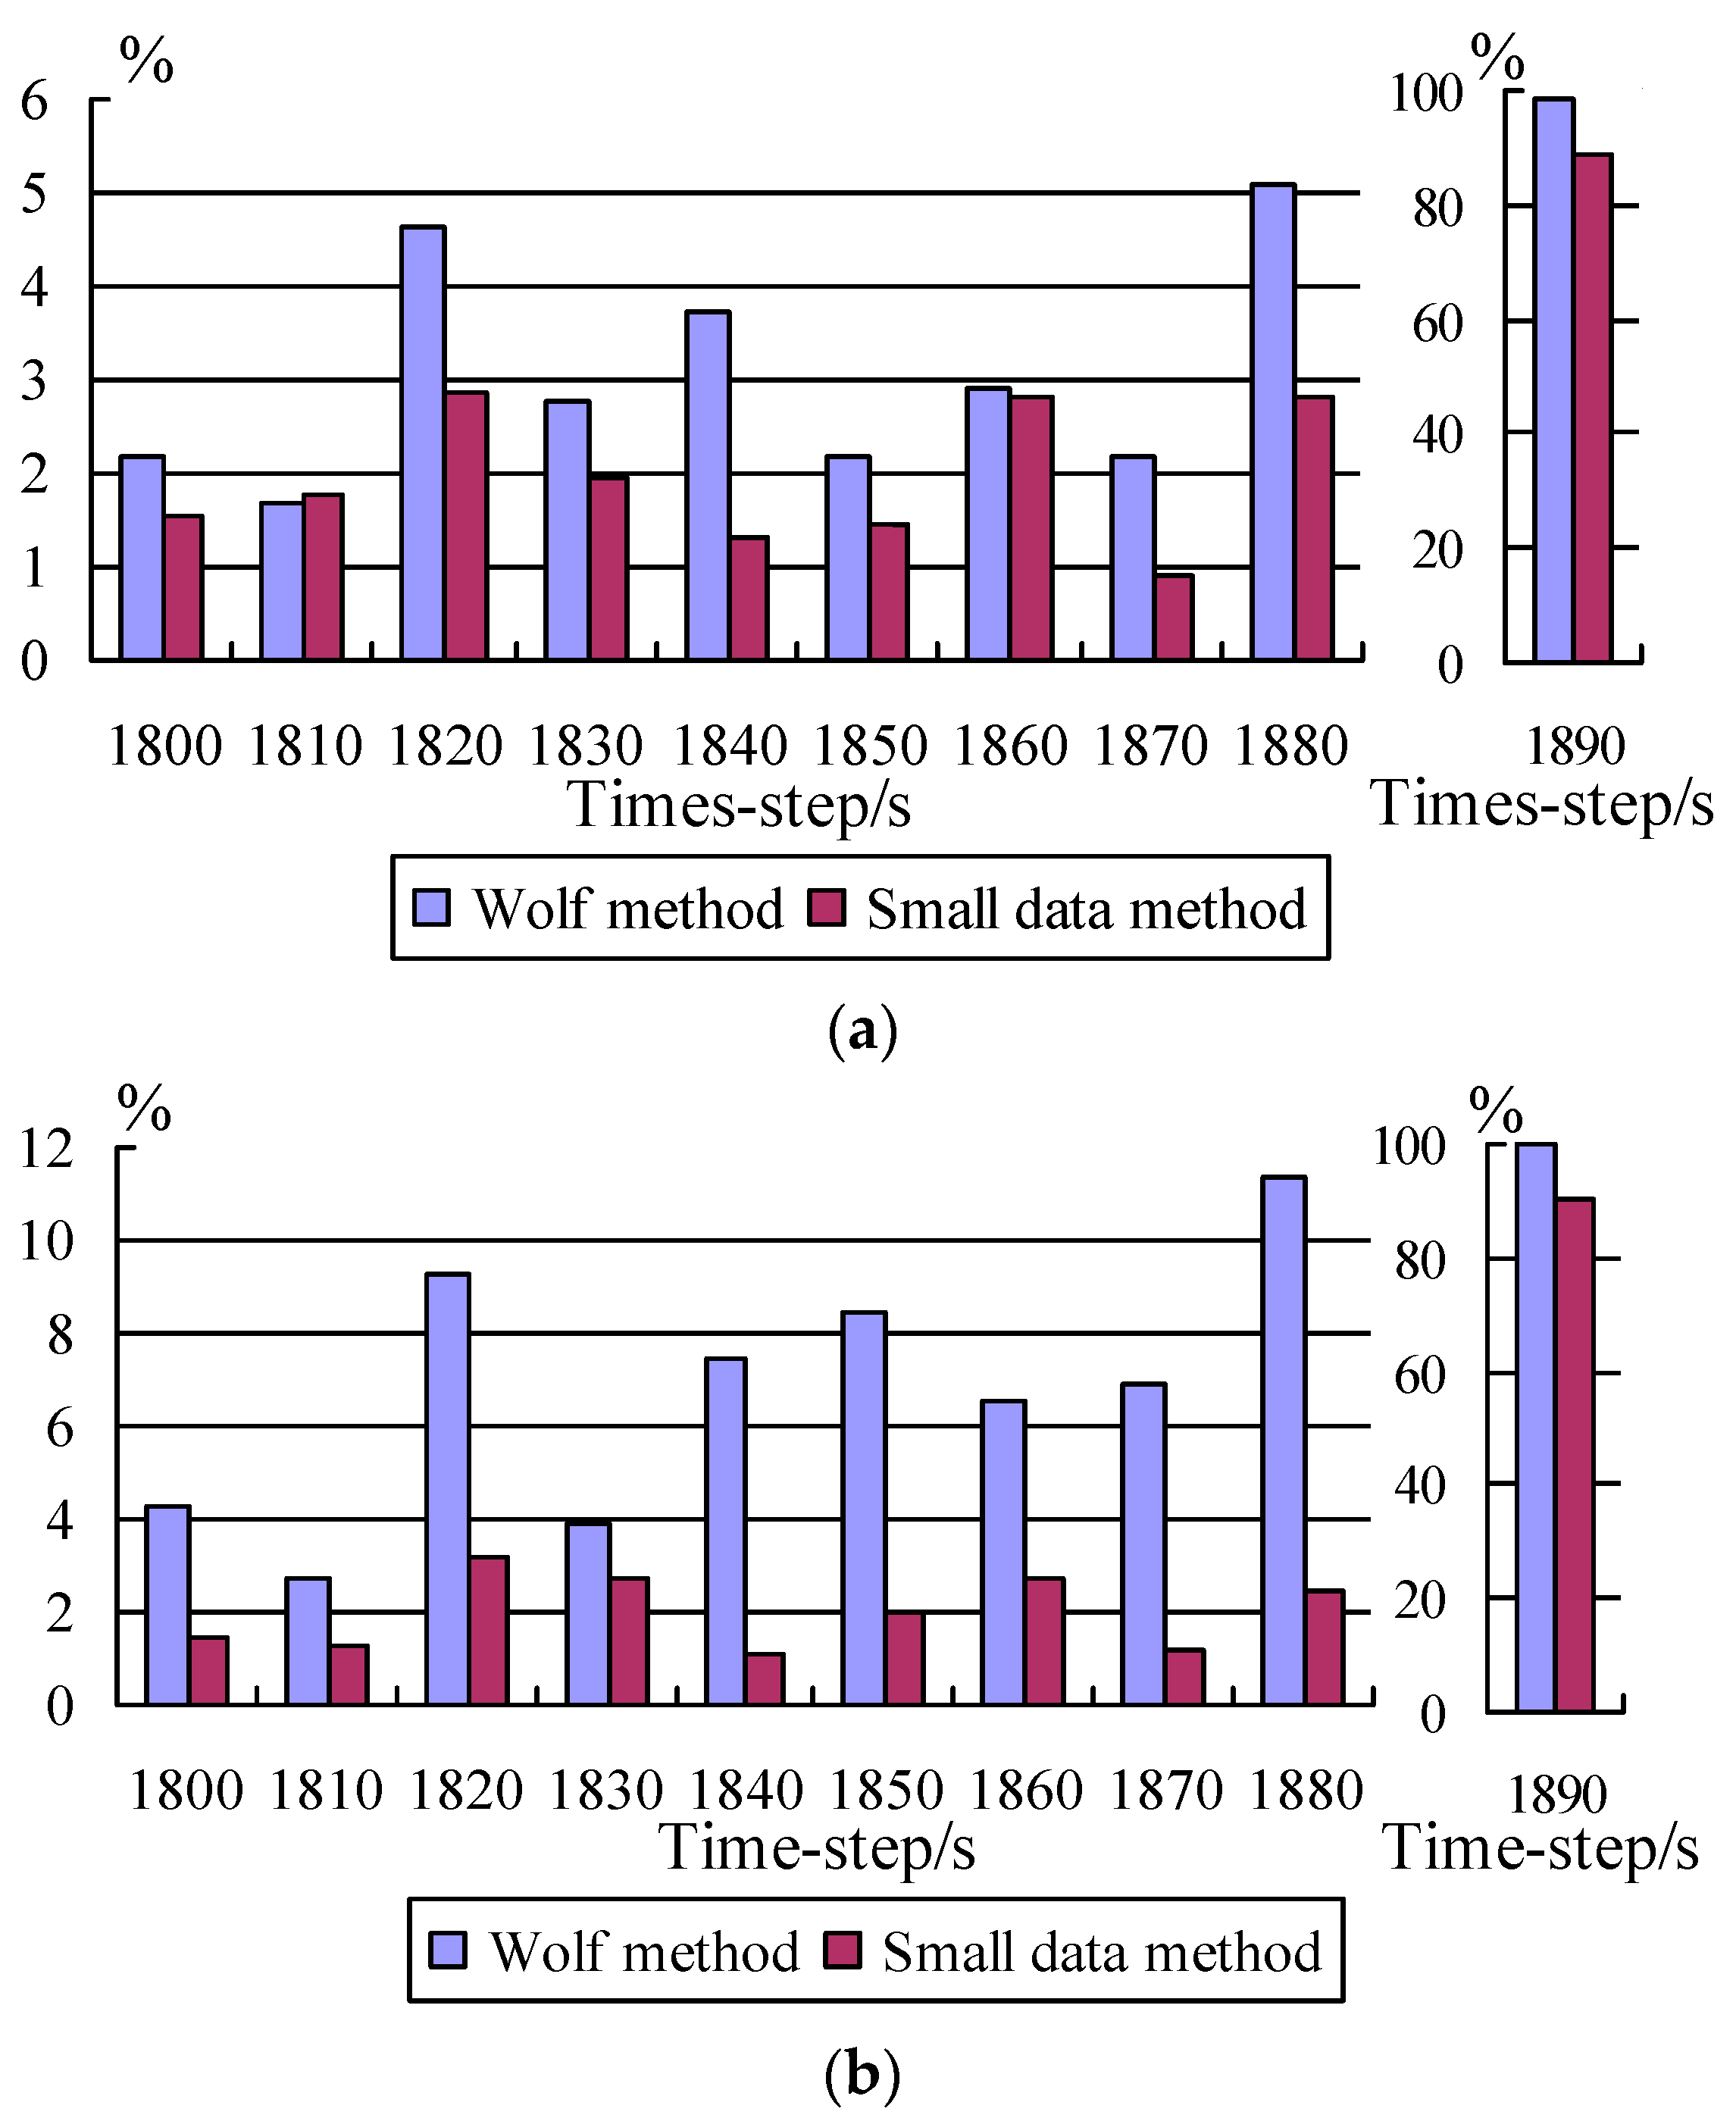
Finally, the relative error was applied to evaluate the accuracy of the 10-step prediction results of the two methods in the two channels, and the results of the two samples are shown in Figure 15 and Figure 16. Since the comparisons of the last time step correspond to the fracture points in the two channels, their relative error values will be much larger than those of the previous ones. For the convenience of observation and analysis, the comparison of the last group in each chart is represented separately. As can be seen from Figure 15 and Figure 16, in both channels, the relative errors of the fatigue fracture process prediction using the small data method are smaller than those of the Wolf method, indicating that the prediction accuracy of the small data method is higher than that of the Wolf method.
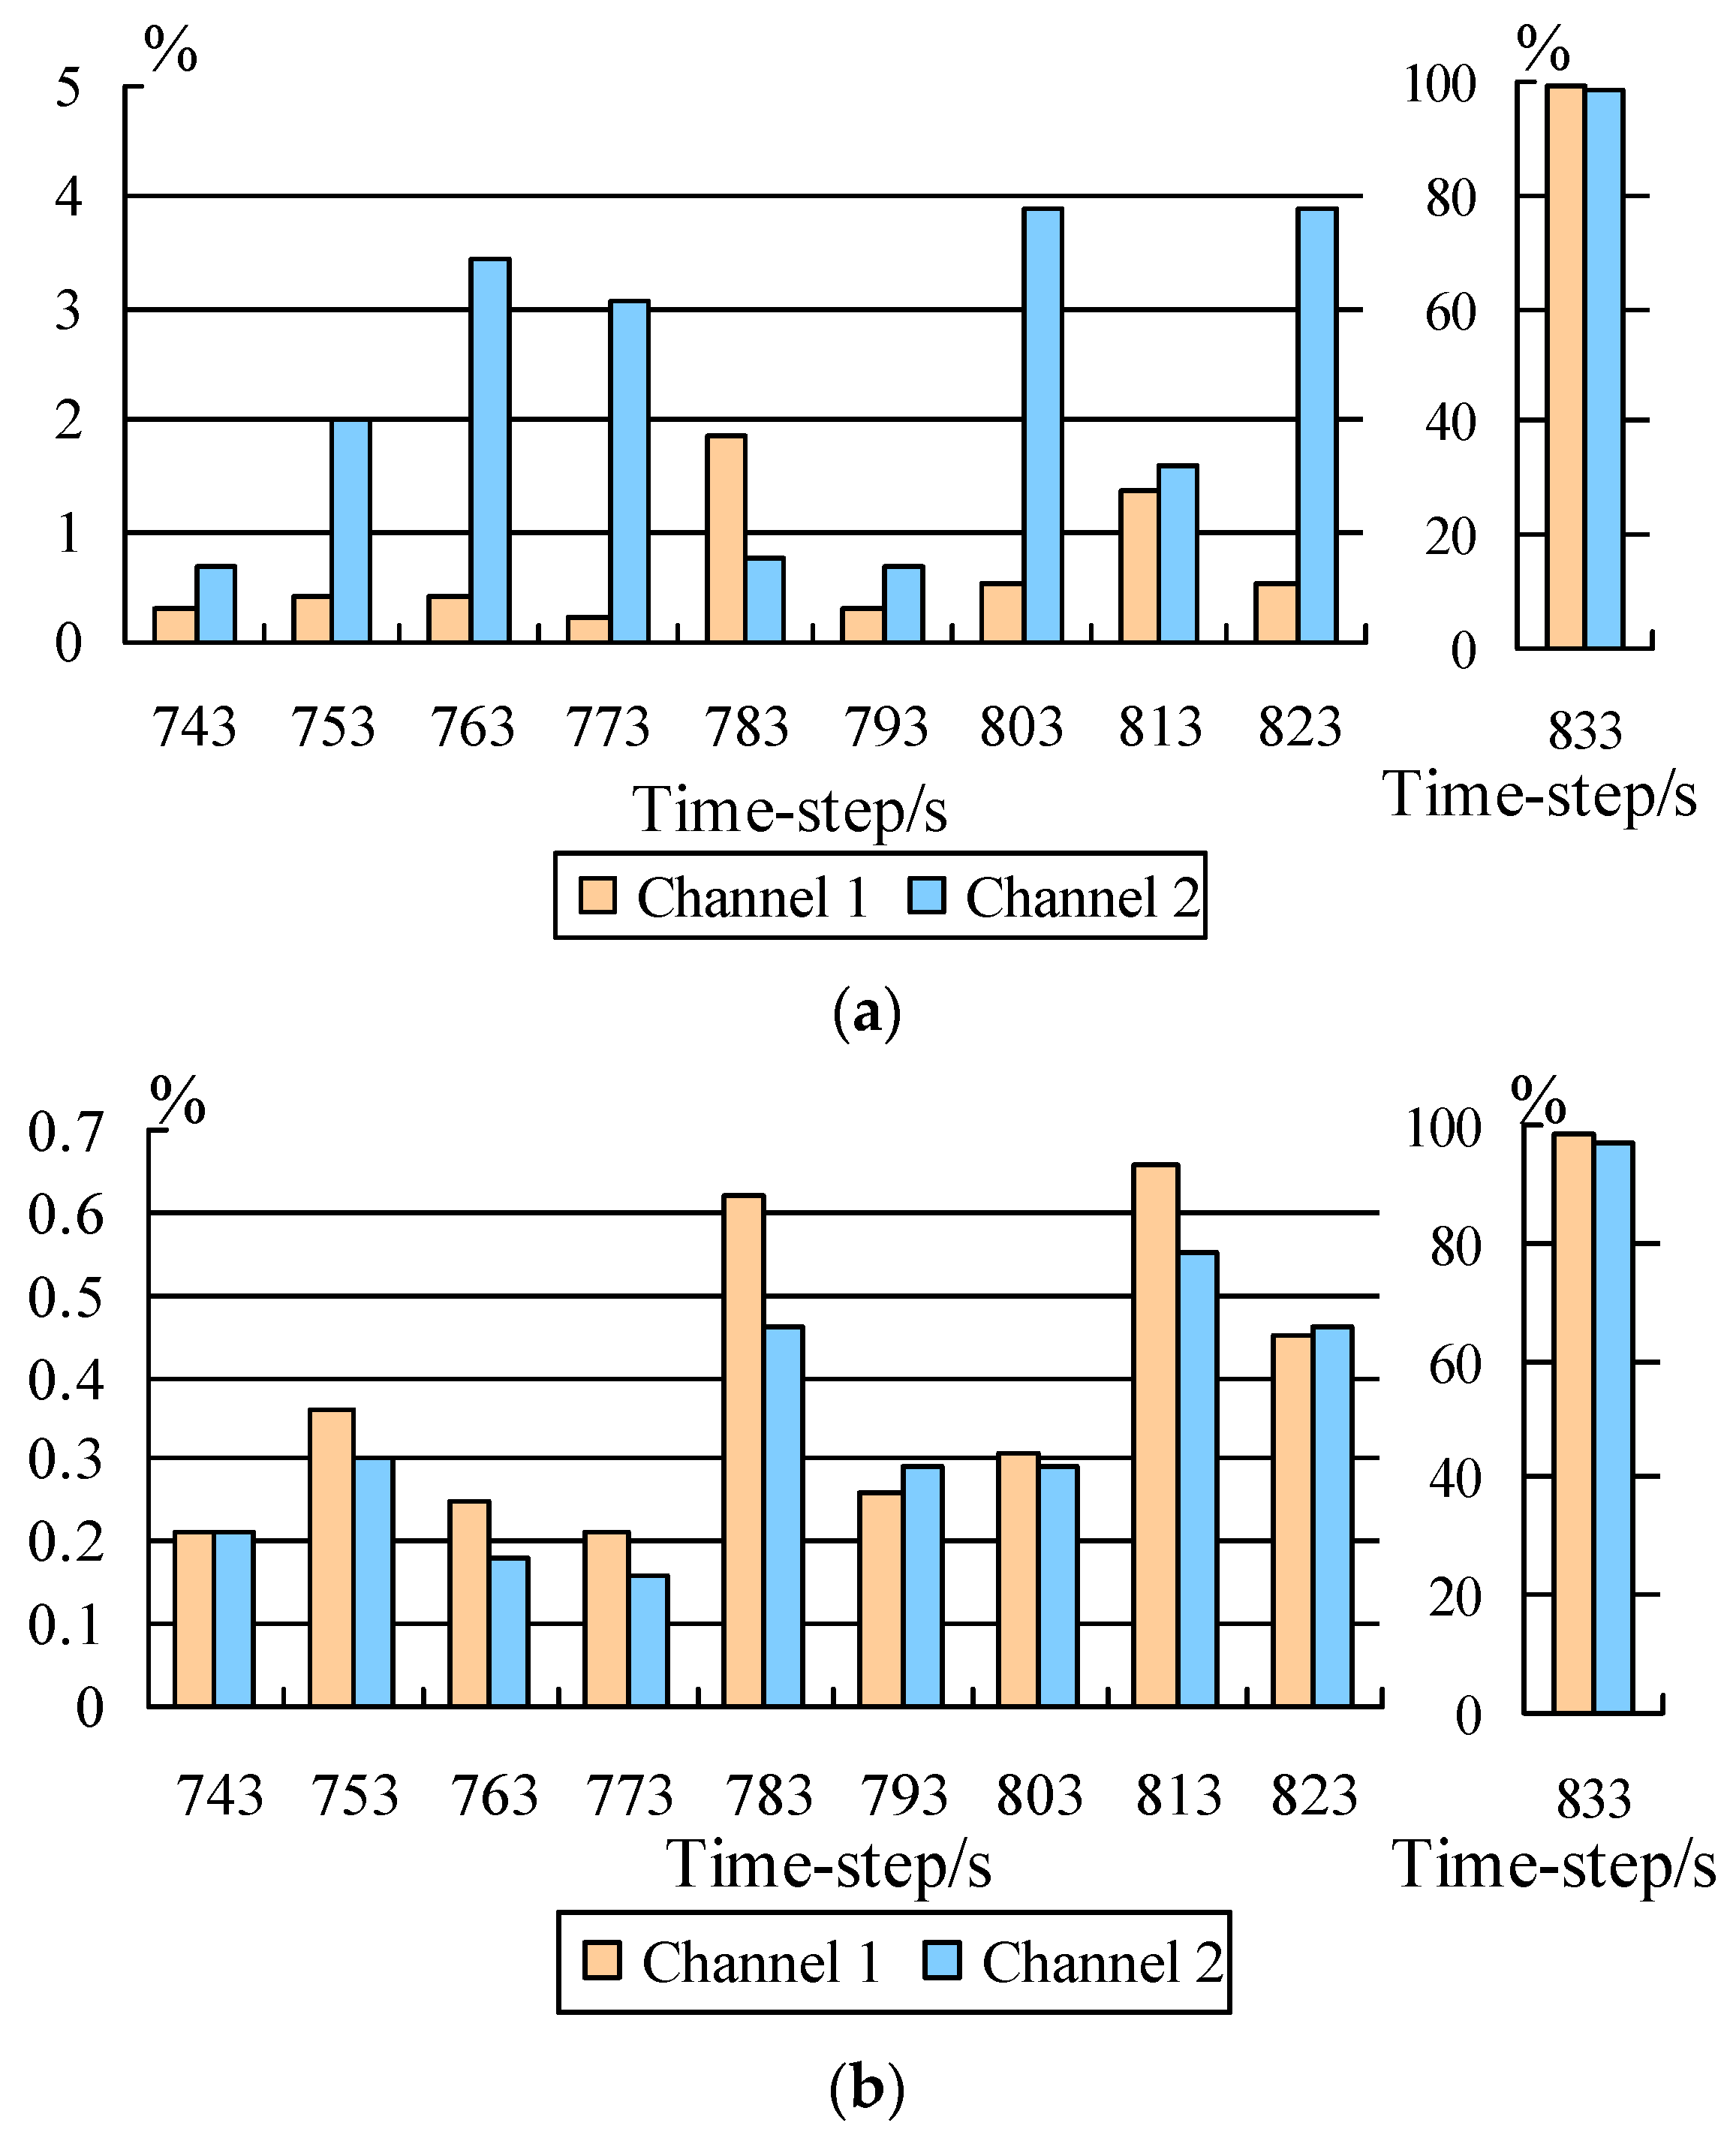
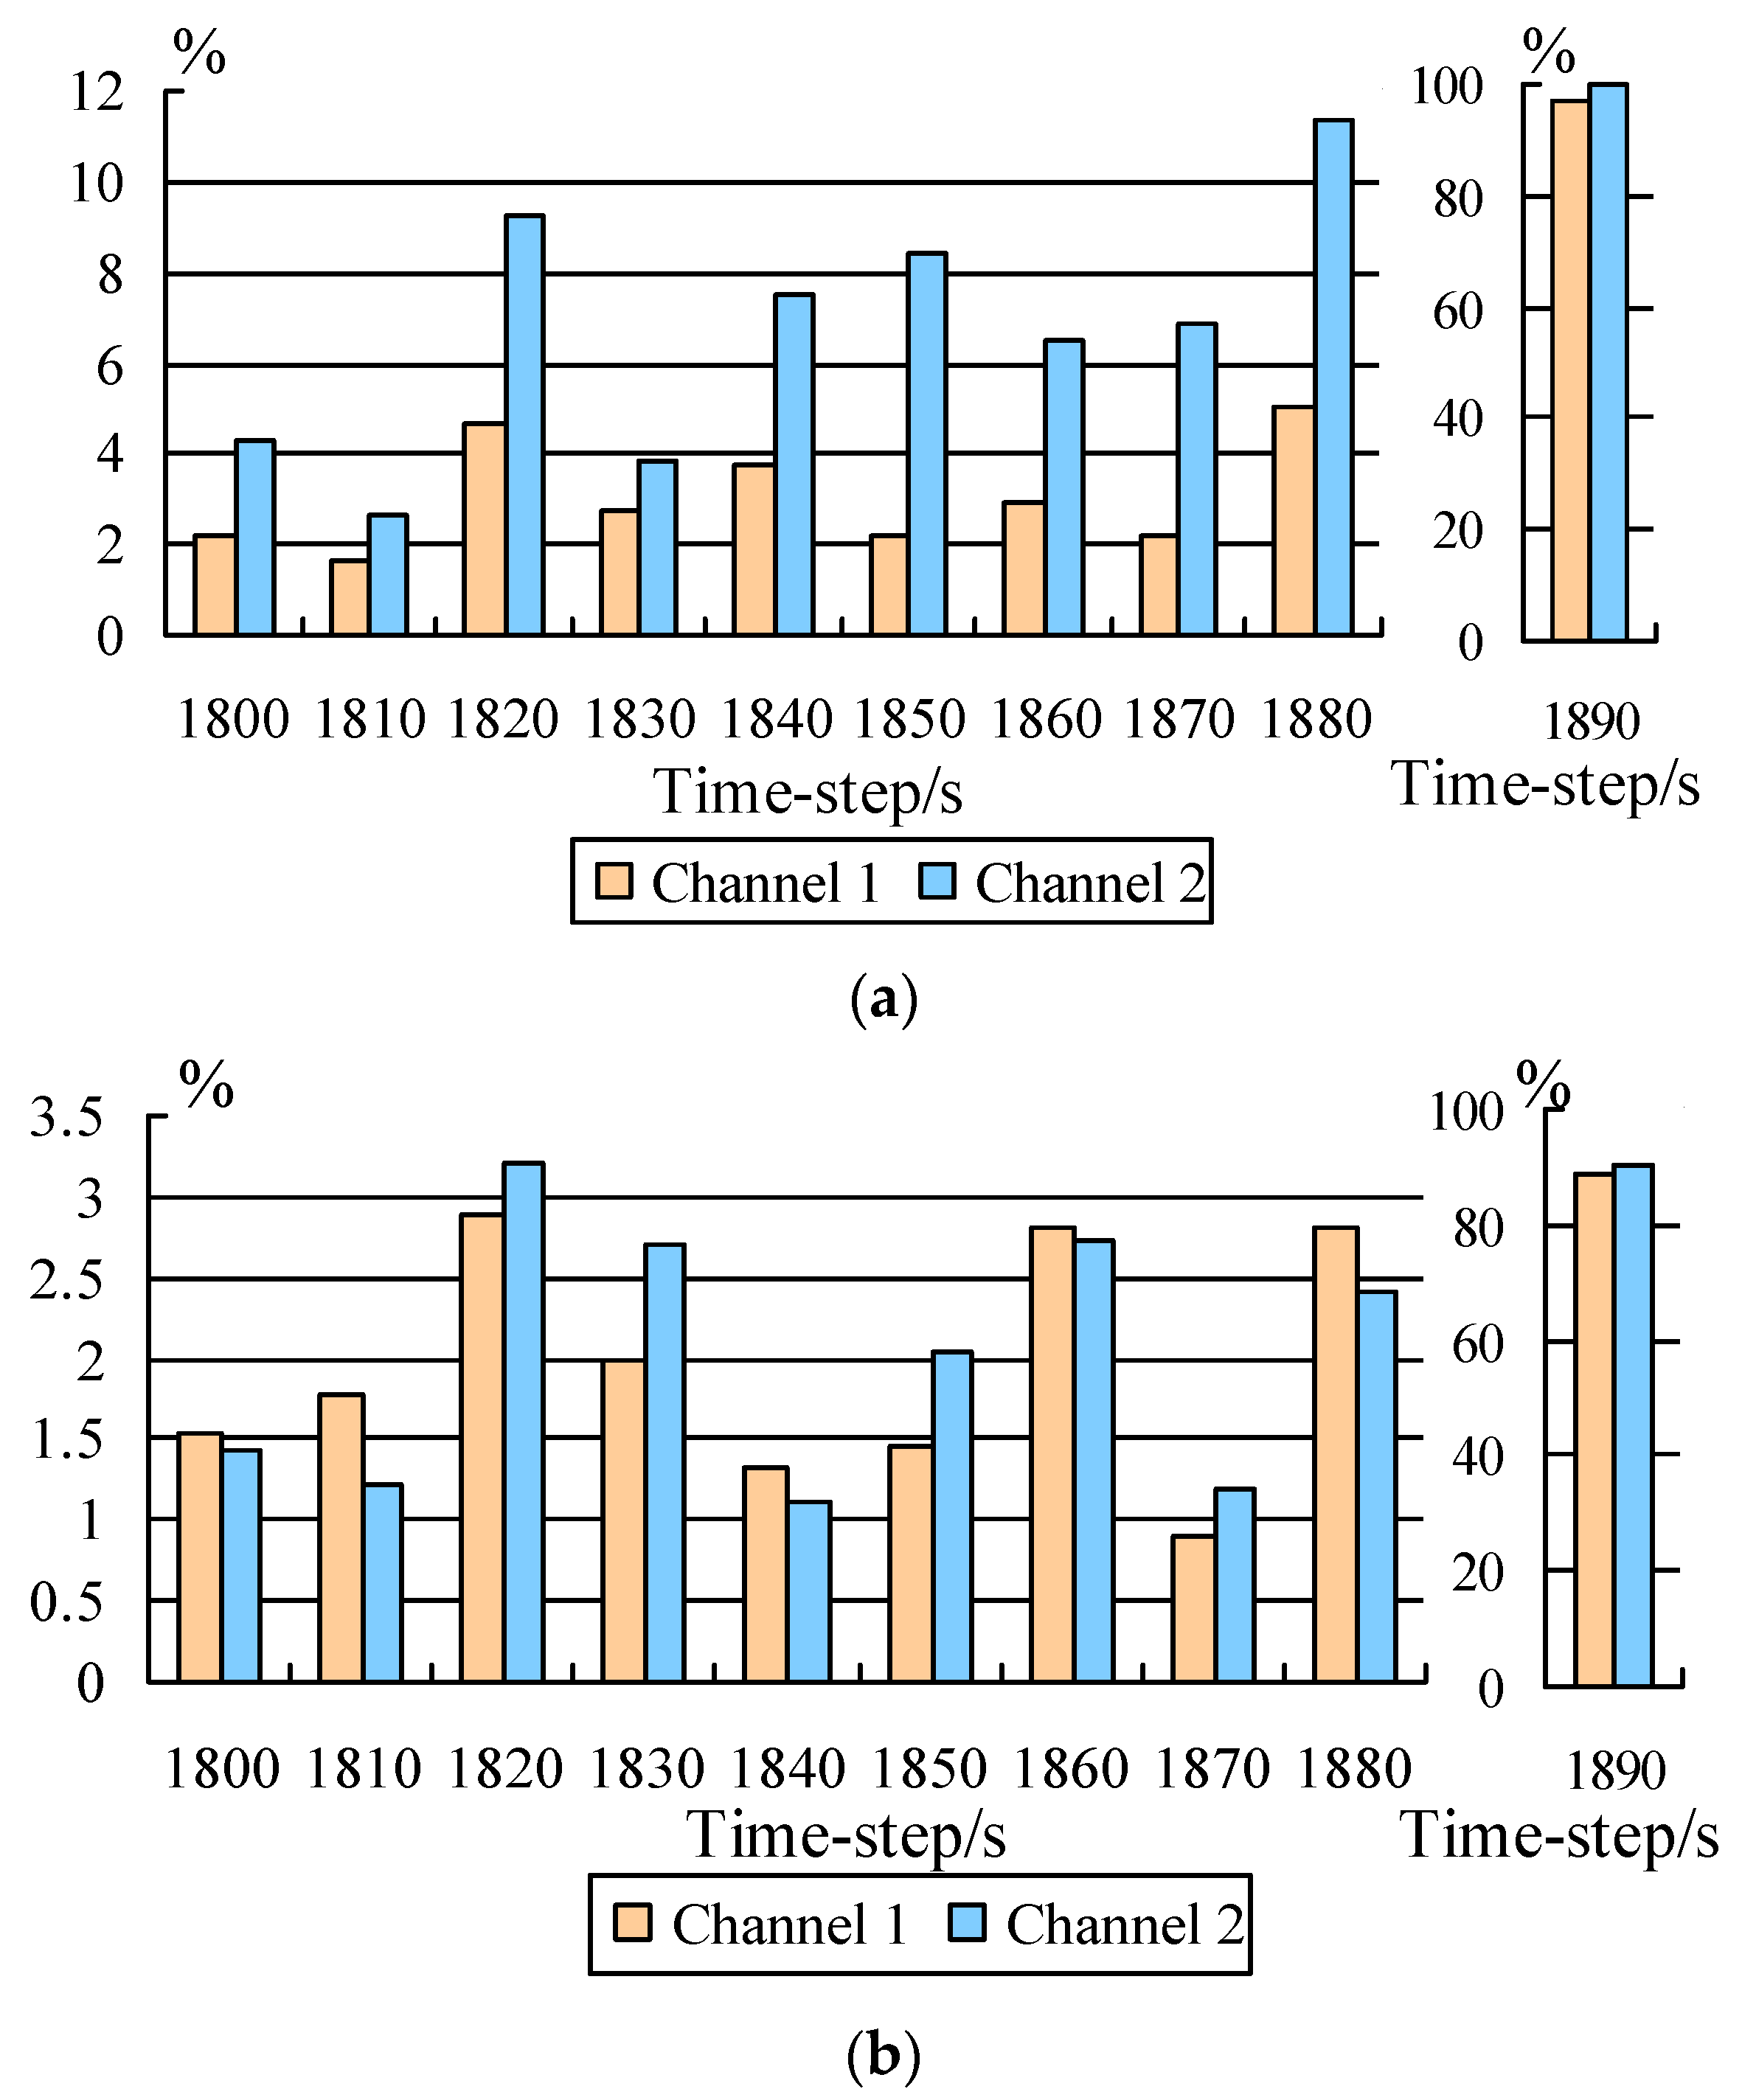
By comparing the prediction results of the Wolf method in the two channels, it can be concluded that due to the smaller amount of data, the prediction accuracy in channel 2 is lower, as seen in Figure 17a and Figure 18a. By comparing the prediction results of the small data method in the two channels, it can be concluded that even though the amount of data in channel 2 is smaller, the prediction accuracy is very close to that in channel 1, and the relative errors in some of the prediction time step are smaller in channel 2, as seen in Figure 17b and Figure 18b. For the same reason as in Figure 15 and Figure 16, the comparison of the last time step in each chart here is also represented separately.

5. Conclusions

As an AE parameter, absolute energy contains the richest dynamic information and is suitable for studying and analyzing the chaotic characteristics of the AE signal during metal fatigue damage process. It can be used as a representative of AE to calculate chaotic characteristic parameters.
In different fatigue damage stages, the largest Lyapunov exponents are all greater than 0, indicating that the metal fatigue damage process is accorded to chaotic characteristics. Chaos theory and chaotic parameters can be used to study and calculate this process.
The small data method applied in this paper is an effective method that improves the largest Lyapunov exponent based on the Wolf method. This method is used to predict the fatigue fracture stage of superalloy, which has the advantages of small computational complexity and few subjective influencing factors. The cross-comparison results of the two samples show that this method is more suitable for data sequences of smaller amount, and the prediction results are more accurate and reliable.
However, since the actual working environment of superalloys is harsher than that of simulation experiments, a more realistic experimental environment is particularly necessary for more in-depth research.

Author Contributions

Conceptualization, T.J. and Y.Y.; Methodology, T.J. and Y.Y.; Software, T.J.; Validation, T.J.; Formal analysis, T.J.; Investigation, T.J.; Resources, Y.Y.; Data curation, T.J.; Writing—original draft, T.J.; Writing—review & editing, T.J. and Y.Y.; Visualization, T.J.; Supervision, Y.Y.; Project administration, Y.Y. All authors have read and agreed to the published version of the manuscript.

Funding

This research was funded by the Innovative Application Program of Aero Engine Corporation of China (No. 630010504).

Data Availability Statement

The original contributions presented in this study are included in the article material. Further inquiries can be directed to the corresponding author.

Conflicts of Interest

The authors declare no conflict of interest.

References

  1. Ju, J.; Yu, H.; Zhao, Y.; Yang, T.; Xiao, B.; Peng, P.; Wang, R.; Wang, H.; Zeng, X.; Wang, J.; et al. Understanding the oxidation behaviors of a Ni-Co-based superalloy at elevated temperatures through multiscale characterization. Corros. Sci. 2024, 227, 111800. [Google Scholar] [CrossRef]
  2. Chen, M.; Hua, L.; Hu, Z.; Dong, K.; Qin, X. Cracking and suppression mechanisms of directed energy deposited IN738 superalloy revealed by microstructural characterization, in-situ thermal monitoring, and numerical simulations. J. Alloys Compd. 2025, 1020, 179446. [Google Scholar] [CrossRef]
  3. Karimian, S.F.; Modarres, M.; Bruck, H.A. A new method for detecting fatigue crack initiation in aluminum alloy using acoustic emission waveform information entropy. Eng. Fract. Mech. 2020, 223, 106771. [Google Scholar] [CrossRef]
  4. Roberts, T.M.; Talebzadeh, M. Acoustic emission monitoring of fatigue crack propagation. J. Constr. Steel Res. 2003, 59, 695–712. [Google Scholar] [CrossRef]
  5. Hassan, F.; Mahmood, A.K.B.; Yahya, N.; Saboor, A.; Abbas, M.Z.; Khan, Z.; Rimsan, M. State-of-the-art review on the acoustic emission source localization techniques. IEEE Access 2021, 9, 101246–101266. [Google Scholar] [CrossRef]
  6. Yu, J.; Ziehl, P.; Zárate, B.; Caicedo, J. Prediction of fatigue crack growth in steel bridge components using acoustic emission. J. Constr. Steel Res. 2011, 67, 1254–1260. [Google Scholar] [CrossRef]
  7. Chai, M.; Zhang, Z.; Duan, Q.; Song, Y. Assessment of fatigue crack growth in 316LN stainless steel based on acoustic emission entropy. Int. J. Fatigue 2018, 109, 145–156. [Google Scholar] [CrossRef]
  8. Keshtgar, A.; Sauerbrunn, C.M.; Modarres, M. Structural reliability prediction using acoustic emission-based modeling of fatigue crack growth. Appl. Sci. 2018, 8, 1225. [Google Scholar] [CrossRef]
  9. Caesarendra, W.; Kosasih, B.; Tieu, A.K.; Zhu, H.; Moodie, C.A.; Zhu, Q. Acoustic emission-based condition monitoring methods: Review and application for low speed slew bearing. Mech. Syst. Signal Process. 2016, 72, 134–159. [Google Scholar] [CrossRef]
  10. Kishawy, H.A.; Hegab, H.; Umer, U.; Mohany, A. Application of acoustic emissions in machining processes: Analysis and critical review. Int. J. Adv. Manuf. Technol. 2018, 98, 1391–1407. [Google Scholar] [CrossRef]
  11. Saeedifar, M.; Zarouchas, D. Damage characterization of laminated composites using acoustic emission: A review. Compos. B Eng. 2020, 195, 108039. [Google Scholar] [CrossRef]
  12. Chai, M.; Zhang, Z.; Duan, Q. A new qualitative acoustic emission parameter based on Shannon’s entropy for damage monitoring. Mech. Syst. Signal Process. 2018, 100, 617–629. [Google Scholar] [CrossRef]
  13. Chai, M.; Zhang, J.; Zhang, Z.; Duan, Q.; Cheng, G. Acoustic emission studies for characterization of fatigue crack growth in 316LN stainless steel and welds. Appl. Acoust. 2017, 126, 101–113. [Google Scholar] [CrossRef]
  14. Berkovits, A.; Fang, D. Study of fatigue crack characteristics by acoustic emission. Eng. Fract. Mech. 1995, 51, 401–416. [Google Scholar] [CrossRef]
  15. Behnia, A.; Chai, H.K.; Shiotani, T. Advanced structural health monitoring of concrete structures with the aid of acoustic emission. Constr. Build. Mater. 2014, 65, 282–302. [Google Scholar] [CrossRef]
  16. Morton, T.M.; Smith, S.; Harrington, R.M. Effect of loading variables on the acoustic emissions of fatigue-crack growth. Exp. Mech. 1974, 14, 282–302. [Google Scholar] [CrossRef]
  17. Li, L.; Zhang, Z.; Shen, G. Influence of grain size on fatigue crack propagation and acoustic emission features in commercial-purity zirconium. Mater. Sci. Eng. 2015, 636, 35–42. [Google Scholar] [CrossRef]
  18. Nemati, N.; Metrovich, B.; Nanni, A. Acoustic emission assessment of through-thickness fatigue crack growth in steel members. Adv. Struct. Eng. 2015, 18, 269–282. [Google Scholar] [CrossRef]
  19. Gagar, D.; Foote, P.; Irving, P.E. Effects of loading and sample geometry on acoustic emission generation during fatigue crack growth: Implications for structural health monitoring. Int. J. Fatigue 2015, 81, 117–127. [Google Scholar] [CrossRef]
  20. Keshtgar, A.; Modarres, M. Probabilistic approach for nondestructive detection of fatigue crack initiation and sizing. Int. J. Progn. Health Manag. 2016, 7, 1–10. [Google Scholar] [CrossRef]
  21. Aggelis, D.G.; Kordatos, E.Z.; Matikas, T.E. Acoustic emission for fatigue damage characterization in metal plates. Mech. Res. Commun. 2011, 38, 106–110. [Google Scholar] [CrossRef]
  22. Chen, H.L.; Choi, J.H. Acoustic emission study of fatigue cracks in materials used for AVLB. J. Nondestruct. Eval. 2004, 23, 133–151. [Google Scholar] [CrossRef]
  23. Takens, F. Detecting strange attractors in turbulence. In Dynamical Systems and Turbulence, Warwick 1980; Springer: Berlin/Heidelberg, Germany, 1981; Volume 898, pp. 366–381. [Google Scholar]
  24. Rosenstein, M.T.; Collins, J.J.; DeLuca, C.J. A Practical Method for calculating Largest Lyapunov Exponents from Small Data Sets. Phys. D Nonlinear Phenom. 1993, 65, 117–134. [Google Scholar] [CrossRef]
  25. Peter, G.; Itamar, P. Measuring the strangeness of strange attractors. Phys. D Nonlinear Phenom. 1983, 9, 189–208. [Google Scholar]
  26. Alan, W.; Jack, S.; Harry, L.; Swinney, J.V. Determining Lyapunov exponents from a time series. Phys. D Nonlinear Phenom. 1985, 3, 285–317. [Google Scholar]
  27. Fraser, A.M. Information and entropy in strange attractors. IEEE Trans. Inf. Theory 1989, 35, 245–262. [Google Scholar] [CrossRef]
  28. GB/T 15248-2008; The Test Method for Axial Loading Constant-Amplitude Low-Cycle Fatigue of Metallic Materials. General Administration of Quality Supervision, Inspection and Quarantine of the People’s Republic of China, National Standardization Administration: Beijing, China, 2008.
Figure 1. The definitions of AE parameters.
Metals 15 00945 g001
Figure 2. Functional block diagram of the proposed method.
Metals 15 00945 g002
Figure 3. Fatigue test rod.
Metals 15 00945 g003
Figure 4. Schematic of the AE signal acquisition system.
Metals 15 00945 g004
Figure 5. AE signals of sample 1 in channel 1.
Metals 15 00945 g005
Figure 6. AE signals of sample 1 in channel 2.
Metals 15 00945 g006
Figure 7. AE signals of sample 2 in channel 1.
Metals 15 00945 g007
Figure 8. AE signals of sample 2 in channel 2.
Metals 15 00945 g008
Figure 9. The coefficient of variation of AE parameters of the two channels for sample 1.
Metals 15 00945 g009
Figure 10. The coefficient of variation of AE parameters of the two channels for sample 2.
Metals 15 00945 g010
Figure 11. The main part of absolute energy and the cumulative characteristics in (a) channel 1 and (b) channel 2 for sample 1.
Metals 15 00945 g011
Figure 12. The main part of absolute energy and the cumulative characteristics in (a) channel 1 and (b) channel 2 for sample 2.
Metals 15 00945 g012
Figure 13. The prediction periods calculated by FFT in (a) channel 1 and (b) channel 2 of sample 1.
Metals 15 00945 g013
Figure 14. The prediction periods calculated by FFT in (a) channel 1 and (b) channel 2 of sample 2.
Metals 15 00945 g014
Figure 15. Comparison of the prediction effects using different methods in (a) channel 1 and (b) channel 2 for sample 1.
Metals 15 00945 g015
Figure 16. Comparison of the prediction effects using different methods in (a) channel 1 and (b) channel 2 for sample 2.
Metals 15 00945 g016
Figure 17. Comparison of the prediction effects in different channels of the two methods: (a) Wolf method and (b) small data method for sample 1.
Metals 15 00945 g017
Figure 18. Comparison of the prediction effects in different channels of the two methods: (a) Wolf method and (b) small data method for sample 2.
Metals 15 00945 g018
Table 1. The calculation results of the largest Lyapunov exponent in channel 1 and channel 2 for sample 1.
Set NumberThe Largest Lyapunov Exponent in Channel 1The Largest Lyapunov Exponent in Channel 2
10.000320.00024
20.001520.00093
30.003550.00278
40.006410.00577
50.004280.00396
Over all0.003920.00251
Table 2. The calculation results of the largest Lyapunov exponent in channel 1 and channel 2 for sample 2.
Set NumberThe Largest Lyapunov Exponent in Channel 1The Largest Lyapunov Exponent in Channel 2
10.001720.00066
20.006710.00129
30.000830.00311
40.003140.00583
50.004220.00501
Over all0.005390.00324
Table 3. Prediction results of the fatigue fracture process for sample 1.
Prediction Time Step/sCyclesChannel 1Channel 2
Measured ValueWolf MethodSmall Data MethodMeasured ValueWolf MethodSmall Data Method
743743036,655.4336,547.2836,733.755599.825638.875587.92
753753029,893.6529,772.4230,001.172539.422488.682546.97
763763026,829.7226,945.5526,895.875628.185433.405638.56
773773039,033.0638,947.1239,113.895989.256173.875979.88
78378342,114.5042,887.6842,373.906826.176773.336857.71
793793065,863.4065,658.1265,691.575584.645621.975568.72
803803041,286.7341,070.8241,416.671262.391311.761266.06
81383011,464.3611,619.6611,539.977509.377390.047497.85
823823045,213.2544,973.3145,417.874622.994802.604644.23
833833039,554,569.66400,467.79672,731.9714,963,564.37187,862.23497,662.11
Table 4. Prediction results of the fatigue fracture process for sample 2.
Prediction Time Step/sCyclesChannel 1Channel 2
Measured ValueWolf MethodSmall Data MethodMeasured ValueWolf MethodSmall Data Method
180018,00014,180.0013,869.0313,962.76527.75550.35535.30
181018,1007150.007031.107023.73356.25365.84351.88
182018,20025.5926.7826.33389.10395.97376.66
183018,3006477.006296.556349.01163.16156.87158.76
184018,400173.87180.35157.81712.99659.64720.96
185018,500820.16837.88788.23797.56809.25813.83
186018,600691.51717.28710.92430.52458.59442.26
187018,7002928.002864.402901.65378.19404.25382.71
188018,80051.8954.5253.351822.001770.771777.94
189018,9004,189,000,000134,885,800.014473,825,575.0611,898,000,0003,530,027.481,150,536,612.85
Disclaimer/Publisher’s Note: The statements, opinions and data contained in all publications are solely those of the individual author(s) and contributor(s) and not of MDPI and/or the editor(s). MDPI and/or the editor(s) disclaim responsibility for any injury to people or property resulting from any ideas, methods, instructions or products referred to in the content.