Article

A Method for Determining Twins and Corresponding Schmid Factors Based on Electron Diffraction

1
Joint International Laboratory for Light Alloys (MOE), College of Materials Science and Engineering, Chongqing University, Sha 8 Zheng Jie 174, Chongqing 400044, China
2
Mechanical and Materials Engineering, University of Nebraska-Lincoln, Lincoln, NE 68588, USA
*
Authors to whom correspondence should be addressed.
Metals 2025, 15(8), 920; https://doi.org/10.3390/met15080920 (registering DOI)
Submission received: 4 July 2025 / Revised: 15 August 2025 / Accepted: 18 August 2025 / Published: 20 August 2025
(This article belongs to the Section Crystallography and Applications of Metallic Materials)

Abstract

Determining orientation relationships between different grains or phases via electron diffraction typically requires coincident zone axes, but it is difficult to achieve in most cases due to tilting angle limitations. To address this challenge, a straightforward method for determining the twinning relationship and twin variant in deformed metals is developed by interpreting the selected area electron diffraction (SAED) patterns and corresponding tilt angles in the transmission electron microscope (TEM). The transformation matrix from the sample coordinate system (SCS) to the crystal coordinate system (CCS) is derived to describe the orientation matrix of the observed target. This method is demonstrated by characterizing twins and corresponding Schmid factors in deformed Ti−15Mo alloy even when the zone axes are not coaxial. This method significantly facilitates the determination of multiple orientation relationships and the quantitative analysis of plastic deformation mechanisms in TEM.

1. Introduction

Electron backscatter diffraction (EBSD) and transmission electron microscopy (TEM) are commonly used to characterize the microstructures and orientations of deformed metals. Since EBSD can directly provide the orientation of each pixel in the sample coordinate system (SCS) [1], by integrating with the applied load, it can be used to build the relation between applied load and deformation mechanisms, i.e., the Schmid factor (SF) associated with each shear mode [2,3,4,5,6,7,8,9,10,11,12,13]. Although high−resolution electron backscatter diffraction (HREBSD) [14] and transmission Kikuchi diffraction (TKD) [15] are able to offer higher resolution, with HREBSD achieving a minimum spatial resolution of ~50 nm and TKD achieving a spatial resolution of less than 10 nm, the spatial resolution is insufficient to characterize the deformation behaviors that occur in ultrafine nanostructures [16,17,18,19]. Thus, TEM is widely used to investigate defects and orientations in nanostructured metals as it offers extremely high resolution−capable of even resolving atomic images [20,21,22,23,24,25,26,27,28,29]. This includes characterizing features such as dislocations [30,31], stacking faults [32,33], nanograins [20,22,26,28], and nanotwins [21,23,24,29], as well as determining the local orientations of the studied domains.
The orientation of a deformed domain In TEM can be identified based on diffraction patterns and Kikuchi bands [34,35,36,37,38,39]. Kikuchi bands offer greater accuracy in ascertaining orientation, but a series of complex calculations and analyses are required from their images to determine the crystal orientation [37,38,40]. Electron diffraction patterns are more intuitive and easier to obtain, but they can only be conducted along specific beam directions [34,35,39]. By tilting the sample to allow one of the zone axes to be strictly parallel to beam direction, the orientation determined by diffraction patterns and Kikuchi bands is identical. However, the highly specialized and complex nature limit the wide application of the integrated diffraction patterns and Kikuchi bands. There are some automated crystal orientation mapping methods in TEM (ACOM−TEM) [40,41,42,43,44,45,46]. In these approaches, the crystal orientation is determined from diffraction patterns and Kikuchi bands that are either recorded directly using the diffraction mode or reconstructed indirectly from conical-scanning dark−field images. Additional special hardware and software are needed utilize ACOM−TEM, which limits its widespread adoption. SAED patterns of low−index zone axes are used to characterize crystal orientation relationships due to their convenience and effectiveness. For example, the twinning relationship is characterized by using SAED along the zone axes of the matrix and the twin. However, this method is limited when the zone axes of the adjacent crystals are not a detected beam direction for either crystal. Thus, the limited tilt angle of the holder often makes it impossible to achieve coaxial alignment, particularly for multiple twin variants. Moreover, tilting the TEM sample also causes rotation of the loading direction in space. The conventional TEM characterization cannot link the microstructural characteristics with the loading axis, which impedes comprehensive understanding of deformation mechanisms.
Here, we propose a method to identify the orientation relations and their relations with loading direction. The significance of crystallographic orientation lies in assessing the relationship between the different directions of the crystal and the characteristic directions of the macroscopic sample. The transformation matrix from the SCS to the crystal coordinate system (CCS) is equivalent to the orientation matrix. Considering the tilting nature of the TEM holder, it is better to introduce a static reference system, i.e., the microscope coordinate system (MCS) to facilitate the transformation between the CCS and the SCS. The transformation between the CCS and the MCS can be easily determined through SAED patterns. As the sample rotates around two fixed axes of the holder during the tilting process, and the tilt angles can be read from the computer display, it is feasible to achieve mutual transformation between the MCS and the SCS, thereby obtaining the orientation expressed in the SCS. If the loading direction is known in the SCS, the orientation relationship between the crystal structure and the applied load of deformed metals can be defined.

2. Calculation Method

Three coordinate systems, the crystal coordinate system (CCS, Figure 1a), microscope coordinate system (MCS, Figure 1b), and sample coordinate system (SCS, Figure 1c), are involved in conducting the following analysis to determine the orientation of a domain. After tilting the holder, an SAED pattern of the zone axis [U V W] is obtained in Figure 1b. By indexing the diffraction spots, the transformation matrix from the MCS to the CCS can be calculated:
J m c = h r u k s v l t w x y 0 y x 0 0 0 1 1 .
Here, [u v w] and [h k l] represent the direction vector of the zone axis and the diffraction vector corresponding to a diffraction spot in the CCS, respectively. The selection of this diffraction spot follows the principle of unique crystal orientation. The vector [r s t] = [u v w] × [h k l]. The MCS is established with the transmission spot as the origin. The vector [x y 0] is the position of this diffraction spot in the MCS. All vectors are normalized. It is worth noting that when an electron diffraction pattern contains reflections from only one zone, there is typically a 180° uncertainty in indexing the spots [35,36]. The alternatives are only equivalent for the determination of orientations if the zone axis has an even order of symmetry. For cubic metals, the [100] and [110] zone axes, and for hexagonal metals, the [11 2 ¯ 0], [10 1 ¯ 0], and [0001] zone axes possess an even order of symmetry. Alternatively, this uncertainty can be resolved by tilting the sample and taking a second diffraction pattern.
The SCS is established based on the double−tilt holder, where the length direction of the holder is the OX axis, the width direction is the OY axis, and the normal direction to the sample surface is the OZ axis. The rotation matrix for transforming between the MCS and the SCS is derived:
J s m = T x T y = 1 0 0 0 cos α sin α 0 sin α cos α cos β 0 sin β 0 1 0 sin β 0 cos β
Here, α and β represent the tilt angles of the holder around the OX and OY axes of the SCS, respectively. In this equation, counterclockwise rotation is defined as a positive angle, and it is worth mentioning that the sign of the tilt angles read in TEM is dependent on the brand and modes of the TEM equipment.
The transformation matrix from the SCS to the CCS (referred to as the orientation matrix) is described by the Euler angles (φ1, Φ, and φ2) as follows:
J s c = J m c J s m = g 11 g 12 g 13 g 21 g 22 g 23 g 31 g 32 g 33   = cos φ 1 cos φ 2 sin φ 1 sin φ 2 cos Φ sin φ 1 cos φ 2 + cos φ 1 sin φ 2 cos Φ sin φ 2 sin Φ cos φ 1 sin φ 2 sin φ 1 cos φ 2 cos Φ sin φ 1 sin φ 2 + cos φ 1 cos φ 2 cos Φ cos φ 2 sin Φ sin φ 1 sin Φ cos φ 1 sin Φ cos Φ
Following the determination of crystal orientations for the studied domains via this method, the orientation relationship between them can also be readily obtained. Deformation characteristics of crystals can be correlated with macroscopic mechanical responses, such as the angle between the twin plane/twin direction and the loading axis. Furthermore, the SF for the twin variants is calculated based on the orientation matrix of the matrix and the loading direction:
m = s J c s b s J c s n
where b and n represent the base vector for the twin shear and twin plane normal in the CCS, respectively. s is the loading direction in the SCS.

3. Materials

An original Ti−15 wt.% Mo rod with a diameter of 10 mm was solution−treated at 1173 K for 1 h and then water−quenched to room temperature to achieve the fully β phase. To verify the actual composition, the rod was analyzed using X−Ray Fluorescence (XRF, Shimadzu XRF−1800, manufactured by Shimadzu Corporation, Kyoto, Japan). The measured result shows a molybdenum content of 14.91 wt.%, with the remainder being titanium. This actual composition is in good agreement with the nominal Ti−15 wt.% Mo. Block specimens with dimensions of 6 mm × 6 mm × 10 mm were cut from the solution−treated rod. Compression tests up to a strain of 2% were performed on an AG−X testing machine (Shimadzu Corporation, Kyoto, Japan) with a strain rate of 10−3 s−1 along a longitudinal direction at ambient temperature, following the procedures outlined in ASTM E9−19 [47] (Standard Test Methods of Compression Testing of Metallic Materials at Room Temperature). The microstructures and orientations were characterized by scanning electron microscopy (TESCAN MIRA3, manufactured by TESCAN ORSAY HOLDING, Brno, Czech Republic) equipped with a EBSD detector, and TEM (FEI Tecnai G2 F20, manufactured by FEI Company, Hillsboro, OR, USA) equipped with a double−tilt holder. EBSD samples were mechanically polished and then electropolished in the perchloric acid electrolyte (60% methanol, 34% n−butanol, and 6% perchloric acid) at 30 V for 15 s. The EBSD measurements were implemented at an accelerating voltage of 20 kV, using a step size of 1 μm. EBSD data were processed by the AZtecCrystal commercial software (version 2.1). TEM foils were cut from the deformed specimens and were mechanically ground to a thickness of 40 μm. The foils were finally twin−jet electropolished in the same electrolyte with a voltage of 30 V at −30 °C. The foils were examined by TEM operating at 200 kV. To discern the loading direction in the SCS, the foil was cut from the deformed specimens in a specific direction. If the foil plane is perpendicular to the loading direction, the loading direction is parallel to the OZ axis in the SCS. Optionally, if the foil plane is parallel to the loading direction, the loading direction should be marked during the preparation of the TEM disc samples. The angle between the loading direction and the OX axis of the SCS should be recorded while mounting the TEM sample.

4. Results and Discussion

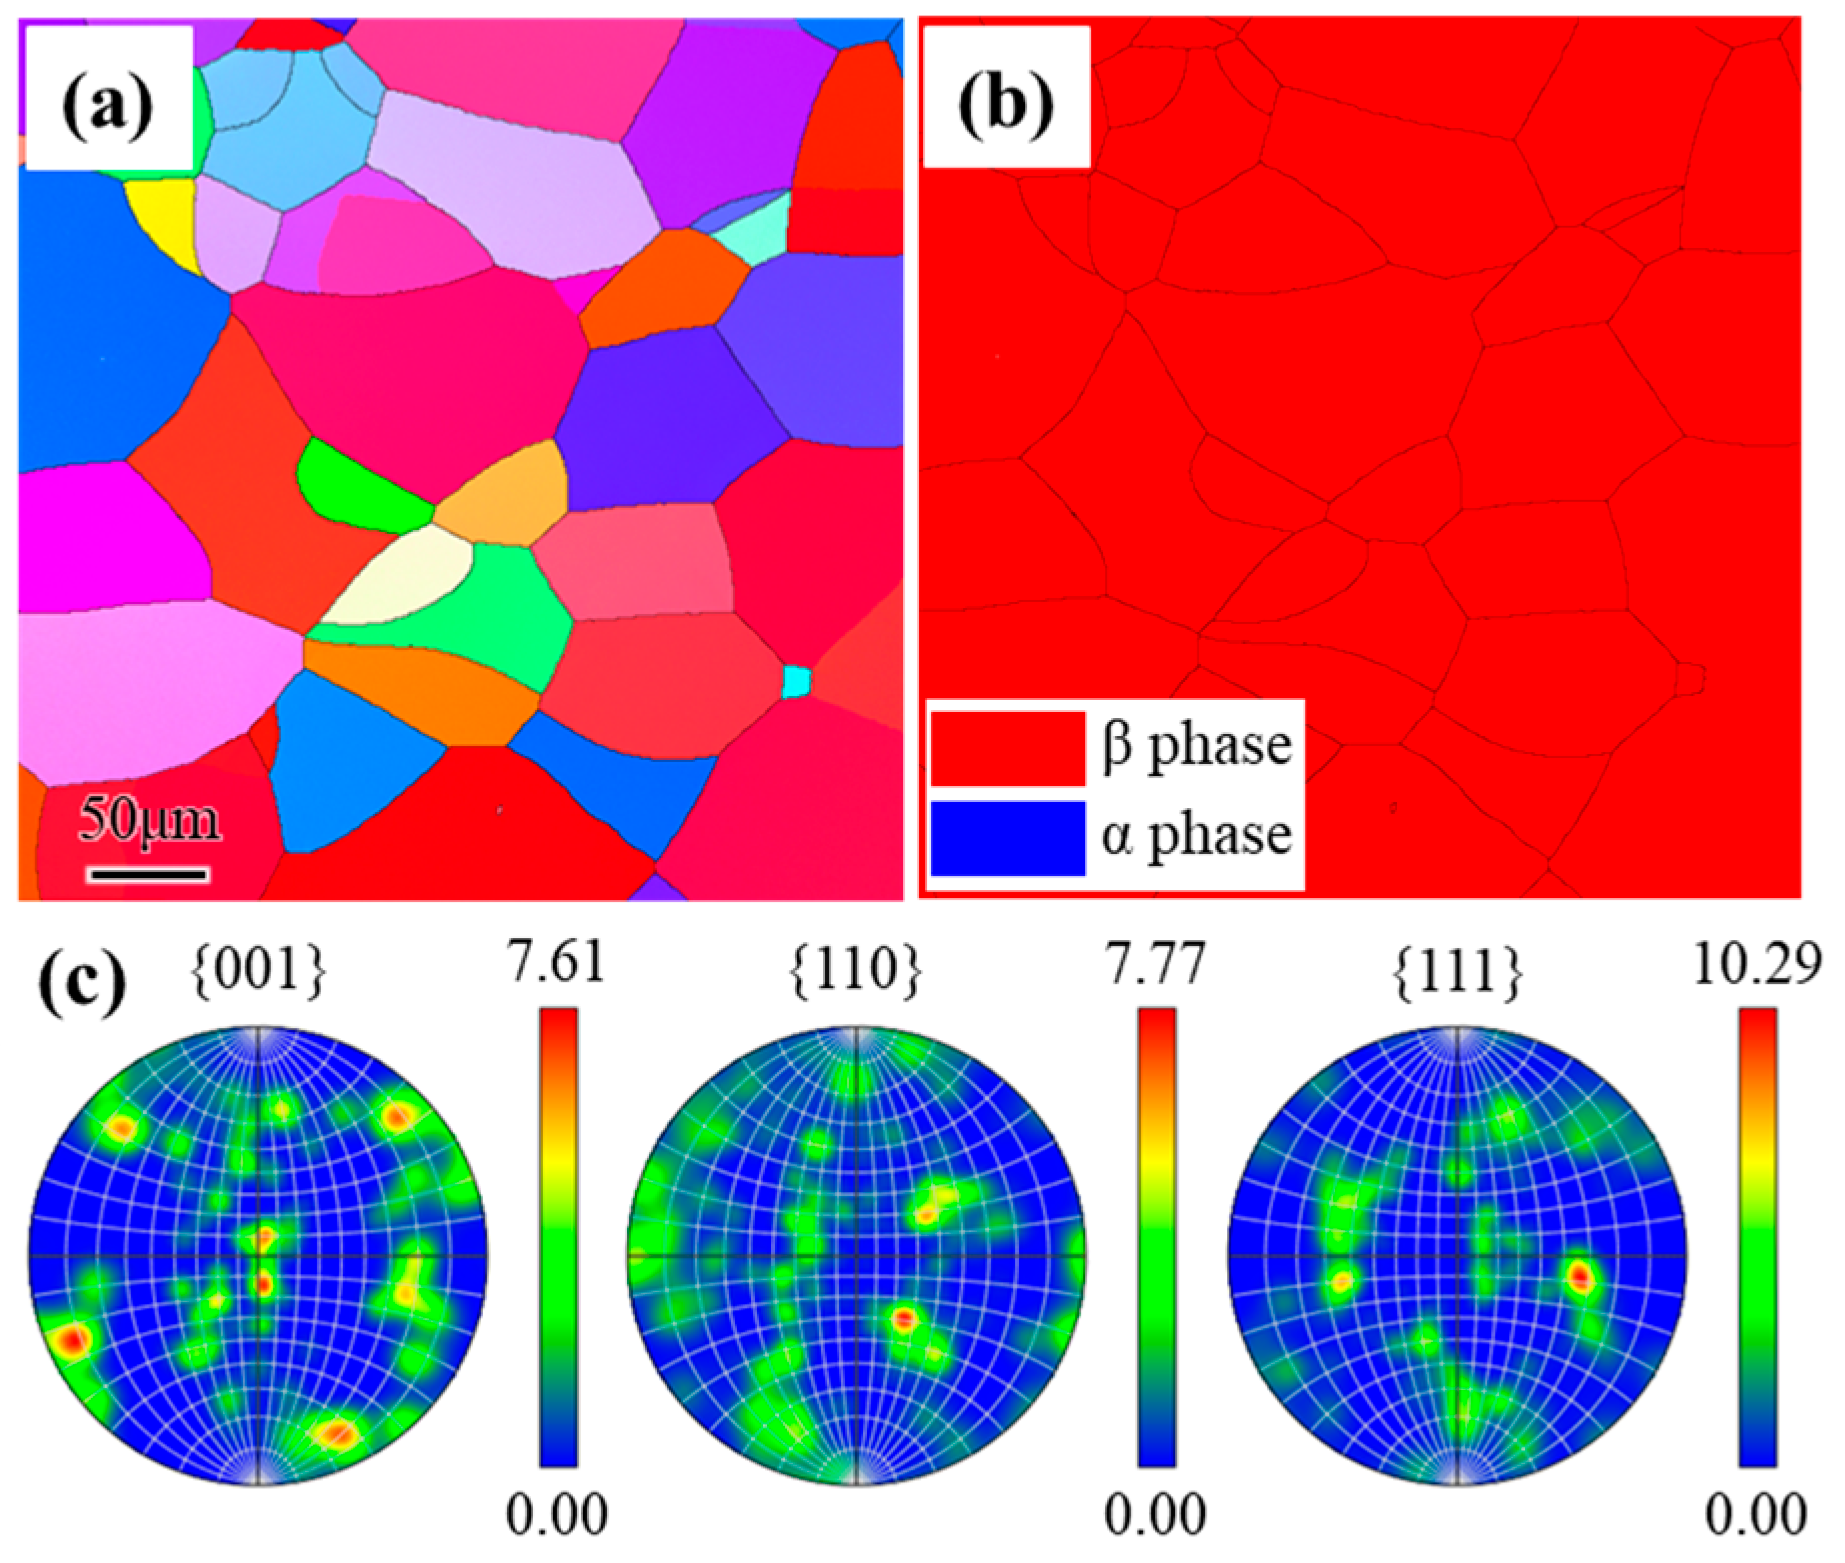
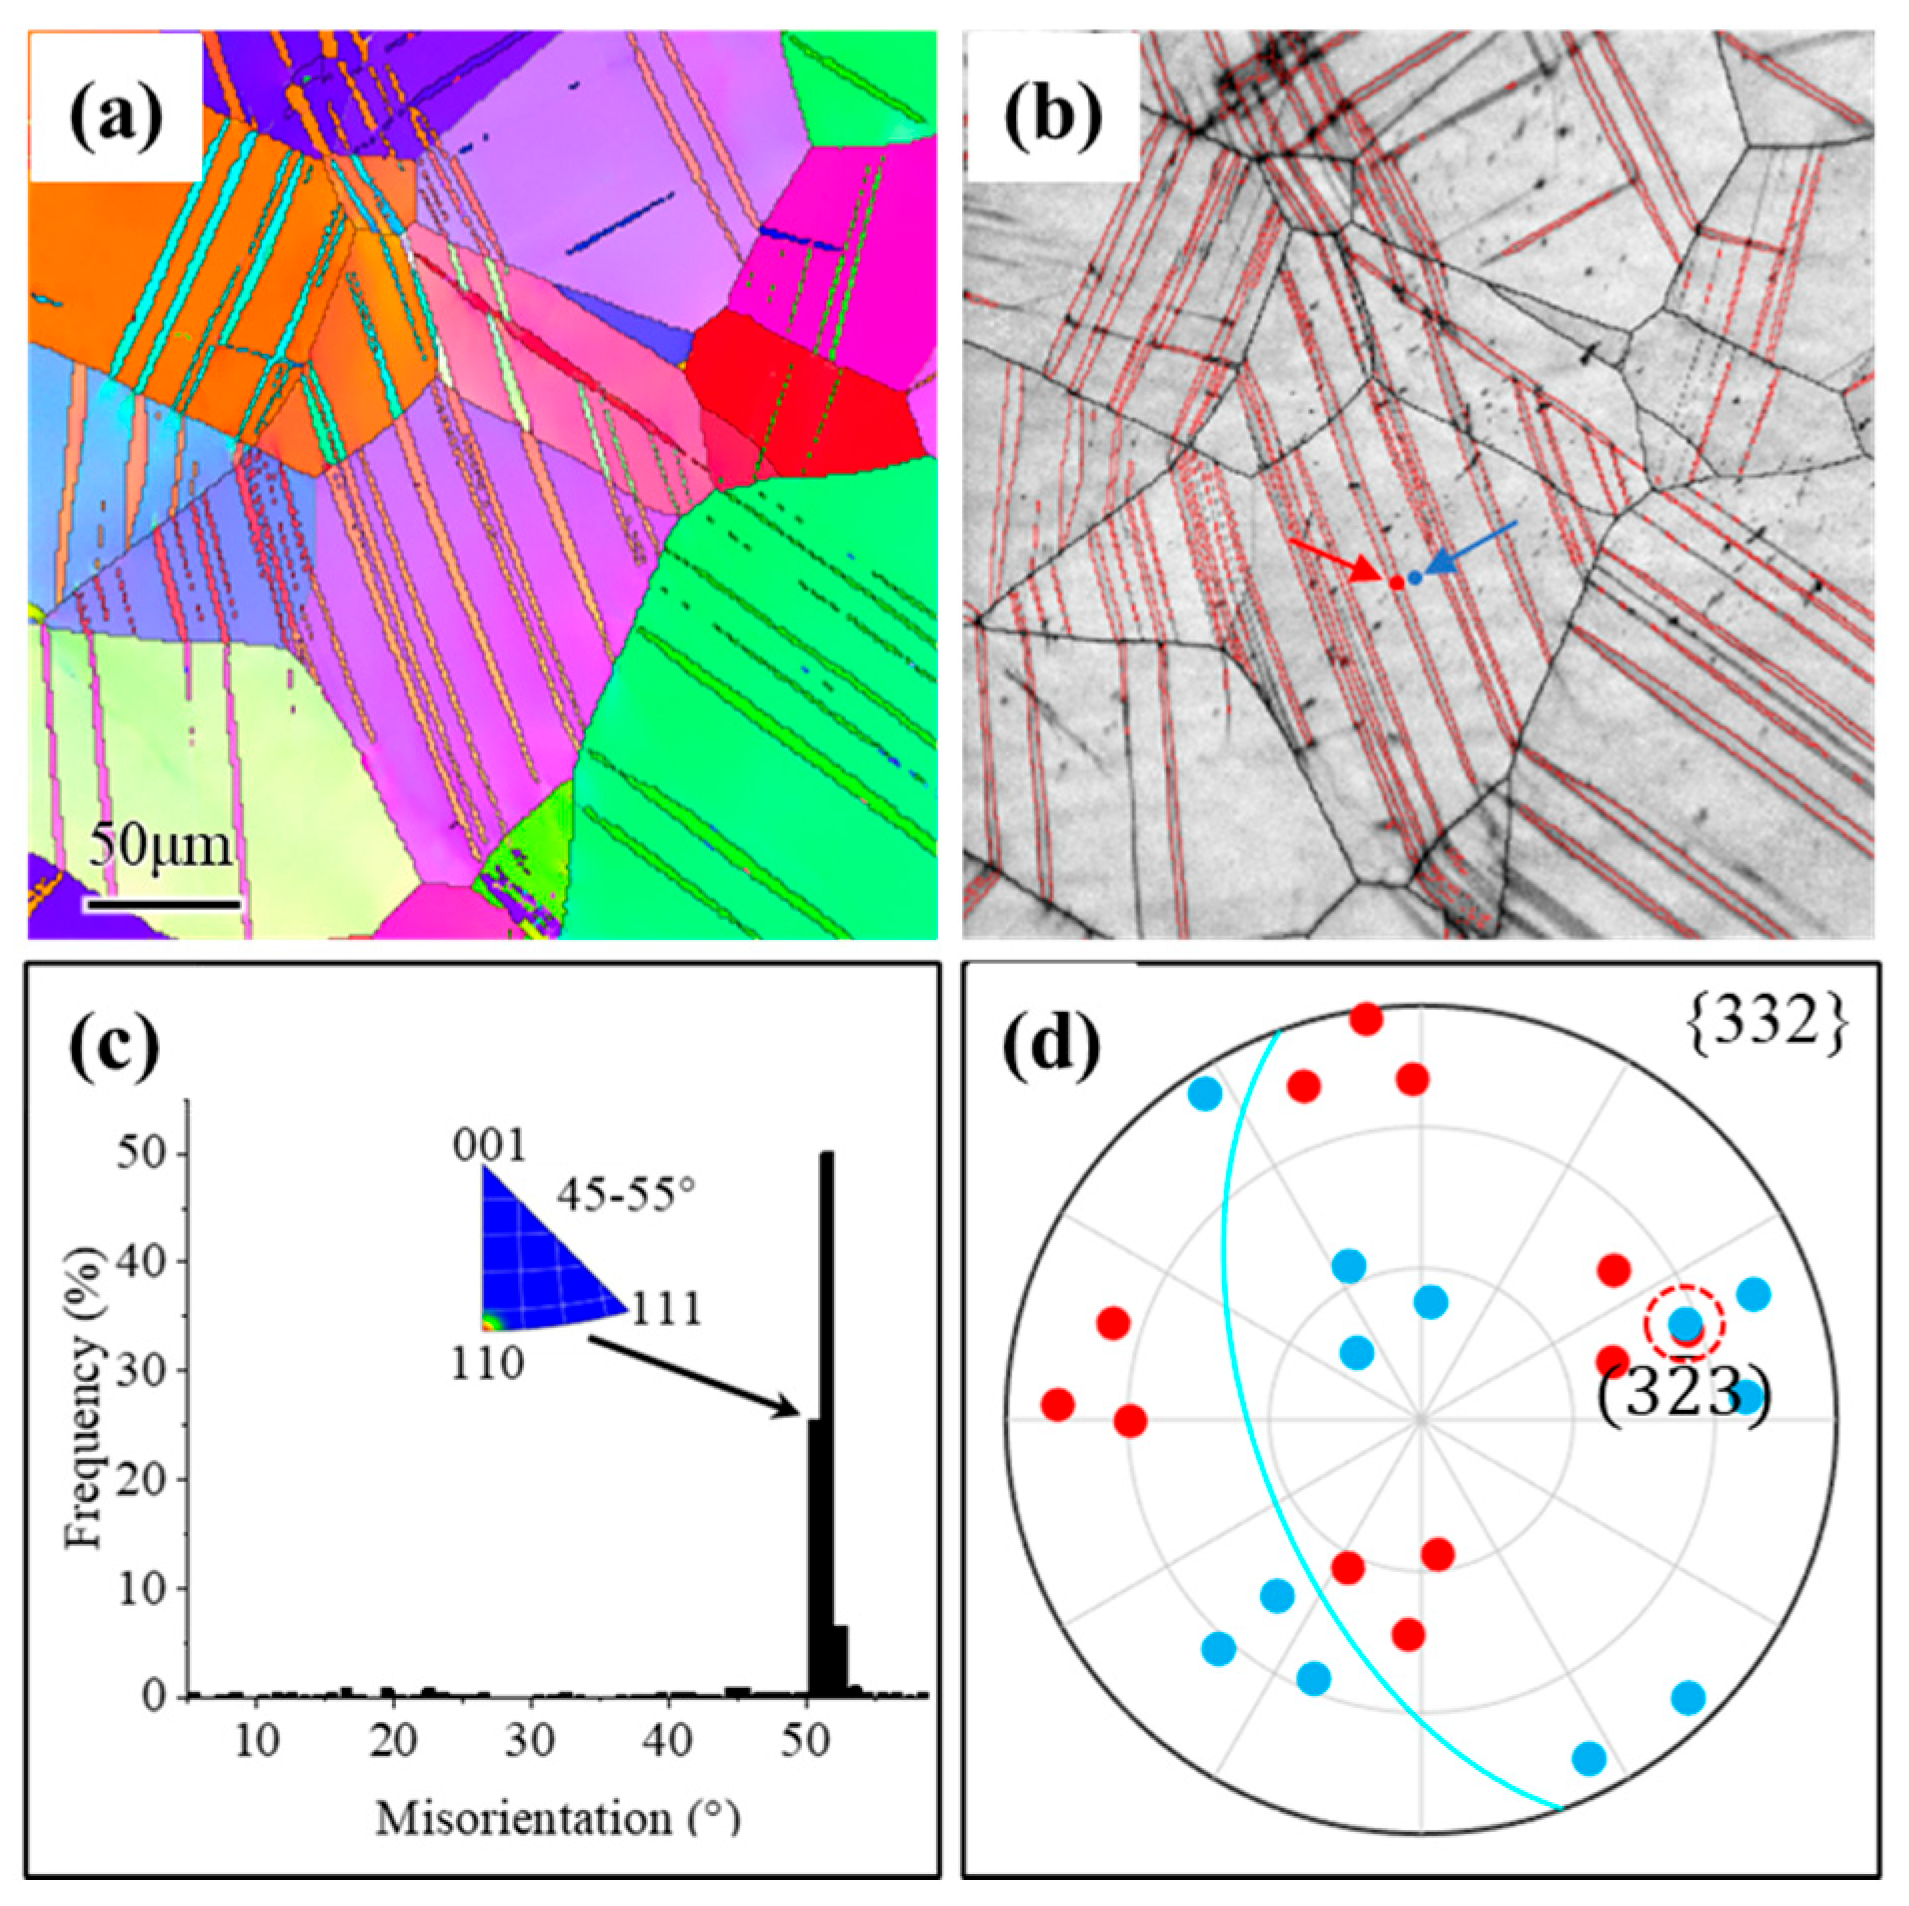
Figure 2 displays the inverse polar figure (IPF) and phase distribution map and polar figures (PFs) of the solution−treated sample. The microstructure consists of fully β equiaxed grains with an average grain size of approximately 53 μm. The grain orientations are relatively random, showing a weak texture. Deformation leads to the formation of distinct deformation bands whose orientations differ from those of the β−matrix, as illustrated in Figure 3a. Mechanical twinning is one of the dominant deformation mechanisms in Ti−15Mo alloys [48,49,50]. Figure 3b displays the {332}<11 3 ¯ > twin boundaries, identified by their misorientation axis and angle. The red lines correspond to a <110>/50° misorientation with a tolerance of ±5°. Figure 3c shows the misorientation distribution across the entire region, revealing a distinct peak at 50−52°. The corresponding rotation axes cluster near <110>, consistent with the characteristic misorientation of {332}<11 3 ¯ > twins (<110>/50.48°). Using the Euler angles from the β−matrix (red circle) and twin (blue circle) regions in Figure 3b, we plotted the superimposed {332} pole figures for both (Figure 3d). The (3 2 ¯ 3) twinning plane and its trace are clearly outlined in the pole figure, aligning with the actual trace. Using the β−matrix orientation, we calculated the SF values for all twin variants. Most of the observed twins correspond to variants with the highest SF values among the twelve possible variants, which agrees with previous findings [50].
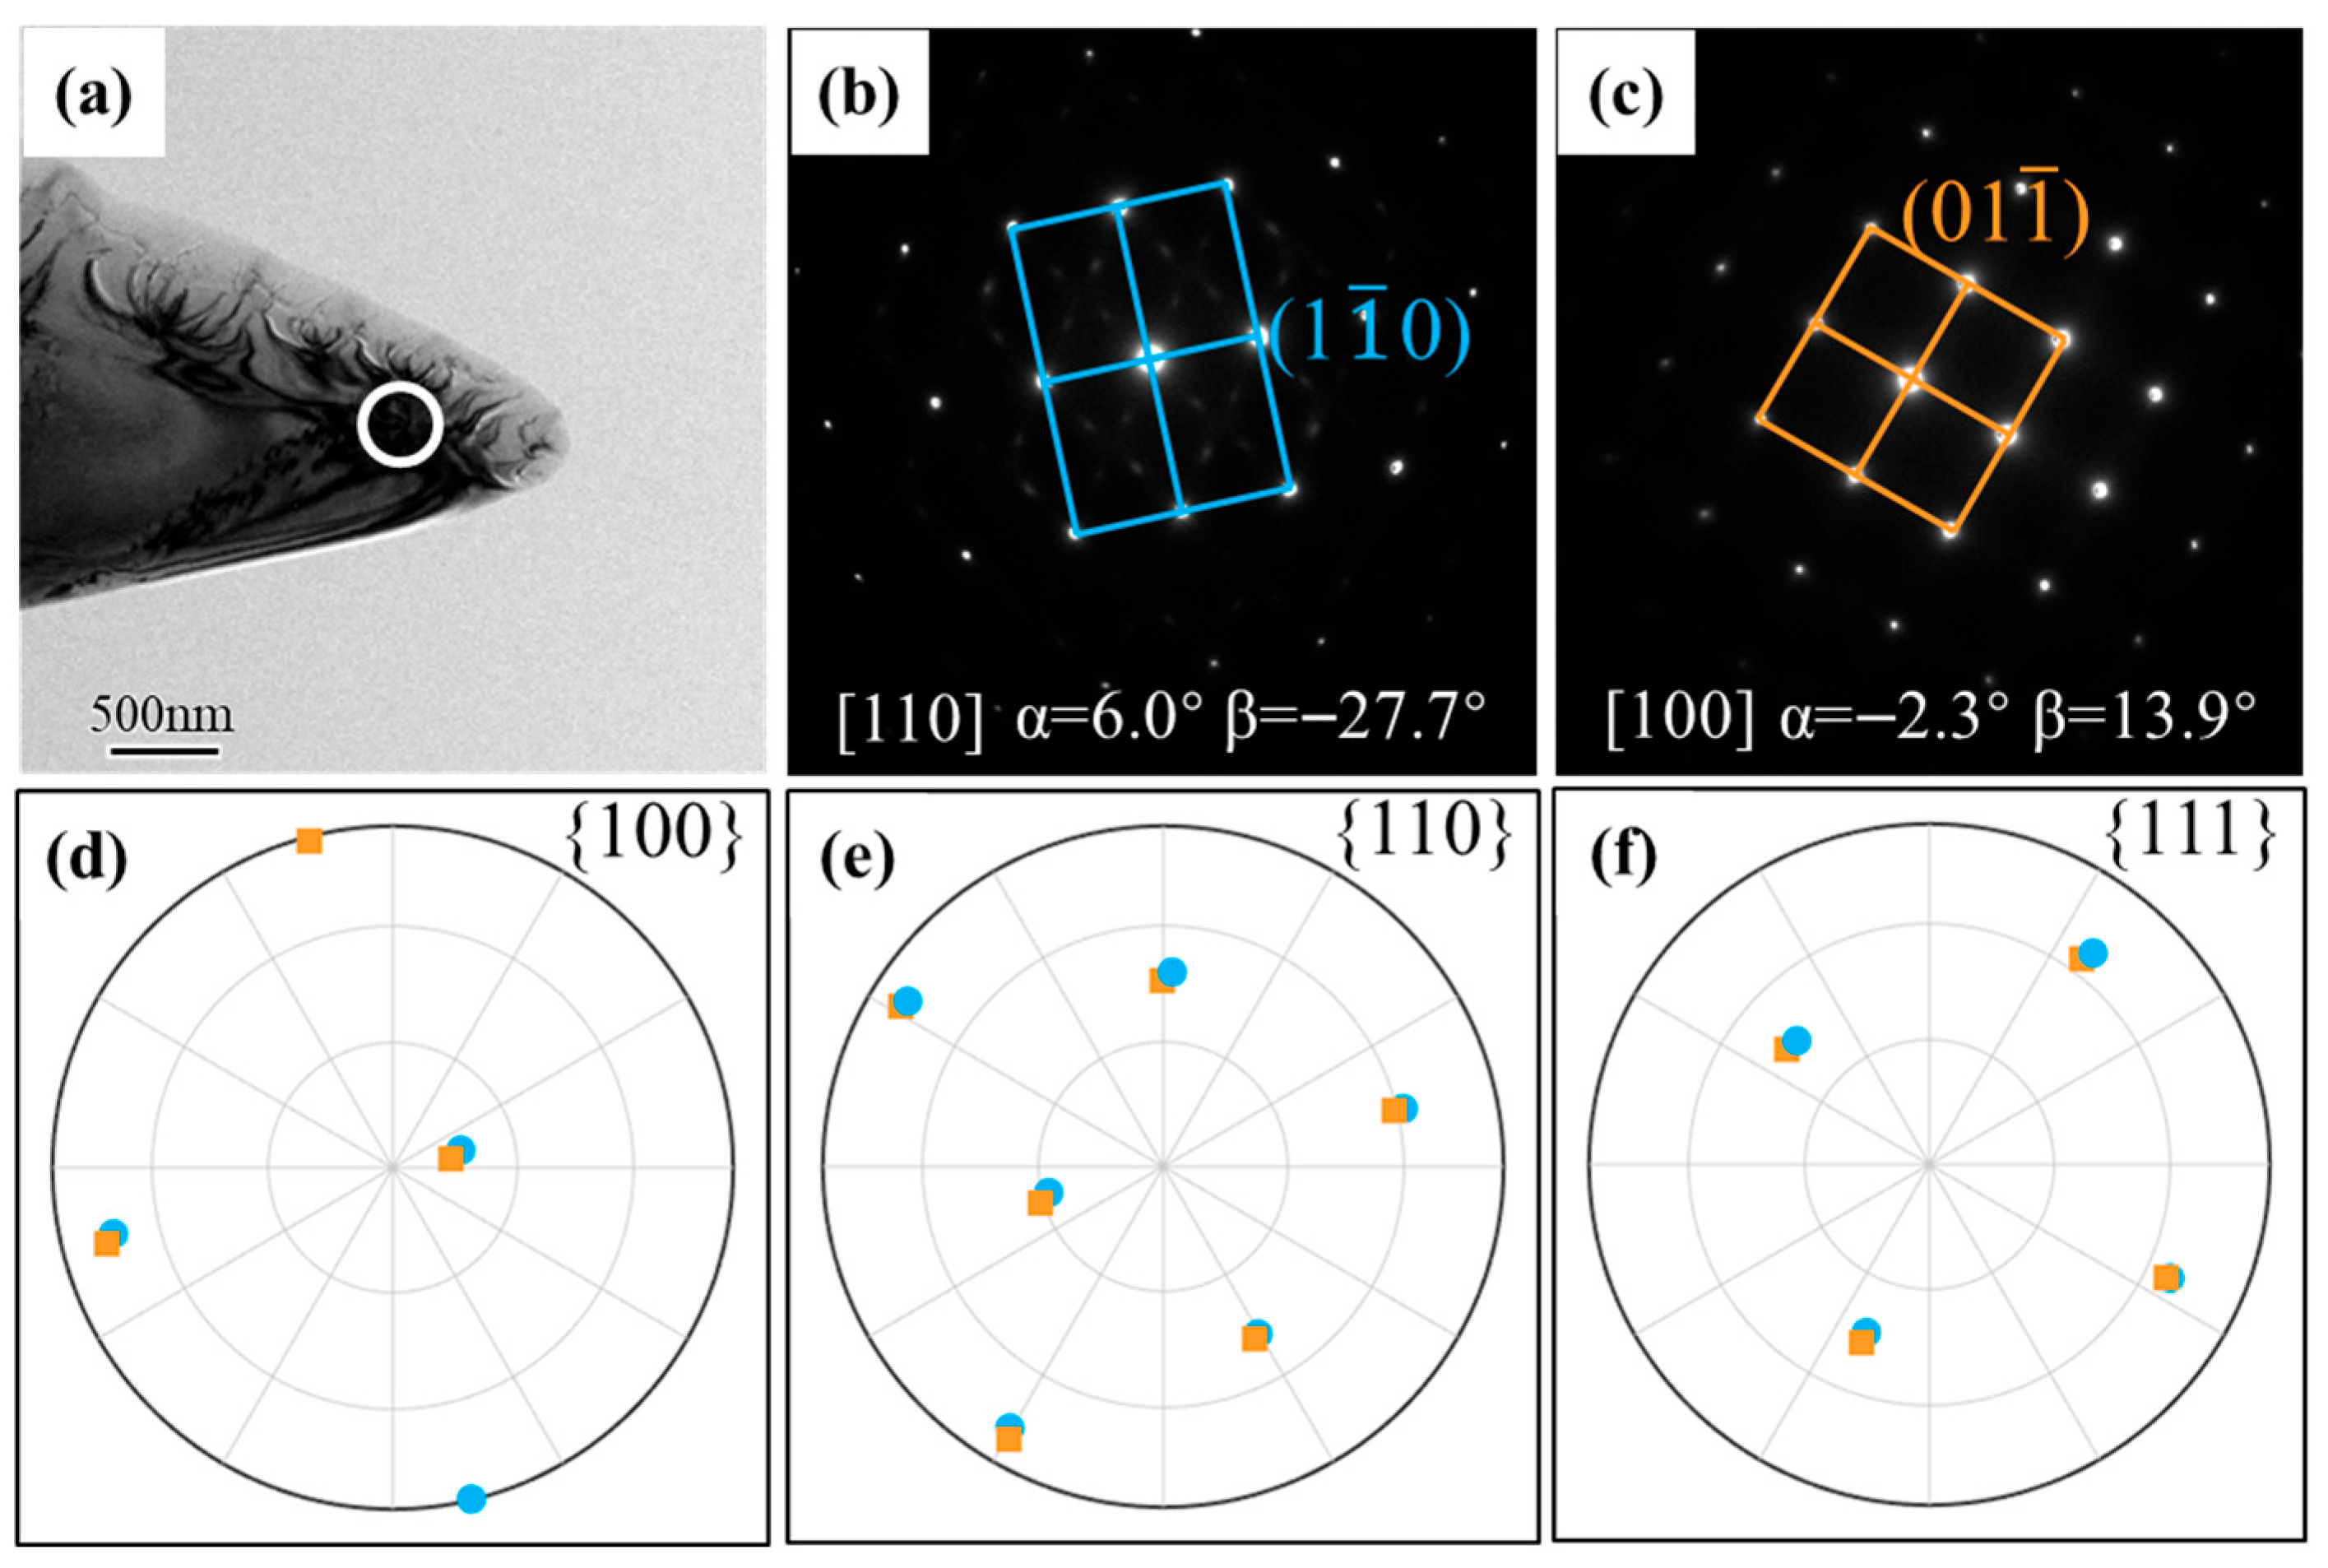
To demonstrate our method’s application, Figure 4a presents the bright−field image of the characteristic region. Figure 4b,c show the SAED patterns from the marked area along the [110] and [001] zone axes, respectively. The [110] zone axis exhibits 2−fold symmetry while [001] shows 4−fold symmetry, both having even−order symmetry that ensures unambiguous orientation determination. Based on these orientations, we plotted superimposed pole figures for {100} (Figure 4d), {110} (Figure 4e), and {111} (Figure 4f). The calculated Euler angles were (13.4°, 89.7°, and 73.3°) and (99.6°, 14.1°, and 4.9°), represented by blue circles and orange squares in the pole figures, respectively. Remarkably, the poles from both orientations show nearly perfect coincidence, with only 3.2° misorientation. This misorientation arises from minor errors, including slight drift of diffraction domains and tilt angle deviations caused by sample rotation, and coordinate measurement of diffraction spots, yet such errors do not compromise the determination of orientation relationships. This result strongly validates our method’s accuracy and reliability−analysis of distinct zone axes from the same region yields consistent, nearly identical orientations.
Here, we demonstrated our approach by identifying deformation twins in deformed Ti−15Mo alloy. To determine twin types via electron diffraction, sample tilting is needed to align the rotation axis of twinning along the electron beam direction. However, in many cases, this condition cannot be satisfied due to the limited tilting range of the sample holder. As shown in Figure 5a, a twin band is clearly seen in the bright−field image, but the superimposed diffraction patterns cannot be obtained along the common zone axis of the β−matrix and twin. In this case, the SAED patterns of the β−matrix and the twin were obtained separately along different zone axes by tilting the sample, as shown in Figure 5b,c. As both patterns were taken along the even−order rotation axes, their orientations can both be uniquely determined. Based on the obtained orientations, the {332} superimposed pole figures of the β−matrix and twin can be plotted (Figure 5d), which confirms the {332} twinning relationship. In the figure, the poles from the matrix and twin were indicated in blue and red, respectively. The OZ axis of the SCS, indicated by a black pentagram, is the loading direction. The twinning plane and its trace are outlined in the pole figure as well, which identifies the variant as ( 3 ¯ 3 ¯ 2) [ 1 ¯ 1 ¯ 3 ¯ ]. With all this information, Schmid factors associated with all twin variants can be calculated, as commonly performed using EBSD data. The results shown in Table 1 indicate that the activated twin variant (V4) has the highest SF among all the variants. It is worth noting that the indices assigned to the diffraction spots are not unique (in principle, it can be anyone of one {hkl} family, but the positions of the {332} poles and twinning plane are fixed in the pole figure). Therefore, the twin variant can always be uniquely identified.
Because of a mirror symmetry between twin and matrix, a twin variant can be identified using the proposed method even though one or two electron diffraction patterns were not obtained along the zone axis of even order symmetry. The bright−field image in Figure 6a indicates a twin band. Figure 6b,c shows the SAED patterns of the β−matrix and twin taken along the [111] and [110] zone axes, respectively. As shown in Figure 6d and e, two different orientations (with 180° rotation symmetry) were obtained for the β−matrix based on the [111] diffraction pattern. As the twin was examined along the zone axis with even−order symmetry, its orientation can be uniquely identified. Considering the mirror symmetry between the matrix and twin, the variant of twinning can still be determined. As revealed in Figure 6d, the trace of the overlapped (233) poles coincides well with the twinning habit plane in the bright−field image, and the poles of the β−matrix and twin are symmetric with respect to the trace. However, the overlapped ( 3 ¯ 2 ¯ 3) poles in Figure 6e are inconsistent with the twinning habit plane, and the poles are not symmetric with respect to the trace either. With this information, the activation of this specific variant can also be further evaluated as (233) [ 3 ¯ 11], as shown in Table 2. It is confirmed that the activated variant (V9) exhibits the highest SF value among all the variants.
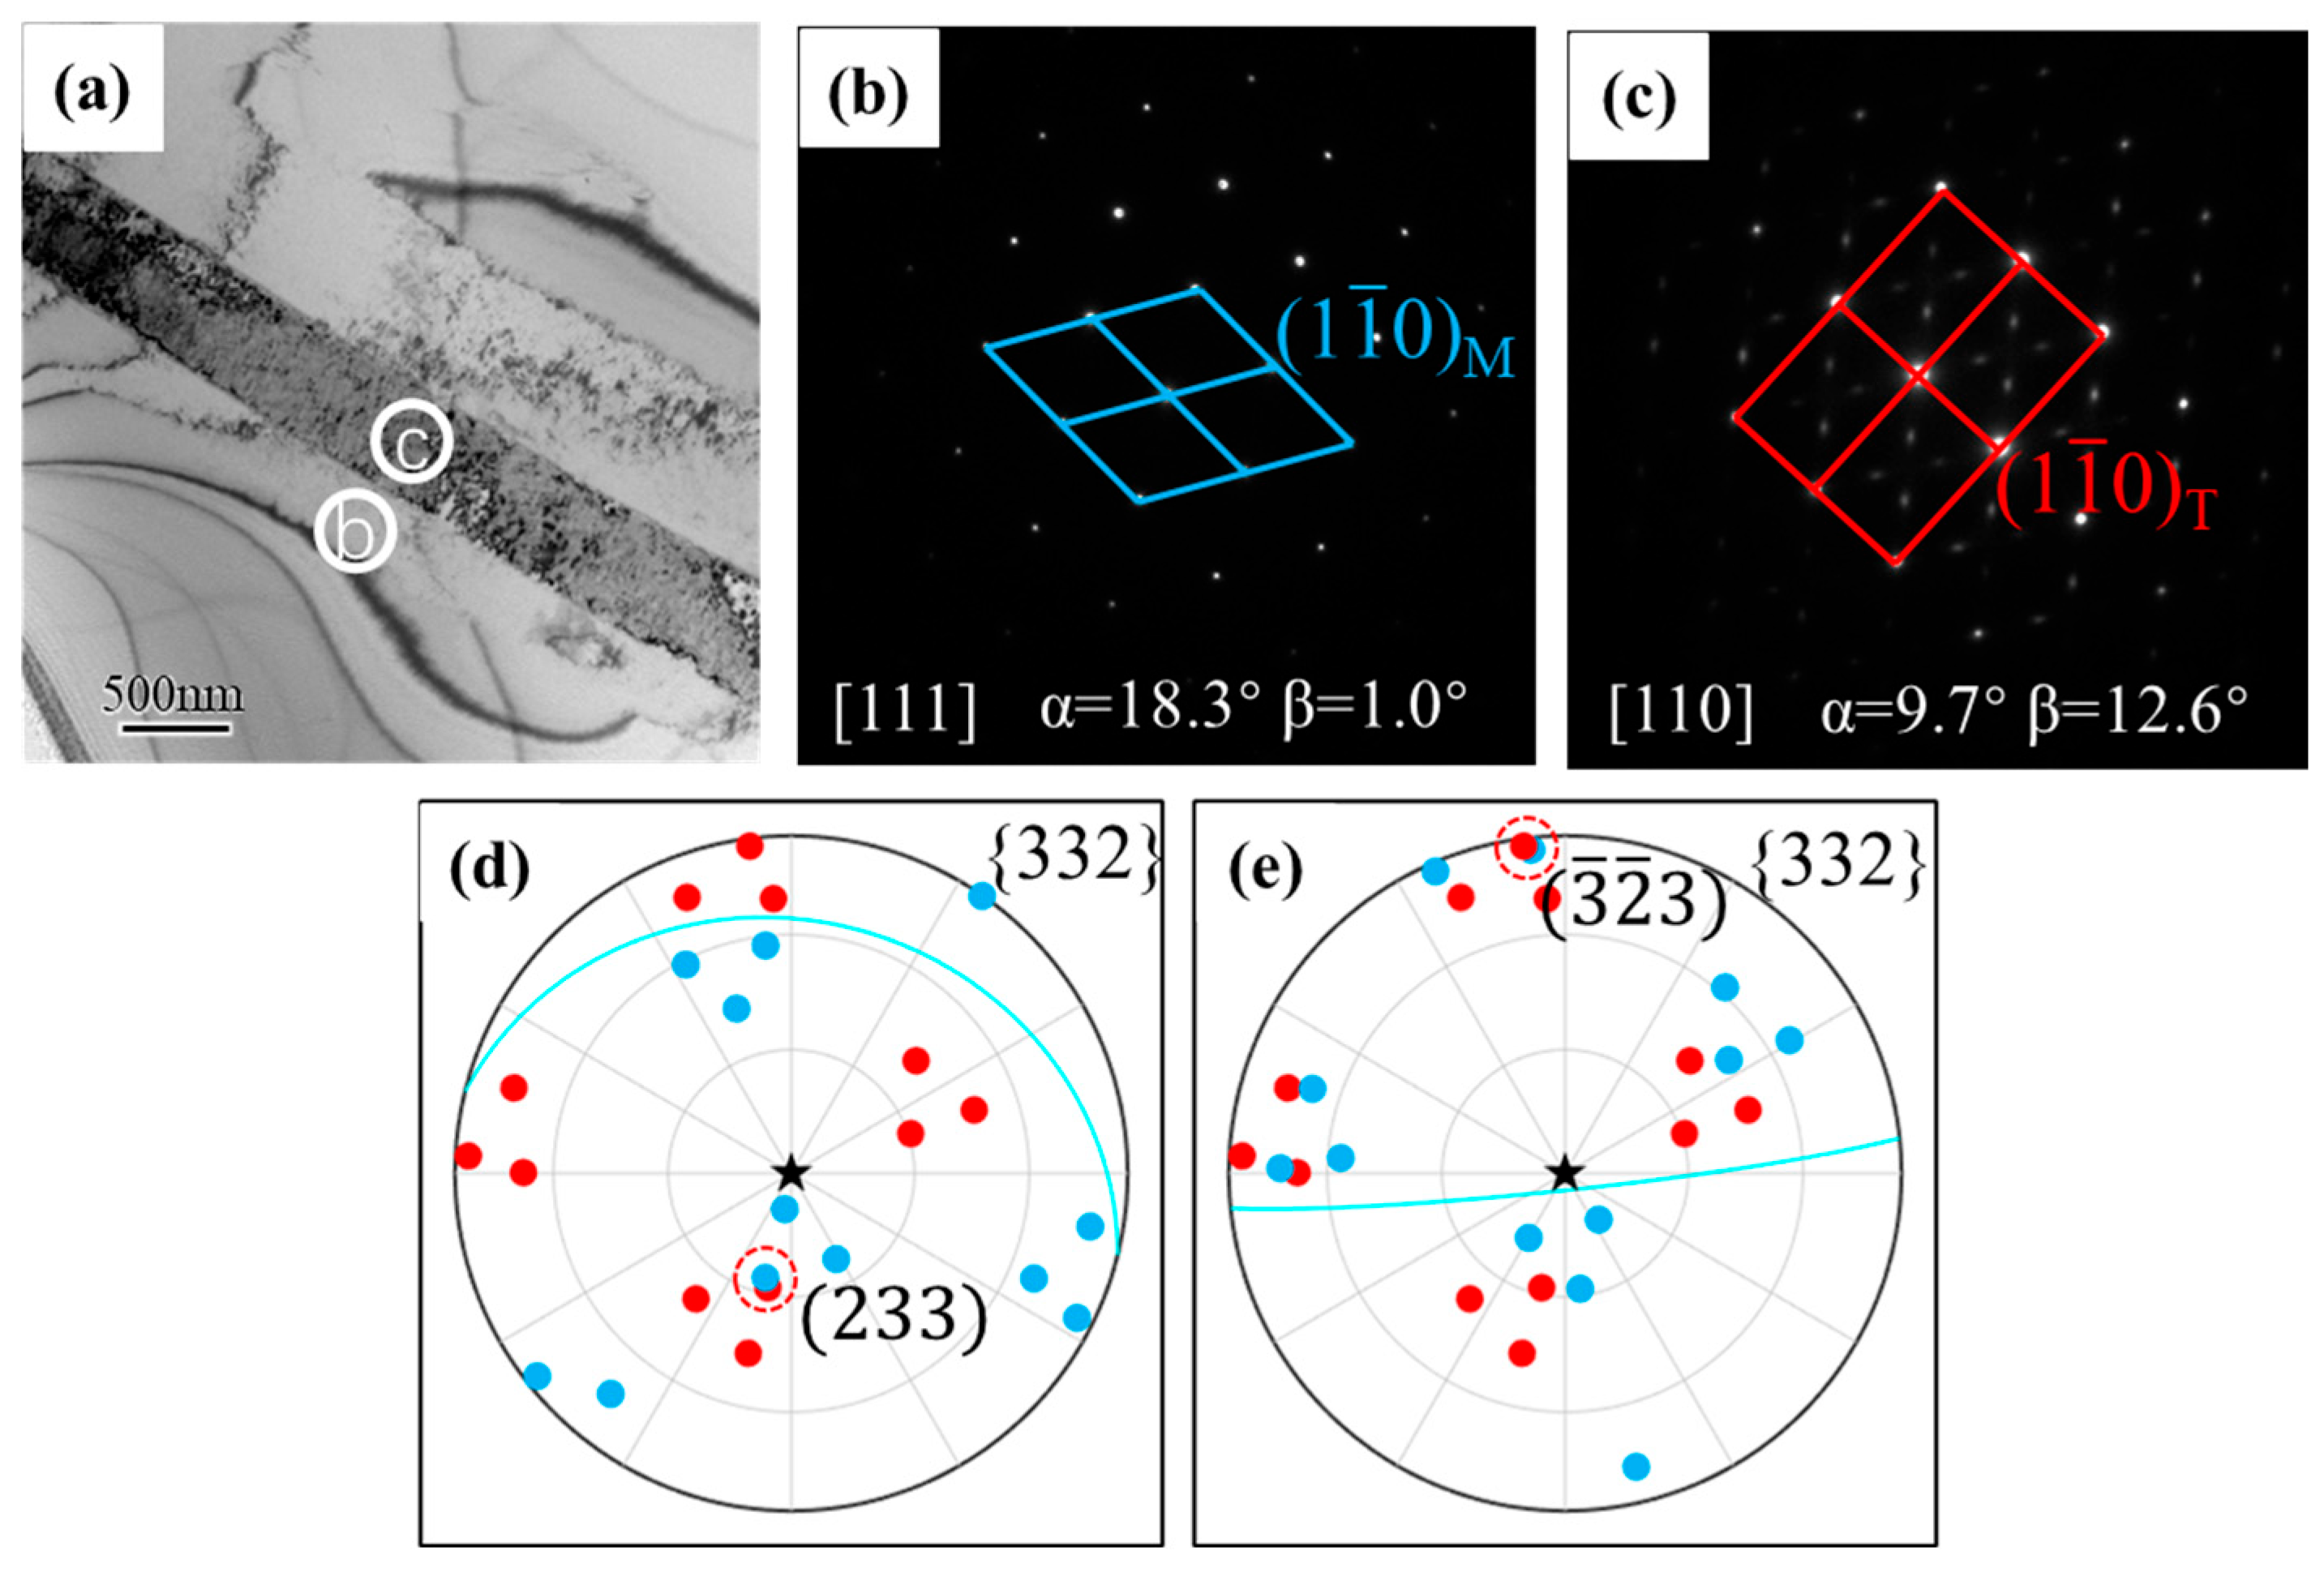
Figure 7a shows another case of twin variant identification when the diffraction patterns from both the β−matrix and twin were recorded along the zone axis without an even order of symmetry. As shown in Figure 7b,c, the SAED patterns of the β−matrix and twin are both taken along the [111] zone axes. Based on the individual diffraction pattern, two different orientations with 180° rotation symmetry were obtained for both the β−matrix and twin, as illustrated in Figure 7d–g. In the pole figures, the traces corresponding to the coincident poles show significant differences. By comparing the overlapped {332} poles and the twinning habit plane, the ones shown in Figure 7d are consistent with the bright−field image results. These are considered to represent the real orientations of the β−matrix and twin, and then the twin variant was identified as ( 3 ¯ 32) [ 1 ¯ 1 3 ¯ ] (V3).
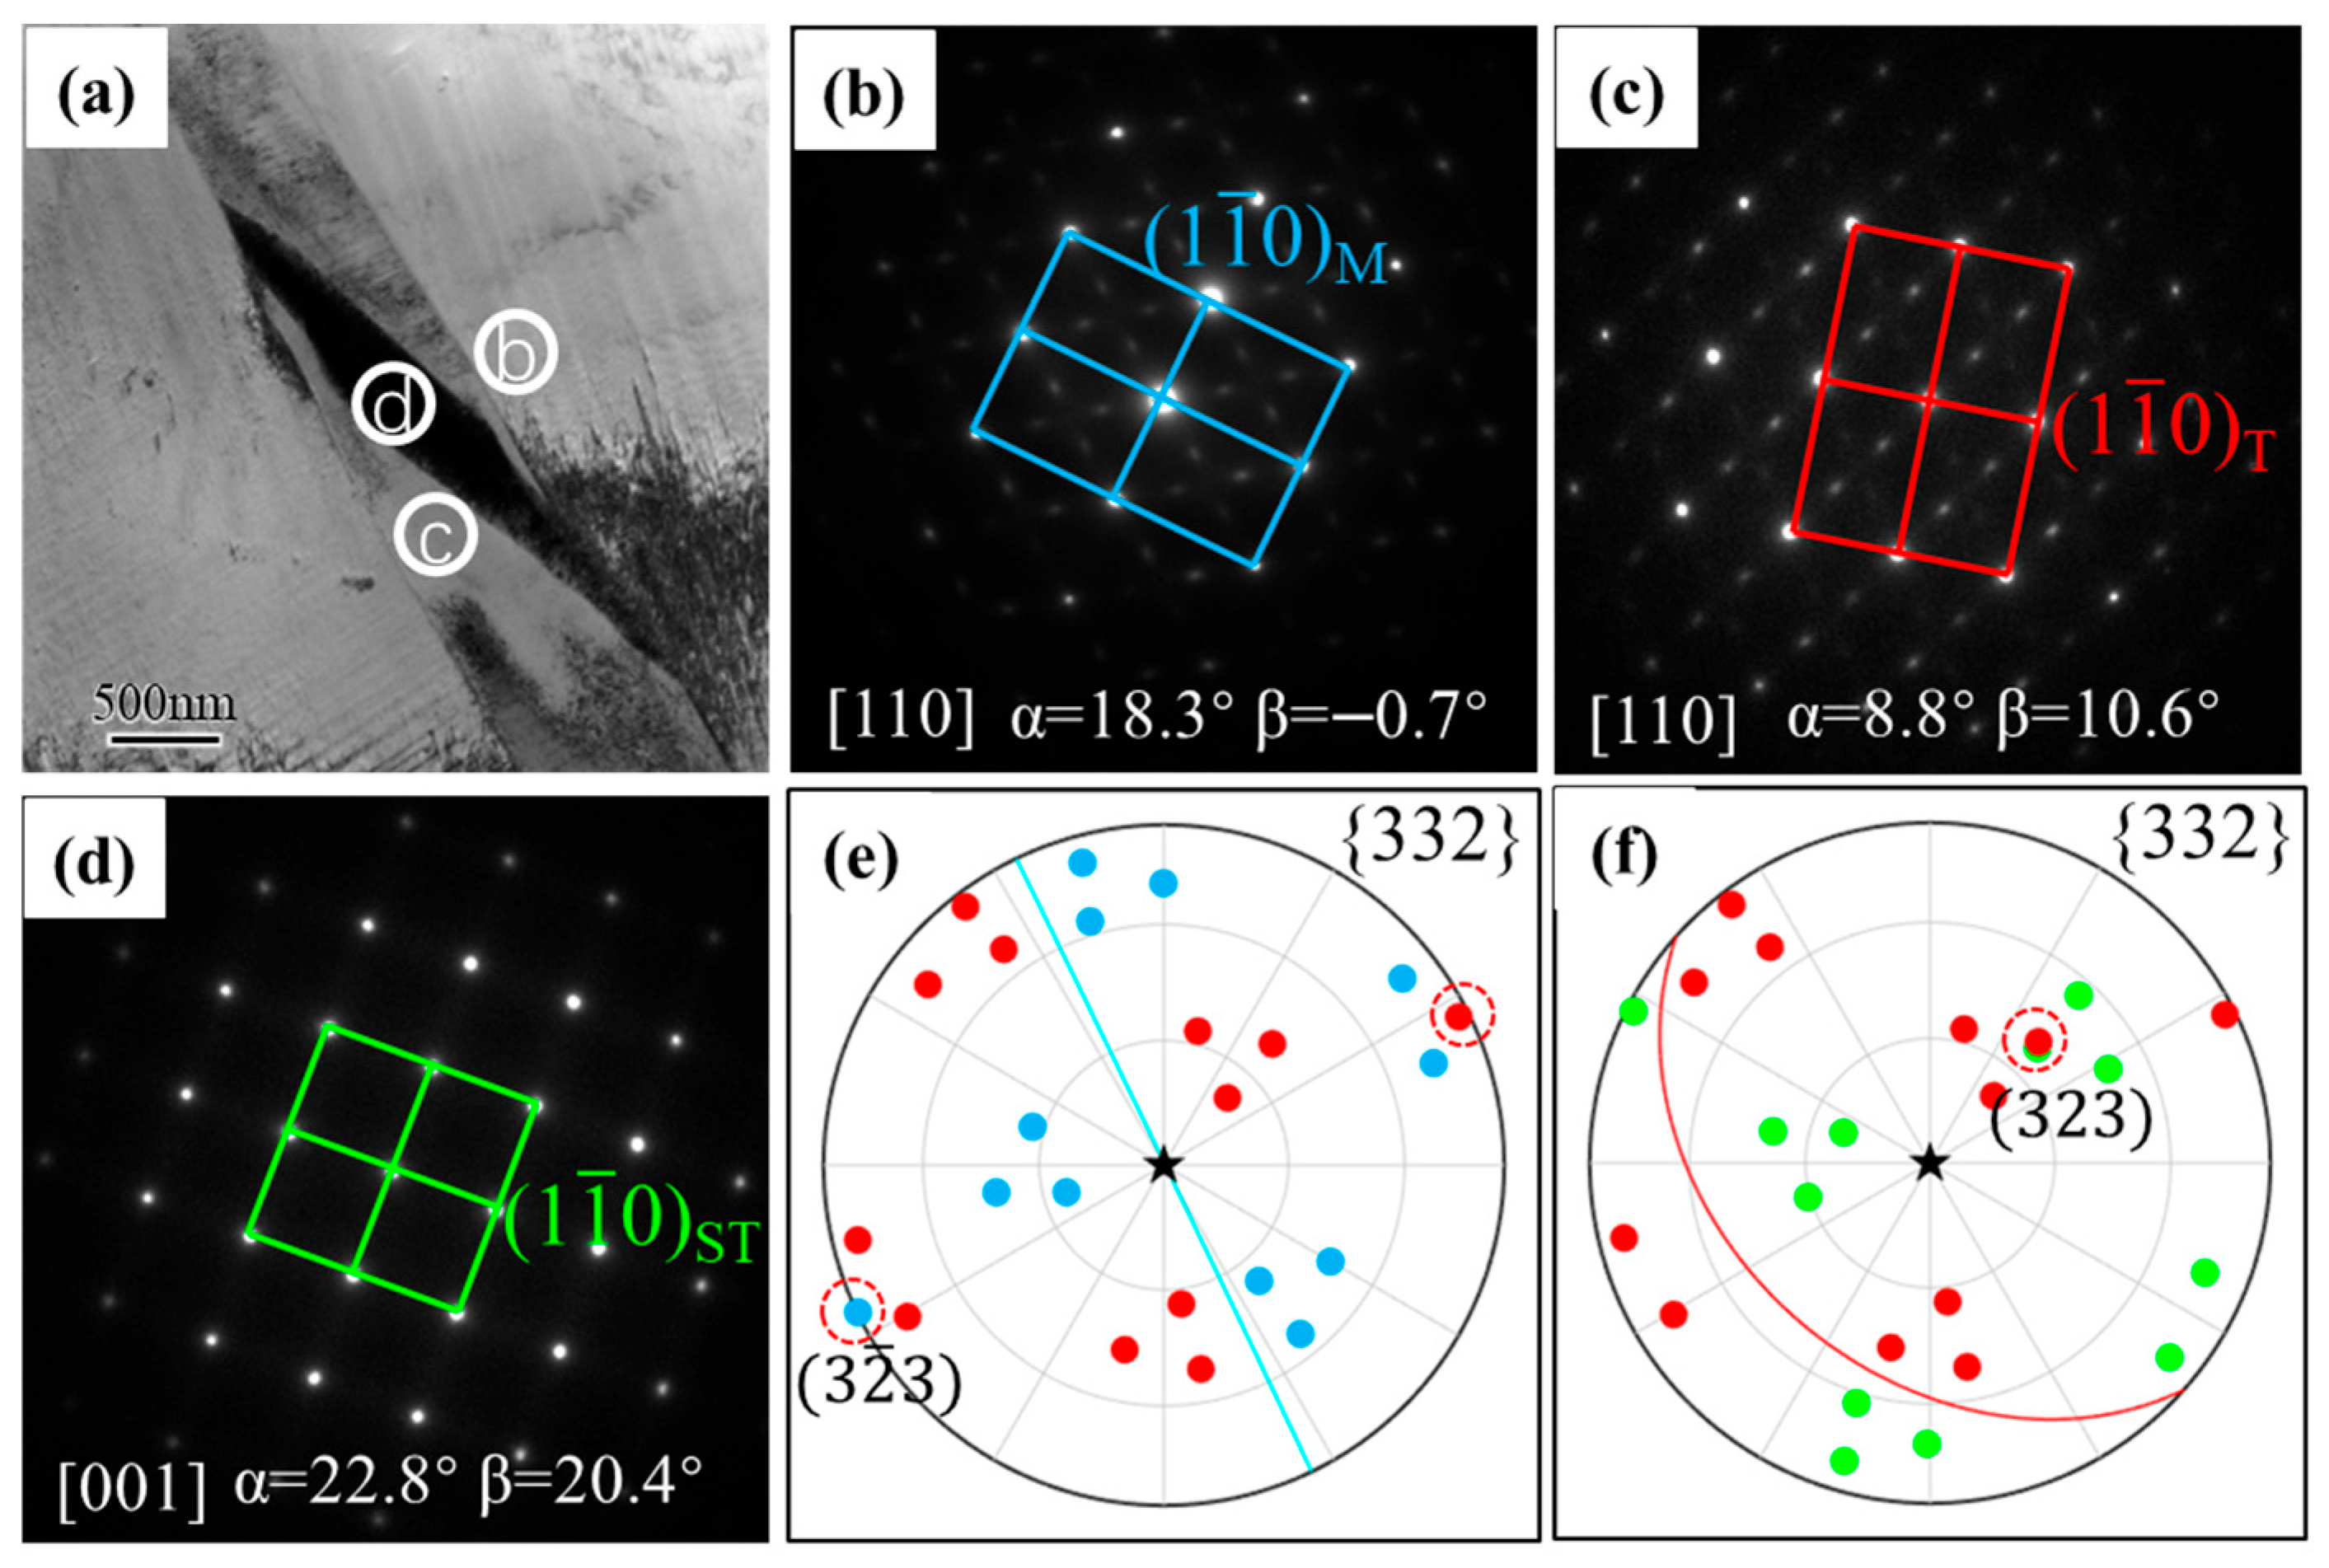
For multiple twins, determining the twinning relationship by the conventional TEM characterization becomes even more challenging due to the requirement for the common axis condition. As illustrated by the double twins in Figure 8a, it is impossible to tilt the holder to achieve the common axis condition between the β−matrix, the primary twin, and the secondary twin. Nevertheless, the twinning relationships of the double twins can still be determined using the method. The diffraction patterns of the three were obtained at different tilt angles as shown in Figure 8b–d. The SAED patterns of the β−matrix and primary twin were obtained along the [110] zone axis, and the SAED patterns of the secondary twin were obtained along the [001] zone axis. They are all even−order rotation axes, and the crystal orientations can be uniquely determined. Figure 8e,f is the {332} superimposed pole figures of the double twins, and the green circular poles are determined by the orientation of the secondary twin. Based on the pole figures, it is easy to identify that the (3 2 ¯ 3) poles of the β−matrix and primary twin coincide, and the (323) poles of the primary twin and secondary twin coincide. It also can be seen that the corresponding traces of the coincident poles of the primary twin and secondary twin are consistent with the twinning habit plane in the TEM bright−field images. Therefore, these {332}<11 3 ¯ > double twins can be determined as the (3 2 ¯ 3)−(323) double twin variants.
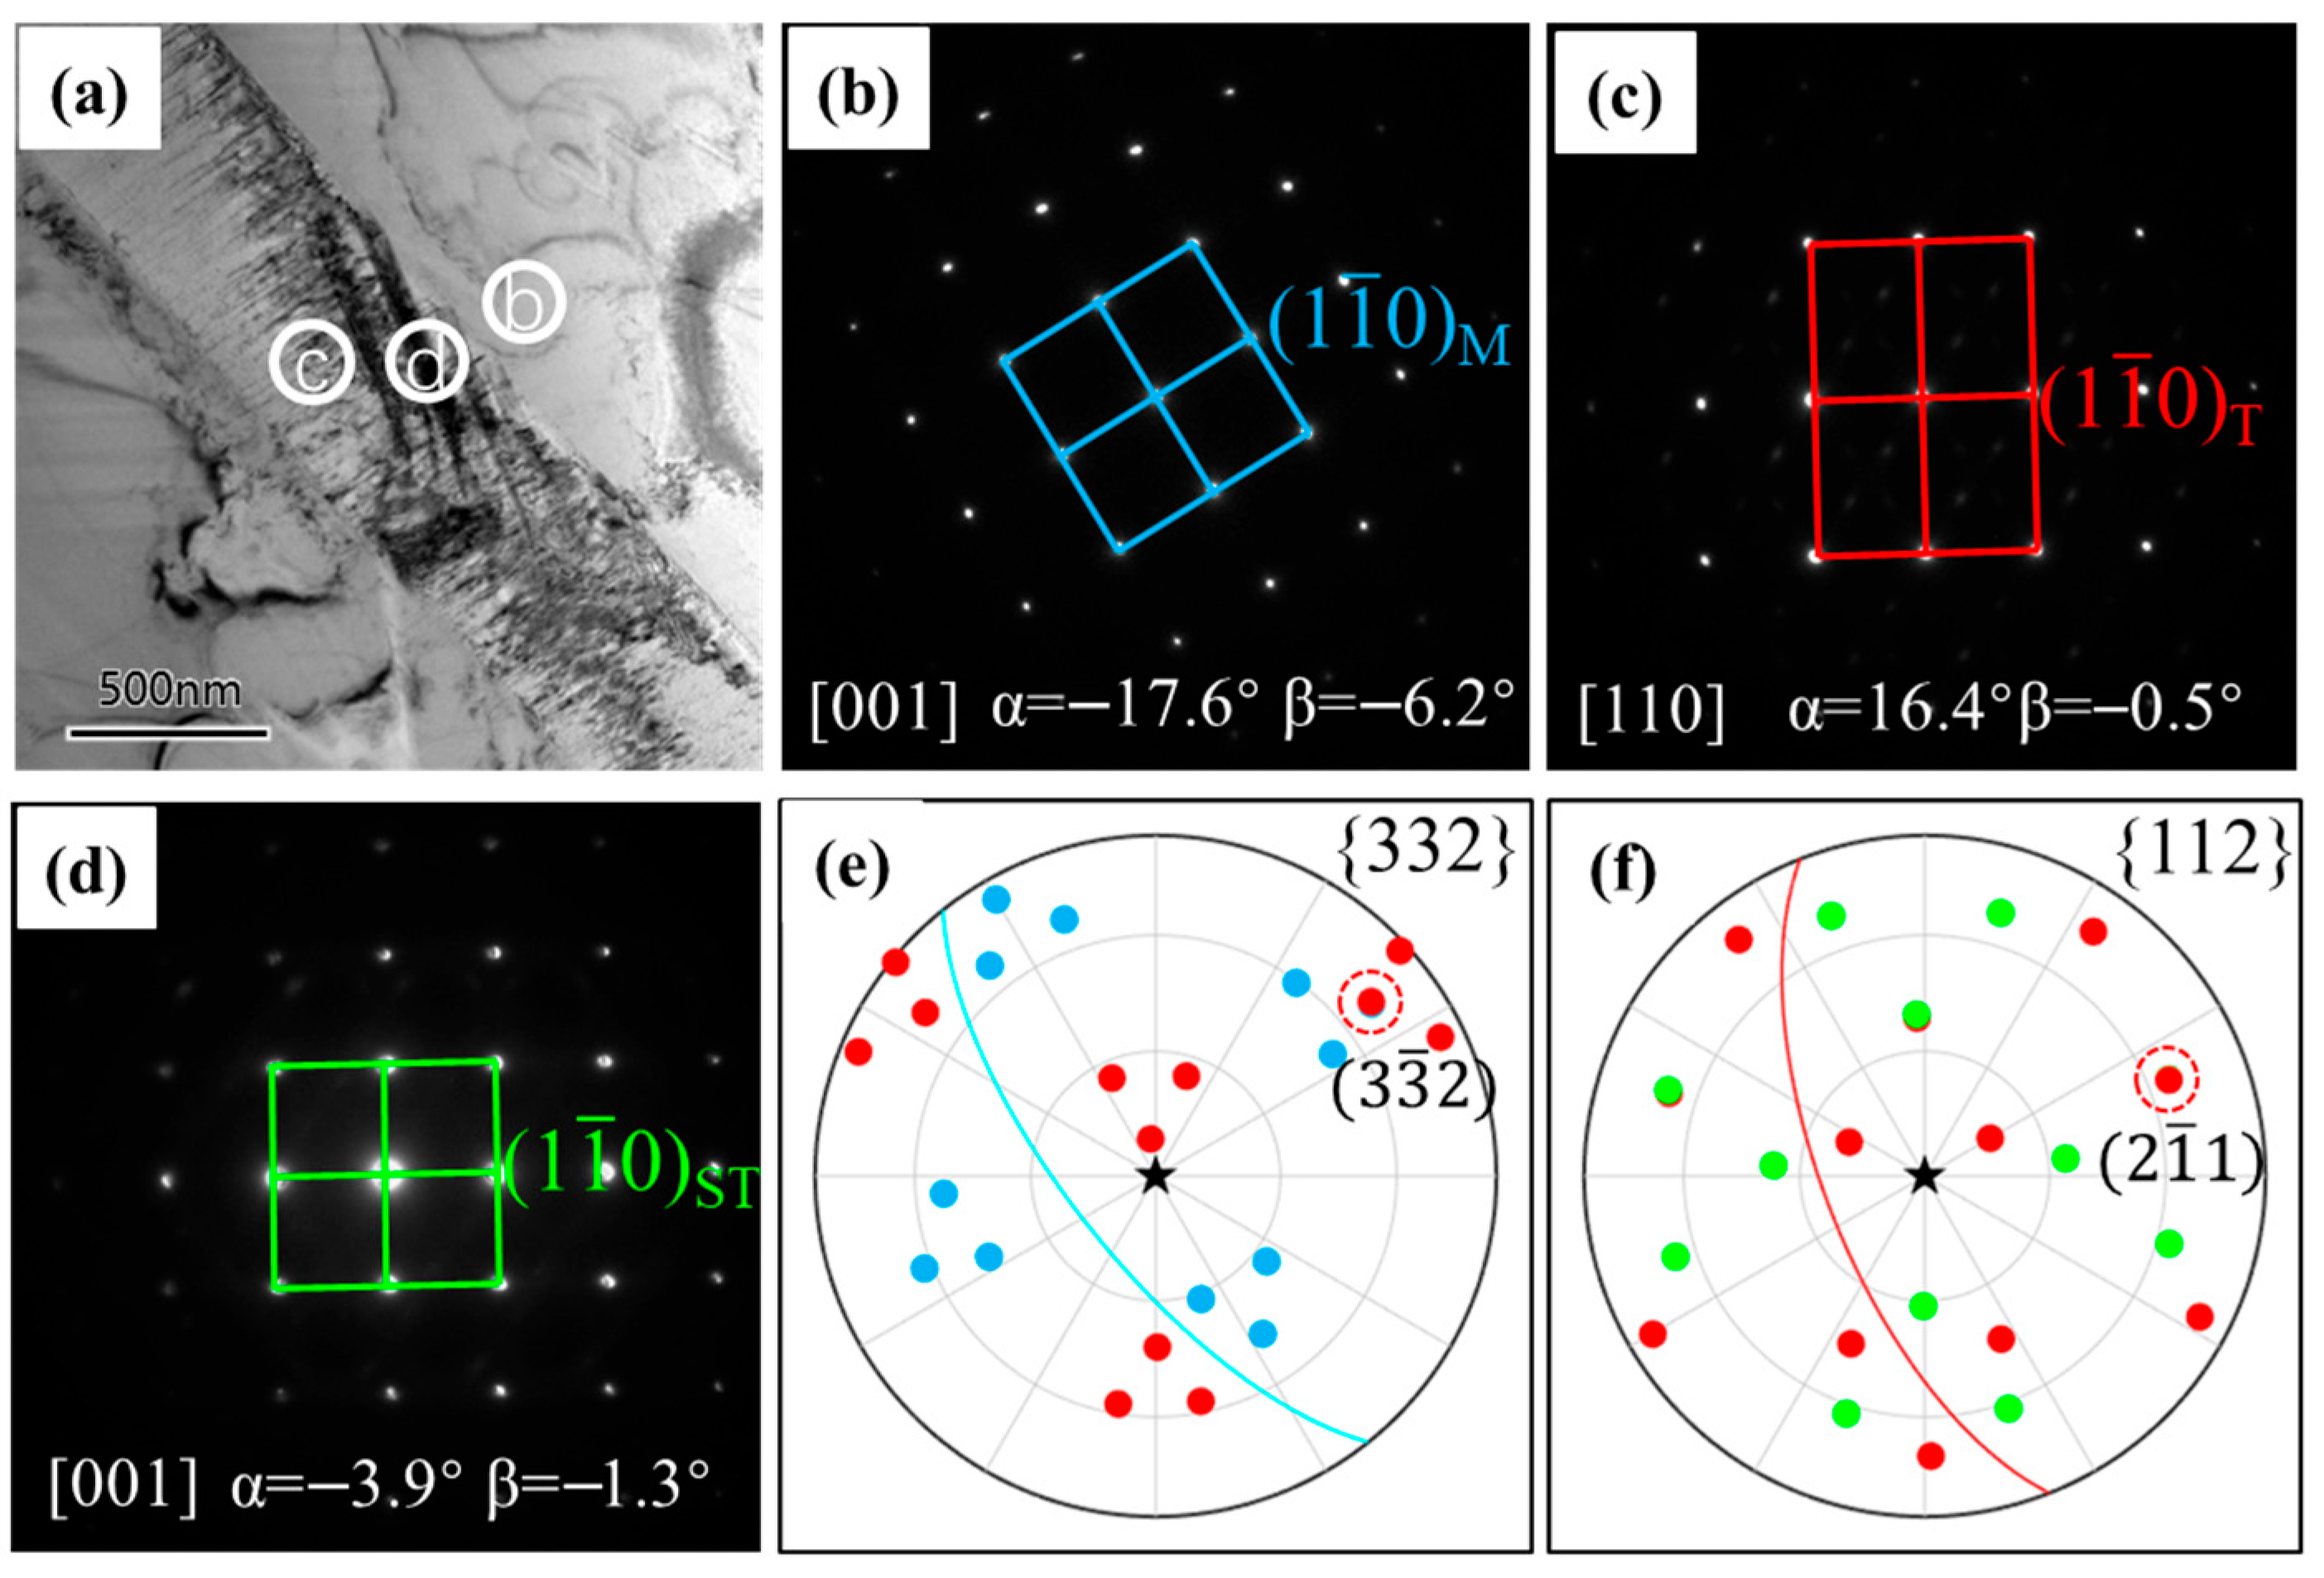
Recent investigations demonstrated that in metastable β−Ti alloys, {112}<11 1 ¯ > twins can manifest either as primary deformation twins or as hierarchically formed secondary twins within {332}<11 3 ¯ > primary twins [51,52]. Owing to their nanoscale size (typically tens of nanometers), characterizing these {112}<11 1 ¯ > twins, especially the secondary variants, via EBSD is challenging. Consequently, TEM remains the most effective approach. A bright−field TEM image of {332}<11 3 ¯ >−{112}<11 1 ¯ > double twins is shown in Figure 9a. The diffraction patterns of the β−matrix, the primary twin, and the secondary twin were also obtained at different tilt angles as shown in Figure 9b–d. The SAED patterns of the β−matrix and secondary twin were obtained along the [001] zone axis, and the SAED patterns of the primary twin were obtained along the [110] zone axis. They are all even−order rotation axes, and the crystal orientations can be uniquely determined. Figure 9e,f shows the {332} and {112} superimposed pole figures of the double twins, respectively. Based on the pole figures, it can be seen that the (3 3 ¯ 2) poles of the β−matrix and primary twin coincide, the (2 1 ¯ 1) poles of the primary twin and secondary twin coincide, and both the traces of the primary twin and the secondary twin are consistent with the twinning habit plane in the bright−field images. So, it can be identified as the (3 3 ¯ 2)−(2 1 ¯ 1) double twin variant.
Although we only demonstrated the feasibility of our approach using a BCC system as an example, this method can be readily extended to other crystal systems, such as FCC or HCP. Other crystal systems exhibit distinct diffraction spot characteristics arising from their unique symmetries, necessitating specific adjustments in diffraction spot indexing. For HCP systems, an additional conversion between 4−index and 3−index notations is required, but this is a standard procedure detailed in material science textbooks. Furthermore, for systems with lower symmetry, obtaining diffraction patterns along even−symmetry zone axes may be challenging within the tilt range of the sample holder. In such cases, two solutions can be adopted: either acquiring diffraction patterns from two non−even symmetry zone axes or combining observations of twinning habit planes in bright−field images to determine the true orientation.

5. Conclusions

In this article, we demonstrated a straightforward method for determining twinning relationships and variants in deformed metals by electron diffraction, even when SAED patterns cannot be acquired along the common zone axis and/or are associated with the inherent 180° uncertainty due to the beam direction. Based on the diffraction pattern obtained and the tilt angles of a double−tilt holder, the orientation in the SCS is derived through transformations between the CSC, MCS, and SCS. Taking the {332}<11 3 ¯ > twins and double twins as representative cases, the orientations of the β−matrix and twin domains can be calculated by separately acquiring SAED patterns. This allows for the correct identification of the twin variants and the calculation of the SF, and the results align with theoretical expectations. Even with the 180° uncertainty, the true orientation and twinning relationship can still be deduced from the crystallographic characteristics of the twin. Of course, the core of our method relies on fundamental crystallographic principles generalizable to other crystal systems (e.g., FCC or HCP). The method proposed in this study offers a robust solution for determining crystal orientations and orientation relationships of different phases in TEM, especially for handling multiple orientation relationships.
Although the algorithm and method are developed based on a double−tilt holder, in principle, a single−tilt holder can also be used as long as on−zone axis diffraction patterns can be obtained. The method is simple and effective, requiring only SAED patterns recorded at known tilt angles, followed by basic pattern indexing and matrix calculations. All implementation steps described above are easy to understand and perform. Thus, this is considered as a highly promising method for characterizing crystal orientations and orientation relationships.

Supplementary Materials

The following supporting information can be downloaded at: https://www.mdpi.com/article/10.3390/met15080920/s1, Figure S1: The electron diffraction pattern along the [110] zone axis; Figure S2: The electron diffraction pattern along the [001] zone axis.

Author Contributions

Conceptualization, R.X.; methodology, Z.L., R.X. and X.W.; formal analysis, Z.L., X.W. and J.W.; investigation, Z.L.; writing—original draft, Z.L.; writing—review and editing, R.X. and J.W.; supervision, R.X.; project administration, R.X.; funding acquisition, R.X. All authors have read and agreed to the published version of the manuscript.

Funding

This project was financially supported by the National Natural Science Foundation of China (52371004 and No. 52071040).

Data Availability Statement

The original contributions presented in this study are included in the article/Supplementary Material. Further inquiries can be directed to the corresponding authors.

Conflicts of Interest

The authors declare no conflict of interest.

References

  1. Britton, T.B.; Jiang, J.; Guo, Y.; Vilalta-Clemente, A.; Wallis, D.; Hansen, L.N.; Winkelmann, A.; Wilkinson, A.J. Tutorial: Crystal orientations and EBSD—Or which way is up? Mater. Charact. 2016, 117, 113–126. [Google Scholar] [CrossRef]
  2. Wei, S.; Zhu, G.; Tasan, C.C. Slip-twinning interdependent activation across phase boundaries: An in-situ investigation of a Ti-Al-V-Fe (α + β) alloy. Acta Mater. 2021, 206, 116520. [Google Scholar] [CrossRef]
  3. Xu, S.; Wang, J. Deformation twins stimulated by {112¯2} twinning in adjacent grain in titanium. Acta Mater. 2022, 229, 117805. [Google Scholar] [CrossRef]
  4. Zhang, M.; Li, J.; Tang, B.; Wang, W.Y.; Li, K.; Zhang, T.; Wang, D.; Kou, H. Quantification of α phase strengthening in titanium alloys: Crystal plasticity model incorporating α/β heterointerfaces. Int. J. Plast. 2022, 158, 103444. [Google Scholar] [CrossRef]
  5. Fidder, H.; Basu, I.; DeHosson, J.T.M. Twinning induced spatial stress gradients: Local versus global stress states in hexagonal close-packed materials. Acta Mater. 2023, 256, 119142. [Google Scholar] [CrossRef]
  6. Zeng, X.; Liu, C.; Zhao, C.; Dong, J.; Roters, F.; Guan, D. Three-dimensional study of grain scale tensile twinning activity in magnesium: A combination of microstructure characterization and mechanical modeling. Acta Mater. 2023, 255, 119043. [Google Scholar] [CrossRef]
  7. Zhang, R.; Zhao, Q.; Guo, D.; Du, Y.; Zou, L.; Ying, Y.; Zhang, B.; Zhao, Y. New findings on the cryogenic TWIP effect in Ti-3Al-2Zr-1.5Mo alloy with lamellar microstructure. Scr. Mater. 2023, 229, 115385. [Google Scholar] [CrossRef]
  8. Sohrabi, M.J.; Mirzadeh, H.; Sadeghpour, S.; Mahmudi, R. Grain size dependent mechanical behavior and TRIP effect in a metastable austenitic stainless steel. Int. J. Plast. 2023, 160, 103502. [Google Scholar] [CrossRef]
  9. Wang, Z.; Shi, S.; Yu, J.; Li, B.; Li, Y.; Chen, X. Combining multiscale structure and TRIP effect to enhance room temperature tensile properties of 304 stainless steel by cryogenic cyclic plastic strengthening. Scr. Mater. 2023, 234, 115581. [Google Scholar] [CrossRef]
  10. Zhang, J.X.; Zhang, J.Y.; Xiao, W.C.; Hou, J.X.; Li, Q.; Xiao, B.; Yang, S.Y.; Wu, J.L.; Zhang, T.L.; Yang, T. Grain refinement induced unusually large shape memory effect in lightweight titanium alloy. Acta Mater. 2024, 272, 119936. [Google Scholar] [CrossRef]
  11. He, X.; Deng, Y.; Guo, X. In-situ EBSD tensile revealing the evolution mechanism of high angle grain boundaries in Al–Zn–Mg alloy profile with heterogeneous structures. Mater. Sci. Eng. A 2024, 901, 146539. [Google Scholar] [CrossRef]
  12. Yang, B.; Wang, J.; Ferdowsi, M.R.G.; Chao, Q.; Gao, X.; Li, Y.; Zhu, Y.; Barnett, M.; Llorca, J. Effect of precipitates on the dominant active slip systems in Mg-4.5Zn (wt.%) alloy. Acta Mater. 2024, 278, 120231. [Google Scholar] [CrossRef]
  13. Xiao, J.F.; Cayron, C.; Van der Meer, M.; Logé, R.E. EBSD study of variant reorientation, texture, and twin formation in a martensitic NiTi alloy deformed in compression. Acta Mater. 2024, 264, 119553. [Google Scholar] [CrossRef]
  14. Ruggles, T.J.; Bomarito, G.F.; Qiu, R.L.; Hochhalter, J.D. New levels of high angular resolution EBSD performance via inverse compositional Gauss–Newton based digital image correlation. Ultramicroscopy 2018, 195, 85–92. [Google Scholar] [CrossRef] [PubMed]
  15. Brodu, E.; Bouzy, E.; Fundenberger, J.-J.; Guyon, J.; Guitton, A.; Zhang, Y. On-axis TKD for orientation mapping of nanocrystalline materials in SEM. Mater. Charact. 2017, 130, 92–96. [Google Scholar] [CrossRef]
  16. Cao, Y.; Ni, S.; Liao, X.; Song, M.; Zhu, Y. Structural evolutions of metallic materials processed by severe plastic deformation. Mater. Sci. Eng. R 2018, 133, 1–59. [Google Scholar] [CrossRef]
  17. Ovid’ko, I.A.; Valiev, R.Z.; Zhu, Y.T. Review on superior strength and enhanced ductility of metallic nanomaterials. Prog. Mater. Sci. 2018, 94, 462–540. [Google Scholar] [CrossRef]
  18. Ji, W.; Zhou, R.; Vivegananthan, P.; Wu, M.S.; Gao, H.; Zhou, K. Recent progress in gradient-structured metals and alloys. Prog. Mater. Sci. 2023, 140, 101194. [Google Scholar] [CrossRef]
  19. Zhang, Y.; Cheng, Z.; Zhu, T.; Lu, L. Mechanics of gradient nanostructured metals. J. Mech. Phys. Solids 2024, 189, 105719. [Google Scholar] [CrossRef]
  20. Lu, L.; Sui, M.L.; Lu, K. Superplastic extensibility of nanocrystalline copper at room temperature. Science 2000, 287, 1463–1466. [Google Scholar] [CrossRef]
  21. Zhao, S.; Zhang, R.; Yu, Q.; Ell, J.; Ritchie, R.O.; Minor, A.M. Cryoforged nanotwinned titanium with ultrahigh strength and ductility. Science 2021, 373, 1363–1368. [Google Scholar] [CrossRef] [PubMed]
  22. Guan, X.R.; Chen, Q.; Qu, S.J.; Cao, G.J.; Wang, H.; Ran, X.D.; Feng, A.H.; Chen, D.L. High-strain-rate deformation: Stress-induced phase transformation and nanostructures in a titanium alloy. Int. J. Plast. 2023, 169, 103707. [Google Scholar] [CrossRef]
  23. Xiong, F.; Wu, Y.; Liu, X.; Wang, H.; Jiang, S.; Zhang, X.; Lu, Z. Enhancing cryogenic yield strength and ductility of the Al0.1CoCrFeNi high-entropy alloy by synergistic effect of nanotwins and dislocations. Scr. Mater. 2023, 232, 115495. [Google Scholar] [CrossRef]
  24. Molnárová, O.; Klinger, M.; Duchoň, J.; Seiner, H.; Šittner, P. Plastic deformation of B19’ monoclinic martensite in NiTi shape memory alloys: HRTEM analysis of interfaces in martensite variant microstructures. Acta Mater. 2023, 258, 119242. [Google Scholar] [CrossRef]
  25. Banerjee, A.; He, M.-R.; Chávez, F.A.; Krogstad, J.A.; Hemker, K.J. Tailoring the nanotwin spacing of Ni-Mo-W alloys via composition and substrate temperature control. Scr. Mater. 2024, 243, 115979. [Google Scholar] [CrossRef]
  26. Li, K.; Zhao, D.; Xing, Y.; Chen, W.; Zhang, J.; Sun, J. Kink-mediated high strength and large ductility via nanocrystallization in a tough titanium alloy. Acta Mater. 2024, 273, 119963. [Google Scholar] [CrossRef]
  27. Ke, J.G.; Liu, R.; Xie, Z.M.; Zhang, L.C.; Wang, X.P.; Fang, Q.F.; Liu, C.S.; Wu, X.B. Ultrahigh strength, thermal stability and high thermal conductivity in hierarchical nanostructured Cu-W alloy. Acta Mater. 2024, 264, 119547. [Google Scholar] [CrossRef]
  28. Wang, Y.; Yan, F.; Lai, M.; Li, X. Formation of nanocrystalline and nanolaminate structures in a twinning induced plasticity Ti-12Mo alloy: The role played by {332} <113> twinning. Acta Mater. 2024, 276, 120078. [Google Scholar] [CrossRef]
  29. Wang, S.; Wu, M.; Shu, D.; Zhu, G.; Wang, D.; Sun, B. Mechanical instability and tensile properties of TiZrHfNbTa high entropy alloy at cryogenic temperatures. Acta Mater. 2020, 201, 517–527. [Google Scholar] [CrossRef]
  30. Fu, R.; Feng, Z.; Huang, X. Orientation distribution and deviation behaviors of dislocation loops in a quenched Al-Cu alloy. Acta Mater. 2024, 270, 119837. [Google Scholar] [CrossRef]
  31. Zhang, L.X.; Liu, L.; Guo, S.; Pan, Q.S.; Lu, L. Microstructure and evolution of gradient dislocation cells in multi-principal element alloy subjected to cyclic torsion. Acta Mater. 2024, 275, 120059. [Google Scholar] [CrossRef]
  32. Yu, H.; Dong, Q.; Yao, Z.; Daymond, M.R. Stacking faults observed in {101−2} extension twins in a compressed high Sn content Zr alloy. Scr. Mater. 2017, 141, 72–75. [Google Scholar] [CrossRef]
  33. Chen, Y.; Guo, T.; Pang, X.; Qiao, L. Formation of high-density stacking faults in ceramic films induced by Ti transition layer. Scr. Mater. 2022, 211, 114496. [Google Scholar] [CrossRef]
  34. Laird, C.; Eichen, E.; Bitler, W.R. Accuracy in the use of electron-diffraction spot patterns for determining crystal orientations. J. Appl. Phys. 1966, 37, 2225–2231. [Google Scholar] [CrossRef]
  35. Pumphrey, P.H.; Bowkett, K.M. An accurate method for determining crystallographic orientations by electron diffraction. Phys. Status Solidi A 1970, 2, 339–346. [Google Scholar] [CrossRef]
  36. Pumphrey, P.H.; Bowkett, K.M. On the resolution of the 180° uncertainty in indexing electron diffraction spot patterns. Phys. Status Solidi A 1971, 5, K155–K157. [Google Scholar] [CrossRef]
  37. Liu, Q. A simple method for determining orientation and misorientation of the cubic crystal specimen. J. Appl. Crystallogr. 1994, 27, 755–761. [Google Scholar] [CrossRef]
  38. Liu, Q. A simple and rapid method for determining orientations and misorientations of crystalline specimens in TEM. Ultramicroscopy 1995, 60, 81–89. [Google Scholar] [CrossRef]
  39. Zhang, Z.; Huang, J.; Guo, P.; Peng, J.; Wang, S.; Chen, C. A method for measuring the micro-texture information based on transmission electron microscopy. J. Mater. Res. Technol. 2020, 9, 6916–6921. [Google Scholar] [CrossRef]
  40. Zaefferer, S. New developments of computer-aided crystallographic analysis in transmission electron microscopy. J. Appl. Crystallogr. 2000, 33, 10–25. [Google Scholar] [CrossRef]
  41. Fundenberger, J.J.; Morawiec, A.; Bouzy, E.; Lecomte, J.S. System for creating orientation maps using TEM. Mater. Chem. Phys. 2003, 81, 535–537. [Google Scholar] [CrossRef]
  42. Wu, G.; Zaefferer, S. Advances in TEM orientation microscopy by combination of dark-field conical scanning and improved image matching. Ultramicroscopy 2009, 109, 1317–1325. [Google Scholar] [CrossRef] [PubMed]
  43. Liu, H.H.; Schmidt, S.; Poulsen, H.F.; Godfrey, A.; Liu, Z.Q.; Sharon, J.A.; Huang, X. Three-dimensional orientation mapping in the transmission electron microscope. Science 2011, 332, 833–834. [Google Scholar] [CrossRef]
  44. Rauch, E.F.; Véron, M. Automated crystal orientation and phase mapping in TEM. Mater. Charact. 2014, 98, 1–9. [Google Scholar] [CrossRef]
  45. Kobler, A.; Kübel, C. Challenges in quantitative crystallographic characterization of 3D thin films by ACOM-TEM. Ultramicroscopy 2017, 173, 84–94. [Google Scholar] [CrossRef]
  46. Baral, P.; Kashiwar, A.; Coulombier, M.; Delannay, L.; Hoummada, K.; Raskin, J.P.; Idrissi, H.; Pardoen, T. Grain boundary-mediated plasticity in aluminum films unraveled by a statistical approach combining nano-DIC and ACOM-TEM. Acta Mater. 2024, 276, 120081. [Google Scholar] [CrossRef]
  47. ASTM E9-19; Standard Test Methods of Compression Testing of Metallic Materials at Room Temperature. ASTM International: West Conshohocken, PA, USA, 2019.
  48. Lilensten, L.; Sun, F.; Hocini, A.; Dirras, G.; Vermaut, P.; Prima, F. {332} <113> mechanical detwinning as a deformation mechanism in the β-metastable Ti-15Mo alloy during cyclic loading. Scr. Mater. 2023, 232, 115503. [Google Scholar]
  49. Zhang, F.; Xu, S.; Pan, S.; Qian, F.; Fan, Q.; Cheng, X. Subsequent growth and sequential twinning induced by the interaction of {332} twins in Ti15Mo alloy. Mater. Charact. 2024, 208, 113621. [Google Scholar] [CrossRef]
  50. Zhang, Y.; Li, X.; Xin, R.; Xin, S.; Liu, Q. Understanding cross boundary {332} <113> twins in a Ti-15Mo alloy by composite Schmid factor. Mater. Charact. 2022, 193, 112310. [Google Scholar] [CrossRef]
  51. Ren, L.; Xiao, W.; Ma, C.; Zheng, R.; Zhou, L. Development of a high strength and high ductility near β-Ti alloy with twinning induced plasticity effect. Scr. Mater. 2018, 156, 47–50. [Google Scholar] [CrossRef]
  52. Tian, Y.; Zhang, L.; Wu, D.; Xue, R.; Deng, Z.; Zhang, T.; Liu, L. Achieving stable ultra-low elastic modulus in near-β titanium alloys through cold rolling and pre-strain. Acta Mater. 2025, 286, 120726. [Google Scholar] [CrossRef]
Figure 1. Illustration of the three coordinate systems defined in this method: (a) crystal coordinate system; (b) microscope coordinate system; (c) sample coordinate system.
Metals 15 00920 g001
Figure 2. EBSD data analysis of the solution−treated sample: (a) IPF map; (b) phase distribution map; (c) {001}, {110}, and {111} PFs.
Metals 15 00920 g002
Figure 3. EBSD data analysis of the sample after deformation. (a) IPF map; (b) band contrast (BC) map + special boundary (<110> 50° ± 5°); (c) the misorientation angle distribution; and (d) the superimposed {332} pole figure of β−matrix and one twin indicated by arrows in (b). The blue and red circles in the pole figures are from the β−matrix and twin, respectively. The blue line represents the trace of coincident poles (highlighted by red dashed line).
Metals 15 00920 g003
Figure 4. (a) Bright−field TEM image of one typical single crystal; (b), (c) SAED patterns taken from the white circle area along the [110] and [001] zone axes, respectively; and (df) superimposed pole figures, revealing the orientations of the single crystal. The blue circles and orange squares in the pole figures are from SAED patterns shown in (b) and (c), respectively.
Metals 15 00920 g004
Figure 5. (a) Bright−field TEM image of {332}<11 3 ¯ > twin; SAED patterns of the (b) β–matrix and (c) twin; and (d) superimposed {332} pole figure of the β–matrix and twin. The blue and red circles in the pole figure are from SAED patterns of the β–matrix and twin, respectively. The blue line represents the trace of coincident poles (highlighted by red dashed line). The black star represents the direction of the force axis.
Metals 15 00920 g005
Figure 6. (a) Bright−field TEM image of {332}<11 3 ¯ > twin; SAED patterns of the (b) β–matrix and (c) twin; (d) superimposed {332} pole figure plotted using one of the orientations determined by (b) and the orientation determined by (c); and (e) superimposed {332} pole figure plotted using another orientation determined by (b) and the orientation determined by (c). The blue and red circles in the pole figure are from SAED patterns of the β–matrix and twin, respectively. The blue lines represent the traces of coincident poles (highlighted by red dashed line). The black stars represent the direction of the force axis.
Metals 15 00920 g006
Figure 7. (a) Bright−field TEM image of {332}<11 3 ¯ > twin; SAED patterns of the (b) β–matrix and (c) twin; and (dg) superimposed {332} pole figures plotted using one of two possible orientations determined by (b) and one of two possible orientations determined by (c), respectively; the blue and red circles in the pole figures are from SAED patterns of the β–matrix and twin, respectively. The blue lines represent the traces of coincident poles (highlighted by red dashed line). The black stars represent the direction of the force axis.
Metals 15 00920 g007
Figure 8. (a) Bright−field TEM image of {332}<11 3 ¯ > double twins; SAED patterns of the (b) β–matrix, (c) primary twin and (d) secondary twin; (e) superimposed {332} pole figures of the β–matrix and twin; and (f) superimposed {332} pole figures of the primary twin and secondary twin. The blue, red, and green circles in the pole figures are from SAED patterns of the β–matrix, the primary twin, and the secondary twin, respectively. The blue and red lines represent the trace of coincident poles (highlighted by red dashed line). The black stars represent the direction of the force axis.
Metals 15 00920 g008
Figure 9. (a) Bright–field TEM image of {332}<11 3 ¯ >–{112}<11 1 ¯ > double twins; SAED patterns of the (b) β–matrix, (c) primary twin, and (d) secondary twin; (e) superimposed {332} pole figures of the β–matrix and twin; and (f) superimposed {112} pole figures of the primary twin and secondary twin. The blue, red, and green circles in the pole figures are from SAED patterns of the β−matrix, the primary twin, and the secondary twin, respectively. The blue and red lines represent the trace of coincident poles (highlighted by red dashed line). The black stars represent the direction of the force axis.
Metals 15 00920 g009
Table 1. Indices of the twelve {332}<11 3 ¯ > twin variants and the SF values calculated from the β–matrix orientation in Figure 5 (The red text color in the table is used to indicate the actually activated variants).
Twin VariantsTwinning SystemsSFTwin VariantsTwinning SystemsSF
V1 332 11 3 ¯ −0.02V7 3 ¯ 23 1 ¯ 3 ¯ 1 −0.41
V2 3 3 ¯ 2 1 1 ¯ 3 ¯ 0.32V8 3 ¯ 2 3 ¯ 1 ¯ 3 ¯ 1 ¯ 0.06
V3 3 ¯ 32 1 ¯ 1 3 ¯ 0.30V9 233 3 ¯ 11 −0.11
V4 3 ¯ 3 ¯ 2 1 ¯ 1 ¯ 3 ¯ 0.49V10 23 3 ¯ 3 ¯ 1 1 ¯ −0.09
V5 323 1 3 ¯ 1 −0.12V11 2 3 ¯ 3 3 ¯ 1 ¯ 1 −0.42
V6 32 3 ¯ 1 3 ¯ 1 ¯ −0.06V12 2 3 ¯ 3 ¯ 3 ¯ 1 ¯ 1 ¯ 0.05
Table 2. Indices of the twelve {332}<11 3 ¯ > twin variants and the SF values calculated from the β–matrix orientation in Figure 6 (The red text color in the table is used to indicate the actually activated variants).
Twin VariantsTwinning SystemsSFTwin VariantsTwinning SystemsSF
V1 332 11 3 ¯ −0.14V7 3 ¯ 23 1 ¯ 3 ¯ 1 0.00
V2 3 3 ¯ 2 1 1 ¯ 3 ¯ 0.04V8 3 ¯ 2 3 ¯ 1 ¯ 3 ¯ 1 ¯ −0.33
V3 3 ¯ 32 1 ¯ 1 3 ¯ 0.02V9 233 3 ¯ 11 0.33
V4 3 ¯ 3 ¯ 2 1 ¯ 1 ¯ 3 ¯ −0.50V10 23 3 ¯ 3 ¯ 1 1 ¯ 0.29
V5 323 1 3 ¯ 1 0.24V11 2 3 ¯ 3 3 ¯ 1 ¯ 1 0.07
V6 32 3 ¯ 1 3 ¯ 1 ¯ 0.24V12 2 3 ¯ 3 ¯ 3 ¯ 1 ¯ 1 ¯ −0.26
Disclaimer/Publisher’s Note: The statements, opinions and data contained in all publications are solely those of the individual author(s) and contributor(s) and not of MDPI and/or the editor(s). MDPI and/or the editor(s) disclaim responsibility for any injury to people or property resulting from any ideas, methods, instructions or products referred to in the content.