Article

Multi-Model Collaborative Optimization of Inconel 690 Deposited Geometry in Laser-Directed Energy Deposition: Machine Learning Prediction and NSGA-II Decision Framework

1
School of Materials Science and Engineering, Northeastern University, Shenyang 110819, China
2
Key Laboratory for Anisotropy and Texture of Materials Ministry of Education, Northeastern University, Shenyang 110819, China
*
Author to whom correspondence should be addressed.
Metals 2025, 15(8), 905; https://doi.org/10.3390/met15080905
Submission received: 30 June 2025 / Revised: 6 August 2025 / Accepted: 12 August 2025 / Published: 14 August 2025

Abstract

The critical challenge of achieving precise geometric control in laser directed energy deposition (L-DED) of Inconel 690 for nuclear applications is addressed by this study. We established a data-driven optimization framework that reduces time-consuming trial-and-error experiments. A comprehensive process-geometry dataset was generated through full-factor experiments. Pearson correlation analysis revealed significant correlations: strong positive correlations between laser power and bead width (r = 0.82) and depth (r = 0.85), and between powder feed rate and height (r = 0.70). A hybrid machine learning model was subsequently developed. It used a Backpropagation Neural Network (BPNN) to achieve excellent prediction of width, height, and depth (R2 ≤ 0.962). It also generated 100 uniformly distributed Pareto optimal process parameter sets via the Non-dominated Sorting Genetic Algorithm II (NSGA-II). Experimental validation confirmed the model’s high predictive accuracy—relative error ≤ 5% for width/depth, and a maximum relative error of 5.34% for height. This demonstrates the framework’s effectiveness for reliable multi-objective process optimization in high-precision deposition tasks. It also highlights its potential for use in nuclear component repair and other material systems.

Graphical Abstract

1. Introduction

Laser-directed energy deposition (L-DED) is an additive manufacturing technology that employs high-energy laser beams to melt metallic feedstock, forming metallurgical bonds with substrates [1,2]. This process achieves near-net shape forming of complex structures through layer-wise deposition, offering superior material utilization (exceeding 95%) [3], enhanced design freedom (e.g., internal conformal channels) [4], and rapid prototyping capabilities compared with subtractive manufacturing. These advantages enable widespread L-DED adoption for high-performance metal components in aerospace, energy, and biomedical sectors [5,6,7]. However, complex coupling effects between process parameters and melt pool dynamics frequently cause geometric deviations, porosity, and microstructural inhomogeneity [8], limiting L-DED’s application in critical load-bearing parts. Since single-bead deposition constitutes the fundamental unit determining final quality, investigating parameter–geometry relationships and establishing accurate bead dimension prediction models are essential for ensuring dimensional accuracy and process robustness.
The optimization of laser additive manufacturing processes is challenged by multi-parameter interactions, vast solution spaces, and complex physical-metallurgical phenomena, rendering trial-and-error approaches and numerical simulations prohibitively time-consuming and costly. Machine learning (ML) addresses these limitations by leveraging extensive process data to shorten experimental cycles, reduce computational expenses, and effectively predict/optimize process parameters. Veiga et al. [9] have systematically analyzed how critical parameters (current, wire feed speed) govern bead geometry (width/height) in Invar alloy wire-arc additive manufacturing through real-time melt pool monitoring, establishing process-geometry correlations via linear regression models. Afshari et al. [10] developed an integrated approach combining design of experiments, inverse analysis, and numerical simulation to evaluate bead geometry and cladding characteristics in Inconel 718 laser deposition, achieving precise prediction through multi-parameter optimization. Chigilipalli et al. [11] optimized Incoloy 825 deposition parameters via neuro-fuzzy modeling, creating an intelligent prediction framework for nickel-based alloys. Shen et al. [12] employed multiple ML algorithms (Random Forest, SVM, ANN) for dimension prediction in CoCrFeNiMo0.2 high-entropy alloy deposition. Li et al. [13] proposed a novel differential evolution-optimized multi-output SVR (DE-MOSVR) model predicting bead morphology in 2319 aluminum wire-laser hybrid DED. Lee et al. [14] utilized Gaussian process regression (GPR) to forecast layer height and porosity in Fe-Ni alloy laser metal deposition, with Shapley Additive Explanations (SHAP) quantifying parameter significance.
Although machine learning (ML) can accurately predict single-target outputs, it lacks the ability to autonomously reconcile conflicts between parameters such as bead width, depth and height. Multi-objective optimization is the key tool for resolving such challenges in engineering decision-making. Wang et al. [15] developed an intelligent optimization method that integrates modified NSGA-II algorithms and multi-pass deposition profile prediction models to optimize parameters in aluminum alloy laser-arc hybrid additive manufacturing. Chen et al. [16] proposed an innovative, multi-objective optimization framework that considers multiple objectives, such as energy efficiency, material utilization and environmental impact in order to optimize process parameters systematically. Using a titanium alloy as a case study, the study verified the effectiveness of this framework in balancing processing performance and environmental benefits. Aghaei et al. [17] combined SVR prediction models with NSGA-II to map the relationship between different laser welding parameters and quality metrics (e.g., strength and penetration). This approach achieved multi-objective synergy through Pareto solutions, improving joint strength by 15% and reducing the width of the heat-affected zone by 20% compared with single-objective approaches. Panico et al. [18] used Taguchi methods and neural networks to model correlations between fused deposition modeling (FDM) 3D printing parameters and quality, utilizing NSGA-II to resolve conflicts between printing speed, strength, and accuracy. Yu et al. [19] created a hybrid framework that combines data augmentation, stacked ensemble learning, SHAP analysis and multi-objective optimization in order to design strong, tough, and ductile laser-melted titanium alloys. This framework simultaneously enhances the ultimate tensile strength (UTS) and elongation (EL) of LPBF Ti components. Together, these studies show that ML-multi-objective synergy is an innovative way to allocate weight precisely across competing objectives and identify optimal parameter sets in laser additive manufacturing.
Inconel 690 alloy, with its compatible filler ER NiCrFe-7A, has been shown to possess exceptionally high-temperature stability and corrosion resistance properties, thus making it a critical material for the manufacturing of components for nuclear power plants. The utilization of this alloy has been demonstrated to result in a substantial increase in service lifetimes. While the potential of additive manufacturing (AM) in the repair and fabrication of nuclear safety-critical components, including reactor penetration nozzles, large-curvature piping nozzles, and fuel assembly bottom grids (BG)/nozzles (BN), has been demonstrated [20,21,22], current research on Inconel 690 AM remains considerably limited. Existing studies have primarily focused on mitigating high-temperature impregnation cracks and enhancing dissimilar-weld mechanical properties, with insufficient attention being paid to predicting and optimizing single-bead geometry. It is imperative to acknowledge that precise dimensional control of individual beads is of the essence in ensuring the quality and stability of fabricated components. Consequently, the advancement of predictive modelling and process optimization for Inconel 690 deposition assumes a pivotal role in nuclear safety assurance.
Therefore, this study combines machine learning and multi-objective optimization to create a predictive model for the geometry of beads in the laser-directed energy deposition (L-DED) of Inconel 690 alloy. A full-factorial experimental design was implemented, using laser power (P), travel speed (V), and powder feed rate (F) as the input variables and bead width (W), height (H), and depth (D) as the output targets. Three machine learning algorithms were used to develop geometric prediction models. The Non-dominated Sorting Genetic Algorithm II (NSGA-II) was then used to find Pareto-optimal combinations of process parameters, maximizing bead width and height while minimizing depth. Ultimately, experimental validation was performed using the optimal parameters predicted by the model.
2. Materials and Methods

2.1. Materials

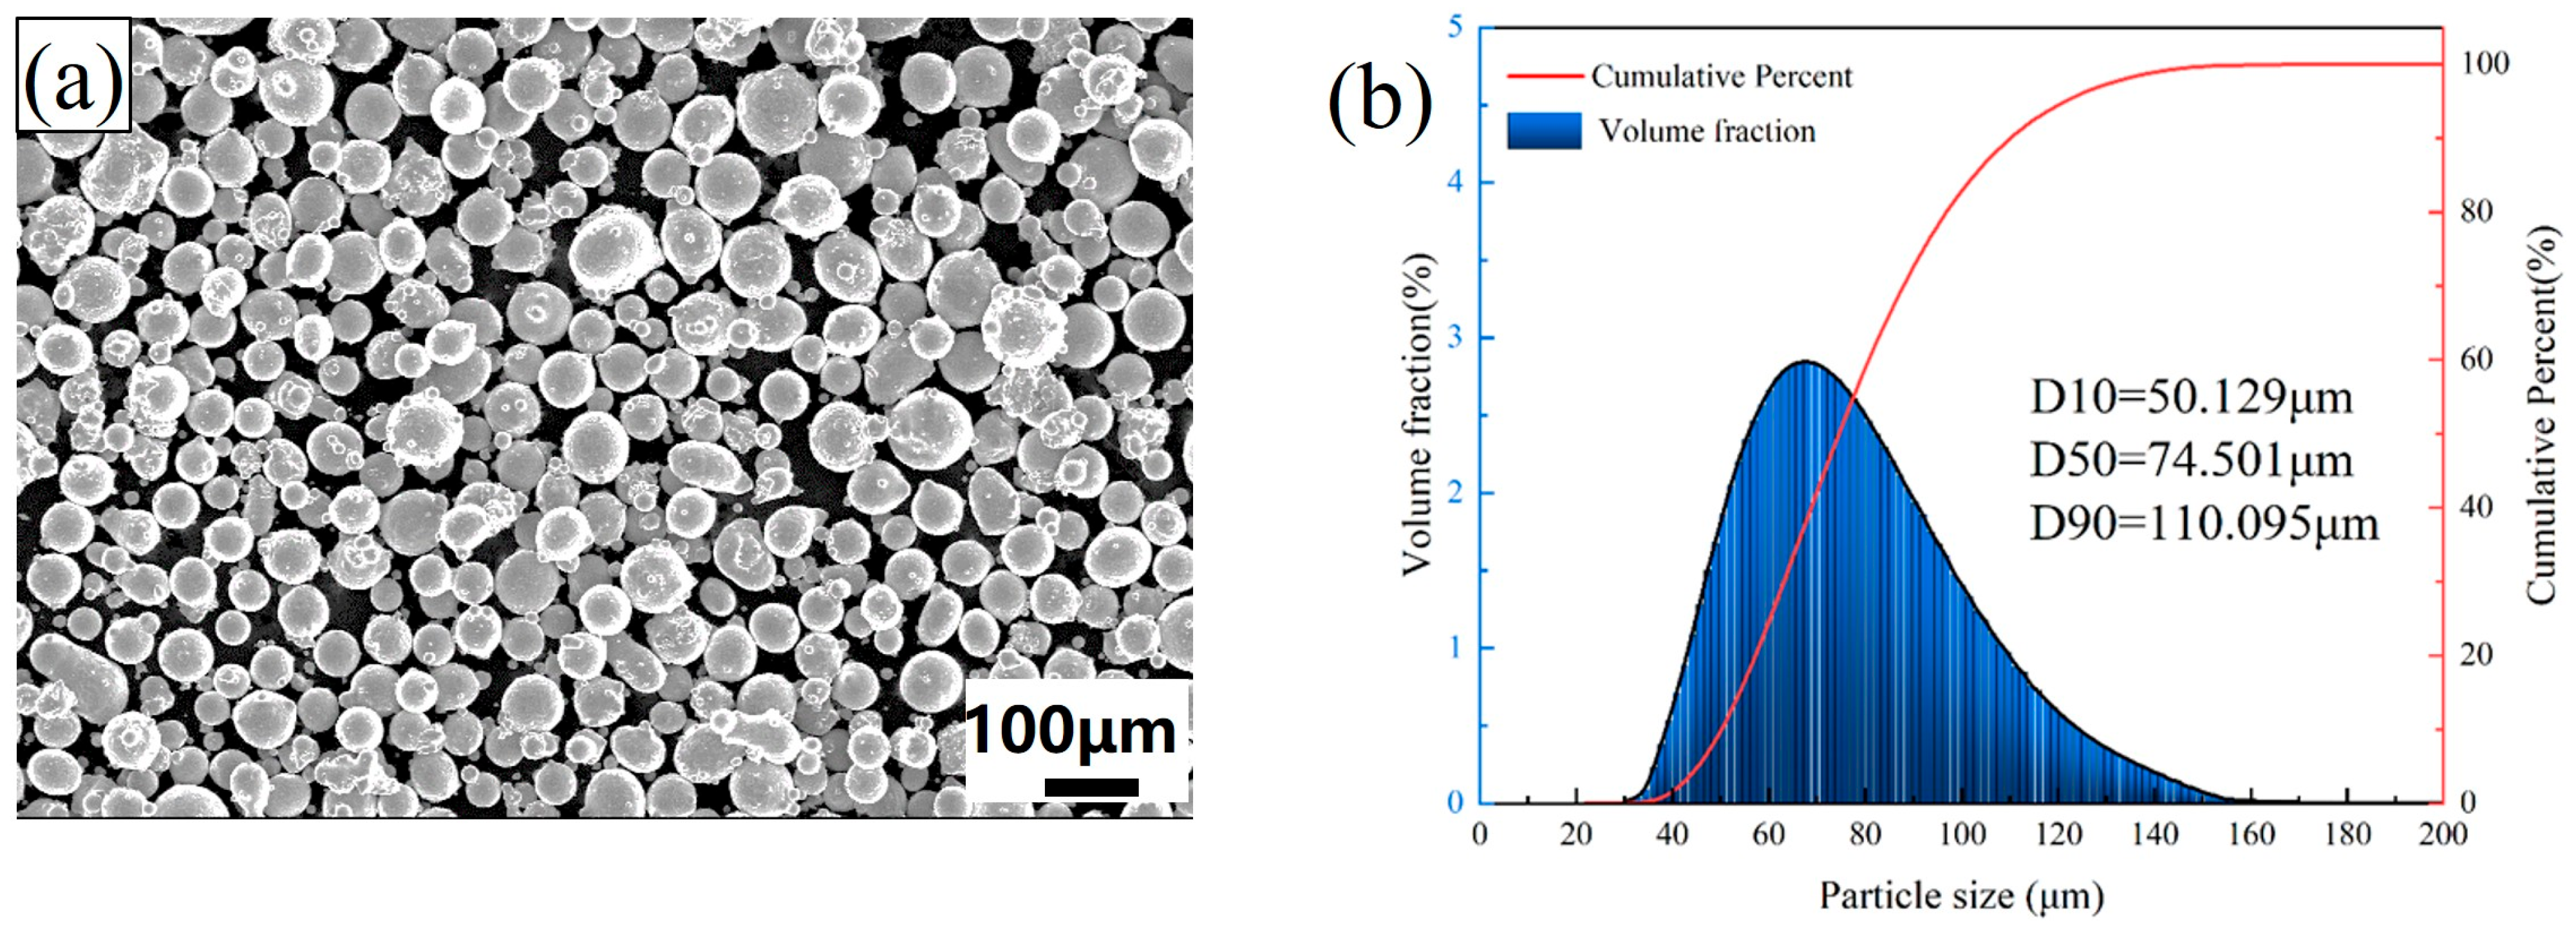
The experiments employed Inconel 690 powder with a particle size distribution of 53–106 μm, the morphology of which is demonstrated in Figure 1. AISI 1045 steel substrates (200 mm × 150 mm × 10 mm) were used, with the chemical compositions of both the powder and the substrates provided in Table 1. Prior to the process of deposition, the surfaces of the substrate were subjected to a grinding procedure using abrasive paper, which was then followed by a cleaning process involving the use of ethanol.

2.2. Laser Direct Energy Deposition System

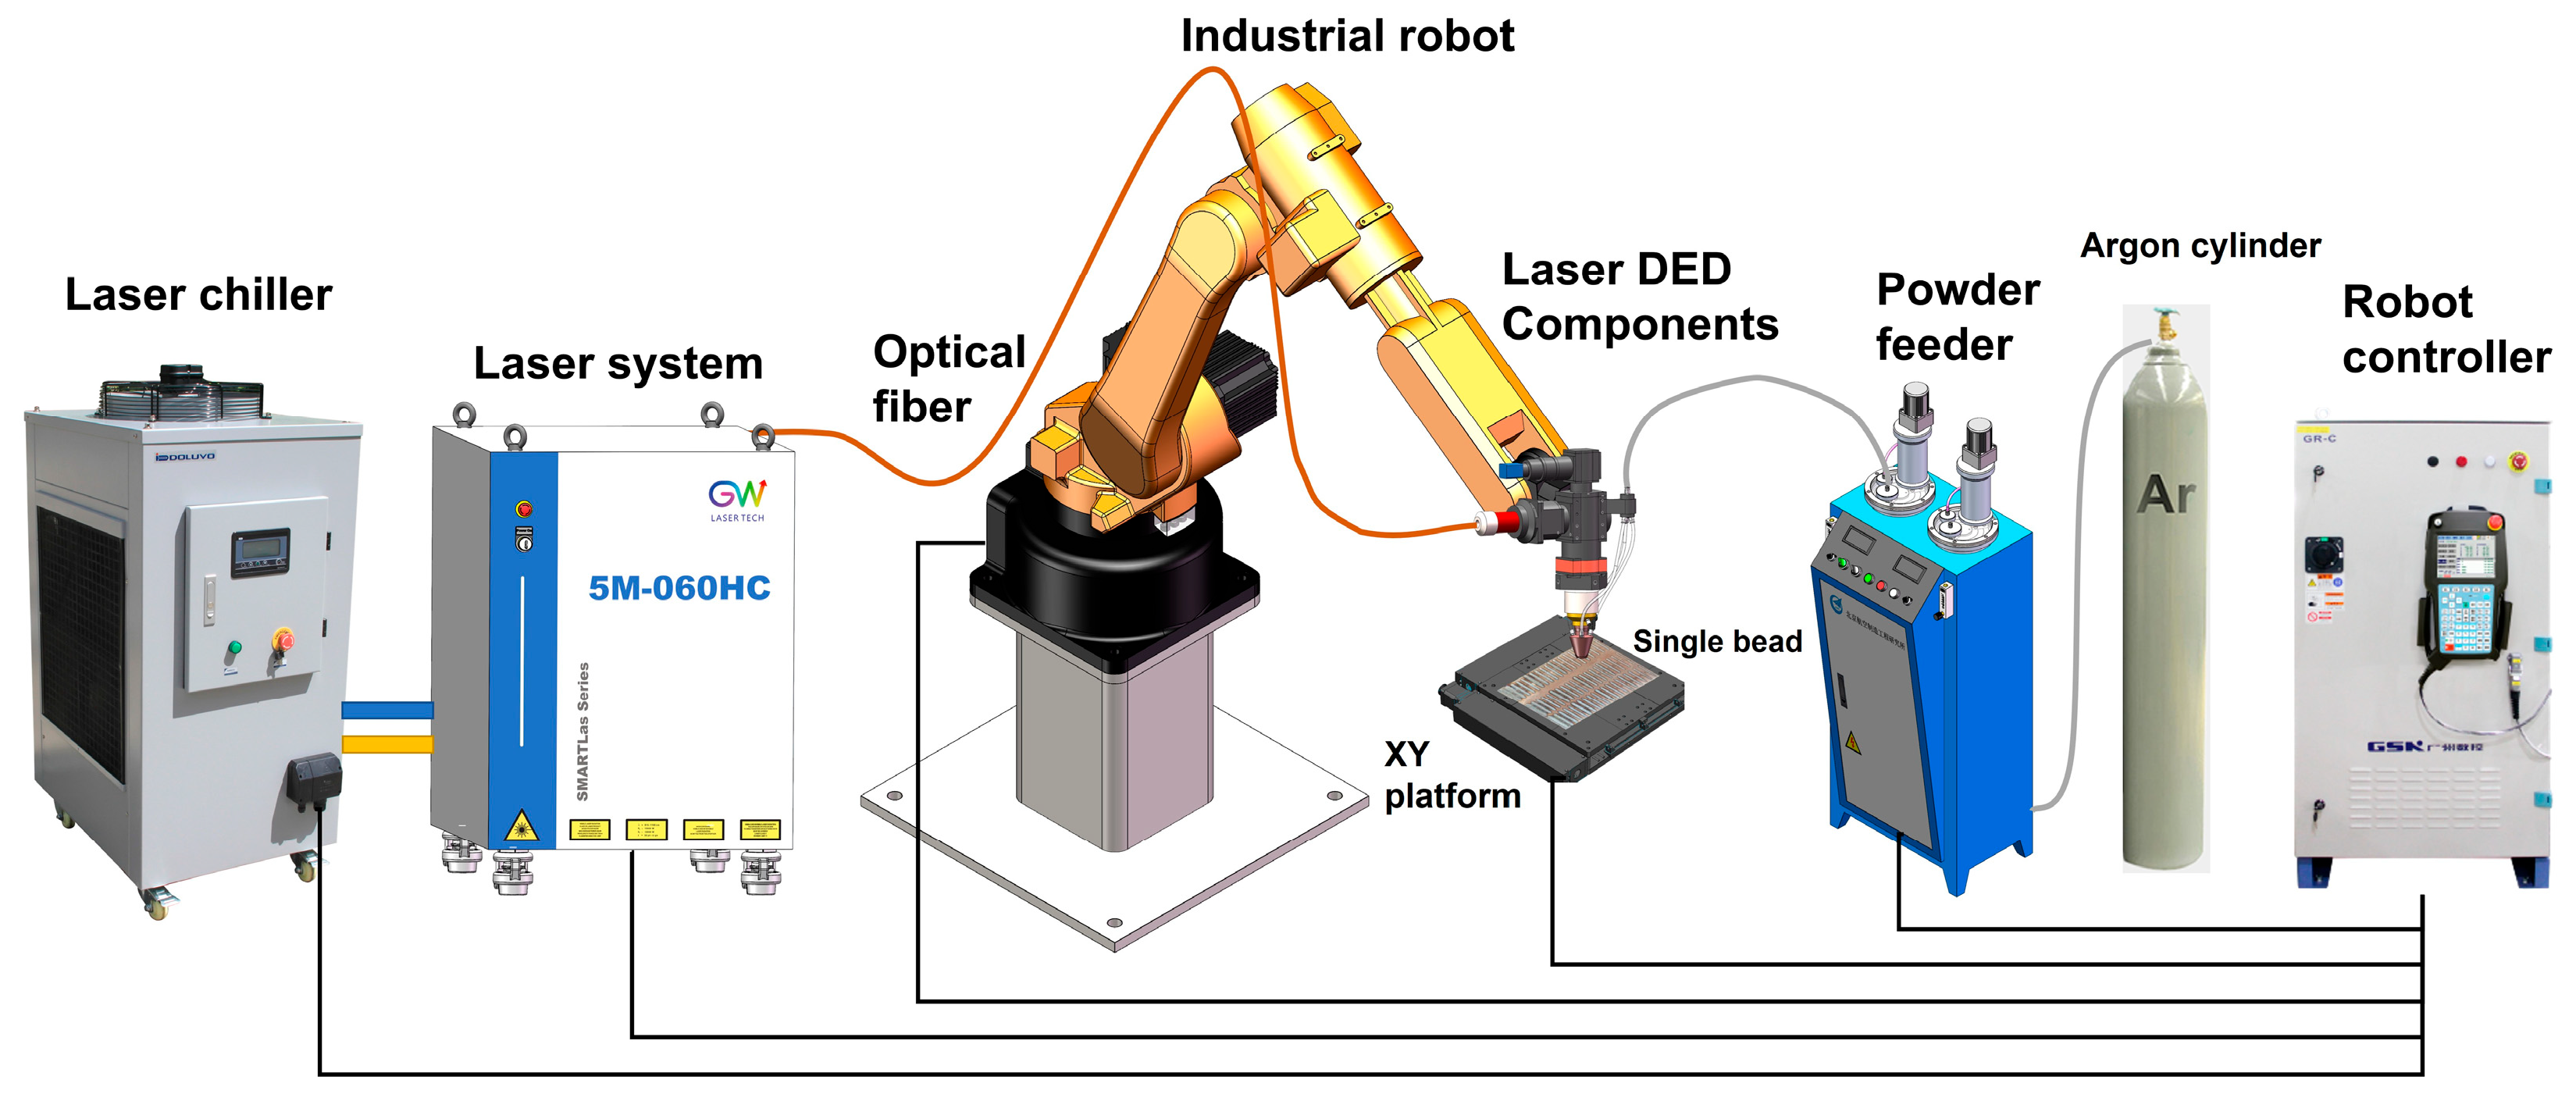
In this study, all samples were fabricated using a 6-axis L-DED system developed in-house. As illustrated in Figure 2, the motion unit incorporates an industrial robot (RB20, GSK CNC Equipment Co., Ltd., Guangzhou, China). The heat source uses a fiber laser (GW 5M-060-HC, GW (Shanghai) Laser Technology Co., Ltd., Shanghai, China) with a maximum power output of 6000 W and a wavelength of 1070 nm. The forming nozzle uses a coaxial three-point nozzle (CT-1317-01, Nanjing Huirui Photoelectric Technology Co., Ltd., Nanjing, China) with 99.999% pure argon gas to prevent oxidation. Throughout the deposition process, the argon gas maintained a stable flow rate of 20 L/min, and the distance between the substrate and the nozzle was consistently maintained at 17 mm with a laser beam spot diameter of 4 mm. During the forming process, the laser power (P), travel speed (v) and powder feed rate (F) are controlled by the programming language in the robot teach pendant.

2.3. Experiments and Data Collection

To obtain the training dataset for the machine learning models, we selected process parameters that covered a wide processing window (see Table 2). The laser power range was 1200–3000 W, in steps of 600 W; the travel speed range was 4–12 mm/s, in steps of 4 mm/s; and the powder feed rate range was 1.8–7.2 g/min, in steps of 1.8 g/min. This covered a wide range of linear energy density values, resulting in a single-bead dataset comprising 80 distinct bead geometries. Here, Linear energy density (LED) is defined as follows:
L E D = P v × F ,
where P is the laser power in watts, v is the travel speed in mm/s, and F is the powder feed rate in g/min.
The length of the single deposition bead is 40 mm. After the cladding process is completed, the prepared specimens are cut into 10 mm × 50 mm × 10 mm specimens using an electric spark wire cutter (each specimen contains 5 deposition beads). After embedding in epoxy resin, the specimens were polished with sandpaper ranging from 200# to 3000#, followed by polishing with polishing paste and a polishing machine until a mirror-like finish was achieved. The specimens were then rinsed with anhydrous ethanol and dried. The polished specimens were etched with 5% nitric acid in ethanol until the coating boundaries were visible. Finally, the polished samples were imaged using an OLYMPUS SZX7 macro-style microscope (Evident Corporation, Tokyo, Japan). Typical laser-deposited single bead morphologies are shown in Figure 3. The bead width W, bead height H, bead depth D, and bead area A were measured using Image-Pro Plus 6.0 software, with each measurement repeated three times and the average value taken.

2.4. Machine Learning Model Development

This study selected three prevalent machine learning (ML) models capable of regression analysis—Support Vector Regression (SVR), Backpropagation Neural Network (BPNN), and eXtreme Gradient Boosting (XGBoost)—to predict bead width (W), height (H), depth (D), and area (A). Prior to model training, data normalization was performed using the MinMaxScaler() function to rescale features within the (0, 1) range. This preprocessing step mitigates model sensitivity to input noise, standardizes feature scales, accelerates convergence, alleviates gradient issues, and enhances generalization capability.
The dataset was partitioned into a training set (70%, 56 samples) and a test set (30%, 24 samples) via the train_test_split() function from Scikit-learn’s model_selection module in Python 3.9.7. Data analysis and modeling were conducted using Python 3.9.7 with key libraries (NumPy, Pandas, Scikit-learn, XGBoost, TensorFlow). The hyperparameters of the model were optimized through the implementation of a grid search. In order to avoid the problem of model overfitting, each set of hyperparameters was evaluated using 5-fold cross-validation. Finally, the optimal parameter combination was selected to establish the model. Optimized models were serialized using Python’s pickle module for subsequent multi-objective optimization.
Three metrics were adopted to evaluate model accuracy: Root Mean Squared Error (RMSE), which quantifies deviations between predicted and actual values, with lower values (closer to 0) indicating superior performance; Mean Absolute Error (MAE), which measures expected absolute error loss, with lower values denoting better regression; and Coefficient of Determination (R2), which assesses model fit, ranging (0, 1), with higher values reflect greater explanatory power of independent variables.
R M S E = 1 n i = 1 n y i y ^ i 2 ,
M A E = 1 n i = 1 n y i y ^ i ,
R 2 = 1 i = 1 n y i y ^ i 2 / i = 1 n y i y ¯ i 2 ,
where y i is the actual value, y ^ i is the predicted value, y ¯ i is the average value, and n is the number of samples.

2.5. Multi-Objective Optimization

In the L-DED process, maximum deposition efficiency is achieved by selecting the maximum bead width and height, while avoiding excessive melt depth, which could lead to a coarse-grain structure. Optimizing L-DED parameters to simultaneously maximize bead width (W) and height (H) while minimizing depth (D) constitutes a classic multi-objective problem. The developed ML models served as fitness functions within the Non-dominated Sorting Genetic Algorithm II (NSGA-II) to identify Pareto-optimal solutions. Since NSGA-II minimizes objectives, the goals for W and H were negated ( f W , f H ). The optimization formulation is the following:
X = P , v , F M in   f X = f W , f H , f D s . t . P min P P max v min v v max F min F F max
In the equation, X represents the input process parameters, including laser power (P), travel speed (v) and powder feed rate (F). f W denotes the bead width prediction model, f H the bead height prediction model, and f D the bead depth prediction model.
The constraints represent the permissible ranges for each process parameter in laser-directed energy deposition. The parameters of the NSGA-II algorithm were set as follows: Initial sampling was set to FloatRandomSampling, the population size to 100, the crossover probability to 0.9, the mutation probability to 0.15, and the number of generations to 100. The Pareto front was then plotted. This is constructed from the search space, highlighting trade-offs and optimal parameter design schemes. Finally, typical optimization schemes were selected for experimental verification.

3. Results and Discussion

3.1. Effect of Process Parameters on the Geometry of the Deposited Bead

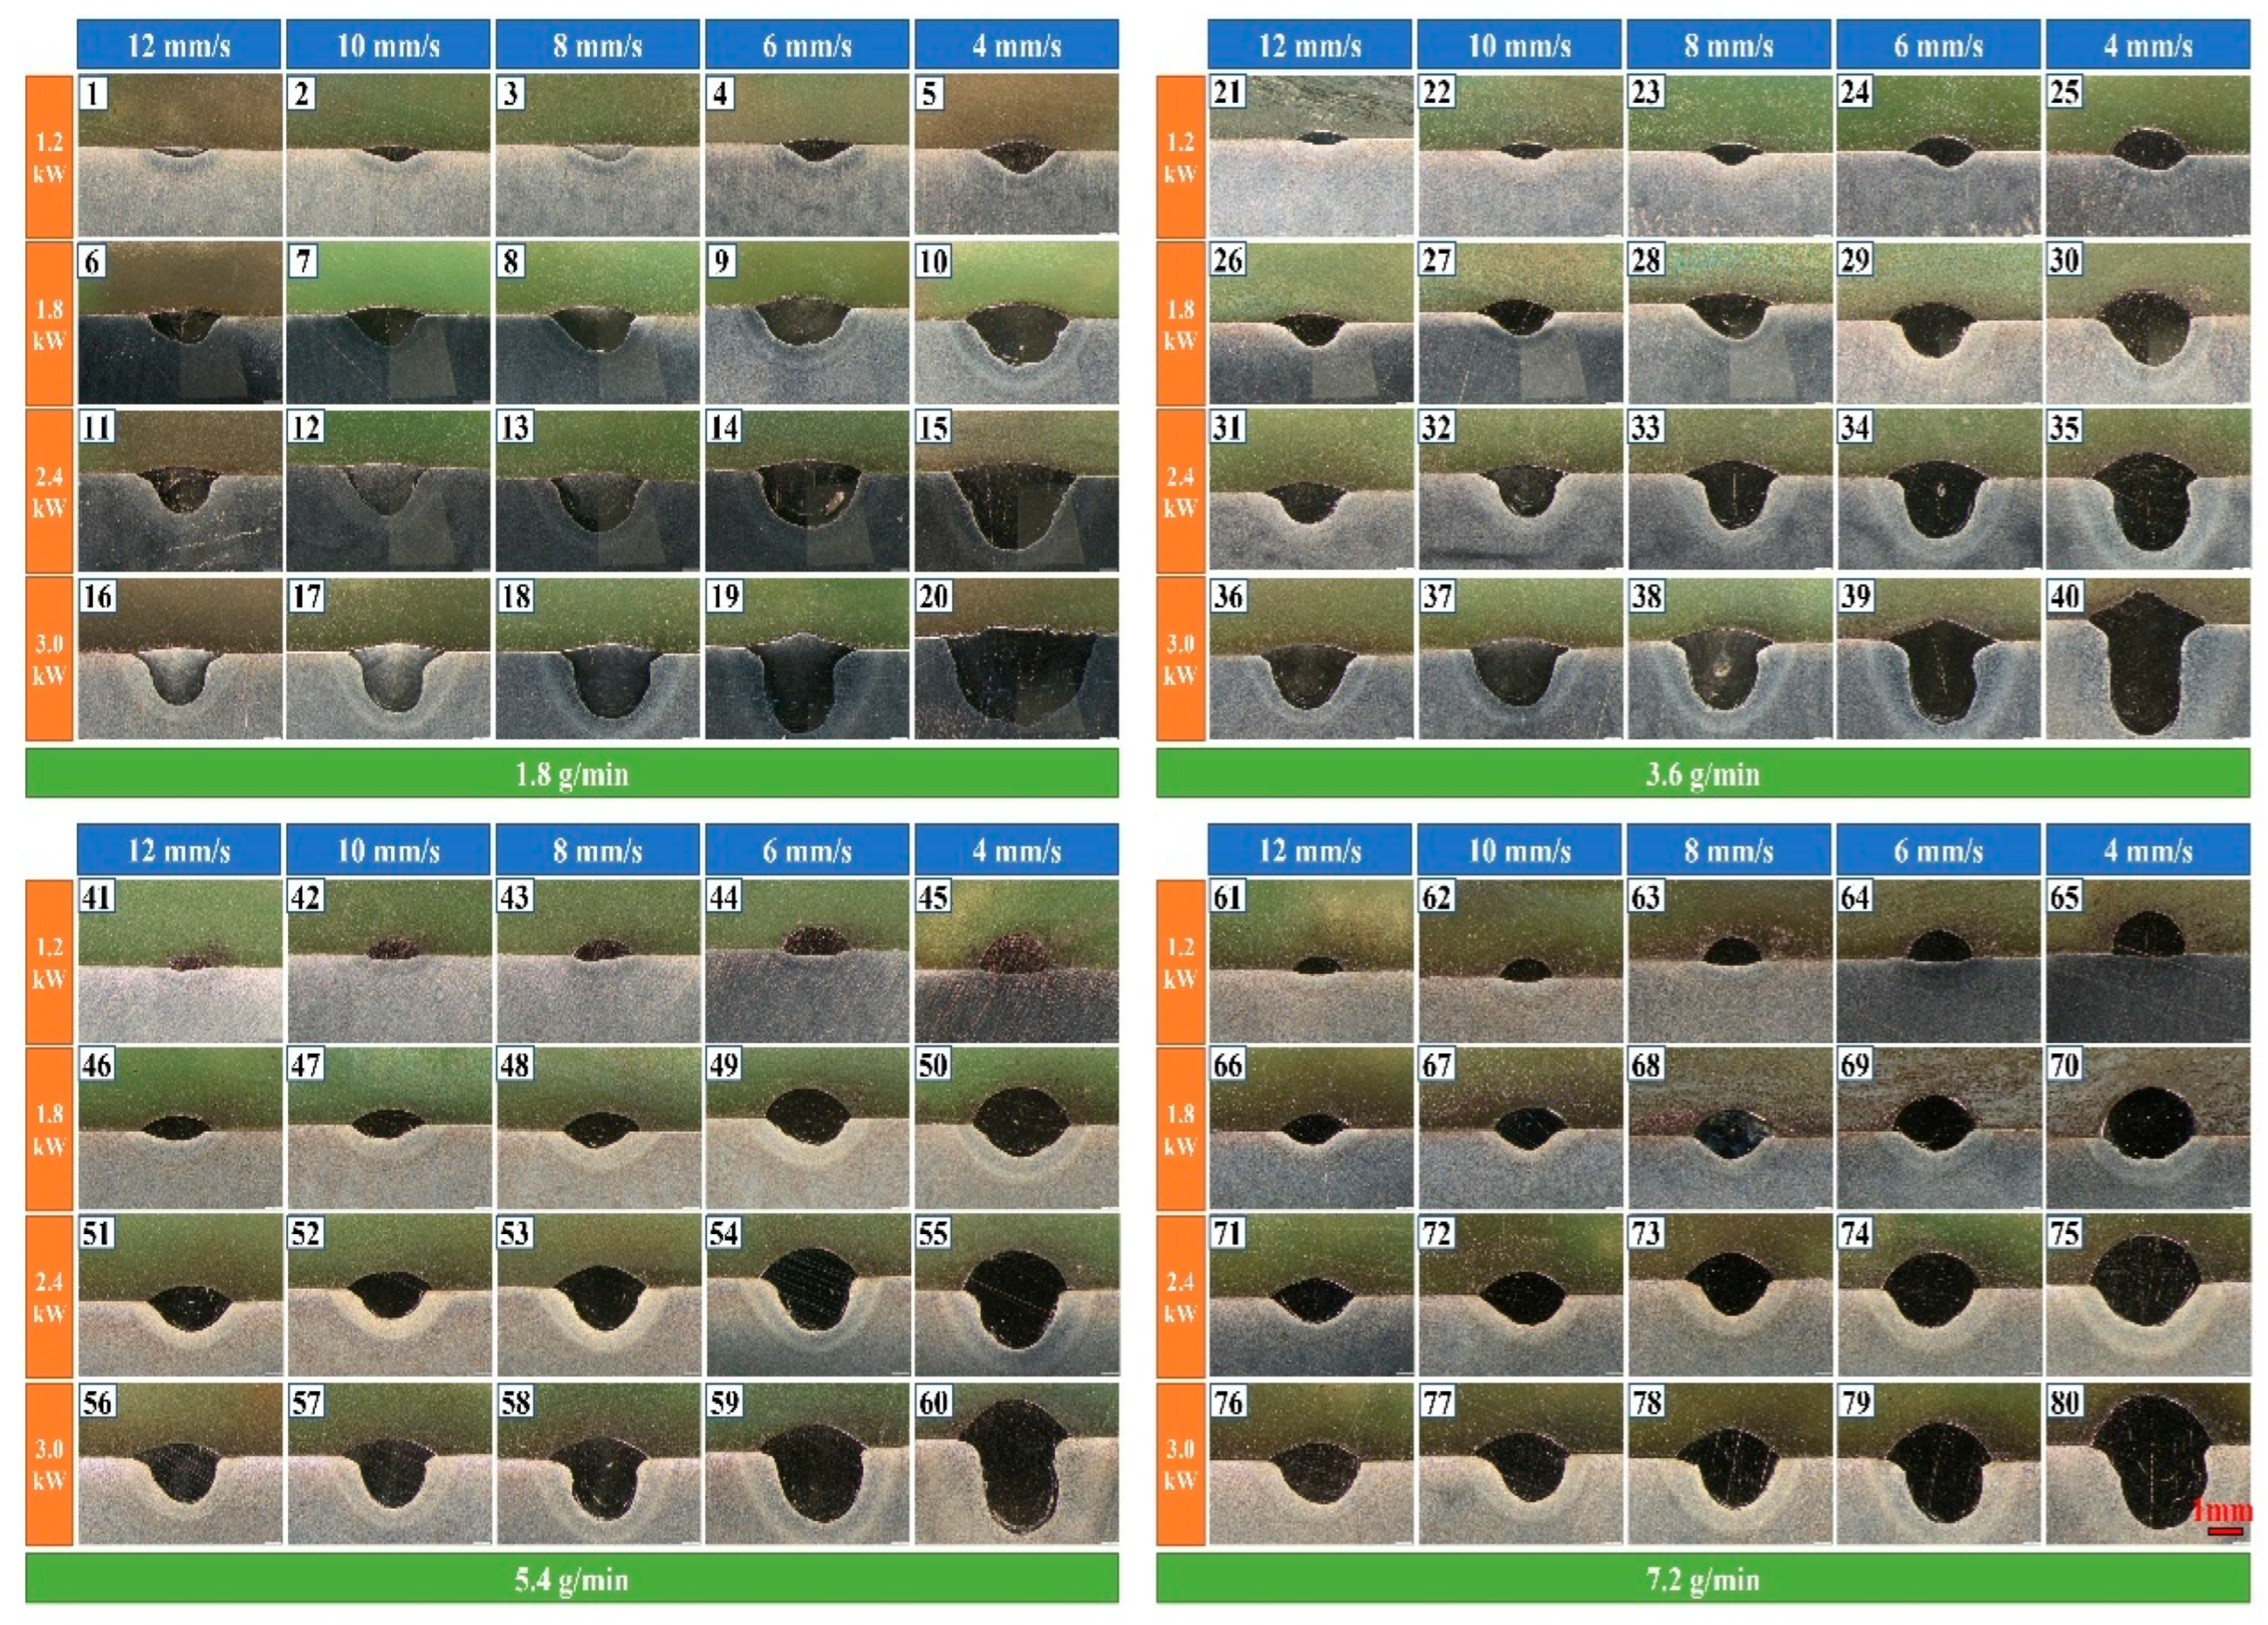
Figure 4 shows the cross-sections of deposited samples prepared using different process parameters. The deposition beads exhibit good metallurgical bonding with the substrate and have regular, well-filled shapes. In additive manufacturing processes, the width of the deposition beads controls the wall thickness of formed thin-walled parts directly, while their height controls deposition efficiency. The depth of the deposition beads primarily influences the size of the remelting zone between layers, which affects grain growth morphology and mechanical properties. Under constant travel speed and powder feed rate, the width, height and area of the deposition beads gradually increase as the laser power increases. Similarly, at a constant laser power and powder feed rate, a decrease in travel speed results in a gradual increase in the width, height, and area of the deposition beads. Similar influence patterns have been observed in other processes and materials [19]. The melting energy of the substrate and powder is determined by the joint effect of laser power and travel speed, thereby influencing the geometric shape and properties of the deposited material. Insufficient power can result in porosity and poor fusion, whereas excessive power can lead to deformation and residual stress. A travel speed that is too slow results in high dilution, whereas a speed that is too fast can cause poor fusion and porosity issues [23]. The bead morphology is further influenced due to the shielding effect of L-DED metal powders on the laser and the convective heat transfer process of the carrier gas flow on the melt pool. Therefore, it is difficult to accurately predict the bead morphology from cross-sectional photographs of the deposition beads alone.

3.2. Correlation Analysis of Process Parameters

A correlation analysis was conducted on the three process parameters and four bead morphology indicators based on the results of the full factorial experiment. Pearson’s correlation coefficient was used to measure the correlation between the process parameters and the bead morphology characteristics. This coefficient can accurately measure the linear correlation between two variables [24]. It can be expressed as follows:
ρ X Y = c o v X , Y σ X σ Y = E X μ X Y μ Y σ X σ Y
In the formula, cov(X, Y) denotes the covariance between X and Y, and σX and σY denote the sample standard deviations of X and Y, respectively. The Pearson correlation coefficient ranges from −1 to 1. A value of 1 indicates a perfect positive correlation between the two variables, a value of −1 indicates a perfect negative correlation, and a value close to 0 indicates almost no linear relationship.
Figure 5 shows the Pearson correlation coefficient matrix between the three process parameters (laser power, travel speed, and powder feed rate) and the bead height, width, depth, and area. Figure 5 shows that laser power exhibits strong positive correlations with bead width, depth, and area, with respective correlation coefficients of 0.82, 0.85, and 0.73. Laser power shows a weak positive correlation with bead height, with a correlation coefficient of 0.14. Travel speed exhibits weak negative correlations with bead width, depth, height, and area, with respective correlation coefficients of −0.47, −0.35, −0.58, and −0.58. The powder feed rate is strongly positively correlated with bead height (with a correlation coefficient of 0.7) while exhibiting a weak negative correlation with bead width and depth, with respective correlation coefficients of −0.11 and −0.24. These patterns are consistent with those observed in Section 3.1 through analysis of bead cross-sectional photographs. Pearson correlation coefficient analysis demonstrates that laser power and travel speed exert a significant influence on the width, depth, and area of the bead, while powder feed rate exerts a substantial influence on the height of the bead. Laser power, travel speed and powder feed rate can be used as input variables to train a machine learning model to predict the geometric dimensions of the deposited layer.
The width and height of the bead directly impact the dimensional accuracy of the LMD process. The establishment of an appropriate depth is a prerequisite for ensuring interlayer metallurgical bond strength. In the context of additive manufacturing processes, the dimensions of width and height can be readily measured non-destructively, with the capability to obtain these measurements online during the forming process. The bead area is defined as the mathematical integral of width, depth, and height, and it has been demonstrated to exhibit a strong positive correlation with these parameters (Pearson correlation coefficients of 0.92, 0.89, and 0.52, respectively). In light of the practical imperatives inherent to additive manufacturing processes and the necessity to streamline the intricacies of multi-objective optimization algorithms, thereby reducing computation time, this study proposes the adoption of bead width, height, and depth as the multi-objective optimization objectives.

3.3. Machine Learning Modeling

Figure 6 shows a comparison of the prediction performance of the SVR, XGBoost, and BPNN models on the training and test sets for the bead width. The diagonal line represents the data predicted using the ideal model. As can be seen from the figure, the data in the training and test sets are close to the diagonal line. It can be seen from the figure that the three machine learning models generally fit the bead width well, although some individual points show large differences between the actual and predicted values, which may be related to the algorithm’s inability to adequately respond to local outliers in the overall trend or an imbalance in the sample distribution of the dataset. To select the optimal bead width prediction model, the three machine learning models were evaluated, and their prediction accuracy on the bead width test set is shown in Table 3. The BPNN model achieved the highest prediction accuracy and fitting degree, with an R2 of 0.955 and an RMSE of 0.114 mm, while the XGBoost model demonstrated similarly high accuracy and goodness of fit, with an R2 of 0.949 and an RMSE of 0.122 mm. The SVR model performed significantly worse than the other two models in terms of accuracy and goodness of fit, with an R2 of 0.926 and an RMSE of 0.147 mm. Taking into account the model’s generalization ability, the BPNN model was selected as the bead width prediction model.
Figure 7 illustrates how the SVR, XGBoost, and BPNN models perform in predicting bead height in the training and test sets. As can be seen from the figure, the data in the training and test sets are close to the diagonal line. It can be seen from the figure that all three machine learning models fit the bead height data well, with an R2 value exceeding 0.9, indicating excellent overall fitting ability. To select the optimal bead width prediction model, the three machine learning models were evaluated, and their prediction accuracy on the bead width test set is shown in Table 4. The BPNN model achieved the highest prediction accuracy and fit, with R2 reaching 0.949 and RMSE reaching 0.069 mm, while the XGBoost model exhibited a similarly high level of accuracy and fitting degree, with R2 reaching 0.946 and RMSE reaching 0.071 mm. The SVR model shows significantly lower accuracy and fitting degree than the previous two models, with R2 at 0.912 and RMSE at 0.090 mm. Considering the models’ generalization ability, the BPNN model was selected as the bead height prediction model.
Figure 8 illustrates the predictive capabilities of the SVR, XGBoost, and BPNN models on the training and test sets with respect to bead depth. As can be seen from the figure, the data in the training and test sets are close to the diagonal line, and the three machine learning models generally perform well in fitting the bead depth, with R2 values exceeding 0.9. Table 5 shows the prediction accuracy of the three models on the test set for bead depth. The BPNN model has the highest prediction accuracy and fitting quality, with R2 reaching 0.962 and RMSE reaching 0.132 mm, while the SVR model exhibits high prediction accuracy and quality of fit, with R2 reaching 0.959 and RMSE reaching 0.137 mm. In contrast, the XGBoost model shows significantly lower accuracy and fitting quality, with an R2 of 0.940 and an RMSE of 0.165 mm. Taking into account the models’ generalization ability, the BPNN model was selected as the prediction model for bead depth.
In order to further verify the applicability of machine learning algorithms without predicting targets, area predictions were also made, with the prediction model not being used as target optimization input. Figure 9 illustrates the predictive capabilities of the SVR, XGBoost, and BPNN models on the training and test sets for bead area. As can be seen from the figure, the data in the training and test sets are close to the diagonal line, and the three machine learning models generally perform well in fitting the bead area, with R2 values exceeding 0.95. Table 6 shows the prediction accuracy of the three models on the bead area test set. The XGBoost model has the highest prediction accuracy and R2 value, with R2 reaching 0.974 and RMSE reaching 0.283 mm2. The SVR model follows with an R2 of 0.967 and RMSE of 0.315 mm2. The BPNN model lags slightly behind the first two with an R2 value of 0.964 and an RMSE value of 0.329 mm2. Taking into account the model’s generalization ability, the XGBoost model was selected as the prediction model for bead area.
In summary, the R2 values of the three machine learning algorithms, SVR, XGBoost, and BPNN, are all greater than 90%, which proves that machine learning models are indeed suitable for predicting the geometric shape of additive manufacturing deposition beads. Due to the varying performance of different machine learning models when processing datasets, this study employed the BPNN model to predict bead width, height, and depth, and the XGBoost model to predict bead area.

3.4. Multi-Objective Optimization of Process Parameters

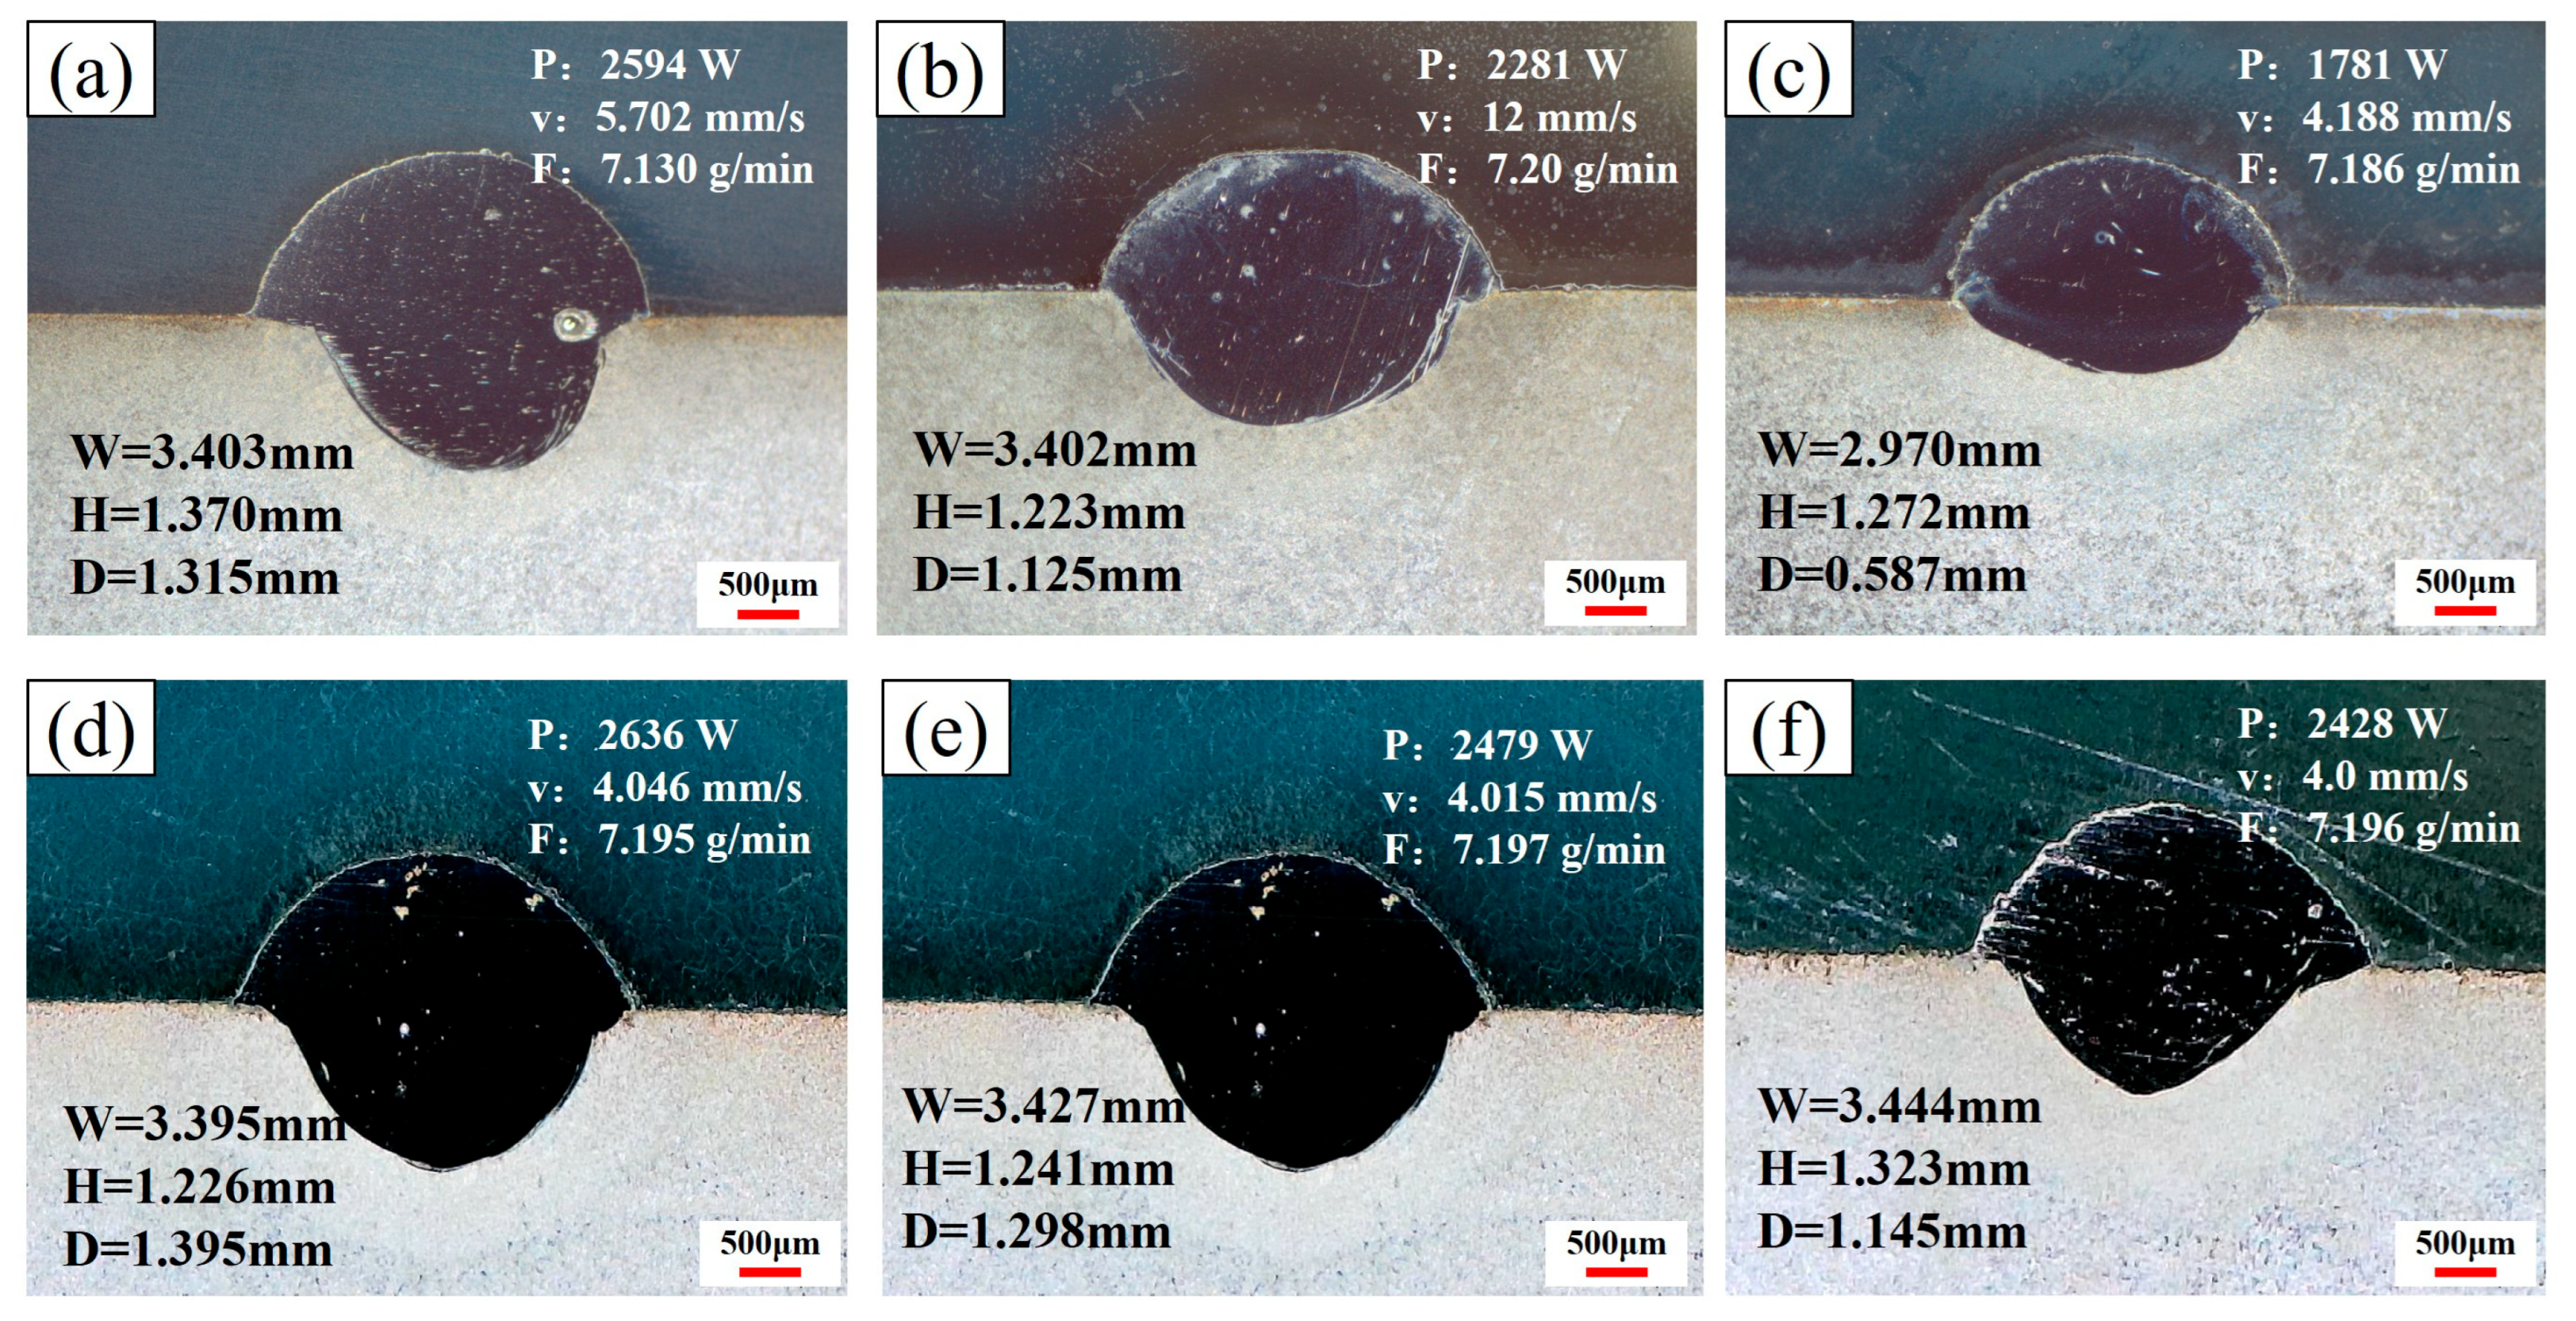
Figure 10 shows the optimal process parameter solutions for maximizing bead width and height while minimizing depth. As can be seen in the figure, there are 100 solution sets uniformly distributed on the Pareto front. In multi-objective optimization problems, each solution set represents an optimization scheme that cannot be dominated by other solution sets. This reflects the trade-offs between different objectives. To verify the accuracy of the model optimization results, experimental verification was conducted in this study. As shown in Figure 10c, based on curvature analysis of the Pareto frontier, the Pareto front has an inflection point, which was selected for verification. Similarly, two additional points were selected to form the verification set. The process parameter values of the verification set were obtained by denormalizing using the inverse_transform() function. Experiments were conducted using these values, and the geometric dimensions of the deposited layer cross-section were measured.
The cross-sectional metallographic images of the verification set deposition beads are displayed in Figure 11, wherein the bead width, bead height, and bead depth were meticulously measured. The experimental results were then compared to the predictions derived from the machine learning model, thus validating the accuracy of the latter. As illustrated in Table 7, a comparison is presented between the output quality characteristics as predicted by the model and the experimental values obtained under the optimal process parameters. The results demonstrate that the relative errors of bead width and bead depth are all controlled within 5% under the six process conditions, with only the height error in the first group reaching 5.34%. This may be attributed to underfitting of the model in specific regions and random errors caused by melt pool fluctuations during laser additive manufacturing, but the model has good overall prediction accuracy. The machine learning and multi-objective optimization algorithm proposed in this study has been shown to be highly effective in predicting and optimizing the geometric morphology of laser additive manufacturing deposition beads, as evidenced by the low error rate.

4. Conclusions

This study pioneered an integrated ML-NSGA-II framework for predicting and optimizing bead geometry in Inconel 690 laser-directed energy deposition (L-DED). Key findings include the following:
(1)
Strong process-geometry correlations: Laser power positively correlated with bead width (r = 0.82), depth (r = 0.85), and area (r = 0.73); powder feed rate correlated with height (r = 0.70); travel speed showed negative correlations (−0.47~−0.58).
(2)
Hybrid ML model superiority: BPNN achieved optimal prediction for width (R2 = 0.955), height (R2 = 0.949), and depth (R2 = 0.962), while XGBoost excelled in area prediction (R2 = 0.974), collectively forming a high-precision prediction system.
(3)
Validation of Pareto solutions: NSGA-II generated 100 optimized parameter sets, with experimental verification confirming ≤5% error for width/depth and a maximum error of 5.34% for height.
The framework establishes an effective data-driven optimization pathway for nuclear-grade L-DED applications. Future work will expand the model to incorporate auxiliary process parameters (spot size, gas flow, incidence angle, modulation frequency, etc.) and mechanical properties (hardness, strength, defects, etc.), with transfer learning applications targeting nuclear dissimilar-material welding and turbine blade repair.

Author Contributions

Conceptualization, C.L. (Chen Liu) and C.L. (Changsheng Liu); methodology, C.L. (Chen Liu); software, C.L. (Chen Liu) and J.L.; validation, C.L. (Chen Liu) and J.L.; formal analysis, C.L. (Chen Liu) and S.S.; investigation, C.L. (Chen Liu) and X.Y.; resources, C.L. (Chen Liu) and X.Y.; data curation, C.L. (Chen Liu) and S.S.; writing—original draft preparation, C.L. (Chen Liu) and X.Z.; writing—review and editing, C.L. (Chen Liu) and X.Z.; visualization, X.Z.; supervision, C.L. (Changsheng Liu) and S.S.; project administration, C.L. (Changsheng Liu); funding acquisition, C.L. (Changsheng Liu). All authors have read and agreed to the published version of the manuscript.

Funding

This study was financially supported by the Joint Funds of NSFC-Liaoning (Grant No. U1508213).

Data Availability Statement

The original contributions presented in this study are included in the article. Further inquiries can be directed to the corresponding author.

Conflicts of Interest

The authors declare no conflicts of interest.

References

  1. Debroy, T.; Wei, H.L.; Zuback, J.S.; Mukherjee, T.; Elmer, J.W.; Milewski, J.O.; Beese, A.M.; Wilson-Heid, A.; De, A.; Zhang, W. Additive manufacturing of metallic components—Process, structure and properties. Prog. Mater. Sci. 2018, 92, 112–224. [Google Scholar] [CrossRef]
  2. Srivastava, M.; Rathee, S.; Patel, V.; Kumar, A.; Koppad, P.G. A review of various materials for additive manufacturing: Recent trends and processing issues. J. Mater. Res. Technol. 2022, 21, 2612–2641. [Google Scholar] [CrossRef]
  3. Li, Z.; Sui, S.; Ma, X.; Tan, H.; Zhong, C.; Bi, G.; Clare, A.T.; Gasser, A.; Chen, J. High deposition rate powder- and wire-based laser directed energy deposition of metallic materials: A review. Int. J. Mach. Tools Manuf. 2022, 181, 103942. [Google Scholar] [CrossRef]
  4. Saito, S.; Baba, S.; Kinoshita, K.; Takada, N.; Someya, S. Thermal–hydraulic performance of additively manufactured crossflow minichannel heat exchangers. Appl. Therm. Eng. 2025, 274, 126543. [Google Scholar] [CrossRef]
  5. Srivastava, M.; Jayakumar, V.; Udayan, Y.; Sathishkumar, M.; Muthu, S.M.; Gautam, P.; Nag, A. Additive manufacturing of Titanium alloy for aerospace applications: Insights into the process, microstructure, and mechanical properties. Appl. Mater. Today 2024, 41, 102481. [Google Scholar] [CrossRef]
  6. Palaniappan, S.; Joshi, S.S.; Sharma, S.; Radhakrishnan, M.; Krishna, K.V.M.; Dahotre, N.B. Additive manufacturing of FeCrAl alloys for nuclear applications—A focused review. Nucl. Mater. Energy 2024, 40, 101702. [Google Scholar] [CrossRef]
  7. Jiang, D.; Thissen, H.; Hughes, T.C.; Yang, K.; Wilson, R.; Murphy, A.B.; Nguyen, V. Advances in additive manufacturing of auxetic structures for biomedical applications. Mater. Today Commun. 2024, 40, 110045. [Google Scholar] [CrossRef]
  8. Gao, G.; Wang, Y.; Wang, Y.; Zhang, K.; Xiang, D.; Ma, J. Development on shape and performance control of aeronautical parts in additive manufacturing. J. Manuf. Process. 2025, 141, 351–374. [Google Scholar] [CrossRef]
  9. Veiga, F.; Suarez, A.; Aldalur, E.; Artaza, T. Wire arc additive manufacturing of invar parts: Bead geometry and melt pool monitoring. Measurement 2022, 189, 110452. [Google Scholar] [CrossRef]
  10. Afshari, M.; Khandaei, M.; Farzadi, A.; Razavi, R.S.; Barekat, M.; Rezaei, M. A new approach to evaluation of bead geometry and cladded layer in laser additive manufacturing of Inconel 718 using the experimental design, inverse analysis and numerical simulation. Opt. Laser Technol. 2025, 184, 112464. [Google Scholar] [CrossRef]
  11. Chigilipalli, B.K.; Veeramani, A. An experimental investigation and neuro-fuzzy modeling to ascertain metal deposition parameters for the wire arc additive manufacturing of Incoloy 825. CIRP J. Manuf. Sci. Technol. 2022, 38, 386–400. [Google Scholar] [CrossRef]
  12. Shen, Q.; Xue, J.; Zheng, Z.; Yu, X.; Ou, N. Machine learning-based prediction of CoCrFeNiMo0.2 high-entropy alloy weld bead dimensions in wire arc additive manufacturing. Mater. Today Commun. 2024, 41, 110359. [Google Scholar] [CrossRef]
  13. Li, R.; Ma, H.; Zeng, K.; Suo, H.; Li, C.; Fu, Y.; Zhang, M.; Zhang, M.; Fang, X. Differential Evolution-Optimized Multi-Output Support Vector Regression-Based Prediction of Weld Bead Morphology in Wire-Fed Laser-Arc Directed Energy Deposition of 2319 Aluminum Alloy. Addit. Manuf. Front. 2025, 4, 200203. [Google Scholar] [CrossRef]
  14. Lee, J.A.; Sagong, M.J.; Jung, J.; Kim, E.S.; Kim, H.S. Explainable machine learning for understanding and predicting geometry and defect types in Fe-Ni alloys fabricated by laser metal deposition additive manufacturing. J. Mater. Res. Technol. 2023, 22, 413–423. [Google Scholar] [CrossRef]
  15. Wang, J.; Feng, L.; Xu, J.; Zha, X.; Cui, Y.; Li, K.; Xie, T. Optimal process parameter combinations search for desired deposited layer geometry in laser-arc hybrid additive manufacturing based on multi-pass overlapping deposited layer contour prediction model and improved NSGA-II algorithm. Opt. Laser Technol. 2025, 187, 112700. [Google Scholar] [CrossRef]
  16. Chen, K.; Jiang, X.; Liu, W.; Zhang, F.; Liu, A.; Xu, X.; Song, B.; Xi, W.; Bian, H.; Yang, G. A novel multi-objective optimization of high-power laser directed energy deposition green processes: A case study of titanium alloy. J. Clean. Prod. 2025, 494, 144877. [Google Scholar] [CrossRef]
  17. Aghaei, H.; Larki, H.A.; Taqizadeh, M.; Aoudia, M.; Aich, W.; Kolsi, L.; Dehkordi, M.H.R. Multi- objective modeling and optimization of dissimilar laser welding by integrating an artificial intelligence predictive model with NSGA-II algorithm. Mater. Today Commun. 2024, 40, 109765. [Google Scholar] [CrossRef]
  18. Panico, A.; Corvi, A.; Collini, L.; Sciancalepore, C. Multi objective optimization of FDM 3D printing parameters set via design of experiments and machine learning algorithms. Sci. Rep. 2025, 15, 16753. [Google Scholar] [CrossRef]
  19. Yu, A.; Pan, Y.; Wan, F.; Kuang, F.; Lu, X. Multi-objective optimization of laser powder bed fused titanium considering strength and ductility: A new framework based on explainable stacking ensemble learning and NSGA-II. J. Mater. Sci. Technol. 2025, 228, 241–255. [Google Scholar] [CrossRef]
  20. Kim, J.; Kim, J.; Park, J.; Baek, S.; Ma, N.; Lee, S.; Kim, D. Continuous tempering effect induced PWHT alternative technology using wire arc additive manufacturing for application in replacing nuclear pressurized water reactor system repairing: CALPHAD, FEM simulation, and EBSD investigation. J. Mater. Res. Technol. 2023, 25, 2961–2988. [Google Scholar] [CrossRef]
  21. Zhong, Y.; Zheng, Z.; Li, J.; Wang, C. Fabrication of 316L nuclear nozzles on the main pipeline with large curvature by CMT wire arc additive manufacturing and self-developed slicing algorithm. Mater. Sci. Eng. A 2021, 820, 141539. [Google Scholar] [CrossRef]
  22. Jeong, S.G.; Kim, E.S.; Ahn, S.Y.; Chun, J.H.; Ryu, J.Y.; Woo, H.G.; Yoo, S.H.; Kang, S.H.; Kim, H.S. Prototyping of nuclear fuel assembly parts by laser powder bed fusion of Inconel 718. Prog. Nucl. Energy 2025, 184, 105694. [Google Scholar] [CrossRef]
  23. Wang, J.; Zhao, B.; Liu, Y.; Zhao, J.; Ma, G. Research Progress in Shape-Control Methods for Wire-Arc-Directed Energy Deposition. Materials 2024, 17, 5704. [Google Scholar] [CrossRef]
  24. Edelmann, D.; Móri, T.F.; Székely, G.J. On relationships between the Pearson and the distance correlation coefficients. Stat. Probab. Lett. 2021, 169, 108960. [Google Scholar] [CrossRef]
Figure 1. (a) SEM morphology of Inconel 690 alloy powder; (b) powder particle size distribution diagram.
Metals 15 00905 g001
Figure 2. Schematic diagram of a laser direct energy deposition system.
Metals 15 00905 g002
Figure 3. Cross-sectional morphology of laser-deposited single bead.
Metals 15 00905 g003
Figure 4. Macrographic morphology of bead cross-sections prepared using different processing parameters.
Metals 15 00905 g004
Figure 5. Pearson correlation coefficient matrix between process parameters and bead geometry.
Metals 15 00905 g005
Figure 6. Comparison of prediction accuracy of different machine learning models for bead width: (a) SVR model; (b) XGBoost model; (c) BPNN model.
Metals 15 00905 g006
Figure 7. Comparison of prediction accuracy of different machine learning models for bead height: (a) SVR model; (b) XGBoost model; (c) BPNN model.
Metals 15 00905 g007
Figure 8. Comparison of prediction accuracy of different machine learning models for bead depth: (a) SVR model; (b) XGBoost model; (c) BPNN model.
Metals 15 00905 g008
Figure 9. Comparison of prediction accuracy of different machine learning models for bead area: (a) SVR model; (b) XGBoost model; (c) BPNN model.
Metals 15 00905 g009
Figure 10. (a) Pareto solution set obtained by the NSGA-II algorithm; (bd) Projection of the Pareto frontier onto (b) the depth/height plane; (c) the depth/width plane; (d) the height/width plane.
Metals 15 00905 g010
Figure 11. Metallographic microstructure of the deposition path in the verification test: (a) No. 1; (b) No. 2; (c) No. 3; (d) No. 4; (e) No. 5; (f) No. 6.
Metals 15 00905 g011
Table 1. Chemical composition of the powder and substrate (wt.%).
MaterialCNiCrFeMnSi
Inconel 6900.02Bal.29.89.860.0530.20
1045 steel0.450.150.15Bal.0.70.27
Table 2. Process parameters for L-DED.
Process Parameters (Symbol, Unit)Values
Laser power (P, W)1200, 1800, 2400, 3000
Travel speed (v, mm/s)4, 6, 8, 10, 12
Powder feed rate (F, g/min)1.8, 3.6, 5.4, 7.2
Laser spot diameter (d, mm)4
Argon gas flux (Q, L/min)20
Table 3. Comparison of the performance metrics of three machine learning algorithms for bead width.
ModelMAERMSER2Hyperparameter
SVR0.1230.1470.926kernel = rbf, C = 10, ε = 0.05
XGBoost0.0990.1220.949Booster = gbtree, n_estimators = 250, learning_rate = 0.01, max_depth = 5
BPNN0.0860.1140.955Neurons = 64, learning_rate = 0.01, epochs = 300, batch_size = 2
Table 4. Comparison of the performance metrics of three machine learning algorithms for bead height.
ModelMAERMSER2Hyperparameter
SVR0.0720.0900.912kernel = rbf, C = 1, ε = 0.05
XGBoost0.0610.0710.946Booster = gbtree, n_estimators = 400, learning_rate = 0.01, max_depth = 5
BPNN0.0520.0690.949Neurons = 132, learning_rate = 0.01, epochs = 200, batch_size = 8
Table 5. Comparison of the performance metrics of three machine learning algorithms for bead depth.
ModelMAERMSER2Hyperparameter
SVR0.1080.1370.959kernel = linear, C = 10, ε = 0.05
XGBoost0.1170.1650.940Booster = gblinear, n_estimators = 1000, learning_rate = 0.05, max_depth = 5
BPNN0.0970.1320.962Neurons = 128, learning_rate = 0.01, epochs = 100, batch_size = 4
Table 6. Comparison of the performance metrics of three machine learning algorithms for bead area.
ModelMAERMSER2Hyperparameter
SVR0.2560.3150.967kernel = rbf, C = 10, ε = 0.05
XGBoost0.2210.2830.974Booster = gbtree, n_estimators = 300, learning_rate = 0.05, max_depth = 5
BPNN0.2790.3290.964Neurons = 32, learning_rate = 0.01, epochs = 200, batch_size = 1
Table 7. Comparison of predicted and actual values for the optimized process.
SampleTargetPredicted ValueActual ValueError
1Width3.4223.4030.50%
Height1.3041.3704.82%
Depth1.3751.3154.56%
2Width3.2763.4023.70%
Height1.2891.2235.34%
Depth1.0131.1253.55%
3Width3.0962.9704.24%
Height1.2801.2720.63%
Depth0.5690.5873.07%
4Width3.444 3.395 1.43%
Height1.306 1.266 3.18%
Depth1.432 1.395 2.69%
5Width3.378 3.427 1.44%
Height1.299 1.241 4.69%
Depth1.238 1.298 4.64%
6Width3.356 3.444 2.56%
Height1.297 1.323 1.97%
Depth1.180 1.145 3.08%
Disclaimer/Publisher’s Note: The statements, opinions and data contained in all publications are solely those of the individual author(s) and contributor(s) and not of MDPI and/or the editor(s). MDPI and/or the editor(s) disclaim responsibility for any injury to people or property resulting from any ideas, methods, instructions or products referred to in the content.