Abstract
During electron beam cold hearth melting (EBCHM) of Ti-6wt%Al-4wt%V titanium alloy, aluminum volatilization causes compositional segregation in the ingot, significantly degrading material performance. Traditional methods (e.g., the Langmuir equation) struggle to accurately predict aluminum diffusion and compensation behaviors, while computational fluid dynamics (CFD), although capable of resolving multiphysics fields in the molten pool, suffer from high computational costs and insufficient research on segregation control. To address these issues, this study proposes a CFD-machine learning (backpropagation neural network, CFD-ML(BP)) approach to achieve precise prediction and optimization of aluminum segregation. First, CFD simulations are performed to obtain the molten pool’s temperature field, flow field, and aluminum concentration distribution, with model reliability validated experimentally. Subsequently, a BP neural network is trained using large-scale CFD datasets to establish an aluminum concentration prediction model, capturing the nonlinear relationships between process parameters (e.g., casting speed, temperature) and compositional segregation. Finally, optimization algorithms are applied to determine optimal process parameters, which are validated via CFD multiphysics coupling simulations. The results demonstrate that this method predicts the average aluminum concentration in the ingot with an error of ≤3%, significantly reducing computational costs. It also elucidates the kinetic mechanisms of aluminum volatilization and diffusion, revealing that non-monotonic segregation trends arise from the dynamic balance of volatilization, diffusion, convection, and solidification. Moreover, the most uniform aluminum distribution (average 6.8 wt.%, R2 = 0.002) is achieved in a double-overflow mold at a casting speed of 18 mm/min and a temperature of 2168 K.
1. Introduction
With the rapid advancement of modern industrial technology, the performance limitations of traditional metallic materials have become increasingly apparent [1]: ferrous materials exhibit insufficient corrosion resistance [2,3]; aluminum alloys face challenges of low strength and susceptibility to softening [4]; magnesium alloys not only demonstrate suboptimal mechanical properties but also possess flammable characteristics [5]; while titanium metals are constrained by difficult processing, high costs, and mediocre wear resistance [6]. To overcome these material bottlenecks, innovative developments in alloy technology have provided crucial solutions for the performance optimization of metallic materials. Currently, various alloy materials have demonstrated unique application value across different fields: reinforced steel bars are widely employed as primary structural materials in construction engineering [7]; owing to their exceptional strength-to-weight ratio, aluminum alloys have found extensive applications in aerospace (e.g., aircraft fuselage manufacturing) and automotive lightweight design [8]; magnesium alloys, due to their ultralight properties, are extensively used in portable electronic products (e.g., laptop casings) and automotive wheel manufacturing, while also showing great potential in biodegradable medical materials [9]; and titanium alloys with outstanding comprehensive performance [10], particularly Ti-6wt%Al-4wt%V [11,12], have become indispensable key materials in high-end manufacturing sectors such as aircraft engines [13], owing to their high strength [14], low density [15], and excellent corrosion resistance [16]. With the rapid development of materials science and continuous optimization of processing technologies, there is an increasing demand for larger dimensional specifications of Ti-6wt%Al-4wt%V ingots [17]. The preparation technology for large-scale aluminum-based titanium alloy ingots has emerged as a key research focus in the current materials field [18].
Computational Fluid Dynamics (CFD) has achieved remarkable results in the field of metal processing, providing a powerful tool for revealing process mechanisms and optimizing production. For example, in the field of welding, Ebrahimi et al. [19] systematically studied the flow field characteristics of the molten pool under different groove shapes through CFD simulations, clarified the influence mechanism of groove structure on molten pool fluidity and weld forming quality, and provided a theoretical basis for the optimization of welding process parameters. In terms of casting defect detection, Namchanthra et al. [20] accurately simulated the flow and heat transfer laws of molten iron during the casting process of cast iron pipes by using CFD technology combined with the split tracking method, revealed the fluid dynamic roots of defects such as shrinkage cavities and blowholes, and laid a foundation for the early prediction of casting defects and process improvement. In the field of titanium alloy processing, Varman et al. [21] comprehensively analyzed the temperature field, flow field, and solidification behavior of the molten pool during the cold hearth continuous casting process by establishing a CFD model, optimized key parameters such as casting speed and cooling intensity, and effectively improved the composition uniformity and mechanical properties of the ingot. These studies fully demonstrate the significant advantages of CFD in revealing the complex physical mechanisms of metal processing processes and optimizing process parameters.
Currently, there are three primary technologies for melting aluminum-based titanium alloys such as Ti-6wt%Al-4wt%V [22,23]: vacuum arc remelting (VAR) [24], plasma arc melting (PAM) [25], and electron beam cold hearth melting (EBCHM) [26]. Among these, VAR technology exhibits significant limitations—it can only produce round ingots and has restricted capability in removing both high- and low-density inclusions from titanium alloys [27]. Even with multiple remelting processes, complete elimination of impurity defects remains challenging [24,28]. Although PAM technology [29] improves melting quality through high-energy plasma beams, it requires substantial consumption of expensive inert gases like argon, resulting in prohibitively high production costs [30]. In contrast, EBCHM demonstrates remarkable advantages: it can produce not only special-shaped ingots (including slab ingots and hollow ingots) but also large titanium alloy ingots up to 8 m in length and exceeding 20 tons in weight, while simultaneously maintaining exceptional capability in removing various types of inclusions [31]. Owing to these technical superiorities, EBCHM has emerged as the mainstream process for manufacturing large titanium alloy ingots, particularly dominating the field of large-scale, high-performance titanium alloy melting [32].
However, during the EBCHM process of aluminum-based titanium alloys, the volatilization of the alloying element aluminum is inevitable [33], leading to macrosegregation in the final ingot and, in extreme cases, causing the ingot composition to deviate from the designed alloy specification [34]. The primary mechanism of segregation stems from the temperature-dependent increase in saturated vapor pressure of alloying elements like aluminum (Al), resulting in continuous evaporation from the molten pool surface—with approximately 30% of the initially added aluminum content being lost through volatilization [35]. Consequently, additional alloying elements must be incorporated into the raw materials to compensate for these evaporation losses [36,37]. To determine appropriate compensation amounts, some studies have employed the Langmuir equation to predict ideal volatilization quantities [38]. However, predictions based solely on the Langmuir equation can only provide macroscopic estimates of required supplementation; they fail to predict the diffusion behavior of compensation elements within the molten pool, thereby making it difficult to control elemental segregation [39,40].
Numerical simulation can provide intuitive visualization of actual processes, facilitating refined analysis and optimization of process parameters while significantly reducing experimental requirements [41,42]. Currently, numerical simulation has been widely applied to control and evaluate the EBCHM casting process [43]. Peng et al. [44] established a temperature field and microstructure simulation for the EBCHM process of Ti-6wt%Al-4wt%V alloy round ingots using the Cellular Automaton Finite Element (CAFE) method. Zhu et al. [45] developed a multiphysics coupling model for the EBCHM casting of Ti-0.3wt%Mo-0.8wt%Ni alloy slabs, investigating the effects of casting speed and pouring temperature on flow fields. Shuster et al. [46] created a coupled thermal-fluid-composition model focusing on the final stage of EBCHM, examining temperature distribution, fluid flow, and composition fields in Ti-6wt%Al-4wt%V ingots. Akhonin et al. [43] developed a kinetic model for Al evaporation during electron beam cold hearth melting of titanium alloys, studying the diffusion of Al to the melt surface, chemical reactions between the melt and surface gas phase, and the process of Al entering the vacuum chamber. Wang et al. [47] established a thermal-fluid coupling model for the cold hearth refining process in EBCHM, investigating the effects of smelting process parameters on molten pool morphology, temperature fields, and flow fields. These studies encompass the effects of microstructure, flow field distribution, and process parameters on final ingots for large-scale titanium and titanium alloy ingots, but research related to element segregation control during electron beam cold hearth melting remains relatively scarce [22].
CFD simulation requires substantial computational resources when solving precise equations for complex industrial processes and often needs considerable time to converge [48]. Machine learning (ML) can extract effective features from complex datasets and make accurate predictions; therefore, numerous studies have adopted ML for parameter prediction and optimization [49]. Li et al. [50] used ML algorithms to predict the FeO content and tumbler strength of sintered ore, obtaining optimal operating parameters through multi-criteria evaluation, which directly reduced fuel consumption by 0.5 kg/t of sintered ore after optimization. Nguyen et al. [51] combined genetic algorithms with CFD models to optimize the structure of pin-fin arrays in cooling channels, resulting in a 20% improvement in the heat transfer coefficient of the optimized fins. Chen et al. [52] employed semi-supervised linear-nonlinear least squares learning networks to predict carbon efficiency in the sintering process and validated the method’s effectiveness using production data. Among machine learning techniques, artificial neural networks possess prominent advantages such as self-adaptation, self-learning, nonlinear mapping, and high fault tolerance [53], making them important research tools. With the rapid development of artificial intelligence (AI) technology, artificial neural network models have been deeply integrated with various fields including internal combustion engines, combustion science, fluid mechanics, and thermal energy engineering, providing new perspectives for solving complex engineering problems [54,55]. Currently, both supervised and unsupervised machine learning methods have been successfully applied to various tasks such as classification, regression, or clustering [56,57]. Particularly, methods based on backpropagation (BP) neural networks have proven highly effective in solving many complex nonlinear problems [58]. BP neural networks represent an important branch of artificial neural networks, which update the weights and biases of the network through backpropagation of errors between predicted and actual values. Compared with other neural networks, BP neural networks have significant advantages such as simple structure, efficient training, and strong versatility. Their feedforward structure and error backpropagation mechanism enable them to quickly fit nonlinear relationships, making them particularly suitable for handling static data, such as numerical prediction tasks. Compared with convolutional neural networks or LSTMs, BP networks have faster training speeds, lower computational resource consumption, a lower implementation threshold, and are easier to debug and optimize. For problems such as data prediction and image classification, BP networks are often the lightweight and efficient first choice. In BP networks, data signals propagate unidirectionally from the input layer to the output layer, with neurons in adjacent layers fully connected, and the model is trained through the backpropagation algorithm to learn the underlying relationships between inputs and outputs [59]. Cui et al. [55] established a prediction model for the ignition delay of three-component surrogate fuels based on BP neural networks, improving prediction accuracy through genetic algorithms and particle swarm optimization while achieving accurate predictions of research octane number (RON) and motor octane number (MON). Liu et al. [60] constructed a flight accident prediction model using historical flight data (such as meteorological conditions and aircraft technical status) based on BP neural networks, experimentally validating the high accuracy and reliability of BP. Wright et al. [61] proposed a physics-aware training method (PAT) based on the BP algorithm, successfully training deep physical neural networks (PNN) composed of optical, mechanical, and electronic systems, and achieving efficient audio and image classification tasks. Additionally, the BP neural network geotechnical parameter prediction model developed by Cui’s team [62] and the hybrid forecasting method combining BP neural networks with seasonal exponential adjustment proposed by Guo et al. [63] have achieved remarkable results in their respective fields. Therefore, neural network models based on the backpropagation (BP) algorithm can guide industrial production.
Existing studies on electron beam cold hearth melting (EBCHM) of Ti-6wt%Al-4wt%V have significant limitations: single-physics simulations fail to capture the complex mechanisms of aluminum segregation, traditional Langmuir equations cannot accurately predict aluminum diffusion, and pure CFD simulations are computationally expensive. While machine learning has been applied in materials processing, its integration with high-precision CFD data to address aluminum distribution prediction in EBCHM remains unexplored. To address these gaps, this study innovatively proposes a CFD-ML(BP) coupling framework that combines high-fidelity CFD simulations (using Fluent) with a BP neural network to model the nonlinear relationships between process parameters and segregation. This approach overcomes the efficiency bottleneck of pure CFD (reducing prediction time by two orders of magnitude with ≤3% error) and the inaccuracy of traditional models. The method is implemented in three stages: (1) CFD analysis of parameter effects validated by experiments, (2) machine learning model development using a comprehensive CFD dataset, and (3) CFD-based multiphysics visualization of predicted results. For the first time, this study reveals the dynamic equilibrium mechanism (volatilization-diffusion-convection-solidification) underlying non-monotonic segregation trends, filling a critical gap in mechanistic understanding. Optimal process parameters (double-overflow mold, 18 mm/min casting speed, 2168 K) are determined through dual validation, providing actionable industrial guidelines. The framework leverages big data diversity to enhance model generalization, captures complex nonlinear interactions, and enables systematic parameter optimization, thereby advancing both theoretical understanding of aluminum segregation and practical process control in EBCHM.
2. Details of CFD Model Translation
2.1. Model Assumptions
In actual EBCHM melting processes, both equipment operation and involved transport phenomena are relatively complex. To establish mathematical models, appropriate simplifications are required. The assumptions are as follows:
- The temperature at the molten pool surface is assumed to be uniformly constant due to the application of appropriate electron beam scanning patterns and frequencies.
- The effects of strand curvature, mold oscillation, mold powder, mold taper, and mold gap are neglected.
- Local thermodynamic equilibrium dominates during the solidification process.
2.2. Governing Equations
The electron beam cold hearth melting (EBCHM) process involves multiple key physical processes, including the phase transformation behavior of metallic materials, mass and heat transfer mechanisms under multiphysics coupling effects, and dynamic volatilization characteristics of elements at the free surface of the molten pool. The numerical simulation system constructed in this study integrates solidification/melting phase transformation models and component transport models, which are used to accurately characterize the solidification kinetic characteristics during continuous ingot formation and the migration patterns of alloying elements, respectively. By introducing a molten pool surface chemical reaction module, the system investigates the influence patterns of element volatilization effects on the composition evolution of both the molten zone and solidified microstructure. Based on user-defined functions (UDF), dedicated computational modules were developed to achieve numerical characterization of dynamic process parameter control.
The key governing equations involved in this model are as follows:
- Continuity Equation:
- Momentum Equation:
The expression for the mushy zone momentum source term is as follows:
In the simulation, the mushy zone constant A_mushy is set to 105 kg/(m3·s). This value is selected based on a comprehensive consideration of the characteristics of the Ti-6wt%Al-4wt%V alloy during electron beam cold hearth melting: the mushy zone constant directly relates to momentum transfer and solute distribution in the molten pool by influencing the resistance of the mushy zone to fluid flow. Since this study aims to accurately capture the coupling effects of aluminum volatilization, diffusion, convection, and solidification for analyzing segregation mechanisms, this value can balance the simulation accuracy of convection intensity and solidification front morphology. Previous studies [64] have shown that this parameter is highly sensitive to the simulation results of solidification and melting. This study refers to the similar order of magnitude values used in relevant research on titanium alloy melting (Akhonin et al. [43], Zhang [65]). By comparing the simulation results with values of 104, 105, and 106, it is found that when A_mushy = 105 kg/(m3⋅s), the deviation between the molten pool temperature field, aluminum concentration distribution, and experimental values is the smallest (average error < 3%), and the non-monotonic segregation trend can be accurately reproduced. Therefore, this value is determined. Where denotes the mushy zone constant, represents the solid phase velocity induced by casting speed.
Energy Equation:
Component Transport Equation:
Electron beam cold hearth melting (EBCHM) process: This study introduces the convection-diffusion equation to predict the local mass fraction of each component. The basic form of this component transport equation is as follows:
where represents the net volatilization rate of component generated by chemical reactions. This form of equation requires solving for N-1 components (where N represents the total number of chemical phase components in the system’s fluid phase). In this study, we primarily consider two elements, Al and Ti, and assume the Al volatilization process is irreversible; thus N = 2. The molar volatilization rate of Al can be calculated using the forward reaction rate constant provided in reference [66] according to the following equation:
The liquid phase mass fraction and solid phase mass fraction are related through the partition coefficient as follows:
Supporting relationship:
The liquid fraction is defined as the volume ratio of liquid metal in each grid cell of the computational domain, determined by the following equation:
In the equation, the superscript represents the iteration count, is the relaxation factor (default value is 0.9), denotes the matrix coefficient of the grid cell, is the time step, is the current density, is the grid cell volume, is the latent heat, represents the current grid temperature, and * is the interface temperature. In this study, the Scheil microsegregation model is adopted, and the corresponding interface temperature [67,68] is calculated as follows:
In the equation, is the melting temperature of the alloy, represents the total number of solute elements, is the partition coefficient of the solute element Al, and is the slope of the liquidus line.
2.3. Initial Conditions and Boundary Conditions
In this study, a rectangular domain with a length of 1050 mm, a width of 220 mm, and a height of 300 mm was selected as the computational domain. Due to the exponential increase in the computational cost of the macrosegregation numerical model with the number of grid cells, a half-symmetrical domain was chosen as the computational domain. Based on the single-overflow mold, a double-overflow mold for same-side casting (Figure 1a), a triple-overflow mold for same-side casting (Figure 1b), and a quadruple-overflow mold for same-side casting (Figure 1c) were established. It is assumed that the Ti-6wt%Al-4wt%V alloy enters the computational domain at a constant speed and temperature from the overflow ports.
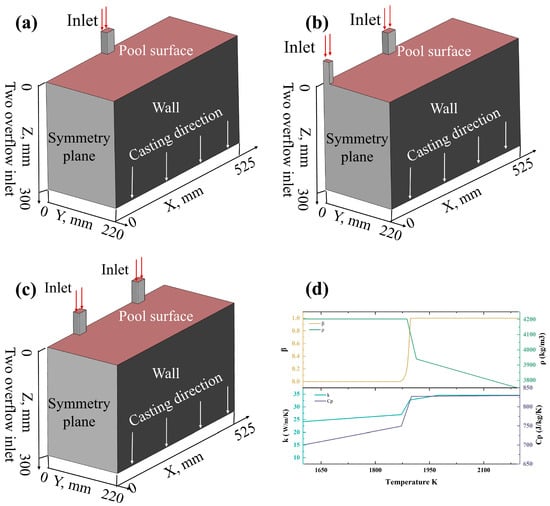
Figure 1.
(a) Double-overflow mold for same-side casting; (b) triple-overflow mold for same-side casting; (c) quadruple-overflow mold for same-side casting; (d) description of the physical properties of Ti-6wt%Al-4wt%V in this numerical model.
In the electron beam cold hearth melting simulation of this study, the initial aluminum concentration is set to 7 wt.%, a choice based on the characteristic of significant aluminum volatilization during electron beam melting. Multiple studies have shown that in the high-temperature environment of electron beam melting, aluminum in titanium-aluminum alloys undergoes obvious volatilization due to its high saturated vapor pressure. For example, the study [39] indicates that it is necessary to increase the initial content to compensate for volatilization losses. Another study [38] also confirms that when the initial aluminum content is set to around 7%, the aluminum content in the final product can stabilize within the target range. For the Ti-6wt%Al-4wt%V alloy focused on in this study, an initial aluminum concentration of 7% can effectively balance volatilization losses, ensuring that the aluminum content in the final ingot is close to the target composition of 6%, and provides an initial condition that is consistent with the actual process for accurately studying the behavior and segregation of aluminum during the melting and casting process.
The initial concentration of aluminum in the inlet and within the computational domain is 7 wt.%, and the surface temperature of the melt pool is equal to the casting temperature. The side walls are made of water-cooled copper molds with a heat transfer coefficient of 2000 W/(m2·K). At the bottom exit boundary, the solidified phase is withdrawn at a constant casting speed [69]. The computational domain consists of approximately 1.7 million hexahedral elements, with the smallest grid size being 0.1 mm3. The control equations of the mathematical model were solved using ANSYS Fluent 2021R1. A velocity inlet boundary condition was defined for the fluid inlet, the walls were treated with a no-slip boundary condition, and the surface was set as a free shear boundary. A coupled algorithm was used for pressure-velocity coupling, and the gradient, pressure, and convection discretization models were selected with the Green-Gauss Cell-Based, PRESTO, and third-order MUSCL options, respectively. The SIMPLE algorithm was employed for the coupling of the flow field, composition, and solidification. The turbulence model used was the standard k-ε turbulence model, and the species transport was modeled using a species transport model. The standard k-ε turbulence model was selected in this study, mainly based on the flow characteristics of the electron beam cold hearth melting (EBCHM) process and the research objectives: The molten pool of Ti-6wt%Al-4wt%V alloy is dominated by moderate-intensity turbulence (Reynolds number approximately 104–105). This model can effectively capture the convection coupling phenomenon driven by uneven heating and density differences, accurately reflect the turbulent diffusion laws of momentum, heat, and solutes, and is highly compatible with the core requirement of analyzing the coupling mechanism of “aluminum volatilization—convective transport—solidification segregation”. Meanwhile, compared with higher-order models such as the Reynolds Stress Model (RSM), it has higher computational efficiency and can realize multiphysics coupling simulation in a complex domain containing 1.7 million grids. It has also been verified in the simulation of titanium alloy molten pool flow. In addition, the prediction deviation of this model for the molten pool surface velocity and temperature uniformity is usually less than 5%. This study further confirmed through comparative experiments that its simulation results are in good agreement with the molten pool depth (75 mm) and aluminum concentration distribution (error ≤ 3%). If a low-Reynolds-number model or large eddy simulation (LES) is used, although it may improve the details near the wall, the computational load will increase by 3–5 times, with little impact on the macroscopic segregation trend. The residual for the energy equation was set to , while the residuals for the other control equations were set to , as shown in Table 1.

Table 1.
Parameter settings for boundary conditions.
In numerical simulations, the accurate setting of boundary conditions has a decisive impact on the computational results. However, the specific working condition settings for different cases also have a significant influence on the final simulation outcomes. For detailed working condition parameters, see Table 2.

Table 2.
Computational Cases.
The diffusion coefficient of aluminum in the molten Ti-6wt%Al-4wt%V alloy is calculated based on the data from reference [70].
The model employs the Arrhenius equation form, with an activation energy of 250 kJ/mol. During the calculation process, the diffusion coefficient of aluminum is dynamically corrected via a user-defined function. The partition coefficient of aluminum in the Ti-6wt%Al-4wt%V alloy is 1.167, which indicates that during the solidification of Ti-6wt%Al-4wt%V, the solute convection effect caused by the concentration gradient formed due to the expulsion of solute elements into the interdendritic liquid phase is not significant.
The thermophysical parameters of Ti-6wt%Al-4wt%V used in this study—including specific heat capacity , thermal conductivity , and density —are all sourced from reference [65], with the relevant calculation results shown in Figure 1d. In Figure 1d, the liquid fraction calculated based on the enthalpy-porosity method [41] is compared and validated against the benchmark data from reference [65].
2.4. Grid Independence Test
Mesh quality is a critical factor in accurately capturing fluid behavior within the molten pool and at the walls. To ensure mesh quality while balancing computational efficiency, this study implemented mesh refinement in the molten pool area and wall regions; since the lower part of the mold is in a solid state with no flow phenomenon, larger-sized meshes were used to save computational resources. The overall mesh type is hexahedral elements, and after mesh independence verification (Figure 2), the total number of meshes was finally determined to be 1,710,000.
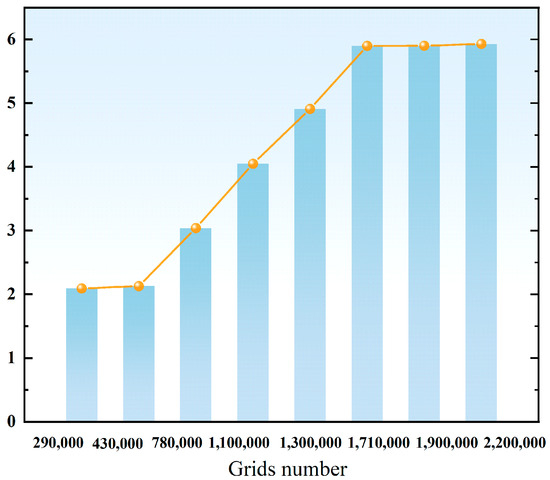
Figure 2.
Comparison of average aluminum element concentration under different mesh quantities.
The core objective of mesh independence verification is to determine the minimum number of meshes required to meet the accuracy requirements of the calculation results under the premise of optimizing computational resources. During the verification process, other parameters were kept unchanged; only the number of meshes was varied, with a focus on monitoring changes in the average concentration of aluminum in the molten pool. The results are shown in Figure 2. When the number of mesh elements is less than 1,710,000, the aluminum concentration shows a significant deviation; however, after further refining the mesh, the fluctuation range of the average aluminum concentration is extremely small. Considering both computational accuracy and resource consumption, this study ultimately selected a mesh with 1,710,000 elements for the simulation calculations.
3. Results and Discussion
3.1. Model Validation and Analysis
Model validation is an essential step to ensure that the numerical model accurately represents the actual physical processes. In this study, the solidification process of the Ti-6wt%Al-4wt%V alloy was validated using a remelting experiment in an electron beam button furnace (as shown in Figure 3). This method, which offers the advantage of precisely controllable process parameters, has been successfully applied by the research team at the University of British Columbia for the validation of an electron beam cold hearth melting model [43]. The validated model can be further extended to the simulation of electron beam cold hearth melting and casting processes for large-sized Ti-6wt%Al-4wt%V alloy ingots.
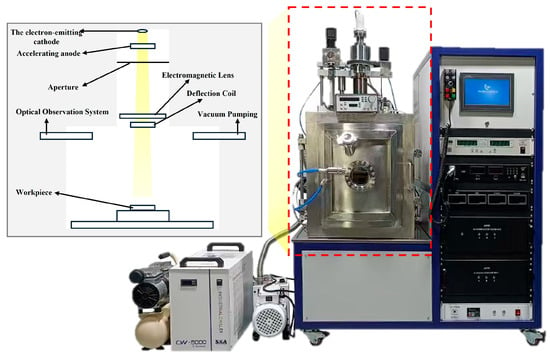
Figure 3.
Electron beam button furnace setup.
The experiment used an electron beam power of 120 W, with a cylindrical mold of diameter 40 mm and height 15 mm. To precisely control the solidification conditions, the side wall and bottom of the water-cooled copper crucible were set with heat transfer coefficients of 2000 W/(m2·K) and 1000 W/(m2·K), respectively. In the numerical simulation, the boundary conditions of the experiment were fully reproduced, including the following:
- Simulating the water-cooled copper crucible using the same heat transfer coefficients.
- Precisely controlling the electron beam power (peak value of 120 W) through user-defined functions.
- Employing 237,466 structured grids to ensure computational accuracy.
To systematically validate the reliability of the model, three characteristic positions were selected on the cross-section of the melt pool of the remelted ingot (the central symmetry axis and two positions 4 mm to either side). Five test points were set at each position, totaling 15 detection sites, as shown in Figure 4a–c. The samples were subjected to microstructural observation and compositional analysis using scanning electron microscopy (SEM) and energy-dispersive spectroscopy (EDS), as shown in Figure 5a,c,e.

Figure 4.
Model validation example, SEM: (a) 0.4 cm to the left of the symmetry plane; (b) at the symmetry plane; (c) 0.4 cm to the right of the symmetry plane.
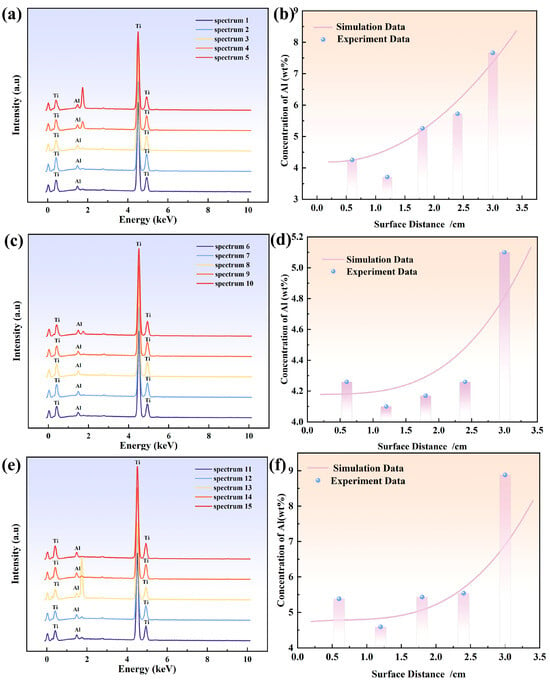
Figure 5.
Elemental EDS spectra of 5 points: (a) at 0.4 cm to the left of the symmetry plane; (c) at the symmetry plane; (e) at 0.4 cm to the right of the symmetry plane; comparison of experimental and simulated Al concentrations: (b) at 0.4 cm to the left of the symmetry plane; (d) at the symmetry plane; (f) at 0.4 cm to the right of the symmetry plane.
The model validation process lasted for 10 min, with the initial time step set at 0.001 s. Comparative analysis shows that the distribution trends of the Al element at the characteristic points are consistent (Figure 5b,d,f). These results fully demonstrate the reliability of this model in describing the key physical phenomena of electron beam melting of Ti-6wt%Al-4wt%V alloy, providing a credible theoretical basis for the subsequent process simulation of large-sized ingots.
Typical cross-sections were selected from the TC4 alloy ingot (with a diameter of 40 mm) melted by the electron beam button furnace. Sampling was conducted at three characteristic positions along the radial direction: 0.4 cm to the left of the symmetry plane, at the symmetry plane, and 0.4 cm to the right of the symmetry plane. A sample block of 10 mm × 10 mm × 5 mm was cut at each position. The samples were sequentially wet-ground with 400#, 800#, 1200#, and 2000# SiC sandpapers until there were no obvious scratches on the surface. Subsequently, they were mechanically polished to a mirror finish using 1 μm diamond paste on chamois leather. The polished samples were etched with Kroll’s reagent (HF:HNO3:H2O = 1:3:10) for 15 s, then rinsed with deionized water and dried, which allowed for clear revelation of grain boundaries and precipitated phases.
The FEI Quanta 450 field emission scanning electron microscope (FEI Company, Hillsboro, OR, USA) was used to observe the microstructure of the samples. The secondary electron imaging (SEI) mode was employed to observe the surface morphology, and the backscattered electron imaging (BSE) mode was used to analyze differences in composition distribution. The accelerating voltage was set to 15 kV, the working distance was 8 mm, and the magnification was adjusted within the range of 500–5000 times according to observation needs to clearly present the grain size, morphology, and distribution characteristics of precipitated phases.
The SEM is equipped with an Oxford X-Max 50 energy-dispersive spectrometer (Oxford Instruments, from Kunming, China) for micro-area composition analysis, sharing the 15 kV accelerating voltage with the SEM. Three modes were used for analysis: point scanning (with an analysis point diameter of approximately 1 μm and a counting time of 100 s) to determine the composition of specific micro-areas (such as precipitated phases); line scanning (with a step size of 50 nm) to analyze the composition gradient along the radial direction; and area scanning (with a resolution of 512 × 512 pixels) to observe the two-dimensional distribution of aluminum elements, thereby quantitatively characterizing the distribution characteristics of aluminum elements within grains and at grain boundaries.
The electron beam button furnace used in the experiment consists of an electron gun system, a vacuum chamber, a water-cooled copper crucible, and a temperature control system. The electron gun has a maximum output power of 120 W, and the scanning trajectory of the electron beam is controlled by electromagnetic lenses and deflection coils. The ultimate vacuum degree of the vacuum chamber reaches 5 × 10⁻⁴ Pa, ensuring a high-vacuum melting environment. The water-cooled copper crucible has a specification of 40 mm in diameter × 15 mm in height, with the heat transfer coefficients of the sidewall and bottom set to 2000 W/(m2·K) and 1000 W/(m2·K), respectively, which can precisely control the solidification rate. The furnace body is equipped with an optical observation system, enabling real-time monitoring of the molten pool morphology changes.
3.2. Analysis of Al Concentration in the Double-Overflow Mold
Figure 6a–c systematically demonstrates the effects of different process parameters on the three-dimensional distribution characteristics of the Al element in Ti-6wt%Al-4wt%V alloy ingots. By comparing the concentration distributions in three characteristic cross-sections—the melt pool region (Slice 1), the solid phase region (Slice 2), and the bottom of the mold (Slice 3)—the study reveals the regulatory patterns of process parameters on solute transport and segregation behavior.
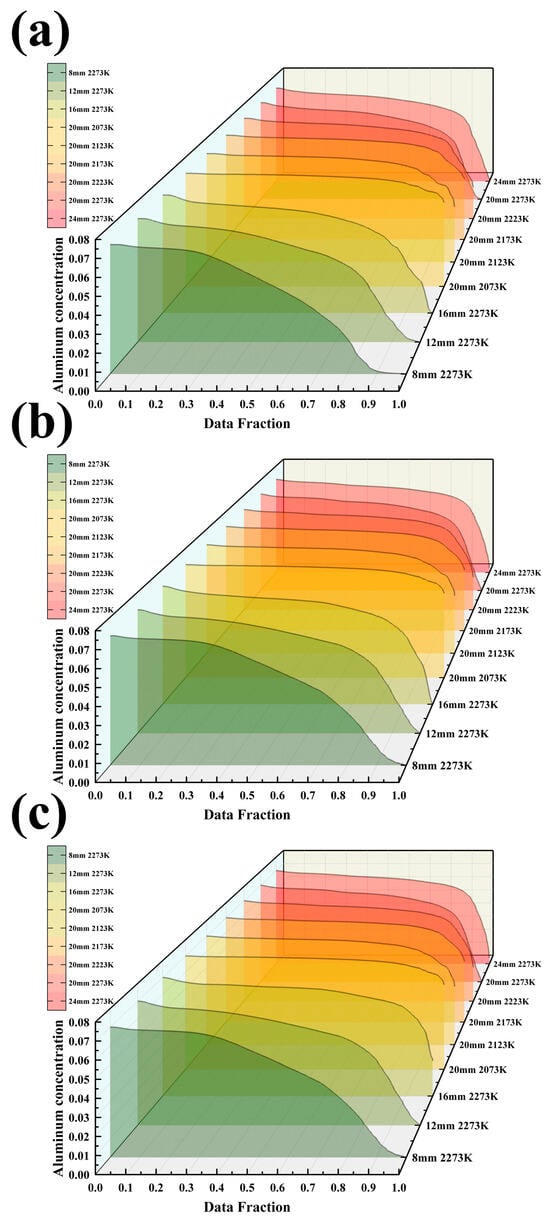
Figure 6.
(a) Al concentration in the melt pool under 9 different conditions; (b) Al concentration at Y = 220 mm under 9 different conditions; (c) Al concentration at the bottom of the mold under 9 different conditions.
In the melt pool region (Figure 6a), the Al concentration field exhibits a distinct temperature dependence. As the melting temperature increases from 2073 K to 2273 K, the surface Al concentration in the melt pool decreases from 6.7 wt.% to 5.6 wt.%, a reduction of 16%. Notably, at 2073 K, the concentration difference between the edge and the center of the melt pool is only 0.3 wt.%, while at 2273 K, it widens to 1.2 wt.%, indicating that higher temperatures exacerbate the compositional inhomogeneity within the melt pool. The effect of casting speed is manifested as follows: within the range of 8–24 mm/min, for every 4 mm/min increase in speed, the average Al concentration in the melt pool increases by approximately 0.15 wt.%, but this enhancement effect diminishes when the speed exceeds 20 mm/min.
Data from the cross-section of the solid phase region (Figure 6b) show that under the optimal process combination (20 mm/min, 2073 K), the average Al concentration is 6.7 wt.% with a coefficient of variation of only 1.8%. In contrast, under the high-temperature condition of 2273 K, the coefficient of variation reaches 7.2%, and a distinct central enrichment feature is observed (the center concentration is 0.9 wt.% higher than the edge). In this region, the effect of casting speed is characterized by a monotonic increase: an extremum of concentration (6.1 wt.%) occurs at 24 mm/min.
Quantitative analysis of the cross-section at the bottom of the mold (Figure 6c) reveals that process parameters exert a decisive influence on the final ingot composition. Under optimal parameters, the longitudinal Al concentration gradient in the ingot is essentially 0 wt.%/cm, whereas in the worst-case scenario (casting speed of 24 mm/min and temperature of 2273 K), this gradient reaches 0.3 wt.%/cm. It is particularly noteworthy that the three sets of data collectively demonstrate that the influence coefficient of temperature on Al volatilization loss is 0.015 wt.%/K, and the influence coefficient of casting speed within the range of 12–20 mm/min is 0.02 wt.%/(mm/min).
These patterns of data variation reveal important process mechanisms: for every 100 K increase in temperature, the average concentration of Al decreases by approximately 0.37 wt.%, which is consistent with the trend of volatilization rate predicted by the Arrhenius equation. When the casting speed is within the range of 12–20 mm/min, an increase of 4 mm/min can raise the Al concentration by about 0.07 wt.%. However, when the speed exceeds 20 mm/min, the concentration begins to decrease, indicating the existence of an optimal speed window.
To more intuitively illustrate the changes in concentration, this paper defines an Enrichment Factor , the formula for which is as follows:
The variance of is calculated to obtain , the formula for which is as follows:
As depicted in Figure 7f, the effects of casting speed (8, 12, 16, 20, and 24 mm/min) on segregation were investigated at a constant smelting temperature of 2273 K. The error bars represent the range of Enrichment Factors (EFs) obtained from three cross-sections under each processing condition (all subsequent error bars in this study indicate the same meaning). The results indicate that as the casting speed increases, the value first decreases and then tends to stabilize. At 8 mm/min, is 0.324; it drops to 0.213 at 12 mm/min and further decreases to 0.100 at 16 mm/min. In the range of 20–24 mm/min, it stabilizes between 0.095 and 0.102. This suggests that appropriately increasing the casting speed helps to suppress segregation, and an optimal process window exists within the range of 16–20 mm/min. Figure 8f shows the effect of different melting temperatures (2073–2273 K) on segregation under a fixed casting speed. The data reveal that the value generally increases with temperature, rising from 0.005 at 2073 K to 0.095 at 2273 K. However, a slight and anomalous decrease occurs in the range of 2123–2173 K (0.015 at 2123 K and 0.014 at 2173 K), indicating the presence of an extremum in this temperature range. Increasing the melting temperature typically exacerbates segregation, but an optimal process parameter may exist within a specific temperature range.
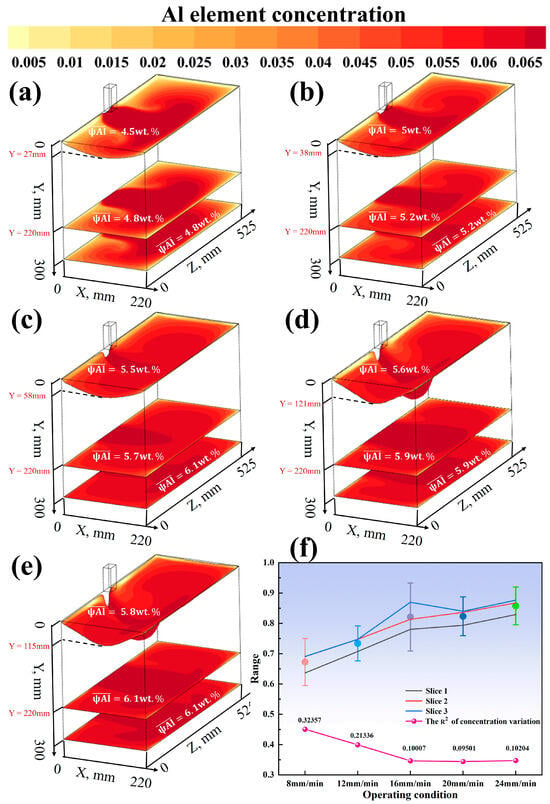
Figure 7.
(a) Casting speed 8 mm, melting temperature 2273 K; (b) casting speed 12 mm, melting temperature 2273 K; (c) casting speed 16 mm, melting temperature 2273 K; (d) casting speed 20 mm, melting temperature 2223 K; (e) casting speed 20 mm, melting temperature 2273 K; (f) Enrichment Factor and variance with varying casting speeds at a fixed melting temperature of 2273 K.
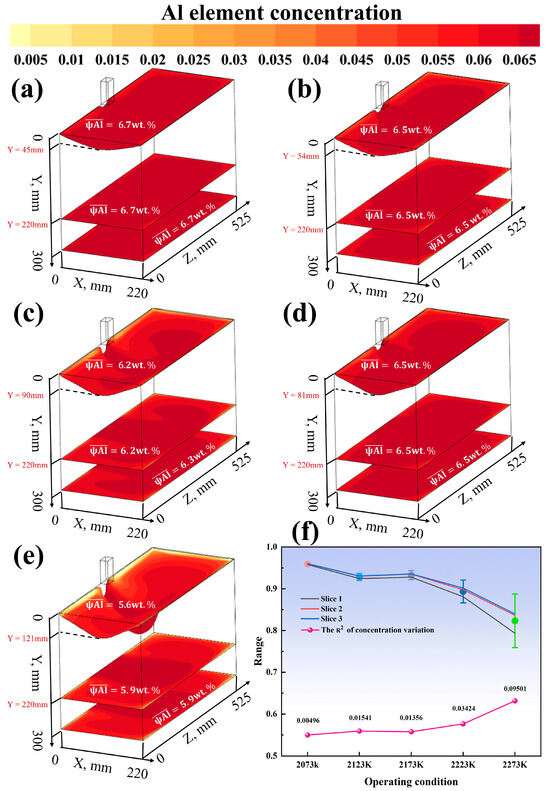
Figure 8.
(a) Casting speed 20 mm, melting temperature 2073 K; (b) casting speed 20 mm, melting temperature 2123 K; (c) casting speed 20 mm, melting temperature 2173 K; (d) casting speed 20 mm, melting temperature 2223 K; (e) casting speed 20 mm, melting temperature 2273 K; (f) Enrichment Factor and variance with varying melting temperatures at a fixed casting speed of 20 mm/min.
3.3. Analysis of Al Concentration in the Triple-Overflow Mold
Figure 9a–c shows the concentration distribution characteristics of the Al element at the mushy zone interface (Slice 1), the cross-section of the solid phase region (Slice 2), and the cross-section at the bottom of the mold (Slice 3) under different melting temperature conditions. At a fixed casting speed of 20 mm/min, as the melting temperature increases from 2073 K to 2273 K, the concentration distribution of the Al element shows significant changes: under low-temperature conditions (2073 K), the distribution of the Al element is relatively uniform. However, as the temperature rises to 2273 K, the concentration gradient gradually increases, the distribution curve becomes steeper, and the overall concentration level decreases. This phenomenon indicates that a lower melting temperature can effectively suppress the segregation behavior of the Al element.
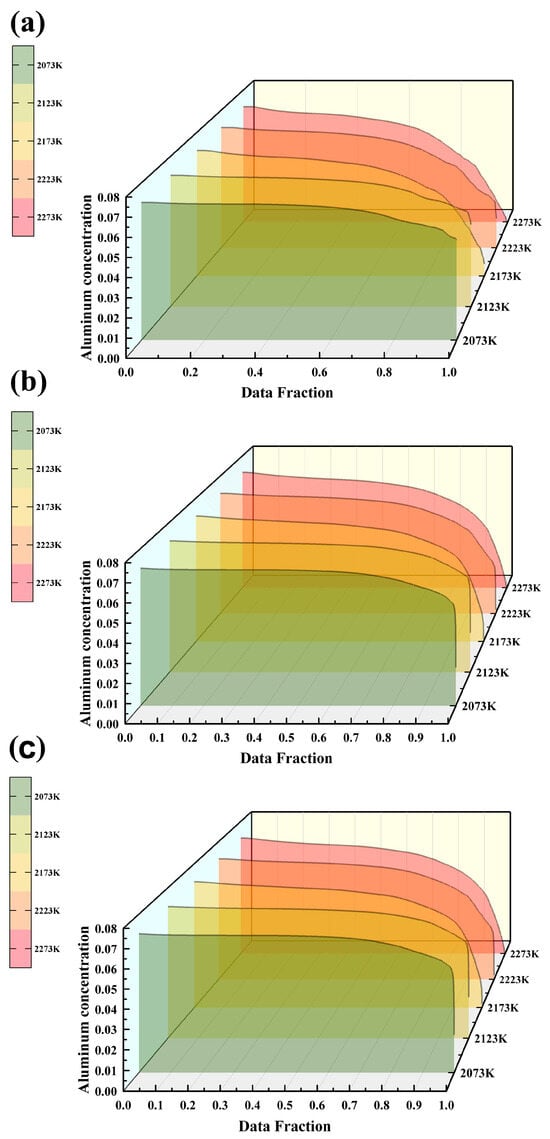
Figure 9.
Al element concentration in the triple-overflow mold for same-side casting under different melting temperatures: (a) Slice 1; (b) Slice 2; (c) Slice 3.
Figure 10a–e systematically investigates the effects of increasing the melting temperature from 2073 K to 2273 K on the distribution characteristics of the Al element at the mushy zone interface (Slice 1), the cross-section of the solid phase region (Slice 2), and the cross-section at the bottom of the mold (Slice 3) at a fixed casting speed of 20 mm/min. The results show that as the melting temperature increases, the macrosegregation of the Al element is significantly exacerbated, with the maximum concentration differences in the three cross-sections reaching 1.1%, 0.9%, and 0.9%, respectively. Specifically, the Al concentration in Slice 1 decreases from 6.6 wt.% to 5.5 wt.% (a relative reduction of 16%), indicating that high temperatures significantly enhance the compositional inhomogeneity within the melt pool. The average concentration in Slice 2 drops from 6.7 wt.% to 5.8 wt.% (a reduction of 13%), with a distinct central enrichment feature observed at 2273 K. The distribution characteristics in Slice 3 are essentially consistent with those in Slice 2. As shown in Figure 10f, the variance of the concentration distribution () increases monotonically with temperature, rising from 0.007 at 2073 K to 0.1 at 2273 K, an increase of 0.093. The peak (0.063) observed near 2173 K suggests that this temperature range may be a turning point for segregation behavior. These results collectively confirm that the melting temperature has a significant regulatory effect on the segregation behavior of the Al element.
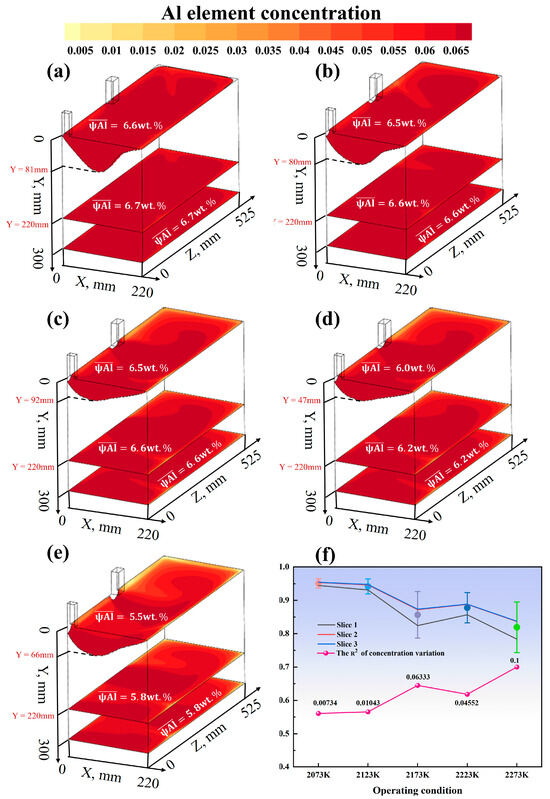
Figure 10.
(a–e) Distribution maps of Al element concentration in three cross-sections under five conditions with a fixed casting speed of 20 mm/min and melting temperatures of 2073 K, 2123 K, 2173 K, 2223 K, and 2273 K, respectively; (f) Enrichment Factor and variance of Al element under the five conditions.
3.4. Analysis of Al Concentration in the Quadruple-Overflow Mold
Figure 11a–c shows the effects of different process parameters on the concentration distribution of the Al element at the mushy zone interface (Slice 1), the cross-section of the solid phase region (Slice 2), and the cross-section at the bottom of the mold (Slice 3). Under a fixed casting speed of 20 mm/min, the effects of five temperature gradients within the range of 2073–2273 K on the Al concentration were investigated. Under a constant melting temperature of 2273 K, the effects of five casting speeds within the range of 8–24 mm/min were studied. Figure 12 and Figure 13a–e further display the concentration contour maps and average concentration data for the three cross-sections under each condition.
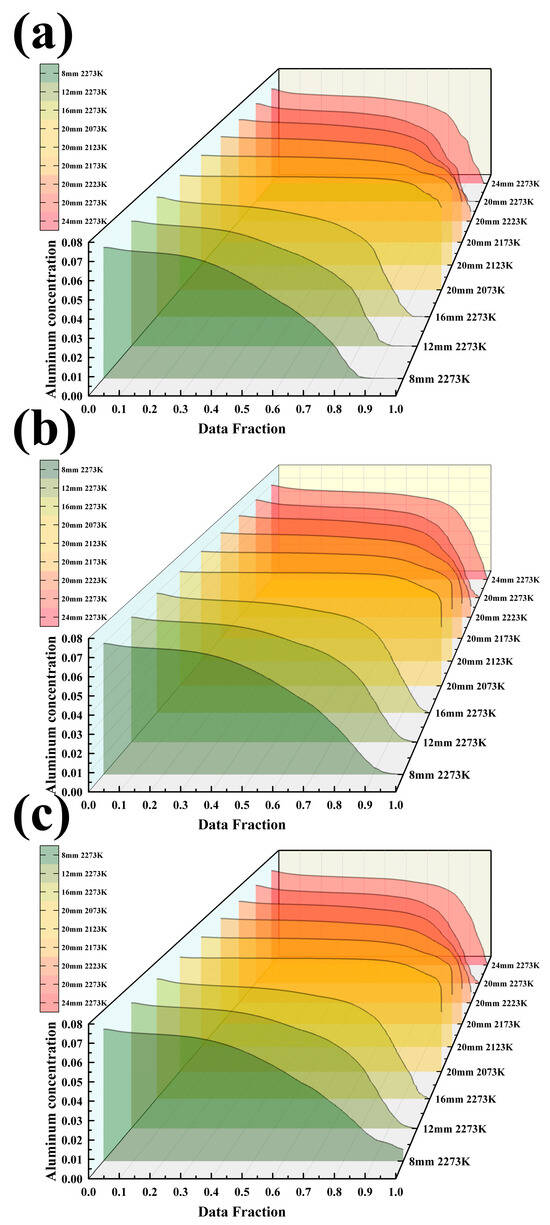
Figure 11.
(a) Al concentration in the melt pool under 9 different conditions; (b) Al concentration at Y = 220 mm under 9 different conditions; (c) Al concentration at the bottom of the mold under 9 different conditions.
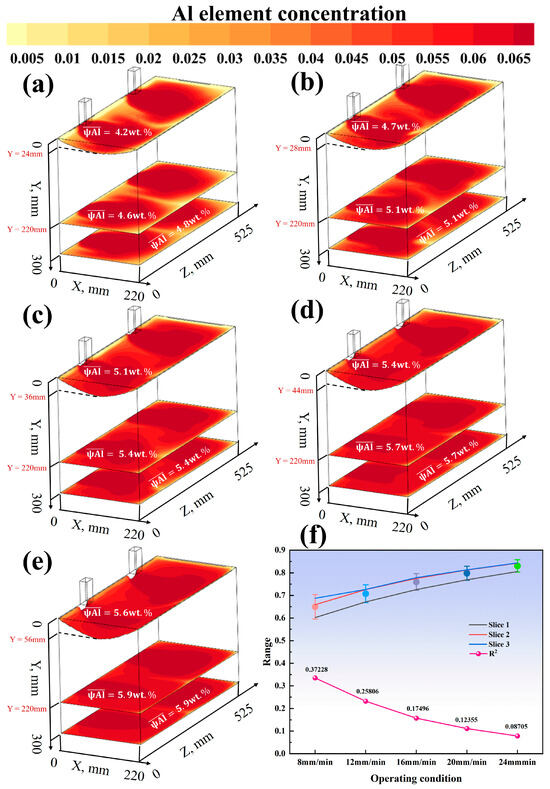
Figure 12.
(a) Casting speed 8 mm, melting temperature 2273 K; (b) casting speed 12 mm, melting temperature 2273 K; (c) casting speed 16 mm, melting temperature 2273 K; (d) casting speed 20 mm, melting temperature 2273 K; (e) casting speed 24 mm, melting temperature 2273 K; (f) Enrichment Factor and variance with varying casting speeds at a fixed melting temperature of 2273 K.
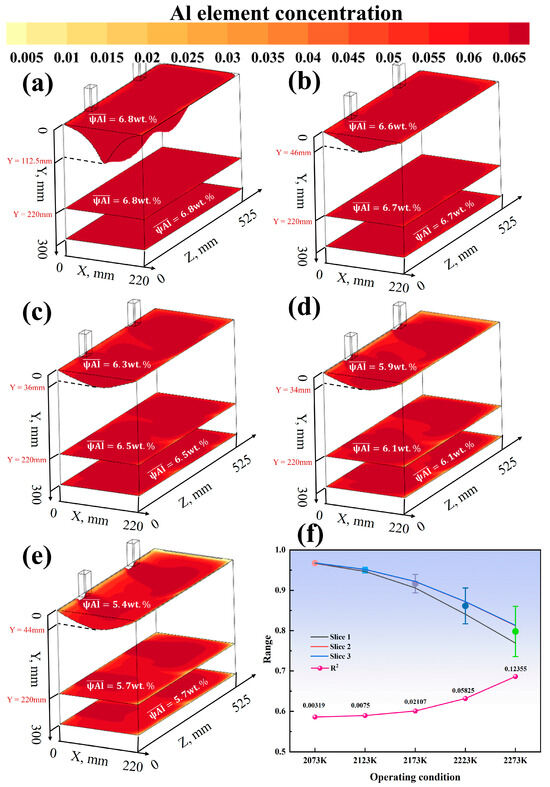
Figure 13.
(a) Casting speed 20 mm, melting temperature 2073 K; (b) casting speed 20 mm, melting temperature 2123 K; (c) casting speed 20 mm, melting temperature 2173 K; (d) casting speed 20 mm, melting temperature 2223 K; (e) casting speed 20 mm, melting temperature 2273 K; (f) Enrichment Factor and variance with varying melting temperatures at a fixed casting speed of 20 mm/min.
Figure 11a shows that as the melting temperature increases from 2073 K to 2273 K, the surface Al concentration in the melt pool decreases from 6.7 wt.% to 5.6 wt.% (a reduction of 16%). Under the condition of 2073 K, the concentration difference between the edge and the center of the melt pool is only 0.3 wt.%, while it expands to 1.2 wt.% at 2273 K. Within the casting speed range of 8–24 mm/min, for every 4 mm/min increase in speed, the average Al concentration in the melt pool increases by approximately 0.15 wt.%, but the enhancement effect weakens when the speed exceeds 20 mm/min. In Figure 11b, under the optimal process combination (20 mm/min, 2073 K), the average Al concentration in the solid phase region is 6.7 wt.% with a coefficient of variation of only 1.8%. In contrast, under the high-temperature condition of 2273 K, the coefficient of variation reaches 7.2%, and the center concentration is 0.9 wt.% higher than the edge. The casting speed in this region shows a monotonic increase, with a concentration extremum of 6.1 wt.% at 24 mm/min. Figure 11c indicates that under the optimal parameters, the longitudinal Al concentration gradient in the ingot is essentially 0 wt.%/cm, while the worst-case scenario (24 mm/min, 2273 K) reaches 0.3 wt.%/cm. The influence coefficient of temperature on Al volatilization loss is 0.015 wt.%/K, and within the casting speed range of 12–20 mm/min, the influence coefficient is 0.02 wt.%/(mm/min).
As shown in Figure 12 and Figure 13a–e, when the casting speed is 20 mm/min and the melting temperature is 2073 K, the distribution of the Al element is the most uniform, with an average concentration reaching 6.8 wt.%, which is closest to the target concentration of 7 wt.% among the nine conditions. Under other conditions, the Al concentration distribution varies to different extents. For example, at a melting temperature of 2273 K and a casting speed of 8 mm/min, the Al concentration in the melt pool is relatively low and unevenly distributed, and the concentrations in the solid phase region and at the bottom of the mold also show certain fluctuations. As the casting speed increases to 12 mm/min and 16 mm/min, the Al concentration in the melt pool increases, but the uniformity of the concentration distribution is still limited by the high-temperature conditions. At a melting temperature of 2073 K and a casting speed of 20 mm/min, the Al concentration distribution in the three cross-sections is uniform, with an average concentration close to 7 wt.% and a low coefficient of variation. As the temperature rises, the difference in Al concentration between the melt pool and the solid phase region increases, the central enrichment phenomenon becomes more pronounced, and the concentration gradient at the bottom of the mold also increases accordingly. Under the condition of a casting speed of 24 mm/min and a melting temperature of 2273 K, although the Al concentration in the melt pool has increased, the unevenness of the concentration distribution has worsened, and there is a larger concentration difference in the solid phase region and at the bottom of the mold.
As shown in Figure 12f, the effect of casting speed (8–24 mm/min) on segregation behavior was investigated under the condition of a fixed melting temperature of 2273 K. The simulation results indicate that as the casting speed increases from 8 mm/min to 24 mm/min, the value decreases monotonically. Specifically, is 0.372 at 8 mm/min, drops to 0.258 at 12 mm/min, is 0.175 at 16 mm/min, and further decreases to 0.124 at 20 mm/min and 0.087 at 24 mm/min. This suggests that increasing the casting speed can effectively suppress segregation in the ingot. Additionally, Figure 13f shows the effect of melting temperature (2073–2273 K) on segregation under a fixed casting speed. The value increases significantly with temperature, rising from 0.005 at 2073 K to 0.095 at 2273 K. Considering the characteristics of the quadruple-overflow mold for same-side casting, it can be concluded that within the experimental parameter range, increasing the melting temperature exacerbates segregation in the ingot.
3.5. Artificial Neural Network Simulation
The non-monotonic variation patterns observed in this study (such as the trend where the effect of casting speed on the degree of segregation in the double-overflow mold first decreases and then stabilizes, and the slight decrease in the degree of segregation within the temperature range of 2123–2173 K) essentially stem from the disruption and reconstruction of the dynamic balance under the coupling effect of multiphysics fields. Taking the influence of casting speed as an example, when the speed is low (8–12 mm/min), the residence time in the molten pool is longer, resulting in a more significant volatilization loss of aluminum at high temperatures. Moreover, the convection intensity inside the molten pool is weak, leading to insufficient solute diffusion, thus causing a higher degree of segregation (with a larger R2 value). As the speed increases to 16–20 mm/min, the forced convection in the molten pool is enhanced, which promotes the uniform mixing of aluminum. Meanwhile, the shorter residence time reduces excessive volatilization, and the degree of segregation decreases accordingly. When the speed exceeds 20 mm/min, the increase in solidification rate is faster than the solute diffusion rate, and the solute enrichment between dendrites cannot be eliminated by convection, causing the degree of segregation to stabilize or even slightly rebound, forming a non-monotonic variation characteristic. The abnormal fluctuation of temperature in the range of 2123–2173 K may be related to the sudden change in the surface tension gradient (Marangoni effect) of the molten pool within this interval. Although increasing temperature should intensify aluminum volatilization and segregation, the change in convection mode at this time (such as from unidirectional flow to local circulation) may temporarily enhance the micro-mixing of the molten pool, offsetting part of the inhomogeneity caused by volatilization.
The existence of the optimal process parameters (such as the combination of a casting speed of 18 mm/min and a temperature of 2168 K in the double-overflow mold) essentially results from the coordinated balance of multiple processes including “volatilization-diffusion-convection-solidification” in the molten pool. Mechanistically, the casting speed determines the dynamic renewal rate of the molten pool, the temperature controls the driving force for aluminum volatilization, and the number of overflow ports affects the stirring intensity of the molten pool. When the parameters are within the optimal range, the volatilization loss of aluminum is controlled within a reasonable range (regulated by temperature), and the convection intensity in the molten pool is sufficient to uniformly diffuse the residual aluminum (matched by the speed and the number of overflow ports). Additionally, the solidification rate and the solute diffusion rate reach a balance (avoiding solute trapping caused by rapid solidification). This coordinated balance of multiphysics fields maximizes the uniformity of aluminum concentration distribution, thereby presenting an optimal process window. This phenomenon also confirms that in the EBCHM process of titanium alloys, the optimization of a single parameter cannot independently solve the segregation problem, and the dynamic balance of multiple processes must be achieved through the coupling regulation of multiple parameters.
In this study, a model of an optimization system for process parameters based on a BP neural network was established to identify the combination of process parameters that can minimize the concentration variance, as shown in the neural network structure diagram in Figure 14. The entire process includes four main stages: data loading and preprocessing, model construction, training, and parameter optimization. In terms of data, two hidden layers were set up to balance model performance and computational time. The system takes multiple sets of process parameters (number of openings, temperature, and feeding speed) as input, reads the corresponding concentration statistical results from an Excel file as output, and uses Enrichment Factor normalization (Standard Scaler) for standardization to enhance the stability of model training. All samples are fed into the DNN model in batches of eight, with the epoch set at 500.
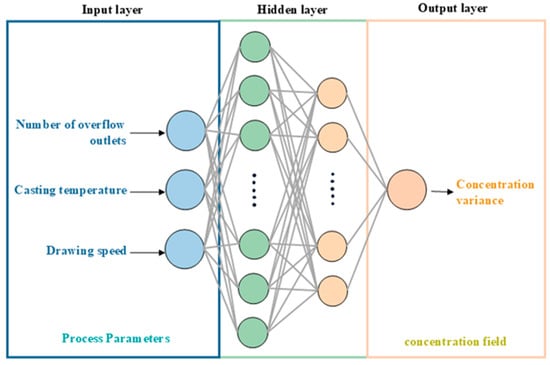
Figure 14.
Schematic diagram of the neural network structure.
In terms of model architecture, the neural network design includes an input layer, two hidden layers (with 60 and 28 neurons in the first and second hidden layers, respectively, and using the ReLU activation function), and an output layer. After standardizing the dataset using batch normalization, the data is divided into an 80% training set and a 20% validation set. The data from the training set is incorporated into the training process of the algorithm. After the training process, the data from the validation set is added to the training data to validate the training process. During the training process, early stopping (EarlyStopping) and callback functions (ReduceLROnPlateau) are introduced to optimize the training. If there is no improvement for 50 consecutive rounds (patience = 50), the training is terminated early to prevent overfitting. After a certain number of epochs, to address the issue that the learning rate may no longer be suitable for the model, a callback function is used to reduce the learning rate during training, thereby optimizing the training process.
During the parameter optimization phase, the Adam algorithm is employed to search within the predefined range of process parameters. The optimization is constrained to ensure that the results meet the requirements of actual production, and the mean squared error (MSE) is used as the evaluation metric for model performance.
Figure 15a illustrates the trends of training loss and validation loss with respect to the number of training epochs for the neural network model. The x-axis represents the number of training epochs, while the y-axis denotes the value of the loss function. As shown in the figure, the training loss curve and validation loss curve decrease synchronously and eventually stabilize. The small gap between the two curves indicates that the model is learning effectively and is not overfitting. If the training loss continues to decrease while the validation loss increases, it suggests overfitting. Conversely, if both losses decrease slowly and remain high, it may indicate underfitting.
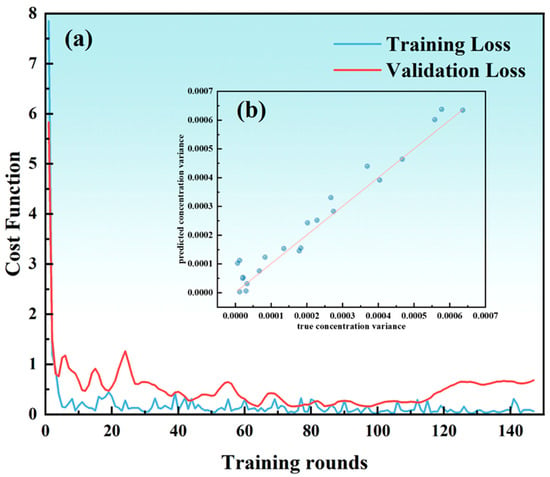
Figure 15.
(a) Loss function curve. (b) Comparison of predicted values and true values.
Figure 15b visualizes the comparison between the predicted values and the actual values from the neural network. The line y = x represents perfect agreement between the predicted and actual values. The degree of scatter of the data points can be used to assess the fit quality. The data points in the figure are concentrated near the diagonal line, indicating a high degree of consistency between the predicted and actual values. If the points are scattered or deviate significantly from the diagonal, it suggests that the model has systematic biases or random errors.
In each prediction process, the prediction results may vary slightly, mainly due to two reasons. First, the random initialization of weights and biases, and second, the random selection of training and validation sets. Therefore, by changing conditions and conducting multiple predictions, the best-performing data can be selected for comparison.
Commonly used activation functions in neural networks include the sigmoid function, ReLU (Rectified Linear Unit), Tanh (hyperbolic tangent), etc. Keeping the overall structure of the neural network unchanged, we used the sigmoid function and ReLU as the activation functions for the hidden layers, respectively. The prediction performance of the two neural networks can be seen in Figure 16a. When the activation function of the hidden layer is the sigmoid function, the correlation coefficient is 0.9874, the MSE is 12.885, and the mean relative error (MRE) is 24.8997%. When the activation function of the hidden layer is ReLU, the neural network performs better in prediction, with a correlation coefficient of 0.9909, an MSE of 1.124, and an MRE of 28.0078%.
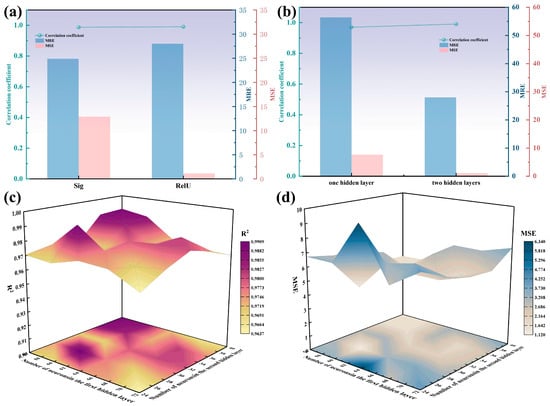
Figure 16.
(a) Correlation coefficient, MSE, and MRE of the neural network when using different activation functions in the hidden layers; (b) correlation coefficient, MSE, and MRE of the neural network when changing the number of hidden layers; (c) correlation coefficient of the neural network with different numbers of neurons in the hidden layers; (d) MSE of the neural network with different numbers of neurons in the hidden layers.
Using ReLU as the activation function for the hidden layer, we changed the number of hidden layers to one for prediction and compared it with the neural network using two hidden layers. The prediction performance of the two neural networks can be seen in Figure 16b. When there is only one hidden layer, the neural network has a correlation coefficient of 0.97, an MSE of 7.651, and an MRE of 56.42%. Compared with the neural network using a double-layer hidden structure, the prediction performance has declined significantly.
For the double-hidden-layer neural network with ReLU as the activation function for the hidden layers, we varied the number of neurons in the first hidden layer from 56 to 72 in increments of 4, and the number of neurons in the second hidden layer from 24 to 40 in increments of 4. We conducted predictions with 25 different combinations of neuron numbers and obtained the correlation coefficients and MSEs for each combination. Figure 16c,d show the correlation coefficients and MSEs of the neural networks with different neuron number combinations. It can be proven that when the first hidden layer and the second hidden layer have 60 and 28 neurons, respectively, the neural network achieves the highest correlation coefficient and the lowest MSE. In other words, this structure of the neural network has the best prediction performance.
The three input layers are the number of openings, temperature, and feeding speed. The number of openings is 2, 3, or 4. The feeding speed increases from 8 mm/min to 24 mm/min in increments of 4 mm/min. The temperature increases from 2073 K to 2273 K in increments of 50 K. A total of 27 sets of process parameters were selected as inputs, and the variance of the concentration field corresponding to each set of input parameters was calculated as the output. Through the neural network, the process parameters when the concentration field distribution is most uniform were obtained: the number of overflow openings is 2, the casting speed is 18 mm/min, and the casting temperature is 2168 K.
3.6. Discussion of the Optimization Model Results
As shown in Figure 17a, under the process conditions of a casting speed of 18 mm/min and a casting temperature of 2168 K, the average Al concentration in the three cross-sections of the mold is stably maintained at a level of 6.8 wt.%. At this time, the melt pool depth is 75 mm, which is entirely within the ideal range of the impact zone depth. Quantitative analysis reveals that the value is only 0.002, indicating that this condition has the highest simulation accuracy among all models. Experimental observations show that although segregation of the Al element can still be detected at the edges of the ingot, the overall degree of segregation is relatively low. The concentration distribution curves in Figure 17b further show that the Al concentration in the three cross-sections remains highly stable in more than 80% of the radial region of the ingot, with the concentration value essentially maintained around 7%. Only in the approximately 20% radial region near the surface does the Al concentration show a significant gradient decrease.
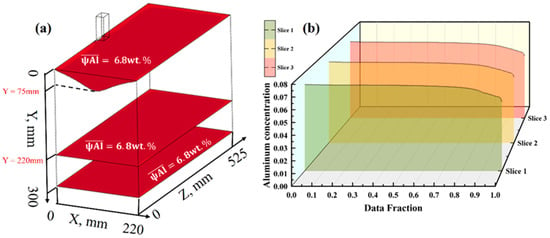
Figure 17.
(a) Distribution maps of Al element concentration in three cross-sections at a casting speed of 18 mm/min and a casting temperature of 2168 K; (b) Al element concentration in the three cross-sections.
Considering that the distribution of elements in the solid phase region inherits the characteristics of the mushy zone, this study selected the cross-section at Y = 220 mm to analyze the distribution of the Al element (Figure 18). The results show that the concentration of the Al element decreases from the center to both sides and forms an enrichment zone at the overflow port. Among the five measurement lines, the distribution of Line 3 is closest to the initial concentration, with the Al concentration maintained at around 7% in more than 90% of the area. However, the distribution uniformity of Line 1 (oriented from the overflow port to the cooling sidewall) is the worst. Nevertheless, this cross-section maintains a high level of Al element concentration, effectively suppressing the segregation of the Al element.
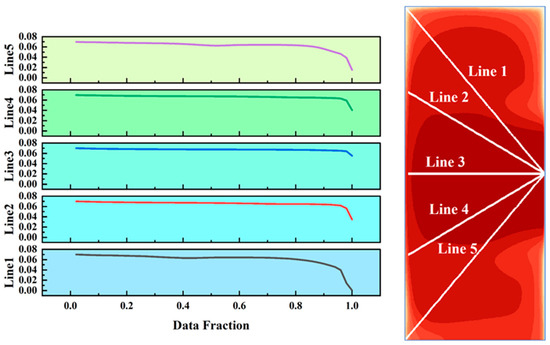
Figure 18.
Distribution of Al element at the slice of Y = 220 mm and the distribution of Al element concentration along the five selected line segments.
4. Conclusions
This study employed a three-dimensional transient multiphysics coupled numerical simulation method to systematically investigate the process of melting large-sized Ti-6wt%Al-4wt%V alloy slab ingots in an electron beam cold hearth furnace. By constructing a coupled model that includes multiple physical phenomena such as element volatilization, melt pool flow, and solidification mass transfer, and combining it with the FNN artificial neural network algorithm, a process-structure prediction model was established. This research not only revealed the formation mechanism of macrosegregation of the Al element inside large titanium alloy ingots but also proposed effective segregation control strategies and determined the optimal combination of process parameters through optimization calculations.
- Under constant melting temperature conditions, as the number of overflow ports increases, the effect of changes in casting speed on the degree of segregation, as measured by the variance ( value), becomes significantly stronger. In the double-overflow mold for same-side casting, the difference in values increases by 0.222 when the casting speed is raised from 8 mm/min to 24 mm/min. However, when using a quadruple-overflow mold for same-side casting, this difference further expands to 0.285. This phenomenon clearly demonstrates that in same-side casting processes, an increase in the number of overflow ports significantly amplifies the impact of melting temperature changes on the segregation behavior of the ingot.
- Under the same-side casting mode, when the casting speed is kept constant, the number of overflow ports and the melting temperature show a clear positive correlation with the degree of segregation (as indicated by the value). The difference in values is 0.09 for the double-overflow configuration, while it increases to 0.12 for the quadruple-overflow configuration. Notably, under high-temperature conditions (2273 K), the value significantly increases by as much as 30%. This series of data confirms that, under the process conditions of a fixed casting speed, the double-overflow configuration can achieve the best segregation control effect.
- A process-structure prediction model was established based on the BP neural network, and the neural network structure was optimized. The prediction performance of the neural network using ReLU as the activation function is superior to that of the neural network using the sigmoid function as the activation function. After optimizing the activation function, different neural networks with varying numbers of hidden layers and neurons were compared. It was found that the neural network with two hidden layers performs better, and the performance is optimal when the number of neurons in the two hidden layers is 60 and 28, respectively. The correlation coefficient is 0.9909, the MSE is 1.124, and the MRE is 28.0078%. The predicted optimal condition is double-overflow same-side casting with a casting speed of 18 mm/min and a melting temperature of 2168 K. The average Al concentration is 6.8 wt.%, the melt pool depth is 75 mm, and the value is only 0.002.
Based on the findings of this study, future research can further deepen the refined modeling of multiphysics coupling mechanisms to explore the correlation between electron beam energy distribution and molten pool interface flow; expand the generalization of machine learning models to achieve cross-alloy and cross-process prediction; verify optimal parameters through industrial-grade equipment; establish a “process-composition-performance” mapping relationship; and combine uncertainty quantification methods to improve process stability, thereby providing more systematic theoretical and application support for the preparation of large titanium alloy ingots.
Author Contributions
Conceptualization, L.G.; Methodology, Y.X., J.L. and L.G.; Software, Y.X., J.L. and L.G.; Validation, Y.X., Z.C. and Y.L.; Formal analysis, T.H. and Q.Z.; Investigation, Y.X., J.L. and Y.S.; Data curation, Y.X. and Y.S.; Writing—original draft, Y.X. and J.L.; Writing—review and editing, L.G., H.Z., H.J., S.Y. and Q.Z.; Visualization, Y.X., J.L. and Z.C.; Supervision, Y.S. and L.G.; Project administration, L.G., S.G. and S.Y.; Funding acquisition, L.G., S.G. and S.Y. All authors have read and agreed to the published version of the manuscript.
Funding
This research was funded by the National Natural Science Foundation of China (grant number 52104351), the Science and Technology Major Project of Yunnan Province (grant number 202202AG050007), Yunnan Fundamental Research Projects (grant number 202401AT070314), the Yunnan Province Key Industries Science and Technology Special Project for Colleges and Universities (grant number FWCY-QYCT2024006), the Key Research and Development Plan of Jiangxi Province (grant number 20232BBE50027), and the Central Guidance Local Scientific and Technological Development Funds (grant number 202407AB110022).
Data Availability Statement
The original contributions presented in this study are included in the article. Further inquiries can be directed to the corresponding authors.
Conflicts of Interest
The authors declare no conflicts of interest.
Abbreviations
The following physical parameters are used in this manuscript:
| Mathematical Parameters | Explanation of Mathematical Parameters |
| liquid fraction | |
| relaxation factor with a default value | |
| cell temperature, K | |
| interface temperature, K | |
| density, kg/m3 | |
| cell volume, m3 | |
| latent heat of the material, J/kg | |
| cell matrix coefficient | |
| time step, s | |
| melting temperature, K | |
| number of species | |
| the slope of the liquidus surface with respect to | |
| the mass fraction of solute i | |
| the partition coefficient of solute i | |
| the momentum sink | |
| a small number (0.001) to prevent division by zero | |
| mushy zone constant | |
| cell velocity, m/s | |
| pull velocity, m/s | |
| liquidus temperature of the material, K | |
| temperature, K | |
| R | universal gas constant, J/mol K |
| reaction rate, kg/m2 s | |
| velocity of the liquid, m/s | |
| mass diffusion coefficient for species in the mixture, m2/s | |
| forward rate constant for reaction r | |
| number of gaseous species | |
| molar concentrations of gaseous species | |
| molar concentrations of site species | |
| and | the rate exponents for the ith gaseous species as reactant and product, respectively |
| and | the rate exponents for the jth gaseous species as reactant and product, respectively |
| pre-exponential factor (consistent units) | |
| temperature exponent (dimensionless) | |
| activation energy for the reaction, J/mol | |
| µ | dynamic viscosity, Pa·s |
| u | velocity of the fluid with respect to the object, m/s |
| L | characteristic length, m |
| Re | Reynolds number |
References
- Cui, Y.-W.; Wang, L.; Zhang, L.-C. Towards load-bearing biomedical titanium-based alloys: From essential requirements to future developments. Prog. Mater. Sci. 2024, 144, 101277. [Google Scholar] [CrossRef]
- Song, T.; Chen, Z.; Cui, X.; Lu, S.; Chen, H.; Wang, H.; Dong, T.; Qin, B.; Chan, K.C.; Brandt, M. Strong and ductile titanium–oxygen–iron alloys by additive manufacturing. Nature 2023, 618, 63–68. [Google Scholar] [CrossRef]
- Ji, H.; Guo, S.; Gao, L.; Yang, L.; Yan, H.; Zeng, H. Revolutionizing titanium production: A comprehensive review of thermochemical and molten salt electrolysis processes. Int. J. Miner. Metall. Mater. 2025. [Google Scholar] [CrossRef]
- Li, S.S.; Yue, X.; Li, Q.Y.; Peng, H.L.; Dong, B.X.; Liu, T.S.; Yang, H.Y.; Fan, J.; Shu, S.L.; Qiu, F. Development and applications of aluminum alloys for aerospace industry. J. Mater. Res. Technol. 2023, 27, 944–983. [Google Scholar] [CrossRef]
- Yang, Y.; Xiong, X.; Chen, J.; Peng, X.; Chen, D.; Pan, F. Research advances in magnesium and magnesium alloys worldwide in 2020. J. Magnes. Alloys 2021, 9, 705–747. [Google Scholar] [CrossRef]
- Banerjee, D.; Williams, J. Perspectives on titanium science and technology. Acta Mater. 2013, 61, 844–879. [Google Scholar] [CrossRef]
- Ouarga, A.; Zirari, T.; Fashu, S.; Lahcini, M.; Youcef, H.B.; Trabadelo, V. Corrosion of iron and nickel based alloys in sulphuric acid: Challenges and prevention strategies. J. Mater. Res. Technol. 2023, 26, 5105–5125. [Google Scholar] [CrossRef]
- Liu, T.-S.; Chen, P.; Qiu, F.; Yang, H.-Y.; Jin, N.T.Y.; Chew, Y.; Wang, D.; Li, R.; Jiang, Q.-C.; Tan, C. Review on laser directed energy deposited aluminum alloys. Int. J. Extrem. Manuf. 2024, 6, 022004. [Google Scholar] [CrossRef]
- You, S.; Huang, Y.; Kainer, K.U.; Hort, N. Recent research and developments on wrought magnesium alloys. J. Magnes. Alloys 2017, 5, 239–253. [Google Scholar] [CrossRef]
- Li, G.; Ma, F.; Liu, P.; Qi, S.; Li, W.; Zhang, K.; Chen, X. Review of micro-arc oxidation of titanium alloys: Mechanism, properties and applications. J. Alloys Compd. 2023, 948, 169773. [Google Scholar] [CrossRef]
- Lee, D.; Ga, J.; Park, M.H.; Chang, S.Y. Effect of High Temperature on Microstructure and Hardness of Ti-6Al-4Dy Alloy by High Energy Ball Milling and Spark Plasma Sintering. J. Jpn. Soc. Powder Powder Metall. 2025, 72, S787–S790. [Google Scholar] [CrossRef]
- Sun, J.; Pan, Y.; Liu, Y.; Kuang, F.; Lu, R.; Lu, X. Strength–ductility synergy strategy of Ti6Al4V alloy fabricated by metal injection molding. Int. J. Miner. Metall. Mater. 2025, 32, 1641–1654. [Google Scholar] [CrossRef]
- Ullah, I.; Akinlabi, E.T.; Songmene, V. Thermo-metallo-mechanical based phase transformation modeling for high-speed milling of Ti–6Al–4V through stress-strain and temperature effects. J. Mater. Res. Technol. 2024, 30, 894–909. [Google Scholar] [CrossRef]
- Madapana, D.; Ramadas, H.; Nath, A.K.; Dutta Majumdar, J. Studies on laser shock peening on nanomechanical and mechano-chemical properties of titanium alloy (Ti6Al4V). JOM 2023, 75, 109–119. [Google Scholar] [CrossRef]
- Zhao, J.-H.; Shangguan, J.-J.; Cheng, G.; Jin, B.-Y.; Yu, S. Microstructures and mechanical properties of TC4/AZ91D bimetal prepared by solid–liquid compound casting combined with Zn/Al composite interlayer. Trans. Nonferrous Met. Soc. China 2022, 32, 1144–1158. [Google Scholar] [CrossRef]
- Strumza, E.; Landau, P.; Kimmel, G.; Ganor, Y.I.; Yeheskel, O.; Hayun, S. Thermophysical properties of Ti-6Al-4V fabricated by powder bed fusion methods. Addit. Manuf. 2022, 58, 103045. [Google Scholar] [CrossRef]
- Qiu, G.; Guo, Y. Current situation and development trend of titanium metal industry in China. Int. J. Miner. Metall. Mater. 2022, 29, 599–610. [Google Scholar] [CrossRef]
- Martin, P.; Prillieux, A.; Balcaen, Y.; Hacquin, A.; Saby, M.; Dod, B.; Alexis, J.; Perusin, S. Rheology of Ti-6Al-4V alloy under non equilibrium conditions during β forging. J. Mater. Process. Technol. 2024, 327, 118346. [Google Scholar] [CrossRef]
- Ebrahimi, A.; Babu, A.; Kleijn, C.R.; Hermans, M.J.; Richardson, I.M. The effect of groove shape on molten metal flow behaviour in gas metal arc welding. Materials 2021, 14, 7444. [Google Scholar] [CrossRef]
- Namchanthra, S.; Phirommark, P.; Phengpom, T.; Priyadumkol, J.; Wijitdamkerng, W.; Chookaew, W.; Suvanjumrat, C.; Promtong, M. Numerical analysis of molten iron flow and heat transfer in plumbing casting defect detection using split tracking approach. Case Stud. Therm. Eng. 2025, 72, 106287. [Google Scholar] [CrossRef]
- Arul Mozhi Varman, J.; Sivarupan, T.; Georgarakis, K.; Salonitis, K.; Jolly, M. Modeling and Simulation of Cold Hearth Continuous Casting of Titanium Alloys. In Proceedings of the TMS Annual Meeting & Exhibition, Las Vegas, NV, USA, 23–27 March 2025; pp. 1117–1124. [Google Scholar]
- Xin, Y.; Liu, Y.; Gao, L.; Fang, H.; Chai, Z.; Shao, J.; Guo, S.; Yang, L.; Lu, D.; Li, X. The numerical simulation of element segregation control during the electron beam cold hearth melting process of large-sized Ti-6wt% Al-4wt% V titanium alloy slab. J. Mater. Res. Technol. 2025, 36, 8671–8687. [Google Scholar] [CrossRef]
- Weng, F.; Bi, G.; Chew, Y.; Sui, S.; Tan, C.; Du, Z.; Su, J.; Ng, F.L. Robust interface and excellent as-built mechanical properties of Ti–6Al–4V fabricated through laser-aided additive manufacturing with powder and wire. Int. J. Miner. Metall. Mater. 2025, 32, 154–168. [Google Scholar] [CrossRef]
- Campbell, J. A Future for Vacuum Arc Remelting and Electroslag Remelting. Metals 2023, 13, 1634. [Google Scholar] [CrossRef]
- Kumar, R.; Saha, A.K.; Mandal, A.K. Removal of metallic and non-metallic impurities by hydrogen plasma-arc melting. Can. Metall. Q. 2023, 62, 383–395. [Google Scholar] [CrossRef]
- Ceng, M.; Liu, Y.; Chen, X.; Zhang, H.; Li, Y. Calculation of flow, heat transfer and evaporation during the Electron Beam Cold Hearth Melting of Ti-6al-4V Alloy. RARE Met. Mater. Eng. 2020, 49, 833–841. [Google Scholar]
- Karimi-Sibaki, E.; Kharicha, A.; Wu, M.; Ludwig, A.; Bohacek, J. A parametric study of the vacuum arc remelting (VAR) process: Effects of arc radius, side-arcing, and gas cooling. Metall. Mater. Trans. B 2020, 51, 222–235. [Google Scholar] [CrossRef]
- Pirro, G.; Martucci, A.; Morri, A.; Lombardi, M.; Ceschini, L. A novel solution treatment and aging for powder bed fusion-laser beam Ti-6Al-2Sn-4Zr-6Mo alloy: Microstructural and mechanical characterization. Int. J. Miner. Metall. Mater. 2025, 32, 414–424. [Google Scholar] [CrossRef]
- Ward, R.; Johnson, T.; Young, J. Process modelling and control for cold hearth refining of intermetallic alloys. Intell. Process. High Perform. Mater. 1998, 5. [Google Scholar]
- Bellot, J.-P.; Décultot, L.; Jardy, A.; Hans, S.; Doridot, E.; Delfosse, J.; McDonald, N. Numerical simulation of the plasma arc melting cold hearth refining process (PAMCHR). Metall. Mater. Trans. B 2020, 51, 1329–1338. [Google Scholar] [CrossRef]
- Liu, Q.; Li, X.; Jiang, Y. Research progress of electron beam clod hearth melting for titanium and titanium alloys. Hot Work. Technol. 2016, 45, 9–14. [Google Scholar]
- Liu, Q.; Li, X.; Jiang, Y. Numerical simulation of EBCHM for the large-scale TC4 alloy slab ingot during the solidification process. Vacuum 2017, 141, 1–9. [Google Scholar] [CrossRef]
- He, X.; Liu, G.; Ma, J.; Wang, S. Study of elemental volatilization patterns in electron beam cold hearth melting of TA10 titanium alloy. In Proceedings of the Ninth International Conference on Energy Materials and Electrical Engineering (ICEMEE 2023), Guilin, China, 25–27 August 2023; pp. 586–590. [Google Scholar] [CrossRef]
- Gao, L.; Li, X.-m.; Huang, H.-g.; Sui, Y.-d.; Zhang, H.-m.; Shi, Z.; Chattopadhyay, K.; Jiang, Y.-H.; Zhou, R. Numerical study of aluminum segregation during electron beam cold hearth remelting for large-scale Ti-6 wt% Al-4 wt% V alloy round ingot. Int. J. Heat Mass Transf. 2019, 139, 764–772. [Google Scholar] [CrossRef]
- Zheng, H.; Hao, X.; Zhang, S.; Omran, M.; Chen, G.; Chen, J.; Gao, L. Modeling of process and analysis of drying characteristics for natural TiO2 under microwave heating. Chem. Eng. Process.-Process Intensif. 2022, 174, 108900. [Google Scholar] [CrossRef]
- Gao, L.; Huang, H.; Jiang, Y.; Chen, G.; Chattopadhyay, K.; Zhou, R. Numerical study on the solid–Liquid interface evolution of large-Scale titanium alloy ingots during high energy consumption electron beam cold hearth melting. JOM 2020, 72, 1953–1960. [Google Scholar] [CrossRef]
- Wang, Y.; Gao, L.; Xin, Y.; Guo, S.; Yang, L.; Ji, H.; Chen, G. Numerical Modeling of Electron Beam Cold Hearth Melting for the Cold Hearth. Minerals 2024, 14, 601. [Google Scholar] [CrossRef]
- Ivanchenko, V.; Ivasishin, O.; Semiatin, S. Evaluation of Evaporation Losses during Electron-Beam Melting of Ti-Al-V Alloys. Metall. Mater. Trans. B 2003, 34, 911–915. [Google Scholar] [CrossRef]
- Klassen, A.; Forster, V.E.; Juechter, V.; Körner, C. Numerical simulation of multi-component evaporation during selective electron beam melting of TiAl. J. Mater. Process. Technol. 2017, 247, 280–288. [Google Scholar] [CrossRef]
- Vutova, K.; Donchev, V. Non-stationary heat model for electron beam melting and refining—An economic and conservative numerical method. Appl. Math. Model. 2016, 40, 1565–1575. [Google Scholar] [CrossRef]
- Gao, L.; Huang, H.-g.; Kratzsch, C.; Zhang, H.-m.; Chattopadhyay, K.; Jiang, Y.-h.; Zhou, R. Numerical study of aluminum segregation during electron beam cold hearth melting for large-scale Ti-6 wt% Al-4 wt% V alloy slab ingots. Int. J. Heat Mass Transf. 2020, 147, 118976. [Google Scholar] [CrossRef]
- Zhou, B.; Lin, G.; Wang, S.; Hu, T.; An, Y. Metal-organic frameworks for sustainable recovery of precious metals: Advances in synthesis, applications and multiscale mechanisms. Int. J. Miner. Metall. Mater. 2025. [Google Scholar] [CrossRef]
- Akhonin, S.; Trigub, N.; Zamkov, V.; Semiatin, S. Mathematical modeling of aluminum evaporation during electron-beam cold-hearth melting of Ti-6Al-4V ingots. Metall. Mater. Trans. B 2003, 34, 447–454. [Google Scholar] [CrossRef]
- Peng, B.-B.; Li, X.-M.; Wang, X.; Mo, J.; Luo, L. Simulation study on temperature field and microstructure of Ti-6Al-4V alloy round ingot during EBCHM. Mater. Res. Express 2021, 8, 046505. [Google Scholar] [CrossRef]
- Zhu, Z.; Li, X.; Zhou, R.; Huang, H.; Xiong, W.; Li, Z. Numerical simulation of molybdenum and nickel distribution in large-scale slab ingots of Ti-0.3 wt.% Mo-0.8 wt.% Ni alloys during electron beam cold hearth melting. JOM 2022, 74, 3811–3820. [Google Scholar] [CrossRef]
- Shuster, R.E. Modeling of Aluminum Evaporation During Electron Beam Cold Hearth Melting of Titanium Alloy Ingots. Master’s Thesis, University of British Columbia, Vancouver, BC, Canada, 2013. [Google Scholar]
- Wang, M.; Chu, S.; Zhang, Q.; Liang, G.; Zhao, H.; Xu, Z.; Xu, Y.; Zhu, X.; Shi, Y.; Mao, B. Study on the Evolution Patterns of the Molten Pool and Inclusion Movement in Electron Beam Cold Hearth Melting Process. Metall. Mater. Trans. B 2024, 56, 1072–1084. [Google Scholar] [CrossRef]
- Chung, H.; Zhang, X.; Jung, S.; Zhang, Z.; Choi, C.Y. Application of machine-learned metadata-driven model for dairy barn ventilation simulation. Comput. Electron. Agric. 2022, 202, 107350. [Google Scholar] [CrossRef]
- Zhao, J.; Feng, T.; Lu, G. Understanding the local structure and thermophysical behavior of Mg-La liquid alloys via machine learning potential. Int. J. Miner. Metall. Mater. 2025, 32, 439–449. [Google Scholar] [CrossRef]
- Li, Z.-p.; Fan, X.-h.; Chen, G.; Yang, G.-m.; Sun, Y. Optimization of iron ore sintering process based on ELM model and multi-criteria evaluation. Neural Comput. Appl. 2017, 28, 2247–2253. [Google Scholar] [CrossRef]
- Nguyen, N.P.; Maghsoudi, E.; Roberts, S.N.; Kwon, B. Shape optimization of pin fin array in a cooling channel using genetic algorithm and machine learning. Int. J. Heat Mass Transf. 2023, 202, 123769. [Google Scholar] [CrossRef]
- Chen, X.; Lan, T.; Shi, X.; Tong, C. A semi-supervised linear–nonlinear least-square learning network for prediction of carbon efficiency in iron ore sintering process. Control Eng. Pract. 2020, 100, 104454. [Google Scholar] [CrossRef]
- Yang, F.; Cho, H.; Zhang, H.; Zhang, J.; Wu, Y. Artificial neural network (ANN) based prediction and optimization of an organic Rankine cycle (ORC) for diesel engine waste heat recovery. Energy Convers. Manag. 2018, 164, 15–26. [Google Scholar] [CrossRef]
- Sevinc, H.; Hazar, H. Investigation of performance and exhaust emissions of a chromium oxide coated diesel engine fueled with dibutyl maleate mixtures by experimental and ANN technique. Fuel 2020, 278, 118338. [Google Scholar] [CrossRef]
- Cui, Y.; Liu, H.; Wang, Q.; Zheng, Z.; Wang, H.; Yue, Z.; Ming, Z.; Wen, M.; Feng, L.; Yao, M. Investigation on the ignition delay prediction model of multi-component surrogates based on back propagation (BP) neural network. Combust. Flame 2022, 237, 111852. [Google Scholar] [CrossRef]
- Fernández, A.; Sanchidrián, J.A.; Segarra, P.; Gómez, S.; Li, E.; Navarro, R. Rock mass structural recognition from drill monitoring technology in underground mining using discontinuity index and machine learning techniques. Int. J. Min. Sci. Technol. 2023, 33, 555–571. [Google Scholar] [CrossRef]
- Lin, H.; Singh, S.K.; Xiang, Z.; Kang, W.H.; Raval, S.; Oh, J.; Canbulat, I. An investigation of machine learning techniques to estimate minimum horizontal stress magnitude from borehole breakout. Int. J. Min. Sci. Technol. 2022, 32, 1021–1029. [Google Scholar] [CrossRef]
- Zhong, J.; Zhang, Y.; Wang, J.; Luo, C.; Miao, Q. Unmanned aerial vehicle flight data anomaly detection and recovery prediction based on spatio-temporal correlation. IEEE Trans. Reliab. 2021, 71, 457–468. [Google Scholar] [CrossRef]
- Jin, N.; Hu, S.; Liu, X.; Guo, L. A Neural Network Method for Characterizing Particle Clusters in Gas–Solid Fluidized Beds. Ind. Eng. Chem. Res. 2024, 63, 16598–16608. [Google Scholar] [CrossRef]
- Liu, H.; Shen, F.; Gao, F. Research on flight accidents prediction based back propagation neural network. arXiv 2024, arXiv:2406.13954. [Google Scholar] [CrossRef]
- Wright, L.G.; Onodera, T.; Stein, M.M.; Wang, T.; Schachter, D.T.; Hu, Z.; McMahon, P.L. Deep physical neural networks trained with backpropagation. Nature 2022, 601, 549–555. [Google Scholar] [CrossRef] [PubMed]
- Cui, K.; Jing, X. Research on prediction model of geotechnical parameters based on BP neural network. Neural Comput. Appl. 2019, 31, 8205–8215. [Google Scholar] [CrossRef]
- Guo, Z.-H.; Wu, J.; Lu, H.-Y.; Wang, J.-Z. A case study on a hybrid wind speed forecasting method using BP neural network. Knowl.-Based Syst. 2011, 24, 1048–1056. [Google Scholar] [CrossRef]
- Ebrahimi, A.; Kleijn, C.R.; Richardson, I.M. Sensitivity of Numerical Predictions to the Permeability Coefficient in Simulations of Melting and Solidification Using the Enthalpy-Porosity Method. Energies 2019, 12, 4360. [Google Scholar] [CrossRef]
- Zhang, Z. Modeling of Al Evaporation and Marangoni Flow in Electron Beam Button Melting of Ti-6Al-4V. Master’s Thesis, University of British Columbia, Vancouver, BC, Canada, 2013. [Google Scholar]
- Wang, X.; Liu, Q.-L.; Li, X.-M. Effect of crystallizer’ s three-dimension on the solid-liquid interface morphology of the large-scale Ti64 during EBCHM. Mater. Res. Express 2019, 6, 0865h4. [Google Scholar] [CrossRef]
- Chen, H.; Long, M.; Chen, D.; Liu, T.; Duan, H. Numerical study on the characteristics of solute distribution and the formation of centerline segregation in continuous casting (CC) slab. Int. J. Heat Mass Transf. 2018, 126, 843–853. [Google Scholar] [CrossRef]
- Fluent, A. Ansys Fluent Theory Guide; Ansys Inc.: Canonsburg, PA, USA, 2011; Volume 15317, pp. 724–746. [Google Scholar]
- Wang, Y.; Xin, Y.; Gao, L.; Cao, W.; Ma, C.; Guo, S.; Chen, G. The Analysis of the Compositional Uniformity of a Ti-Al Alloy during Electron Beam Cold Hearth Melting: A Numerical Study. Metals 2024, 14, 884. [Google Scholar] [CrossRef]
- Semiatin, S.; Ivanchenko, V.; Ivasishin, O. Diffusion models for evaporation losses during electron-beam melting of alpha/beta-titanium alloys. Metall. Mater. Trans. B 2004, 35, 235–245. [Google Scholar] [CrossRef]
Disclaimer/Publisher’s Note: The statements, opinions and data contained in all publications are solely those of the individual author(s) and contributor(s) and not of MDPI and/or the editor(s). MDPI and/or the editor(s) disclaim responsibility for any injury to people or property resulting from any ideas, methods, instructions or products referred to in the content. |
© 2025 by the authors. Licensee MDPI, Basel, Switzerland. This article is an open access article distributed under the terms and conditions of the Creative Commons Attribution (CC BY) license (https://creativecommons.org/licenses/by/4.0/).
