Abstract
This study investigates the effect of Alx and Tix content (x = 0.1, 0.2, 0.3, 0.4, 0.5, and 0.6) on the microstructural evolution and mechanical properties of Co-free high-entropy AlxTixCrFe2Ni alloys in both as-cast and homogenized conditions. The research focused on the characterization of structural features, melting behavior, and mechanical performance. Microstructural characterization was carried out using optical microscopy, scanning electron microscopy (SEM), electron backscatter diffraction (EBSD), X-ray diffraction (XRD), and differential thermal analysis (DTA). Mechanical properties were evaluated through Vickers hardness testing and uniaxial compression tests. Increasing the Al and Ti content induced a transformation from a single-phase FCC structure to a dual-phase BCC structure, with the primary BCC phase strengthened by spherical precipitates rich in Al, Ti, and Ni. Homogenization annealing at 1100 °C led to an overall improvement in the mechanical properties. The Al0.3Ti0.3CrFe2Ni alloy exhibited the most balanced combination of strength and ductility after annealing, achieving a compressive yield strength of 1510 MPa, a compressive strength of 3316 MPa, and a compressive plastic strain of 45%.
1. Introduction
Research on high-entropy alloys (HEAs) has introduced a novel approach to the design of metallic materials composed of five or more elements in equal or near-equiatomic atomic ratios [1,2]. This concept enables the formation of stable solid solutions with simple ordered structures, such as face-centered cubic (FCC), body-centered cubic (BCC), and hexagonal close-packed (HCP) lattices, which exhibit outstanding mechanical properties. As a result, HEAs have attracted considerable interest for applications requiring high tensile and compressive strength and good ductility [3,4,5], high hardness, and reliable performance under extreme conditions [6,7,8,9].
First-generation HEAs were designed as single-phase solid solutions, based either on FCC structures, which provide high ductility, or BCC structures, which offer superior strength, albeit at the expense of reduced plasticity. Subsequent development of HEAs has focused on so-called multiphase alloys that combine the synergistic advantages of both FCC and BCC structures, enabling a balance of high strength and good ductility. Alloying elements such as aluminum [10], which stabilizes the BCC phase and promotes the formation of strengthening precipitates, play a significant role in these systems. A large part of current research is directed toward so-called Co-free HEAs [11,12], aiming to develop cost-efficient HEA systems capable of competing with advanced steels and superalloys [13,14]. In this type of alloy, stabilization of the FCC phase is achieved by substituting Co with other elements such as Cu and Mn [15,16,17] or by increasing the content of Ni [5,18] or Fe [19,20]. Another important alloying element in HEAs is Ti, which stabilizes the BCC phase and supports the formation of strengthening precipitates, thereby contributing to increased material strength, as in the CrFeNiAl0.4Ti0.2 alloy [21], which exhibits exceptional mechanical properties with a yield strength () of 1600 MPa, a fracture strength () of and a fracture strain () of Similarly, Ni-rich alloys, such as the FCC matrix Ni45(FeCoCr)40(AlTi)15 alloy [22], also demonstrate high mechanical properties with , , and , as do Fe-rich alloys such as Fe35Co20Cr17Ni12Al12Ti4 [23], which achieves , , and . On the other hand, excessively high Ti contents can lead to the formation of Laves phases, as in AlCoCrFeNiTi1.5 [24], where the high strength of these phases increases yield strength but significantly reduces toughness. Eutectic compositions have also been proposed [25,26,27]. In Fe-rich systems, these alloys often show high yield strength, high compressive strength, and relatively high compressive plasticity, as demonstrated by the AlCrFe2NiTi0.2 alloy [25], with mechanical properties in the as-cast state reaching 1499 MPa, 3353 MPa, and 33.9%, respectively.
Based on the results of previous research [28], a new Co-free alloy system AlxTixCrFe2Ni with increased iron content was designed to develop cost-effective HEAs exhibiting enhanced mechanical properties. The influence of the alloying elements Al and Ti in the AlxTixCrFe2Ni system (x = 0.1–0.6) was systematically evaluated with respect to their effect on phase formation, crystal structure, microhardness, and compressive strength through a direct comparison between as-cast samples and those subjected to homogenization annealing.
2. Materials and Methods
A series of medium- to high-entropy alloys with the nominal formula AlxTixCrFe2Ni2 (x = 0.1, 0.2, 0.3, 0.4, 0.5, and 0.6—denoted as AT1, AT2, AT3, AT4, AT5, and AT6, respectively) were synthesized as small ingots via arc melting in a vacuum arc furnace, the Mini Arc Melter MAM-1 (Edmund Bühler GmbH, Bodelshausen, Germany). Melting was performed under an argon atmosphere on a water-cooled copper hearth. To ensure chemical homogeneity, each ingot was remelted five times, with the ingot flipped between each pass. High-purity elemental feedstock (Fe, Ni, Cr, Al, Ti) with ≥99.9 wt.% purity was used. All alloys were examined in both as-cast and homogenized conditions. Homogenization was carried out at two temperatures, 1100 °C and 1150 °C, for 4 h each, followed by water quenching.
The crystal structures of the alloys were characterized using a Rigaku Rapid II X-ray diffractometer (Rigaku Holdings Corporation, Tokyo, Japan) equipped with a D-Max two-dimensional curved detector. Measurements were performed in reflection geometry, with the omega angle held constant at 15° and the phi axis oscillating at 15°/s.
For microstructural analysis, the samples were prepared in accordance with the ASTM E3 standard [29], following Struers metallographic procedures, including sectioning, mounting, grinding, polishing, and etching. Cutting was performed using a precision saw with a diamond wire to minimize deformation. The samples were then mounted using Poly-Fast conductive resin. Grinding began with Piano 220 discs, followed by fine grinding on Largo discs using a 9 μm diamond suspension. Polishing was carried out in two stages: first with a 3 μm diamond suspension, and then with a 1 μm diamond suspension to achieve a mirror-like surface. To reveal crystallographic features, the polished specimens were briefly etched (1–5 s) in marble etchant solution (20 mL HCl + 4 g CuSO4 + 20 mL methanol). For EBSD measurements, the sample surfaces were prepared using oxide polishing with a colloidal silica (SiO2) suspension.
Thermal analysis of the experimental alloys was performed using simultaneous thermal analysis (STA) based on differential thermal analysis (DTA) (STA-449-F3 Jupiter-NETZSCH, Germany) at a heating rate of 10 K/min up to 1450 °C. Thermal analysis was performed on as-cast samples with a mass of 150 mg, placed in alumina crucibles under a high-purity argon atmosphere.
The structural characteristics of the alloys were examined using an optical microscope ZEISS AXIO VERT A1 (Carl Zeiss, Oberkochen, Germany), while microstructural details were observed at high resolution with a scanning electron microscope (SEM), TESCAN MIRA 3 LMU (TESCAN, Brno, Czech Republic). The chemical composition of individual structural components was determined using energy-dispersive spectroscopy (EDS) (Oxford Instruments X-act; Oxford Instruments, Oxford, UK), with measurements taken in at least three different regions per sample. Phase maps of the selected microstructures were obtained via EBSD using an Oxford NordlysMax2 detector (Oxford Instruments, Abingdon, UK). The volume fraction of each phase was quantified by digital image analysis performed over more than five areas at different magnifications.
The mechanical behavior was evaluated by conducting room-temperature compression tests using a Tinius Olsen H300KU universal testing machine (Tinius Olsen, Horsham, PA, USA). Each alloy was tested in both as-cast and homogenized conditions with a minimum of two specimens per condition. The tests were conducted using cylindrical samples with dimensions of Φ 4 × 8 mm, and each specimen was subjected to a constant strain rate of 1 × 10⁻³ s−1. The microhardness of each structural component was measured on the etched sample surfaces using a Struers Duramin-5 Vickers tester (Struers, Copenhagen, Denmark) in accordance with ISO 6507-1 [30]. At least 10 indents per phase were made under a 981 mN (HV 0.1) load for 5 s. The distance between adjacent indents was kept at a minimum of three times the diagonal length of the indent to avoid interaction effects. From the measured values, the average microhardness and standard deviation were calculated for each phase.
3. Results
3.1. Characterization of Structural and Mechanical Properties of AlxTixCrFe2Ni Alloys in As-Cast State
The XRD patterns from the as-cast AlxTixCrFe2Ni alloys are displayed in Figure 1, where it is evident that the phase composition gradually changes depending on the chemical composition of the melts. Table 1 shows the variation in lattice parameters resulting from the changing chemical compositions of alloys AT1–AT6. In the AT1 alloy, which has the lowest Al and Ti content, the structure consists of a single FCC phase, with characteristic diffraction peaks observed in multiple patterns at specific 2θ positions. Specifically, these are diffraction peaks corresponding to (111) (near 19°), (200) (near 22.5°), and (220) (near 32.5°). Additional reflections observed at higher angles such as (222), (400), (331), and (420) further confirm the face-centered cubic lattice. Based on these peaks, the lattice parameter of the FCC phase was calculated to be 3.604 Å. The distinct formation of the BCC1 phase can be seen in the AT2 alloy, where its dominant peaks are identified for the (110) (near 19°), (200) (near 28°), (211) (near 35°), and (220) (near 41°) planes. Additional reflections corresponding to the (310), (222), and (321) planes further support the identification of the body-centered cubic lattice. The lattice parameter of the BCC1 phase, calculated from these reflections, was found to be 2.877 Å. In this alloy, there is even evidence of a second BCC phase (BCC2), which is identified at the same indices (211) and (220), but whose reflections slightly shift toward lower angles due to a larger lattice parameter (see Table 1). Its presence is clearly visible in the AT3 alloy, where it is also evident at (110) and (200). The lattice parameter of the FCC phase exhibits a slight increase as the Al and Ti content increases (see Table 1). In the AT4 alloy, a significant reduction in the FCC phase can be observed, which only exhibits very weak reflections in the diffraction peaks corresponding to (200) and (220). Complete disappearance of the FCC phase is observed in the AT5 alloy, whose structure is composed solely of the BCC1 and BCC2 phases. A similar trend is seen in the AT6 alloy.

Figure 1.
XRD Patterns of as-cast AlxTixCrFe2Ni alloys.

Table 1.
Lattice constants of as-cast AlxTixCrFe2Ni alloys.
Figure 2 presents the as-cast microstructures of AlxTixCrFe2Ni alloys at two scales: low-magnification images obtained via optical microscopy and high-resolution views captured using SEM. Table 2 summarizes the chemical compositions of the individual structural phases and regions obtained through EDS measurements, while the microhardness values of these regions are shown in Figure 3. The AT1 alloy exhibits a single-phase homogeneous FCC matrix containing finely dispersed precipitates of a second phase (BCC1), precipitated within the columnar interdendritic (ID) regions. The ID area primarily forms due to the presence of Ti (12.3 at.%), while the Al content remains relatively low (2.2 at.%). The overall volume fraction of this phase is less than 3%, and therefore, it was not detected by XRD measurements. The presence of the FCC phase is further supported by its low hardness, approximately 265 HV0.1 (see Figure 3). In the AT2 alloy, the volume fraction of the ID region increases to approximately 20%. According to XRD measurements, this is the BCC1 phase, characterized by small globular precipitates enriched in Al and Ti, with sizes ranging from 160 to 200 nm, as documented in Figure 2d. A similar morphology was previously observed in the Al0.5CrFe2Ni2 alloy, which was identified via selected area electron diffraction (SAED) in transmission electron microscopy (TEM) as a mixture of BCC + B2 phases [31].
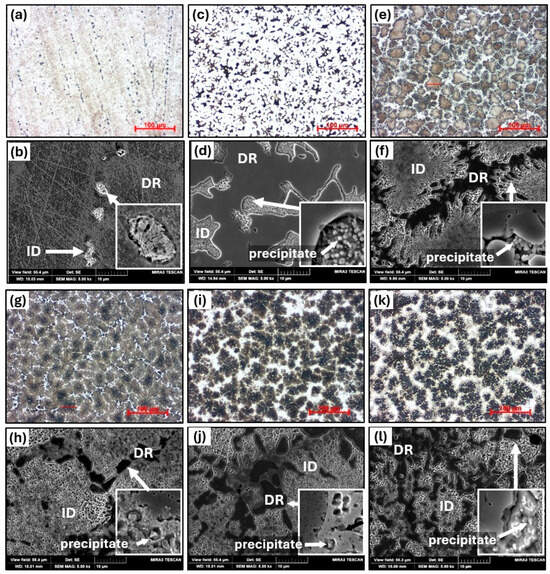
Figure 2.
The microstructure of as-cast AlxTixCrFe2Ni alloys, as observed via optical microscopy at 500× magnification and SEM at 5000× magnification: AT1(a,b), AT2 (c,d), AT3 (e,f), AT4 (g,h), AT5 (i,j), and AT6 (k,l).

Table 2.
Chemical compositions of different regions in as-cast AlxTixCrFe2Ni alloys obtained from EDS (at. %).
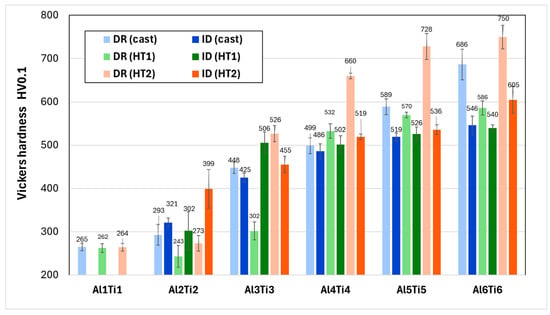
Figure 3.
Microhardness of different regions in AlxTixCrFe2Ni alloys in as-cast and heat-treated conditions.
A significant difference in microstructural evolution is observed in the AT3 alloy, which crystallizes into an equiaxed dendritic structure composed of two dominant BCC phases: a primary BCC1 phase labeled ID (dark regions in Figure 2) and a secondary BCC2 phase labeled DR (light regions in Figure 2), which precipitates preferentially along the boundaries of ID. Its volume fraction reaches 13%. The presence of both BCC phases was confirmed by XRD analysis (Figure 1). The ID phase is characterized by a high Fe content (45 at.%) and a slightly reduced content of Al and Ti compared to the nominal alloy composition. Within the ID phase, fine globular precipitates measuring 200–300 nm are detected, enriched in Al, Ti, and Ni, and depleted in Cr and Fe. The hardness of the ID phase increases to 425 HV0.1. The DR phase crystallizes as a single-phase structural constituent with a relatively high content of Al (15.8 at.%), Ti (13.7 at.%), and Ni (33.1 at.%) and a lower content of Cr (12.4 at.%) and Fe (25.1 at.%). This phase also exhibits a higher hardness of 448 HV0.1 compared to BCC1. A pronounced change in the chemical composition of the DR phase is identified in the AT4 alloy, where the content of Al (23 at.%), Ti (18.1 at.%), and Ni (38 at.%) further increases, while Cr (4.7 at.%) and Fe (16.2 at.%) decrease, resulting in an increased hardness of 499 HV0.1. The volume fraction of the DR phase is reduced to 7%. The hardness of the ID phase also increases, reaching 486 HV0.1. In alloys AT5 and AT6, the content of Al and Ti in the DR phase remains relatively stable, while a slight increase in Cr and Fe at the expense of Ni likely contributes to a further increase in hardness, reaching 589 HV0.1 and 686 HV0.1, respectively. With increasing Al and Ti content in the alloys, the volume fraction of the DR phase increases to 20% and 38%, respectively. Additionally, a slight enrichment in Al and Ti is observed within the precipitates in the ID phase. A similar morphology has been reported in AlxCrFeNiTi0.25 and AlCrFeNi2Ti0.5 alloys [32,33] after homogenization annealing at 1000 °C for 6 h followed by furnace cooling.
Figure 4 presents the DTA traces for alloys AT1–AT6 recorded from room temperature up to 1450 °C, with all characteristic temperatures indicated. Each alloy exhibits a clear endothermic peak at the high-temperature end of the curve, corresponding to its melting event. The onset melting temperature for each alloy is determined by the intersection of tangent lines drawn at the first inflection point of the peak. Alloy AT1 has the highest onset melting temperature (solidus) at 1312 °C. Melting occurs within a relatively narrow temperature interval (ΔT = 80 °C), which is characteristic of the melting of a single phase; this observation is in agreement with the XRD measurements. Additionally, a small endothermic peak is observed in this alloy at 1213 °C, representing the melting of the interdendritic (ID) phase, whose presence was confirmed by metallographic analysis, indicating a volume fraction of approximately 3%. The melting temperature of alloy AT2 shifts significantly to a lower value of 1235 °C. This change results from the coexistence of two phases: the original primary phase (FCC), showing a melting peak at 1345 °C, and the secondary BCC1 phase, which melts over a relatively broad temperature range. In alloy AT3, a higher proportion of the BCC1 phase is evident, with the onset of melting further decreasing to 1191 °C, a structural composition also confirmed by metallographic analysis. Distinct melting behavior is observed in alloy AT4, which shows two peaks: one at 1202 °C corresponding to the BCC1 phase and another at 1230 °C, which, according to XRD analysis, corresponds to the BCC2 phase. A similar trend is seen in alloy AT5, where the second peak (1242 °C) is more pronounced and the end of melting shifts towards lower temperatures, indicating the disappearance of the FCC phase, as revealed by XRD. Alloy AT6 exhibits the lowest melting temperature, recorded at 1182 °C, with the BCC2 phase (peak at 1239 °C) becoming predominant.
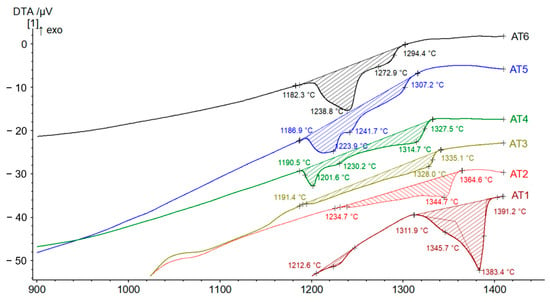
Figure 4.
DTA heating curves of AlxTixCrFe2Ni alloys in cast state.
To investigate the effects of alloying additions, compression tests were conducted on the studied HEAs containing different amounts of Al and Ti. Figure 5 presents the compressive engineering stress–strain profiles for the as-cast alloys, with their key mechanical parameters summarized in Table 3. For some alloys (AT1–AT4), no failure or loss of specimen integrity was observed during compression due to their high plasticity. Therefore, their strength characteristics are reported as the compressive maximum strength , corresponding to the uniform compressive plastic strain . This point is defined as the moment when the engineering stress begins to increase again, indicating a reversal in the slope of the stress increment, caused by the onset of non-uniform deformation. The deformation values and were determined from the specimen dimensions after testing.
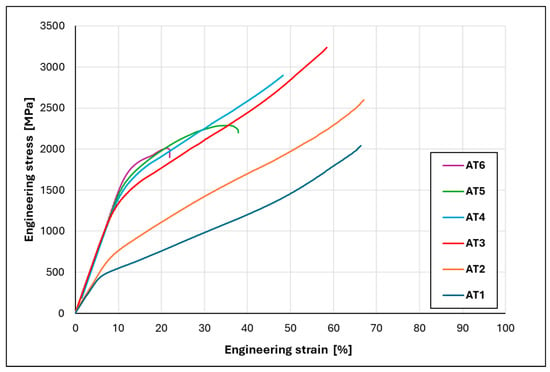
Figure 5.
Compressive engineering stress–strain curves of AlxTixCrFe2Ni alloys at room temperature.

Table 3.
Characteristic mechanical properties of AlxTixCrFe2Ni alloys in as-cast condition.
Alloy AT1 exhibits pronounced strain hardening, with plastic deformation starting at and reaching a strength at a plastic strain . Alloy AT2 shows similar behavior, with a slightly higher yield strength and maximum strength. Alloy AT3 exhibits a substantially higher yield strength (YS = 1208 MPa) and achieves the highest strength () among all as-cast states. It is also observed that the elastic modulus increases progressively from alloys AT3 to AT6. A further increase in Al and Ti content in alloys AT4, AT5, and AT6 results in a gradual rise in yield strength, reaching 1313 MPa, 1450 MPa, and 1570 MPa, respectively; however, this is accompanied by a significant reduction in overall strength and ductility (see Table 3). In the case of alloy AT5, a ductile fracture occurred along the direction of maximum shear stress, following the diagonal of the compressed cylinder, while alloy AT6 fractured in a brittle manner into multiple fragments.
3.2. Characterization of Structural and Mechanical Properties of AlxTixCrFe2Ni Alloys After Heat Treatment
Homogenization annealing of HEAs is carried out to eliminate solidification-induced segregations and is most commonly carried out at temperatures ranging from 1100 °C to 1300 °C [34,35,36,37,38], with the specific temperature depending on the chemical composition and the desired grain size. Based on DTA results, two homogenization temperatures were selected: 1100 °C, which is commonly used for HEA alloys, and 1150 °C, which is approximately 30 °C below the lowest solidus temperature. These conditions were designated as HT1 and HT2, respectively. The selected temperatures also allowed for the investigation of the thermal stability of the alloy structures.
The XRD patterns of the homogenized AlxTixCrFe2Ni alloys are presented in Figure 6, while Table 4 summarizes the variation in lattice parameters of the identified structural phases. Compared to the as-cast state, the AT1 alloy retains an FCC structure at both annealing temperatures. The AT2 alloy exhibits the presence of the BCC2 phase on the (200), (211), and (311) planes after HT1. Higher intensities of the FCC phase are observed in the AT3 alloy after HT1, while in the case of HT2, the diffraction pattern is comparable to the as-cast state. A slight indication of the presence of the FCC phase is detected in the AT4 and AT5 alloys after HT2. The phase composition of the AT6 alloy does not significantly change after either heat treatment compared to the as-cast condition.
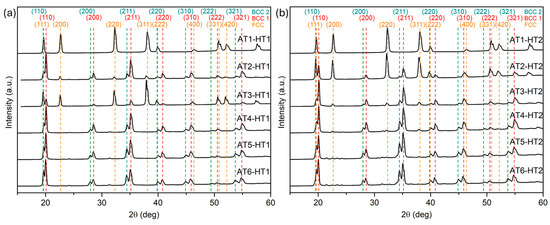
Figure 6.
XRD patterns of AlxTixCrFe2Ni alloys after homogenization annealing: (a) HT1; (b) HT2.

Table 4.
Lattice parameters of AlxTixCrFe2Ni alloys after homogenization annealing, HT1 and HT2.
Figure 7 shows the microstructural evolution after homogenization treatment under HT1 conditions, while the detailed chemical compositions of each identified phase and region are presented in Table 5. The AT1+HT1 alloy exhibits a homogeneous single-phase microstructure in which all interdendritic structural components observed in the as-cast state have been dissolved, while the hardness remains unchanged (see Figure 3). In the AT2+HT1 alloy, spheroidization of the interdendritic regions in the as-cast state was observed, with their size ranging from 15 to 30 μm. The treatment led to a reduction in the hardness of both the matrix (DR) and the secondary phase (ID). The phase composition of this alloy was further confirmed by EBSD analysis, in which the red color represents the FCC matrix and the blue color indicates the BCC phase in Figure 8. The IPF map reveals that the matrix exhibits a preferred crystallographic orientation along <111>, whereas the ID regions are randomly oriented. Pronounced homogenization of the microstructure is evident in the AT3 alloy, where spheroidization of the ID phase occurred along with the formation of polyhedral grains with diameters ranging from 50 to 80 μm. The hardness of these grains increased by 80 HV0.1 compared to the as-cast state. An increase in the number of precipitates and a more uniform size distribution was also observed. The dendritic (DR) phase is located along the boundaries of the ID phases, mostly at triple junctions, appearing as islands that tend to coalesce. Its hardness markedly decreased to 302 HV0.1 compared to the as-cast condition. In the AT4 alloy, partial spheroidization was also observed, along with an increase in the size of ID grains to approximately 48 mm.
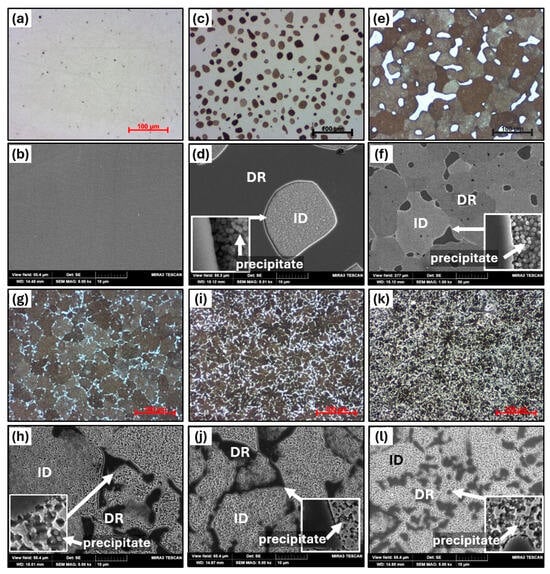
Figure 7.
The microstructure of AlxTixCrFe2Ni alloys after HT1, as observed via optical microscopy at 500× magnification and SEM at 5000× magnification: AT1+HT1 (a,b), AT2+HT1 (c,d), AT3+HT1 (e,f), AT4+HT1 (g,h), AT5+HT1 (i,j), and AT6+HT1 (k,l).

Table 5.
Chemical compositions of different regions of AlxTixCrFe2Ni alloys after HT1 and HT2 obtained from EDS (at. %).
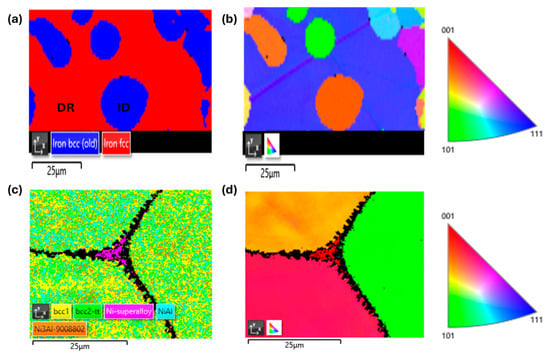
Figure 8.
Phase analysis of selected alloys in annealed state using EBSD and IPF maps: (a,b) AT2-HT1; (c,d) AT5-HT2.
The annealed microstructures of the AT5 and AT6 alloys retained a dendritic morphology, with the DR phases becoming more uniformly distributed. Their hardness decreased to 570 HV0.1 and 586 HV0.1, respectively. As a result of homogenization annealing, the chemical compositions of the BCC1 and BCC2 phases in alloys AT4, AT5, and AT6 became more homogeneous, reaching approximately the same average concentrations of the main elements Al, Ti, and Cr. Specifically, the BCC1 phase contains Al (7.8 at.%), Ti (7.4 at.%), and Cr (3.4 at.%), while the BCC2 phase contains Al (23.7 at.%), Ti (19.8 at.%), and Cr (3.5 at.%). At the same time, the Fe content slightly increased, while the Ni content slightly decreased.
The microstructural evolution following HT2 treatment is shown in Figure 9, and Table 5 summarizes the chemical compositions of the various structural phases and regions. After homogenization annealing at 1150 °C (HT2), the alloys AT1-HT2 and AT2-HT2 exhibit a similar structural morphology to that observed after HT1. In the case of AT2-HT2, the ID phase shows a larger grain size, ranging from 30 to 40 μm, compared to AT1-HT1. Structural instability due to the high annealing temperature (1150 °C) was observed in alloys AT3-HT2 to AT6-HT2, where abnormal growth of ID grains occurred, characterized by spherical islands within the grains and the precipitation of additional phases along the grain boundaries. In alloys AT4-HT2 to AT6-HT2, significant depletion of Al was detected, with the Al content decreasing to approximately half of the nominal composition. These alloys also show pronounced redistribution of chemical composition; the ID regions in the as-cast state are rich in Al, Ti, and Ni, the grain interiors are now enriched in Cr, Fe, and Ni, and the precipitates are enriched in Ti, Fe, and Ni. Their hardness gradually increased to 519 HV0.1, 536 HV0.1, and 605 HV0.1, respectively. Along the grain boundaries and at triple junctions (designated as DR), phases with high hardness were formed reaching values of 660 HV0.1, 728 HV0.1, and 750 HV0.1, respectively. In these regions, Al was almost completely depleted, with its content reduced to as low as 1.7 at.%, while Ti, Fe, and Ni were strongly enriched.
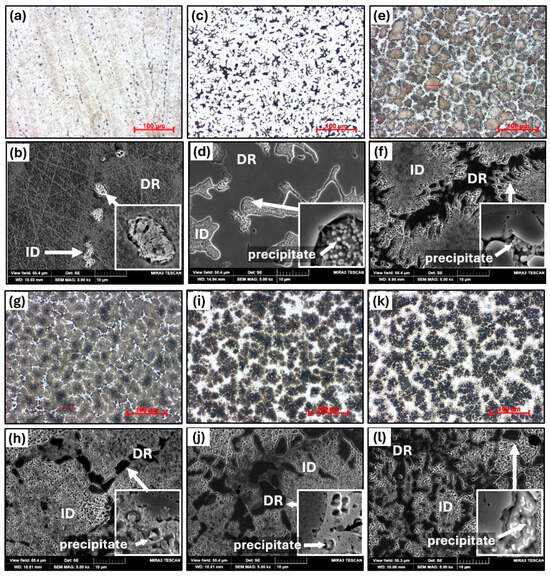
Figure 9.
The microstructure of AlxTixCrFe2Ni alloys after HT2, as observed via optical microscopy at 500× magnification and SEM at 5000× magnification: AT1+HT2 (a,b), Al2+HT2 (c,d), Al3+HT2 (e,f), Al4+HT2 (g,h), Al5+HT2 (i,j), and Al6+HT2 (k,l).
The phase composition determined by EBSD analysis (Figure 8) demonstrates that the grains of alloy AT5-HT2 consist of a mixture of multiple phases, including BCC1, BCC2, B2 (NiAl), and L12 (Ni3Al). The identification of these phases in the EBSD analysis was based on their lattice parameters. Along the grain boundaries and at triple junctions, there is an FCC phase (Ni-based superalloy) which was also identified by X-ray analysis. Detailed identification of these phases requires transmission electron diffraction.
Figure 10 compares the compressive engineering stress–strain curves obtained under different heat treatment conditions (HT1 and HT2). For reference, the stress–strain curves of the as-cast condition, taken from Figure 5, are also included to allow for direct comparison of the different processing states (the as-cast curves are shown as a thin dotted line). The corresponding key mechanical properties are summarized in Table 6. The AT1 alloy retains high plasticity after both homogenization annealing treatments (HT1 and HT2), with a slight increase in both strength and plasticity compared to the as-cast state. A reduction in uniform compressive plastic strain due to HT2 annealing can be observed starting from the AT2-HT2 alloy. The most beneficial effect of homogenization annealing was observed under HT1 conditions in the AT3-HT1 alloy, where the strength increased compared to the as-cast state, reaching at a plastic strain . HT1 treatment also had a positive effect on the AT4-HT1, AT5-HT1, and AT6-HT1 alloys, with a gradual increase in both strength and plastic strain. In the case of AT6, the strength increased to and the plasticity to . In contrast, HT2 treatment led to a deterioration of the mechanical properties, as the strength of the AT4-HT2 alloy decreased to from the original as-cast value of . For the AT5-HT2 and AT6-HT2 alloys, due to their high brittleness, it was not possible to produce test specimens for compression testing; therefore, their stress–strain curves are not presented.
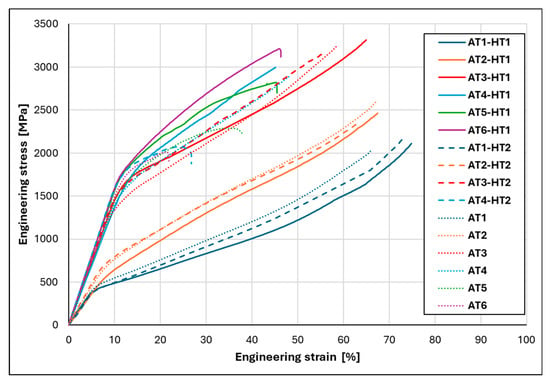
Figure 10.
Comparison of compressive engineering stress–strain curves of AlxTixCrFe2Ni alloys after homogenization annealing under HT1 and HT2 conditions.

Table 6.
Characteristic mechanical properties of AlxTixCrFe2Ni alloys after homogenization annealing under HT1 and HT2 conditions.
4. Discussion
4.1. Effect of Chemical Composition on Microstructural Evolution
The chemical composition and the thermodynamic solidification conditions determine the resulting phase composition of HEAs. Elements with a higher concentration of valence electrons, such as Fe, Ni, Co, and Mn, primarily stabilize the FCC phase [39,40], while elements with a lower concentration of valence electrons, such as Al, Ti, and Cr, promote and stabilize the BCC phase [41,42]. The key thermodynamic parameters used to characterize the investigated HEAs, most commonly applied to predict structural stability and phase formation, are summarized in Table 7. These include values calculated using empirical rules for atomic size difference (δ), valence electron concentration (VEC), mixing enthalpy (ΔHmix), and the Ω parameter, which combines mixing enthalpy, mixing entropy (ΔSmix), and melting temperature (Tm).

Table 7.
The thermodynamic parameters of the investigated as-cast alloys.
According to Guo et al. [42,43], FCC phases are stable when the VEC > 8, whereas FCC and BCC phases coexist in alloys with VEC values ranging from 6.87 to 8. This prediction is in full agreement with the results for our investigated alloys, which, starting from the lowest concentrations of Al and Ti, exhibit the presence of both FCC and BCC phases. At higher Al and Ti concentrations, as in the case of AT6, two distinct BCC phases are even observed (see Figure 1 and Figure 3). Figure 11 compares the VEC values of the HEAs investigated in this study, AlxTixCrFe2Ni, which are Fe-based, with a similar alloy system, AlxTixCrFe2Ni2, richer in Fe and Ni, studied in our previous work [28]. From the comparison of VEC values and microstructures, it is evident that the AlxTixCrFe2Ni alloy system contributes more strongly to the formation of BCC phases. For example, the AT3 alloy (Al0.3Ti0.3CrFe2Ni) exhibits an even higher BCC phase fraction than the Al0.6Ti0.6CrFe2Ni2 alloy [28]. Several studies [44,45,46,47] have demonstrated that this type of Fe-rich alloy consists of a disordered BCC (A2) matrix rich in Fe and Cr, containing uniformly distributed ultrafine BCC (B2) precipitates with high hardness. Further increases in Al and Ti content promote the development of the BCC structure. According to the solid solution stability assessment by the authors [48,49], the AT5 and AT6 alloys exceed the recommended limits for the atomic size difference (1% < δ < 6.6%) and for mixing enthalpy (−15 kJ·mol−1 ≤ ΔHmix ≤ 5 kJ·mol−1), indicating a strong tendency toward phase segregation or intermetallic formation. This prediction is consistent with the obtained microstructures of the investigated alloys, as confirmed not only by structural analyses but also by X-ray diffraction measurements.

Figure 11.
A graphical interpretation of the thermodynamic parameters of the as-cast alloys under study compared with alloys from our previous research [28]: (a) the relationship between the VEC and the content of AlxTix; (b) a prediction map of the alloys based on the correlation between ΔHmix and δ.
4.2. Thermal Stability of Investigated Alloys
Thermal analysis was used to measure the solidus temperatures of the investigated alloys, as summarized in Table 7. As can be seen, with increasing Al and Ti content, the solidus temperature shifts to lower values due to changes in phase composition, decreasing from 1312 °C to 1182 °C, which represents a reduction of 130 °C. Several authors [50,51] have confirmed that in AlxCoCrFeNi-type alloys, as the Al content increases from 0 at.% to 0.7 at.%, the solidus temperature decreases from 1690 K to 1621 K, but with further increases in Al content from 0.7 at.% to 1.8 at.%, the solidus temperature rises again to 1680 K. Other authors working with Ni51Co18Fe5Cr10Al16–xTix and AlCrFeNiTix alloys [52] have shown that Ti content also has a significant effect on reducing the solidus temperature. In the alloys investigated in this study (AT3–AT6), the solidus temperatures were considerably lower than those of the Ni-based alloys reported in [52]. This reduction is likely caused by the combined effect of Al, Ti, and Fe.
Homogenization annealing in the HT1 regime led to several beneficial microstructural modifications, including spheroidization of interdendritic regions without a significant change in their size, a more uniform distribution of the BCC2 phase along the ID boundaries, an increased number and more homogeneous distribution of precipitates within the ID phase, and the absence of low-melting phase segregation. These changes contributed to improved strength and plastic strain of the alloys. The results also indicate that the studied HEAs after HT1 exhibit outstanding thermal stability during homogenization annealing at temperatures up to 0.9Tm, which significantly exceeds the typical values applied in conventional steels. This thermal resistance is comparable to values characteristic of high-performance superalloys, such as INCONEL 718 [53].
Heat treatment under the HT2 regime had a similar effect on alloys with higher solidus temperatures (AT1 and AT2) as those observed under the HT1 regime, without significant degradation of the microstructure. In contrast, for alloys AT3 through AT6, pronounced grain growth of ID regions and precipitation of hard phases along grain boundaries were observed. These phenomena indicate localized overheating of the material during annealing, leading to a disruption of phase equilibrium and partial degradation of the characteristic HEA microstructure.
4.3. Mechanical Properties of Investigated Alloys
The mechanical properties of the analyzed alloys are strongly influenced by their chemical composition and structural state. Alloys that contain a combination of FCC and BCC phases in the as-cast condition (AT1 and AT2) are characterized by lower hardness, yield strength, and elastic modulus, while retaining high plastic strain. In contrast, alloys with higher Al and Ti contents (AT3–AT6) are predominantly composed of two BCC phases (BCC1 and BCC2), which leads to a gradual increase in yield strength up to 1570 MPa. This effect is most pronounced in the AT3 alloy, which exhibits the highest strength within this group.
Homogenization annealing at 1100 °C (HT1) had a beneficial effect on the mechanical properties of all investigated alloys. For the AT1-HT1 and AT2-HT1 alloys, a reduction in strengthening was observed compared to the as-cast condition, which can be attributed to the chemical homogenization of the FCC phase. This process reduces local segregation of alloying elements, resulting in a more uniform solid solution and, consequently, a lower resistance to dislocation movement.
In the AT3-HT1 alloy, a significant increase in yield strength along with improved plasticity was observed. These enhancements are attributed to the homogenization of interdendritic (ID) regions, which, after heat treatment, exhibit a more uniform microstructure with a higher number of finer precipitates compared to the as-cast state. As a result, the AT3 alloy demonstrated the best overall mechanical performance, achieving a maximum compressive strength of 3316 MPa at a 45% plastic strain.
The most pronounced improvement in mechanical behavior, especially in terms of plasticity, was found in the AT5-HT1 and AT6-HT1 alloys. This improvement is directly linked to the microstructural evolution of the BCC2 phase, which undergoes noticeable softening after homogenization compared to the as-cast condition. Consequently, the material exhibits enhanced plastic deformability.
The negative effect of high-temperature annealing of alloys composed of two BCC phases is attributed to abnormal grain growth and phase segregation. During homogenization, hard phases (with microhardness values of 660–750 HV0.1) tend to segregate along grain boundaries, leading to the formation of brittle, hard zones at interfaces. This microstructural evolution significantly impairs mechanical performance by promoting crack initiation and reducing the alloy’s ability to undergo plastic deformation.
Figure 12 compares the mechanical properties of the HEAs developed in this work with similar alloys alloyed with aluminum and titanium. From the graph, it is evident that with increasing Al and Ti content in the alloys, the yield strength (YS) also increases.
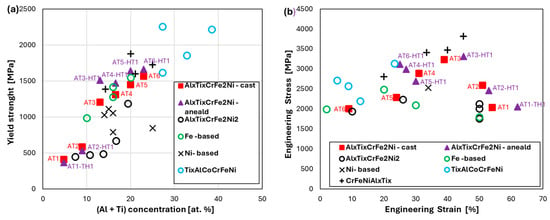
Figure 12.
Comparison of mechanical properties with other HEA alloys, such as AlxTixCrFe2Ni2 [28], Ni-based [16,52,54], Fe-based [23,55,56], and CrFeNiAlxTix [21,33] alloys: (a) relationship between yield strength (YS) and Al+Ti concentration; (b) relationship between engineering stress versus engineering strain.
The compared alloys can be categorized into three groups based on the concentration of Al and Ti, enabling a clearer analysis of the relationship between alloying element content and YS (Figure 12a):
- Alloys containing up to 10 at.% (Al + Ti) exhibit a YS below 1000 MPa;
- Alloys with 10–20 at.% show a YS in the range of 1000–1500 MPa;
- For concentrations above 20 at.%, the YS ranges between 1500 and 2000 MPa, and in some cases even higher.
Most of the BCC-structured alloys in this study, following HT1 annealing, exhibit YS values exceeding 1500 MPa, as indicated by the purple triangles. Figure 12b presents the engineering stress–strain curves, showing that alloys with a high YS generally exhibit reduced plasticity, which limits their compressive strength. However, the AT2, AT3, and AT4 alloys represent a very good compromise between strength and plasticity. Moreover, these alloys offer a cost advantage over comparable CrFeNiAlxTix-type HEAs (represented by black crosses), as they contain lower amounts of expensive alloying elements such as Ti, Cr, and Ni.
5. Conclusions
In this study, six HEAs in the AlxTixCrFe2Ni system, alloyed with aluminum and titanium, were investigated. The research focused on the characterization of their structure, melting temperatures, and evaluation of their mechanical properties through microhardness measurements and compression tests, both in the as-cast state and after homogenization annealing. The main findings can be summarized as follows:
- With increasing Al and Ti content, the crystal structure evolved from a single FCC phase to a mixture of FCC and BCC phases, and at higher concentrations, to a dual-phase BCC structure (BCC1 + BCC2). The BCC1 phase is strengthened by spherical precipitates rich in Al, Ti, and Ni.
- In alloys containing both BCC1 and BCC2 phases, a relatively low solidus temperature was observed, decreasing progressively with increasing Al and Ti content—from 1191 °C for alloy AT3 to 1182 °C for alloy AT6.
- Homogenization annealing at 1100 °C resulted in enhanced mechanical properties, reflected in the increased yield strength, compressive strength, and ductility, as well as a reduction in the microhardness of individual structural constituents.
- Alloy AT3 exhibited the most balanced combination of strength and ductility, both in the as-cast state and after homogenization annealing at 1100 °C. Compared to other Al- and Ti-alloyed HEAs, it also offers lower production costs due to its relatively lower content of expensive alloying elements such as Ti, Cr, and Ni.
- Homogenization annealing at 1150 °C led to significant microstructural degradation in alloys containing both BCC1 and BCC2 phases, resulting in a marked deterioration of mechanical properties.
Author Contributions
Conceptualization, R.K. and K.S.; methodology, R.K., I.P., G.S., O.M., K.K., and D.C.; software, R.K., G.S., K.S., K.K., and O.M.; validation, P.P., O.M., K.S., P.D., and D.C.; formal analysis, R.K., I.P., and O.M.; investigation, R.K., I.P., K.S., G.S., and O.M.; resources, D.C. and K.S.; data curation, R.K., K.S., and O.M.; writing—original draft preparation, R.K.; writing—review and editing, P.P., O.M., P.D., and D.C.; visualization, R.K., O.M., and G.S.; supervision, R.K. and K.S.; project administration, R.K.; funding acquisition, R.K. All authors have read and agreed to the published version of the manuscript.
Funding
This research was funded by NextGenerationEU through the Recovery and Resilience Plan for Slovakia under the project No. 09I03-03-V04-00048.
Data Availability Statement
The data are contained within the article.
Conflicts of Interest
The authors declare no conflicts of interest.
References
- Chen, J.; Zhou, Y.; Yu, L.; Zeng, S.; Wang, A.; Fu, H.; Zhang, H.; Zhang, H.; Zhu, Z. Enhancing Strength-Ductility Combination of Fe–Ni–Cr–Al–Ti High-Entropy Alloys via Co-Precipitation of Sigma and L21 Phases. Mater. Sci. Eng. A 2024, 913, 147062. [Google Scholar] [CrossRef]
- Cantor, B.; Chang, I.T.H.; Knight, P.; Vincent, A.J.B. Microstructural Development in Equiatomic Multicomponent Alloys. Mater. Sci. Eng. A 2004, 375–377, 213–218. [Google Scholar] [CrossRef]
- Wen, L.H.; Kou, H.C.; Li, J.S.; Chang, H.; Xue, X.Y.; Zhou, L. Effect of Aging Temperature on Microstructure and Properties of AlCoCrCuFeNi High-Entropy Alloy. Intermetallics 2009, 17, 266–269. [Google Scholar] [CrossRef]
- Zhu, J.M.; Fu, H.M.; Zhang, H.F.; Wang, A.M.; Li, H.; Hu, Z.Q. Synthesis and Properties of Multiprincipal Component AlCoCrFeNiSix Alloys. Mater. Sci. Eng. A 2010, 527, 7210–7214. [Google Scholar] [CrossRef]
- Liu, X.X.; Ma, S.G.; Song, W.D.; Zhao, D.; Wang, Z.H. Microstructure Evolution and Mechanical Response of Co-Free Ni2CrFeAl0.3Tix High-Entropy Alloys. J. Alloys Compd. 2023, 931, 167523. [Google Scholar] [CrossRef]
- Fu, W.; Zheng, W.; Huang, Y.; Guo, F.; Jiang, S.; Xue, P.; Ren, Y.; Fan, H.; Ning, Z.; Sun, J. Cryogenic Mechanical Behaviors of CrMnFeCoNi High-Entropy Alloy. Mater. Sci. Eng. A 2020, 789, 139579. [Google Scholar] [CrossRef]
- Ding, Q.; Fu, X.; Chen, D.; Bei, H.; Gludovatz, B.; Li, J.; Zhang, Z.; George, E.P.; Yu, Q.; Zhu, T.; et al. Real-Time Nanoscale Observation of Deformation Mechanisms in CrCoNi-Based Medium- to High-Entropy Alloys at Cryogenic Temperatures. Mater. Today 2019, 25, 21–27. [Google Scholar] [CrossRef]
- Praveen, S.; Kim, H.S. High-Entropy Alloys: Potential Candidates for High-Temperature Applications–An Overview. Adv. Eng. Mater. 2018, 20, 1700645. [Google Scholar] [CrossRef]
- Chen, J.; Zhou, X.; Wang, W.; Liu, B.; Lv, Y.; Yang, W.; Xu, D.; Liu, Y. A Review on Fundamental of High Entropy Alloys with Promising High–Temperature Properties. J. Alloys Compd. 2018, 760, 15–30. [Google Scholar] [CrossRef]
- Wang, W.-R.; Wang, W.-L.; Wang, S.-C.; Tsai, Y.-C.; Lai, C.-H.; Yeh, J.-W. Effects of Al Addition on the Microstructure and Mechanical Property of AlxCoCrFeNi High-Entropy Alloys. Intermetallics 2012, 26, 44–51. [Google Scholar] [CrossRef]
- Mohammadzadeh, R.; Heidarzadeh, A.; Tarık Serindağ, H.; Çam, G. Microstructure and Mechanical Response of Novel Co-Free FeNiMnCrAlTi High-Entropy Alloys. J. Mater. Res. Technol. 2023, 26, 2043–2049. [Google Scholar] [CrossRef]
- Jiang, Z.; Chen, W.; Xia, Z.; Xiong, W.; Fu, Z. Influence of Synthesis Method on Microstructure and Mechanical Behavior of Co-Free AlCrFeNi Medium-Entropy Alloy. Intermetallics 2019, 108, 45–54. [Google Scholar] [CrossRef]
- Fedoriková, A.; Petroušek, P.; Kvačkaj, T.; Kočiško, R.; Zemko, M. Development of Mechanical Properties of Stainless Steel 316LN-IG after Cryo-Plastic Deformation. Materials 2023, 16, 6473. [Google Scholar] [CrossRef]
- Petroušek, P.; Kvačkaj, T.; Bidulská, J.; Bidulský, R.; Grande, M.A.; Manfredi, D.; Weiss, K.-P.; Kočiško, R.; Lupták, M.; Pokorný, I. Investigation of the Properties of 316L Stainless Steel after AM and Heat Treatment. Materials 2023, 16, 3935. [Google Scholar] [CrossRef]
- Guo, S.; Ng, C.; Liu, C.T. Anomalous Solidification Microstructures in Co-Free AlxCrCuFeNi2 High-Entropy Alloys. J. Alloys Compd. 2013, 557, 77–81. [Google Scholar] [CrossRef]
- Wang, X.; Liu, J.; Zhang, Y.; Zhang, A.; Hou, H.; Miao, Z.; Hongliang, D. Microstructure and Mechanical Property of Novel Nanoparticles Strengthened AlCrCuFeNi Dual-Phase High Entropy Alloy. Mater. Today Commun. 2022, 32, 104155. [Google Scholar] [CrossRef]
- Wei, R.; Zhang, K.; Chen, L.; Han, Z.; Wang, T.; Chen, C.; Jiang, J.; Hu, T.; Li, F. Novel Co-Free High Performance TRIP and TWIP Medium-Entropy Alloys at Cryogenic Temperatures. J. Mater. Sci. Technol. 2020, 57, 153–158. [Google Scholar] [CrossRef]
- Luo, S.; Wang, Z.; Nagaumi, H.; Wu, Z. Tailoring the Microstructure and Mechanical Property of Additively Manufactured AlCrCuFeNi3.0 High-Entropy Alloy through Heat Treatment. Mater. Sci. Eng. A 2022, 844, 143192. [Google Scholar] [CrossRef]
- Ren, B.; Zhao, R.-F.; Liu, Z.-X.; Guan, S.-K.; Zhang, H.-S. Microstructure and Properties of Al0.3CrFe1.5MnNi0.5Ti x and Al0.3CrFe1.5MnNi0.5Si x High-Entropy Alloys. Rare Met. 2014, 33, 149–154. [Google Scholar] [CrossRef]
- Wang, Z.; Baker, I.; Guo, W.; Poplawsky, J.D. The Effect of Carbon on the Microstructures, Mechanical Properties, and Deformation Mechanisms of Thermo-Mechanically Treated Fe40.4Ni11.3Mn34.8Al7.5Cr6 High Entropy Alloys. Acta Mater. 2017, 126, 346–360. [Google Scholar] [CrossRef]
- Zhang, M.; Ma, Y.; Dong, W.; Liu, X.; Lu, Y.; Zhang, Y.; Li, R.; Wang, Y.; Yu, P.; Gao, Y.; et al. Phase Evolution, Microstructure, and Mechanical Behaviors of the CrFeNiAlxTiy Medium-Entropy Alloys. Mater. Sci. Eng. A 2020, 771, 138566. [Google Scholar] [CrossRef]
- Zhang, L.; Zhou, Y.; Jin, X.; Du, X.; Li, B. The Microstructure and High-Temperature Properties of Novel Nano Precipitation-Hardened Face Centered Cubic High-Entropy Superalloys. Scr. Mater. 2018, 146, 226–230. [Google Scholar] [CrossRef]
- Stepanov, N.D.; Shaysultanov, D.G.; Tikhonovsky, M.A.; Zherebtsov, S.V. Structure and High Temperature Mechanical Properties of Novel Non-Equiatomic Fe-(Co, Mn)-Cr-Ni-Al-(Ti) High Entropy Alloys. Intermetallics 2018, 102, 140–151. [Google Scholar] [CrossRef]
- Zhou, Y.J.; Zhang, Y.; Wang, Y.L.; Chen, G.L. Solid Solution Alloys of AlCoCrFeNiTix with Excellent Room-Temperature Mechanical Properties. Appl. Phys. Lett. 2007, 90, 181904. [Google Scholar] [CrossRef]
- Zhang, J.; Yang, J.; Liu, T.; Tian, D.; Liu, H.; Yang, G.; Lu, Y.; Shoji, T. Microstructure and Mechanical Properties of Co-Free AlCrFeNiTi0.2 Eutectic High-Entropy Alloy. J. Mater. Res. Technol. 2024, 33, 6688–6700. [Google Scholar] [CrossRef]
- Li, S.; Chen, F.; Tang, X.; Ge, G.; Sun, Z.; Geng, Z.; Fan, M.; Huang, P. Effect of Ti on the Microstructure and Mechanical Properties of AlCrFeNiTix Eutectic High-Entropy Alloys. J. Mater. Eng. Perform. 2022, 31, 8294–8303. [Google Scholar] [CrossRef]
- Wei, C.; Du, X.; Lu, Y.; Jiang, H.; Li, T.; Wang, T. Novel As-Cast AlCrFe2Ni2Ti05 High-Entropy Alloy with Excellent Mechanical Properties. Int. J. Miner. Met. Mater. 2020, 27, 1312–1317. [Google Scholar] [CrossRef]
- Kočiško, R.; Petroušek, P.; Saksl, K.; Petryshynets, I.; Milkovič, O.; Csík, D. The Influence of Ti and Al on the Evolution of Microstructure and Mechanical Properties in Medium-Entropy and High-Entropy Alloys Based on AlxTixCrFe2Ni2. Materials 2025, 18, 1382. [Google Scholar] [CrossRef]
- ASTM E3-11; Standard Guide for Preparation of Metallographic Specimens. ASTM International: West Conshohocken, PA, USA, 2011.
- ISO 6507-1:2023; Metallic Materials—Vickers Hardness Test. International Organization for Standardization: Geneva, Switzerland, 2023.
- Wei, C.; Li, L.; Lu, Y.; Du, X.; Wang, T. Evolution of Microstructure and Mechanical Properties of As-Cast AlxCrFe2Ni2 High-Entropy Alloys with Al Content. Met. Mater. Trans. A 2021, 52, 1850–1860. [Google Scholar] [CrossRef]
- Jiang, L.; Jiang, H.; Lu, Y.; Wang, T.; Cao, Z.; Li, T. Mechanical Properties Improvement of AlCrFeNi2Ti0.5 High Entropy Alloy through Annealing Design and Its Relationship with Its Particle-Reinforced Microstructures. J. Mater. Sci. Technol. 2015, 31, 397–402. [Google Scholar] [CrossRef]
- Liu, S.; Gao, M.C.; Liaw, P.K.; Zhang, Y. Microstructures and Mechanical Properties of AlxCrFeNiTi0.25 Alloys. J. Alloys Compd. 2015, 619, 610–615. [Google Scholar] [CrossRef]
- Li, Y.; Xie, J.; Zhang, Z.; Zhang, X.; Ren, X.; Chen, L. Effect of Homogenization Annealing on Microstructure and Mechanical Properties of AlMo0.5NbTa0.5TiZr Refractory High Entropy Alloy Manufactured by Laser Metal Deposition. Mater. Charact. 2025, 225, 115119. [Google Scholar] [CrossRef]
- Chang, Y.-J.; Yeh, A.-C. The Evolution of Microstructures and High Temperature Properties of AlxCo1.5CrFeNi1.5Tiy High Entropy Alloys. J. Alloys Compd. 2015, 653, 379–385. [Google Scholar] [CrossRef]
- Saboktakin Rizi, M.; Ebrahimian, M.; Minouei, H.; Shim, S.H.; Pouraliakbar, H.; Fallah, V.; Park, N.; Hong, S.I. Enhancing Mechanical Properties in Ti-Containing FeMn40Co10Cr10C0.5 High-Entropy Alloy through Chi (χ) Phase Dissolution and Precipitation Hardening. Mater. Lett. 2024, 377, 137516. [Google Scholar] [CrossRef]
- Peng, H.; Hu, L.; Baker, I. Effects of Thermo-Mechanical Treatment on the Microstructures and Mechanical Properties of a Medium-Entropy Alloy. High Entropy Alloys Mater. 2023, 1, 295–311. [Google Scholar] [CrossRef]
- Rezaee, A.; Ketabchi, M.; Shams, S.A.A.; Jafarian, H.R.; Lee, C.S. Characteristics of the Cold-Rolled Multi-Phase Cr30Fe30Ni15Co10Cu10Ti5 High-Entropy Alloy. Met. Mater. Int. 2023, 29, 1366–1381. [Google Scholar] [CrossRef]
- Wang, M.; Wen, Z.; Liang, L.; Chen, W.; Mo, H.; Wei, G.; Zhao, Y. Excellent Combination of Compressive Strength and Strain of AlCrFeNi MPEAs via Adding Ti and V. J. Alloys Compd. 2023, 947, 169560. [Google Scholar] [CrossRef]
- Lu, W.; Yan, K.; Luo, X.; Wang, Y.; Hou, L.; Li, P.; Huang, B.; Yang, Y. Superb Strength and Ductility Balance of a Co-Free Medium-Entropy Alloy with Dual Heterogeneous Structures. J. Mater. Sci. Technol. 2022, 98, 197–204. [Google Scholar] [CrossRef]
- Yeh, J.-W. Overview of High-Entropy Alloys. In High-Entropy Alloys: Fundamentals and Applications; Gao, M.C., Yeh, J.-W., Liaw, P.K., Zhang, Y., Eds.; Springer International Publishing: Cham, Switzerland, 2016; pp. 1–19. ISBN 978-3-319-27013-5. [Google Scholar]
- Guo, S.; Liu, C.T. Phase Stability in High Entropy Alloys: Formation of Solid-Solution Phase or Amorphous Phase. Prog. Nat. Sci. Mater. Int. 2011, 21, 433–446. [Google Scholar] [CrossRef]
- Guo, S.; Ng, C.; Lu, J.; Liu, C.T. Effect of Valence Electron Concentration on Stability of Fcc or Bcc Phase in High Entropy Alloys. J. Appl. Phys. 2011, 109, 103505. [Google Scholar] [CrossRef]
- Peng, S.; Wang, S.; Hao, Z.; Wang, D.; Shu, D. Hierarchical Coherent Precipitates Lead to High Tensile Strength in Casting BCC-Structured Al0.8CrNiMn2Fe2.5 High-Entropy Alloy. J. Mater. Res. Technol. 2025, 36, 903–912. [Google Scholar] [CrossRef]
- Liu, J.; Jiang, Z.; Chen, W.; Fan, H.; Fu, Z. Microstructural Evolution and Mechanical Behavior of Co-Free (Fe40Ni30Cr20Al10)100−x Ti x High-Entropy Alloys. Adv. Eng. Mater. 2023, 25, 2300946. [Google Scholar] [CrossRef]
- Jiang, Z.; Chen, W.; Chu, C.; Fu, Z.; Ivanisenko, J.; Wang, H.; Peng, S.; Lu, Y.; Lavernia, E.J.; Hahn, H. Directly Cast Fibrous Heterostructured FeNi0.9Cr0.5Al0.4 High Entropy Alloy with Low-Cost and Remarkable Tensile Properties. Scr. Mater. 2023, 230, 115421. [Google Scholar] [CrossRef]
- Nguyen, C.; Tieu, A.K.; Deng, G.; Wexler, D.; Vo, T.D.; Wang, L.; Yang, J. Tribological Performance of a Cost-Effective CrFeNiAl0.3Ti0.3 High Entropy Alloy Based Self-Lubricating Composite in a Wide Temperature Range. Tribol. Int. 2022, 174, 107743. [Google Scholar] [CrossRef]
- Guo, S. Phase Selection Rules for Cast High Entropy Alloys: An Overview. Mater. Sci. Technol. 2015, 31, 1223–1230. [Google Scholar] [CrossRef]
- Yang, X.; Zhang, Y. Prediction of High-Entropy Stabilized Solid-Solution in Multi-Component Alloys. Mater. Chem. Phys. 2012, 132, 233–238. [Google Scholar] [CrossRef]
- Wang, W.-R.; Wang, W.-L.; Yeh, J.-W. Phases, Microstructure and Mechanical Properties of AlxCoCrFeNi High-Entropy Alloys at Elevated Temperatures. J. Alloys Compd. 2014, 589, 143–152. [Google Scholar] [CrossRef]
- Chen, X.; Qi, J.Q.; Sui, Y.W.; He, Y.Z.; Wei, F.X.; Meng, Q.K.; Sun, Z. Effects of Aluminum on Microstructure and Compressive Properties of Al-Cr-Fe-Ni Eutectic Multi-Component Alloys. Mater. Sci. Eng. A 2017, 681, 25–31. [Google Scholar] [CrossRef]
- Joseph, J.; Annasamy, M.; Kada, S.R.; Hodgson, P.D.; Barnett, M.R.; Fabijanic, D.M. Optimising the Al and Ti Compositional Window for the Design of γ’ (L12)-Strengthened Al–Co–Cr–Fe–Ni–Ti High Entropy Alloys. Mater. Sci. Eng. A 2022, 835, 142620. [Google Scholar] [CrossRef]
- Zhao, Y.; Li, K.; Gargani, M.; Xiong, W. A Comparative Analysis of Inconel 718 Made by Additive Manufacturing and Suction Casting: Microstructure Evolution in Homogenization. Addit. Manuf. 2020, 36, 101404. [Google Scholar] [CrossRef]
- Yang, T.; Zhao, Y.L.; Tong, Y.; Jiao, Z.B.; Wei, J.; Cai, J.X.; Han, X.D.; Chen, D.; Hu, A.; Kai, J.J.; et al. Multicomponent Intermetallic Nanoparticles and Superb Mechanical Behaviors of Complex Alloys. Science 2018, 362, 933–937. [Google Scholar] [CrossRef] [PubMed]
- Jain, H.; Shadangi, Y.; Singh, L.K.; Dubey, A.K.; Mukhopadhyay, N.K. Dual-Phase Fe40Mn20Cr15Ti10Al10Ni5 High-Entropy Alloy Prepared by Mechanical Alloying and Spark Plasma Sintering: Alloying Behavior, Thermal Stability, and Mechanical Properties. J. Mater. Res. 2025, 40, 123–139. [Google Scholar] [CrossRef]
- Shaysultanov, D.G.; Salishchev, G.A.; Ivanisenko, Y.V.; Zherebtsov, S.V.; Tikhonovsky, M.A.; Stepanov, N.D. Novel Fe36Mn21Cr18Ni15Al10 High Entropy Alloy with Bcc/B2 Dual-Phase Structure. J. Alloys Compd. 2017, 705, 756–763. [Google Scholar] [CrossRef]
Disclaimer/Publisher’s Note: The statements, opinions and data contained in all publications are solely those of the individual author(s) and contributor(s) and not of MDPI and/or the editor(s). MDPI and/or the editor(s) disclaim responsibility for any injury to people or property resulting from any ideas, methods, instructions or products referred to in the content. |
© 2025 by the authors. Licensee MDPI, Basel, Switzerland. This article is an open access article distributed under the terms and conditions of the Creative Commons Attribution (CC BY) license (https://creativecommons.org/licenses/by/4.0/).