Article

Experimental Study on the Microscale Milling Process of DD5 Nickel-Based Single-Crystal Superalloy

1
Shenyang Institute of Technology, Fushun 113122, China
2
School of Mechanical Engineering and Automation Northeastern University, Shenyang 110819, China
*
Author to whom correspondence should be addressed.
Metals 2025, 15(8), 898; https://doi.org/10.3390/met15080898
Submission received: 1 July 2025 / Revised: 3 August 2025 / Accepted: 5 August 2025 / Published: 11 August 2025

Abstract

Technological advances have expanded the use of single-crystal in microscale applications—particularly in infrared optics, electronics, and aerospace. Conducting research on the surface quality of micro-milling processes for single-crystal superalloys has become a key factor in expanding their applications. In this paper, the nickel-based single-crystal superalloy DD5 is selected as the test object, and the finite element analysis software ABAQUS 2022 version is used to conduct a simulation study on its micro-scale milling process with reasonable milling parameters. A three-factor five-level L25(53) slot milling orthogonal experiment is conducted to investigate the effects of milling speed, milling depth, and feed rate on its milling force and surface quality, respectively. The results show that the milling depth has the greatest impact on the milling force during the micro-milling process, while the milling speed has the greatest influence on the surface quality. Finally, based on the experimental data, the optimal parameter combination for micro-milling nickel-based single-crystal superalloy DD5 parts is found—when the milling speed is 1318.8 mm/s; the milling depth is 12 µm; the feed rate is 20 µm/s; and the surface roughness value is at its minimum, indicating the best surface quality—which has certain guiding significance for practical machining.

1. Introduction

Micro-cutting is an advanced manufacturing technology that has emerged in recent years, fulfilling the industrial demands for machining miniature structural components and micro-features on macro-scale parts. However, there is currently no consensus on how to define micro-machining [1,2,3,4,5,6,7]. Masuzawa believes that the “micro” in micro-machining refers to a “very small, difficult-to-machine” scale range; while Subboah thinks that micro-machining can be applied in the material removal process of the following three situations: one is the machining process of small products and their components; the second is the machining process of small and complex structures on larger parts; and the third is the machining process of precision smooth surfaces on large parts [8,9,10,11,12].
The cutting depth in the micro-machining process is extremely small, especially in the case of sub-micron or nanometer-scale precision machining. Generally, metal materials consist of grains with diameters ranging from several microns to hundreds of microns. Under macro machining conditions, due to the large processing feature size and the relatively large size of the workpiece, the influence of the grain size on the machining process can be neglected, and the workpiece can be regarded as a continuum [13,14,15,16,17]. However, during the micro-cutting process, due to the small size of the microstructures being machined, low cutting parameters, and instances where the cutting depth is less than the grain diameter of the workpiece material, this is equivalent to machining a discontinuous body. Essentially, it involves breaking the interatomic/intermolecular bonding forces within the material. [18,19,20]. Therefore, the material removal process in micro-machining not only depends on the cutting tool used in the process but is also influenced by the microscopic defects of the workpiece material and the inhomogeneity of its microstructure.
With the advancement of technology, single-crystal materials have begun to be widely applied in fields such as aerospace, optical instruments, and high-end equipment, playing an indispensable role [21,22,23]. Compared to conventional cast alloys, single-crystal materials lack grain boundary sites, resulting in better thermal, fatigue, and creep resistance [24,25]. Furthermore, due to their uniform crystallographic orientation and absence of internal grain boundaries, single-crystal materials exhibit fewer dislocations and relatively lower microscopic defects such as impurity atoms. This reduces errors in precision instruments, prevents signal distortion and attenuation, enhances transmission performance, and improves mechanical properties. Compared to other crystalline materials, they demonstrate excellent tensile and shear strength, along with better ductility [26,27].
Micro milling typically refers to the cutting process of micro-scale parts or micro-features on macro-scale components, where the machined part dimensions generally range from 100 μm to 10 mm, and the diameter of the micro-milling tools used is below 1 mm. Milling is one of the most flexible machining methods, and micro milling has become an effective approach for fabricating complex three-dimensional micro-parts with diverse materials [28,29,30]. Currently, while micro-scale milling technology has achieved engineering applications, mature processing techniques are still lacking, and the fundamental theoretical framework for micro-manufacturing processes remains to be established. This is particularly true for micro-scale milling of single-crystal parts, where fundamental theories and rational process parameters for different materials require further exploration. Additionally, the impact of recrystallization induced during machining on the performance of parts must be considered. Under such circumstances, it is essential to conduct extensive experiments combined with finite element simulations to investigate the process performance of typical single-crystal parts in micro-scale milling and the effects of recrystallization. This research focuses on experimentally processing representative single-crystal parts via micro-scale milling to identify optimal process parameters and summarize their machining characteristics.

2. Micro-Scale Milling Finite Element Analysis

Compared with other finite element software, ABAQUS 2022 version software is dedicated to more complex and in-depth engineering problems. Its powerful nonlinear analysis function has been widely recognized by high-end users in design and research. The nonlinearity includes material nonlinearity, geometric nonlinearity, and state nonlinearity [31,32,33].
Considering that this project is aimed at the finite element simulation analysis of micro-scale milling, which is a typical contact problem and belongs to nonlinear analysis, the selection of ABAQUS 2022 version is relatively appropriate.

2.1. ABAQUS Analysis Steps

Using ABAQUS for finite element analysis mainly includes three steps: preprocessing, solution computation, and postprocessing. Among them, preprocessing is the key step of the entire simulation link, which is related to the efficiency of the simulation operation and even whether the simulation can be successfully carried out. The solution computation can complete the basic analysis of metal cutting in the simulation process and complete the analysis and calculation of stress–strain and system temperature fields as well as cutting force. The analysis results are saved in binary form for postprocessing. Postprocessing is a vivid and intuitive interpretation of the operation results, making the calculation results visualized. Its main functions are as follows: (1) displaying the material flow mode during the simulation process; (2) outputting the cloud images of the temperature field and the stress–strain field in deformation; (3) being able to output the force curve and temperature curve of each node. The specific simulation analysis process of ABAQUS is shown in Figure 1.

2.2. Micro-Milling Model Establishment

2.2.1. Determination of Constitutive Model and Material Constants

At present, the main constitutive models used to describe plastic anisotropy are the Hill model and the crystal plasticity model. However, due to the certain difficulties in numerical integration of the crystal plasticity model, the Hill model is mostly adopted to describe the crystal plasticity model in the actual simulation research process. In this paper, the Hill model is adopted as the constitutive model for simulation, and the anisotropic Hill yield criterion is as follows:
Elastoplastic decomposition of deformation:
F = F * F P
The velocity gradient is as follows:
L = F F 1 = D + W
D = 1 2 ( L + L T ) ,   W = 1 2 ( L L T )
The stretch tensor can be written as follows:
D = D e + D P
When describing the stress under isotropic strengthening conditions, the yield function is as follows:
f ( e ) = e 0 ( X p l )
wherein e0 represents the equivalent uniaxial stress, and Xpl represents the equivalent plastic strain.
When considering the case of plastic anisotropy, it is necessary to make appropriate adjustments to the above Hill model to accommodate the characteristics of anisotropy. The specific approach is as follows: Anisotropy with three mutually perpendicular symmetry planes at each point is considered, and the intersection lines of these planes are called the principal axes of the anisotropic body. During the deformation process, the directions of these axes will change. It adopts the plastic potential, calculated as follows:
f ( e ) = F ( e ^ 22     e ^ 33 ) 2   +   G ( e ^ 33     e ^ 11 ) 2   +   H ( e ^ 11     e ^ 22 ) 2   +   2 L e ^ 23 2   +   2 M e ^ 31 2   +   2 N e ^ 12 2
Among them,
F = ( e 0 ) 2 2 1 e ¯ 22 2 + 1 e ¯ 33 2 1 e ¯ 11 2 = 1 2 1 R 22 2 + 1 R 33 2 1 R 11 2
G = ( e 0 ) 2 2 1 e ¯ 33 2 + 1 e ¯ 11 2 1 e ¯ 22 2 = 1 2 1 R 33 2 + 1 R 11 2 1 R 22 2
H = ( e 0 ) 2 2 1 e ¯ 11 2 + 1 e ¯ 22 2 1 e ¯ 33 2 = 1 2 1 R 11 2 + 1 R 22 2 1 R 33 2
L = 3 2 f 0 e ¯ 23 2 = 3 2 R 23 2
M = 3 2 f 0 e ¯ 13 2 = 3 2 R 13 2
N = 3 2 f 0 e ¯ 12 2 = 3 2 R 12 2
e ^ i j = n i e n j
R 11 = e ¯ 11 e 0 ,   R 22 = e ¯ 22 e 0 ,   R 33 = e ¯ 33 e 0 R 12 = e ¯ 12 e 0 ,   R 13 = e ¯ 13 e 0 ,   R 23 = e ¯ 23 e 0
f 0 = e 0 3
In the formula, e ¯ i j represents the yield stress under the action of the non-stress component eij;     e ^ i j represents the stress component in the principal axis coordinate system; e0 represents the reference yield stress; Rij represents the anisotropic yield stress rate; and F represents anisotropic parameter.
The physical parameters of the simulation material single crystal DD5 are shown in the following Table 1:
The uniaxial tensile yield curve of the principal axis coordinate system under uniform deformation of the specimen is defined as the stress–strain material curve in the Hill model. According to the above parameters, the maximum yield stress in the three principal axis directions under uniaxial tension can be calculated as follows: e ¯ 11 = e ¯ 22 = e ¯ 33 = 251 MPa, and the three shear yield stresses are 3 e ¯ 12 = 3 e ¯ 13 = 3 e ¯ 23 = 429 MPa. Furthermore, the anisotropic yield stress rates are calculated as follows: R11 = R22 = R33 = 1, R12 = R13 = R23 = 1.709.

2.2.2. Model Establishment, Assembly, and Meshing

ABAQUS, with its powerful modeling capabilities, can directly establish very complex geometric models and can also accept models imported from external data. The geometric models used in this paper are all established directly in the ABAQUS/CAE module, where assembly is completed, and material properties are defined for them.
There is no unified unit system in ABAQUS. Therefore, a unified unit system should be established before the simulation. Since the parameters related to the micro-milling process are relatively small, the SI (mm) unit system is selected for all the simulations in this paper, and the specific units are shown in Table 2.
In the simulation, the geometric parameters of the micro-endmill refer to those used in the experiment. The main parameters are as follows: double-edged, micro-endmill; the radius of the cutting edge arc is 5 μm; the rake angle is 10°; the relief angle is 6°; and the diameter is 0.6 mm. In the simulation, in order to simplify the tool model, shorten the simulation calculation time, and improve the work efficiency, the tool type is set as a rigid body analysis for the time being, without considering the tool length, and the top center of the tool is taken as the reference point; the workpiece type is set as a deformable material with dimensions of 0.8 mm × 0.9 mm × 0.2 mm, and the constitutive parameters and material properties calculated and summarized in the previous section are assigned to the workpiece section. The micro-endmill used in the simulation and that used in the experiment are shown in Figure 2.
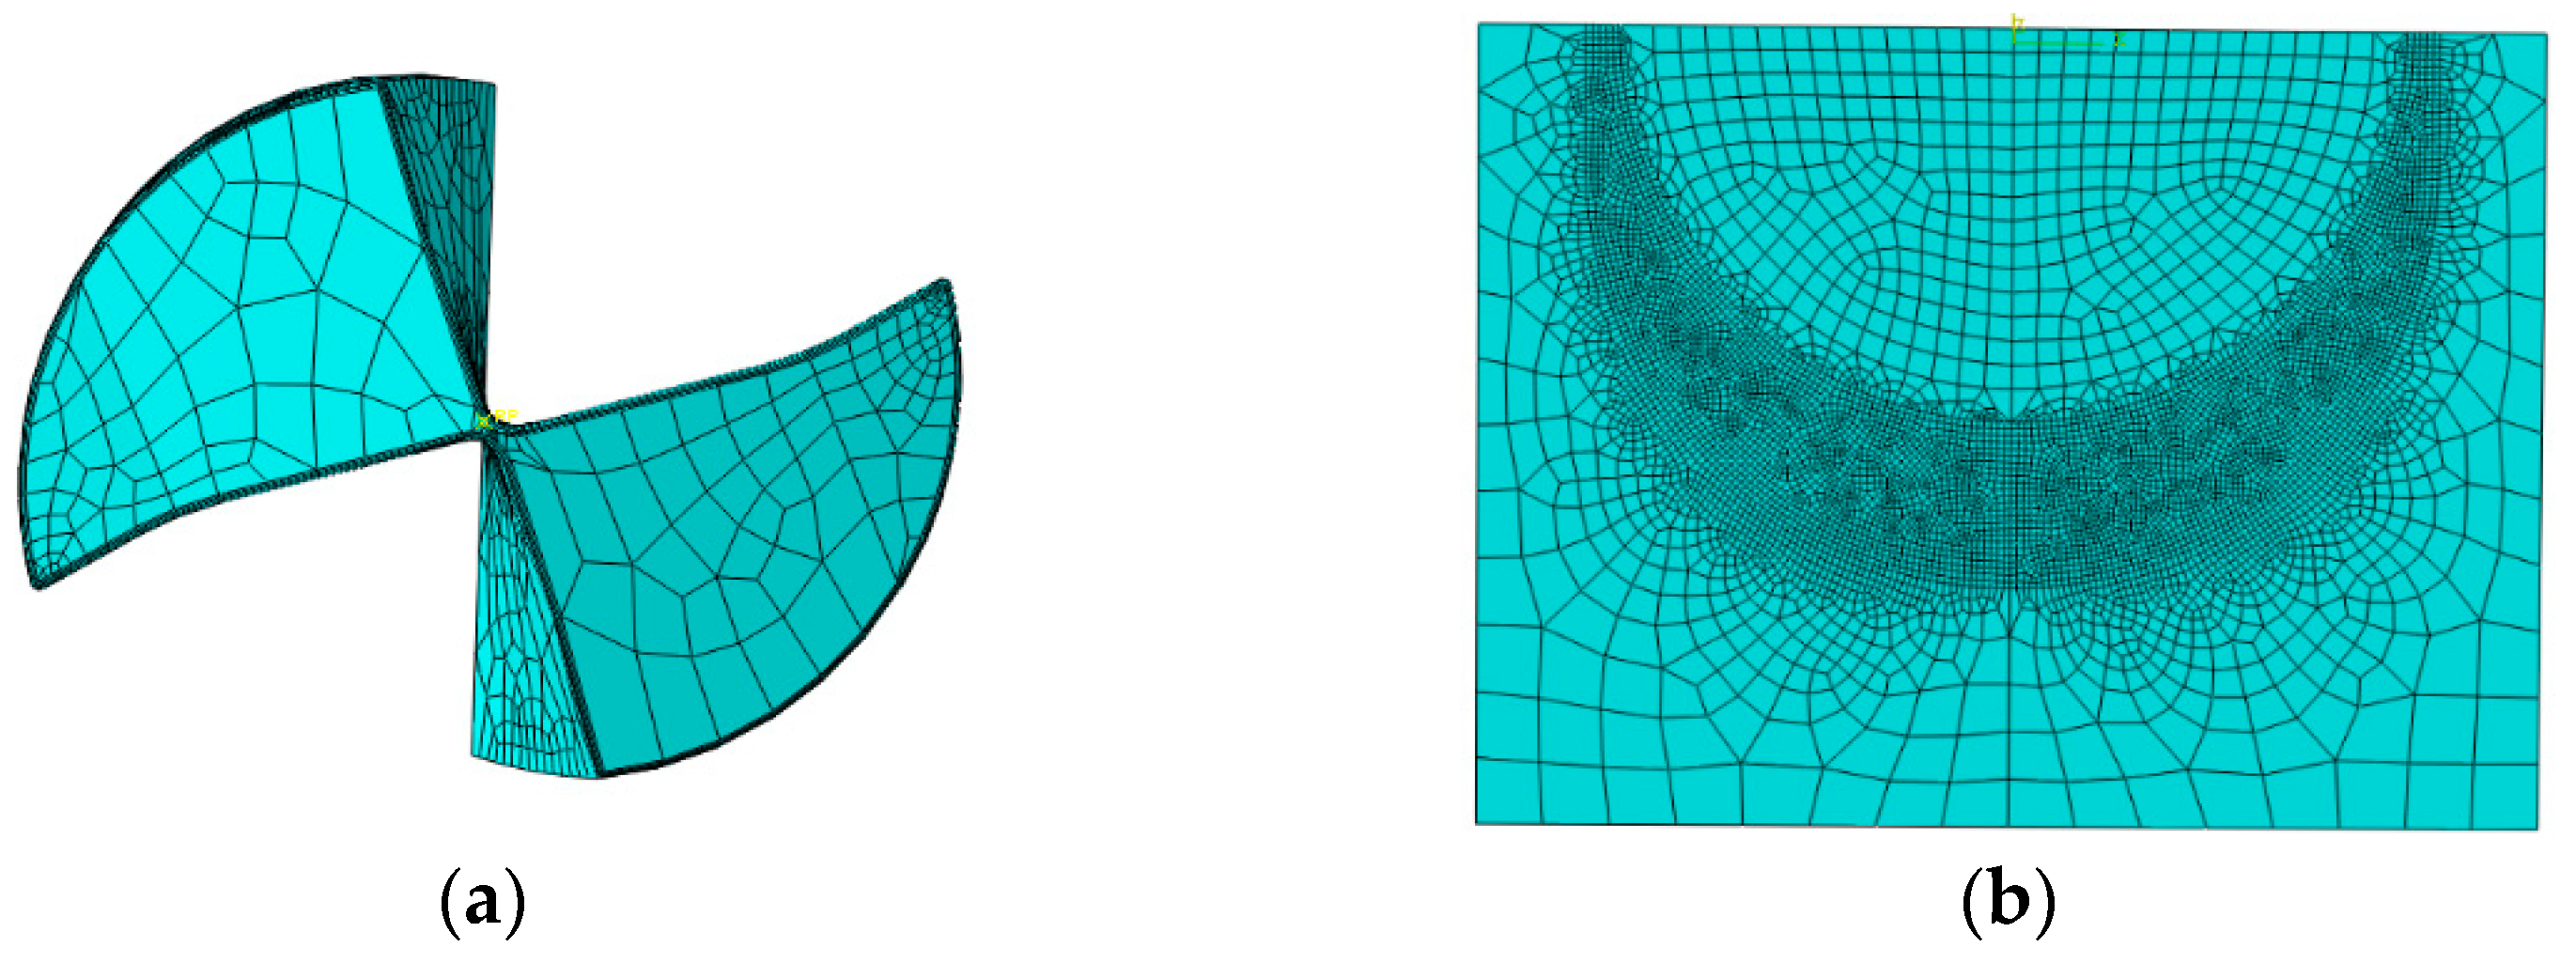
In this modeling, after building the part model, the mesh is divided first. The advantage of doing so is that in the process of mesh division, it is often found that the geometric model of the component needs to be further modified. For example, there are too small filet radii or line segments, resulting in unnecessary mesh refinement. After these modifications, the previously defined boundary conditions, loads, and contacts may become invalid and need to be redefined. Dividing the mesh first reduces this unnecessary repetitive work. Being able to reasonably divide the mesh can obtain high-quality simulation results while also saving simulation calculation time and improving work efficiency as much as possible. In this paper, it is chosen to divide the mesh finer at the key positions such as the tool contact area of the workpiece and the cutting-edge plane of the tool, while the mesh in other areas of the workpiece and the tool is relatively coarser, as shown in Figure 3.
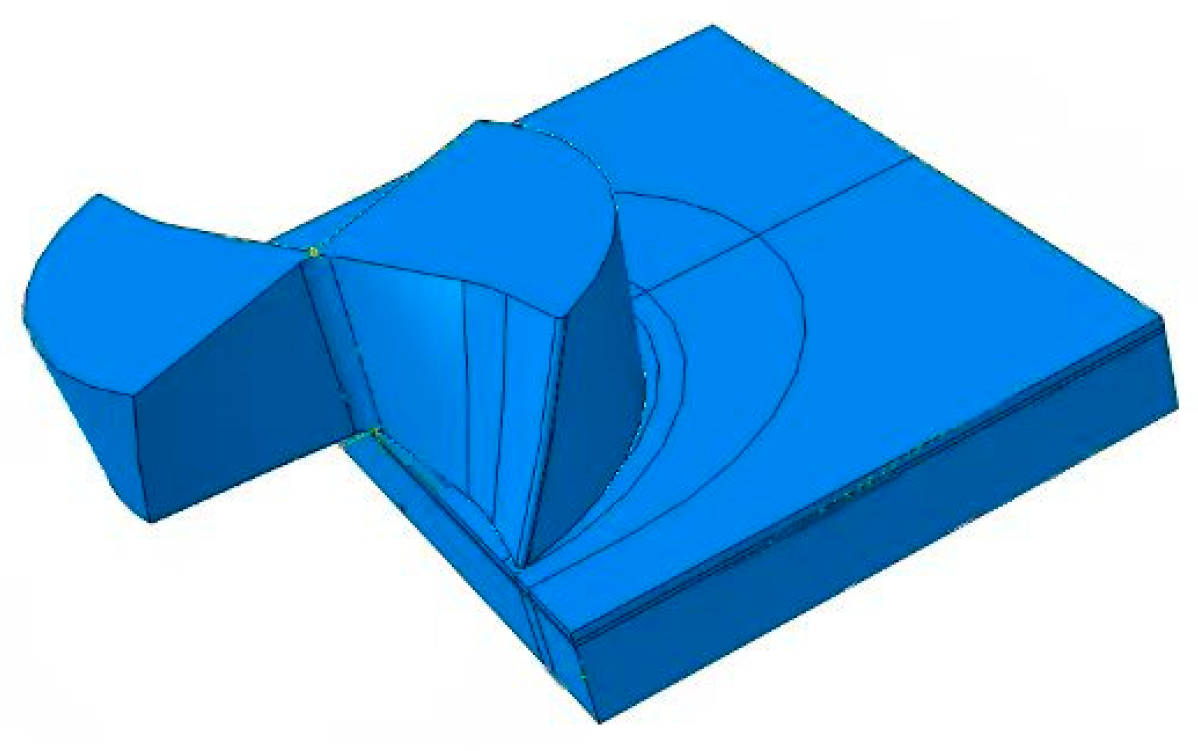
Finally, the tool and workpiece models with divided meshes are assembled together, and their relative positions are adjusted to ensure that they are in close proximity without interference. When defining the analysis steps, the longer the analysis step time is, the higher the calculation accuracy will be, but at the same time, the time used in the calculation process will also be longer. After comprehensive consideration in this paper, the analysis step time is set to 0.00125 s. The assembly diagram is shown in Figure 4.

2.3. Analysis of Simulation Results

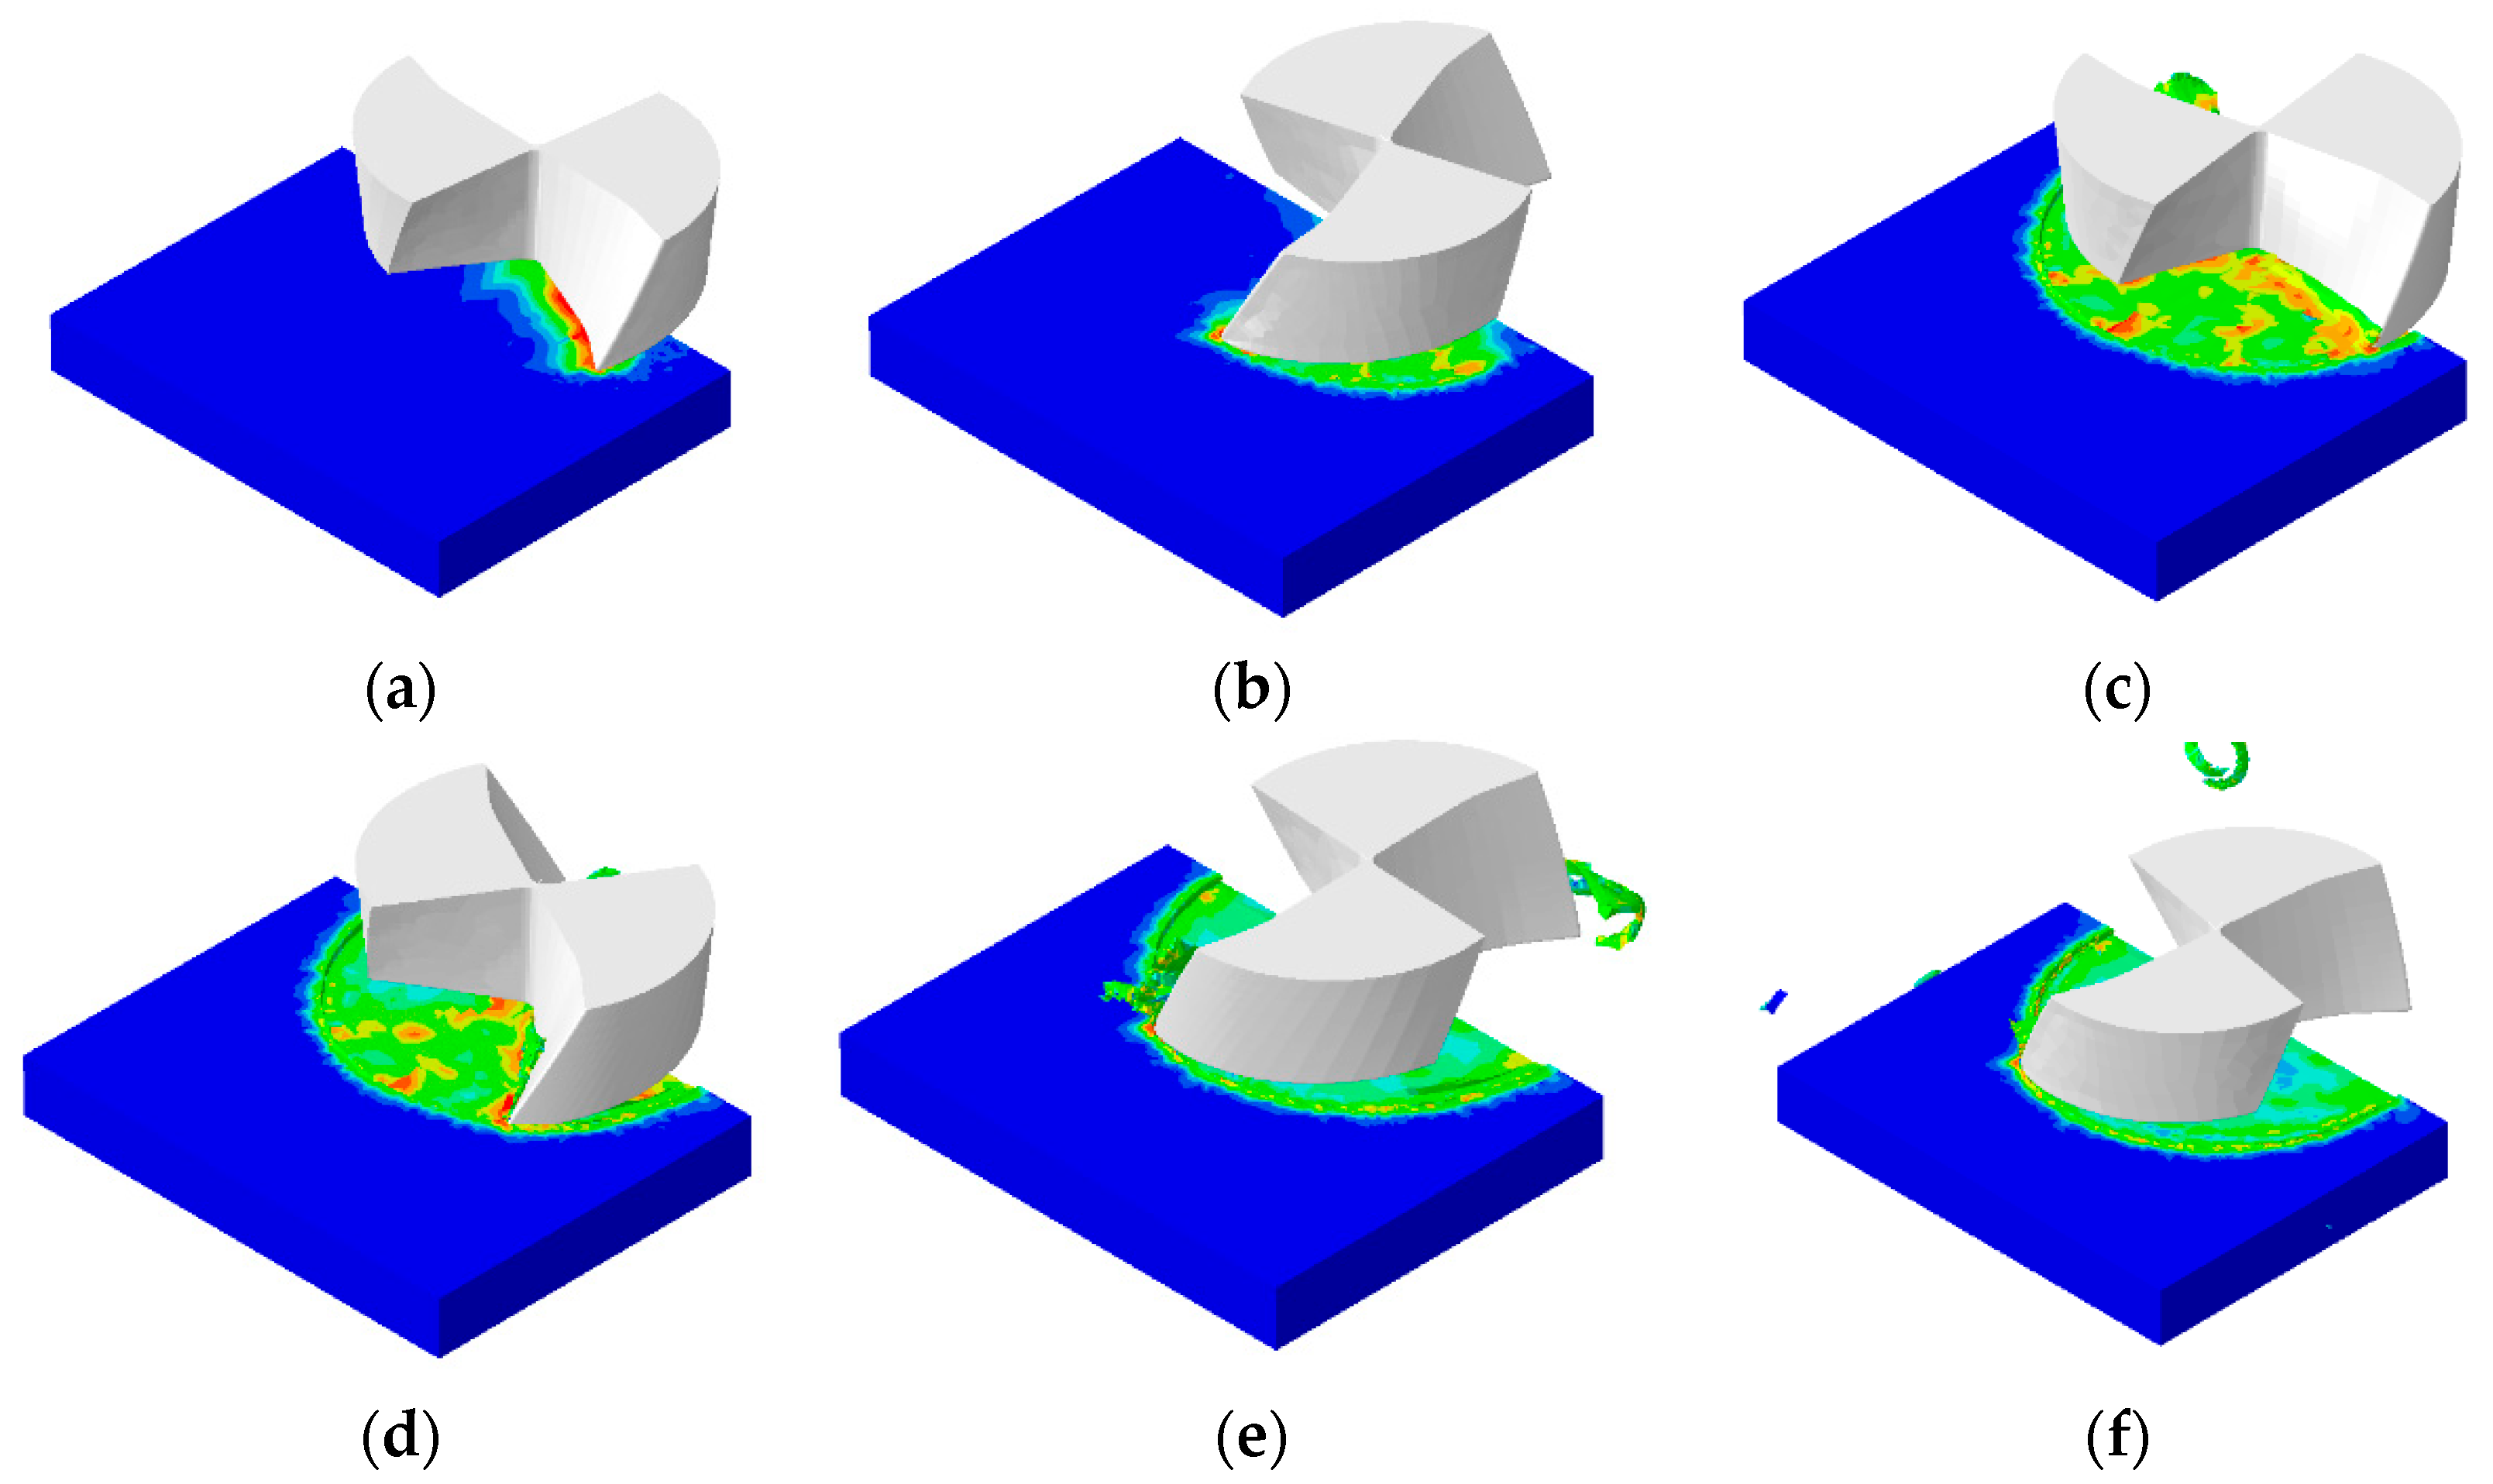
This simulation mainly studies the influence of milling speed and milling depth on milling force, and the parameters in the simulation refer to the parameter data in the experimental scheme. In the process of simulation, there is no chip generation in the initial stage, and the tool only slides on the surface of the workpiece. With the progress of the milling process, a certain amount of ribbon chips is generated. The specific process is shown in Figure 5. From the figure, it can be clearly seen the stress distribution generated on the machined surface during the cutting process. Generally speaking, the stress is larger at the initial stage of machining, and when the workpiece is machined to better surface quality, the stress becomes smaller.
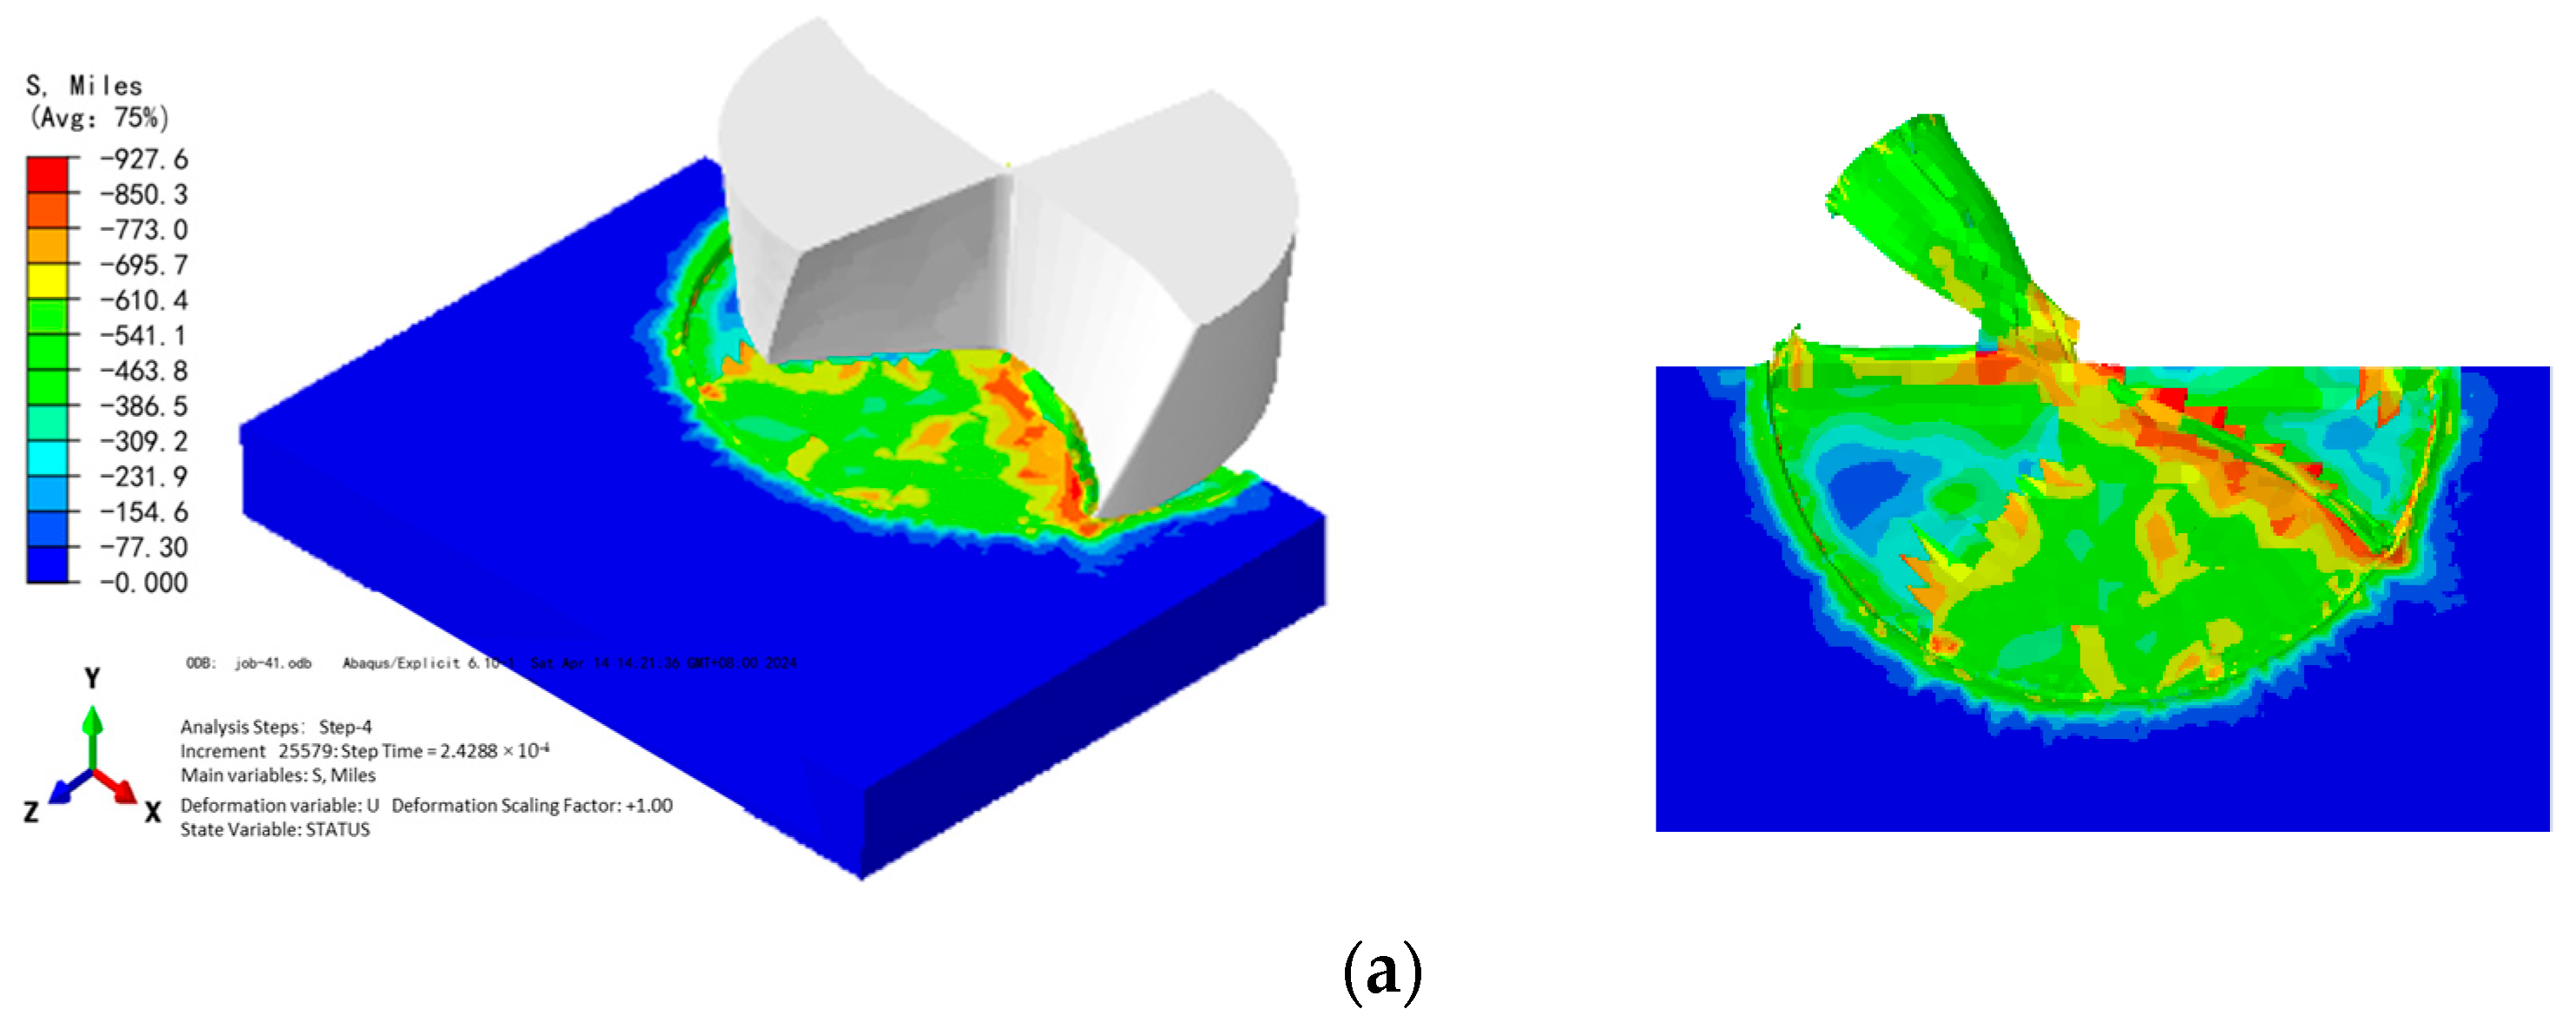
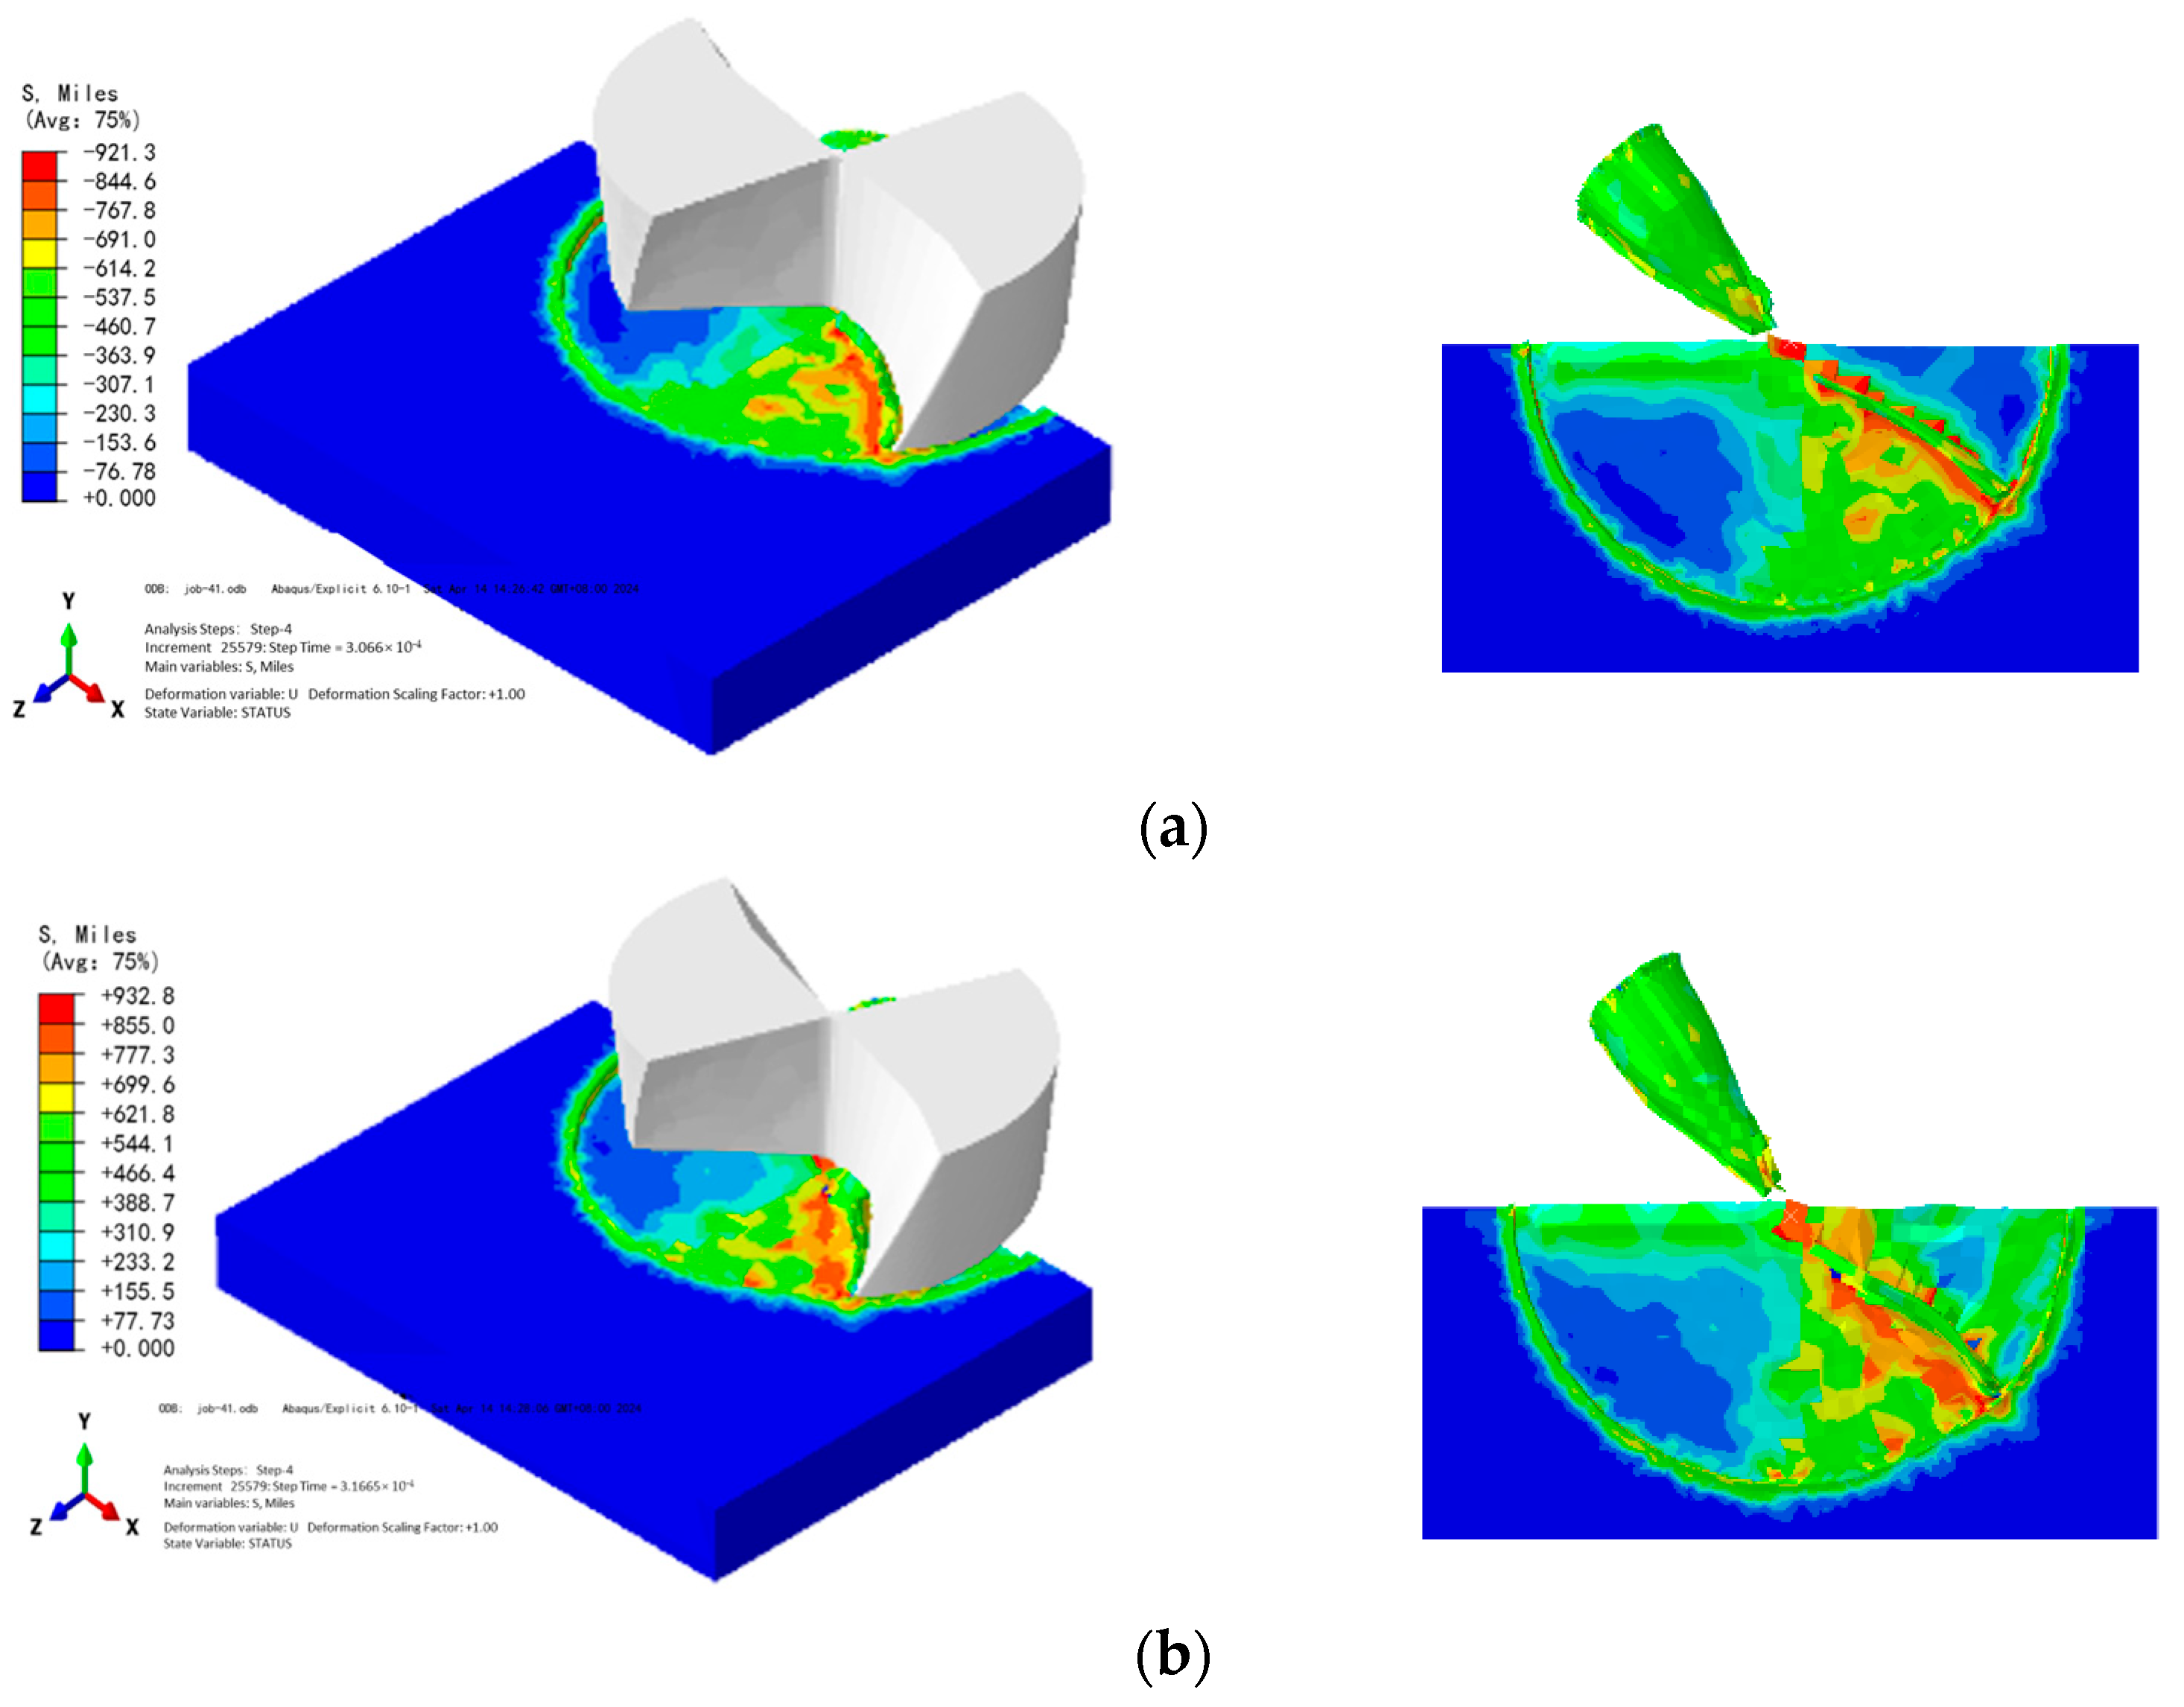
Referring to the parameter data in the experimental scheme, the simulation results under the three conditions that the spindle speed is at 24,000 r/min, 36,000 r/min, and 48,000 r/min (the spindle speed is converted into milling speed according to the tool radius of the micro-endmill, and the results are 753.6 mm/s, 1130.4 mm/s, and 1507.2 mm/s, respectively) are shown in Figure 6, including the whole stress nephogram and the stress nephogram on the workpiece surface corresponding to different milling speeds.
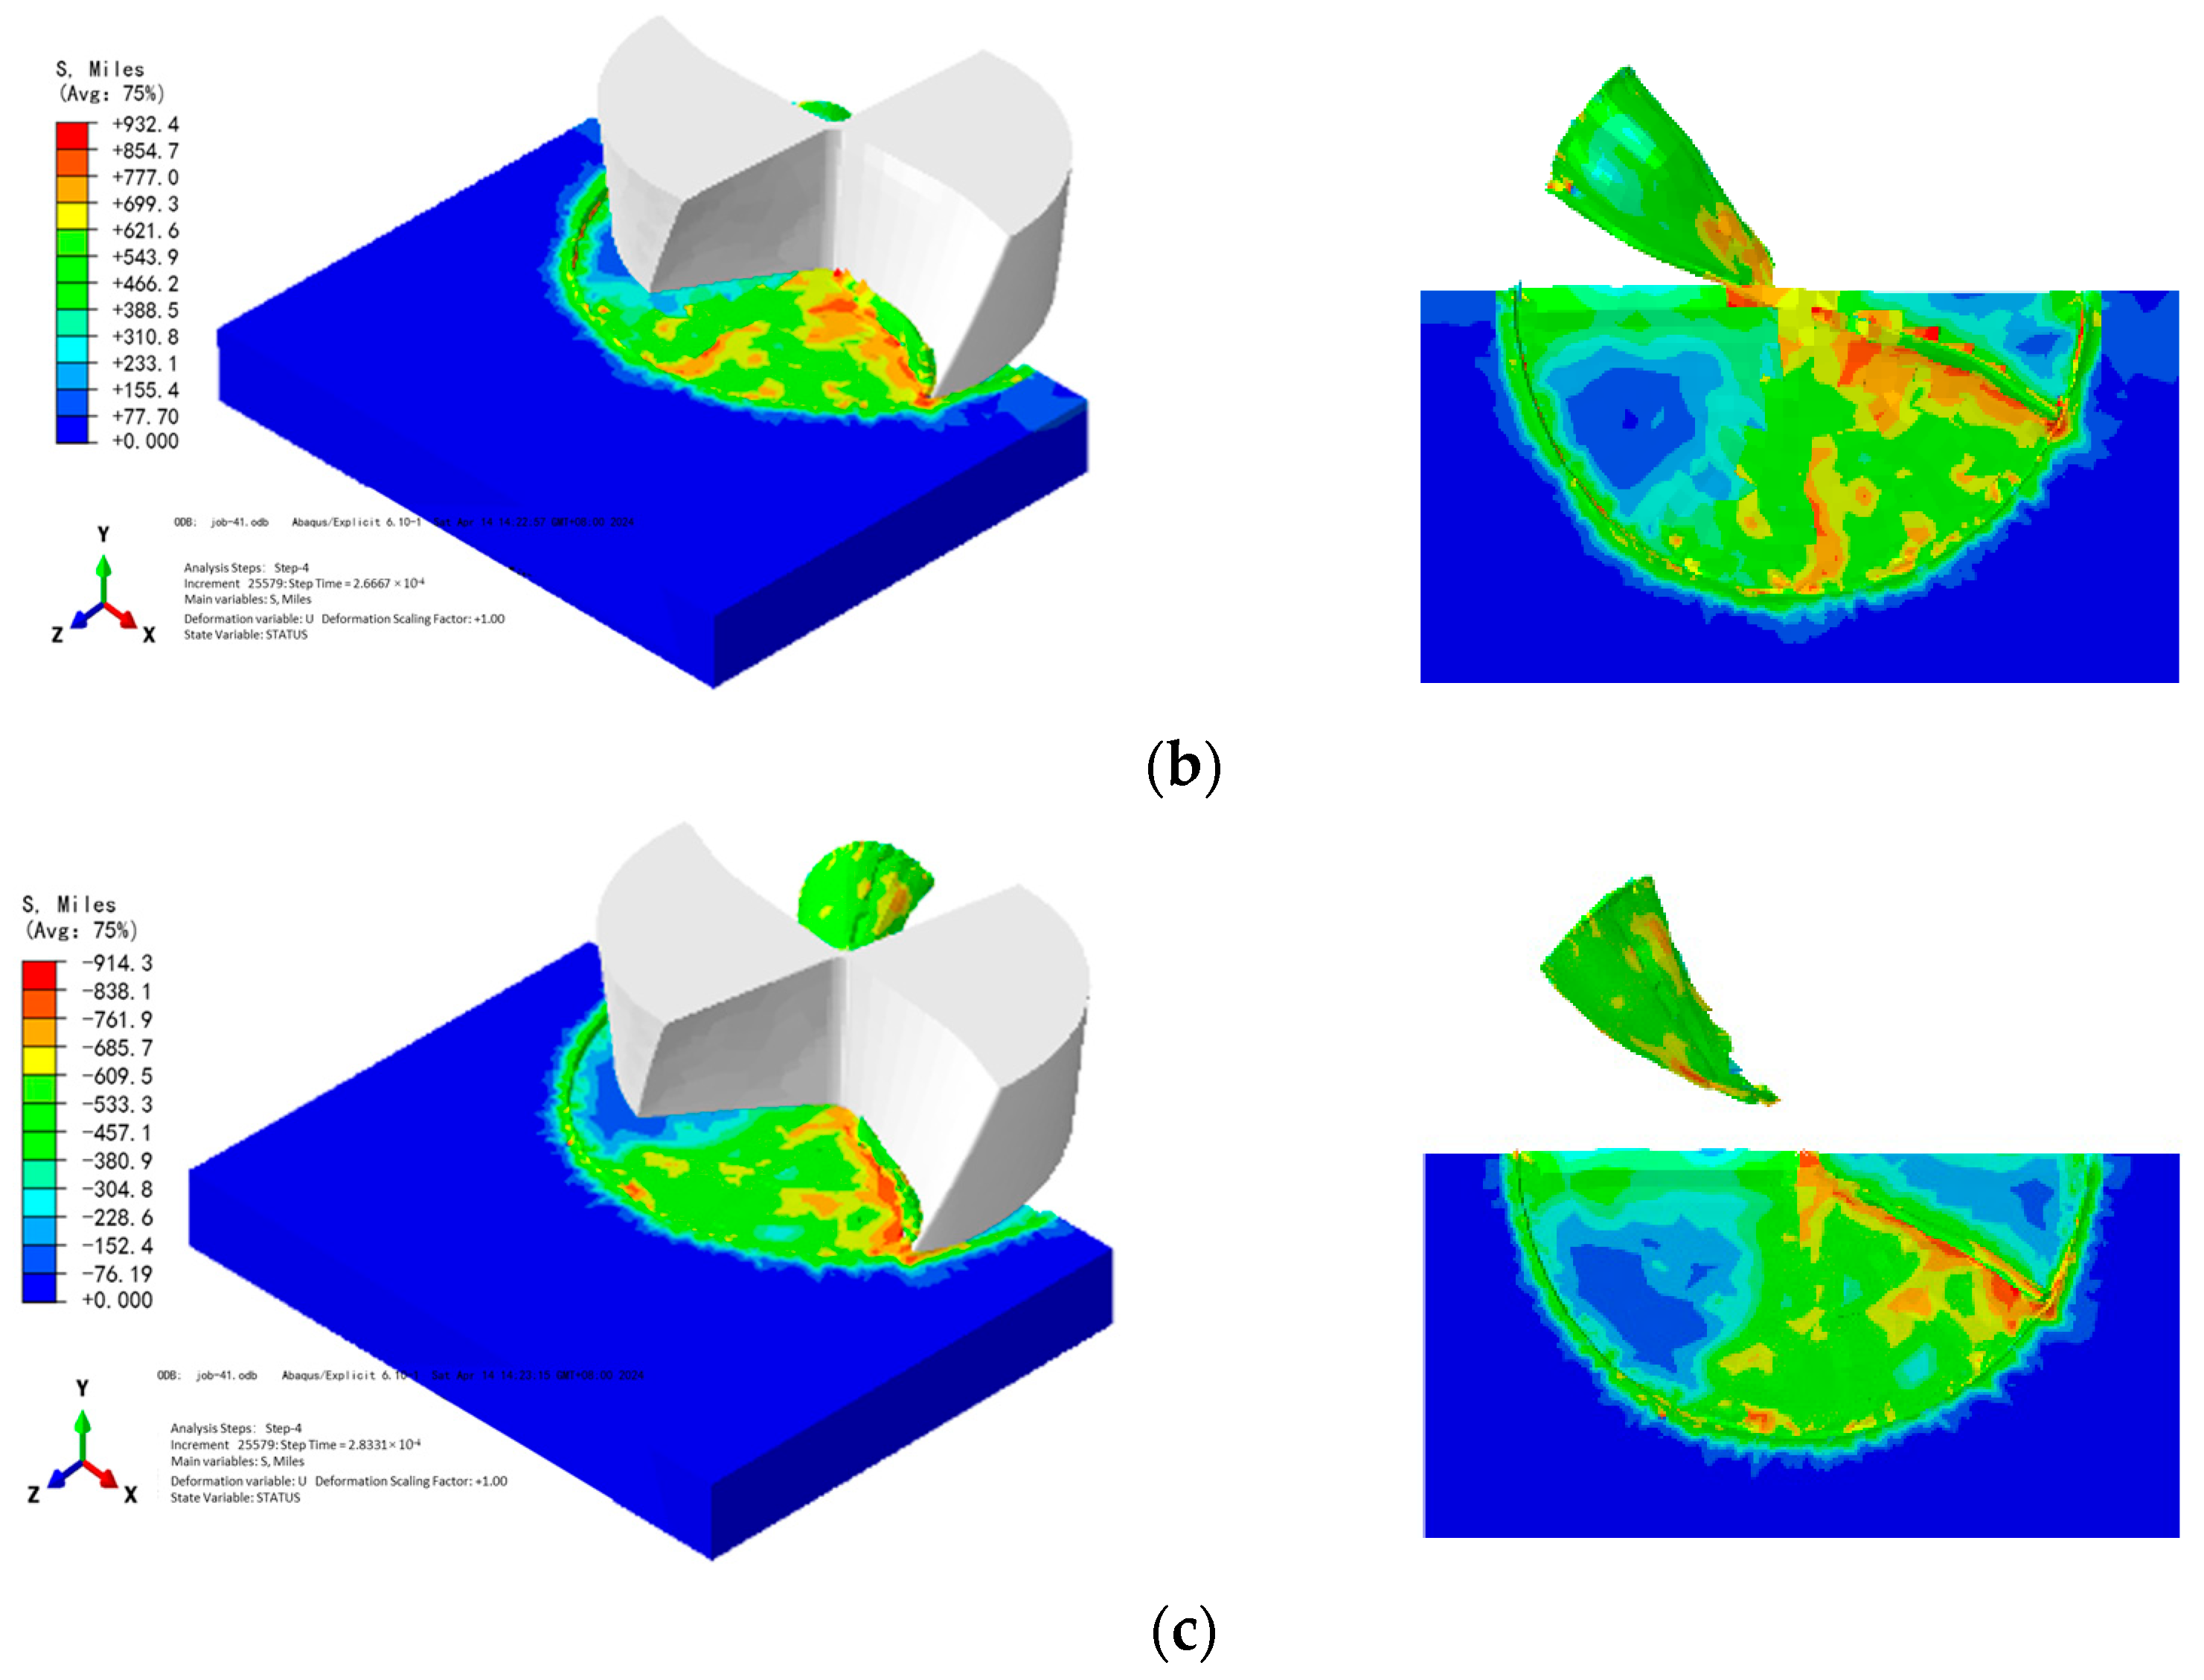
Referring to the parameter data in the experimental scheme, the simulation results under the three conditions that the milling depth is at 8 µm, 10 µm, and 12 µm are shown in Figure 7, including the whole stress nephogram and the stress nephogram on the workpiece surface corresponding to different milling speeds.
It can be seen from the above simulation results that in the micro-milling process, the stress at the tool–workpiece contact area is always relatively high. And due to the anisotropy of the monocrystalline material DD5, at every moment in the micro-scale milling process, when the tool cuts different positions of the workpiece, there are differences in the stress distribution on the workpiece surface. From the stress nephogram in Figure 6, it can be seen that as the milling speed increases, the milling force tends to decrease; from the stress nephogram in Figure 7, it can be seen that as the milling depth increases, the milling force tends to increase.

3. Experimental Design Methods and Instruments and Equipment

3.1. Experimental Equipment and Testing Instruments

3.1.1. Processing Equipment

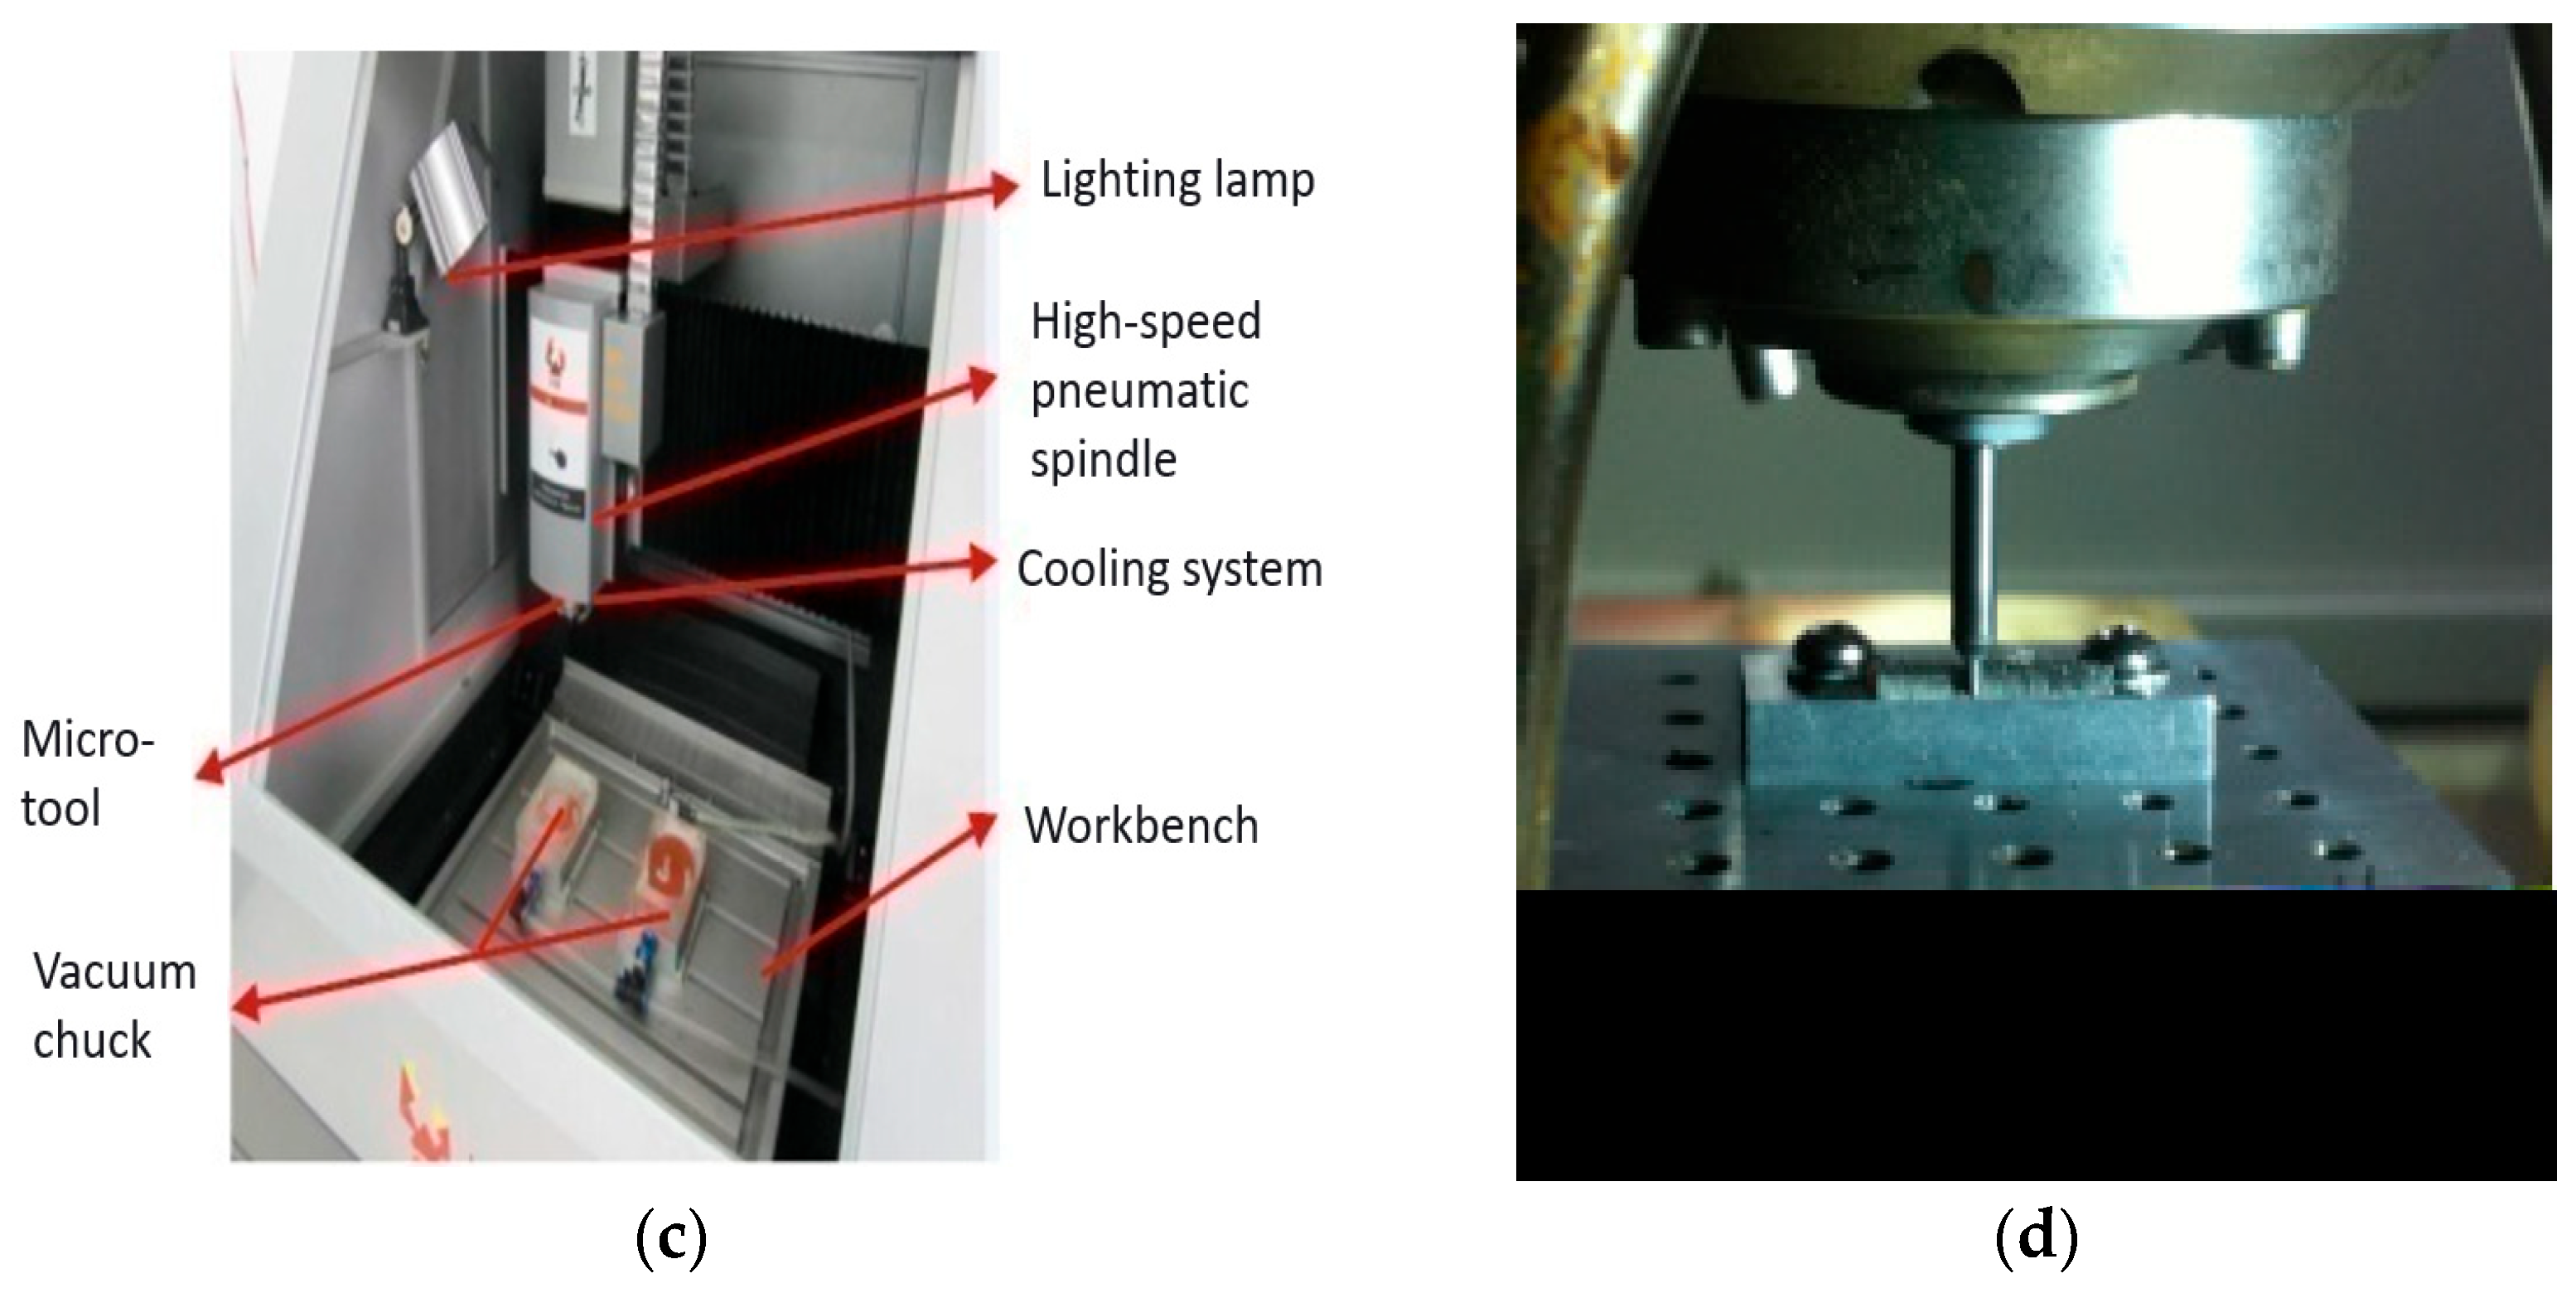
All experiments in this project employed the JX-1A precision machining machine (which was manufactured by Juxie Precision Machinery Equipment Co., Ltd. of Shenzhen in China) for micro-scale milling of typical nickel-based superalloy components. The machine is suitable for micro-scale grinding, milling, and other micro-machining processes, and it can meet various micro-machining requirements based on different needs, as shown in Figure 8.
To ensure the smooth progress of the experiments, there are certain requirements for the technical specifications of the precision machine tools used in the machining. The technical parameters of the JX-1A Crab Precision Machining Center are shown in Table 3. It can be seen that this machine tool has high tool-positioning accuracy and a high milling speed, which can achieve sub-micron level machining accuracy and meet the experimental requirements. During the machining process, the workpiece being machined is adsorbed on a vacuum chuck and moves in the Y-coordinate direction along with the worktable to achieve feeding. At the same time, the pneumatic spindle drives the tool to rotate and move in the X and Z coordinate directions to machine the workpiece. During machining, the control panel on the machine tool is used to control the machining parameters. It is possible to choose manual operation to control the machine tool or to import a pre-written program into the machine tool for machining. Manual operation was chosen for all the experiments in this paper.

3.1.2. Testing Equipment

The experiments in this project adopted the DHDAS -5920N Dynamic Signal Test and Analysis Instrument (which was manufactured by Beijing Institute of Vibration and Noise Technology in Beijing, China) to measure the micro-milling forces in the X, Y, and Z directions during the micro-milling process by connecting it with sensors. The DHDAS-5920N Dynamic Signal Test and Analysis Instrument, which is compatible with it, was used to collect and store the measured micro-milling forces. This dynamic signal acquisition and analysis system can measure signals such as strain and vibration from 16 channels simultaneously, mainly used for dynamic performance testing and analysis.
In the experiments of this project, a total of two devices, the VHX-1000E Ultra-deep Field Microscope (which was manufactured by Keyence Company of Osaka, Japan) and the Micromeasure 3D Profilometer (which was manufactured by STIL Company in Cluses, France), were used to examine the surface morphology, 3D profile, and surface roughness of the workpieces.
In the experiments, the VHX-1000E Ultra-deep Field Microscope designed and manufactured by Keyence Company of Japan was used. Based on the principle of optical imaging, this equipment utilizes high-definition CCD electronic imaging technology and stepless zoom lenses, integrating a stereo microscope, tool microscope, and metallographic microscope into one. It can observe the microscopic world that traditional optical microscopes cannot see due to insufficient depth of field. The equipment is equipped with two zoom lenses. The low-power lens can achieve magnifications of 20, 30, 50, 100, and 200 times, while the high-power lens can achieve magnifications of 1000, 2000, and 3000 times. The high-power lens can reach a micron-level observation effect. During the detection process, by using the image stitching and depth synthesis functions of the equipment, the workpiece under test is photographed layer by layer, and the photos taken are deeply synthesized to finally obtain clear two-dimensional and three-dimensional microscopic morphology maps of the workpiece surface under test.
The three-dimensional profile and surface roughness are measured by the Micromeasure 3D Profilometer designed and manufactured by STIL Company in France. This equipment uses the scanning white light interference method to measure the surface roughness of the machined workpiece and generate a 3D profile morphology map of the workpiece. In the experiments of this paper, the selected sampling area is 0.1 mm × 0.1 mm, and a 50× laser lens is applied. During the measurement process, the lens does not contact the workpiece. The high-precision laser probe moves in the X and Y directions for scanning, and the scanning results are analyzed and processed by the supporting software to obtain the detection information such as the surface roughness and 3D profile morphology map of the surface under test.

3.2. Experimental Design Scheme

In the research of environmental and resource science, the comparative experiments mainly include single- the commonly used design methods of comparative experiments mainly include single-factor experiment scheme and multi-factor experiment scheme. The single-factor experiment can only study the effect of one factor, while the multi-factor experiment mainly examines the simple effects, main effects and interactive effects among different factors, so as to determine the optimal level combination of each experimental factor. In order to save experiment time and improve experiment efficiency, the orthogonal experiment method is generally adopted in multi-factor experiments.
In order to study the micro-machining process performance of nickel-based single crystal superalloy, according to the experimental plan, the basic principles of clear purpose, strict comparability and high efficiency of the experiment are followed. The project adopts an experimental method of non-replicate orthogonal experiment and selects single crystal DD5 as the experimental material. The main research contents are as follows: through the orthogonal experiment, the material is processed by micro-milling, and the influence order and rules of milling speed, milling depth, and feed rate on milling force and surface roughness are obtained, as well as the optimal parameter combination of various materials during processing.
The method of three-factor and five-level L25(53) slot milling orthogonal experiment is adopted (shown in Table 4 for the factors and levels table) to explore the influence of milling speed, milling depth, and feed rate on the milling force and surface quality, respectively. The main contents include the following: designing the orthogonal experiment, conducting range analysis on the experimental results of milling force and surface roughness, obtaining the optimal micro-milling parameter combination of the two materials for micro-milling, as well as the primary and secondary order of influencing factors; studying the influence of each micro-milling process parameter on surface roughness and milling force; and summarizing the influence rules. The parameters that need to be measured include the milling forces FX and FY during the processing and the surface roughness Ra after processing. The milling forces FX and FY are combined into the total milling force F, and the measurement results are recorded in the form.

4. Experimental Plan and Results

4.1. Experimental Plan and Data

The milling force and surface roughness of single crystal DD5 parts are measured by a DH-5920N dynamic signal testing analyzer and a Micromeasure 3D profilometer, respectively, and the experimental data are shown in Table 5.

4.2. Effect of Cutting Parameters on Milling Force

To process the data in Table 5, it is necessary to calculate the range R and variance V of the data and then analyze them. The specific calculation process is as follows: Calculate the sum of the data corresponding to each level of each column and its square, where Kij is the sum of the data corresponding to each level of each column; Kij2 is its square; and the range R is the difference between the maximum and minimum values among Kij; T is the sum of all the data in each column; n is the total number of experiments, n = 25; m is the number of levels for each factor, m = 5; r is the number of repeated experiments for each level, r = 5; SSj is the sum of squares of deviations for each column; dfj is the degree of freedom for the factor; and the relevant calculation formula for variance V and others are shown in the following formula (16)–(20). The results after data processing are shown in Table 6.
C T = T 2 n
S S j = 1 r i = 1 m K i j 2 C T
d f j = m 1
V = S S j d f j
R = K i j max K i j min
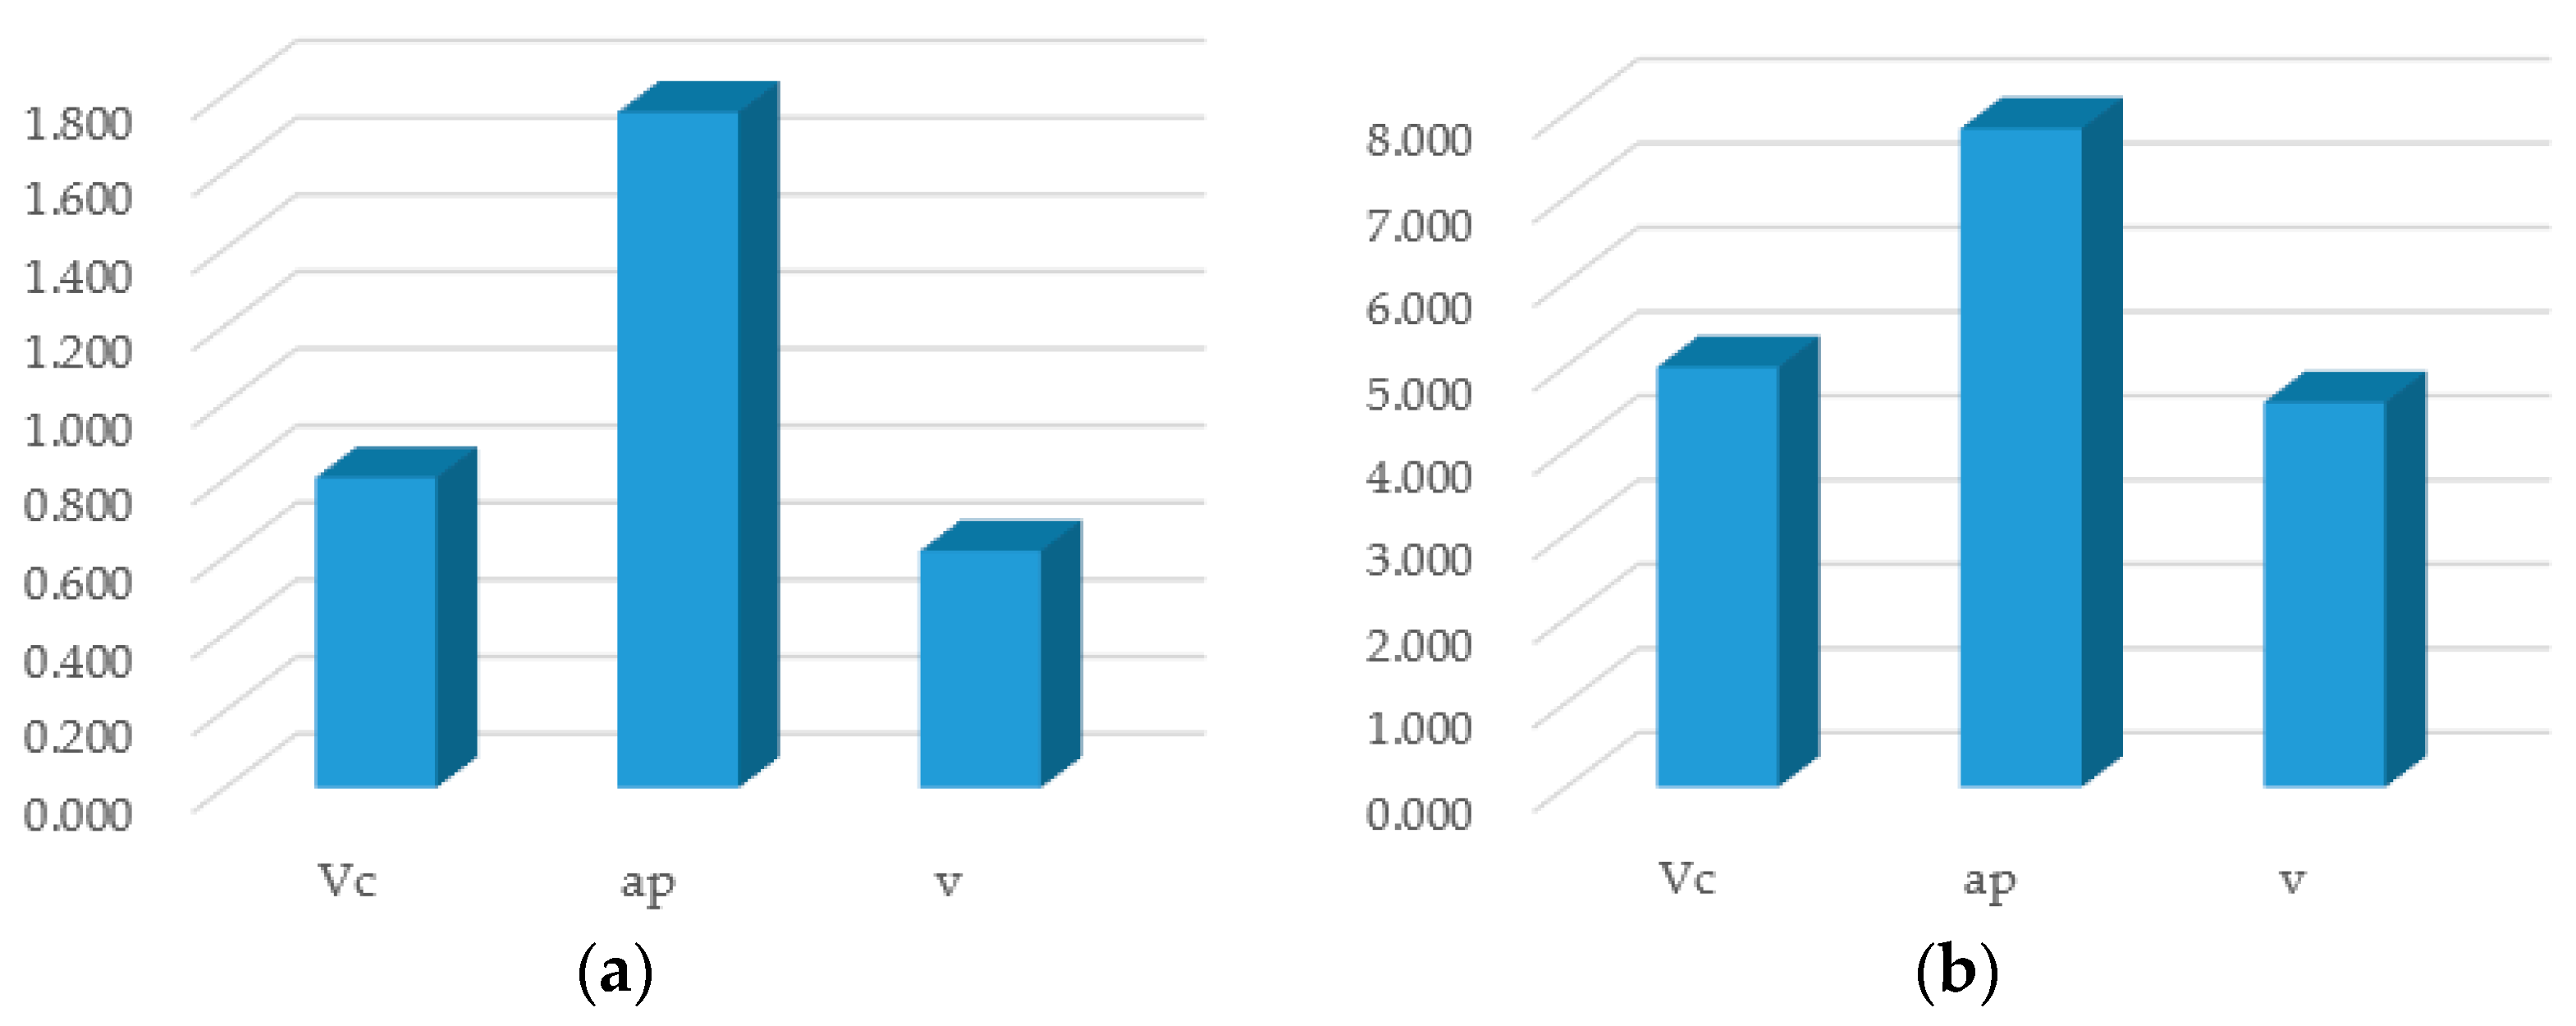
Under the influence of three cutting parameters, namely milling speed, milling depth, and feed rate, the range chart and variance chart of the milling force of single crystal DD5 are shown in Figure 9. It can be seen from the figure that the range and variance of the milling depth are both the largest among the three, followed by the milling speed, while the feed rate has the smallest value. The range reflects the variation range of the data. The larger the range, the wider the data range; the smaller the range, the narrower the data range. The variance can be used to measure the fluctuation of a batch of data, that is, the degree to which the data deviates from the average. The larger the variance, the greater the fluctuation of the data and the less stable it is; the smaller the variance, the smaller the fluctuation of the data and the more stable it is. Therefore, in this experiment, the range and variance of each factor can represent the influence of that factor on the orthogonal experiment. The larger the range and variance, the greater the degree of influence. Hence, the following conclusion can be drawn: In the orthogonal experiment of the milling force of single crystal DD5, the milling depth has the greatest impact on the milling force during its micro-milling process, while the milling speed and feed rate have less impact. Therefore, selecting the milling depth reasonably plays a very important role and practical significance in effectively controlling the milling force during the micro-milling process.
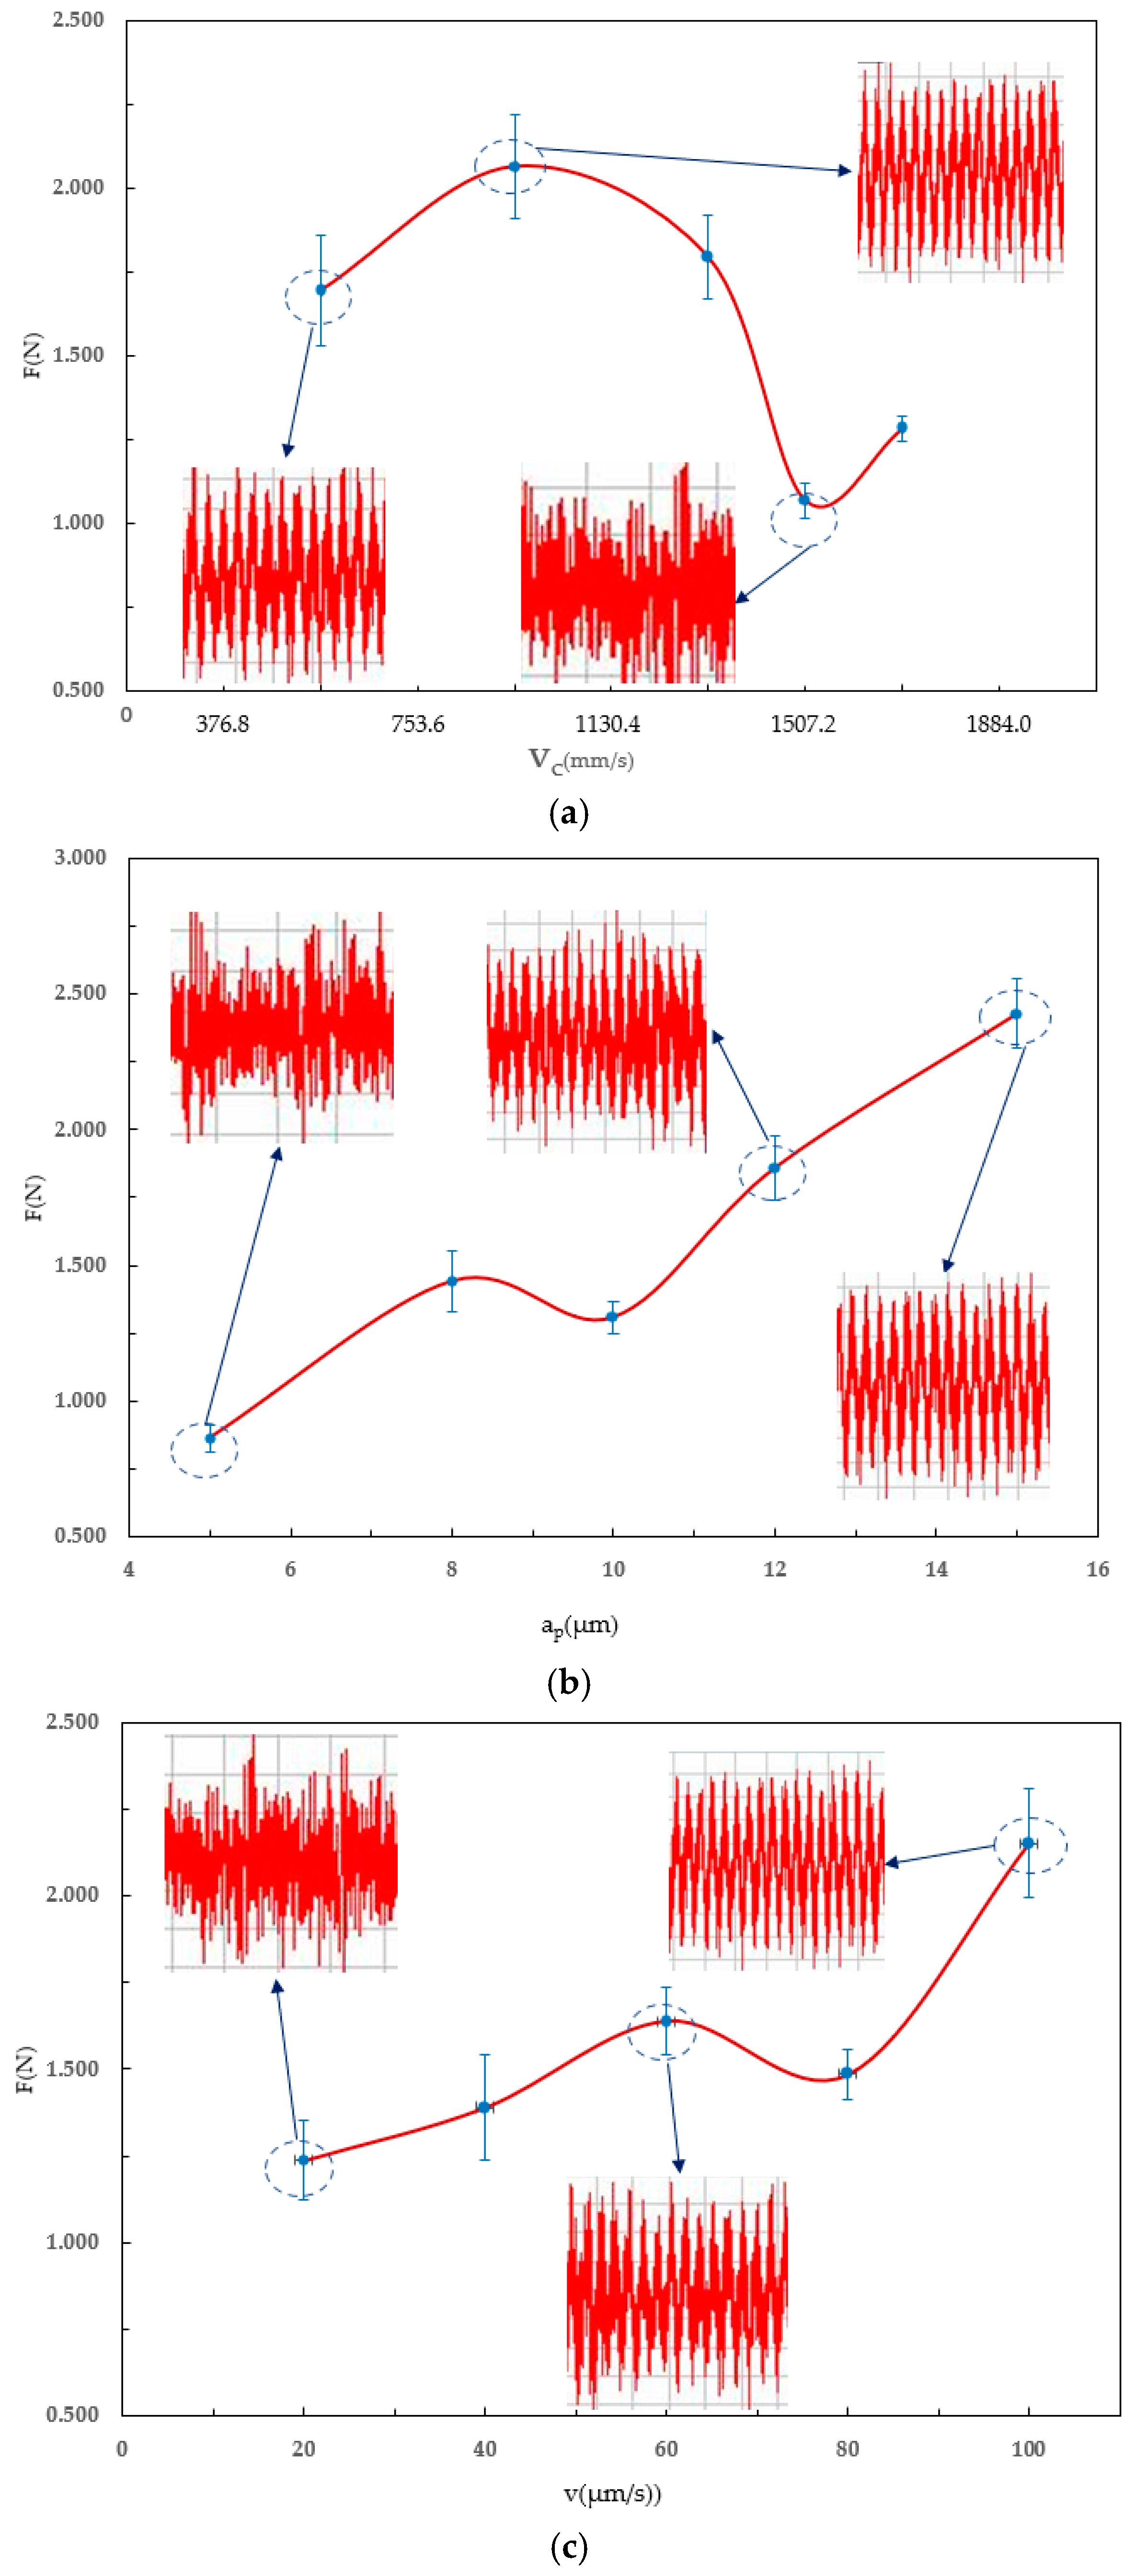
To further study the changing trends of the influence of three cutting parameters, namely milling speed, milling depth, and feed rate, on the milling force, the average value of the sum of the data corresponding to each level of each column is now calculated (the obtained data is shown in Table 6), and a line chart of the influence of these three factors on the milling force is plotted, as shown in Figure 10 (Several typical milling force measurement curves are illustrated in the figure).
As can be seen from Figure 10, when the milling speed is 12,000 r/min, the milling force is 1.694 N. When the milling speed increases to 1884 mm/s, the milling force decreases by 24% to 1.283 N. As the milling speed increases, the overall trend of the milling force is to first increase, then decrease, and then increase again. The turning points are at 24,000 r/min and 42,000 r/min. At these turning points, the milling force reaches its maximum and minimum values, which are 2.065 N and 1.067 N, respectively, with a difference of 0.998 N. When the milling depth increases from 5 µm to 15 µm, the milling force also increases from the minimum value of 0.864 N to the maximum value of 2.429 N, an increase of 181%. As the milling depth increases, the overall trend of the milling force is to first increase, then decrease, and then increase again. The turning points are at 8 µm and 10 µm, and the milling forces at these turning points are 1.442 N and 1.309 N, respectively. When the feed rate increases from 20 µm/s to 100 µm/s, the milling force increases from the minimum value of 1.237 N to the maximum value of 2.151 N, an increase of 74%. As the feed rate increases, the overall trend of the milling force is to first increase, then decrease, and then increase again. The turning points are at 60 µm/s and 80 µm/s, and the milling forces at these turning points are 1.639 N and 1.485 N, respectively. It can be seen that the milling depth has the greatest influence on the milling force among the three parameters. This further proves that reasonably selecting the milling depth is the most effective way to control the milling force in the micro-milling process.
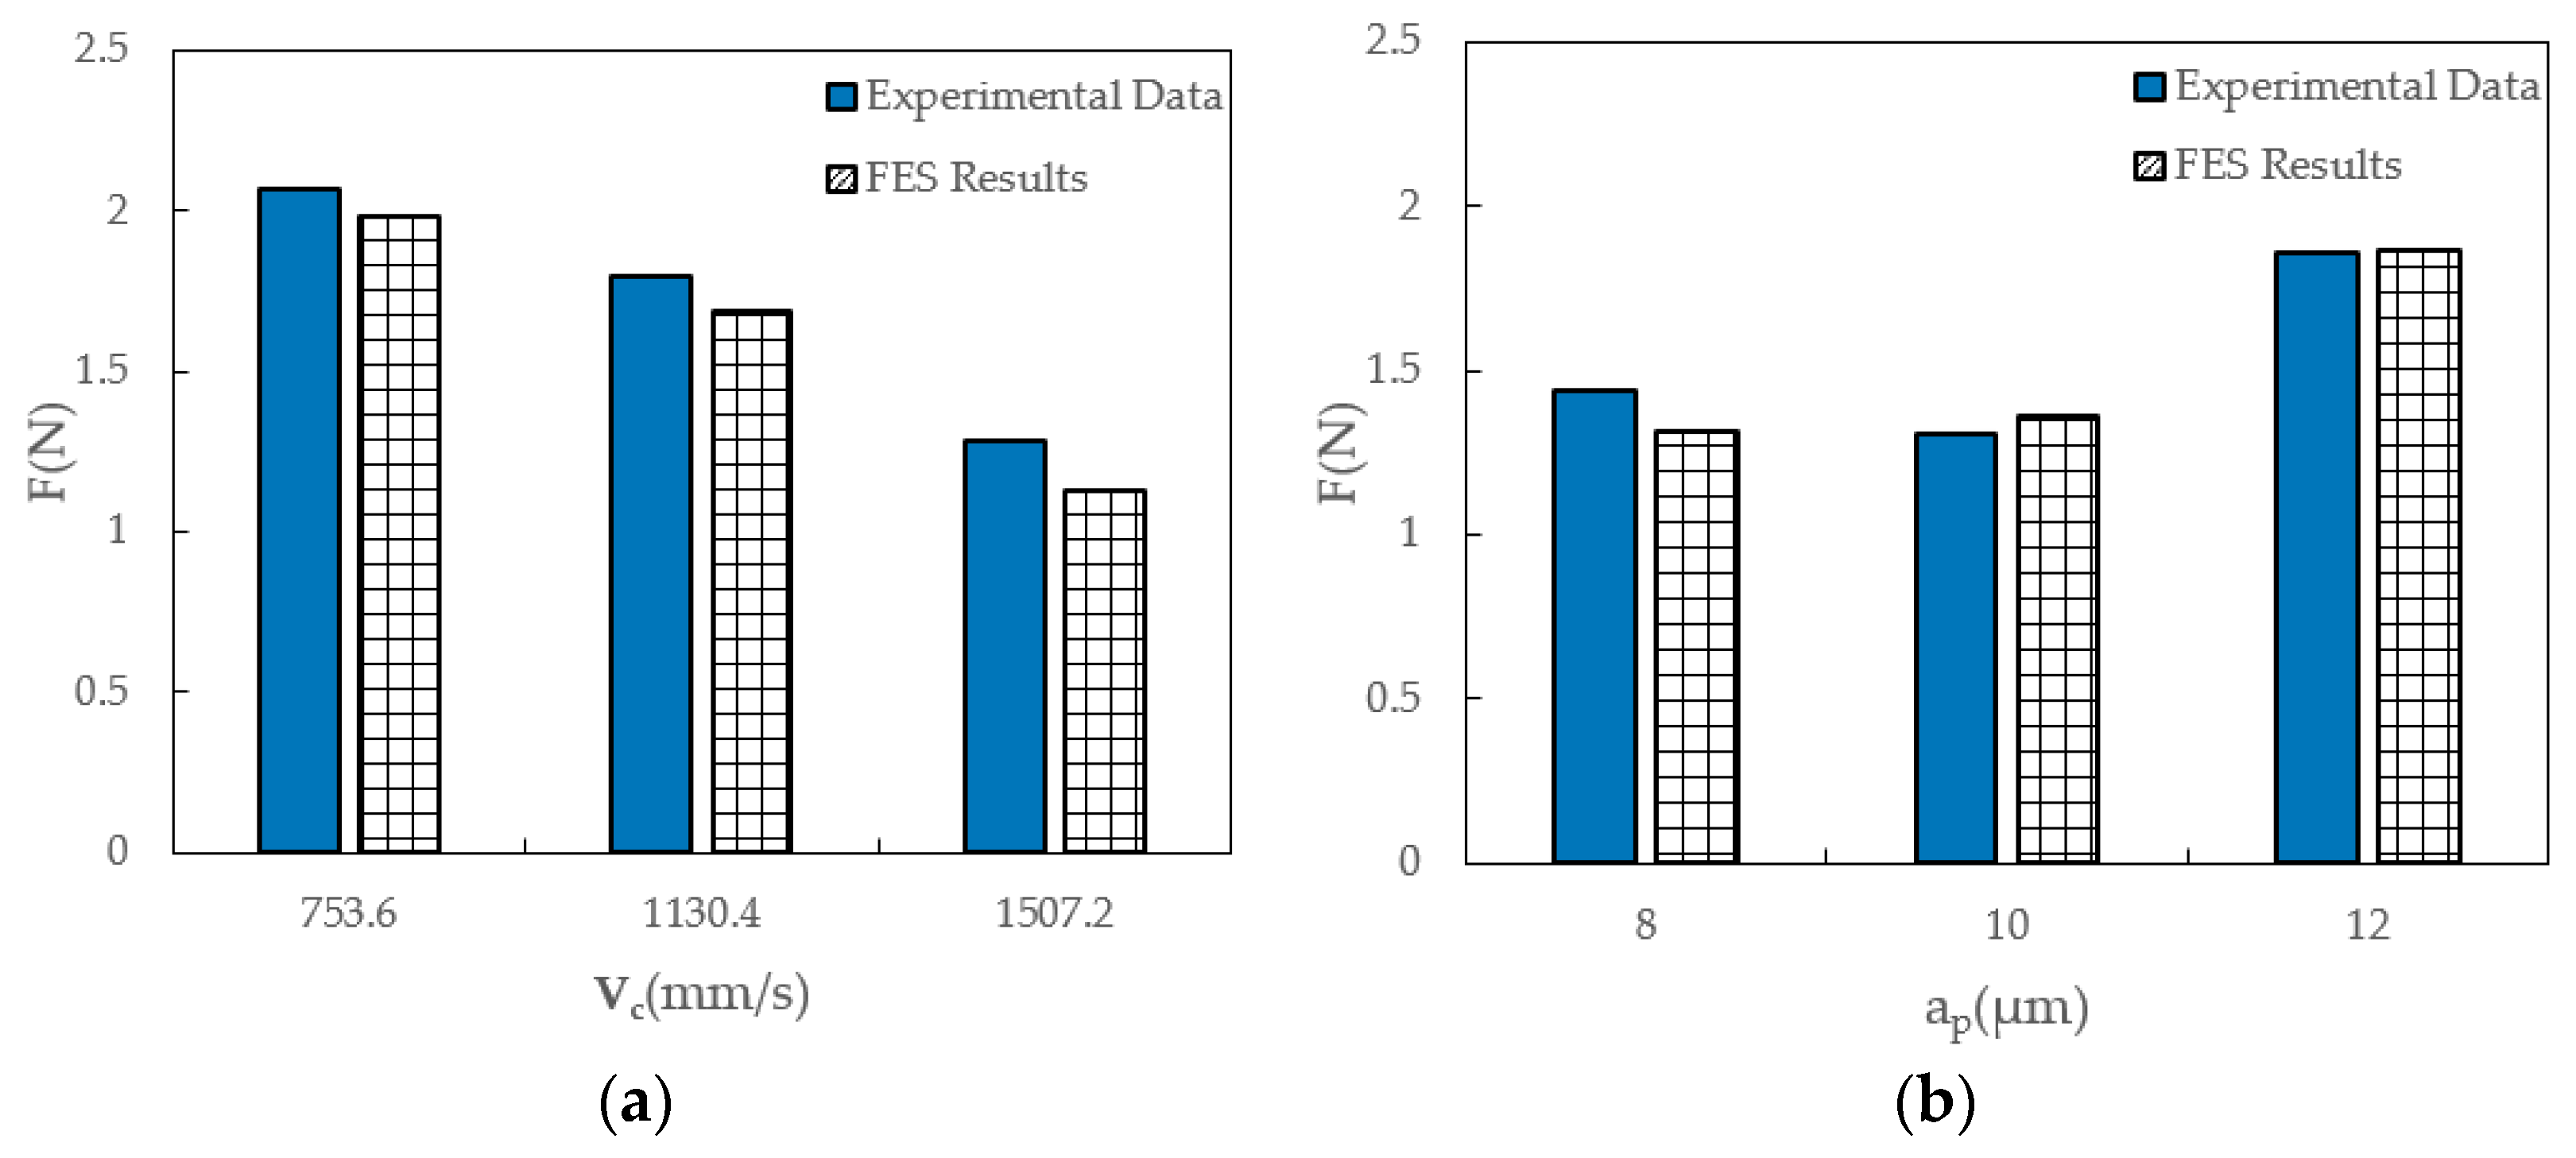
Comparing the experimental data with the results of finite element simulation analysis, as shown in Figure 11, it can be seen that the experimental data and simulation results show a high degree of consistency, and the two are very close. This high degree of agreement is not accidental, and it effectively proves the reliability of the experimental data we collected, providing solid data support for subsequent research work, and laying an important foundation for further exploration of related theories and practices.
When the milling speed is low, the main influence is the minimum chip thickness theory. The tool does not cut on the surface of the workpiece but slides and plows. Therefore, the milling force will continue to increase as the milling speed increases. At the same time, in the milling process at low speeds, built-up edges will form on the rake face of the tool. The built-up edges increase the hardness of the tool, but their instability causes the cutting depth and thickness to constantly change during the cutting process. This not only affects the machining accuracy but also generates vibration and impact, leading to changes in the milling force and causing it to continuously increase. As the milling speed continues to increase, the tool gradually enters the cutting state, and the built-up edges gradually disappear. At this stage, the milling force will decrease. When the milling speed reaches a higher level, the machine tool undergoes significant vibrations, the cutting process becomes unstable, and the milling force inevitably increases again.
When the milling depth is small, it is also influenced by the minimum chip thickness theory. As the milling depth gradually increases, the milling force will continuously increase. However, as the cutting process continues, the material begins to be removed in a plastic manner. The energy within the slip band is gradually broken, which reduces the force exerted on the tool and consequently decreases the milling force. But during the experiment, when the milling depth reaches a higher level, mechanical vibration and chemical reactions occur, leading to tool wear. At this time, the milling force significantly increases.
The effect of feed rate on the milling force is similar to that of the milling speed. Both are influenced by the minimum chip thickness theory, built-up edges generated during milling at low speeds, and machine tool vibration caused by higher milling speeds. These factors lead to changes in the milling force with a trend similar to that of the milling speed.

4.3. Effect of Cutting Parameters on Surface Quality

The data in Table 5 were processed to calculate the range (R) and variance (V) and then analyzed. The results of this processing are shown in Table 7.
Under the influence of the three cutting parameters of milling speed, milling depth, and feed rate, the range and variance charts of the surface roughness of single-crystal DD5 are shown in Figure 12. It can be seen from the figure that the range and variance of the milling speed are the largest among the three, followed by the milling depth, and the feed rate has the smallest values. Therefore, we can draw the following conclusion: In the orthogonal experiment of surface roughness on single-crystal DD5, the milling speed has the greatest influence on the surface roughness during the micro-milling process, while the milling depth and feed rate have less influence on it. So, reasonably selecting the milling speed plays a very important role and practical significance in effectively controlling the surface roughness during the micro-milling process to obtain better surface quality.
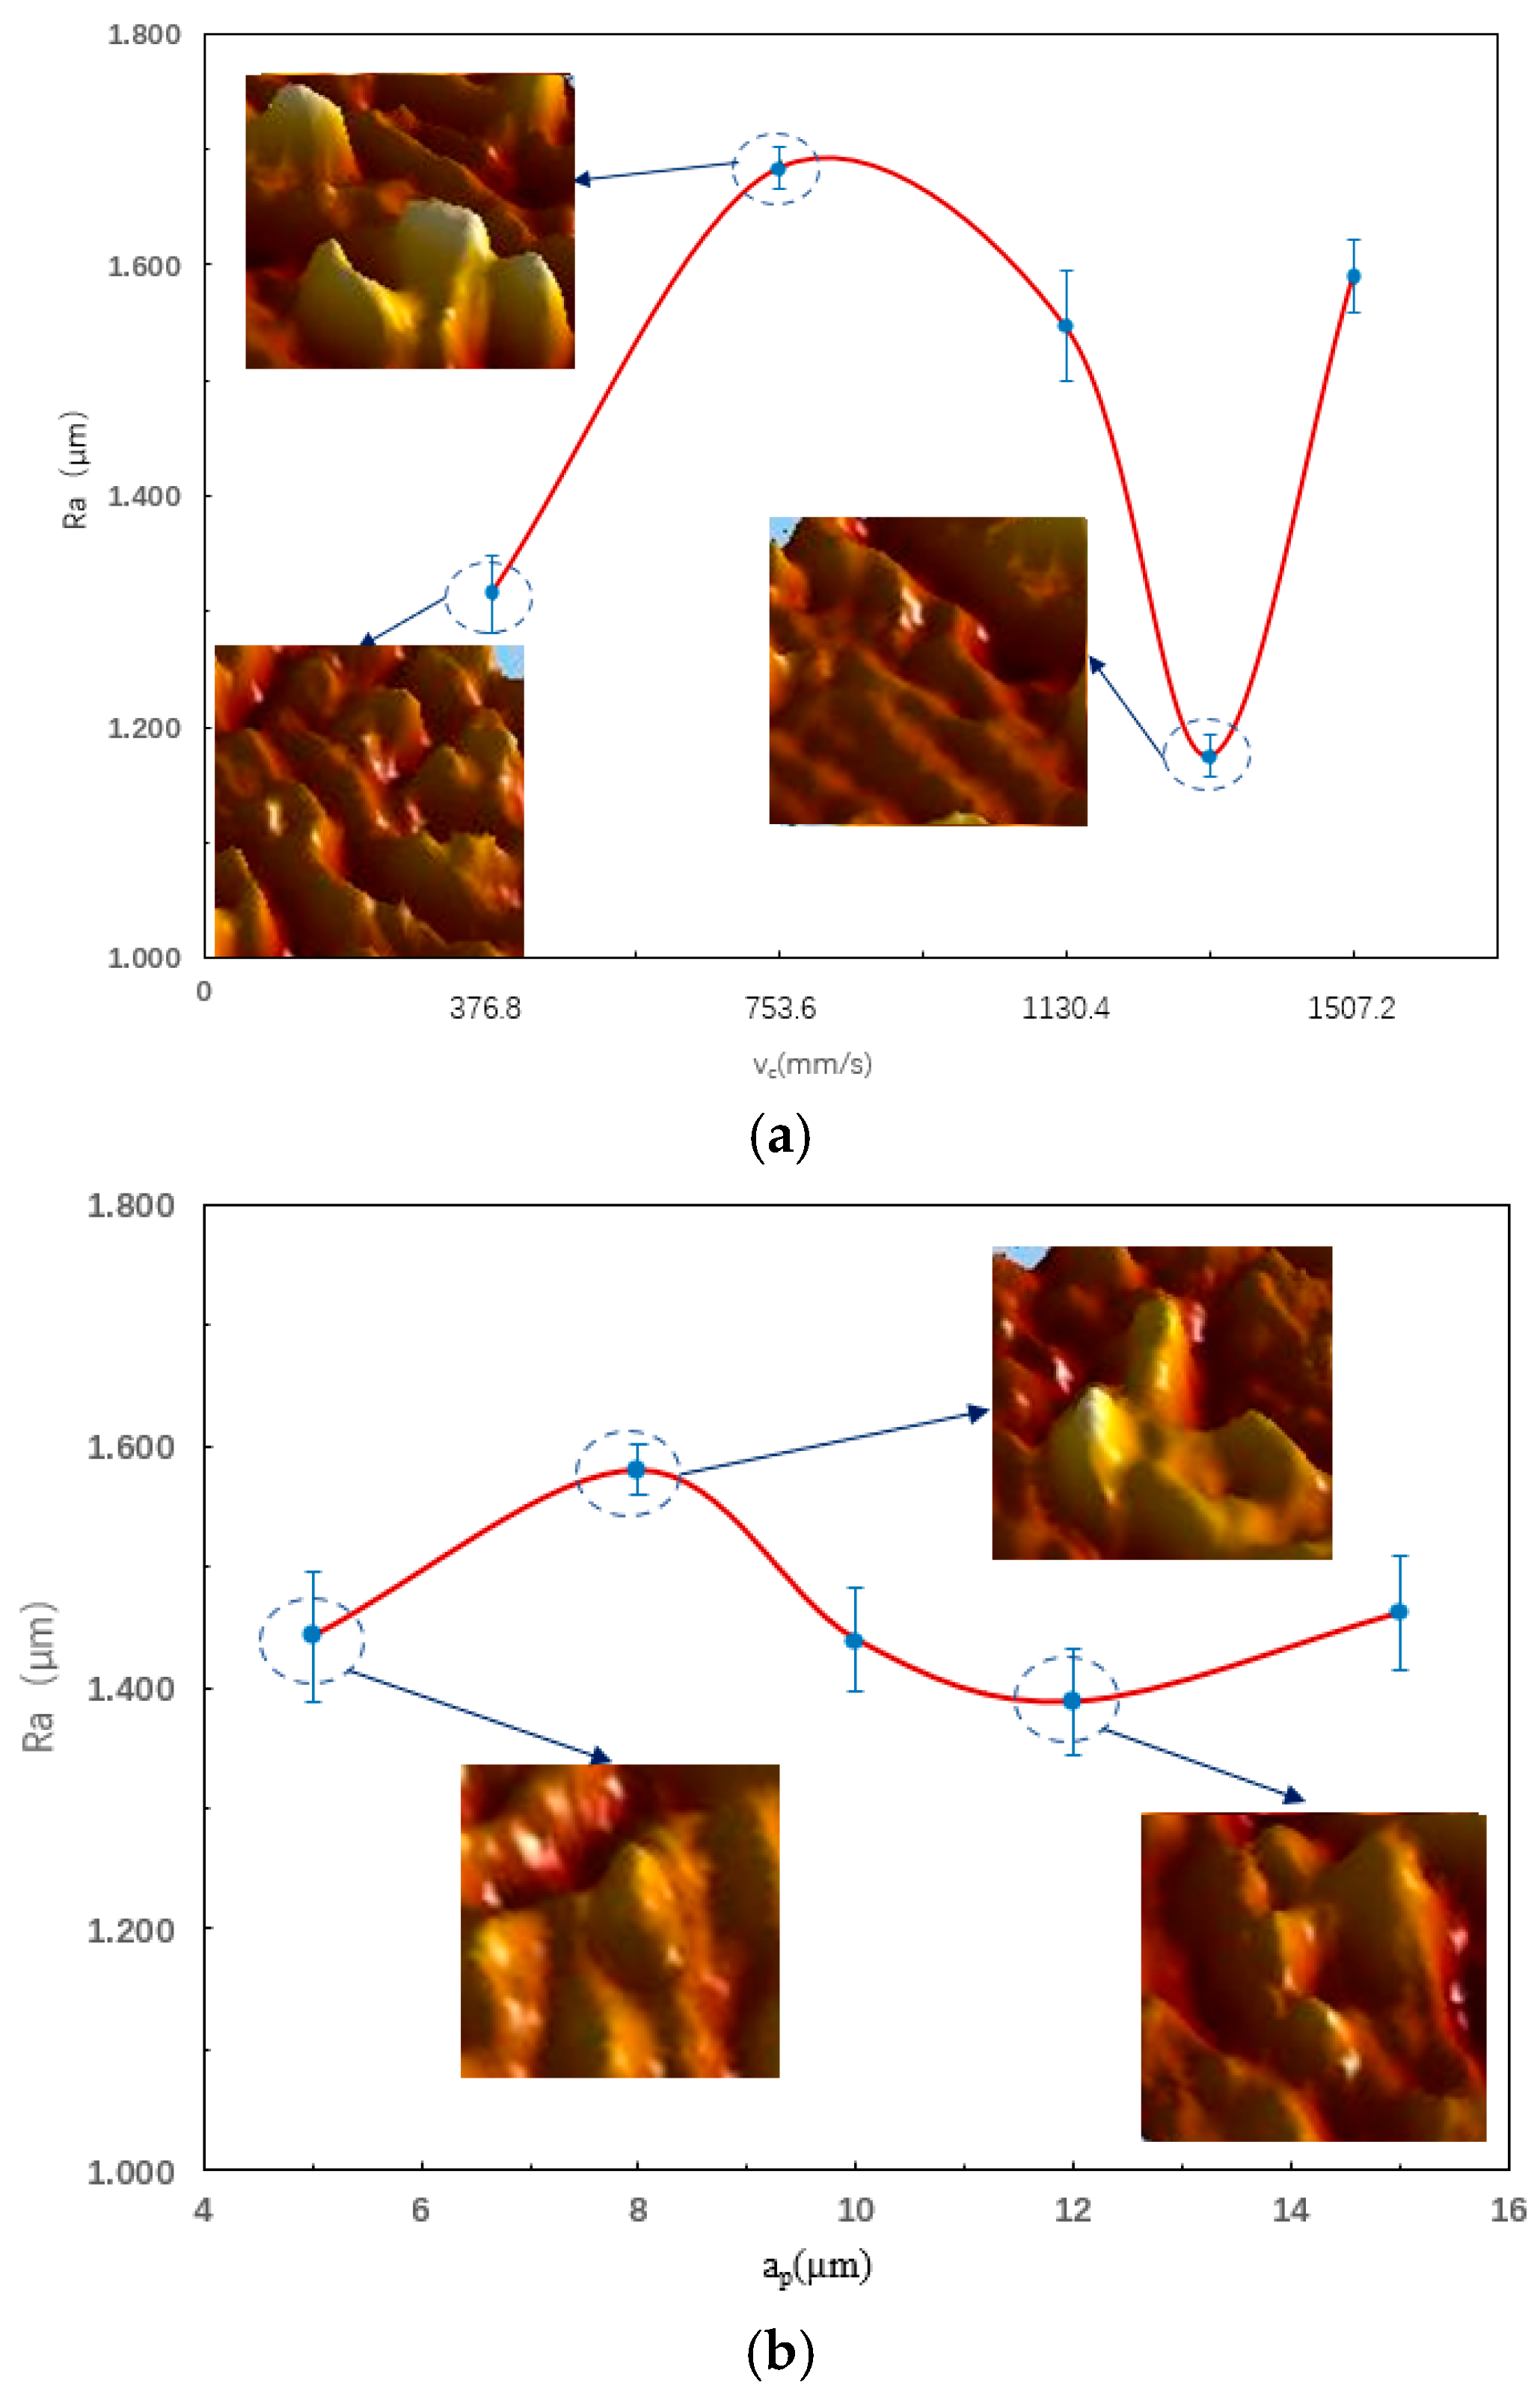
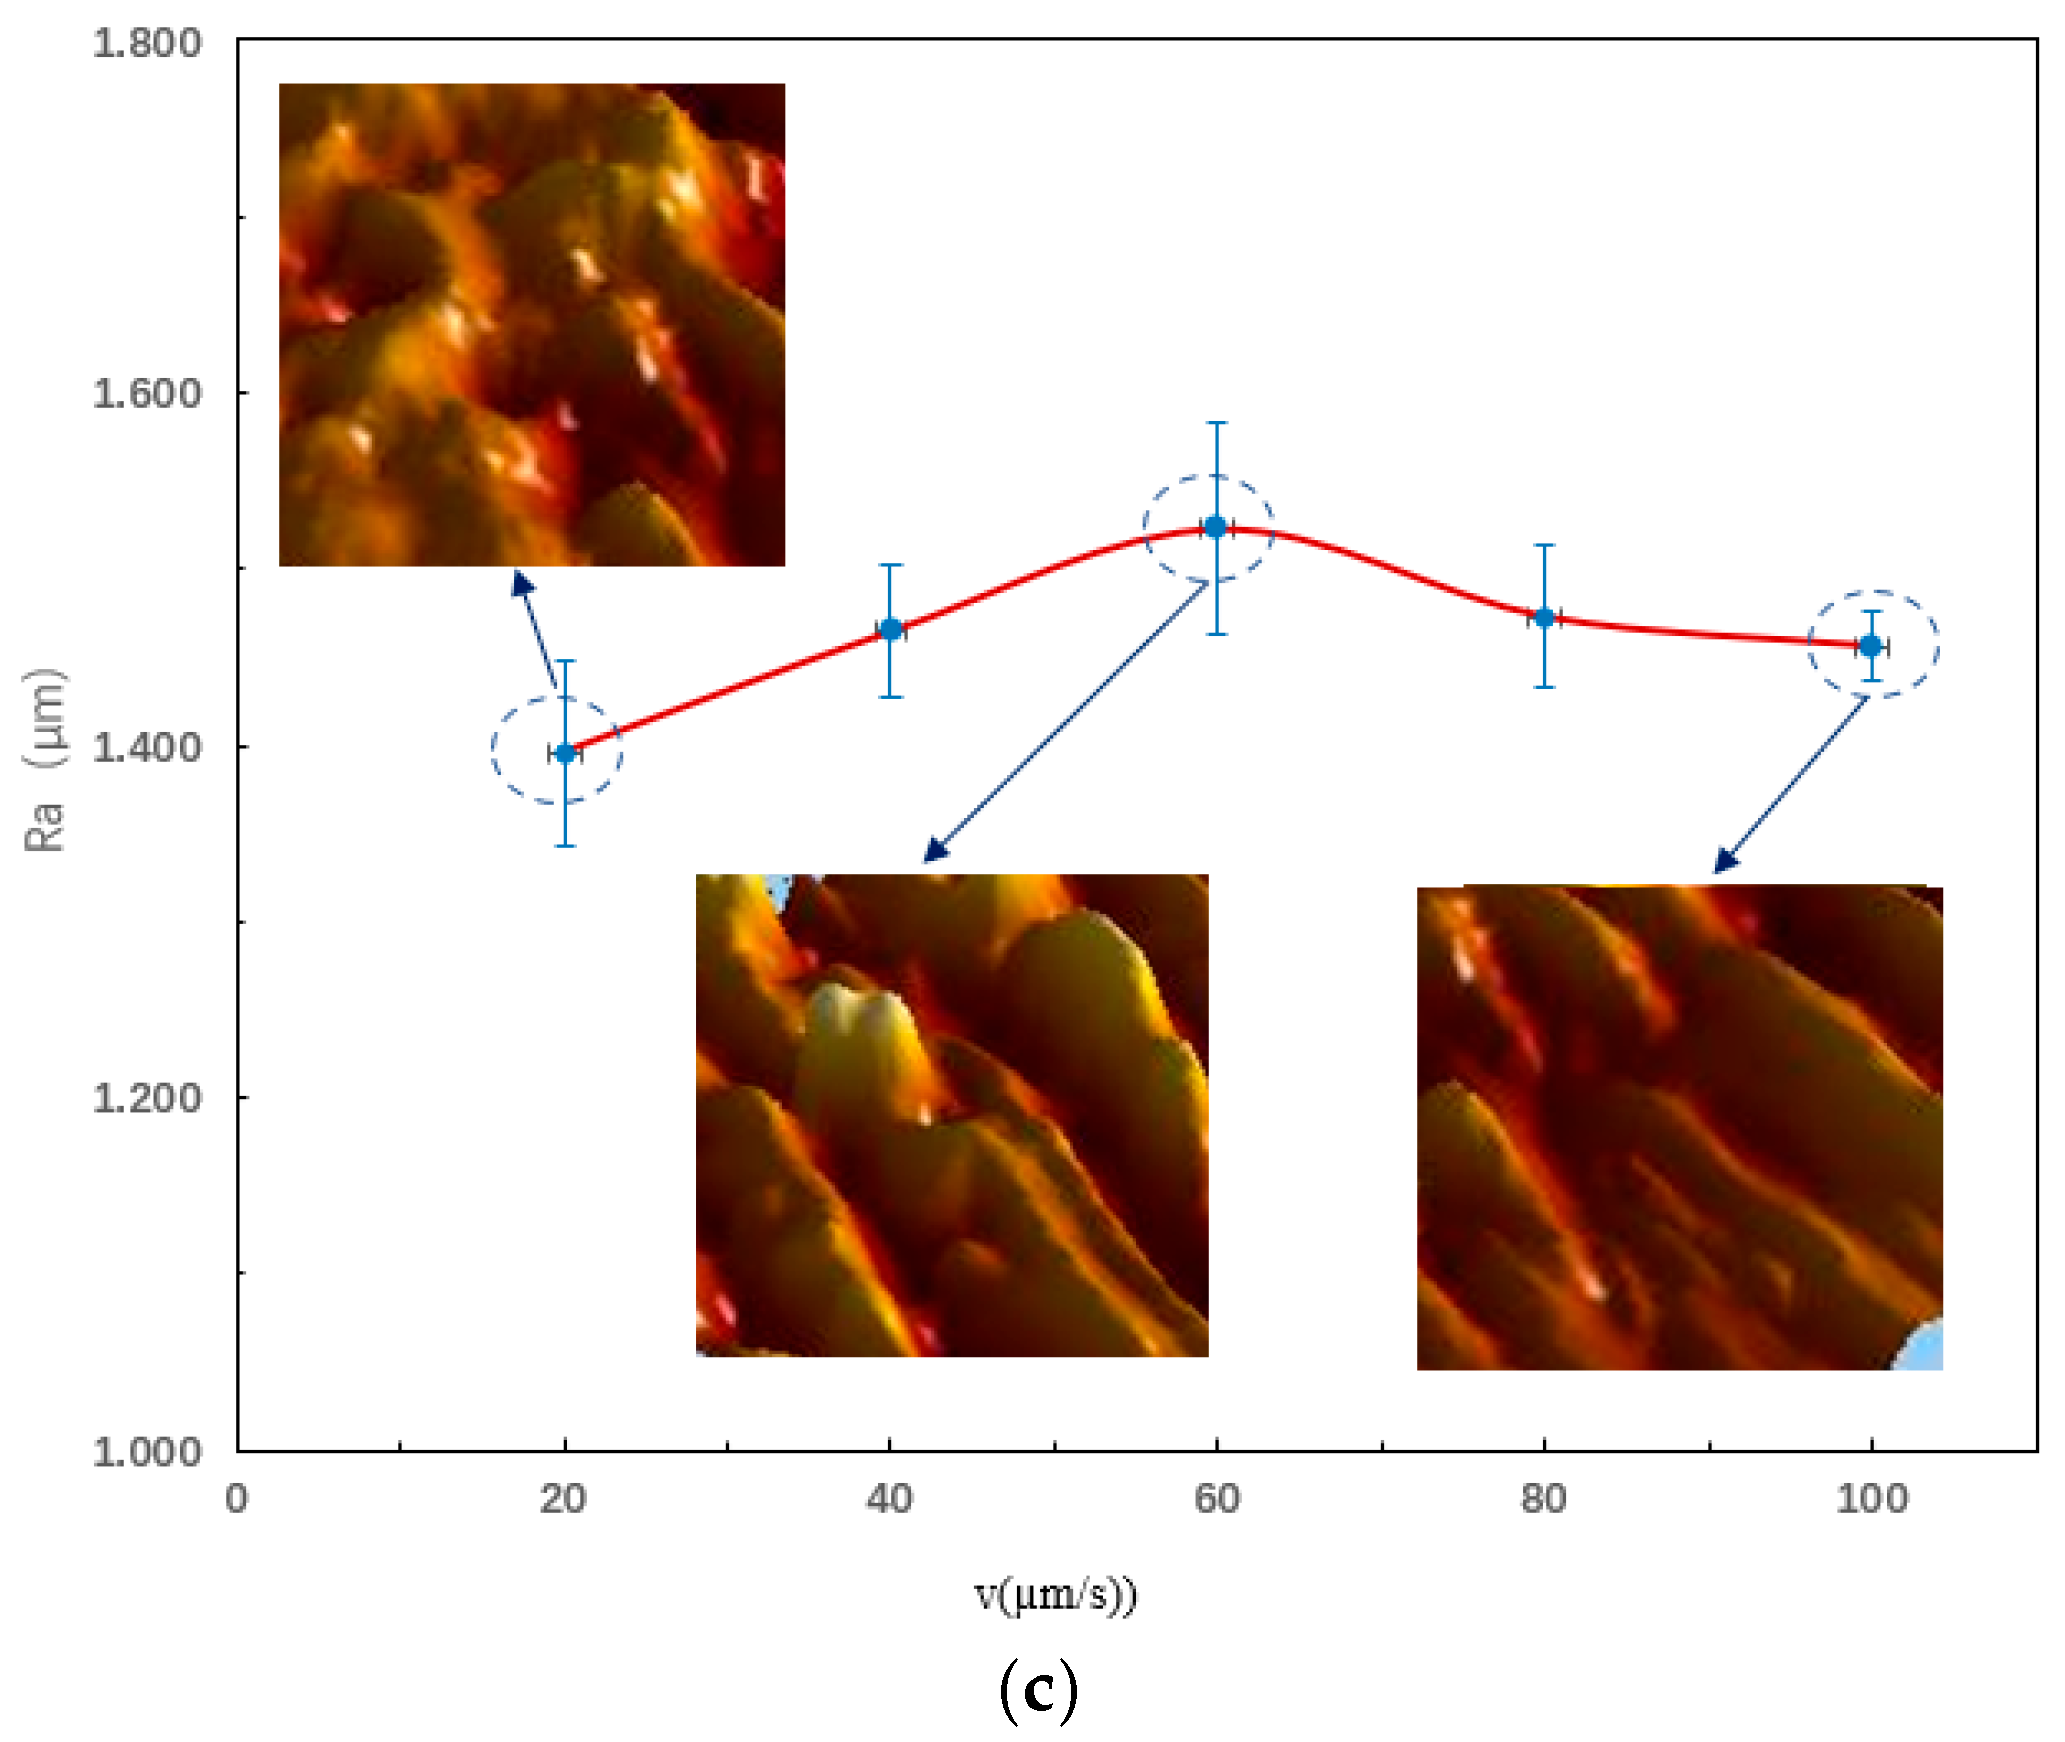
To further study the variation trend of the influence of the three cutting parameters, namely milling speed, milling depth, and feed rate, on the surface roughness, the average of the sum of the data corresponding to each column and level is now calculated (the obtained data is shown in Table 7), and a line chart of the influence of these three factors on the surface roughness is drawn, as shown in Figure 13.
As can be seen from Figure 13, when the milling speed is 12,000 r/min, the surface roughness is 1.316 µm. When the milling speed increases to 1884 mm/s, the surface roughness is 1.590 µm, which is increased by 21%. With the increase in milling speed, the overall variation trend of surface roughness is to first increase, then decrease, and then increase again. The turning points are 24,000 r/min and 42,000 r/min, and the maximum and minimum values are reached in turn at the turning points, which are 1.684 µm and 1.175 µm, respectively, with a difference of 0.509 µm. When the milling depth is 5 µm and 15 µm, the surface roughness is 1.442 µm and 1.462 µm, respectively, with little change. But from the overall micro-milling process, as the milling depth increases, the overall variation trend of surface roughness is to first increase, then decrease, and then increase again. The turning points are 8 µm and 12 µm, and the maximum value of 1.580 µm and the minimum value of 1.388 µm are reached at the milling depth of 8 µm and 12 µm, respectively, with a difference of 0.192 µm, and the surface roughness fluctuates greatly. When the feed rate increases from 20 µm/s to 100 µm/s, the surface roughness increases from 1.395 µm to 1.456 µm, which is only increased by 4%, and the change is not significant. With the increase in feed rate, the overall variation trend of surface roughness is to first increase and then decrease, and the turning point is 60 µm/s. At this time, the surface roughness reaches the maximum value of 1.523 µm, which is only 0.128 µm different from the minimum value of 1.395 µm reached at the feed rate of 20 µm/s, with little fluctuation. It can be seen that the influence of milling speed on surface roughness is the largest among the three, which further proves that reasonably selecting the milling speed is an effective way to control the surface roughness in the micro-milling process in order to obtain better surface quality.
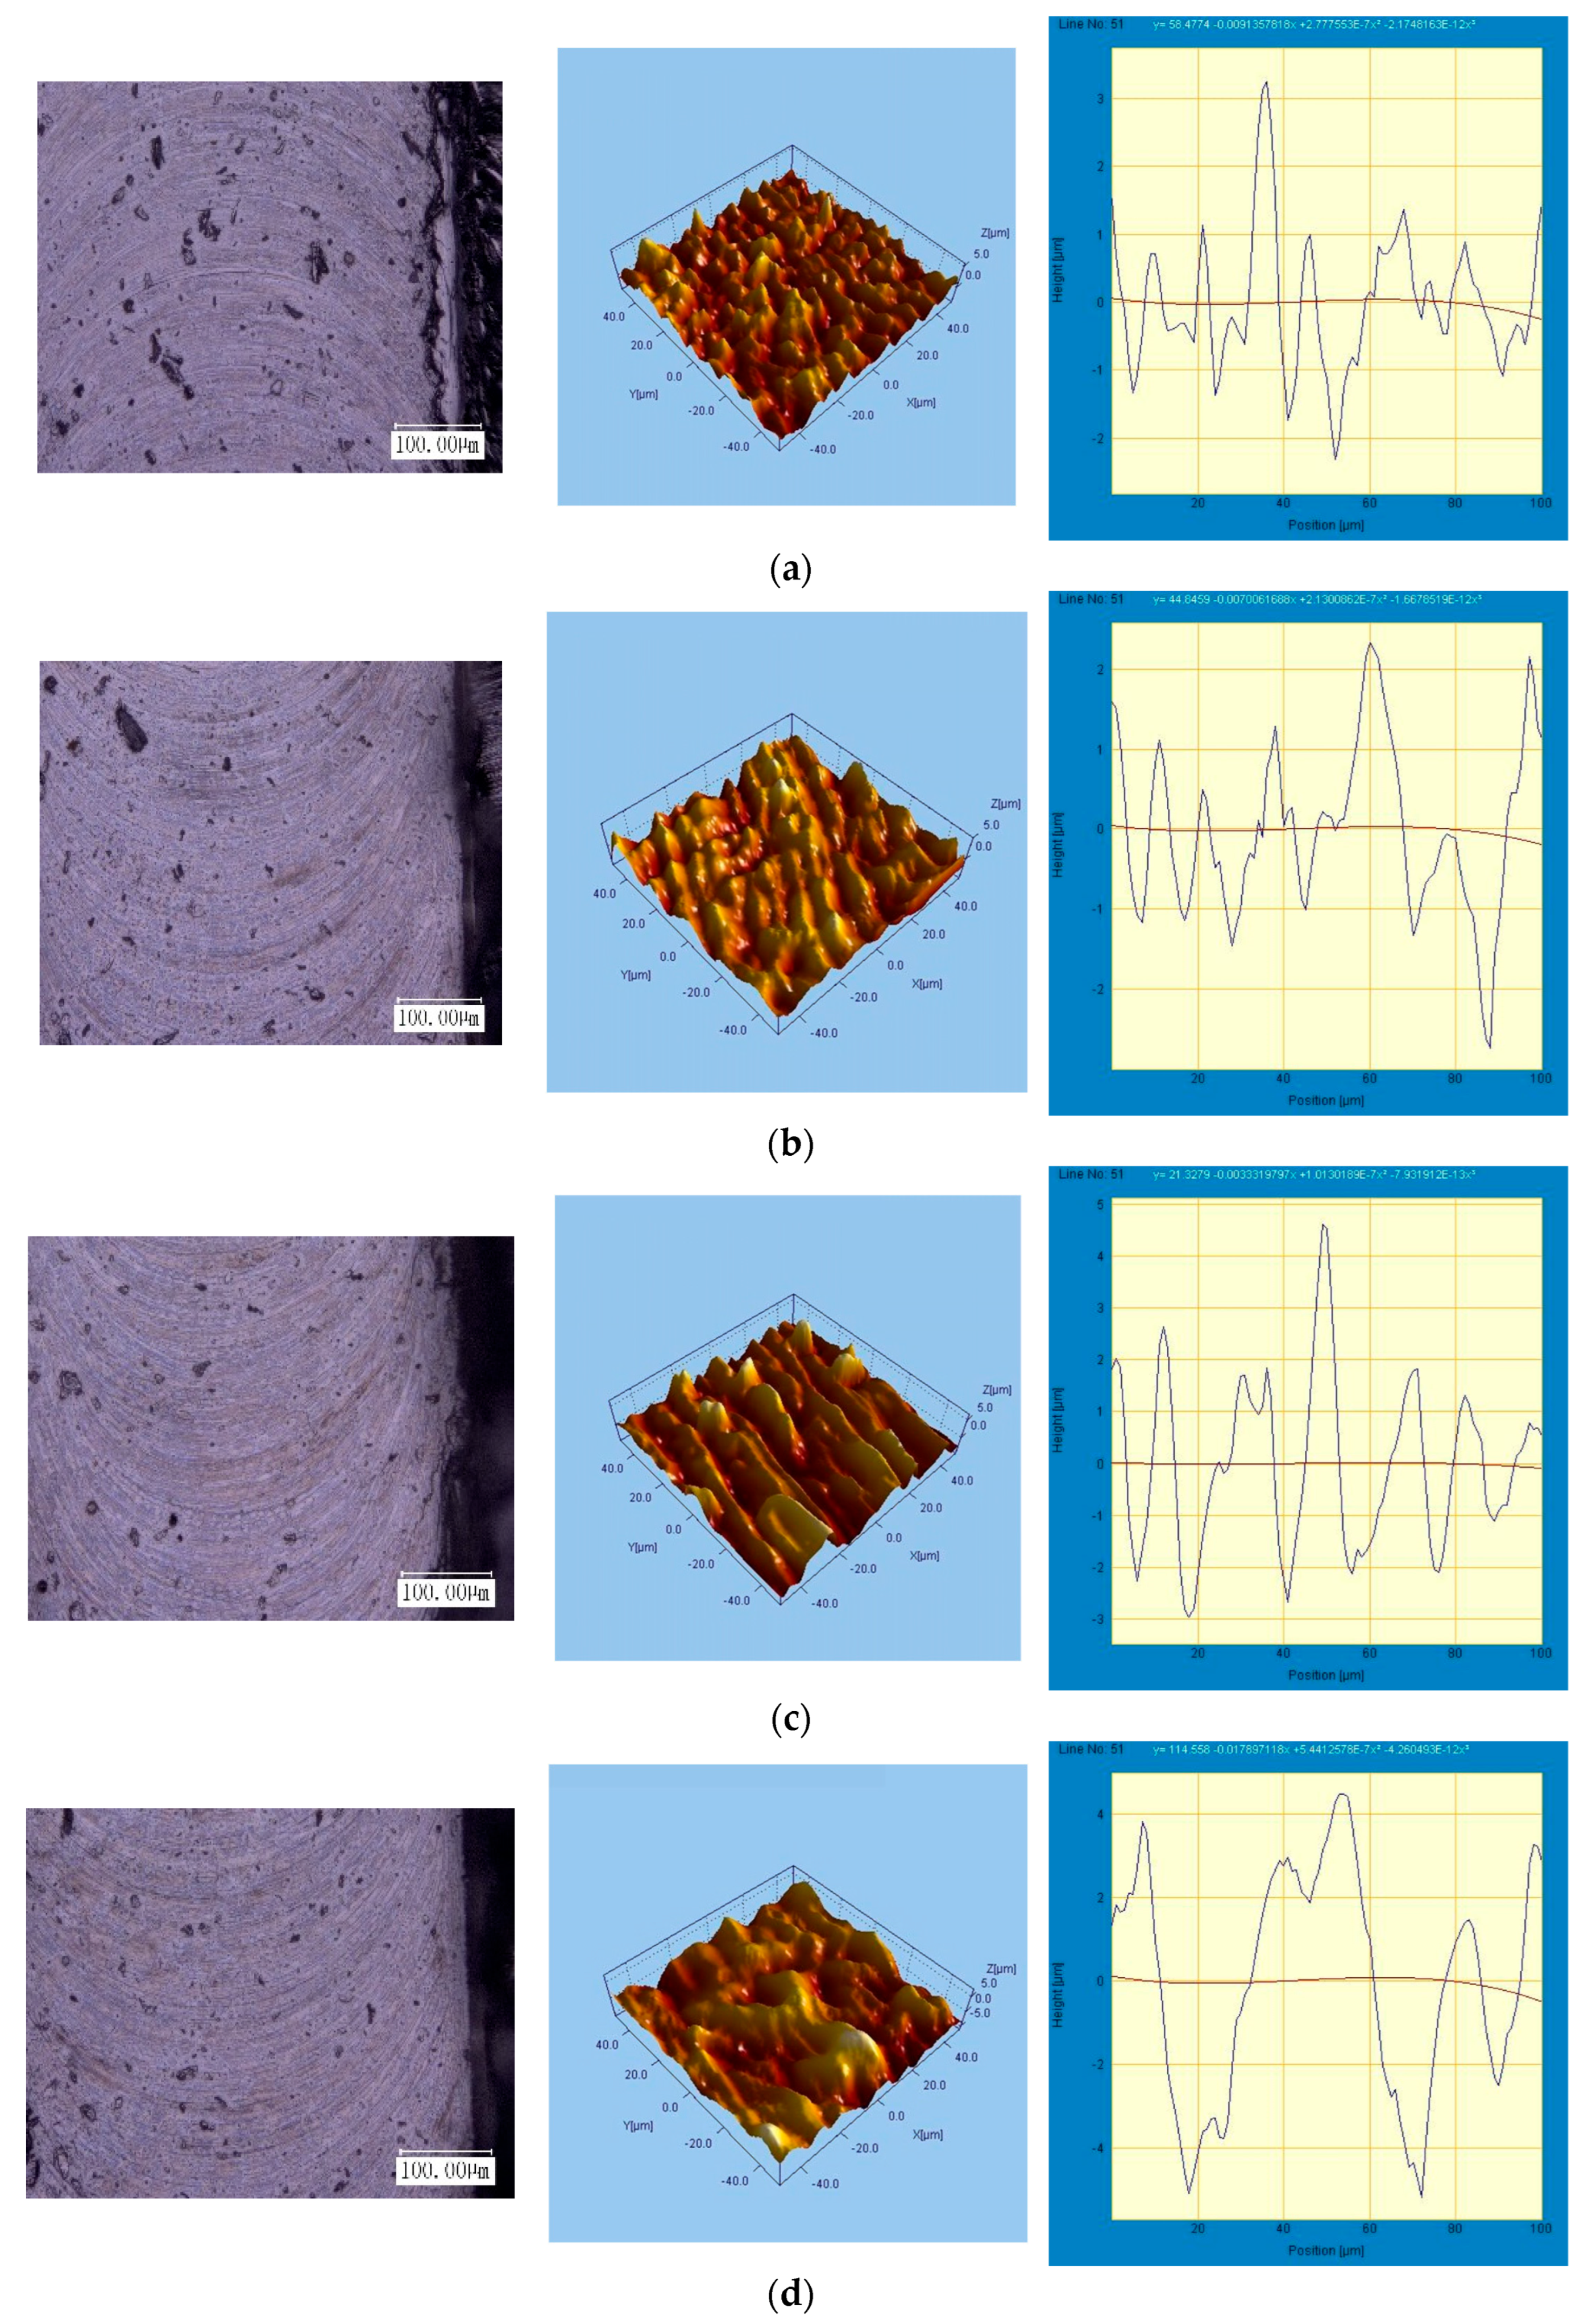
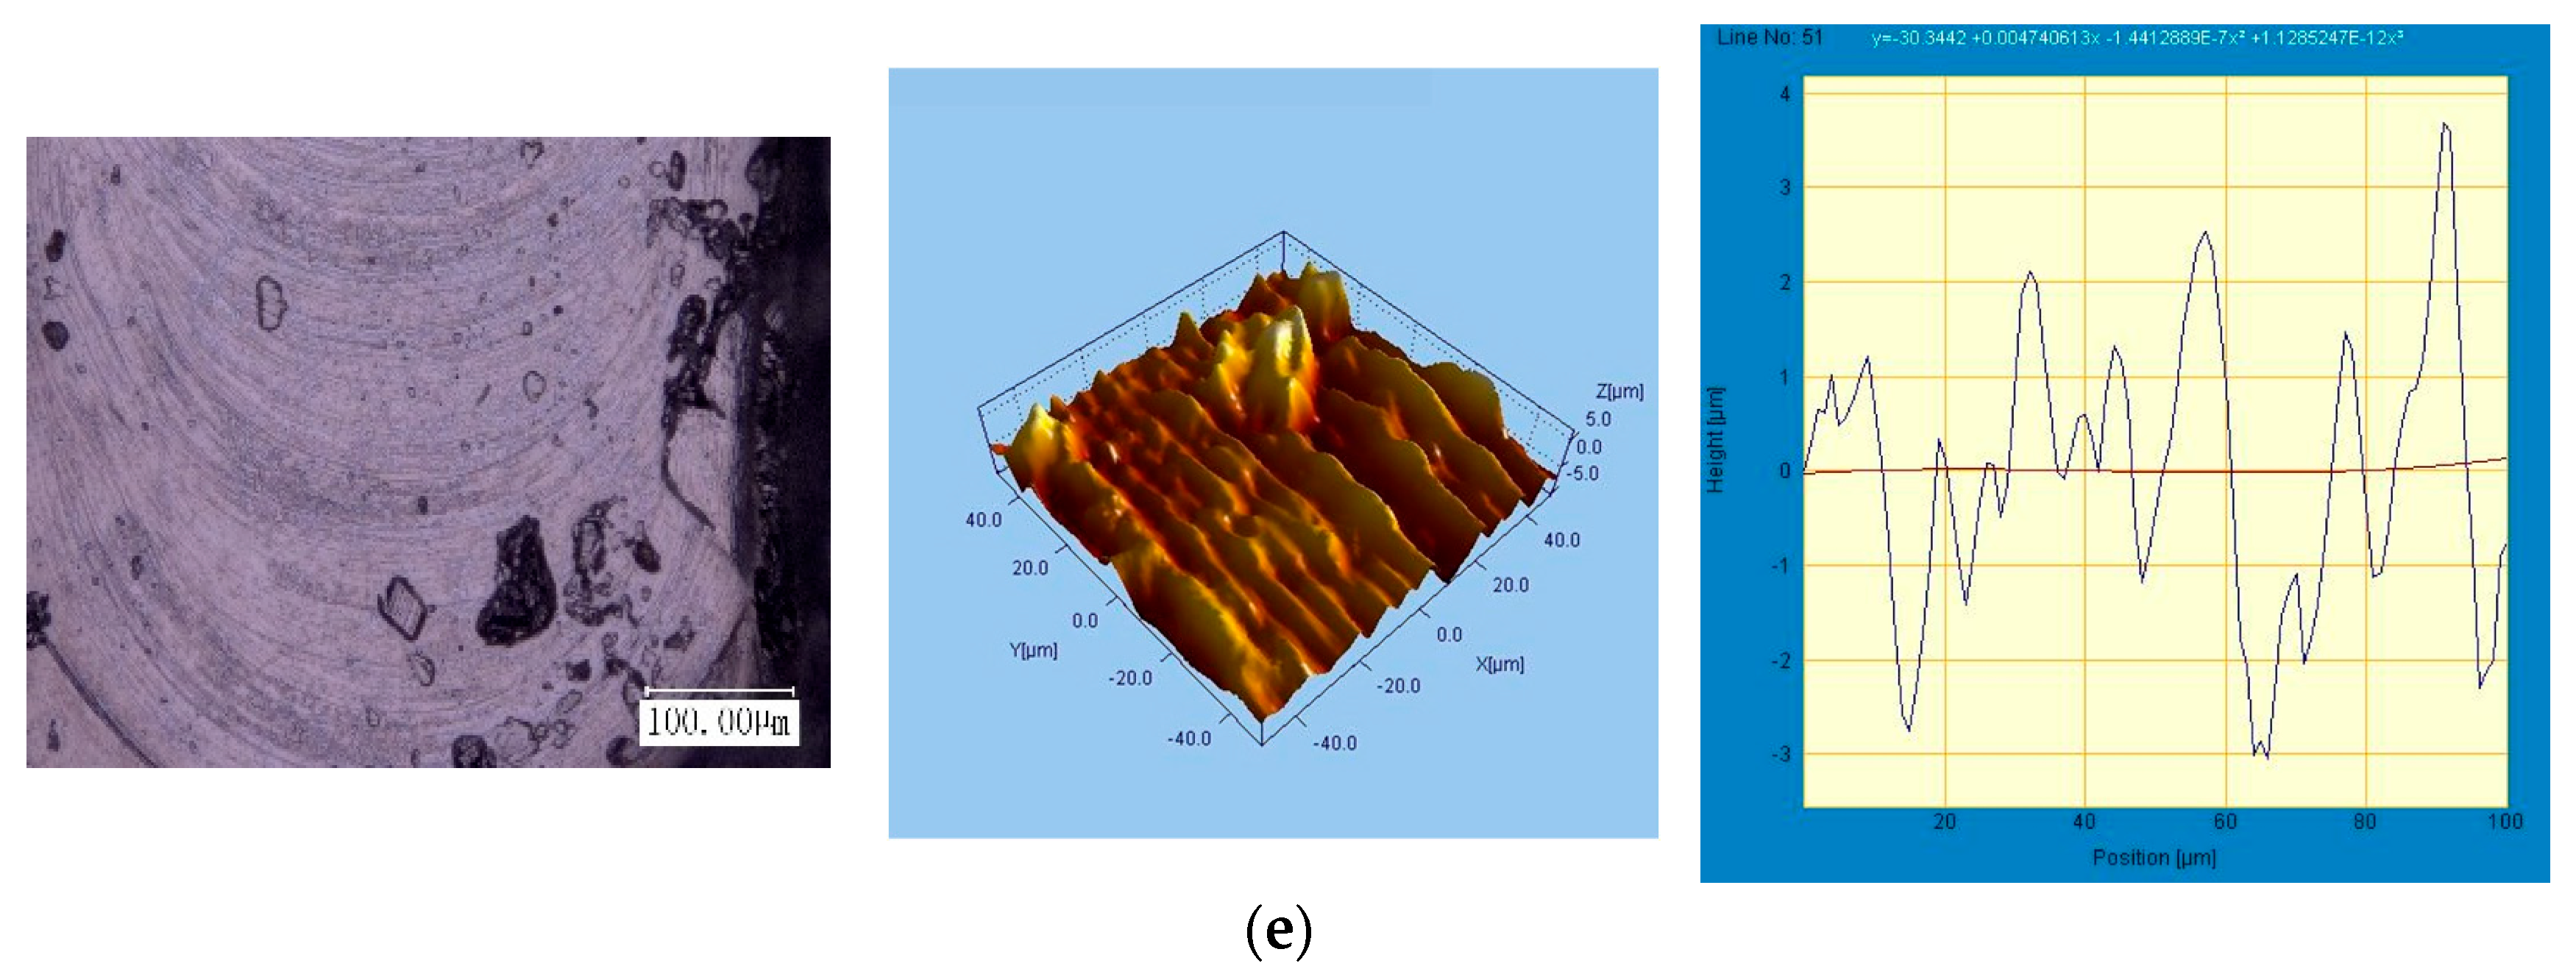
The machined surface can be mathematically analyzed by measuring the surface roughness value, while the surface topography and three-dimensional morphology observed through super-depth microscope and three-dimensional profiler can more intuitively evaluate the surface quality. The following figure shows the surface topography and three-dimensional profile of single-crystal DD5.
As can be seen from Figure 14, when the feed rate is constant, the surface quality of single-crystal DD5 varies with different cutting parameters. When the milling speed and milling depth gradually increase, the surface quality first becomes better and then worse. When the cutting parameters are relatively large, in addition to being affected by the machine tool spindle vibration, the burrs and microscopic defects on the surface produced during the machining process also have a certain impact on its surface quality.
As the single-crystal DD5 nickel-based superalloy is a difficult-to-machine material with relatively high hardness, when the milling speed is low, the cutting temperature is also low. At this time, influenced by the minimum chip thickness theory, the material is mainly removed in a brittle manner. Meanwhile, in the low-speed process, built-up edges will generate on the rake face of the tool. The instability of the built-up edges makes the cutting depth and thickness constantly change, resulting in vibration and impact. Moreover, the fragments of the fallen built-up edges adhere to the machined surface, making the machined surface rough. As the machining process proceeds and the tool enters the normal cutting state, with the continuous increase in the milling speed, the peripheral milling speed of the micro-end mill becomes larger, the built-up edges gradually decrease and disappear, and the number of times the tool passes through the workpiece surface per unit volume per unit time increases, which improves the material removal rate. During this process, the surface roughness value shows a decreasing trend, and as the milling speed continues to increase, the surface quality tends to be smooth. However, with the further increase in the milling speed, the cutting temperature will also rise, and the material removal mode changes from brittleness to plasticity, making its machined surface uneven. At the same time, when the milling speed reaches a relatively high level, the machine tool spindle vibration is quite serious, and the cutting process is unstable, resulting in poor surface quality again.
Affected by the minimum chip thickness theory, the overall variation trend of the surface roughness value with the increase in milling depth is to first increase, then decrease, and then increase again. However, from a general perspective, the fluctuation is slightly smaller than that of the milling speed. Since the slip band becomes wider as the milling depth increases and the elastic recovery ability of each slip layer is different, the surface quality gradually decreases. But when the milling depth reaches a certain value, the lattice inside the crystal is broken by the accumulated energy, and some dislocations pile up under the action of internal stress and form chips along the rake face of the tool, which improves the surface quality. If the milling depth continues to increase, it will cause vibration of the machine tool and affect the machining quality.
At low feed rates, the influence of the minimum chip thickness theory is serious, resulting in severe rubbing and plowing phenomena. The single-tooth movement of the tool does not produce an actual chip every time, leading to an uneven workpiece surface and poor surface quality. As the milling speed continuously increases, the feed per tooth completely breaks away from the restriction of the minimum chip thickness, and the tool gradually enters the cutting state. The rubbing and plowing phenomena are alleviated, and the surface quality is improved.

5. Conclusions

(1)
This study employed finite element analysis and orthogonal experimental methods to investigate the micro-milling process of nickel-based single-crystal superalloy DD5 components. The influences of cutting speed, cutting depth, and feed rate on the milling forces and surface quality were systematically analyzed and characterized.
(2)
In practical machining, the surface quality of parts is usually used as the measurement standard. From the perspective of surface quality, when the milling speed is 1318.8 mm/s, the milling depth is 12 µm, and the feed rate is 20 µm/s, the surface roughness value is at its minimum, indicating the best surface quality. Naturally, this set of data is solely based on the experimental methods and parameters employed in this study. Its application to actual production would require further research and investigation.
(3)
In this study, the surface roughness of DD5 micro-milled parts was most significantly affected by spindle speed, followed by milling depth, with feed rate having the least impact. However, while high-speed cutting improved efficiency, it also intensified tool wear. Therefore, the optimized processing parameter combination obtained in this study holds great significance for practical machining production.

Author Contributions

Conceptualization, Y.L. (Ying Li) and Y.G.; methodology, Y.L. (Ying Li); software, Y.L. (Yang Liu); validation, Y.L. (Ying Li), Z.W. (Zhike Wang) and Z.W. (Zhiheng Wang); formal analysis, Y.L. (Ying Li); investigation, Z.X.; resources, J.Z.; data curation, Z.W. (Zhike Wang); writing—original draft preparation, Z.W. (Zhiheng Wang); writing—review and editing, J.Z.; visualization, Z.X.; supervision, Y.L. (Yang Liu); project administration, Y.G. All authors have read and agreed to the published version of the manuscript.

Funding

This research was funded by the Liaoning Provincial Natural Science Foundation Joint Fund, grant number 2023-MSLH-201.

Data Availability Statement

The original contributions presented in the study are included in the article, further inquiries can be directed to the corresponding author.

Acknowledgments

We would like to thank Northeastern University and the Shenyang Institute of Technology for carrying out the experiments and the technical support.

Conflicts of Interest

The authors declare no conflicts of interest. The funders had no role in the design of the study; in the collection, analyses, or interpretation of data; in the writing of the manuscript; or in the decision to publish the results.

References

  1. Rehan, M.; He, T.; Khalil, A.K.; Tahir, D.; Yip, W.S.; To, S.S. Experimental Investigation of the Micro-Milling of Additively Manufactured Titanium Alloys: Selective Laser Melting and Wrought Ti6Al4V. Chin. J. Mech. Eng. 2024, 37, 115–127. [Google Scholar] [CrossRef]
  2. Liu, J.; Chen, N.; Jia, Y.; Zhao, J.; Wu, L.; Xiao, H.; He, N.; Yu, N.; Li, L. Machinability improvement in micro milling AlN after laser chemical milling. Chin. J. Aeronaut. 2024, 37, 588–602. [Google Scholar] [CrossRef]
  3. Sun, Y.; Sun, Y.R.; Huang, Y.M.; Gong, S.; Sun, M.S.; Liu, M. Study on developing predicted system model of cutting-edge trajectory for micro-milling process based on tool runout error, chip thickness and force signal. Mech. Syst. Signal Process. 2025, 228, 112410. [Google Scholar] [CrossRef]
  4. Li, C.; Wang, K.; Zakharov, O.; Cui, H.; Wu, M.; Zhao, T.; Yan, Y.; Geng, Y. Damage evolution mechanism and low-damage grinding technology of silicon carbide ceramics. Int. J. Extrem. Manuf. 2025, 7, 022015. [Google Scholar] [CrossRef]
  5. Xiang, D.; Liu, Y.; Yu, T.; Wang, D.; Leng, X.; Wang, K.; Liu, L.; Pan, J.; Yao, S.; Chen, Z. Review on wear resistance of laser cladding high-entropy alloy coatings. J. Mater. Res. Technol. 2024, 28, 911–934. [Google Scholar] [CrossRef]
  6. Hu, Y.; Jin, X.; Jiang, X.; Zheng, Z. Inverse kinematics model and trajectory generation of a dual-stage micro milling machine. J. Manuf. Process. 2024, 132, 425–450. [Google Scholar] [CrossRef]
  7. Hojati, F.; Baraheni, M.; Azarhoushang, B. Research on Ploughing to Shearing Transition in Micro Milling of Titanium Alloy Using Gramian Angular Field and Machine Learning Methods. Arab. J. Sci. Eng. 2024, 1–13. [Google Scholar] [CrossRef]
  8. Bai, Q.; Wang, P.; Cheng, K.; Zhao, L.; Zhang, Y. Machining dynamics and chatters in micro-milling: A critical review on the state-of-the-art and future perspectives. Chin. J. Aeronaut. 2024, 37, 59–80. [Google Scholar] [CrossRef]
  9. Khan, M.A.; Khan, M.A.; Aziz, S.; Faraz, M.I.; Tahir, A.M.; Jaffery, S.H.I.; Jung, D.W. Experimental Evaluation of Surface Roughness, Burr Formation, and Tool Wear during Micro-Milling of Titanium Grade 9 (Ti-3Al-2.5V) Using Statistical Evaluation Methods. Appl. Sci. 2023, 13, 12875. [Google Scholar] [CrossRef]
  10. Ding, P.; Huang, X.; Miao, X.; Li, S.; Liu, H. Dynamic stability simulation of micro-milling under the condition of multi-parameter uncertainty. Probabilistic Eng. Mech. 2023, 74, 103499. [Google Scholar] [CrossRef]
  11. Ding, P.; Huang, X. Sustainable optimization of micro-milling machining parameters considering reliability assessment. Mech. Based Des. Struct. Mach. 2025, 53, 864–901. [Google Scholar] [CrossRef]
  12. Ding, P.; Huang, X.; Rong, Z.; Li, S.; Gao, W. Modeling and reliability analysis of the micro-milling process considering stochastic tool wear with surrogate models. Mech. Based Des. Struct. Mach. 2025, 53, 611–640. [Google Scholar] [CrossRef]
  13. Mahmat, A.; Agar, S.; Tosun, N. Ultrasonic-assisted high-speed micro-milling of Ti6Al4V. J. Braz. Soc. Mech. Sci. Eng. 2024, 47, 46. [Google Scholar] [CrossRef]
  14. Yang, K.; Cao, Z.; Zhao, X.; Mei, W.; Wu, Q. Experimental Study of Micro-Milling Carbon Fibre Reinforced Composites Under Variable Cooling and Lubrication Strategies. Int. J. Precis. Eng. Manuf.-Green Technol. 2024, 12, 1247–1260. [Google Scholar] [CrossRef]
  15. Karkantonis, T.; Penchev, P.; Nasrollahi, V.; Le, H.; See, T.L.; Bruneel, D.; de Ramos Campos, J.A.; Dimov, S. Laser micro-machining of freeform surfaces: Accuracy, repeatability and reproducibility achievable with multi-axis processing strategies. Precis. Eng. 2022, 78, 233–247. [Google Scholar] [CrossRef]
  16. Yu, H.; He, Z.; Li, J.; Li, B.; Xin, J.; Yao, L.; Yan, F. Finite element modeling on micro-machining of graphene-reinforced aluminum matrix composites. Int. J. Adv. Manuf. Technol. 2022, 124, 97–110. [Google Scholar] [CrossRef]
  17. Kundiya, R.R.; Kadam, M.; Jadhav, P.; Pawade, R. A review on high speed micro-milling of shape memory alloy (NiTinol): Process and post perspective. Int. J. Interact. Des. Manuf. 2024, 19, 2337–2353. [Google Scholar] [CrossRef]
  18. Oymak, A.M.; Bahçe, E.; Gezer, İ. Experimental and numerical study on micro-milling of CoCrW alloy produced by selective laser melting and casting. Proc. Inst. Mech. Eng. Part B J. Eng. Manuf. 2024, 238, 1924–1939. [Google Scholar] [CrossRef]
  19. Ji, H.; Song, Q.; Du, Y.; Zhao, Y.; Liu, Z. Grain-scale material removal mechanisms of crystalline material micro-cutting. Int. J. Mech. Sci. 2022, 233, 107671. [Google Scholar] [CrossRef]
  20. Liu, C.; Wu, C.; Li, X.; Hou, B.; Wang, G.; Wu, J.; Sun, R.; Chen, M. Modeling and analysis of radial throw of micro-milling tool based on tool-attachment errors in high-speed rotating. J. Manuf. Process. 2023, 108, 779–790. [Google Scholar] [CrossRef]
  21. Wen, X.; Wen, M.; Ye, C.; Yu, S.; Yue, S.; Lu, T.M.; Zhao, Q. Highly Thermal-Conductive Cubic Boron Arsenide: Single-Crystal Growth, Properties, and Future Thin-Film Epitaxy. J. Phys. Chem. Lett. 2025, 16, 682–695. [Google Scholar] [CrossRef]
  22. Wang, J.; Yu, W.; Xu, S. Simultaneous regulation of grain size and interface of single-crystal ultrahigh-nickel LiNi0.9Co0.055Mn0.045O2 via one-step Li2ZrO3 coating. J. Colloid Interface Sci. 2025, 685, 427–436. [Google Scholar] [CrossRef]
  23. Zhang, X.; Zhang, Y.; Liu, J.; Yan, Z.; Chen, J. Syntheses, challenges and modifications of single-crystal cathodes for lithium-ion battery. J. Energy Chem. 2021, 63, 217–229. [Google Scholar] [CrossRef]
  24. Li, Y.; Zhao, B.; Xue, J.P.; Xie, J.; Yao, Z.S.; Tao, J. Giant single-crystal-to-single-crystal transformations associated with chiral interconversion induced by elimination of chelating ligands. Nat. Commun. 2021, 12, 6908. [Google Scholar] [CrossRef] [PubMed]
  25. Bahnmüller, U.J.; Kuper, H.; Seewald, T.; Yalҫinkaya, Y.; Becker, J.A.; Schmidt-Mende, L.; Weber, S.A.L.; Polarz, S. On the Shape-Selected, Ligand-Free Preparation of Hybrid Perovskite (CH3NH3PbBr3) Microcrystals and Their Suitability as Model-System for Single-Crystal Studies of Optoelectronic Properties. Nanomaterials 2021, 11, 3057. [Google Scholar] [CrossRef] [PubMed]
  26. Durham, D.B.; Ophus, C.; Siddiqui, K.M.; Minor, A.M.; Filippetto, D. Accurate quantification of lattice temperature dynamics from ultrafast electron diffraction of single-crystal films using dynamical scattering simulations. Struct. Dyn. 2022, 9, 064302. [Google Scholar] [CrossRef] [PubMed]
  27. Liu, Y.; Zeng, T.; Li, G.; Wan, T.; Li, M.; Zhang, X.; Li, M.; Su, M.; Dou, A.; Zeng, W. The surface double-coupling on single-crystal LiNi0.8Co0.1Mn0.1O2 for inhibiting the formation of intragranular cracks and oxygen vacancies. Energy Storage Mater. 2022, 52, 534–546. [Google Scholar] [CrossRef]
  28. Yan, T.; Shi, W.; Zhu, L.; Dong, L.; Wang, L.; Xie, C.; Yang, Y. Simulation analysis and experimental study on aramid fiber reinforced polymer micro-milling mechanism. J. Manuf. Process. 2023, 105, 431–443. [Google Scholar] [CrossRef]
  29. Pang, S.; Zhao, W.; Qiu, T.; Liu, W.; Jiao, L.; Wang, X. Study on surface quality and mechanical properties of micro-milling WE43 magnesium alloy cardiovascular stent. J. Manuf. Process. 2023, 101, 1080–1090. [Google Scholar] [CrossRef]
  30. Hellen, T.K. A frontal solution program for finite element analysis. Int. J. Numer. Methods Eng. 2010, 3, 149. [Google Scholar] [CrossRef]
  31. Chen, Z.; Zhao, P.; Yan, R.; Tian, G.; Yang, M.; Shi, Y. Quantitative finite element analysis of microscopic surface formation for TC4 aeroengine blade polishing using single-grain method. Int. J. Adv. Manuf. Technol. 2024, 132, 2941–2955. [Google Scholar] [CrossRef]
  32. Lee, M.Y.; Park, J.H.; Park, S.J.; Chang, N.Y.; Chae, J.M. A finite element analysis of stress distribution with various directions of intermaxillary fixation using orthodontic mini-implants and elastics following mandibular advancement with a bilateral sagittal split ramus osteotomy. Orthod. Craniofacial Res. 2024, 27, 8. [Google Scholar] [CrossRef]
  33. Xu, S.; Yang, X.; Hu, X.; Ma, H.; Li, J.; Ren, G. Preparation of Negative Poisson’s Ratio 316L Stainless Steel Porous Bone Scaffolds Based on Finite Element Analysis and 3D Printing Technology. Mater. Res. 2025, 28, e20240479. [Google Scholar] [CrossRef]
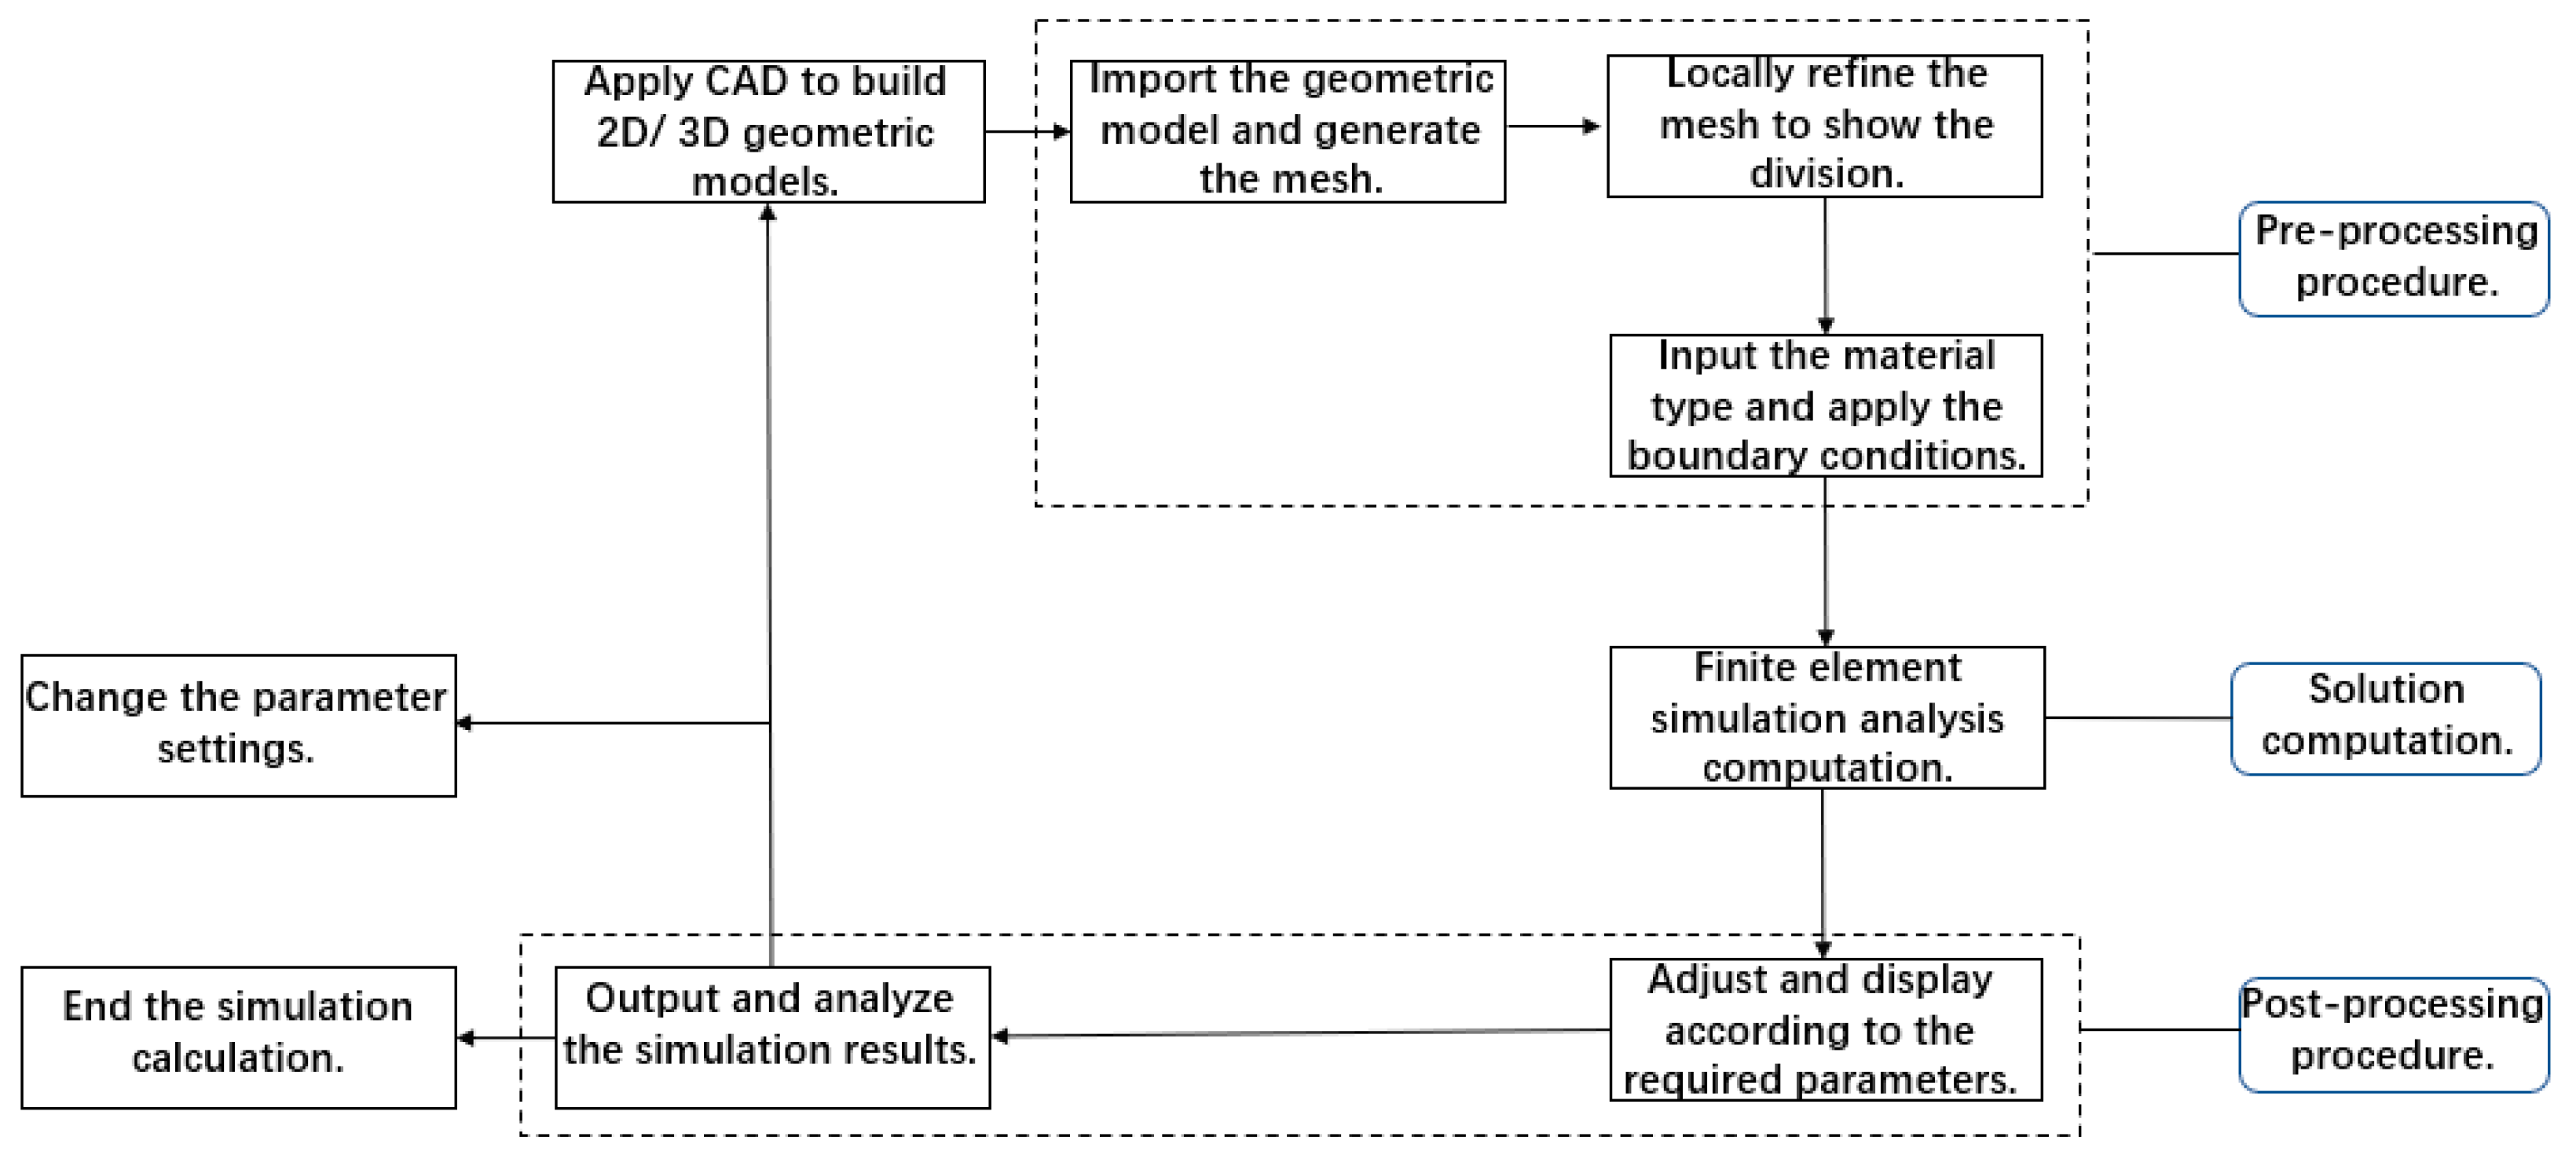
Figure 1. Flow chart of ABAQUS simulation.
Metals 15 00898 g001
Figure 2. Comparison of the micro-milling tool used in simulation and experiment: (a) simulation tool; (b) experimental tool.
Metals 15 00898 g002
Figure 3. Network partitioning: (a) tool; (b) workpiece.
Metals 15 00898 g003
Figure 4. Assembling drawing.
Metals 15 00898 g004
Figure 5. Simulation of the micro-milling process (af) means the different status with the time increasing.
Metals 15 00898 g005
Figure 6. Simulation results with different milling speed: (a) vc = 753.6 mm/s; (b) vc = 1130.4 mm/s; (c) vc = 1507.2 mm/s.
Metals 15 00898 g006aMetals 15 00898 g006b
Figure 7. Simulation results with different milling depth: (a) ap = 8 µm; (b) ap = 10 µm; (c) ap = 12 µm.
Metals 15 00898 g007aMetals 15 00898 g007b
Figure 8. The precision machine tool of JX-1A. (a) Appearance drawing of machine tool. (b) Control panel. (c) Schematic diagram of the machining area’s structure. (d) Worktable and cutting tools.
Metals 15 00898 g008aMetals 15 00898 g008b
Figure 9. Range and variance diagram of the influence of each factor on milling force: (a) range chart; (b) variance chart.
Metals 15 00898 g009
Figure 10. Influence of each factor on milling force: (a) influence of milling speed on milling force; (b) influence of milling depth on milling force; (c) influence of feed rate on milling force.
Metals 15 00898 g010
Figure 11. Comparison of experimental data and finite element simulation analysis results: (a) comparison under different milling speeds; (b) comparison under different milling depths.
Metals 15 00898 g011
Figure 12. Range and variance diagram of the influence of each factor on surface roughness: (a) range chart; (b) variance chart.
Metals 15 00898 g012
Figure 13. Influence of each factor on surface roughness: (a) influence of milling speed on surface roughness; (b) influence of milling depth on surface roughness; (c) influence of feed rate on surface roughness.
Metals 15 00898 g013aMetals 15 00898 g013b
Figure 14. Surface and three-dimensional of single crystal DD5 with different milling parameters: (a) Vc = 376.8 mm/s, ap = 15 µm, v = 100 µm/s; (b) Vc = 753.6 mm/s, ap = 12 µm, v = 100 µm/s; (c) Vc = 1130.4 mm/s, ap = 10 µm, v = 100 µm/s; (d) Vc = 1318.8 mm/s, ap = 8 µm, v = 100 µm/s; (e) Vc = 1507.2 mm/s, ap =5 µm, v = 100 µm/s.
Metals 15 00898 g014aMetals 15 00898 g014b
Table 1. Physical parameters of the material in simulation.
Density (kg/m3)Shear Modulus (MPa)Elastic Modulus (MPa)Poisson’s
Ratio
820023,40013,0000.313
Table 2. The SI (mm)system of units.
Unit SystemLengthForceMassTimeStressEnergyDensityAcceleration
SI (mm)mmNtonsMPamJton/mm3mm/s2
Table 3. Technical parameters of the JX-1A machine.
Performance IndicatorTechnical Parameter
X-axis Working Travel490 mm
Y-axis Working Travel.460 mm
Z-axis Working Travel120 mm
Worktable Working Range560 mm × 500 mm
Maximum Cutting Feed Rate9 m/min
Milling speed3000 r/min~6000 r/min
Positioning Precision0.006 mm
Tool Setting Precision0.002 mm
Control SystemGUC-400-ESV
Dimension1300 mm × 1500 mm × 2050 mm
Table 4. Factors and levels table.
Level12345
Factor
Milling Speed vc (mm/s)376.8753.61130.41318.81507.2
Milling Depth ap (µm)58101215
Feed Rate v (µm/s)20406080100
Table 5. Experimental data of the single crystal DD5.
Experiment NumberMilling Speed
vc (mm/s)
Milling Depth
ap (µm)
Feed Rate
v (µm/s)
Milling Force
F (N)
Surface Roughness
Ra (µm)
1376.85200.5611.102
2376.88400.9861.540
3376.810601.3651.172
4376.812802.1761.184
5376.8151003.3811.580
6753.605400.6051.630
7753.608602.7151.600
8753.6010801.3881.710
9753.60121003.1081.590
10753.6015202.5101.890
111130.405600.9231.988
121130.408801.5971.760
131130.40101001.8861.460
141130.4012201.3991.240
151130.4015403.1601.286
161318.805800.8301.210
171318.8081000.9821.370
181318.8010200.7861.115
191318.8012401.0801.126
201318.8015601.6581.055
211507.2051001.3991.280
221507.208200.9291.630
231507.2010401.1191.740
241507.2012601.5351.800
251507.2015801.4341.500
Table 6. Experimental results of the single crystal DD5 of milling force.
Processing Number Vc v c ¯ ap a p ¯ v v ¯
K1j8.469 1.6944.318 0.864 6.184 1.237
K2j10.326 2.0657.209 1.442 6.950 1.390
K3j8.965 1.7936.544 1.309 8.196 1.639
K4j5.336 1.0679.298 1.860 7.425 1.485
K5j6.416 1.283 12.143 2.429 10.756 2.151
K1j271.720 18.646 38.248
K2j2106.626 51.963 48.300
K3j280.376 42.819 67.174
K4j228.468 86.461 55.129
K5j241.162 147.446 115.695
R4.990 7.825 4.572
T 39.511
CT 62.446
SS3.225 7.021 2.463
V0.806 1.755 0.616
Table 7. Experimental results of the single crystal DD5 surface roughness.
Processing NumberVc v c ¯ ap a p ¯ v v ¯
K1j6.578 1.316 7.210 1.442 6.977 1.395
K2j8.420 1.684 7.900 1.580 7.322 1.464
K3j7.734 1.547 7.197 1.439 7.615 1.523
K4j5.876 1.175 6.940 1.388 7.364 1.473
K5j7.950 1.590 7.311 1.462 7.280 1.456
K1j243.270 51.984 48.679
K2j270.896 62.410 53.612
K3j259.815 51.797 57.988
K4j234.527 48.164 52.228
K5j263.203 53.451 52.998
R2.544 0.960 0.638
T 36.558
CT 53.459 53.459
SS0.883 0.102 0.042
V0.221 0.025 0.010
Disclaimer/Publisher’s Note: The statements, opinions and data contained in all publications are solely those of the individual author(s) and contributor(s) and not of MDPI and/or the editor(s). MDPI and/or the editor(s) disclaim responsibility for any injury to people or property resulting from any ideas, methods, instructions or products referred to in the content.