Abstract
The structure and composition of the oxide layer on the surface of 316L stainless steel (SS) after exposure to alkaline high-temperature and high-pressure water for 2000 h are characterized using various analytical techniques. The oxide layer has a double-layer structure comprising an outer spinel oxide and an inner Cr oxide. With an increase in exposure time, the thickness of the inner oxide layer increases and stabilizes at approximately 100 nm. The spinel oxide dissolves after 336 h of exposure, and the dissolution increases with increasing exposure time. The adsorptive capacity of OH− on the NiFe2O4 surface is explained using density functional theory (DFT) calculations. The energy released by the strong adsorption of OH− on the surface of NiFe2O4 provides the impetus for the dissolution of NiFe2O4, so that NiFe2O4 dissolves in the experimental environment.
1. Introduction
Once-through steam generators (OTSGs) are used in lead–bismuth-cooled fast reactors [1,2,3]. Water can be directly heated into superheated steam using an OTSG. Compared with pressurized water reactors (PWRs), the heat exchange efficiency is improved [4,5]. However, corrosion problems are inevitable during the long-term operation of reactors [6], including uniform corrosion [7,8,9,10], intergranular corrosion [11,12], and stress corrosion cracking (SCC) [12]. Shan et al. [10] studied the effect of the corrosion behavior of 316L SS in boron-free lithium-containing hydrogenated water at 345 °C. The results show that the oxide formed on the surface of 316L SS is composed of the outer layer of Fe3O4 polyhedra and the inner layer of Fe-Cr spinel nanocrystals. Ding et al. [12] studied the deformation mechanism and SCC behavior of 690TT alloy with dents at high temperature. The dents lead to stress concentration and microstructure changes, increasing the sensitivity of SCC. The deformation mechanism at the notch is slip and twinning. The shoulder area of the notch is oxidized due to residual tensile stress, while the bottom area of the notch is SCC due to stress concentration, showing a symmetrical distribution of ‘quadrilateral’. There is a critical threshold of SCC induced by crack depth, which is positively correlated with SCC crack length. The corrosion products generated during the corrosion process are deposited on the surface of the material, resulting in corrosion fouling. Corrosion fouling significantly reduces heat transfer efficiency [13,14]. It is imperative to solve the problem of heat exchange efficiency reduction caused by corrosion and fouling.
Some studies have reported the corrosion products during reactor operation [1,14,15,16]. In simulated pressurized water reactor environments, Lee et al. [15] conducted a corrosion test on 316 stainless steel with 25 and 50 cc/kg H2O-dissolved hydrogen concentrations. It was found that the external Fe-rich oxide particles and the inner Cr-rich layer were simultaneously formed at the beginning of corrosion. Duan et al. [16] researched the effects of temperature and dissolved oxygen on the electrochemical behavior and the oxide film formation of grades 304L and 316L stainless steels at high-temperature borated and lithiated water. The oxide films formed on the steel samples immersed in the solution containing 20 ppb of dissolved oxygen exhibited a duplex structure, in which the inner layer was primarily composed of Cr oxides, and the outer layer mainly consisted of Fe oxides and Ni-Fe spinel. Fouling in the steam generator (SG), which seriously affects the internal integrity of the SG tube, heat transfer efficiency, and control of water chemistry, is commonly caused by the growth of thick oxides and deposition of soluble particles in the secondary circuit of the PWR. Three fouling layers were observed at the crevice position of the SG tube, and the large Fe3O4 fouling particles exhibited a double-layer structure. The growth process and direction of the fouling particles were found to be related to the oxide layer. Meanwhile, the deposition process of fouling is affected by the matrix shape and distribution of the massive fouling particles, and large fouling particles grow preferentially in the direction of the primary crystal plane on the surface of the oxide layer [17]. The fouling behavior of the SG tube was also investigated at different positions after 500 h of immersion in PWR. A triple-layer structure of fouling appeared at both the crevice and free span positions, namely, a large, dispersedly distributed deposition layer on the top, a small and faceted outer layer, and a relatively continuous inner layer. No obvious positional effect on the thickness of the inner layer was observed. However, in the crevice position, the deposited particle density and outer layer thickness were much higher than those of the free span position [7]. Corrosion fouling mainly comprises a protective inner layer and an evacuated outer layer. According to the Point Defect Model (PDM) [18], after long-term exposure, the dissolution and formation rates of the inner fouling tend to be the same, and the thickness will be stable in a certain range; the outer fouling does not obey the model. Therefore, to solve the problem of heat transfer efficiency reduction caused by fouling deposition, the dissolution rate of the outer layer of the fouling can be increased. Chen et al. [19,20] reported that spinel oxides exhibit dissolution behavior when deviating from a neutral water environment, but the dissolution mechanism has not been elucidated.
Yuan et al. [21] studied the dissolution of the Laves phase in an alkaline environment and explained the mechanism using density functional theory (DFT) calculations. Shan et al. [10] studied the structure of 316L SS oxide in high-temperature and high-pressure LiOH water, and found that the oxide formed on the surface of 316L SS was composed of the outer layer of Fe3O4 polyhedra and the inner layer of Fe-Cr spinel nanocrystals. Nickel also accumulates along the grain boundary beneath the oxide/matrix interface. In high-temperature and high-pressure alkaline aqueous solution, Wang et al. [22] reveal that the corrosion rate of 316L SS increases with increasing pH, but Wu et al. [23] believe that the corrosion rate of SS at high temperatures decreases with the increase in pH. This indicates that the oxidation mechanism of 316L SS in high-temperature and high-pressure alkaline water is not clear.
It can be observed that the oxide may dissolve in an alkaline environment, and this dissolution can slow down the fouling. Therefore, the long-term corrosion behavior of 316L SS in alkaline solutions at high temperature and high pressure is studied, focusing on the change in spinel oxide dissolution behavior; 316L SS is exposed to high-temperature and high-pressure water for 168/336/720/2000 h. The study aims to verify or explore what proposed mechanisms drive spinel dissolution using scanning electron microscopy (SEM), Raman spectroscopy, focused ion beam (FIB) analysis, and transmission electron microscopy (TEM).
2. Experimental
2.1. Materials and Specimens
The chemical composition of the 316L SS used in this study is listed in Table 1. The specimens are cut from a 15 mm × 15 mm × 5 mm plate. The specimens are mechanically abraded with emery paper up to 2000 grit and polished with an abrasive paste to obtain a mirror finish. The samples are then stored in a dry dish until the start of the experiment.

Table 1.
Composition of 316L SS used in the present work (wt.%).
2.2. Experimental Procedure
The equipment used in the experiment is a dynamic high-temperature and high-pressure autoclave built independently by the laboratory. The specimens are exposed to alkaline solutions for 168, 336, 720, and 2000 h. The experimental parameters are listed in Table 2.
Table 2.
Testing conditions in the present work.
The surfaces of the exposed specimens are analyzed using scanning electron microscopy (SEM, SU500, Hitachi High-Tech Corporation, Tokyo, Japan) in high-vacuum mode. The secondary electron (SE) mode is used for imaging, with an accelerating voltage of 15 kV. The phases of the oxide films are characterized using Raman spectroscopy (XploRA-PLUS, HORIBA Scientific, Paris, France). The thickness of the oxide film is measured using SEM and a focused ion beam (FIB, HELIOS 2 CX, Thermo Fisher Scientific, Waltham, MA, USA). Twenty positions are measured for each specimen, and the mean and standard deviation are calculated for each specimen. SEM and transmission electron microscopy (TEM, JEM 3200fs, JEOL Ltd., Tokyo, Japan) are used for observation, equipped with energy dispersive X-ray spectroscopy (EDS, JEOL Ltd., Tokyo, Japan), a high-resolution transmission electron microscopy (HRTEM) CCD camera, and a high-angle annular dark field (HAADF) detector. The crystal structure is analyzed using selected-area electron diffraction (SAED). In addition, to determine the crystal structure of the oxide, a fast Fourier transform (FFT) is performed using digital microphotography. FIB-prepared TEM specimens are used, with W as the protective layer.
2.3. DFT Calculation
The Vienna Ab-initio Simulation Package (VASP) performs all the DFT calculations [21,24]. The spin-polarized version of Perdew–Burke–Ernzerhof (PBE) is adopted for the exchange-correlation interaction [21,25]. The wave functions are expanded in terms of plane-wave basis sets with an energy cut-off of 400 eV. The spin polarization of the atoms is considered in all calculations. For the surface calculation, 1 × 1 × 1 unit cells for the NiFe2O4 (001), (111), and (022) [26,27] surface structures are constructed. A k-point sampling mesh of 2 × 2 × 2 is employed. A vacuum layer of 15 Å along the Z-direction is added to all surface structures [28]. A single-point energy calculation is performed after structural optimization for all structures.
The adsorption energy is calculated using the following equation [29]:
where EB+X, EB, Ex, and n represent the total energies of the adsorbed surface, clean surface, single OH molecule, and the number of OH groups, respectively.
The calculation formula for the eject energy is as follows [30]:
where Etotal, Etotal−1, and EM represent the total energies of the slab before the ejection of a given atom, the slab after the ejection of the given atom, and the isolated given metal atom, respectively.
3. Results and Discussion
3.1. Exposure Experimental Results
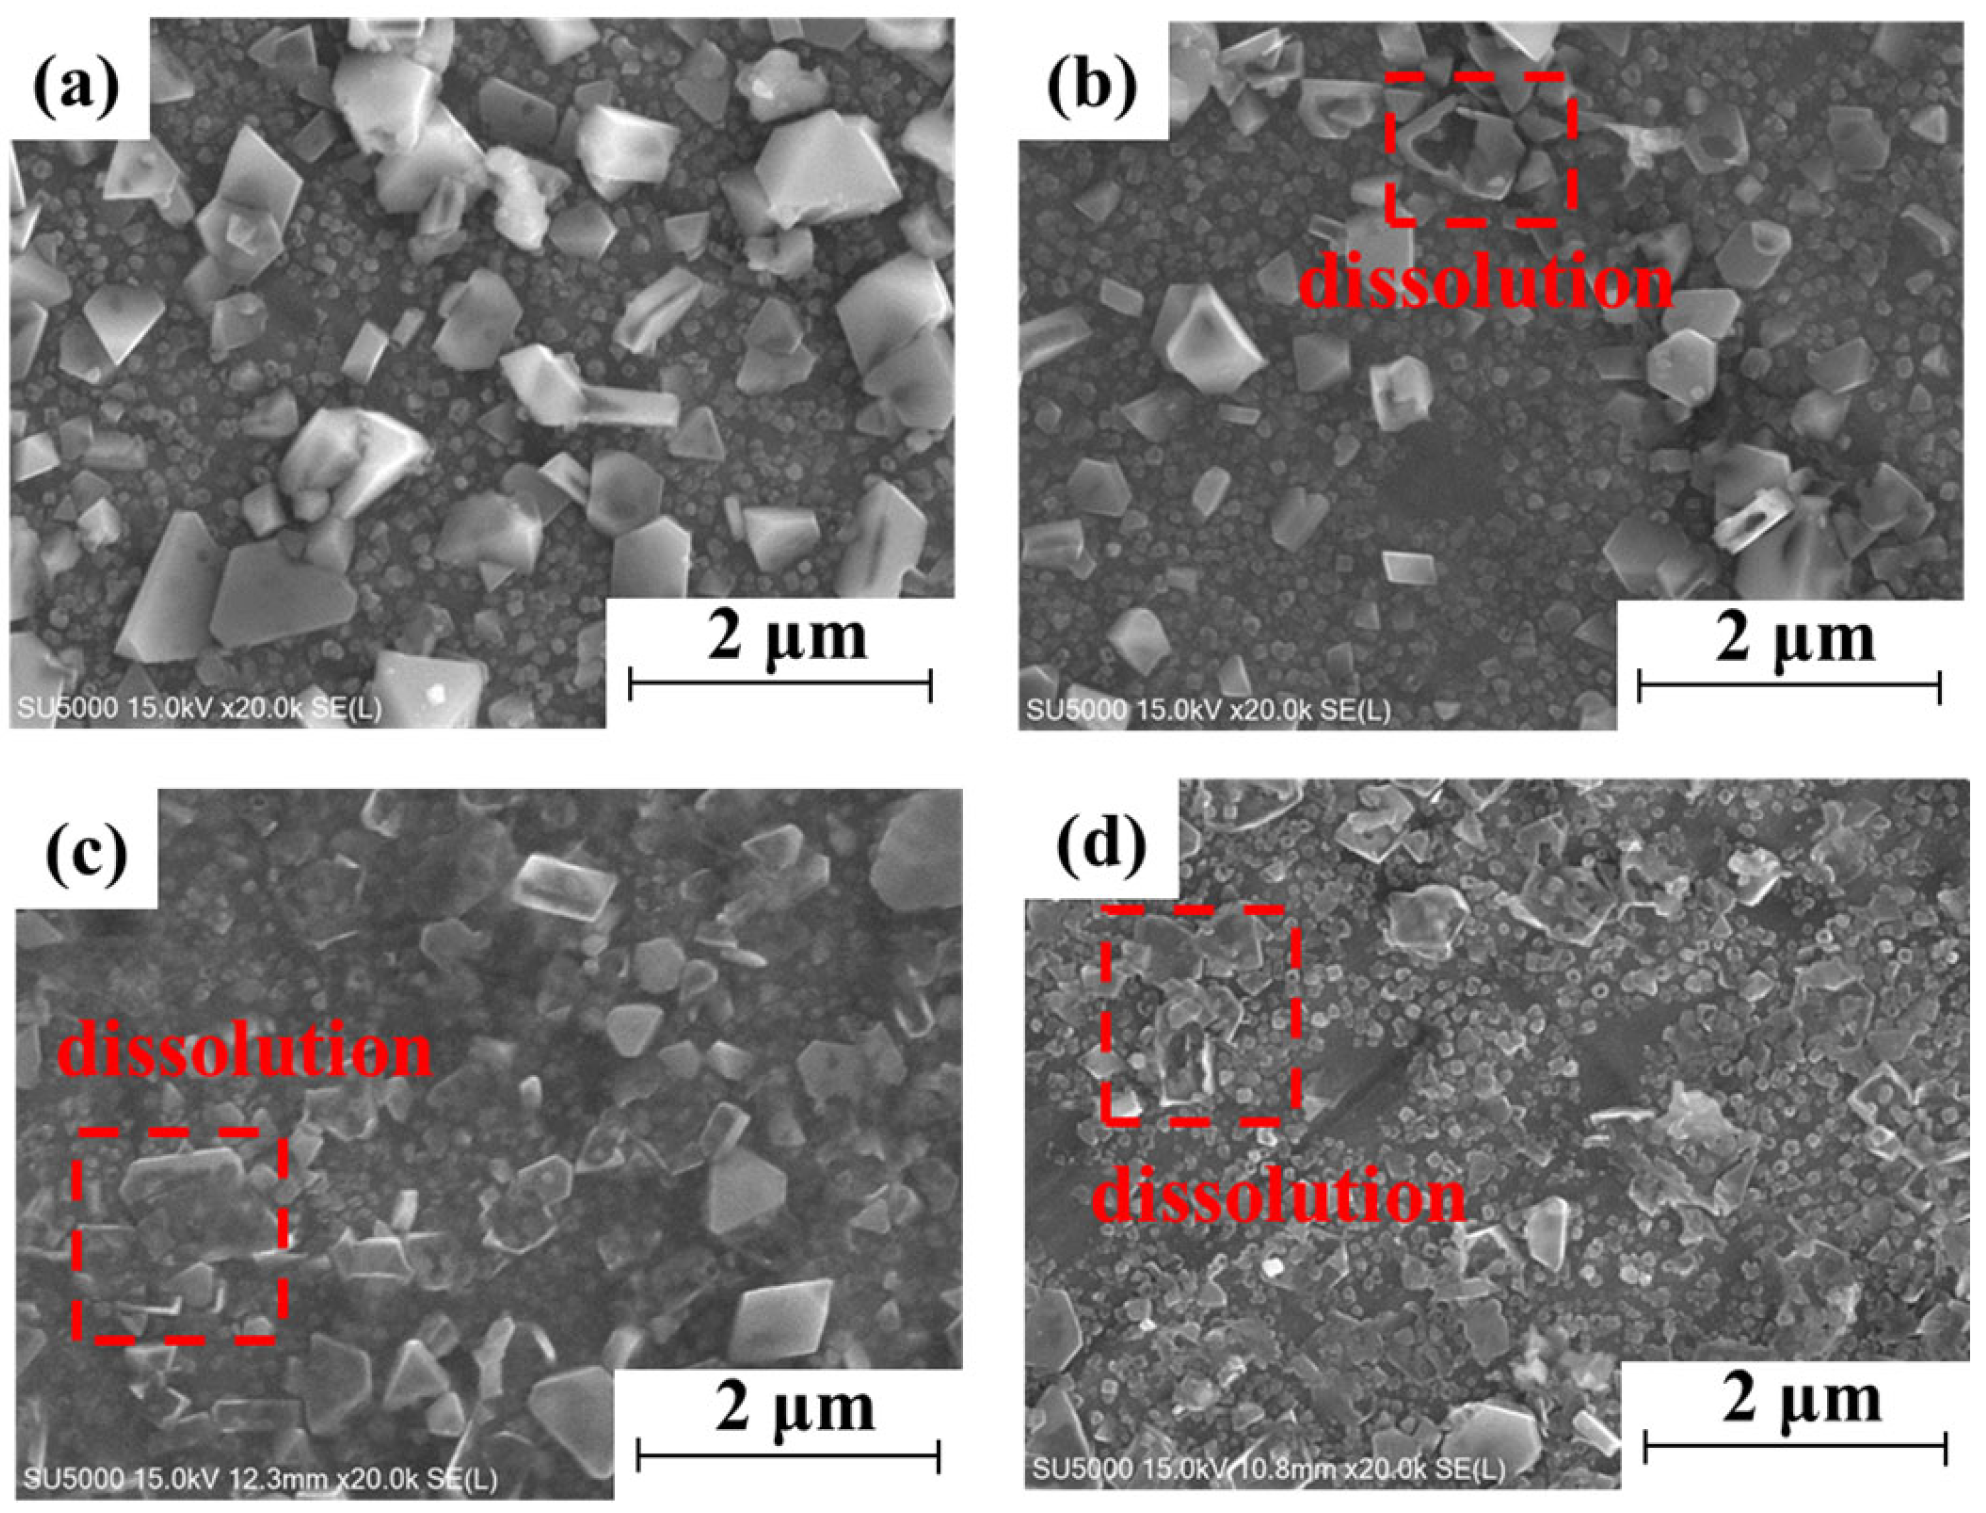
Figure 1 shows the surface morphologies of the 316L SS after exposure to alkaline solutions for different periods. The surface morphologies of 316L after exposure for different durations are significantly different. Spinel oxides are attached to the surface of 316L after exposure for different durations. However, the spinel oxide on the surface of 316L dissolves after exposure for 336 h (Figure 1b). With an increase in exposure time, the degree and quantity of spinel dissolution increase (Figure 1b–d red dashed rectangles). Figure 2 shows the Raman spectra of the 316L SS after exposure to alkaline solutions for various durations. The main spinel-type oxide NiFe2O4 peak is found near 700 cm−1, and a small peak at 490 cm−1 is also found after exposure at different times.
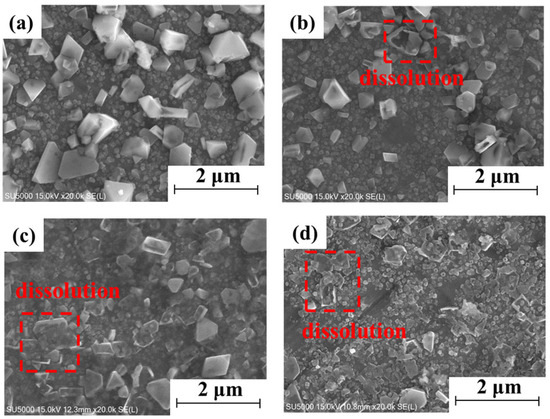
Figure 1.
Surface morphology of 316L SS after exposure to the alkaline solution at different times: (a) 168 h, (b) 336 h, (c) 720 h, (d) 2000 h.
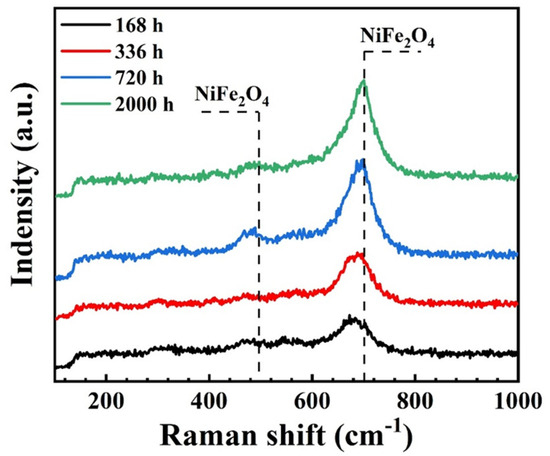
Figure 2.
Raman spectra of 316L SS after exposure to the alkaline solution at different times.
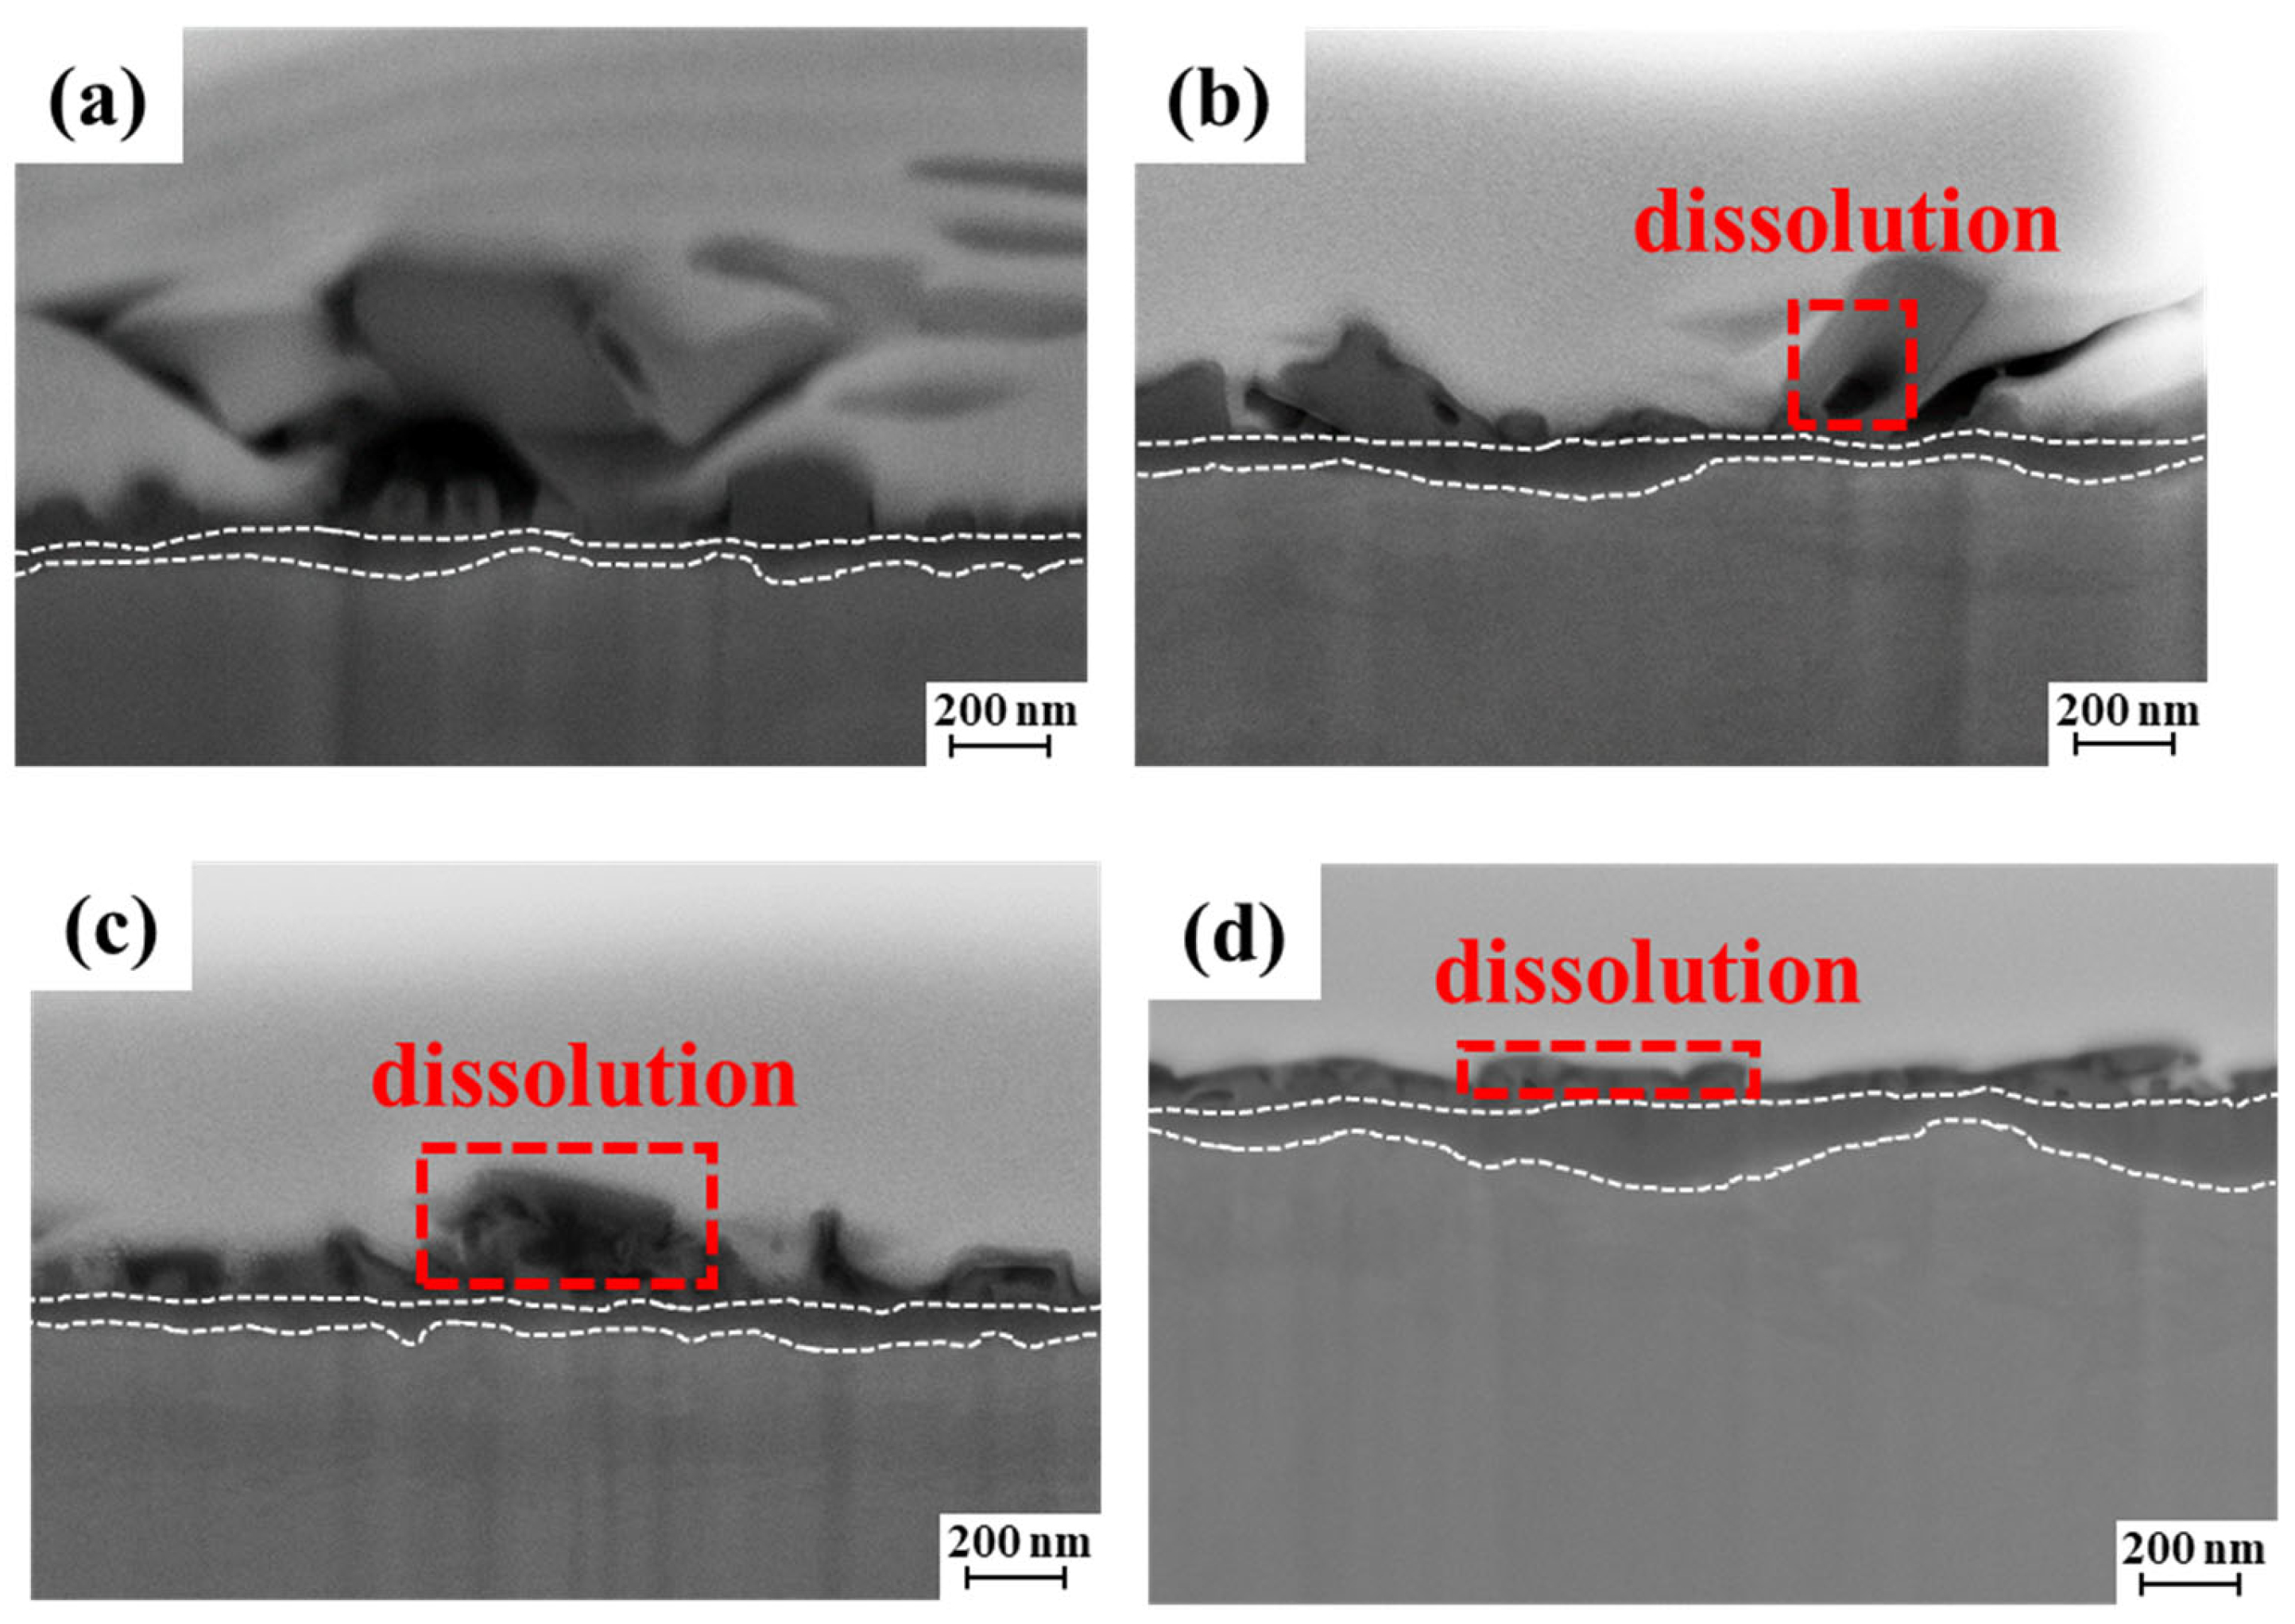
Figure 3 shows the cross-sectional morphology of the 316L SS after exposure to the alkaline solution for different durations. It can be found that the oxide exhibits a double-layer structure after exposure at different times. The inner structure is relatively dense, and the outer layer is loosely distributed with spinel oxide. The thickness of the inner oxide layer is shown in Figure 4a. It can be found that the thickness of the inner oxide layer increases from 68.49 nm to 112.53 nm with the increase in exposure time. It can also be found that the thickness of the inner oxide layer is stable at about 110 nm during long-term exposure. Meanwhile, with an increase in exposure time, there are obvious differences in the spinel oxide. The dissolution of spinel oxides is observed at 336 h, and the amount of dissolved spinel oxides increases with time. It is difficult to observe the existence of spinel oxide at 2000 h. This is consistent with the surface morphology results. Figure 4b shows the thickness gain of the inner oxide layer as a function of time for the 316L SS in the alkaline solution. The data are fitted to the power law relation given as follows [31,32]:
where is the thickness gain in nm, kp is the oxidation rate constant, t is the time in h, and n is the time exponent. The time exponent obtained from the experiments is 0.32 for 316L SS. The oxidation kinetics are near parabolic, slightly deviating from the ideal parabolic oxidation kinetics (n = 0.5). Defects (pores, cracks, and grain boundaries) in real oxide films may affect the effective diffusivity, resulting in a deviation of the time exponent from the parabolic law [31]. At the same time, it can be observed that the increase in the thickness of the inner oxide layer during the exposure process is accompanied by the dissolution of spinel oxide. This may be due to the decrease in the coverage of the outer oxide after the dissolution of the spinel, which leads to a larger area of contact between the inner layer and the corrosive medium and accelerates oxidation.

Figure 3.
The cross-section morphology of the 316L SS after exposure to the alkaline solution at different times: (a) 168 h, (b) 336 h, (c) 720 h, (d) 2000 h.
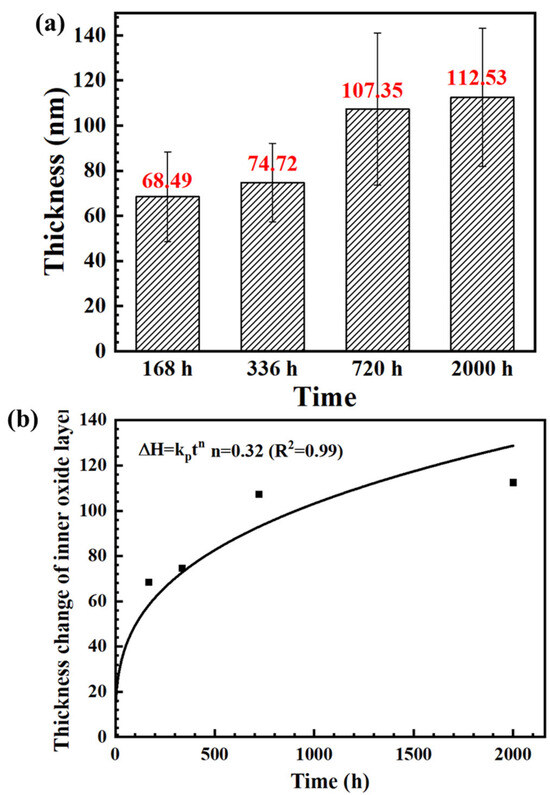
Figure 4.
(a) The thickness of the inner oxide layer of the 316L SS after exposure to the alkaline solution at different times. (b) Thickness change of the inner oxide layer as a function of time for the 316L SS in the alkaline solution.
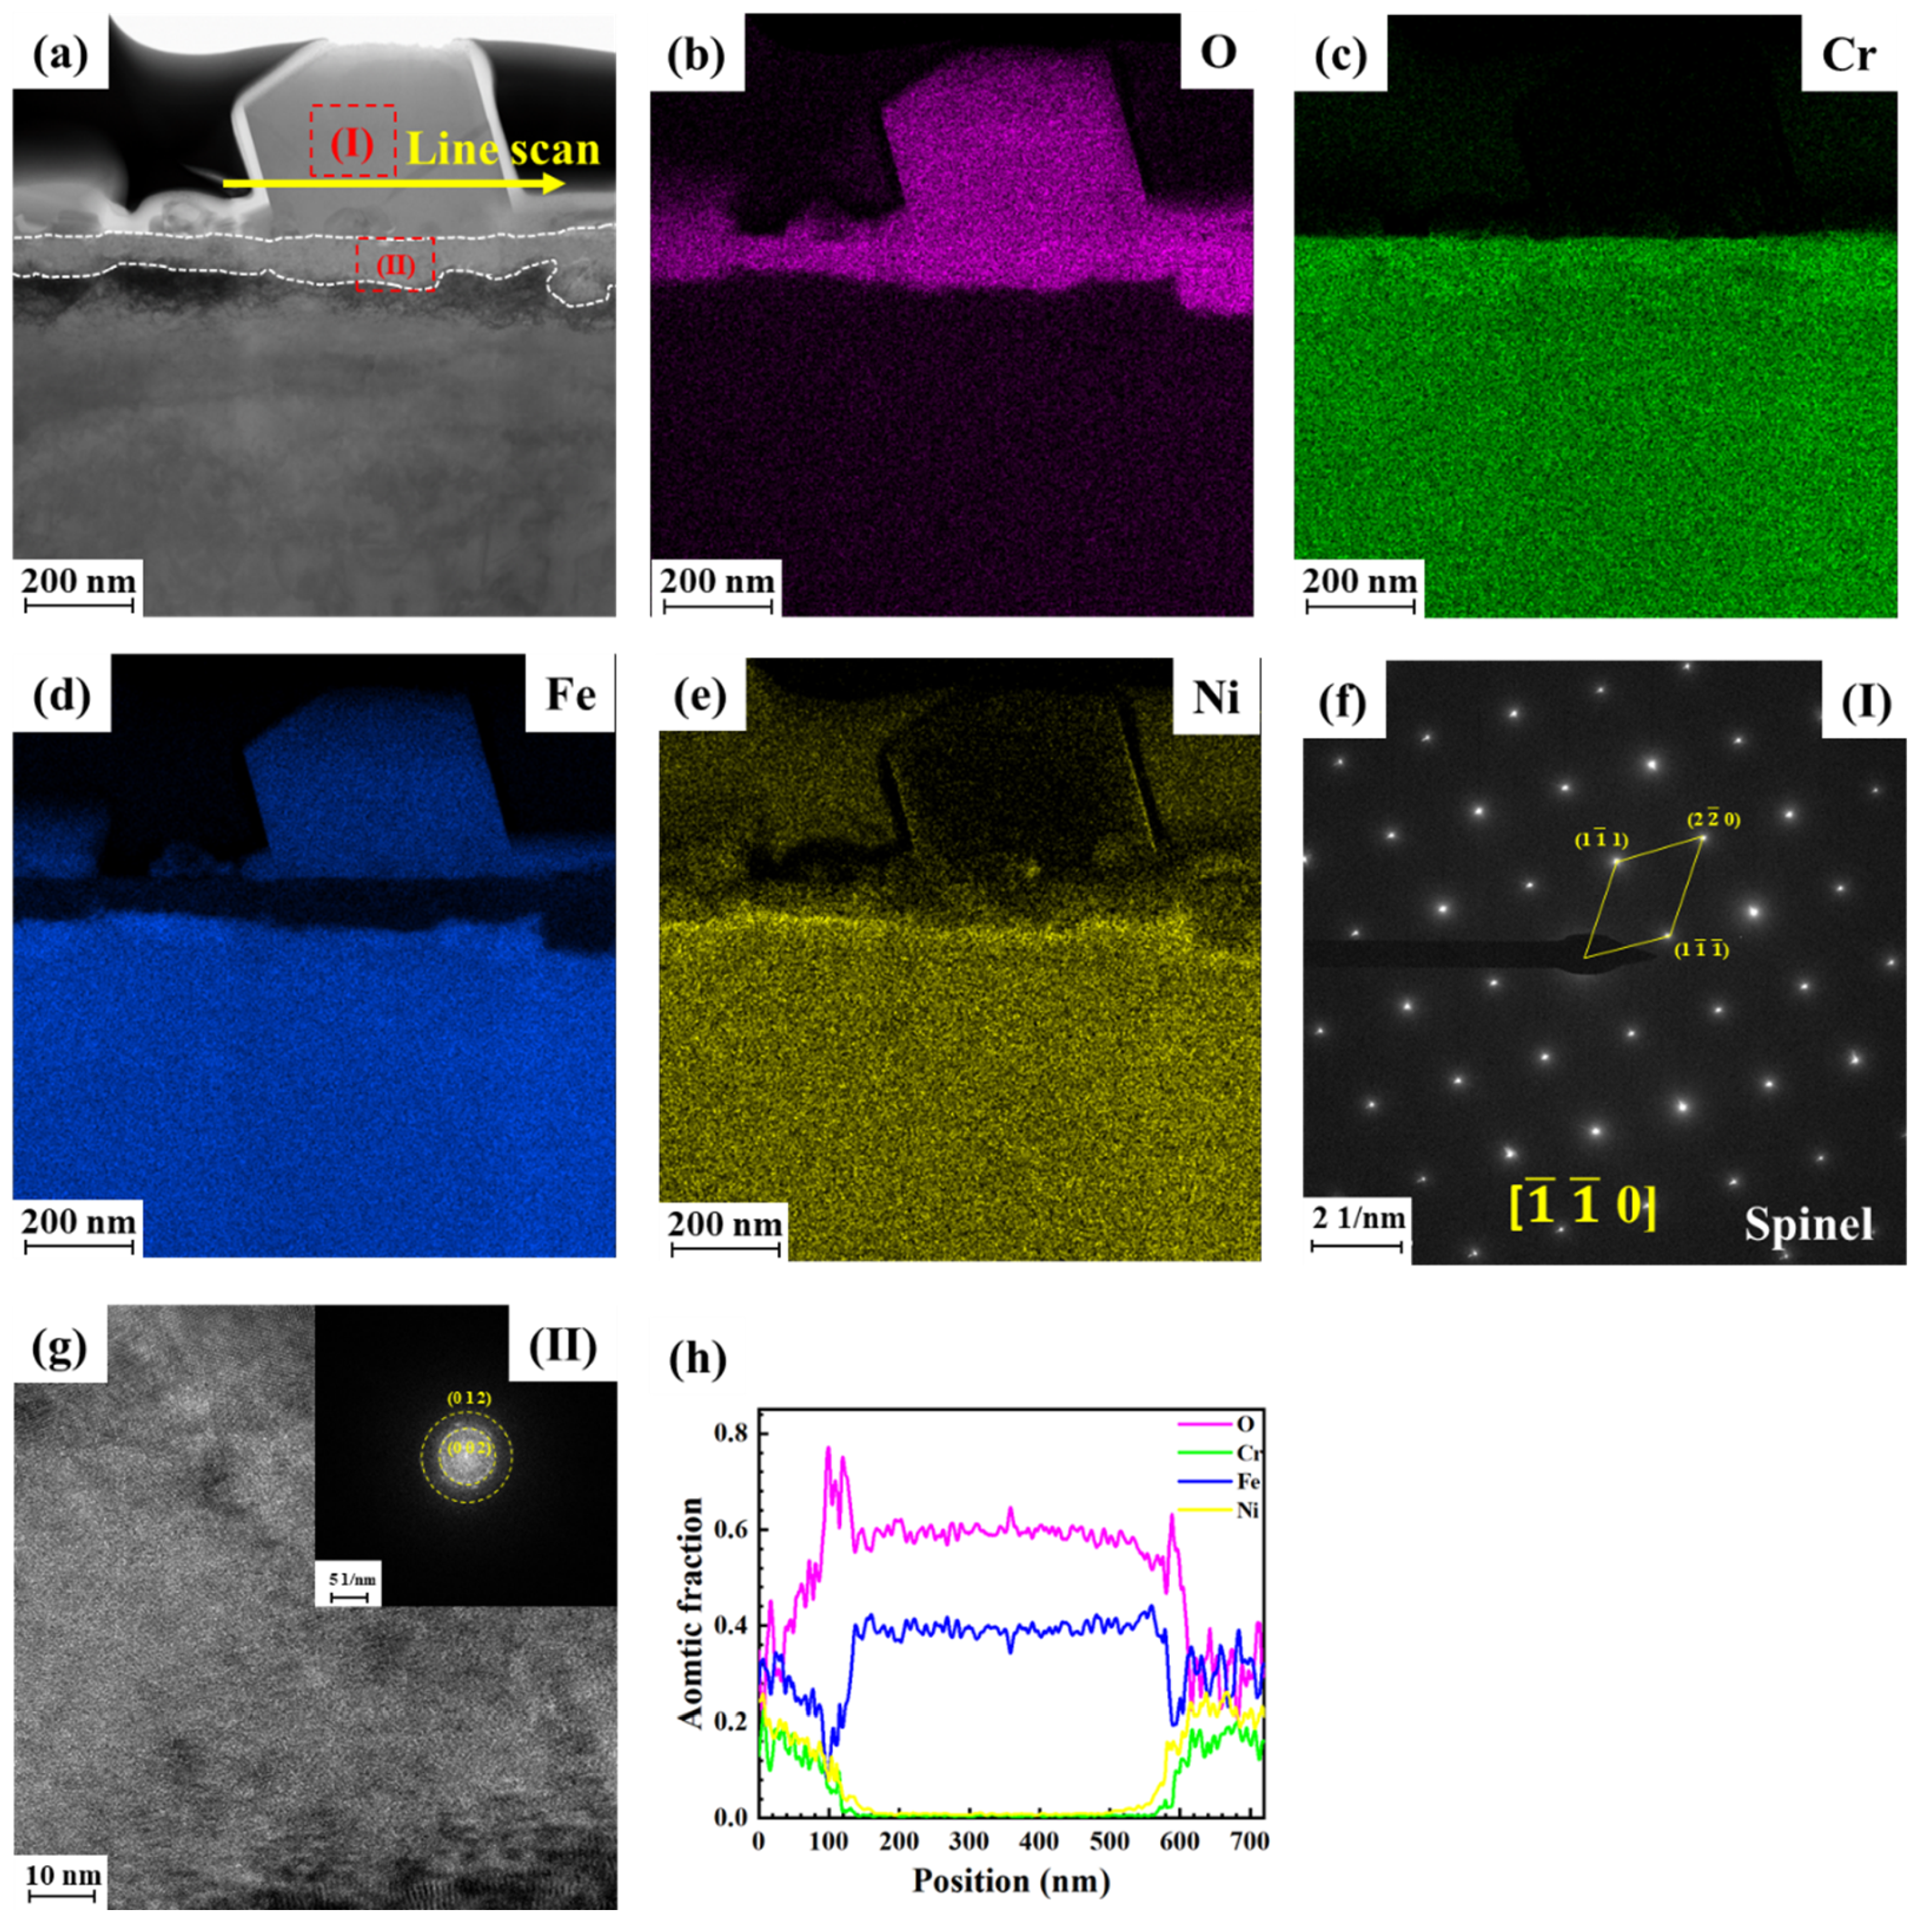
Figure 5 shows the TEM results of the cross-section of the oxide of 316L SS exposed to the alkaline solution for 168 h. As shown in Figure 5a, two oxide layers are visible. The inner layer contains a continuous and compact oxide, whereas the outer layer contains loosely distributed spinel oxides. Owing to the limited area observed by transmission electron microscopy, the thickness of the oxide layer is not measured. Figure 5b–e show the corresponding element mapping results. The inner oxide layer primarily comprises Cr and O, whereas the outer oxide layer is predominantly composed of Fe, Ni, and O. Simultaneously, Ni is unevenly distributed within the spinel oxide, with a concentration observed along its periphery. This is explained in the next section. The SAED and FFT patterns of regions I and II, which are indicated in Figure 5a, are displayed in Figure 5f,g, respectively. The outer oxide layer consists of a single-crystal spinel NiFeO4, while the inner layer exhibits nanocrystalline properties, likely composed of Cr2O3/CrOOH. This is consistent with the Raman results. Figure 5h shows the line scan result of the arrow in Figure 5a. It can be found that the spinel oxide is composed of Fe, Ni, and O, and Ni is mainly concentrated at the edge of the spinel.

Figure 5.
The TEM results of a cross-section of the oxide of 316L SS exposed to the alkaline solution after 168 h: (a) TEM image, (b) O EDS mapping, (c) Cr EDS mapping, (d) Fe EDS mapping, (e) Ni EDS mapping, (f) the SAED pattern of area I in (a), (g) the FFT pattern of area II in (a), (h) line scan of the arrow shown in (a).
Figure 6 shows the TEM results of the cross-section of the oxide of 316L SS exposed to the alkaline solution after 336 h. Double-layered oxides are also observed (Figure 6a). In addition, some spinel in the outer oxide layer is observed to dissolve. According to the element mapping results (Figure 6b–e), it can be seen that the inner oxide is Cr-rich oxide. Spinel oxides are Fe-rich oxides with a small amount of Ni content. The dissolved spinel oxide has the same composition as the undissolved one. Segregation of Ni is also observed in the undissolved spinel oxides. Figure 6f–h show the SAED and FFT patterns of areas I, II, and III marked in Figure 6a. The outer oxide is spinel single-crystal NiFeO4, and the inner layer has nanocrystalline characteristics, which can be attributed to Cr2O3/CrOOH. Figure 6h shows the line scan result of the arrow in Figure 6a. It was found that all elements were poor at the spinel dissolution location. The segregation of Ni on the undissolved spinel is also verified.
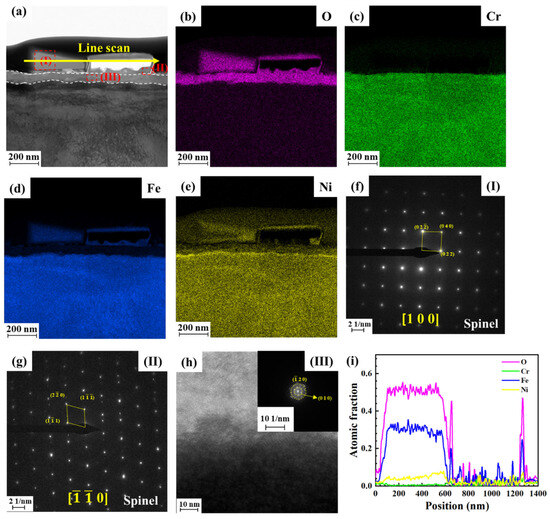
Figure 6.
The TEM results of a cross-section of the oxide of 316L SS exposed to the alkaline solution after 336 h: (a) TEM image, (b) O EDS mapping, (c) Cr EDS mapping, (d) Fe EDS mapping, (e) Ni EDS mapping, (f) the SAED pattern of area I in (a), (g) the FFT pattern of area II in (a), (h) the FFT pattern of area III in (a), (i) line scan of the arrow shown in (a).
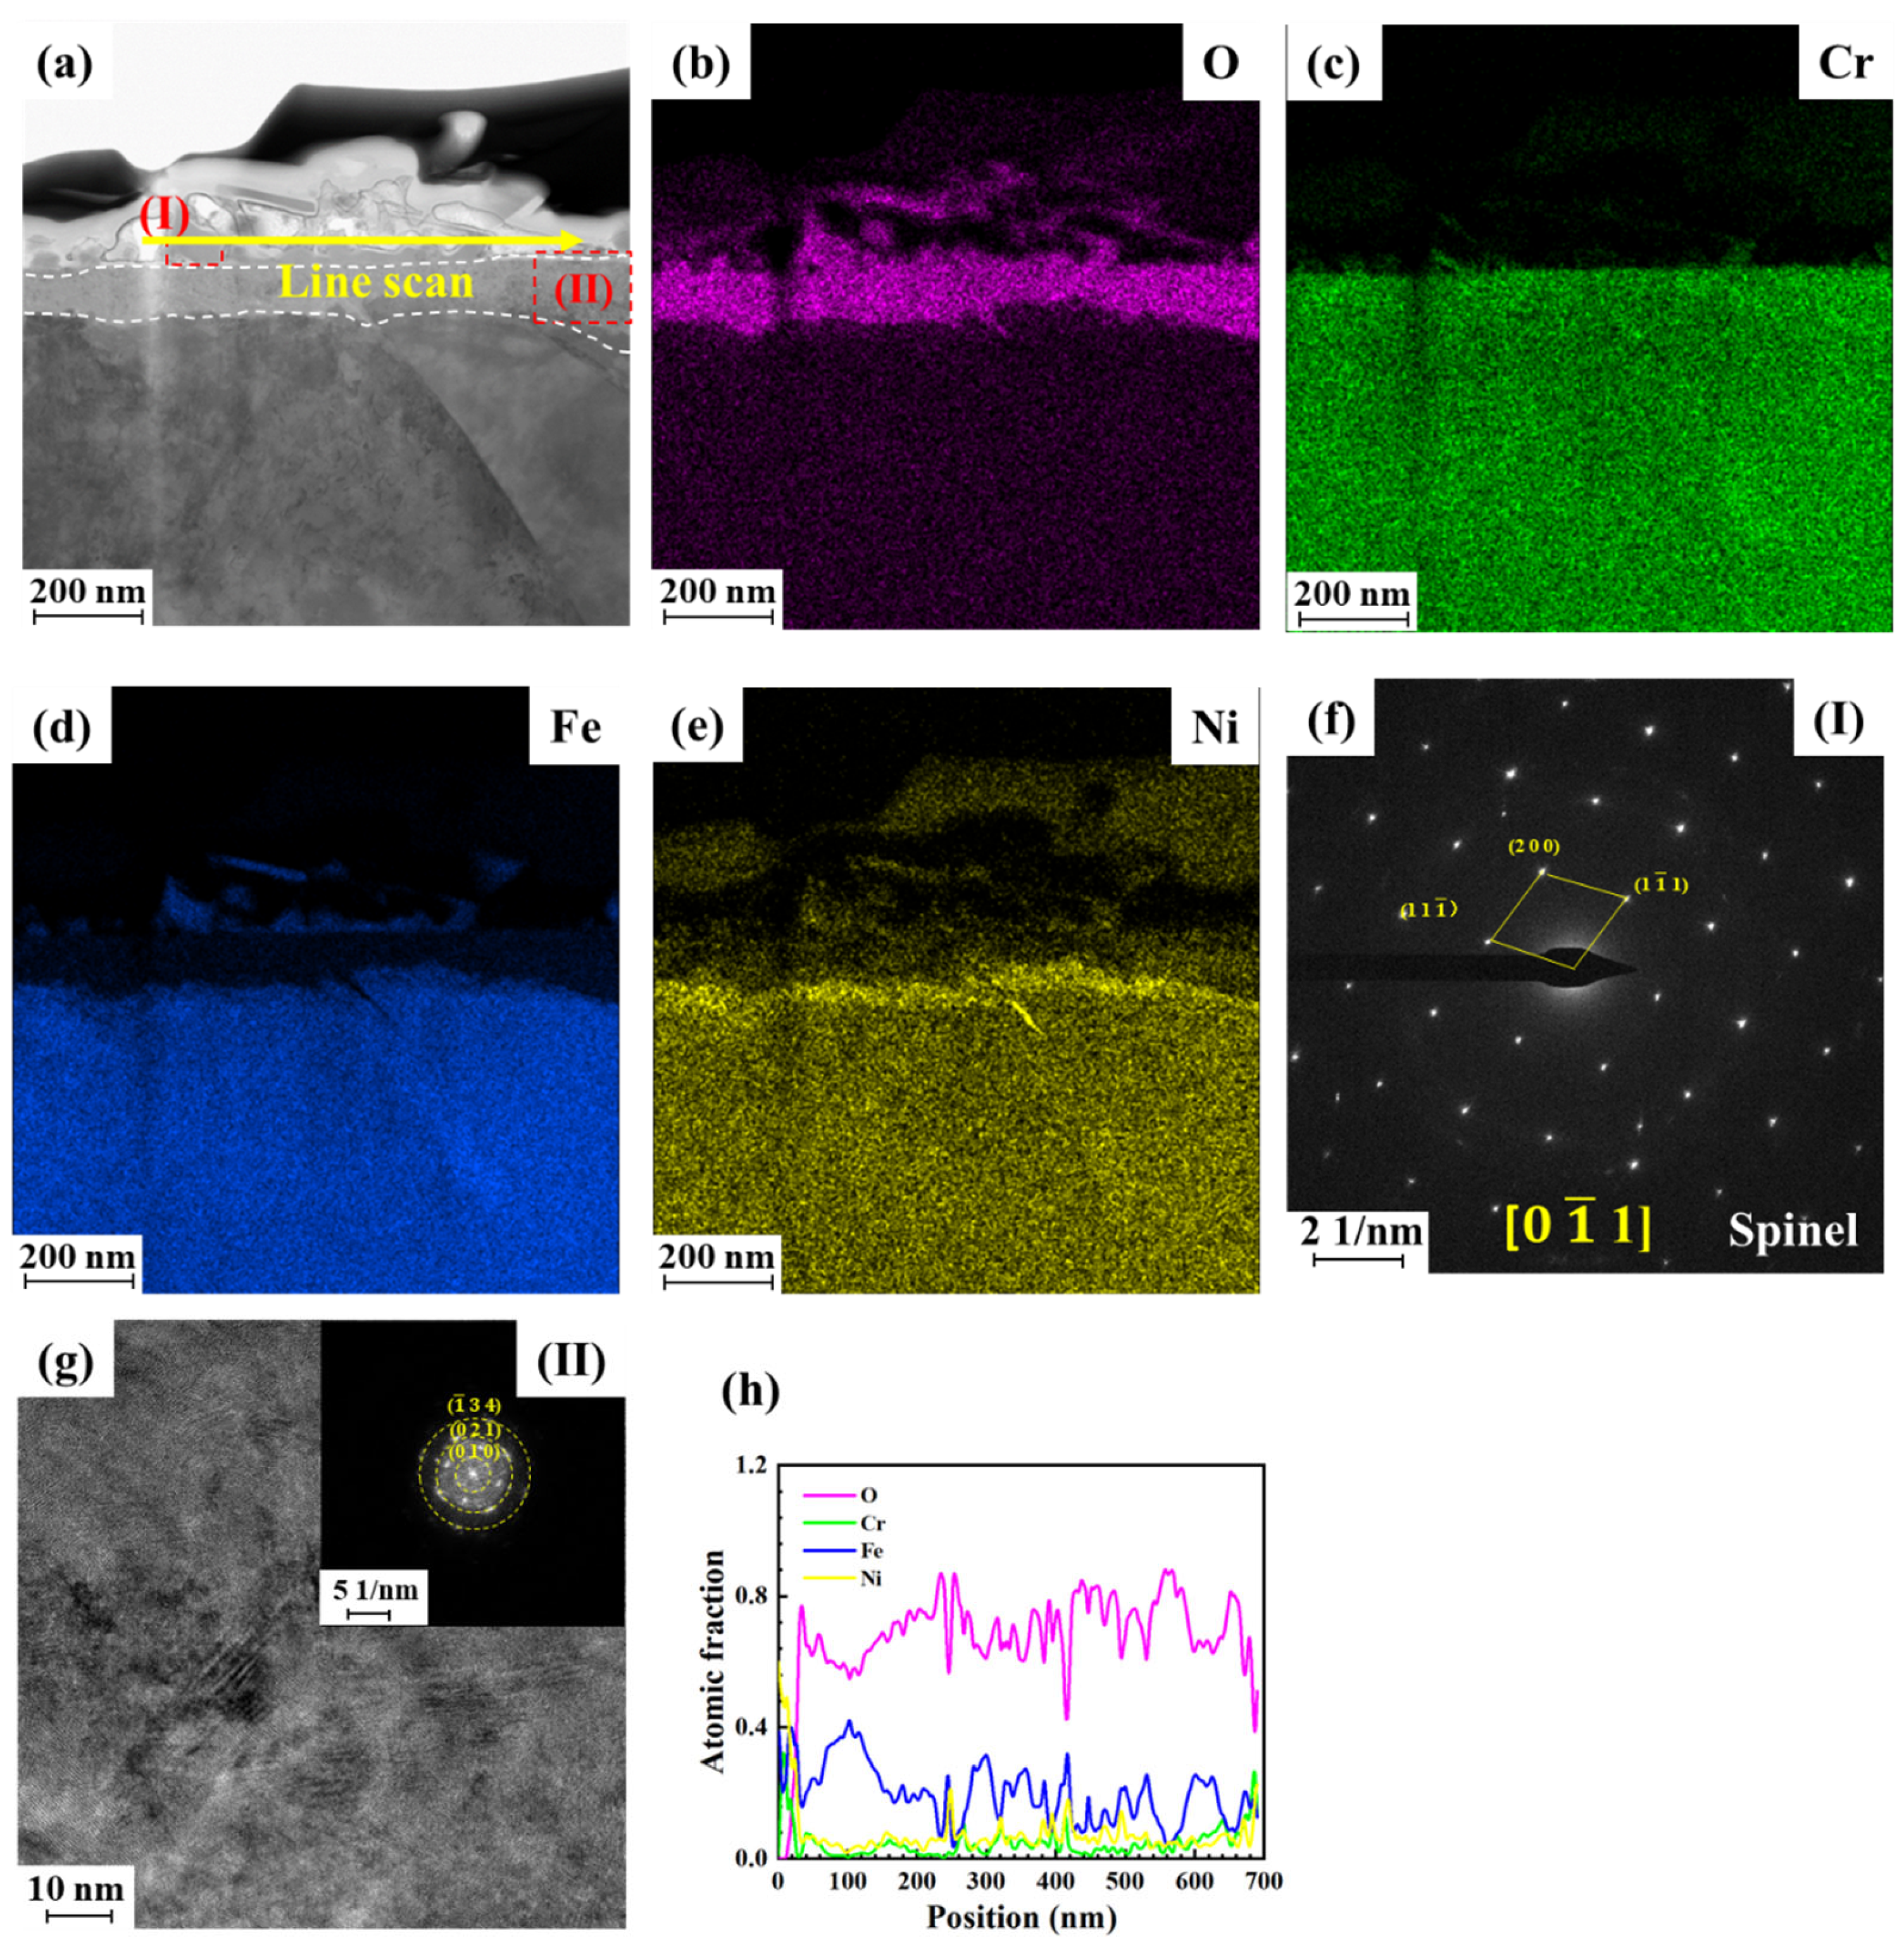
Figure 7 shows the TEM results of the cross-section of the oxide of 316L SS exposed to the alkaline solution after 2000 h. The double-layer structure of the oxide layer is still observed (Figure 7a). The complete spinel oxide is not observed in the outer oxide, and the dissolution of spinel increased. Figure 7b–e show the corresponding element mapping results. It can be found that the inner oxide layer is also Cr-rich oxide, and the incompletely dissolved spinel fragments are mainly composed of Fe, O, and Ni. Figure 7f,g show the SAED and FFT patterns of areas I and II marked in Figure 7a. The outer oxide is a spinel single-crystal NiFeO4, and the inner layer has nanocrystalline characteristics, which can be attributed to Cr2O3/CrOOH. This is consistent with the Raman results. Figure 7h shows the line scan result of the arrow in Figure 7a. It can be observed that the element distribution is discontinuous, which further indicates that the dissolution degree of spinel increases. Comparing Figure 5, Figure 6 and Figure 7, it can be observed that with an increase in exposure time, the degree of dissolution of the spinel oxide on the 316L SS surface increases, and Ni segregation occurs in the initial stage of spinel dissolution.

Figure 7.
The TEM results of a cross-section of the oxide of 316L SS exposed to the alkaline solution after 2000 h: (a) TEM image, (b) O EDS mapping, (c) Cr EDS mapping, (d) Fe EDS mapping, (e) Ni EDS mapping, (f) the SAED pattern of area I in (a), (g) the FFT pattern of area II in (a), (h) line scan of the arrow shown in (a).
3.2. DFT Calculation Results
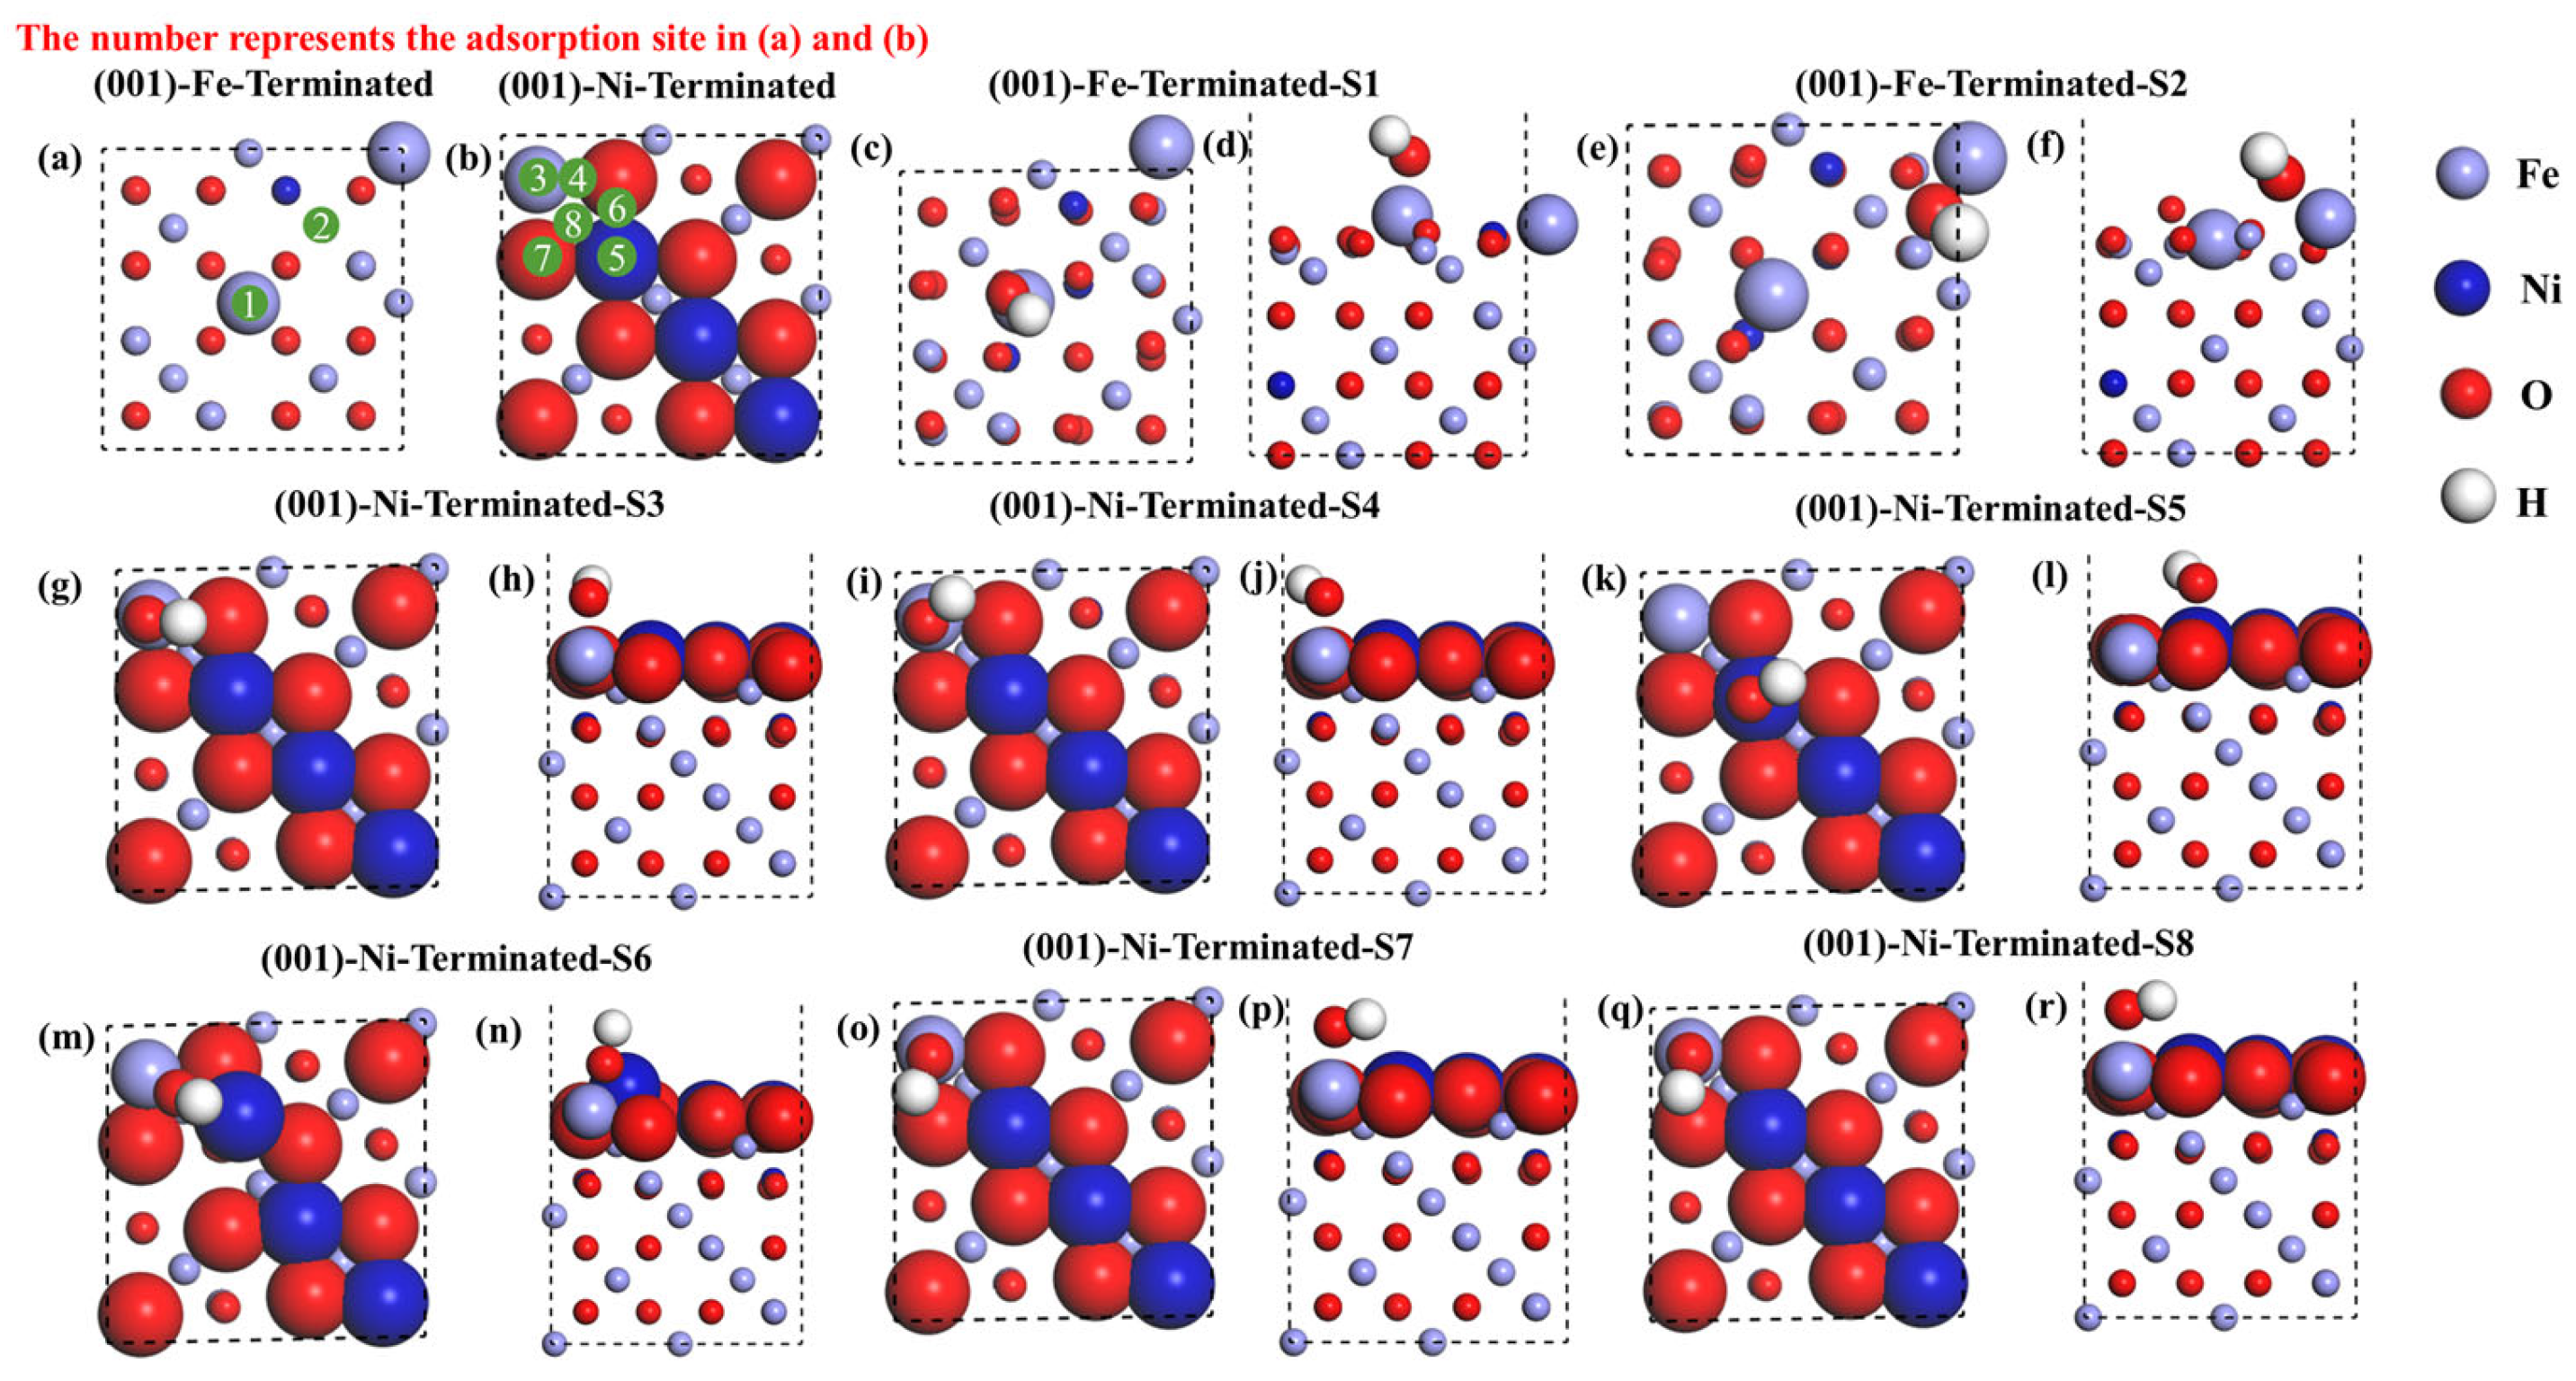
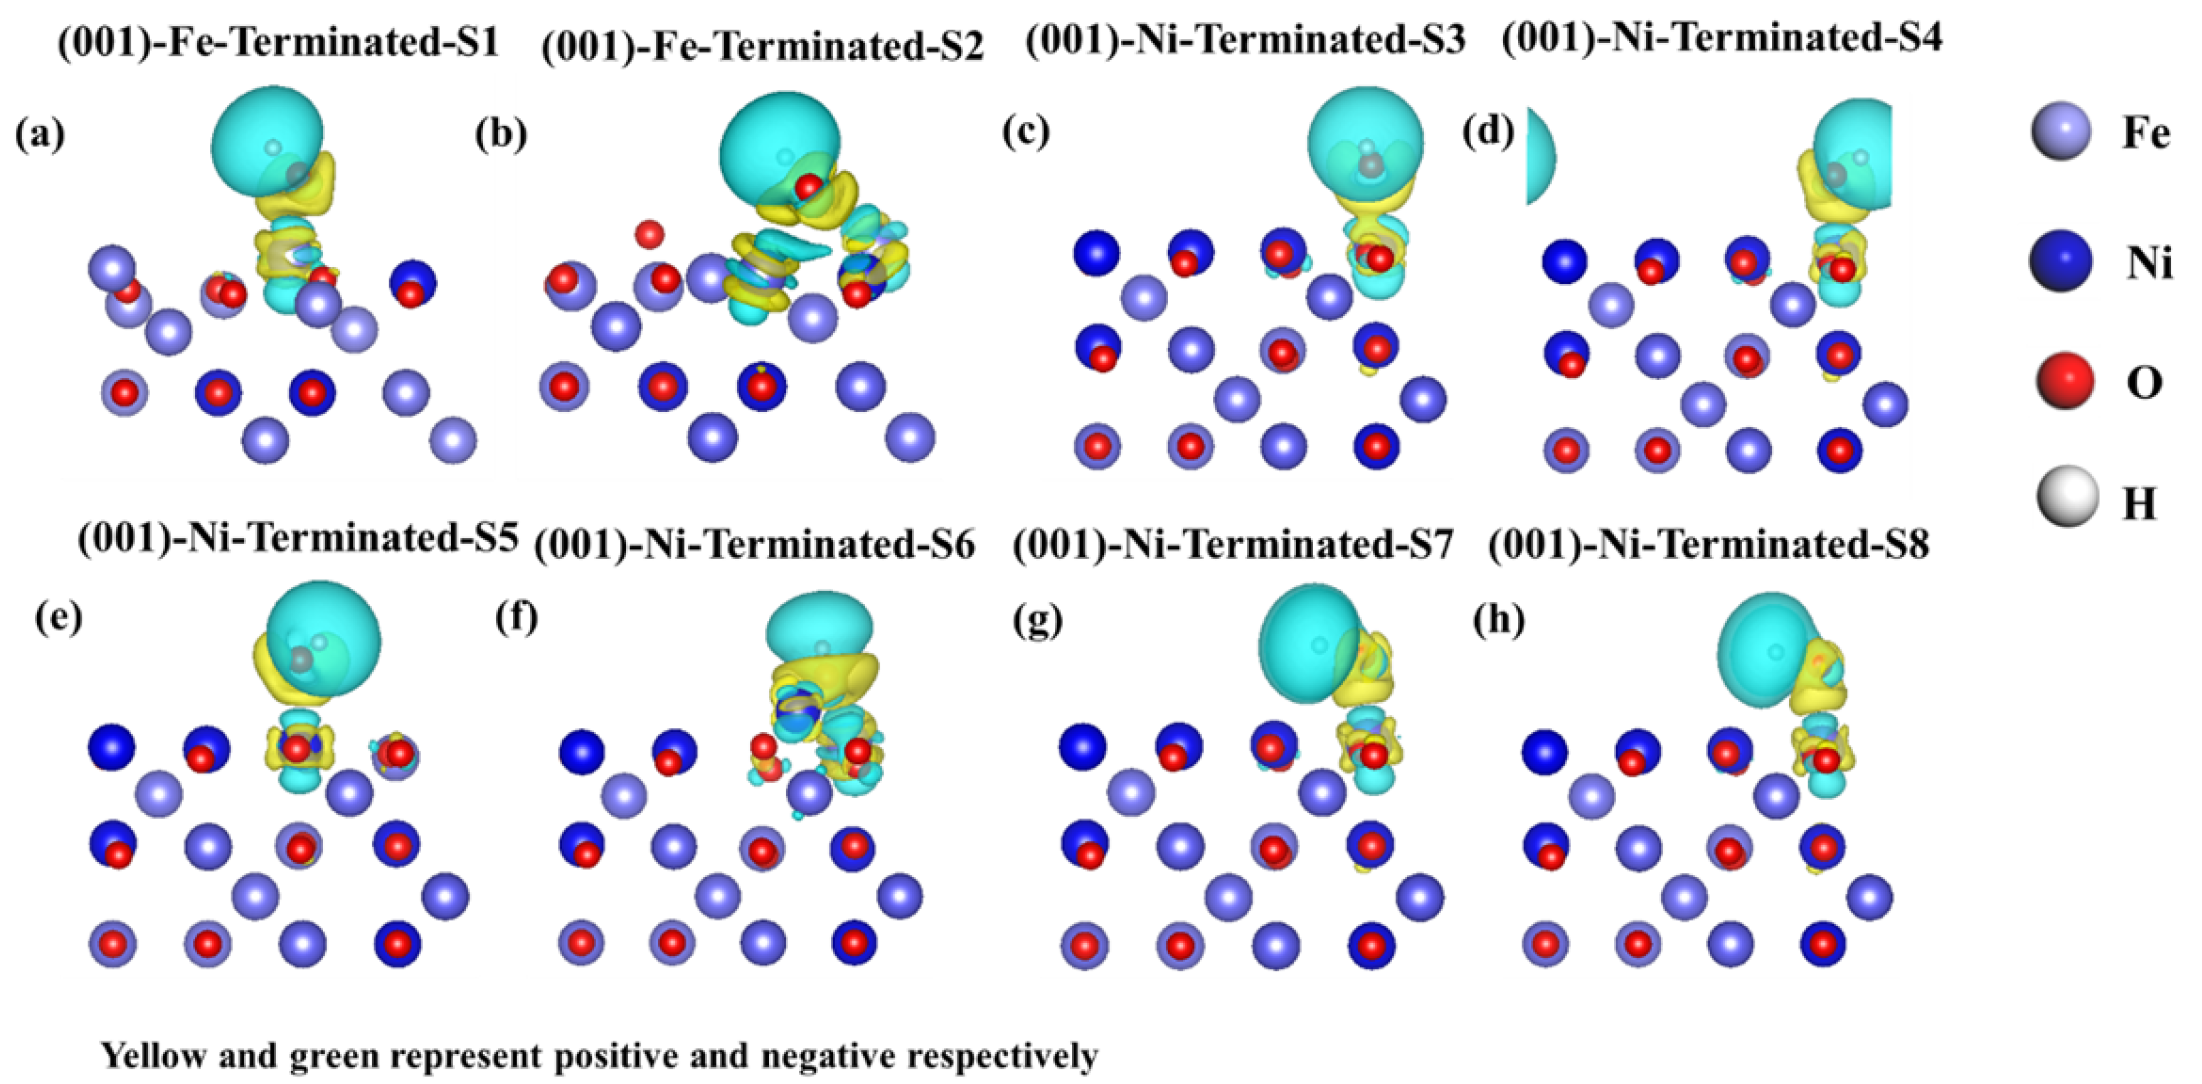
DFT calculations reveal the dissolution process at the atomic scale to further understand the dissolution behavior of spinel oxides in an alkaline solution. The adsorption of OH− on the spinel oxide surface in an alkaline solution should be considered first. Figure 8 shows the adsorption sites of OH− on different layers of the NiFe2O4 (001) surface and the optimized atomic structure at different adsorption sites of the NiFe2O4 (001) surface. In the (001)-Fe-terminated layer, the change in the OH− site at the top is not obvious (S1), and the change in the OH− site in the bridge is more obvious (S2), which is close to the top site. In the (001)-Ni-terminated layer, the OH− at S3 and S5 did not change significantly, and the OH− at other sites changed significantly, all of which are close to the top site. The adsorption energies are listed in Table 3. It was found that OH− was easily adsorbed on the NiFe2O4 (001) surface. The bond length between O and Fe (Ni) is approximately 1.8~2 Å, and the bond length between O and H is 0.98 Å. The O-H bond lengths change slightly after adsorption, indicating that adsorption does not tend to dissociate the O-H bond. Figure 9 shows the differential charge diagram for the different adsorption sites of the NiFe2O4 (001) surface. Yellow and green represent positive and negative correlations, respectively (the colors can be seen in the online version). It is found that charges flowed from the metal atoms to OH− on the (001) surface. The charge density of the OH−-centered region increased, whereas that of the surface Fe and Ni atoms decreased due to the loss of electrons. This suggests that the OH− bond with surface atoms mainly through ionic bonding.
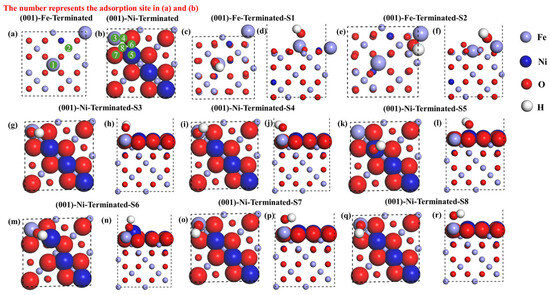
Figure 8.
(a,b) The adsorption sites of OH− on different layers of the NiFe2O4 (001) surface, (c–r) the optimized atomic structure at different adsorption sites of NiFe2O4 (001) surface.
Table 3.
Adsorption energy calculation results of the NiFe2O4 (001) surface.

Figure 9.
Differential charge diagram at different adsorption sites of the NiFe2O4 (001) surface.
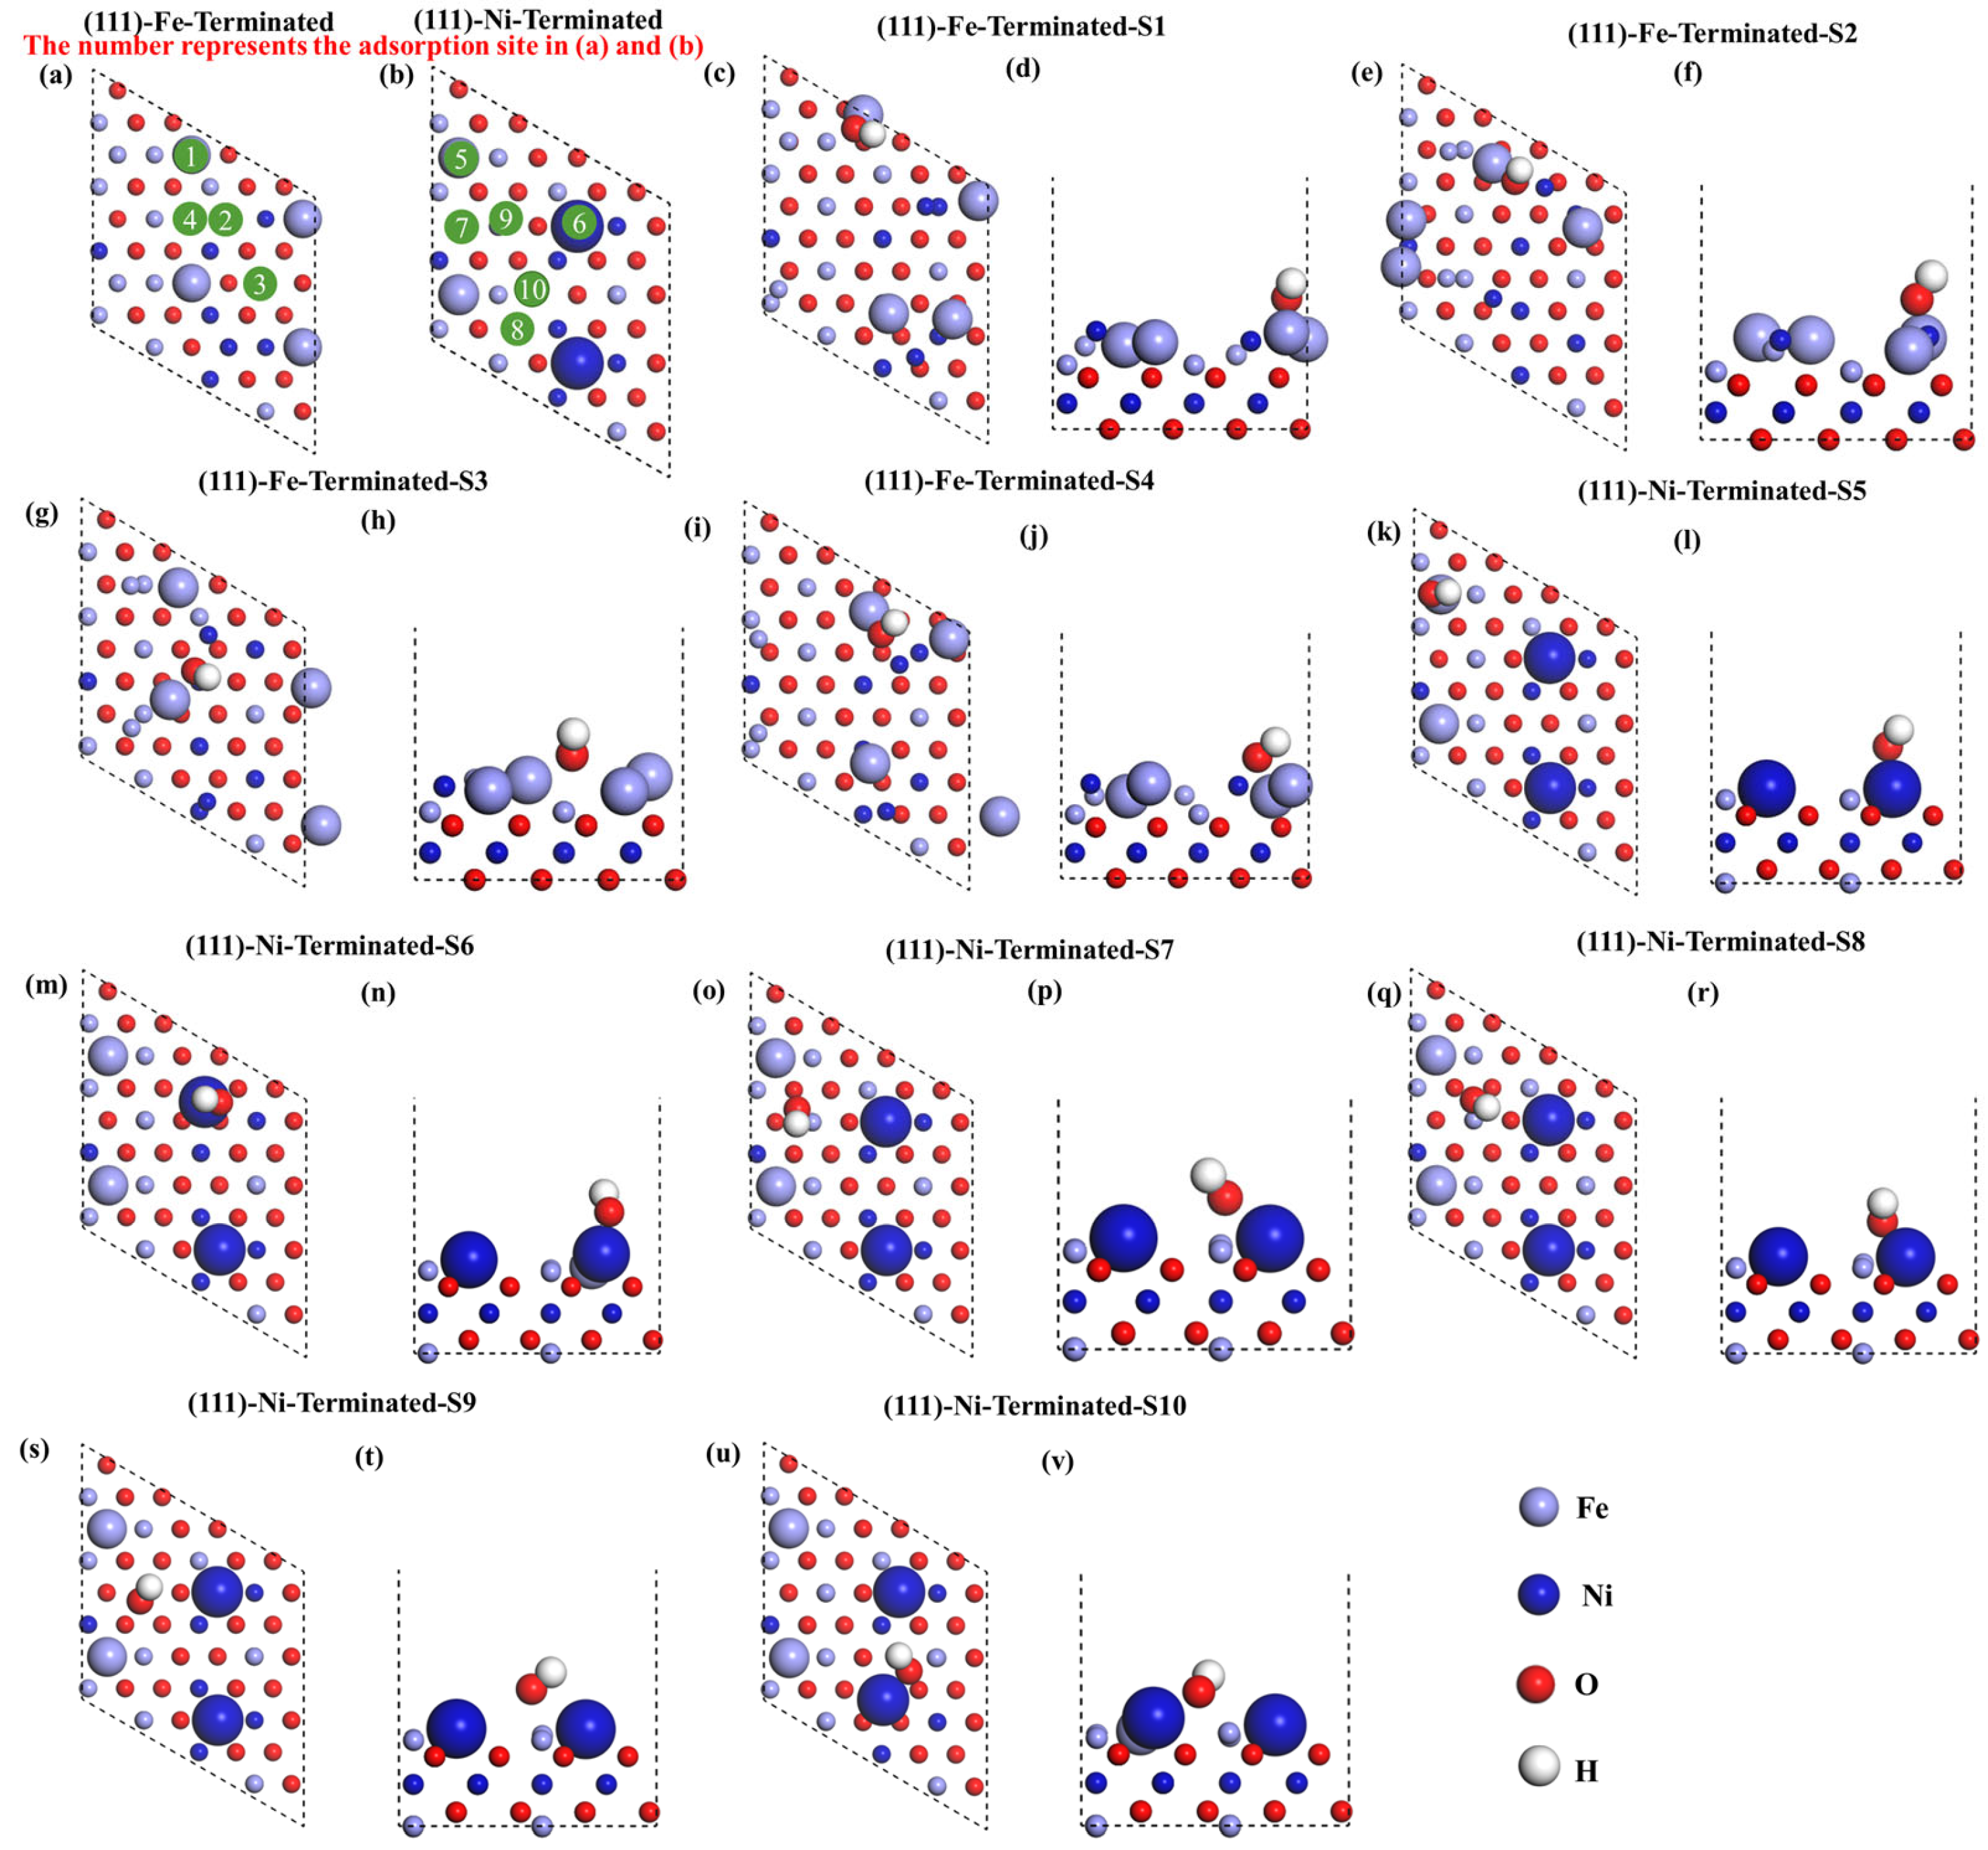
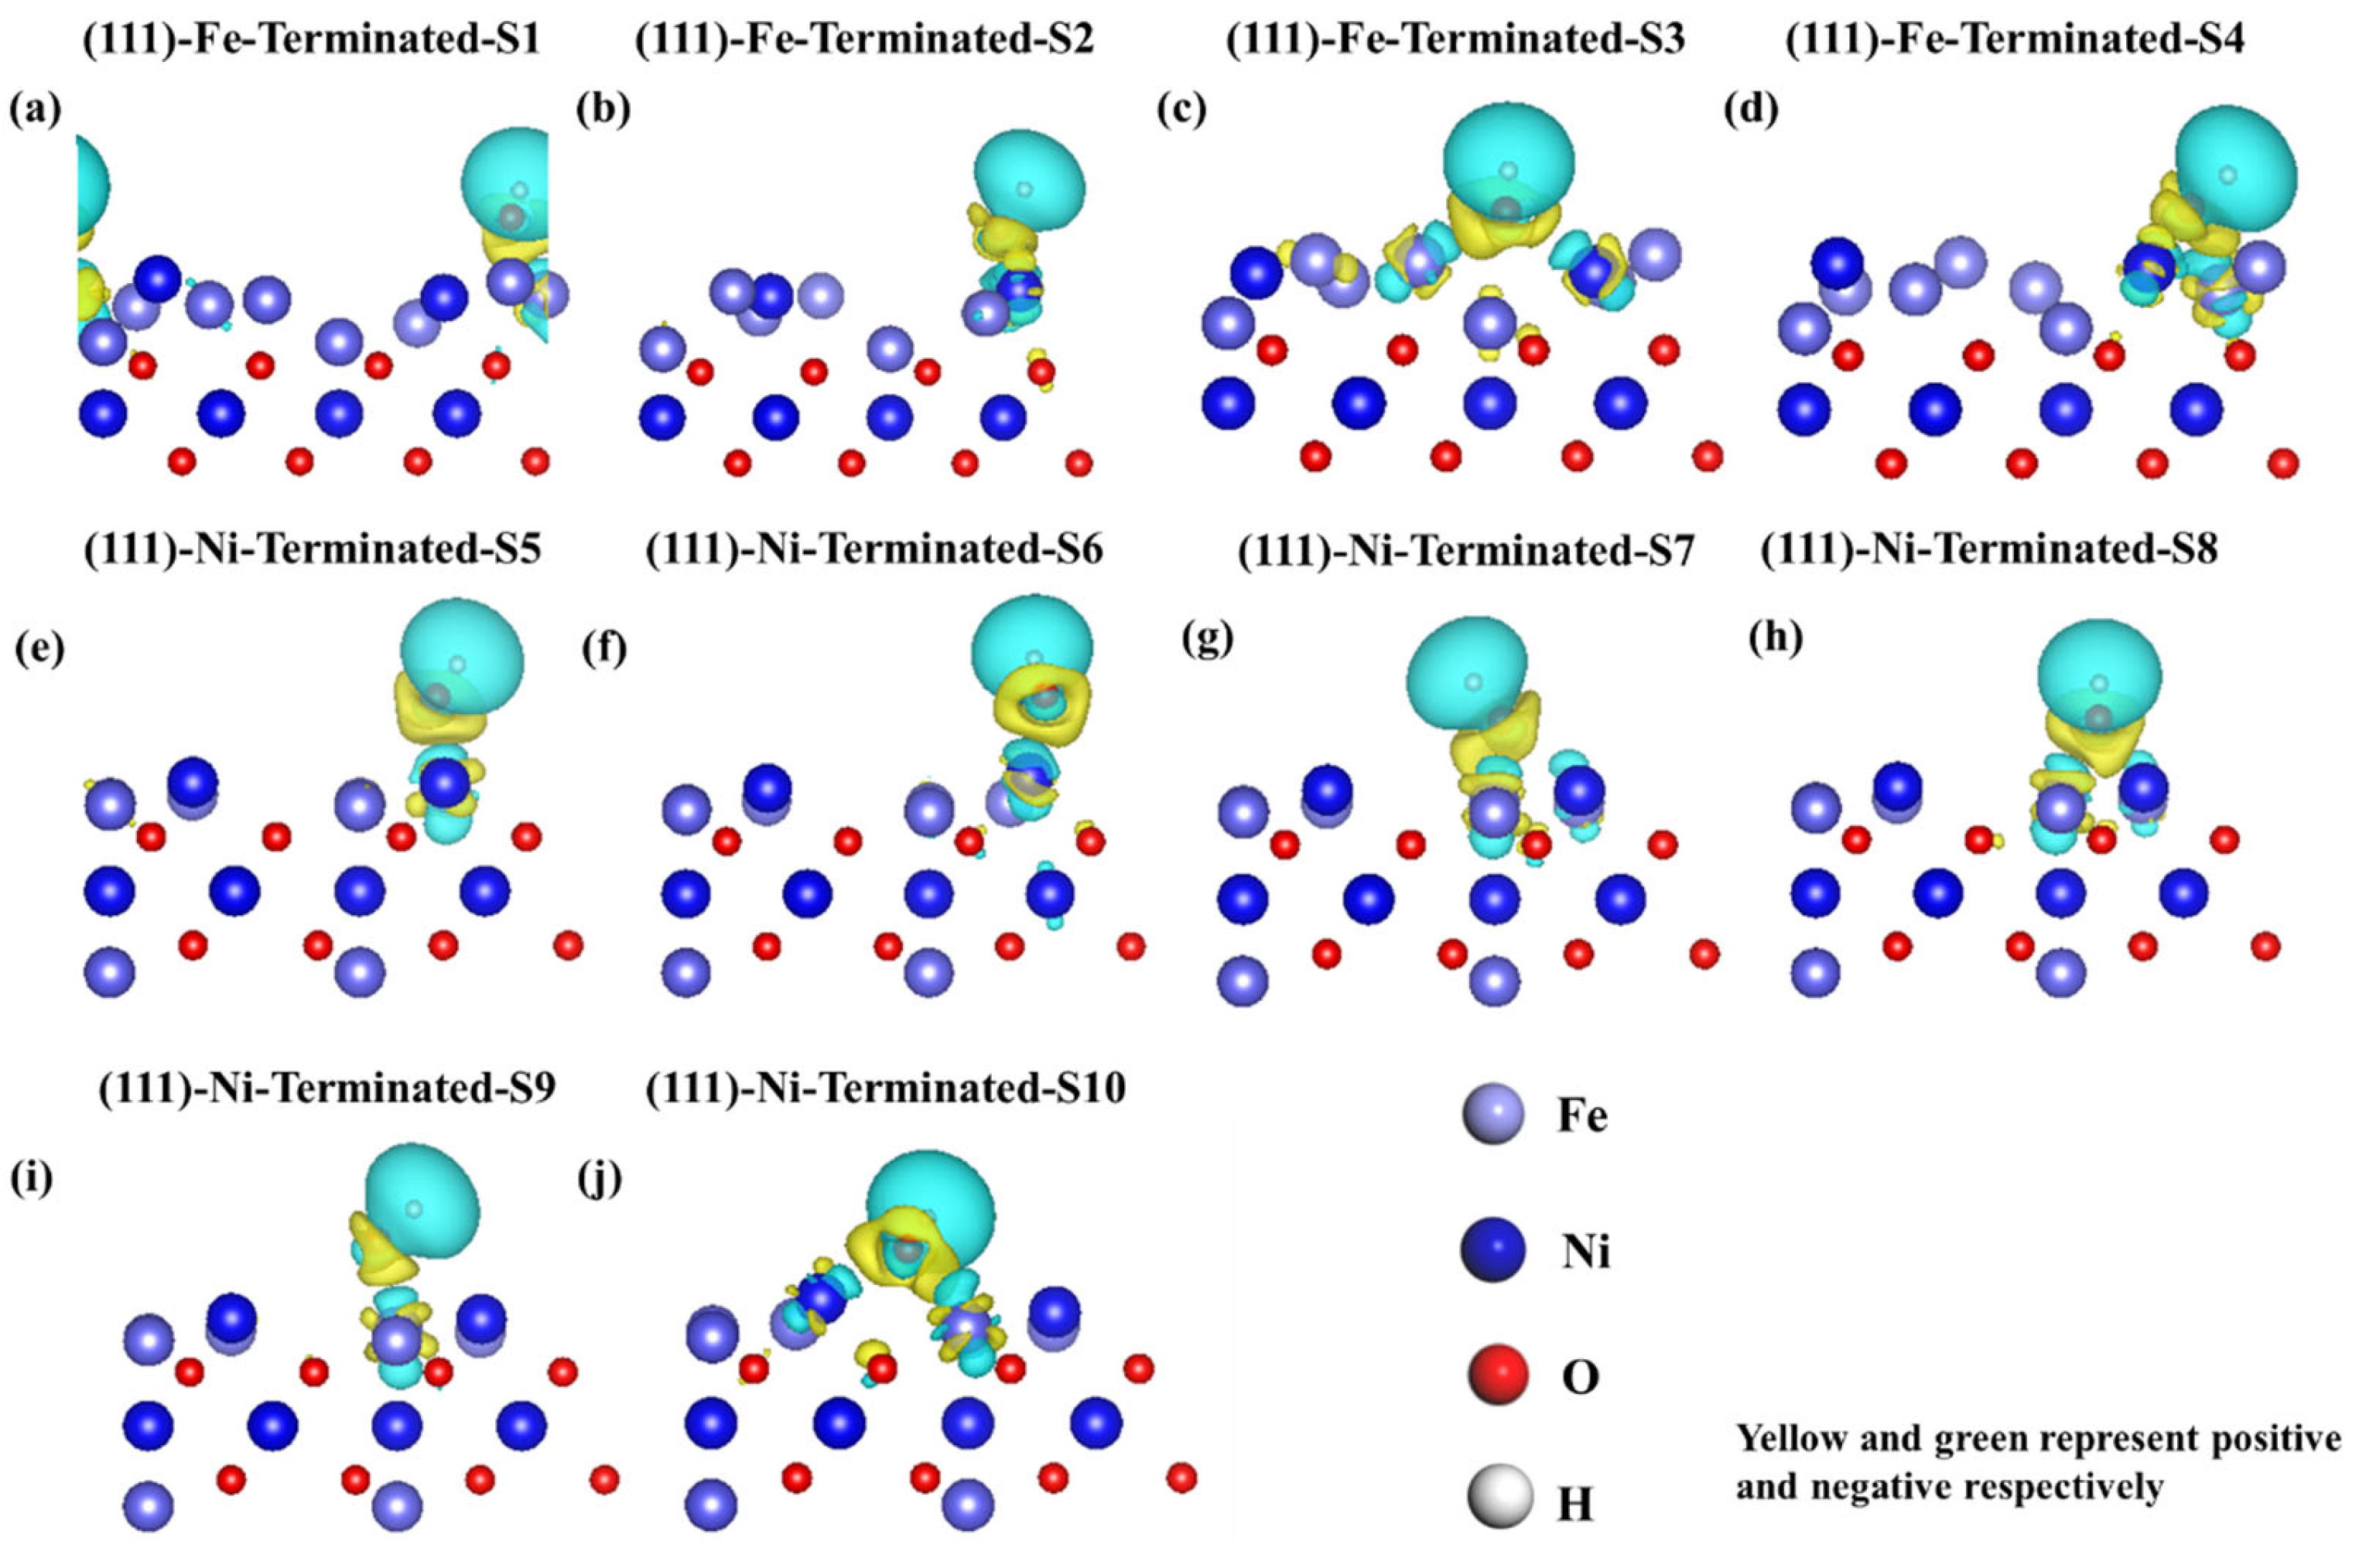
Figure 10 shows the adsorption sites of OH− on different layers of the NiFe2O4 (111) surface and the optimized atomic structure at different adsorption sites of the NiFe2O4 (111) surface. In the (111)-Fe-terminated layer, the change in the OH− site at the S1 site is not obvious, and the OH− sites at other positions have changed significantly, all of which are close to the top site. In the (111)-Ni-terminated layer, the change in the OH− site at most sites is not obvious; only the OH− at the S8 and S10 sites changes significantly, moving from the bridge site to the fcc-site and from the hcp-site to the top site, respectively. The adsorption energies are listed in Table 4. It is found that OH− is easily adsorbed on the NiFe2O4 (111) surface. The bond length between O and Fe (Ni) is approximately 1.8~2Å, and the bond length between O and H is 0.98 Å. The O-H bond lengths change slightly after adsorption, indicating that adsorption does not tend to dissociate the O-H bond. Figure 11 shows the differential charge diagram for the different adsorption sites on the NiFe2O4 (111) surface. Yellow and green represent positive and negative correlations, respectively (the colors can be seen in the online version). It can also be observed that charges flow from the metal atoms to OH− on the (111) surface, similar to Figure 9. Comparing Table 3 and Table 4, it can be found that OH− is strongly adsorbed on the NiFe2O4 surface, and the (111) surface may be easier to begin to dissolve first, which is consistent with the TEM results (Figure 6 and Figure 7).
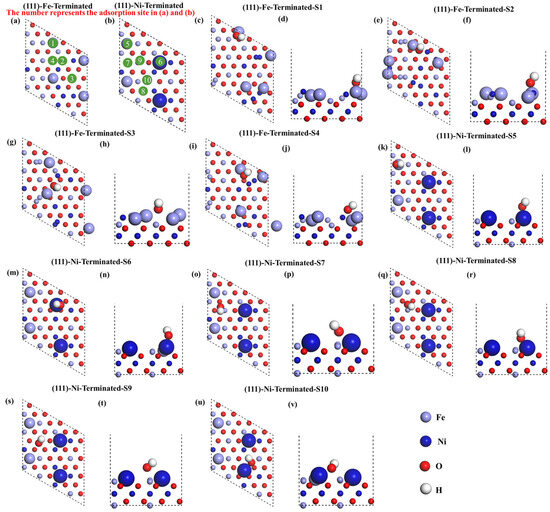
Figure 10.
(a,b) The adsorption sites of OH− on different layers of the NiFe2O4 (111) surface, (c–v) the optimized atomic structure at different adsorption sites of the NiFe2O4 (111) surface.
Table 4.
Adsorption energy calculation results of the NiFe2O4 (111) surface.

Figure 11.
Differential charge diagram at different adsorption sites of the NiFe2O4 (111) surface.
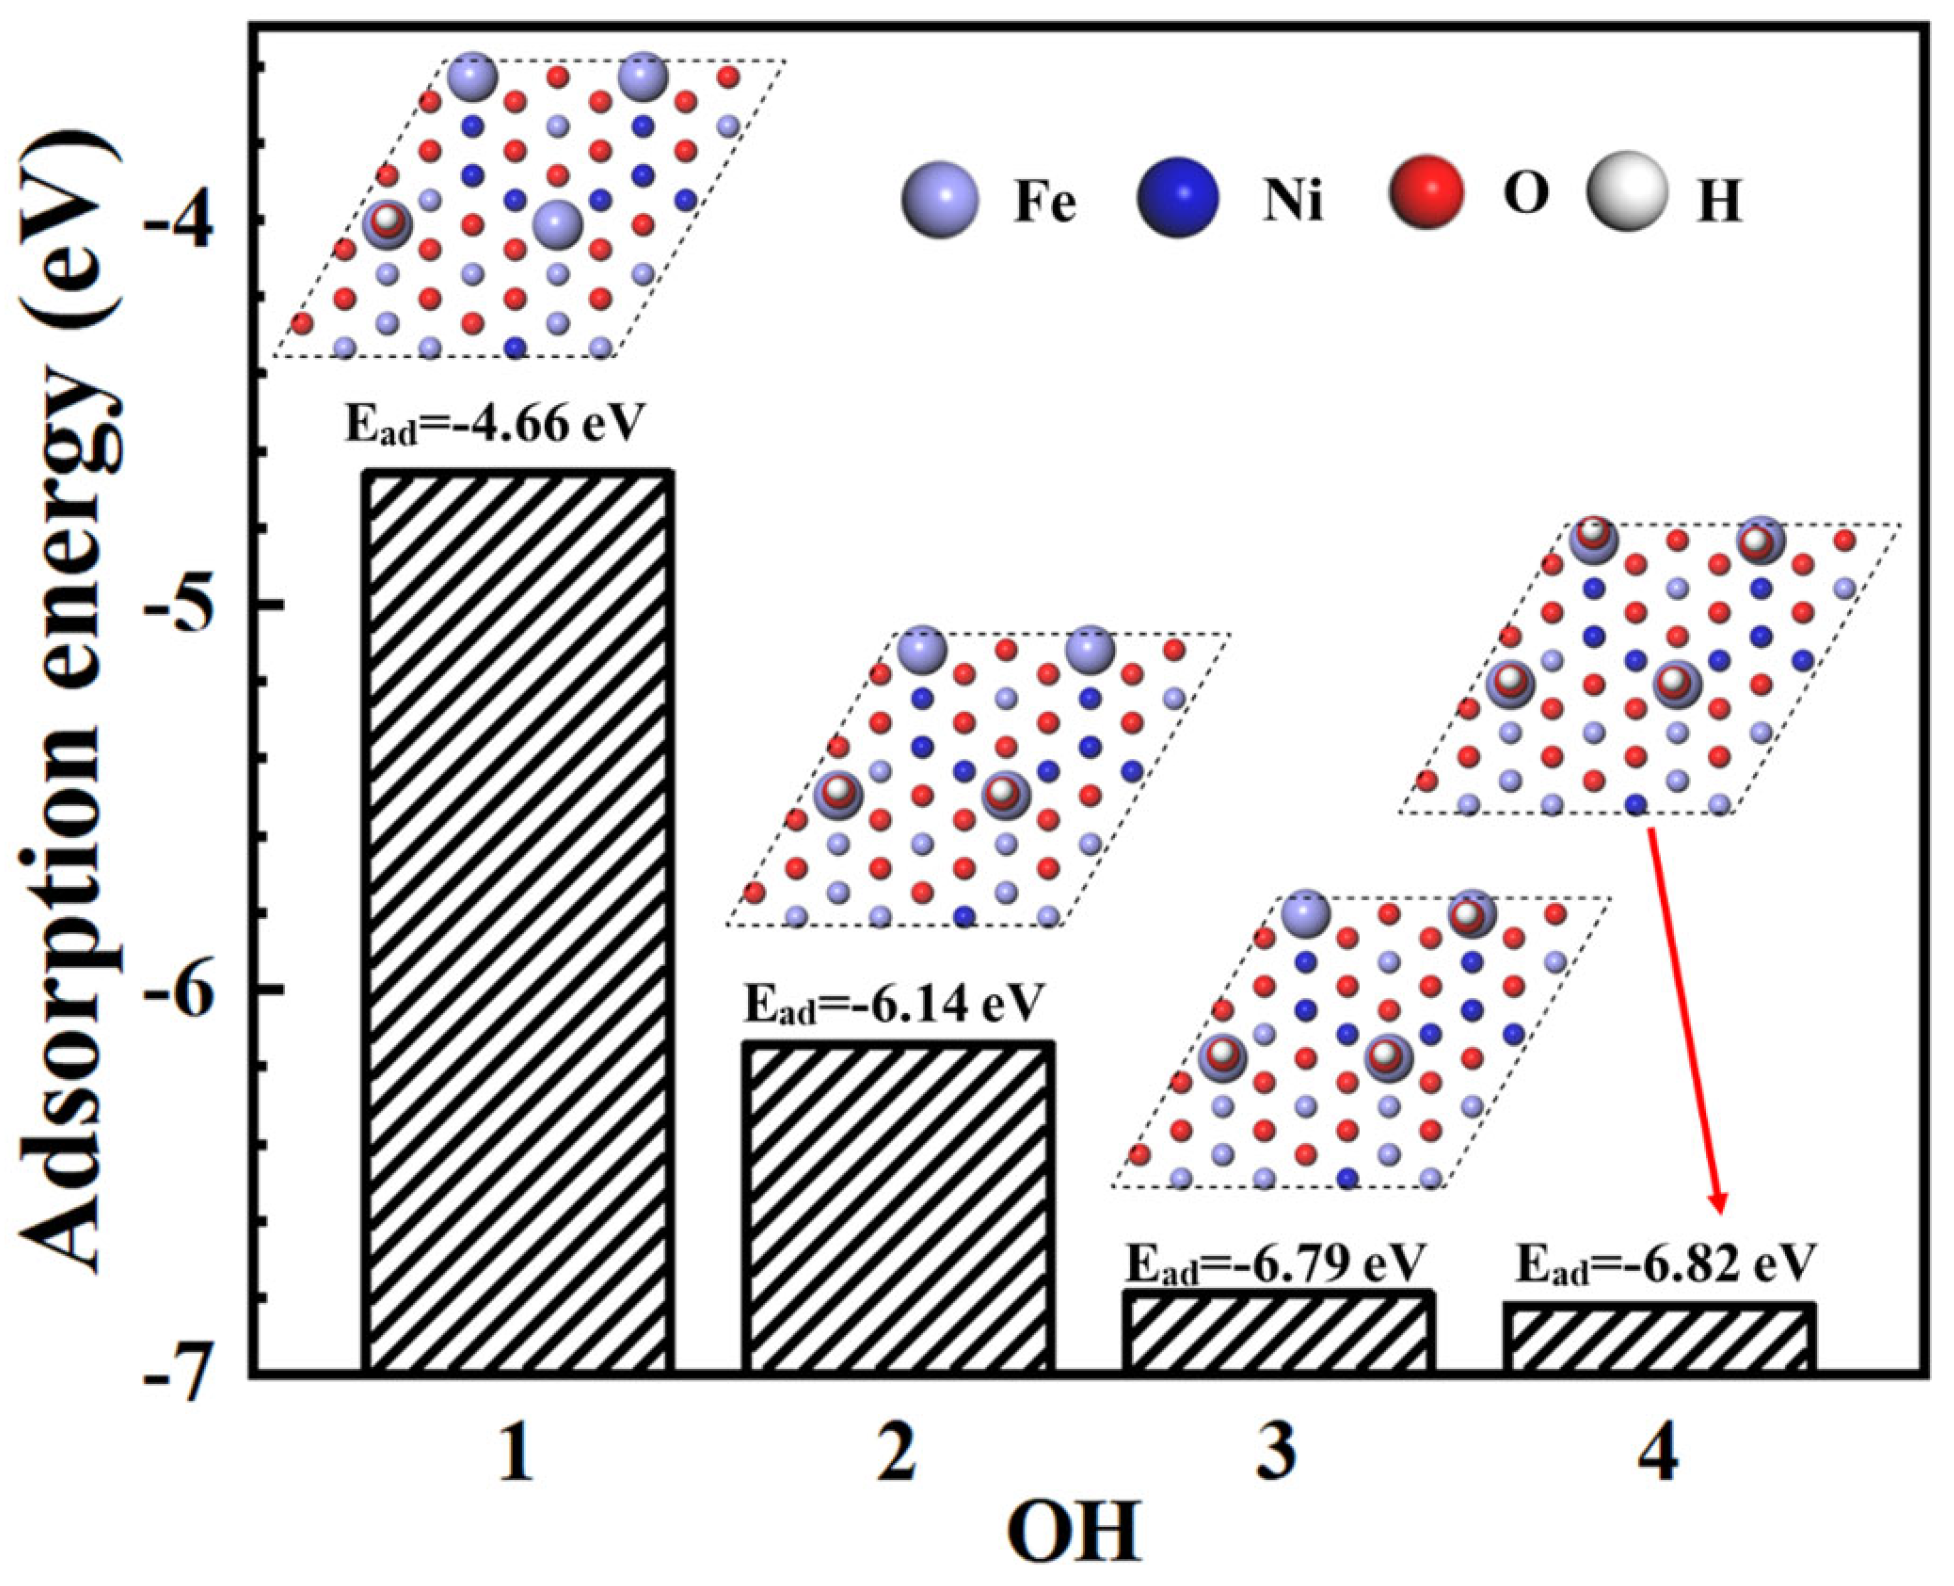
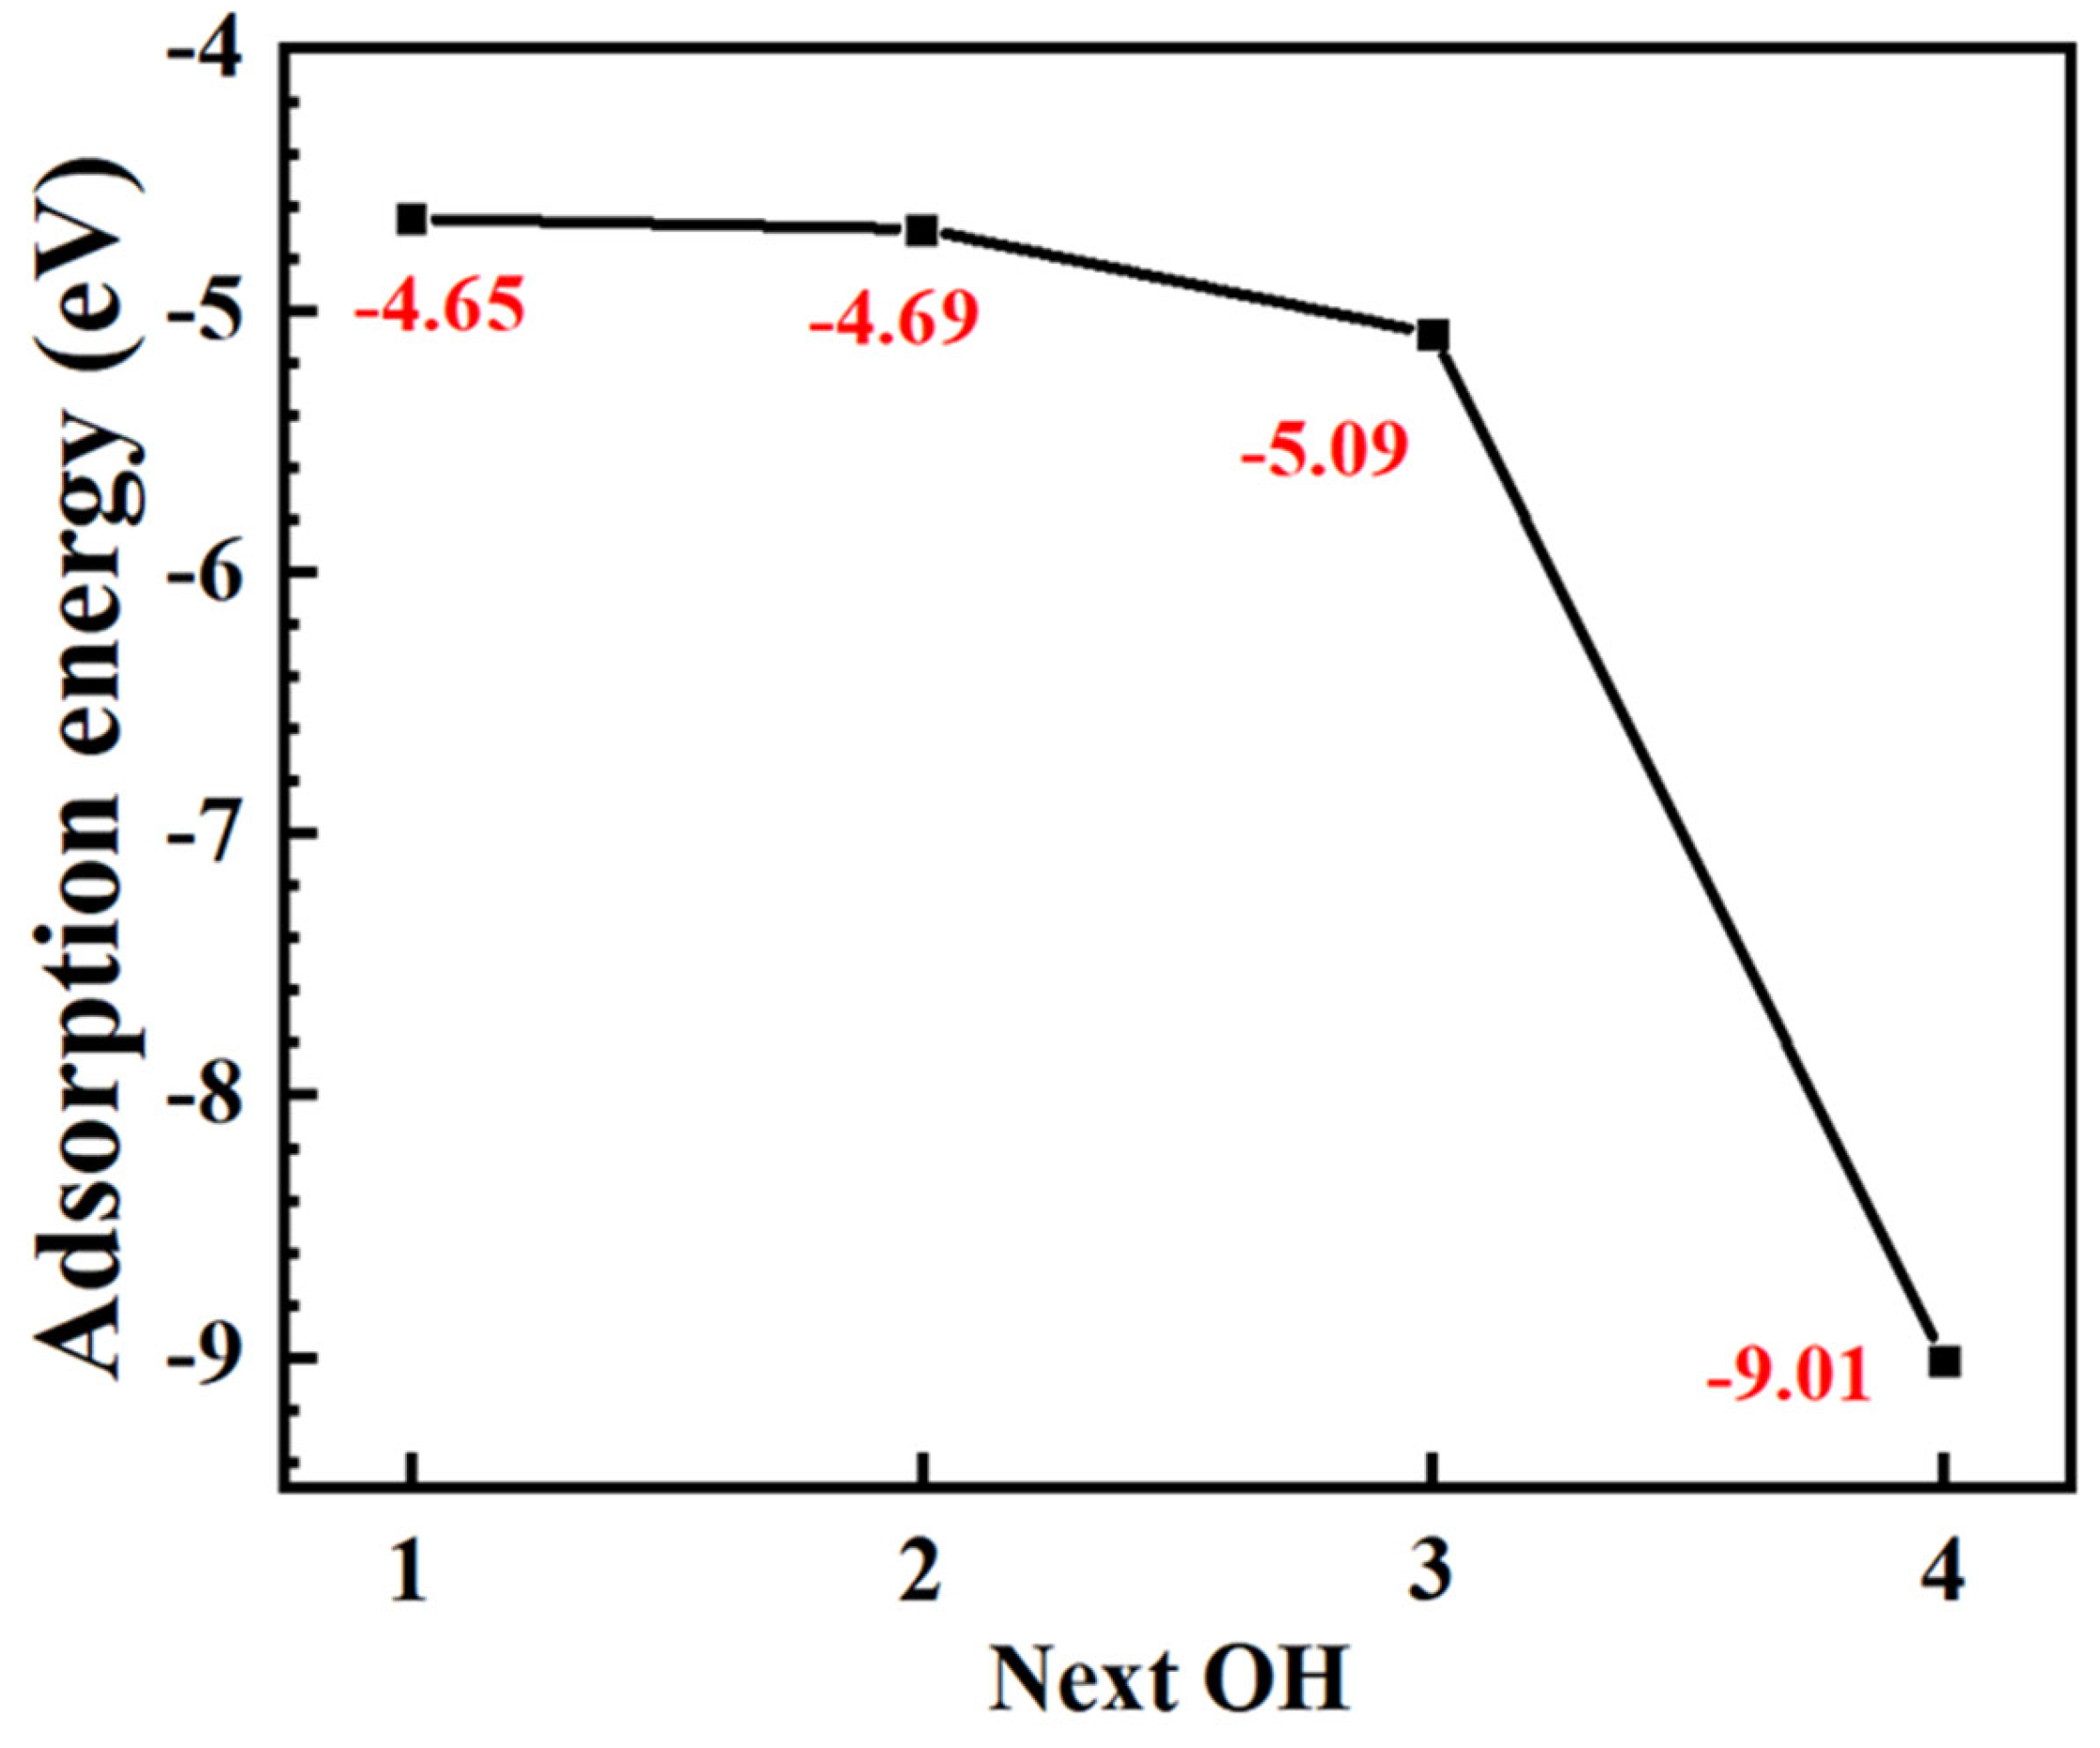
The dissolution of spinel oxides has not been observed in many experiments in a neutral environment [11,16,33,34,35]. It can be seen that the dissolution of spinel is dependent on pH value. The change in pH leads to a shift in the OH− coverage on the spinel surface. A model of OH− with different coverages on the NiFe2O4 surface is established, and the adsorption energy is calculated. Figure 12 shows the adsorption energy calculation results for the NiFe2O4 (111) surface with different OH− coverage. The adsorption energy moves in a more negative direction with increasing OH− coverage. This indicates that the adsorption capacity of OH on the surface of Ni increased with increasing pH. The adsorption energy of each OH− adsorption is also calculated as the coverage increases, as shown in Figure 13. It can be found that OH− is easily adsorbed on the surface with the increase of OH− coverage. This indicates that the dissolution rate of NiFe2O4 also increases at high pH values.
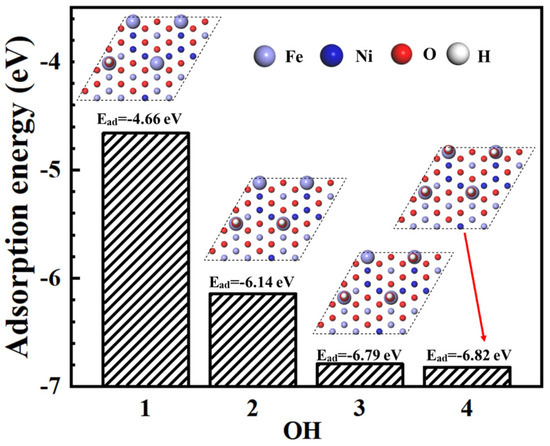
Figure 12.
The adsorption energy calculation results of the NiFe2O4 (111) surface with different OH− coverage.
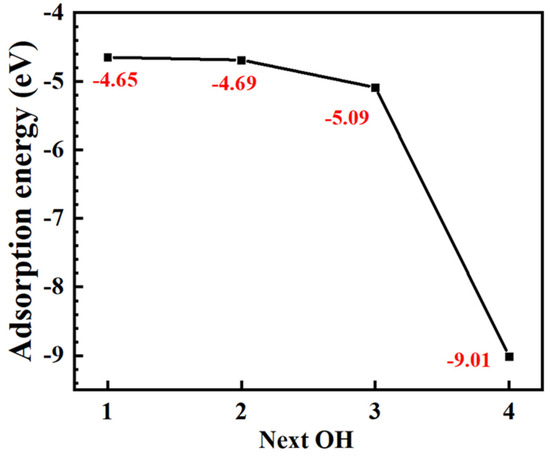
Figure 13.
The adsorption energy of each OH− adsorption.
The ejection energy describes atomic dissolution. The smaller the ejection energy, the easier it is for the atoms to dissolve [30]. Based on the NiFe2O4 observed by TEM, (001), (111), and (022) surfaces are constructed, and their atomic ejection in a certain order is calculated (Figure 14). The eject energy is listed in Table 5. It can be found that the atomic ejection energy on the NiFe2O4 (111) (Figure 14c) crystal plane is smaller than that on other crystal planes. This means that the atoms of the NiFe2O4 (111) crystal plane are easier to dissolve, which is consistent with the TEM results. Meanwhile, the ejection energy of Ni in the same layer is lower than that of other atoms, indicating that Ni is easier to dissolve in the same layer. This may also lead to the segregation of Ni in NiFe2O4.
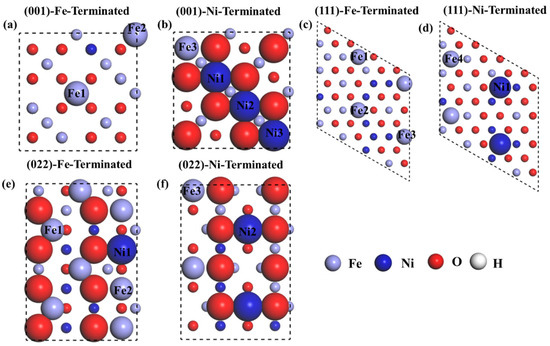
Figure 14.
Schematic diagram of atomic ejection.
Table 5.
Eject energy calculation results of the NiFe2O4 surface.
3.3. Dissolving Mechanism of Spinel Oxides in Alkaline Solution
In this study, the spinel oxides dissolved after 336 h of exposure, and the dissolution increased with time (Figure 1, Figure 3, Figure 5, Figure 6 and Figure 7). The composition of the spinel oxides did not change during dissolution. The spinel oxide on the surface of the 316L SS is mainly composed of Fe, Ni, and O and exhibits the structure of NiFe2O4 (Figure 2, Figure 5, Figure 6 and Figure 7). The dissolution of NiFe2O4 is attributed to the uniform dissolution of the elements, and there is no selective dissolution of the elements. The reactions can be described as follows [21,36]:
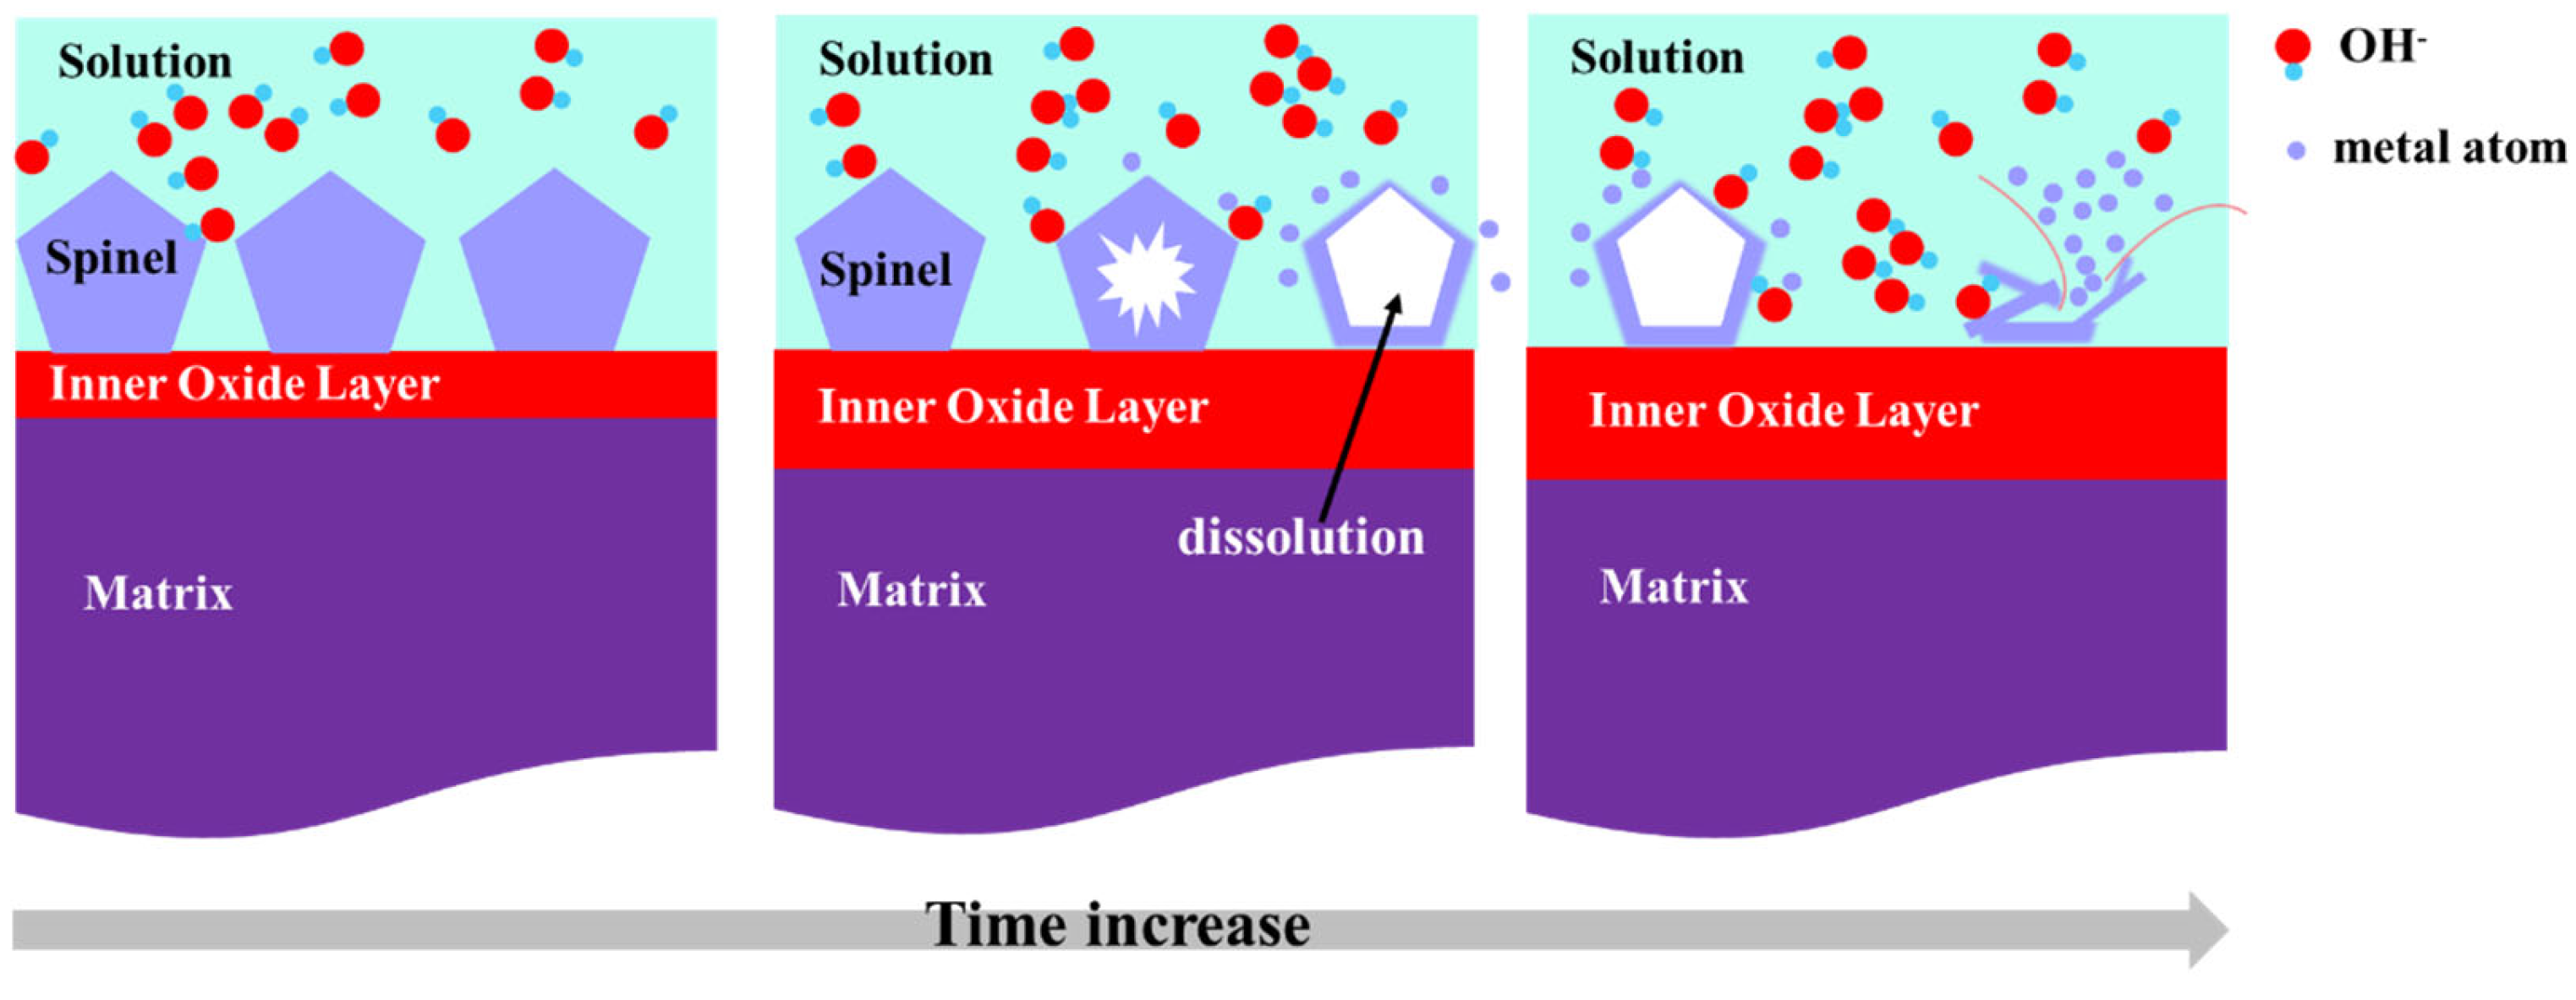
Compared with previous studies [11,16,33,34,35], the alkaline environment in this study was a special condition for the dissolution of spinel oxides. The effect of OH− in the alkaline solution on the surface of NiFe2O4 is obtained using DFT calculations. OH− is strongly adsorbed on the surface of NiFe2O4 (Table 3 and Table 4). When the coverage of OH− increases, the adsorption capacity increases (Figure 9). The adsorption of OH− on the surface in an alkaline solution forms a steady state, which is exothermic. This is the conversion of OH− from a high energy level to a low energy level. The dissolution of NiFe2O4 is an endothermic process that breaks these bonds. It must absorb energy to overcome the barrier to breaking bonds, and the calculation of ejection energy by DFT confirms this process (the value of ejection energy is positive, Table 5). When NiFe2O4 is in an alkaline solution, OH− is easily adsorbed on its surface (Table 3 and Table 4), and the heat released during adsorption provides additional energy for the rupture of the bonding structure in NiFe2O4, making NiFe2O4 easier to dissolve. Meanwhile, with an increase in the surface coverage of OH−, the adsorption capacity also increases (Figure 12). This implies that more heat will be released for NiFe2O4 dissolution during adsorption. Therefore, the higher the pH value, the easier the dissolution of NiFe2O4. This is consistent with the dissolution behavior of NiFe2O4 under these experimental conditions. Simultaneously, with an increase in OH− coverage, OH− is easily adsorbed on the surface (Figure 13). This further accelerates the dissolution of NiFe2O4. The dissolution mechanism of NiFe2O4 is illustrated in Figure 15. The above experimental results and calculations provide a new theoretical basis for the dissolution of spinel oxides and a new solution for the deposition of corrosion products in lead–bismuth stacks.
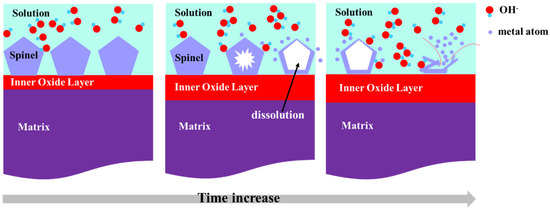
Figure 15.
The mechanism diagram of NiFe2O4 dissolution.
4. Conclusions
The effects of OH− on the structure and compositional distribution of the spinel oxide on the surface of 316L SS after 2000 h of exposure to high-temperature and high-pressure water are investigated. The following conclusions are drawn based on the present results:
- The oxide film on the surface of the 316L SS is a double-layer structure. The outer oxide layer is Fe-rich spinel oxide, and the inner layer is Cr-rich oxide;
- The inner oxide layer is dense and thickens with increasing exposure time. The outer oxide layer is loosely distributed and dissolved after 336 h;
- The thickness of the inner oxide layer increases with exposure time and stabilizes at approximately 100 nm;
- OH− is strongly adsorbed onto NiFe2O4. With increasing coverage, OH is more easily adsorbed.
Author Contributions
Conceptualization, X.Z. and H.W.; Methodology, J.X.; Validation, B.Z., C.Z. and J.X.; Formal analysis, C.Z. and X.Z.; Investigation, B.Z., C.Z. and X.Z.; Data curation, B.Z., X.Z. and H.W.; Writing—original draft, B.Z.; Writing—review and editing, H.W. and J.X.; Supervision, J.X. All authors have read and agreed to the published version of the manuscript.
Funding
This research received no external funding.
Data Availability Statement
The original contributions presented in this study are included in the article. Further inquiries can be directed to the corresponding author.
Conflicts of Interest
Authors Bin Zhang, Congbin Zhu and Xiaoping Zou were employed by the company China Nuclear Power Engineering Co., Ltd. The remaining authors declare that the research was conducted in the absence of any commercial or financial relationships that could be construed as a potential conflict of interest.
References
- Herman, S.D.; Mehrotra, A.K. A heat-transfer model for tube fouling in the radiant section of once-through steam generators. Can. J. Chem. Eng. 2020, 99, 789–802. [Google Scholar] [CrossRef]
- Adedeji, O.E.; Kumar, A.; Perdicakis, B.; Sanders, R.S. Investigation of solid particle erosion-related failures in once-through steam generators (OTSGs) in oil sands in-situ production: The limitations of the API RP 14E guideline in OTSG design or operational decision-making. Can. J. Chem. Eng. 2023, 101, 6135–6150. [Google Scholar] [CrossRef]
- Zrodnikov, A.V.; Toshinsky, G.I.; Komlev, O.G.; Dragunov, Y.; Stepanov, V.; Klimov, N.; Generalov, V.; Kopytov, I.; Krushelnitsky, V. Innovative nuclear technology based on modular multi-purpose lead–bismuth cooled fast reactors. Prog. Nucl. Energy 2008, 50, 170–182. [Google Scholar] [CrossRef]
- Nagata, A.; Takaki, N.; Sekimoto, H. A feasible core design of lead bismuth eutectic cooled CANDLE fast reactor. Ann. Nucl. Energy 2009, 36, 562–566. [Google Scholar] [CrossRef]
- Feldhoff, J.F.; Hirsch, T.; Pitz-Paal, R.; Valenzuela, L. Transient models and characteristics of once-through line focus Systems. Energy Procedia 2015, 69, 157–168. [Google Scholar] [CrossRef]
- Wang, Z.; Xu, J.; Li, J.; Xin, L.; Lu, Y.; Shoji, T.; Takeda, Y.; Otsuka, Y.; Mutoh, Y. The synergy of corrosion and fretting wear process on Inconel 690 in the high temperature high pressure water environment. J. Nucl. Mater. 2018, 502, 255–262. [Google Scholar] [CrossRef]
- Zhang, T.; Qiu, G.; Yu, H.; Zhou, P.; Wang, S.; Zhang, K.; Guo, Q.; Ren, L.; Xu, J. The Fouling Behavior of Steam Generator Tube at Different Positions in the High-Temperature Water. Metals 2021, 11, 684. [Google Scholar] [CrossRef]
- Luo, L.; Su, M.; Yan, P.; Zou, L.; Schreiber, D.K.; Baer, D.R.; Zhu, Z.; Zhou, G.; Wang, Y.; Bruemmer, S.M.; et al. Atomic origins of water-vapour-promoted alloy oxidation. Nat. Mater. 2018, 17, 514–518. [Google Scholar] [CrossRef]
- Shan, H.; Zhang, T.; Yuan, Y.; Guo, Q.; Liu, Z.; Liu, F.; Xu, J.; Shoji, T. Effects of dissolved oxygen on the corrosion-related unidentified deposit formed of 304 SS in the flow accelerated zone under the simulated secondary water chemistry. Corros. Commun. 2024, 16, 14–23. [Google Scholar] [CrossRef]
- Shan, H.; Bai, Z.; Wei, S.; Yuan, Y.; He, Z.; Wang, X.; Wang, C.; Xu, J. Effects of pH on the corrosion behavior of 316L SS in SMRs for boron-free lithium-containing high-temperature water: Experiments and calculations. Surf. Interfaces 2025, 56, 105750. [Google Scholar] [CrossRef]
- Lu, Y.H.; Peng, Q.J.; Sato, T.; Shoji, T. An ATEM study of oxidation behavior of SCC crack tips in 304L stainless steel in high temperature oxygenated water. J. Nucl. Mater. 2005, 347, 52–68. [Google Scholar] [CrossRef]
- Ding, Y.; Yuan, S.; Wu, R.; Wei, S.; Wang, S.; Xu, J.; Yu, H.; Sun, D. Effect of surface hemispherical dent depth on the microstructure evolution and stress corrosion cracking of heat transfer tubes in steam generator. Corros. Sci. 2024, 230, 111950. [Google Scholar] [CrossRef]
- Krause, T.W.; Babbar, V.K.; Underhill, P.R. A pulsed eddy current probe for inspection of support plates from within Alloy-800 steam generator tubes. Am. Inst. Phys. 2014, 55, 112–131. [Google Scholar] [CrossRef]
- Zebardast, H.R.; Rogak, S.; Asselin, E. Electrochemical detection of corrosion product fouling in high temperature and high pressure solution. Electrochim. Acta 2013, 100, 101–109. [Google Scholar] [CrossRef]
- Lee, H.B.; Jang, C. Effect of dissolved hydrogen on the early corrosion behavior of 316 stainless steel in simulated PWR environments. J. Nucl. Mater. 2024, 591, 154907. [Google Scholar] [CrossRef]
- Duan, Z.; Arjmand, F.; Zhang, L.; Abe, H. Investigation of the corrosion behavior of 304 L and 316 L stainless steels at high-temperature borated and lithiated water. J. Nucl. Sci. Technol. 2015, 53, 1435–1446. [Google Scholar] [CrossRef]
- Ren, L.; Wang, S.; Xu, J.; Zhang, T.; Guo, Q.; Zhang, D.; Si, J.; Zhang, X.; Yu, H.; Shoji, T.; et al. Fouling on the secondary side of nuclear steam generator tube: Experimental and simulated study. Appl. Surf. Sci. 2022, 590, 153143. [Google Scholar] [CrossRef]
- Macdonald, D.D. The Point Defect Model for the Passive State. J. Electrochem. Soc. 1992, 139, 3434–3448. [Google Scholar] [CrossRef]
- Chen, D.; Han, E.H.; Wu, X. Effects of crevice geometry on corrosion behavior of 304 stainless steel during crevice corrosion in high temperature pure water. Corros. Sci. 2016, 111, 518–530. [Google Scholar] [CrossRef]
- Zhang, Z.; Wang, J.; Han, E.H.; Ke, W. Effects of Surface State and Applied Stress on Stress Corrosion Cracking of Alloy 690TT in Lead-containing Caustic Solution. J. Mater. Sci. Technol. 2012, 28, 785–792. [Google Scholar] [CrossRef]
- Yuan, S.; Nong, J.; Guo, Q.; Liu, Z.; Liu, F.; Xu, J.; Li, J.; Shoji, T. Atomic insights into the preferential dissolution of Laves phase of 9% Cr heat resistant steels in the strong alkaline solution. Corros. Sci. 2024, 227, 111791. [Google Scholar] [CrossRef]
- Wang, J.; Wang, J.; Ming, H.; Zhang, Z.; Han, E. Effect of pH on corrosion behavior of 316 L stainless steel in hydrogenated high temperature water. Mater. Corros. 2017, 69, 580–592. [Google Scholar] [CrossRef]
- Sun, H.; Wu, X.; Han, E.H.; Wei, Y. Effects of pH and dissolved oxygen on electrochemical behavior and oxide films of 304SS in borated and lithiated high temperature water. Corros. Sci. 2012, 59, 334–342. [Google Scholar] [CrossRef]
- Nong, J.; Ren, Y.; Bai, Z.; Wei, S.; Wang, X.; Li, X.; Wang, C.; Xu, J.; Shoji, T. Combined dual-exposure test and DFT investigations into effects of interstitial hydrogen on oxide film of Alloy 600 in high temperature water. Corros. Sci. 2024, 238, 112371. [Google Scholar] [CrossRef]
- Resende, F.J.; Carvalho, V.E.; Costa, B.V.; de Castilho, C. Temperature dependent structure of low index copper surfaces studied by molecular dynamics simulation. Braz. J. Phys. 2004, 34, 414–418. [Google Scholar] [CrossRef]
- Obot, I.B.; Gasem, Z.M.; Umoren, S.A. Understanding the mechanism of 2-mercaptobenzimidazole adsorption on Fe (110), Cu (111) and Al (111) Surfaces: DFT and molecular dynamics simulations approaches. Int. J. Electrochem. Sci. 2014, 9, 2367–2378. [Google Scholar] [CrossRef]
- Kovačević, N.; Kokalj, A. Chemistry of the interaction between azole type corrosion inhibitor molecules and metal surfaces. Mater. Chem. Phys. 2012, 137, 331–339. [Google Scholar] [CrossRef]
- Zhang, Y.; Ren, Y.; Guo, Q.; Li, X.; Xu, J.; Shoji, T. Experiments and DFT calculations on the effects of interstitial hydrogen on Ti corrosion products in high temperature water. Corros. Sci. 2024, 232, 112014. [Google Scholar] [CrossRef]
- Zou, X.J.; Ding, K.N.; Zhang, Y.F.; Li, J.Q. A DFT study of acetonitrile adsorption and decomposition on the TiO2 (110) surface. Int. J. Quantum Chem. 2011, 111, 915–922. [Google Scholar] [CrossRef]
- Li, B.; Gao, W.; Jiang, Q. A universal picture for ejecting atoms on metallics. Acta Mater. 2022, 228, 117792. [Google Scholar] [CrossRef]
- Liu, C.; Shen, T.; Yao, C.; Chang, H.; Wei, K.; Niu, L.; Ma, Z.; Wang, Z. Corrosion behavior of ferritic–martensitic steels SIMP and T91 in fast-flowing steam. Corros. Sci. 2021, 187, 109474. [Google Scholar] [CrossRef]
- Liu, C.; Jin, P.; Shen, T.; Wang, Z. Microstructural evolution of early-stage oxide film on 15–15Ti austenitic stainless steel under 500 ℃ steam. Corros. Sci. 2022, 207, 110557. [Google Scholar] [CrossRef]
- Sun, H.; Wu, X.; Han, E.H. Effects of temperature on the oxide film properties of 304 stainless steel in high temperature lithium borate buffer solution. Corros. Sci. 2009, 51, 2840–2847. [Google Scholar] [CrossRef]
- Romedenne, M.; Lambeets, S.; Song, M.; Roach, C.; Devaraj, A.; Pillai, R. Revealing the elusive role of water vapor in the oxidation behavior of a Mn-Si containing NiCr alloy at 950 °C. Corros. Sci. 2023, 221, 111348. [Google Scholar] [CrossRef]
- Li, Y.H.; Wang, S.Z.; Li, X.D.; Lu, J.M. Corrosion of an Austenitic Heat-Resistant Steel HR3C in High-Temperature Steam and Supercritical Water. Adv. Mater. Res. 2014, 908, 67–71. [Google Scholar] [CrossRef]
- Tyurin, A.G. Estimation of the Effect of Molybdenum on Chemical and Electrochemical Stability of Iron-Based Alloys. Prot. Met. 2003, 39, 367–373. [Google Scholar] [CrossRef]


Disclaimer/Publisher’s Note: The statements, opinions and data contained in all publications are solely those of the individual author(s) and contributor(s) and not of MDPI and/or the editor(s). MDPI and/or the editor(s) disclaim responsibility for any injury to people or property resulting from any ideas, methods, instructions or products referred to in the content. |
© 2025 by the authors. Licensee MDPI, Basel, Switzerland. This article is an open access article distributed under the terms and conditions of the Creative Commons Attribution (CC BY) license (https://creativecommons.org/licenses/by/4.0/).