
Understanding Room-Temperature Ductility of Bcc Refractory Alloys from Their Atomistic-Level Features


Abstract
1. Introduction
2. Methods
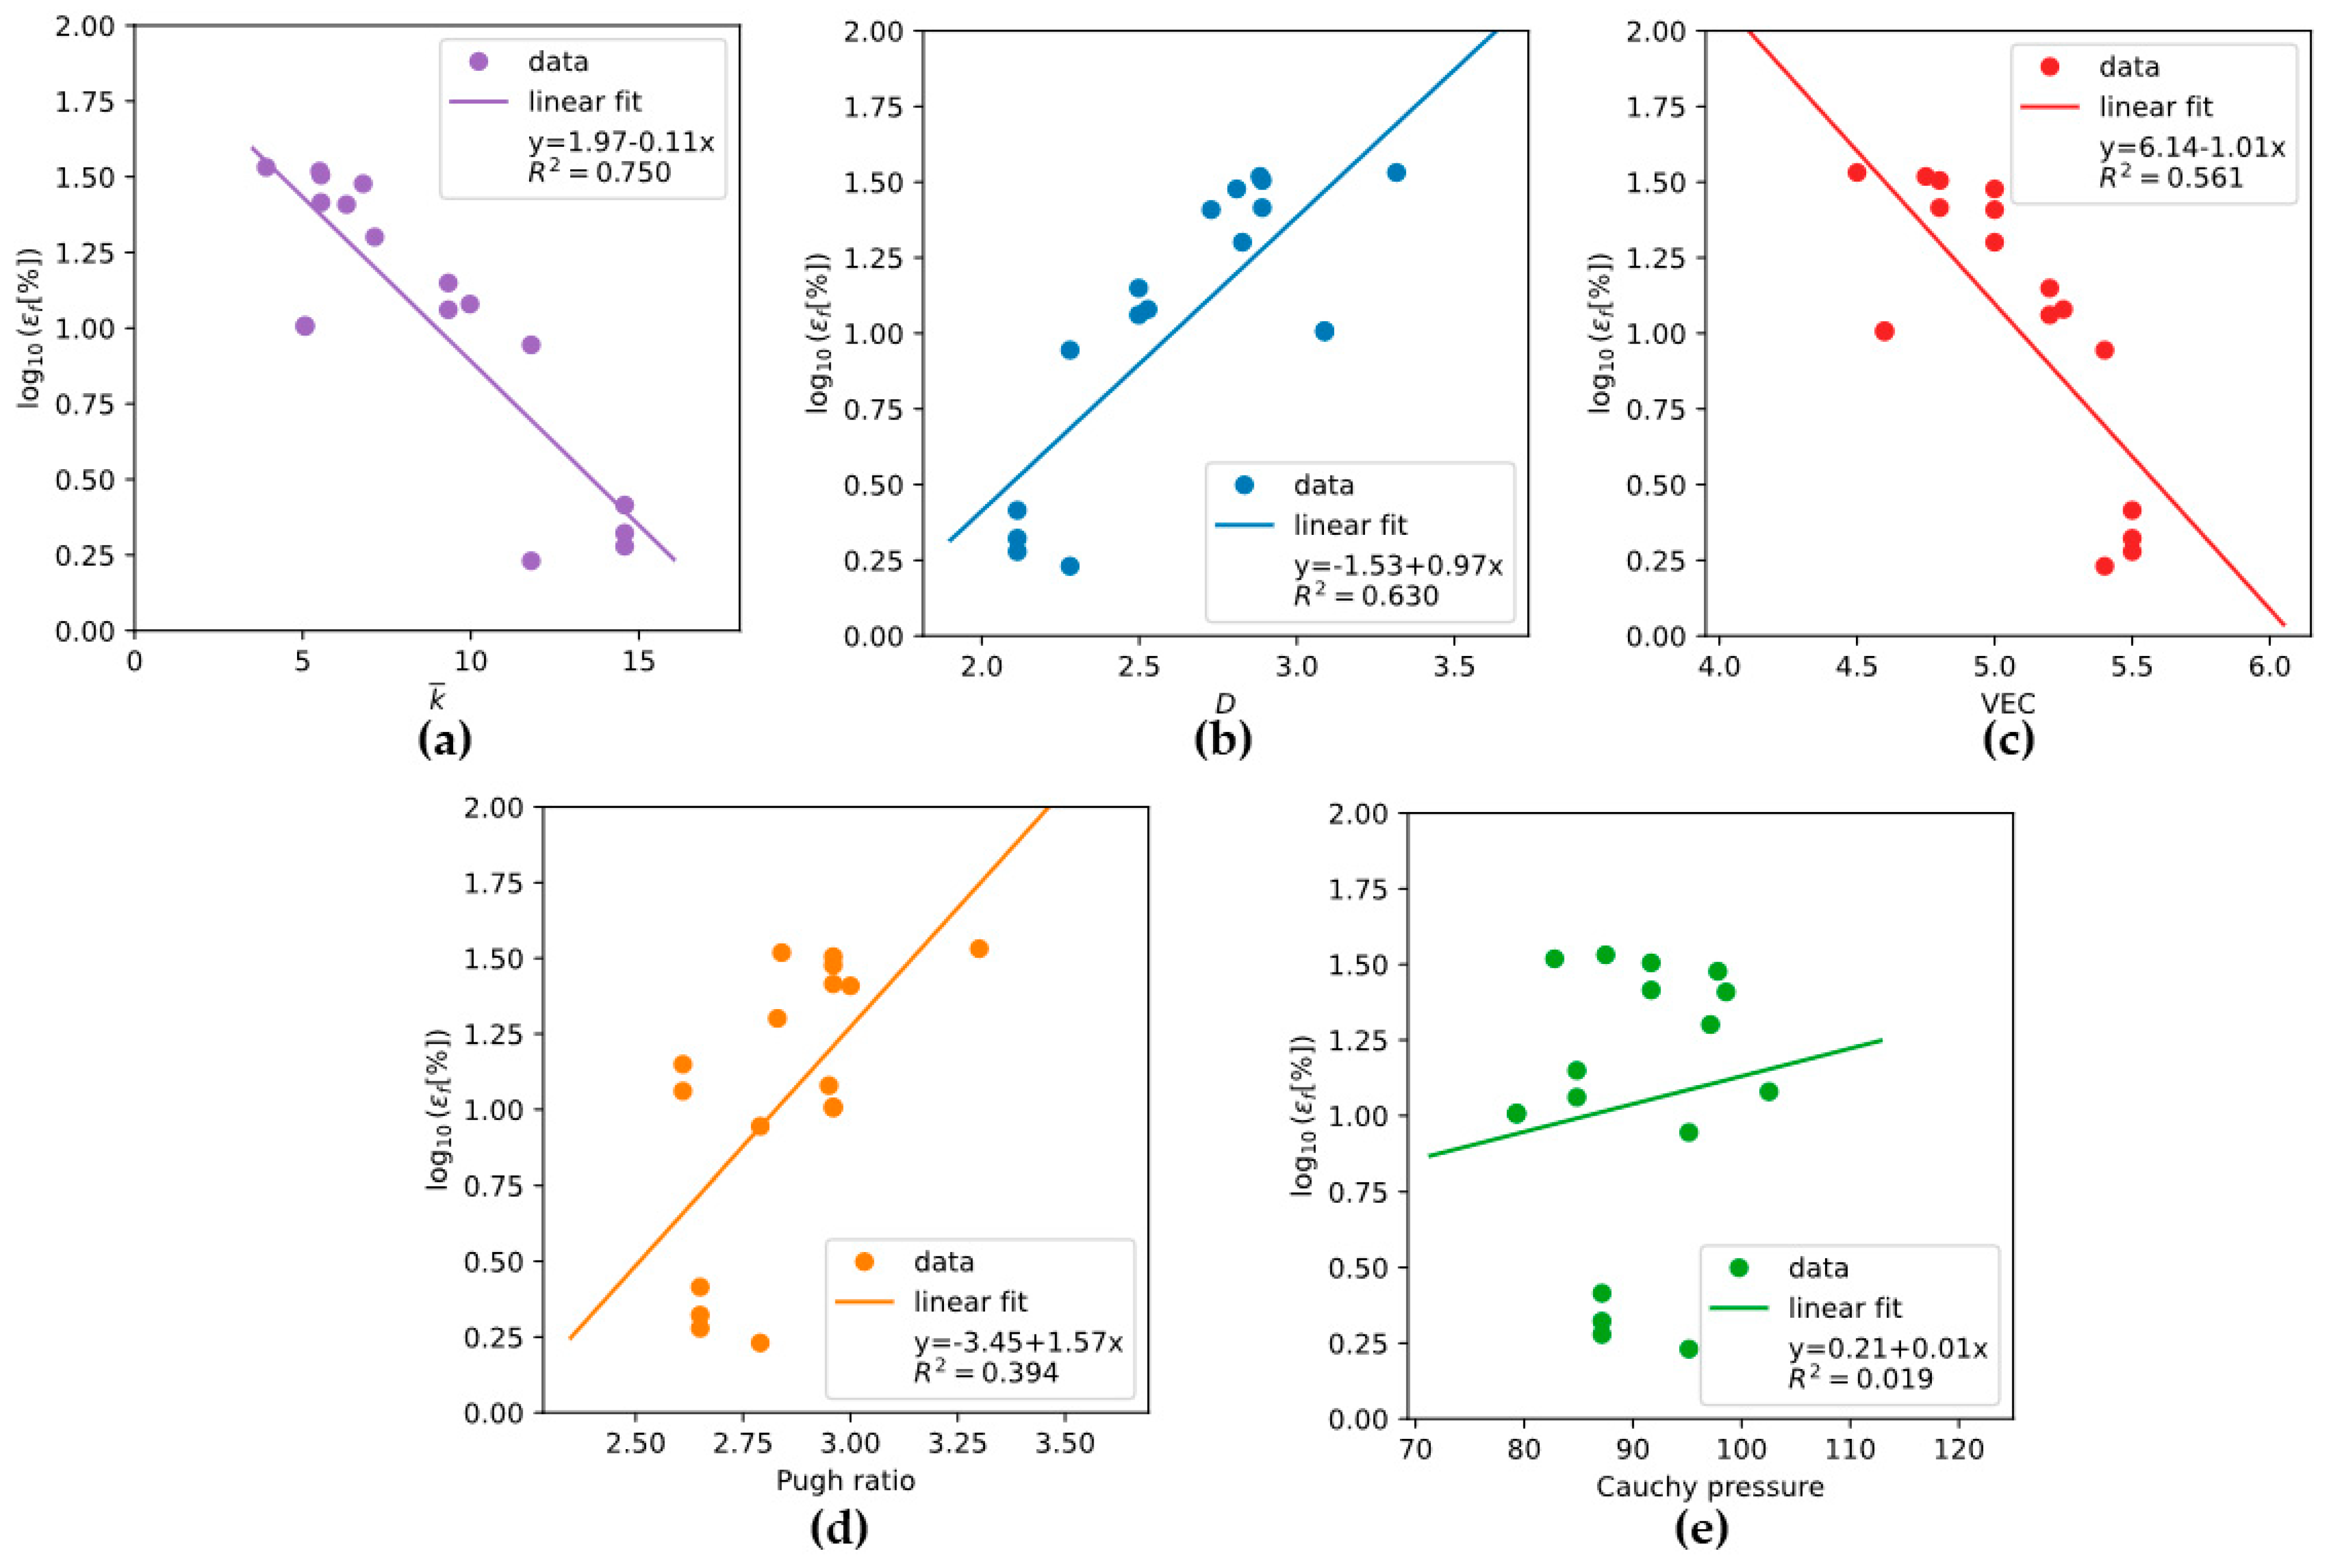
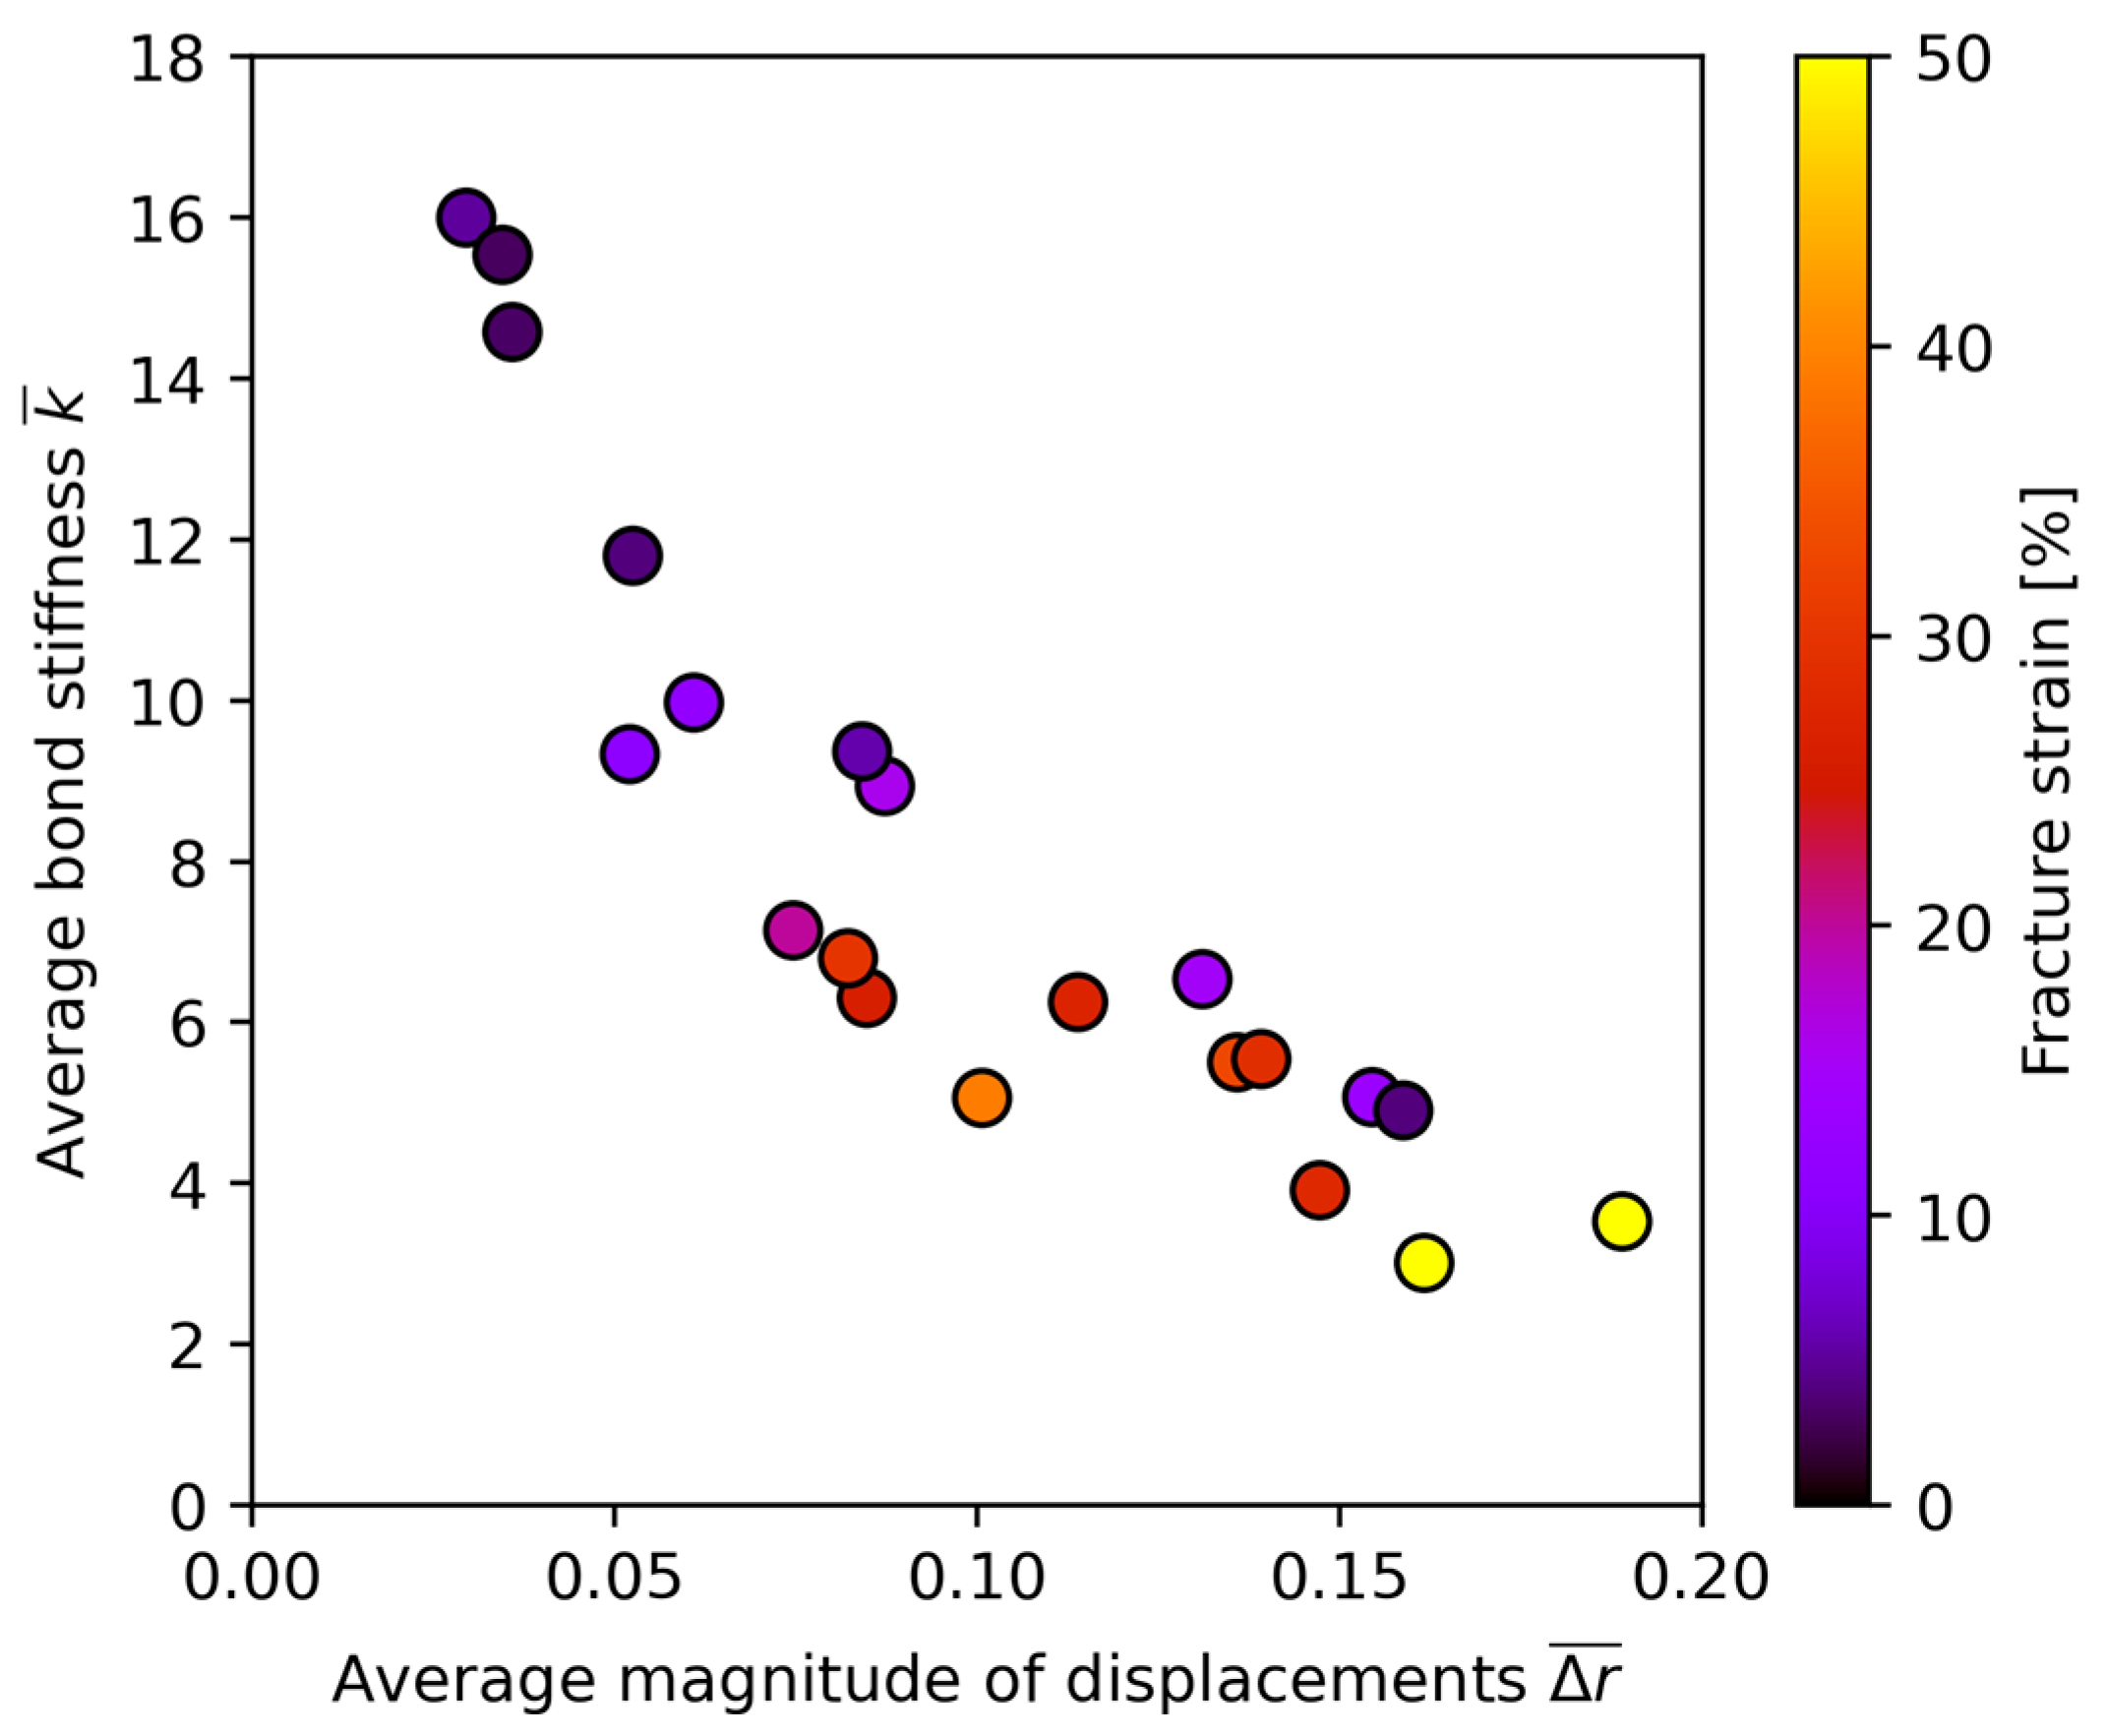
- Rule 1: Under constant , the alloy with lower should exhibit higher ductility;
- Rule 2: Under constant , the alloy with lower should exhibit higher ductility.
3. Results
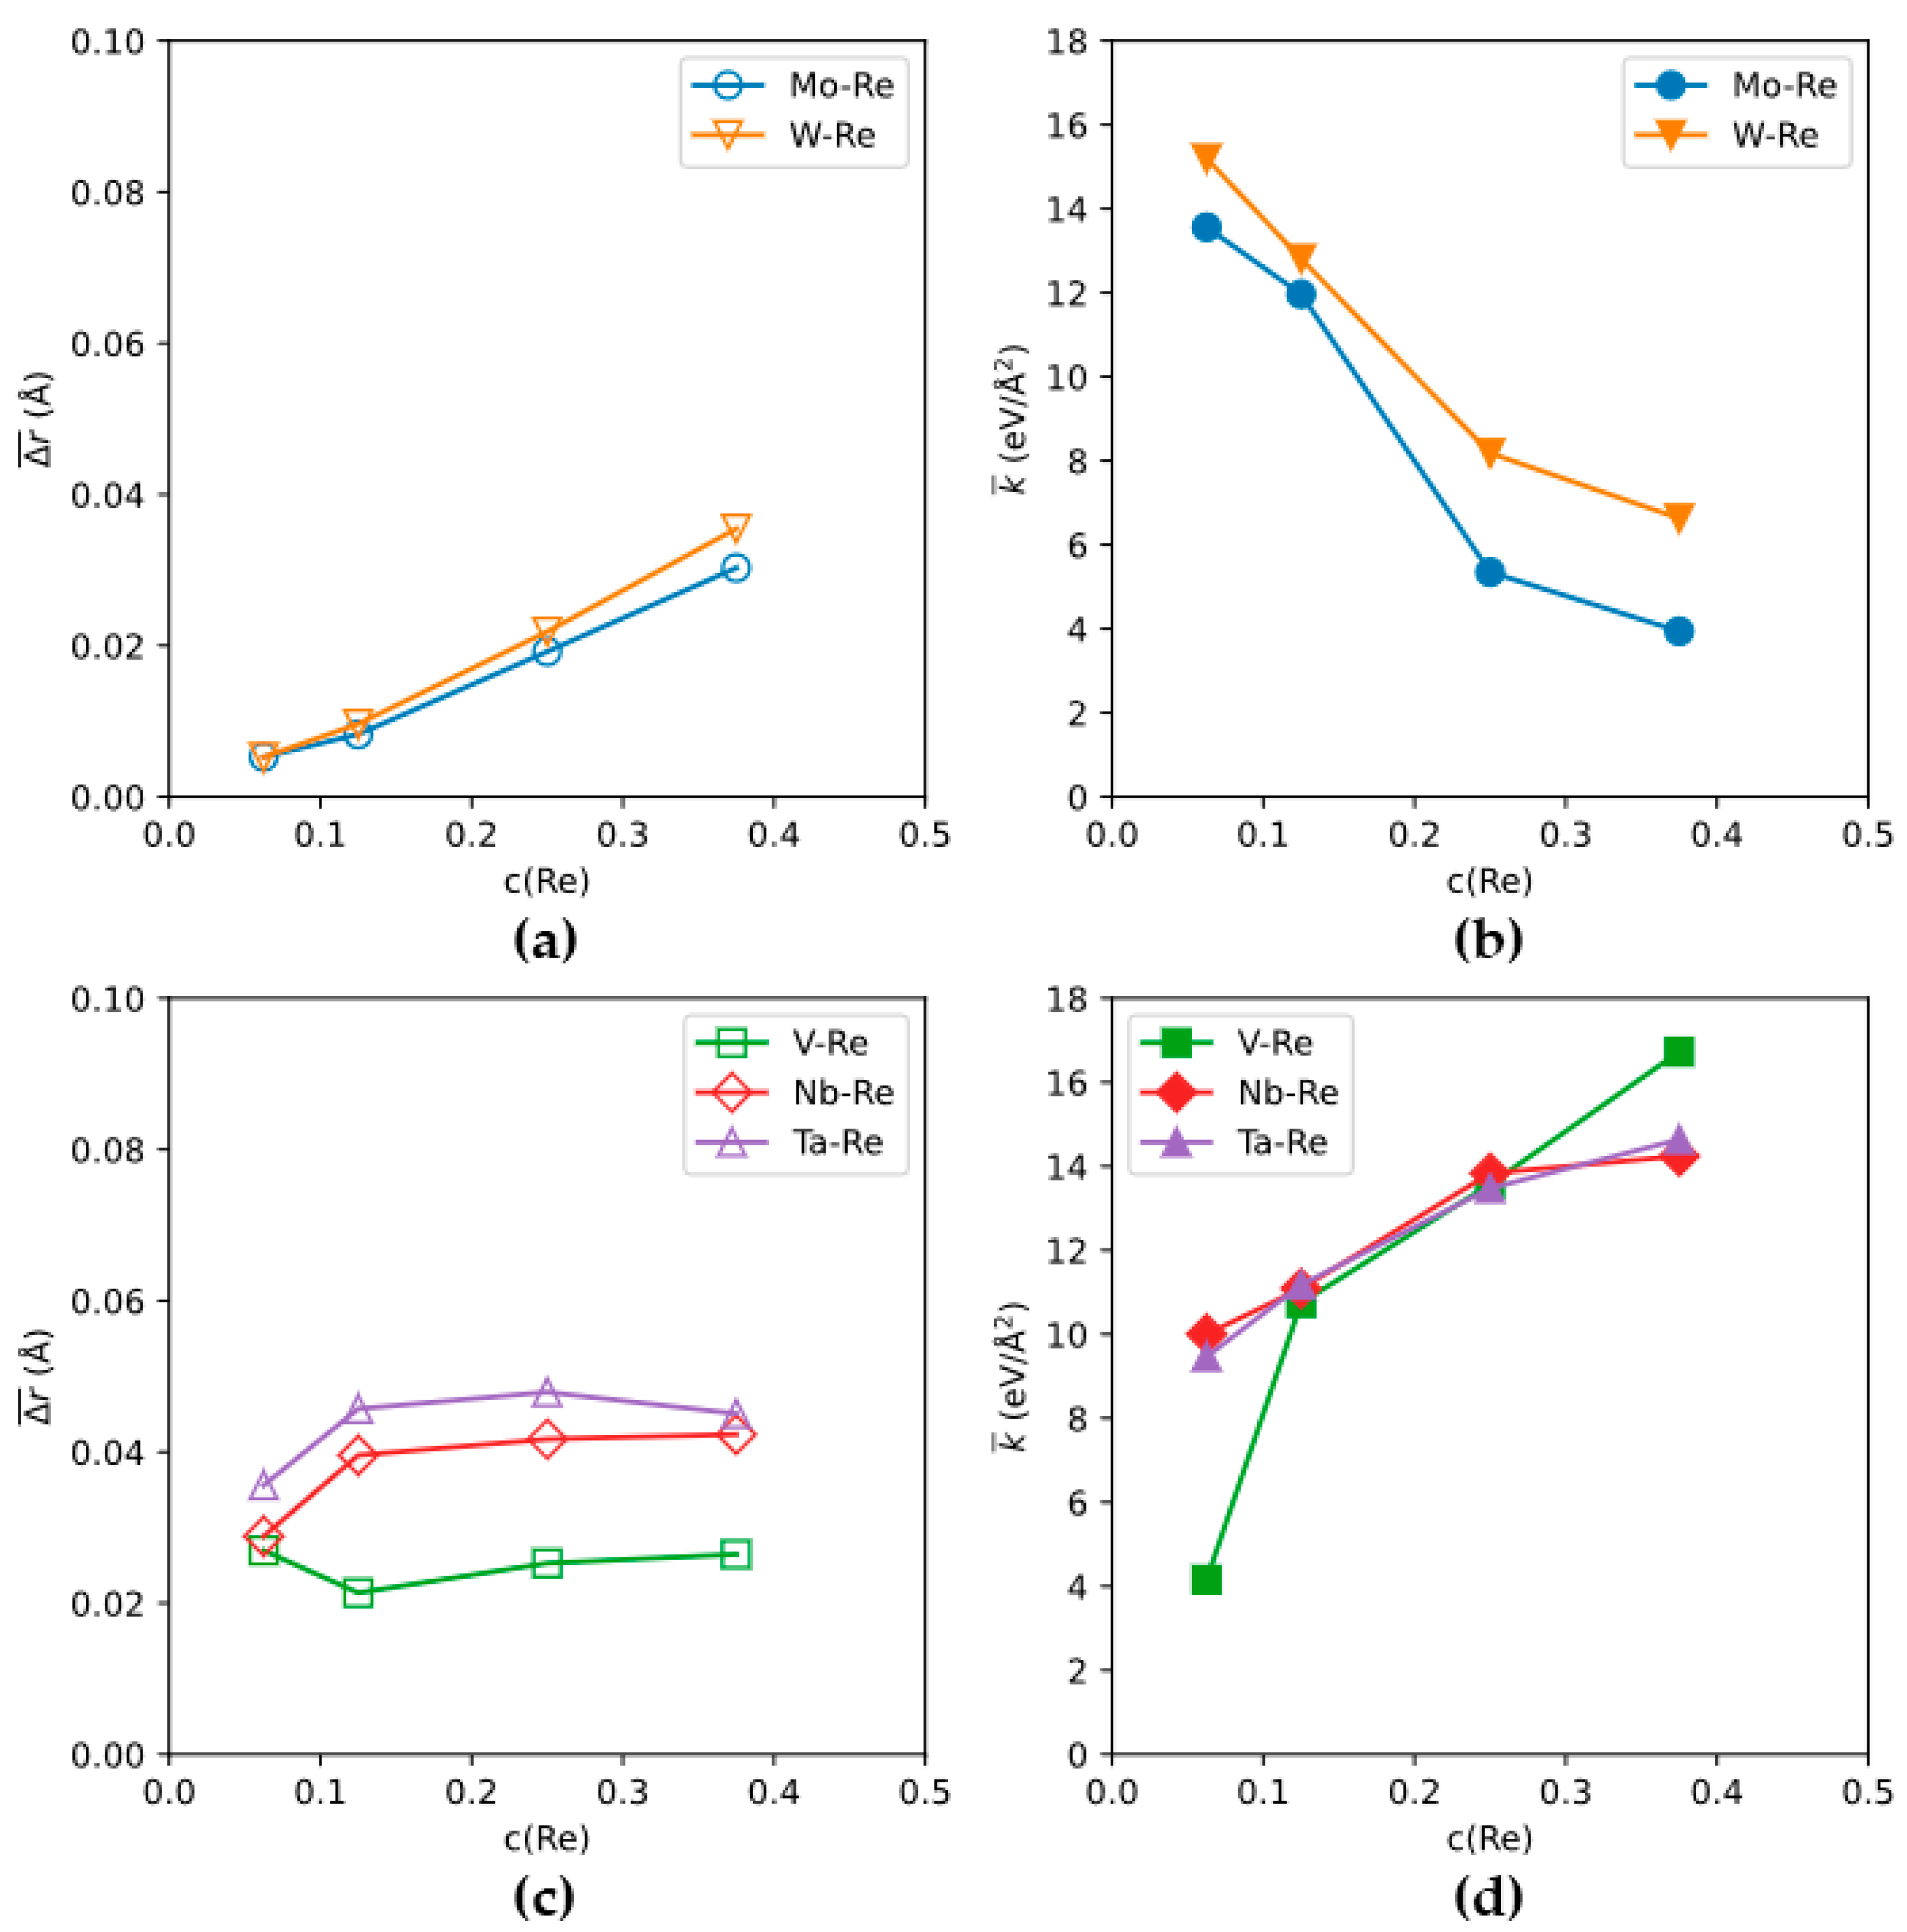
3.1. The “Rhenium Effect”
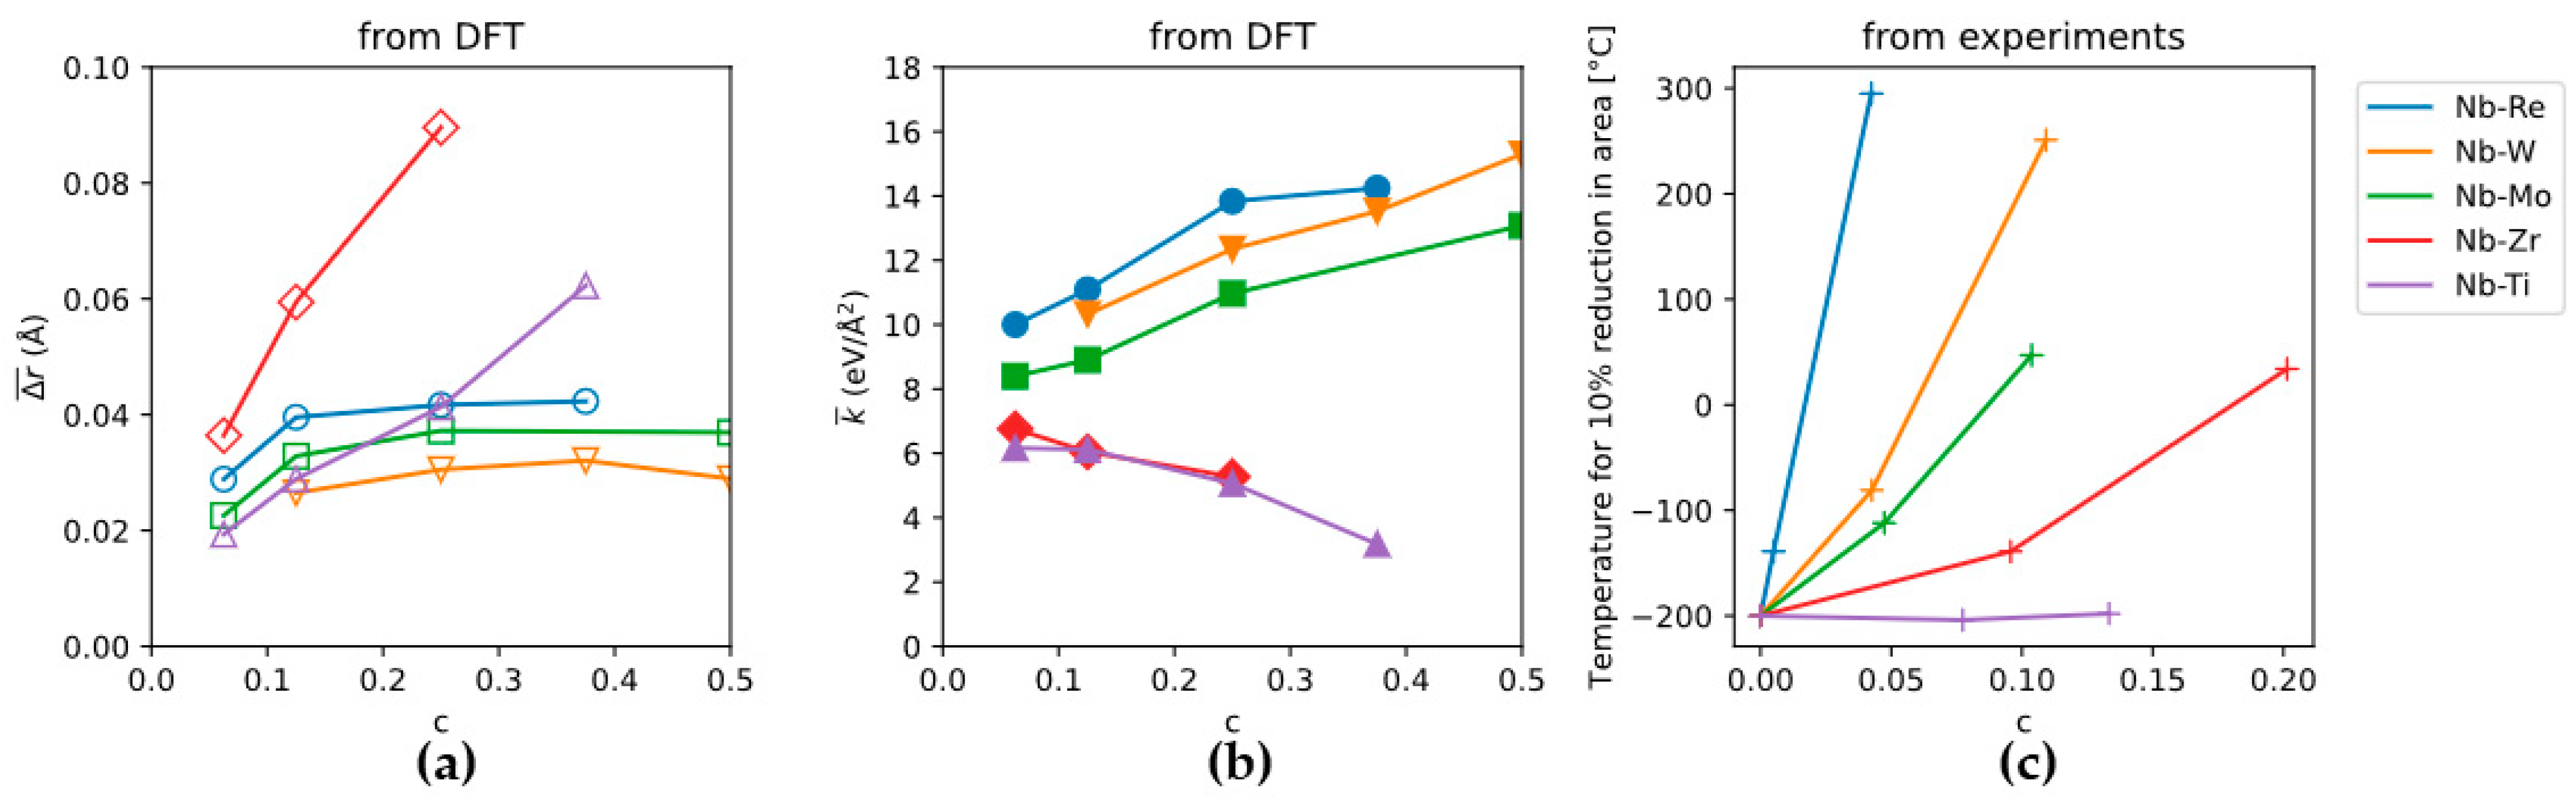
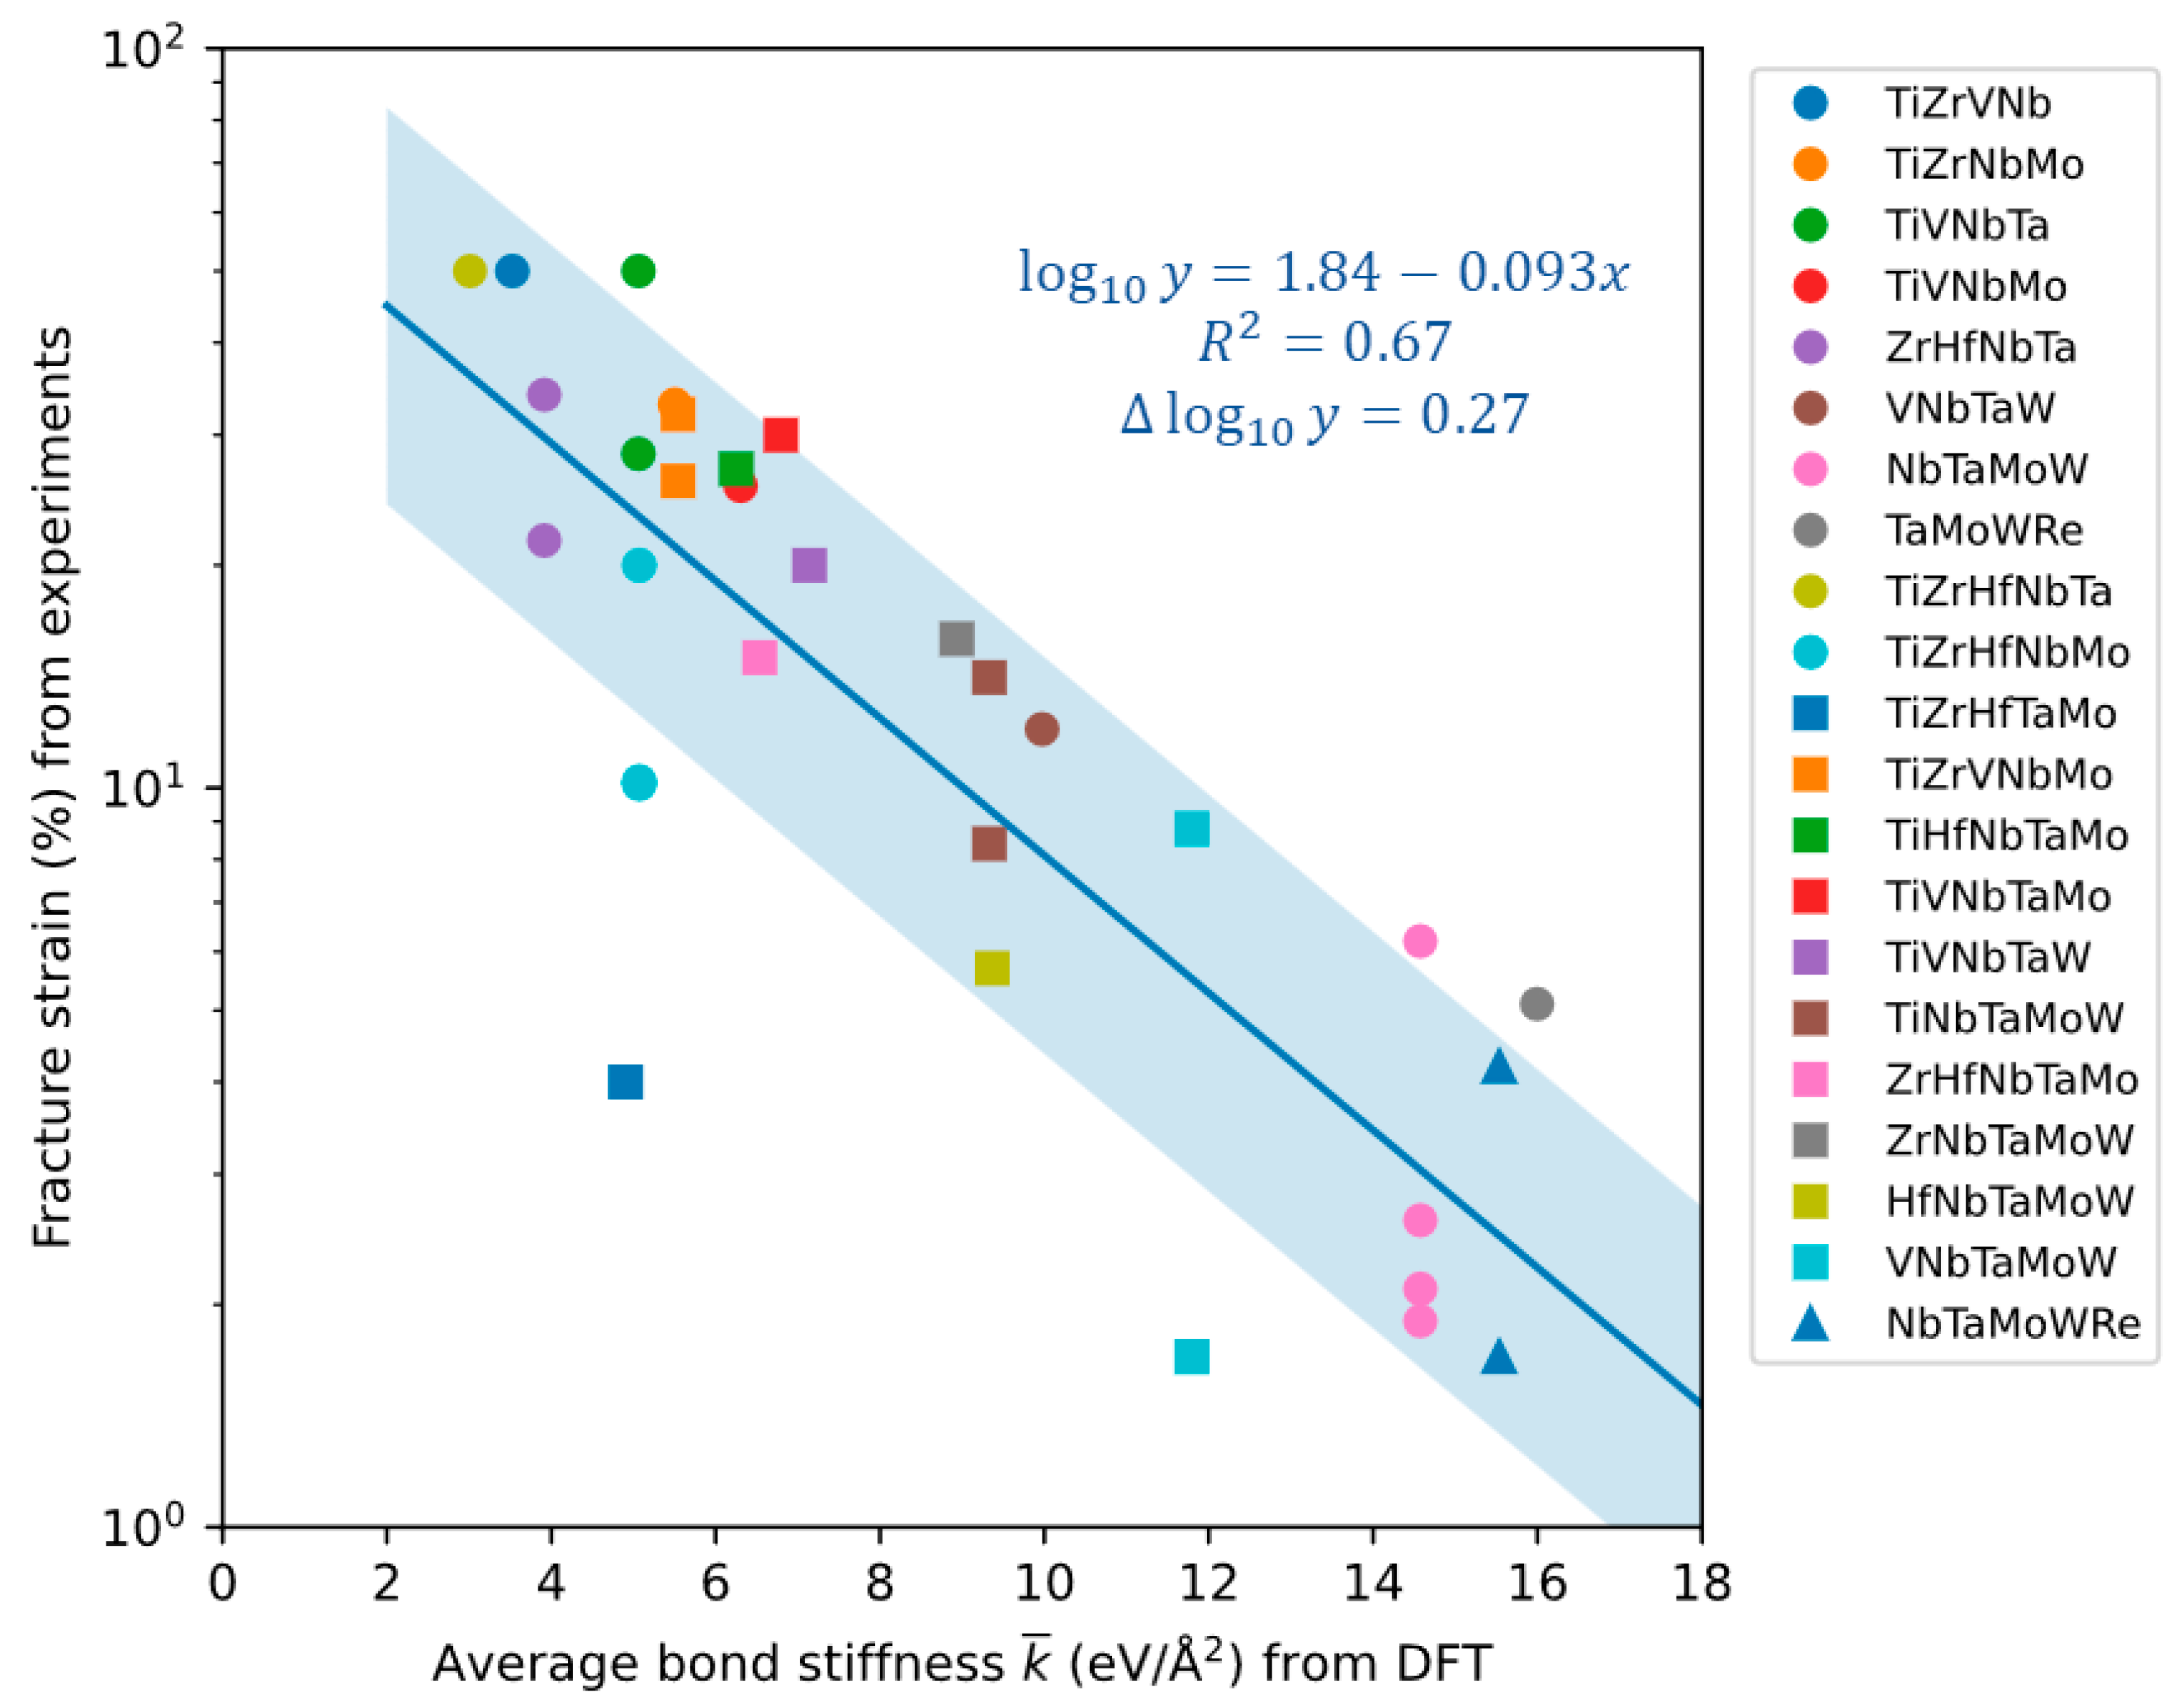
3.2. Bcc Refractory HEAs
4. Discussion
5. Conclusions
Author Contributions
Funding
Data Availability Statement
Acknowledgments
Conflicts of Interest
References
- Zhou, Y.; Xiang, H.; Dai, F. High-Entropy Materials; Wiley: New York, NY, USA, 2023. [Google Scholar]
- Yu, T.; Qi, L.; Ramprakash, S.; Wang, Y. Computational Studies on BCC Superalloys. Scr. Mater. 2025, 267, 116804. [Google Scholar] [CrossRef]
- Argon, A.S. Strengthening Mechanisms in Crystal Plasticity; Oxford University Press: Oxford, UK, 2008. [Google Scholar]
- Senkov, O.N.; Gorsse, S.; Miracle, D.B.; Rao, S.I.; Butler, T.M. Correlations to Improve High-Temperature Strength and Room Temperature Ductility of Refractory Complex Concentrated Alloys. Mater. Des. 2024, 239, 112762. [Google Scholar] [CrossRef]
- Wen, C.; Zhang, Y.; Wang, C.; Huang, H.; Wu, Y.; Lookman, T.; Su, Y. Machine-Learning-Assisted Compositional Design of Refractory High-Entropy Alloys with Optimal Strength and Ductility. Engineering 2025, 46, 214–223. [Google Scholar] [CrossRef]
- Savitskii, E.M.; Burkhanov, G.S. Physical Metallurgy of Refractory Metals and Alloys; Consultants Bureau: New York, NY, USA, 1970.
- Anderson, T.L. Fracture Mechanics; CRC Press: Boca Raton, FL, USA, 2017. [Google Scholar]
- Besson, J. Continuum Models of Ductile Fracture: A Review. Int. J. Damage Mech. 2010, 19, 3–52. [Google Scholar] [CrossRef]
- Singh, P.; Vela, B.; Ouyang, G.; Argibay, N.; Cui, J.; Arroyave, R.; Johnson, D.D. A Ductility Metric for Refractory-Based Multi-Principal-Element Alloys. Acta. Mater. 2023, 257, 119104. [Google Scholar] [CrossRef]
- Senkov, O.N.; Miracle, D.B.; Rao, S.I. Correlations to Improve Room Temperature Ductility of Refractory Complex Concentrated Alloys. Mater. Sci. Eng. A 2021, 820, 141512. [Google Scholar] [CrossRef]
- Hu, Y.-J.; Sundar, A.; Ogata, S.; Qi, L. Screening of Generalized Stacking Fault Energies, Surface Energies and Intrinsic Ductile Potency of Refractory Multicomponent Alloys. Acta. Mater. 2021, 210, 116800. [Google Scholar] [CrossRef]
- Gornostyrev, Y.N.; Katsnelson, M.I.; Peschanskikh, G.V.; Trefilov, A.V. On the Nature of the Rhenium Effect. Peculiarities of the Band Structure and Elastic Moduli of W- and Mo-Based Alloys. Phys. Status Solidi B 1991, 164, 185–193. [Google Scholar] [CrossRef]
- Borges, P.P.P.O.; Ritchie, R.O.; Asta, M. Electronic Descriptors for Dislocation Deformation Behavior and Intrinsic Ductility in Bcc High-Entropy Alloys. Sci. Adv. 2024, 10, eadp7670. [Google Scholar] [CrossRef]
- An, Z.; Li, A.; Mao, S.; Yang, T.; Zhu, L.; Wang, R.; Wu, Z.; Zhang, B.; Shao, R.; Jiang, C.; et al. Negative Mixing Enthalpy Solid Solutions Deliver High Strength and Ductility. Nature 2024, 625, 697–702. [Google Scholar] [CrossRef]
- Huang, X.; Zheng, L.; Xu, H.; Fu, H. Predicting and Understanding the Ductility of BCC High Entropy Alloys via Knowledge-Integrated Machine Learning. Mater. Des. 2024, 239, 112797. [Google Scholar] [CrossRef]
- Kresse, G.; Furthmüller, J. Efficiency of Ab-Initio Total Energy Calculations for Metals and Semiconductors Using a Plane-Wave Basis Set. Comput. Mater. Sci. 1996, 6, 15–50. [Google Scholar] [CrossRef]
- Kresse, G.; Furthmüller, J. Efficient Iterative Schemes for Ab Initio Total-Energy Calculations Using a Plane-Wave Basis Set. Phys. Rev. B 1996, 54, 11169–11186. [Google Scholar] [CrossRef]
- Kohn, W.; Sham, L.J. Self-Consistent Equations Including Exchange and Correlation Effects. Phys. Rev. 1965, 140, A1133–A1138. [Google Scholar] [CrossRef]
- Blöchl, P.E. Projector Augmented-Wave Method. Phys. Rev. B 1994, 50, 17953–17979. [Google Scholar] [CrossRef] [PubMed]
- Kresse, G.; Joubert, D. From Ultrasoft Pseudopotentials to the Projector Augmented-Wave Method. Phys. Rev. B 1999, 59, 1758–1775. [Google Scholar] [CrossRef]
- Perdew, J.P.; Ruzsinszky, A.; Csonka, G.I.; Vydrov, O.A.; Scuseria, G.E.; Constantin, L.A.; Zhou, X.; Burke, K. Restoring the Density-Gradient Expansion for Exchange in Solids and Surfaces. Phys. Rev. Lett. 2008, 100, 136406. [Google Scholar] [CrossRef] [PubMed]
- Monkhorst, H.J.; Pack, J.D. Special Points for Brillouin-Zone Integrations. Phys. Rev. B 1976, 13, 5188–5192. [Google Scholar] [CrossRef]
- Methfessel, M.; Paxton, A.T. High-Precision Sampling for Brillouin-Zone Integration in Metals. Phys. Rev. B 1989, 40, 3616–3621. [Google Scholar] [CrossRef]
- Pant, D.; Aidhy, D.S. Electronic Density of States as the Descriptor of Elastic Bond Strength, Ductility, and Local Lattice Distortion in BCC Refractory Alloys. Mater. Des. 2025, 253, 113885. [Google Scholar] [CrossRef]
- Buckman, R.W. Rhenium as an Alloy Addition to the Group VA Metals. In Rhenium and Rhenium Alloys: Proceedings of the International Symposium on Rhenium and Rhenium Alloys; Bryskin, B.D., Ed.; TMS: Warrendale, PA, USA, 1997; pp. 629–638. [Google Scholar]
- Begley, R.T. Columbium Alloy Development at Westinghouse. In Evolution of Refractory Metals and Alloys; Dalder, E.N.C., Grobstein, T., Olsen, C.S., Eds.; TMS: Warrendale, PA, USA, 1994; pp. 29–48. [Google Scholar]
- Mak, E.; Yin, B.; Curtin, W.A. A Ductility Criterion for Bcc High Entropy Alloys. J. Mech. Phys. Solids 2021, 152, 104389. [Google Scholar] [CrossRef]
- Temesi, O.K.; Varga, L.K.; Chinh, N.Q.; Vitos, L. Ductility Index for Refractory High Entropy Alloys. Crystals 2024, 14, 838. [Google Scholar] [CrossRef]
- Senkov, O.N.; Rao, S.; Chaput, K.J.; Woodward, C. Compositional Effect on Microstructure and Properties of NbTiZr-Based Complex Concentrated Alloys. Acta Mater. 2018, 151, 201–215. [Google Scholar] [CrossRef]
- Wu, Y.D.; Cai, Y.H.; Chen, X.H.; Wang, T.; Si, J.J.; Wang, L.; Wang, Y.D.; Hui, X.D. Phase Composition and Solid Solution Strengthening Effect in TiZrNbMoV High-Entropy Alloys. Mater. Des. 2015, 83, 651–660. [Google Scholar] [CrossRef]
- Zhang, Y.; Yang, X.; Liaw, P.K. Alloy Design and Properties Optimization of High-Entropy Alloys. JOM 2012, 64, 830–838. [Google Scholar] [CrossRef]
- Yao, H.W.; Qiao, J.W.; Gao, M.C.; Hawk, J.A.; Ma, S.G.; Zhou, H.F.; Zhang, Y. NbTaV-(Ti,W) Refractory High-Entropy Alloys: Experiments and Modeling. Mater. Sci. Eng. A 2016, 674, 203–211. [Google Scholar] [CrossRef]
- Guo, W.; Liu, B.; Liu, Y.; Li, T.; Fu, A.; Fang, Q.; Nie, Y. Microstructures and Mechanical Properties of Ductile NbTaTiV Refractory High Entropy Alloy Prepared by Powder Metallurgy. J. Alloys Compd. 2019, 776, 428–436. [Google Scholar] [CrossRef]
- Chen, S.; Yang, X.; Dahmen, K.; Liaw, P.; Zhang, Y. Microstructures and Crackling Noise of AlxNbTiMoV High Entropy Alloys. Entropy 2014, 16, 870–884. [Google Scholar] [CrossRef]
- Maiti, S.; Steurer, W. Structural-Disorder and Its Effect on Mechanical Properties in Single-Phase TaNbHfZr High-Entropy Alloy. Acta Mater. 2016, 106, 87–97. [Google Scholar] [CrossRef]
- Senkov, O.N.; Wilks, G.B.; Scott, J.M.; Miracle, D.B. Mechanical Properties of Nb25Mo25Ta25W25 and V20Nb20Mo20Ta20W20 Refractory High Entropy Alloys. Intermetallics 2011, 19, 698–706. [Google Scholar] [CrossRef]
- Han, Z.D.; Chen, N.; Zhao, S.F.; Fan, L.W.; Yang, G.N.; Shao, Y.; Yao, K.F. Effect of Ti Additions on Mechanical Properties of NbMoTaW and VNbMoTaW Refractory High Entropy Alloys. Intermetallics 2017, 84, 153–157. [Google Scholar] [CrossRef]
- Han, Z.D.; Luan, H.W.; Liu, X.; Chen, N.; Li, X.Y.; Shao, Y.; Yao, K.F. Microstructures and Mechanical Properties of TixNbMoTaW Refractory High-Entropy Alloys. Mater. Sci. Eng. A 2018, 712, 380–385. [Google Scholar] [CrossRef]
- Zhang, J.; Hu, Y.; Wei, Q.; Xiao, Y.; Chen, P.; Luo, G.; Shen, Q. Microstructure and Mechanical Properties of RexNbMoTaW High-Entropy Alloys Prepared by Arc Melting Using Metal Powders. J. Alloys Compd. 2020, 827, 154301. [Google Scholar] [CrossRef]
- Wan, Y.; Wang, Q.; Mo, J.; Zhang, Z.; Wang, X.; Liang, X.; Shen, B. WReTaMo Refractory High-Entropy Alloy with High Strength at 1600 °C. Adv. Eng. Mater. 2022, 24, 2100765. [Google Scholar] [CrossRef]
- Senkov, O.N.; Scott, J.M.; Senkova, S.V.; Miracle, D.B.; Woodward, C.F. Microstructure and Room Temperature Properties of a High-Entropy TaNbHfZrTi Alloy. J. Alloys Compd. 2011, 509, 6043–6048. [Google Scholar] [CrossRef]
- Juan, C.-C.; Tseng, K.-K.; Hsu, W.-L.; Tsai, M.-H.; Tsai, C.-W.; Lin, C.-M.; Chen, S.-K.; Lin, S.-J.; Yeh, J.-W. Solution Strengthening of Ductile Refractory HfMo x NbTaTiZr High-Entropy Alloys. Mater. Lett. 2016, 175, 284–287. [Google Scholar] [CrossRef]
- Guo, N.N.; Wang, L.; Luo, L.S.; Li, X.Z.; Chen, R.R.; Su, Y.Q.; Guo, J.J.; Fu, H.Z. Effect of Composing Element on Microstructure and Mechanical Properties in Mo–Nb–Hf–Zr–Ti Multi-Principle Component Alloys. Intermetallics 2016, 69, 13–20. [Google Scholar] [CrossRef]
- Guo, N.N.; Wang, L.; Luo, L.S.; Li, X.Z.; Su, Y.Q.; Guo, J.J.; Fu, H.Z. Microstructure and Mechanical Properties of Refractory MoNbHfZrTi High-Entropy Alloy. Mater. Des. 2015, 81, 87–94. [Google Scholar] [CrossRef]
- Tseng, K.-K.; Juan, C.-C.; Tso, S.; Chen, H.-C.; Tsai, C.-W.; Yeh, J.-W. Effects of Mo, Nb, Ta, Ti, and Zr on Mechanical Properties of Equiatomic Hf-Mo-Nb-Ta-Ti-Zr Alloys. Entropy 2018, 21, 15. [Google Scholar] [CrossRef]
- Yao, H.W.; Qiao, J.W.; Hawk, J.A.; Zhou, H.F.; Chen, M.W.; Gao, M.C. Mechanical Properties of Refractory High-Entropy Alloys: Experiments and Modeling. J. Alloys Compd. 2017, 696, 1139–1150. [Google Scholar] [CrossRef]
- Kang, B.; Lee, J.; Ryu, H.J.; Hong, S.H. Ultra-High Strength WNbMoTaV High-Entropy Alloys with Fine Grain Structure Fabricated by Powder Metallurgical Process. Mater. Sci. Eng. A 2018, 712, 616–624. [Google Scholar] [CrossRef]
- Yan, D.; Song, K.; Sun, H.; Wu, S.; Zhao, K.; Zhang, H.; Yuan, S.; Kim, J.T.; Chawake, N.; Renk, O.; et al. Microstructures, Mechanical Properties, and Corrosion Behaviors of Refractory High-Entropy ReTaWNbMo Alloys. J. Mater. Eng. Perform. 2020, 29, 399–409. [Google Scholar] [CrossRef]
- Belcher, C.H.; MacDonald, B.E.; Apelian, D.; Lavernia, E.J. The Role of Interstitial Constituents in Refractory Complex Concentrated Alloys. Prog. Mater. Sci. 2023, 137, 101140. [Google Scholar] [CrossRef]

| Alloy | (%) Experimental | (eV/Å2) from DFT | (Å) from DFT |
|---|---|---|---|
| TiZrVNb | >50 [29], 50 [30] | 3.53 | 0.189 |
| TiZrNbMo * | 33 [31] | 5.50 | 0.136 |
| TiVNbTa | >50 [32], 28.3 [33] | 5.06 | 0.101 |
| TiVNbMo * | 25.6 [34] | 6.30 | 0.085 |
| ZrHfNbTa * | 34 [35] | 3.91 | 0.147 |
| VNbTaW * | 12 [32] | 9.97 | 0.061 |
| NbTaMoW * | 2.1 [36], 2.6 [37], 1.9 [38], 6.2 [39] | 14.58 | 0.036 |
| TaMoWRe | 5.1 [40] | 16.00 | 0.029 |
| TiZrHfNbTa | >50 [41,42] | 3.01 | 0.162 |
| TiZrHfNbMo * | 10.12 [43], 10.2 [44], 20 [45] | 5.07 | 0.155 |
| TiZrHfTaMo | 4 [45] | 4.91 | 0.159 |
| TiZrVNbMo * | 26 [31], 32 [30] | 5.54 | 0.139 |
| TiHfNbTaMo | 27 [45] | 6.25 | 0.114 |
| TiVNbTaMo * | 30 [46] | 6.80 | 0.082 |
| TiVNbTaW * | 20 [32], 14.1 [37] | 7.14 | 0.075 |
| TiNbTaMoW * | 8.4 [38] | 9.33 | 0.052 |
| ZrHfNbTaMo | 15 [45] | 6.54 | 0.131 |
| ZrNbTaMoW | 15.9 [45] | 8.93 | 0.087 |
| HfNbTaMoW | 5.7 [47] | 9.37 | 0.084 |
| VNbTaMoW * | 1.7 [36], 8.8 [37], 1.7 [47] | 11.80 | 0.052 |
| NbTaMoWRe | 4.2 [39], 1.7 [48] | 15.53 | 0.035 |
Disclaimer/Publisher’s Note: The statements, opinions and data contained in all publications are solely those of the individual author(s) and contributor(s) and not of MDPI and/or the editor(s). MDPI and/or the editor(s) disclaim responsibility for any injury to people or property resulting from any ideas, methods, instructions or products referred to in the content. |
© 2025 by the authors. Licensee MDPI, Basel, Switzerland. This article is an open access article distributed under the terms and conditions of the Creative Commons Attribution (CC BY) license (https://creativecommons.org/licenses/by/4.0/).
Share and Cite
Yan, J.; Fu, C. Understanding Room-Temperature Ductility of Bcc Refractory Alloys from Their Atomistic-Level Features. Metals 2025, 15, 851. https://doi.org/10.3390/met15080851
Yan J, Fu C. Understanding Room-Temperature Ductility of Bcc Refractory Alloys from Their Atomistic-Level Features. Metals. 2025; 15(8):851. https://doi.org/10.3390/met15080851
Chicago/Turabian StyleYan, Jiayi, and Cheng Fu. 2025. "Understanding Room-Temperature Ductility of Bcc Refractory Alloys from Their Atomistic-Level Features" Metals 15, no. 8: 851. https://doi.org/10.3390/met15080851
APA StyleYan, J., & Fu, C. (2025). Understanding Room-Temperature Ductility of Bcc Refractory Alloys from Their Atomistic-Level Features. Metals, 15(8), 851. https://doi.org/10.3390/met15080851