
Cr-Si Alloys with Very Low Impurity Levels Prepared by Optical Floating Zone Technique

 , and
, and
Abstract
1. Introduction
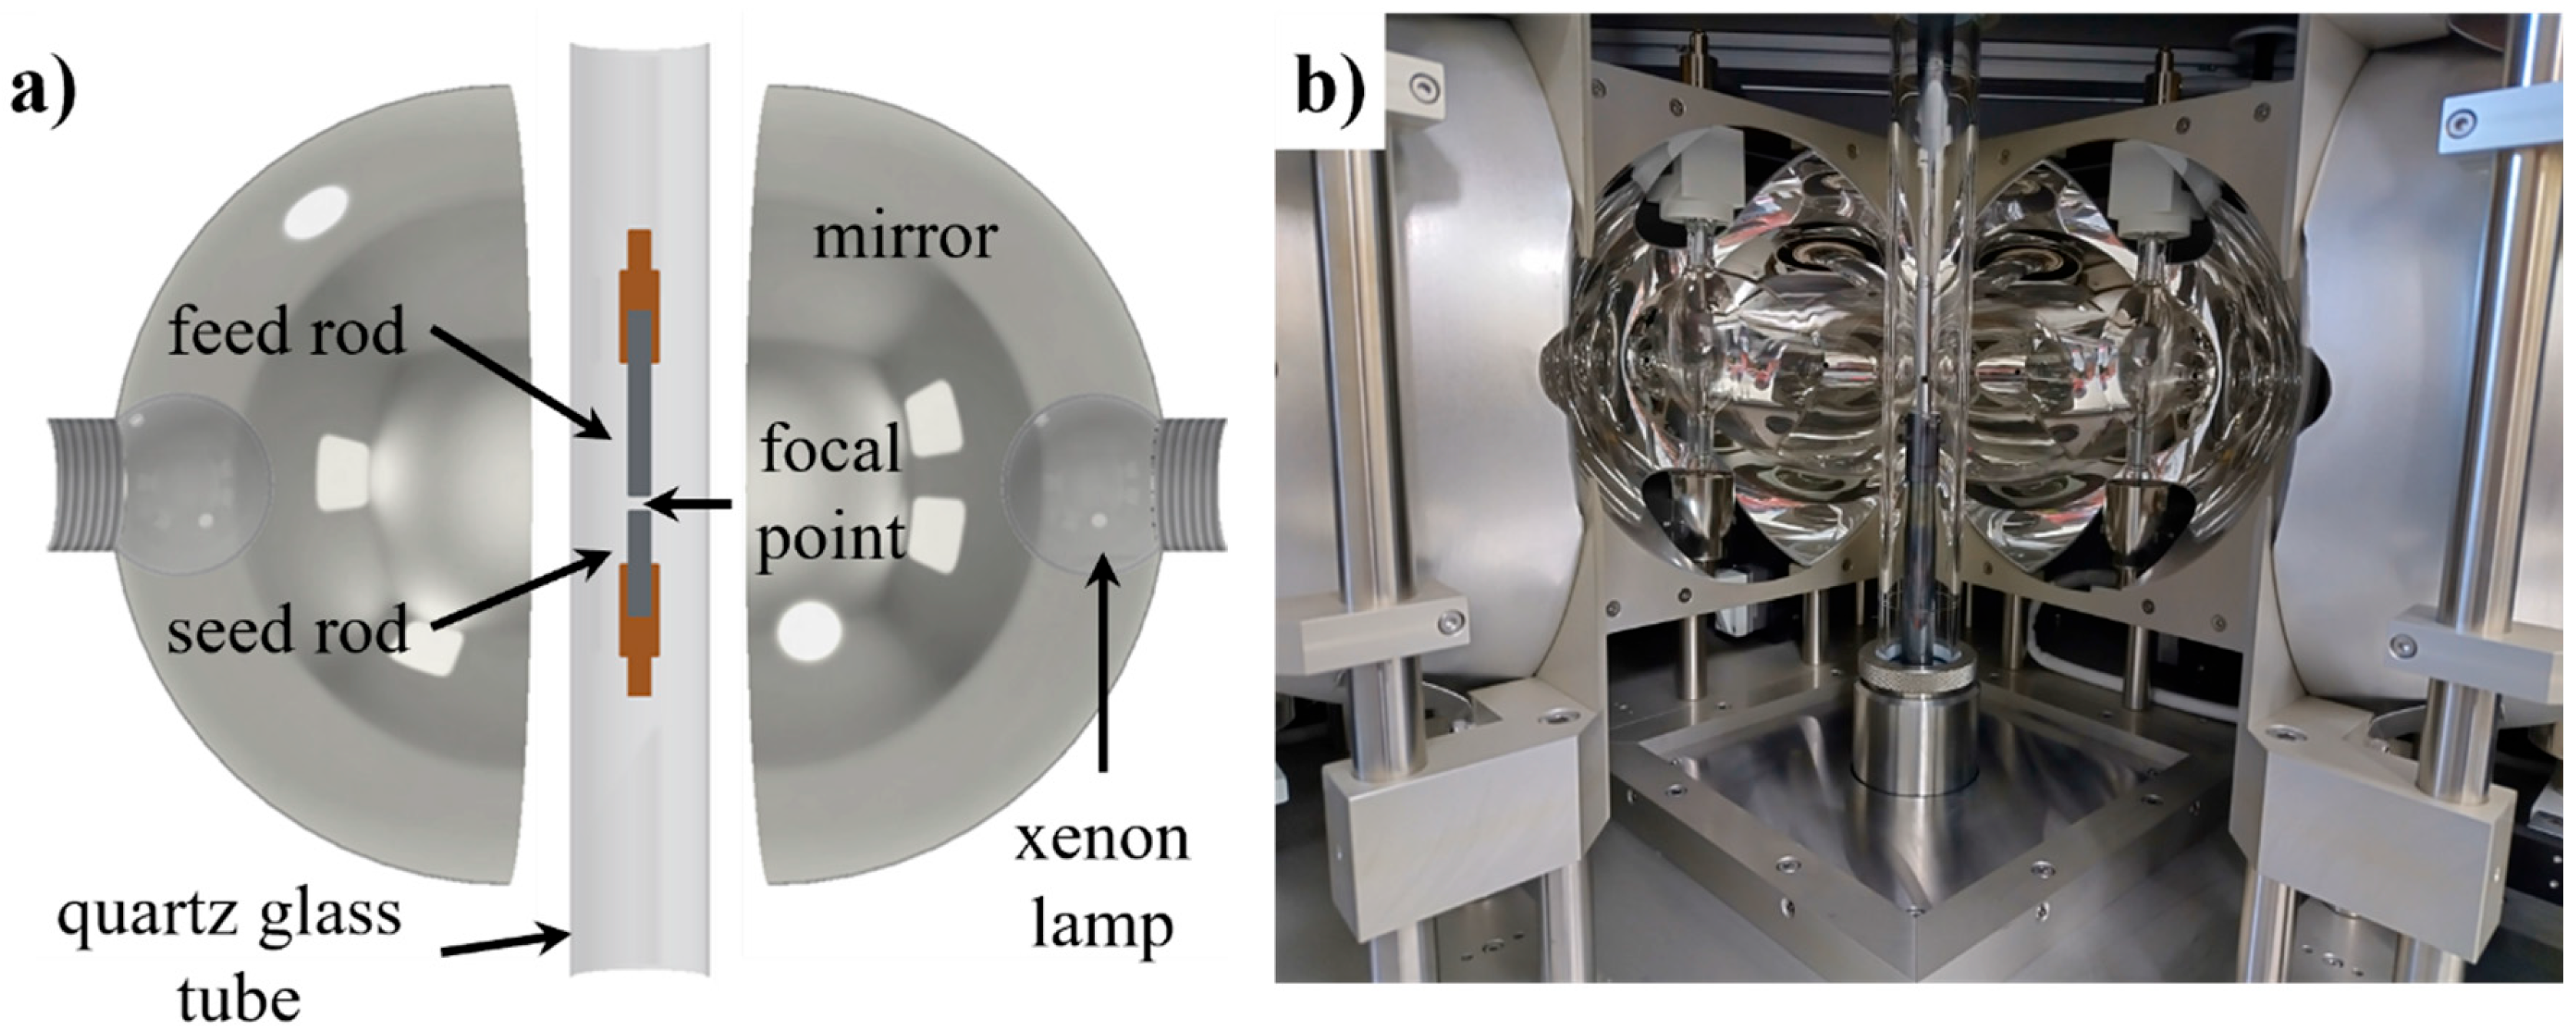
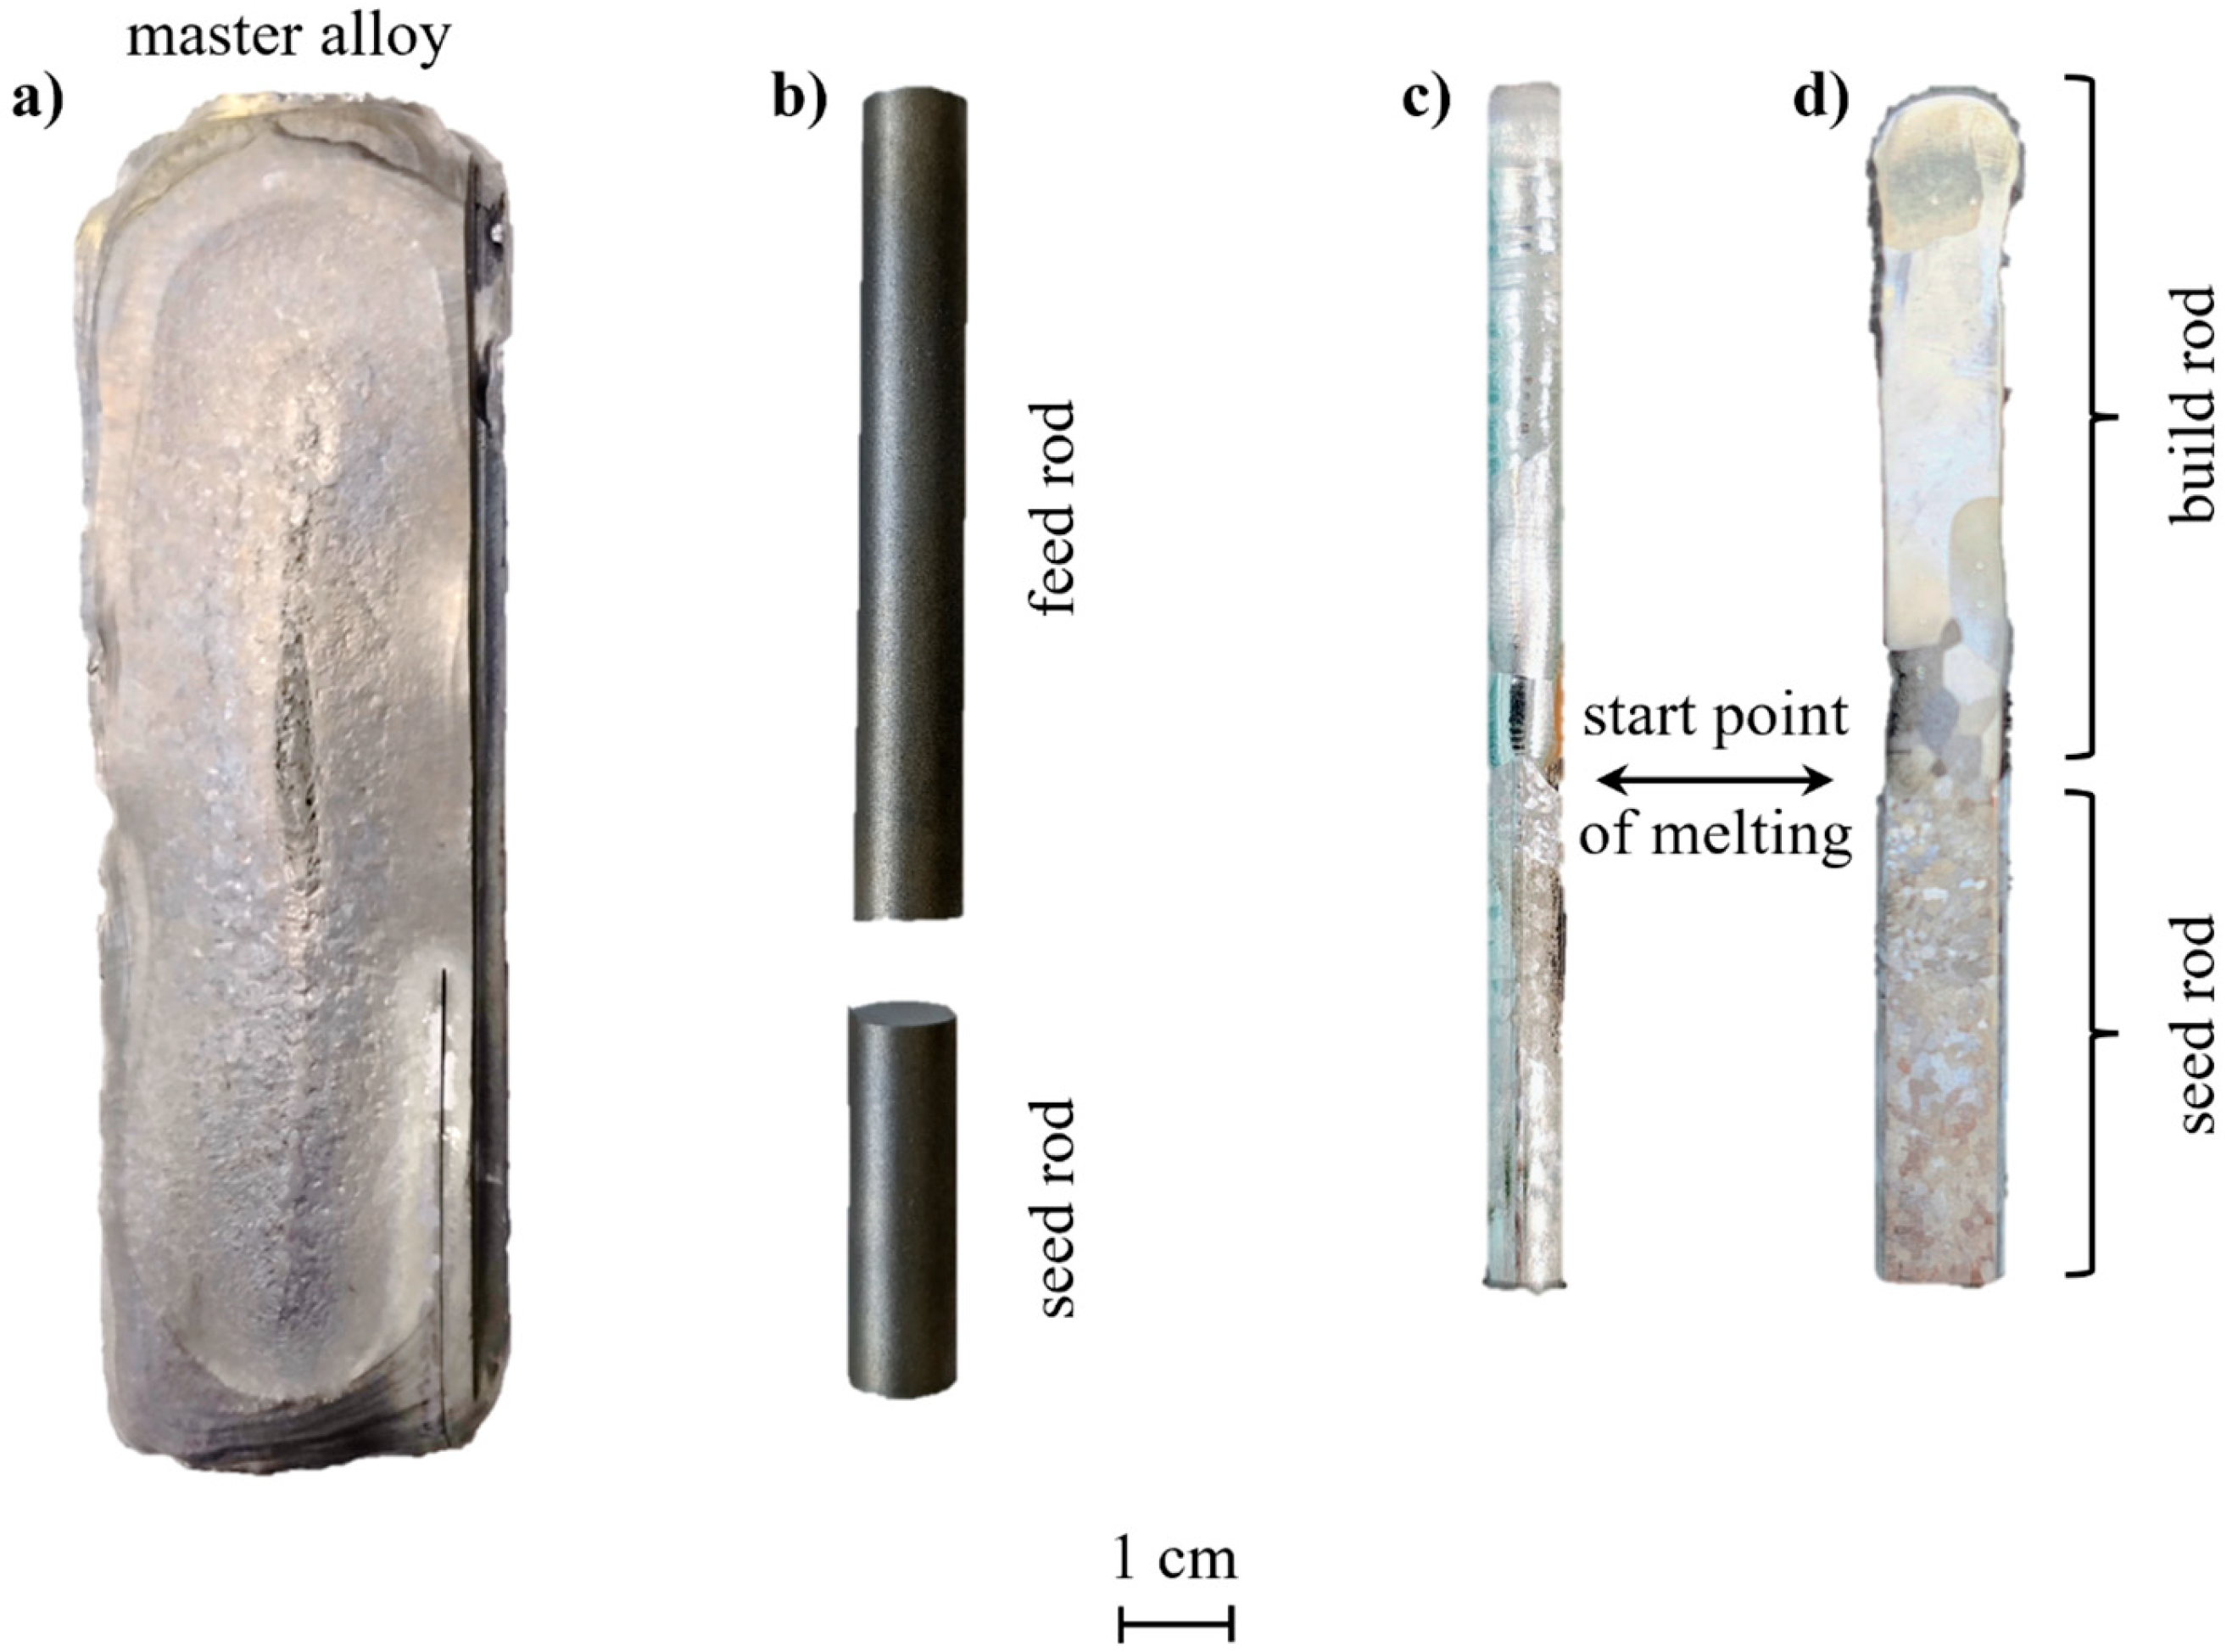
2. Materials and Methods

| Properties | Limits for Which Equation (1) Is Applicable |
|---|---|
| Vickers hardness HV in | 1…70 |
| fracture toughness KIC in | 0.9…16 |
| Poisson’s ratio | 0.2…0.3 |
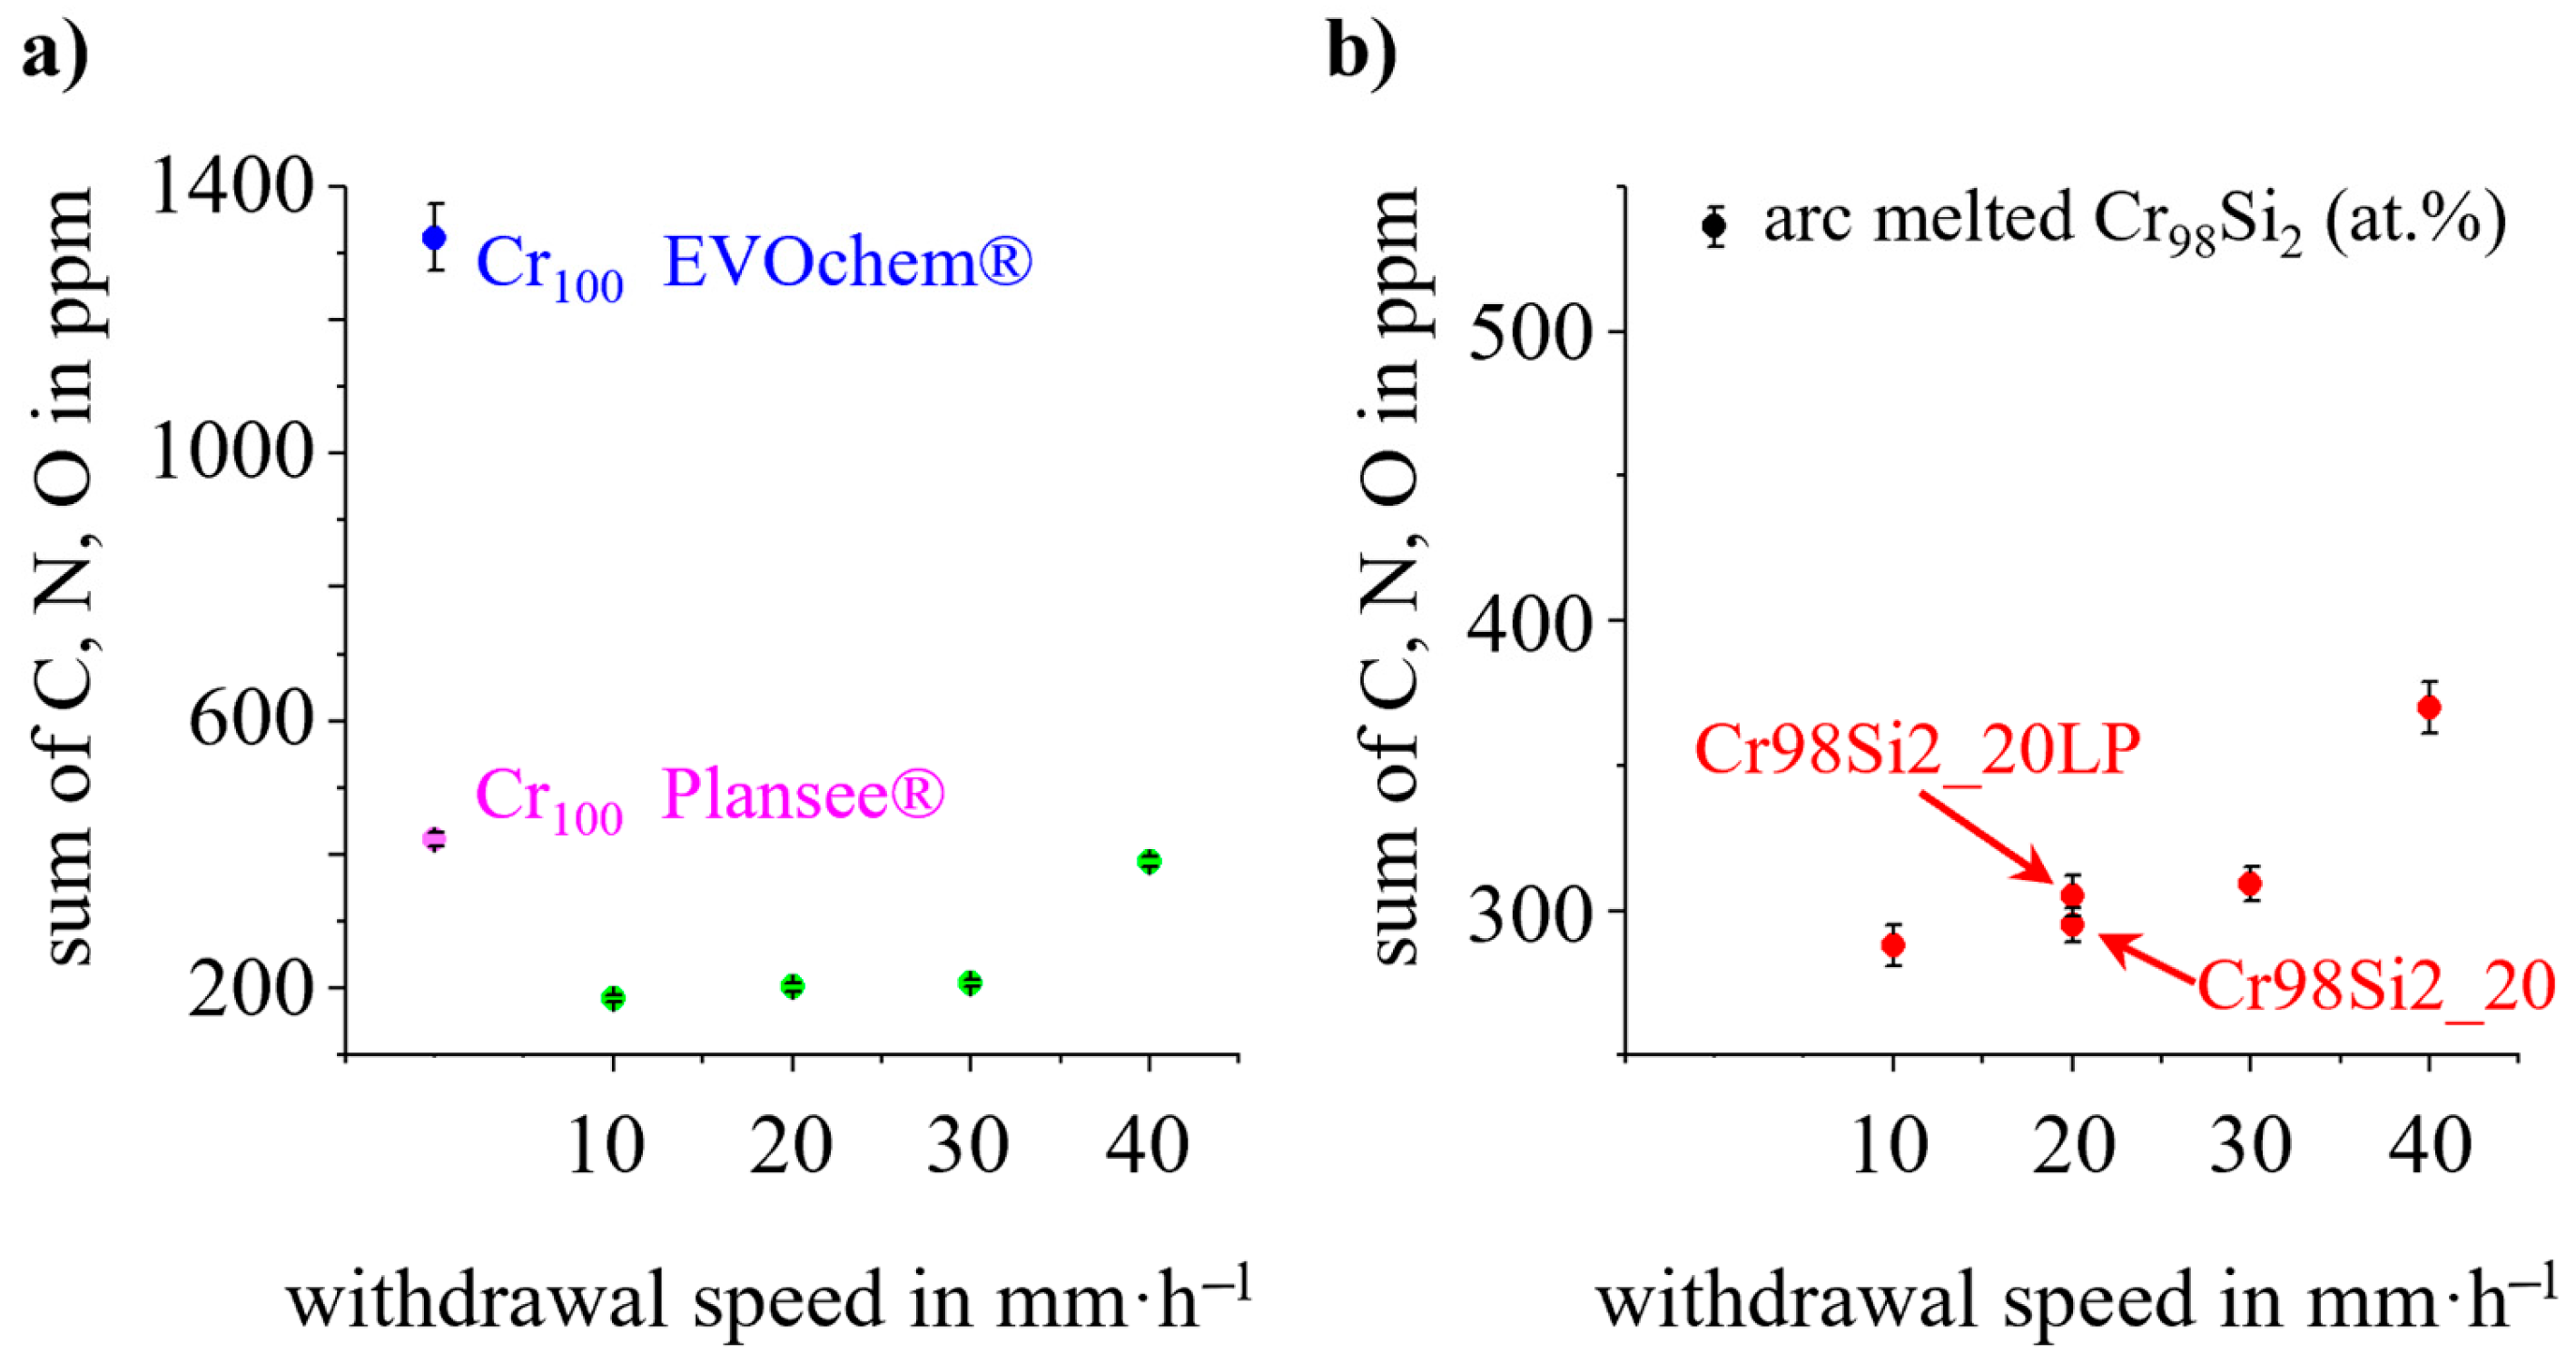
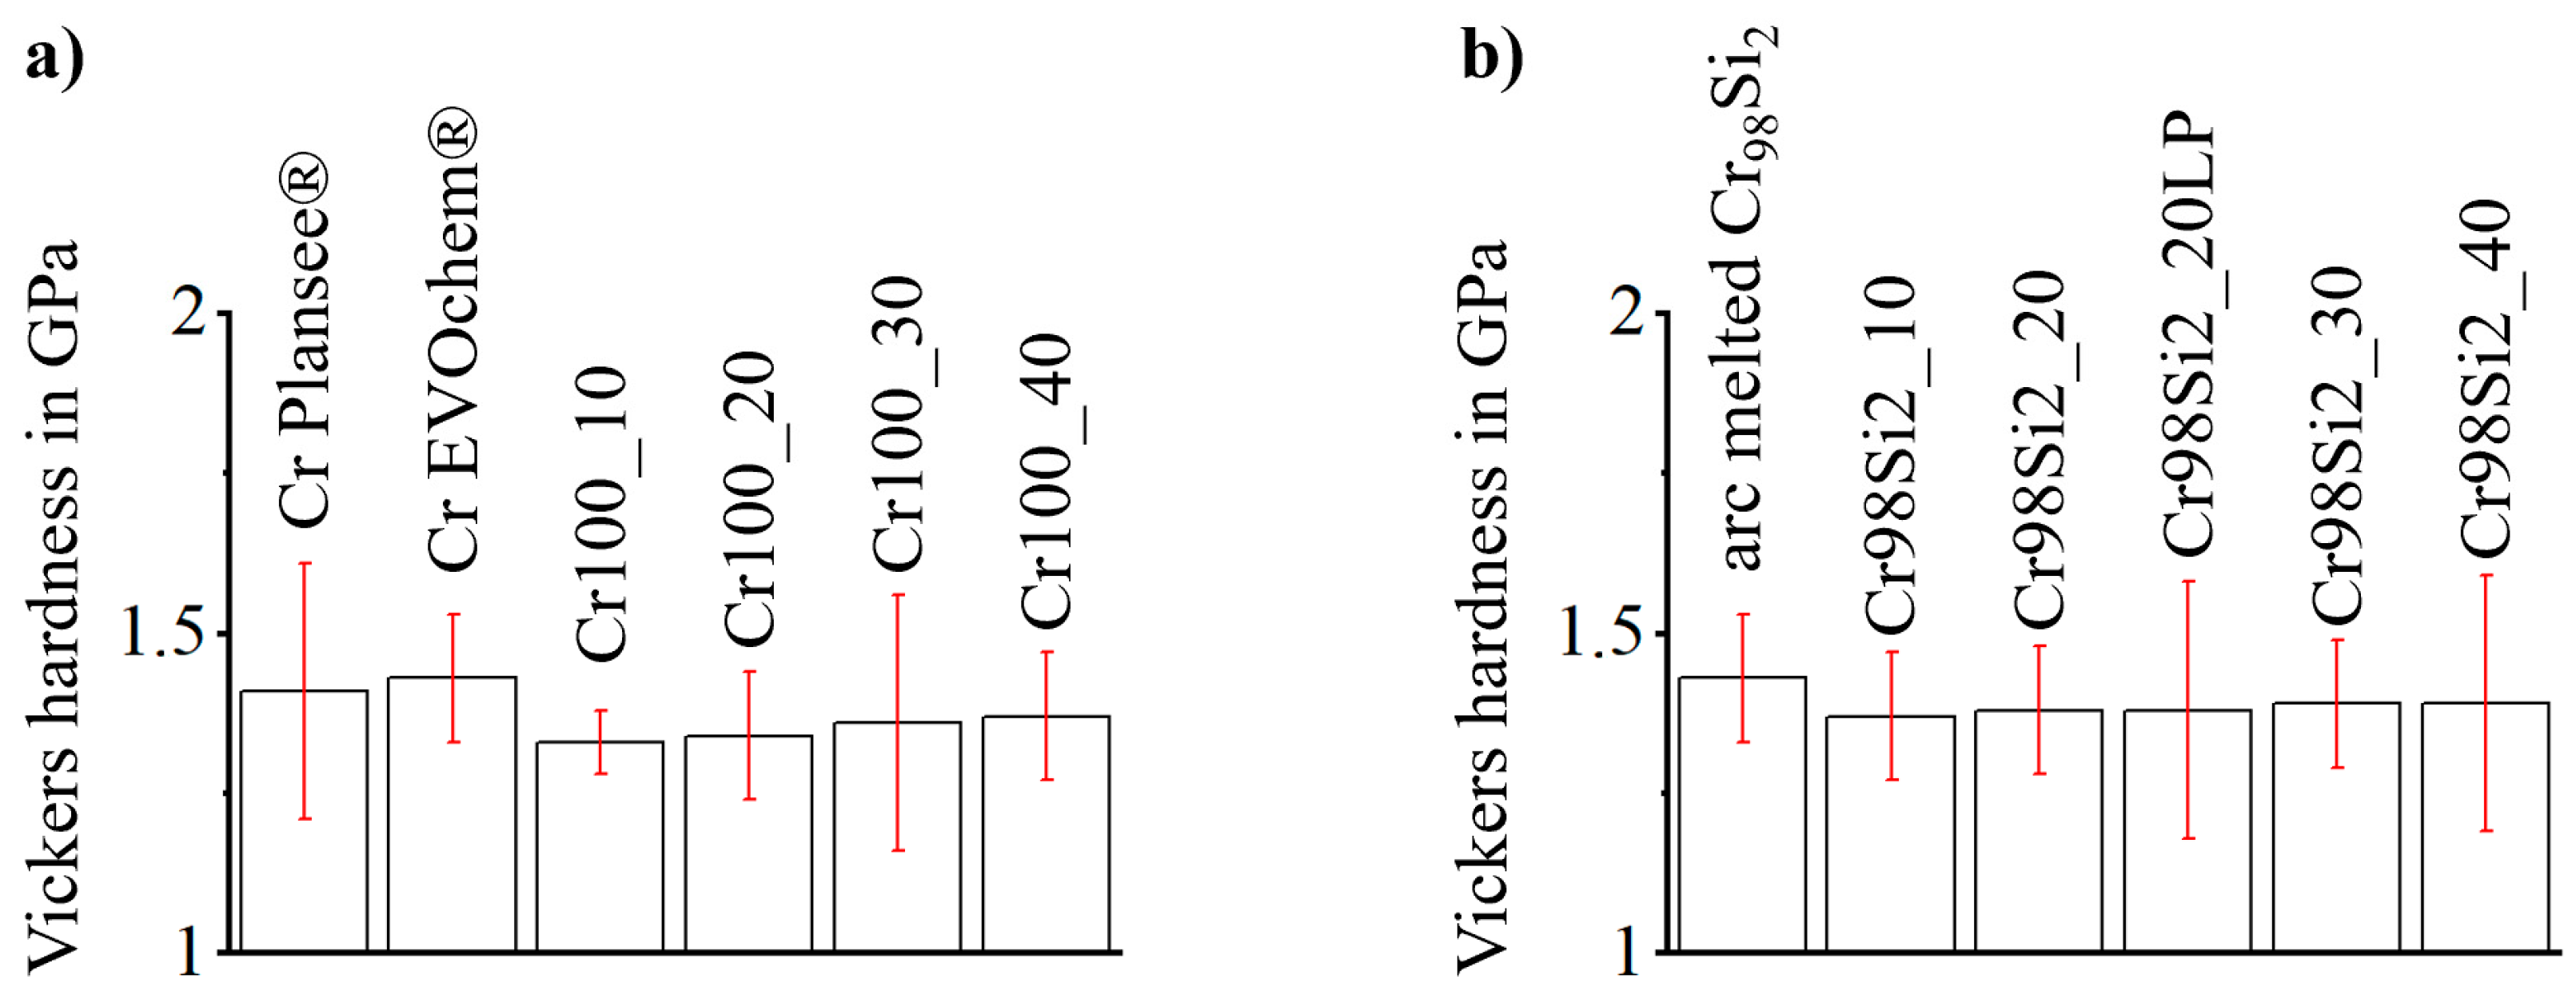
3. Results
4. Discussion
5. Conclusions
Author Contributions
Funding
Data Availability Statement
Conflicts of Interest
Abbreviations
| EBSD | electron backscattered diffraction |
| EDM | electric discharge machining |
| EDS | energy dispersive spectroscopy |
| GDOES | glow discharge optical emission spectroscopy |
| ICP-OES | inductively coupled plasma optical emission spectroscopy |
| OFZ | optical floating zone |
| OM | optical microscopy |
| ppm | parts per million |
| SEM | scanning electron microscopy |
| XRD | X-ray diffraction |
| µXRF | micro X-ray fluorescence spectroscopy |
References
- Dorcheh, A.S.; Galetz, M.C. Challenges in Developing Oxidation-Resistant Chromium-Based Alloys for Applications Above 900°C. JOM 2016, 68, 2793–2802. [Google Scholar] [CrossRef]
- Gu, Y.F.; Harada, H.; Ro, Y. Chromium and chromium-based alloys: Problems and possibilities for high-temperature service. JOM 2004, 56, 28–33. [Google Scholar] [CrossRef]
- Aono, Y.; Omori, T.; Kainuma, R. Microstructure and high-temperature strength in Cr–Si binary alloys. Intermetallics 2019, 112, 106526. [Google Scholar] [CrossRef]
- Lu, Y.; Han, W.-Z. Lowering the ductile-to-brittle transition temperature to −36 °C via fine-grained structures in chromium. Scr. Mater. 2024, 239, 115813. [Google Scholar] [CrossRef]
- Brandes, E.A.; Greenaway, H.T.; Stone, H.E.N. Ductility in Chromium. Nature 1956, 178, 587. [Google Scholar] [CrossRef]
- Gao, M.C.; Doğan, Ö.N.; King, P.; Rollett, A.D.; Widom, M. The first-principles design of ductile refractory alloys. JOM 2008, 60, 61–65. [Google Scholar] [CrossRef]
- Harada, Y.; Ohmori, M. Ductile–brittle transition behavior of rolled chromium. J. Mech. Work. Technol. 2004, 153–154, 93–99. [Google Scholar] [CrossRef]
- Johnstone, S.T.M.; Henderson, F.; Wain, H.L. Recrystallization and the Ductility of Chromium. Nature 1957, 180, 806. [Google Scholar] [CrossRef]
- Kroll, W. Das duktile Chrom. Z. Anorg. Allg. Chem. 1935, 226, 23–32. [Google Scholar] [CrossRef]
- Smith, W.H.; Seybolt, A.U. Ductile Chromium. J. Electrochem. Soc. 1956, 103, 347. [Google Scholar] [CrossRef]
- Briant, C.L. Impurity Effects in Chromium and Titanium. Mater. Trans. JIM 2000, 41, 161–165. [Google Scholar] [CrossRef]
- Briant, C.; Kumar, K.; Rosenberg, N.; Tomioka, H. The mechanical properties of high purity chromium. Int. J. Refract. Met. Hard Mater. 2000, 18, 9–11. [Google Scholar] [CrossRef]
- Brady, M.; Anderson, I.; Weaver, M.; Meyer, H.; Walker, L.; Miller, M.; Larson, D.; Wright, I.; Sikka, V.; Rar, A.; et al. Nitrogen impurity gettering in oxide dispersion ductilized chromium. Mater. Sci. Eng. A 2003, 358, 243–254. [Google Scholar] [CrossRef]
- Ulrich, A.S.; Pfizenmaier, P.; Solimani, A.; Glatzel, U.; Galetz, M.C. Strengthened Cr-Si-base alloys for high temperature applications. Int. J. Refract. Met. Hard Mater. 2018, 76, 72–81. [Google Scholar] [CrossRef]
- Gao, S.; Ji, W.; Zhu, Q.; Jarlöv, A.; Shen, X.; Bai, X.; Zhu, C.; Lek, Y.Z.; Xiao, Z.; Zhou, K. Pulsed-wave laser additive manufacturing of CrCoNi medium-entropy alloys with high strength and ductility. Mater. Today 2024, 81, 36–46. [Google Scholar] [CrossRef]
- Sandner, K.; Völkl, R.; Dickes, D.; Kuo, J.-T.; Yeh, A.C.; Glatzel, U. Investment casting of Cr-Si alloys with liquidus temperatures up to 1900 °C. Int. J. Met. 2024. [Google Scholar] [CrossRef]
- Pelchen, L.; Schenker, M.; Lepple, M.; Ulrich, A.S. Reaction of a Molten Cr-Si-Base Alloy with Ceramics and a High Entropy Oxide. High Temp. Corros. Mater. 2024, 101, 897–909. [Google Scholar] [CrossRef]
- Bhaumik, I.; Ganesamoorthy, S.; Bhatt, R.; Saxena, A.; Karnal, A.K.; Gupta, P.K. Growth of Nd:Cr:YVO 4 Single Crystals by the Optical Floating Zone Technique under Different Oxygen Partial Pressures to Control the Oxidation State of Chromium. Cryst. Growth Des. 2013, 13, 3878–3883. [Google Scholar] [CrossRef]
- Zhang, X.; Friedrich, S.; Friedrich, B. Production of High Purity Metals: A Review on Zone Refining Process. J. Cryst. Process. Technol. 2018, 8, 33–55. [Google Scholar] [CrossRef]
- Koohpayeh, S.M.; Fort, D.; Abell, J.S. The optical floating zone technique: A review of experimental procedures with special reference to oxides. Prog. Cryst. Growth Charact. Mater. 2008, 54, 121–137. [Google Scholar] [CrossRef]
- Evans, A.G.; Charles, E.A. Fracture Toughness Determinations by Indentation. J. Am. Ceram. Soc. 1976, 59, 371–372. [Google Scholar] [CrossRef]
- Okamoto, H. Cr-Si (Chromium-Silicon). J. Phase Equilibria Diffus. 2001, 22, 593. [Google Scholar] [CrossRef]
- Schwartzberg, F.R.; Ogden, H.R.; Jaffee, R.I. Ductile-Brittle Transition in the Refractory Metals; Battelle Memorial Institute, Defense Metals Information Center: Columbus, OH, USA, 1959. [Google Scholar]
- Soni, V.; Senkov, O.N.; Gwalani, B.; Miracle, D.B.; Banerjee, R. Microstructural Design for Improving Ductility of An Initially Brittle Refractory High Entropy Alloy. Sci. Rep. 2018, 8, 8816. [Google Scholar] [CrossRef]
- Edwards, A.R.; Nish, J.I.; Wain, H.L. The preparation and properties of high-purity chromium. Met. Rev. 1959, 4, 403–449. [Google Scholar] [CrossRef]
- Stamm, H.; Bonansinga, M.; Dos Santos Marques, F.; Hähner, P.; Kolbe, H.; Volcan, A. Thermomechanical characteristics of low activation chromium and chromium alloys. J. Nucl. Mater. 1998, 258–263, 1756–1761. [Google Scholar] [CrossRef]
- Pfizenmaier, P.; Ulrich, A.S.; Galetz, M.C.; Glatzel, U. Tensile Creep Properties of Cr-Si Alloys at 980 °C in Air—Influence of Ge and Mo Addition. Metals 2021, 11, 1072. [Google Scholar] [CrossRef]


| Specimen | Nominal Composition (in at.%) | Withdrawal Speed (in mm·h−1) | Ar Pressure (in MPa) | Ar Gas Flow (in L/min) | |
|---|---|---|---|---|---|
| Cr | Si | ||||
| Cr100_10 | 100.0 | 0.0 | 10 | 0.7 | 2.0 |
| Cr100_20 | 20 | ||||
| Cr100_30 | 30 | ||||
| Cr100_40 | 40 | ||||
| Cr98Si2_20LP | 98.0 | 2.0 | 20 | 0.1 | |
| Cr98Si2_10 | 0.7 | ||||
| Cr98Si2_20 | |||||
| Cr98Si2_30 | 30 | ||||
| Cr98Si2_40 | 40 | ||||
| Specimen | Nominal Composition (in at.%) | Length of Largest Grain (in mm) | Number of Grains Within the Build Rod | |
|---|---|---|---|---|
| Cr | Si | |||
| Cr100_10 | 100.0 | 0.0 | >30 | 12 |
| Cr100_20 | >20 | 16 | ||
| Cr100_30 | 17 | |||
| Cr100_40 | 9.8 | >30 | ||
| Cr98Si2_20LP | 98.0 | 2.0 | 0.6 | >50 |
| Cr98Si2_10 | >40 | 11 | ||
| Cr98Si2_20 | 12 | |||
| Cr98Si2_30 | >20 | 22 | ||
| Cr98Si2_40 | 26 | |||
| Specimen | Nominal Composition (in at.%) | µXRF Results (in at.%) | Porosity (Measured at the Surface) (in %) | ||
|---|---|---|---|---|---|
| Cr | Si | Cr | Si | ||
| Cr100_10 | 100.0 | 0.0 | 100.0 ± 0.0 | below resolution limit (<0.1 at.%) | 0.15 |
| Cr100_20 | 0.20 | ||||
| Cr100_30 | |||||
| Cr100_40 | 0.25 | ||||
| Cr, pure from Plansee® | 0.85 | ||||
| Cr, pure from EVOCHEM® | 0.80 | ||||
| Cr98Si2, arc melted | 98.0 | 2.0 | 0.70 | ||
| Cr98Si2_20LP | 97.6 ± 0.1 | 2.4 ± 0.1 | 0.30 | ||
| Cr98Si2_10 | 97.8 ± 0.1 | 2.2 ± 0.1 | 0.20 | ||
| Cr98Si2_20 | 97.9 ± 0.2 | 2.1 ± 0.2 | 0.35 | ||
| Cr98Si2_30 | 97.7 ± 0.2 | 2.3 ± 0.2 | 0.40 | ||
| Cr98Si2_40 | 98.1 ± 0.2 | 1.9 ± 0.2 | |||
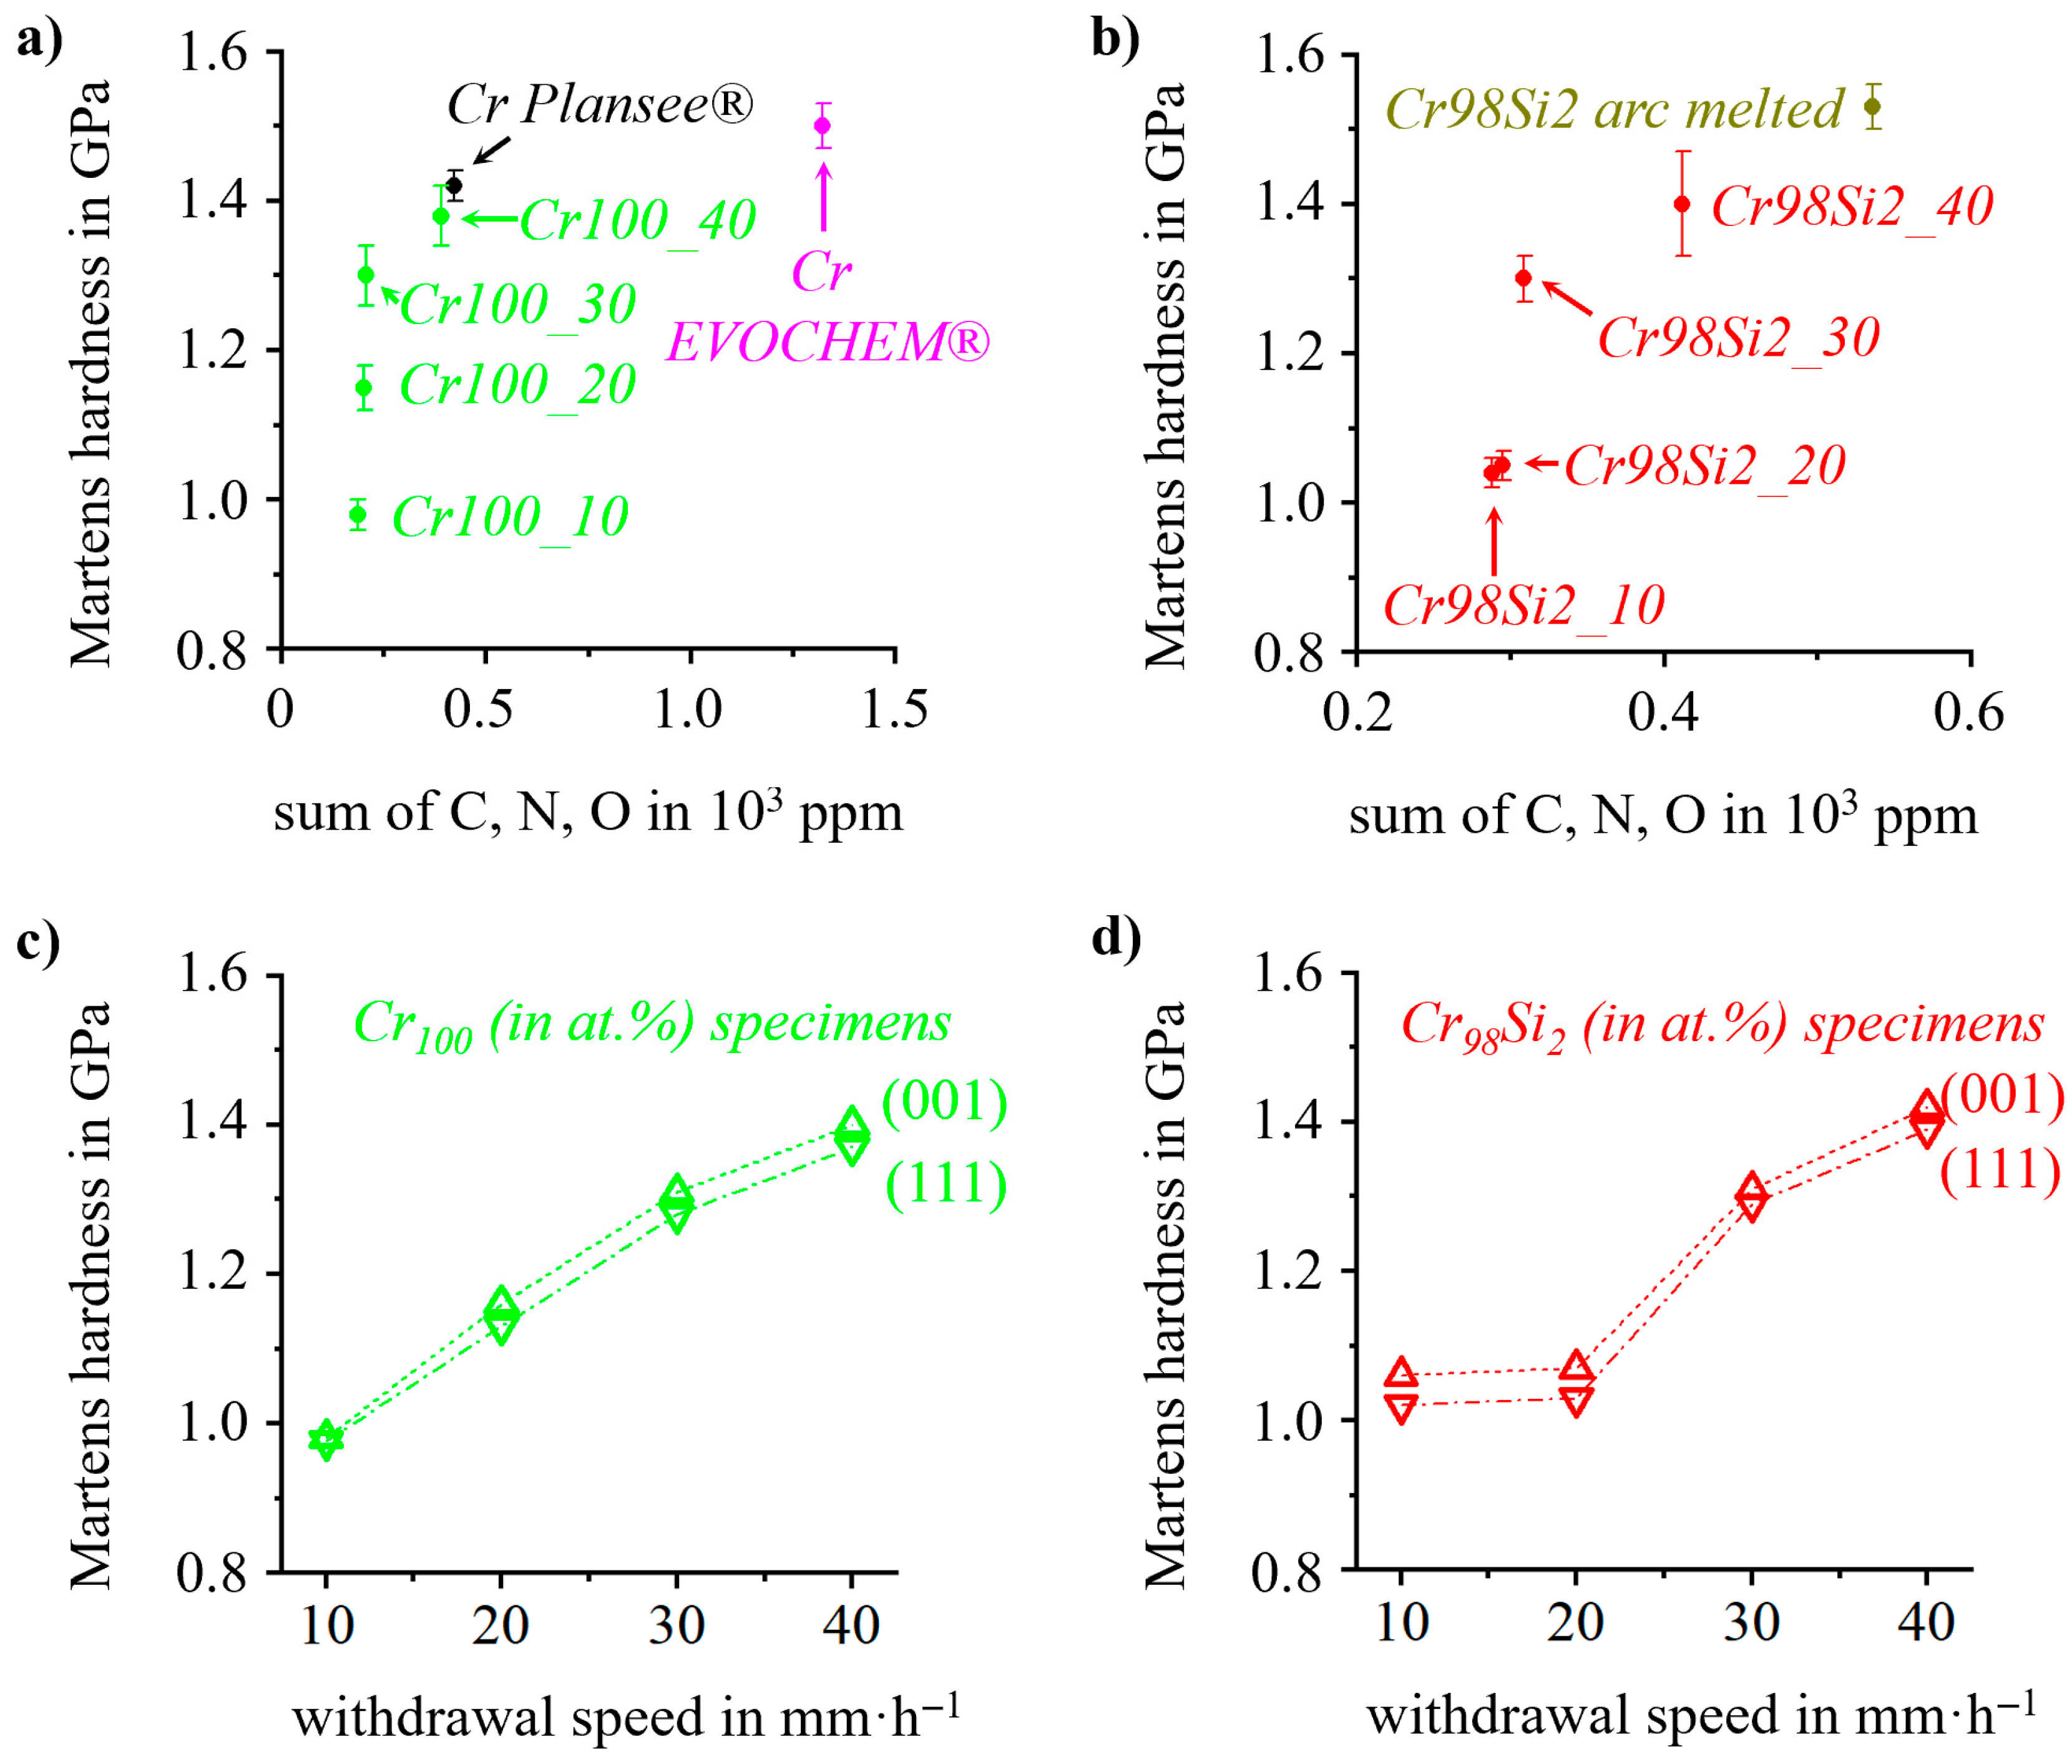
| Specimen | Withdrawal Speed (in mm·h−1) | C (in ppm) | N (in ppm) | O (in ppm) |
|---|---|---|---|---|
| Cr100_10 | 10 | 10 ± 2 | 32 ± 4 | 144 ± 5 |
| Cr100_20 | 20 | 11 ± 2 | 40 ± 3 | 151 ± 5 |
| Cr100_30 | 30 | 13 ± 2 | 44 ± 5 | 150 ± 5 |
| Cr100_40 | 40 | 12 ± 2 | 118 ± 7 | 259 ± 5 |
| Cr98Si2_10 | 10 | 12 ± 3 | 66 ± 9 | 210 ± 8 |
| Cr98Si2_20LP | 20 | 12 ± 2 | 82 ± 7 | 211 ± 7 |
| Cr98Si2_20 | 12 ± 2 | 76 ± 6 | 207 ± 6 | |
| Cr98Si2_30 | 30 | 13 ± 2 | 83 ± 6 | 213 ± 6 |
| Cr98Si2_40 | 40 | 12 ± 2 | 114 ± 9 | 244 ± 6 |
| Cr, pure from Plansee® * | -- | 12 ± 2 | 144 ± 5 | 267 ± 5 |
| Cr, pure from EVOchem® * | 20 ± 10 | 1163 ± 50 | 140 ± 50 | |
| Cr98Si2, arc melted * | 12 ± 2 | 209 ± 9 | 315 ± 7 |
Disclaimer/Publisher’s Note: The statements, opinions and data contained in all publications are solely those of the individual author(s) and contributor(s) and not of MDPI and/or the editor(s). MDPI and/or the editor(s) disclaim responsibility for any injury to people or property resulting from any ideas, methods, instructions or products referred to in the content. |
© 2025 by the authors. Licensee MDPI, Basel, Switzerland. This article is an open access article distributed under the terms and conditions of the Creative Commons Attribution (CC BY) license (https://creativecommons.org/licenses/by/4.0/).
Share and Cite
Sandner, K.; Yen, H.; Lee, J.-L.; Völkl, R.; Yeh, A.-C.; Glatzel, U. Cr-Si Alloys with Very Low Impurity Levels Prepared by Optical Floating Zone Technique. Metals 2025, 15, 850. https://doi.org/10.3390/met15080850
Sandner K, Yen H, Lee J-L, Völkl R, Yeh A-C, Glatzel U. Cr-Si Alloys with Very Low Impurity Levels Prepared by Optical Floating Zone Technique. Metals. 2025; 15(8):850. https://doi.org/10.3390/met15080850
Chicago/Turabian StyleSandner, Kilian, Hung Yen, Jhuo-Lun Lee, Rainer Völkl, An-Chou Yeh, and Uwe Glatzel. 2025. "Cr-Si Alloys with Very Low Impurity Levels Prepared by Optical Floating Zone Technique" Metals 15, no. 8: 850. https://doi.org/10.3390/met15080850
APA StyleSandner, K., Yen, H., Lee, J.-L., Völkl, R., Yeh, A.-C., & Glatzel, U. (2025). Cr-Si Alloys with Very Low Impurity Levels Prepared by Optical Floating Zone Technique. Metals, 15(8), 850. https://doi.org/10.3390/met15080850