Article

Deep Learning-Based YOLO Applied to Rear Weld Pool Thermal Monitoring of Metallic Materials in the GTAW Process

1
LMGC, Univ. Montpellier, CNRS, Montpellier 78400, France
2
EDF R&D, 6 Quai Watier, 78400 Chatou, France
*
Author to whom correspondence should be addressed.
Metals 2025, 15(8), 836; https://doi.org/10.3390/met15080836 (registering DOI)
Submission received: 26 June 2025 / Revised: 22 July 2025 / Accepted: 25 July 2025 / Published: 26 July 2025
(This article belongs to the Special Issue Advances in Welding Processes of Metallic Materials)

Abstract

This study investigates the use of YOLOv8 deep learning models to segment and classify thermal images acquired from the rear of the weld pool during the Gas Tungsten Arc Welding (GTAW) process. Thermal data were acquired using a two-color pyrometer under three welding current levels (160 A, 180 A, and 200 A). Models of sizes from nano to extra-large were trained on 66 annotated frames and evaluated with and without data augmentation. The results demonstrate that the YOLOv8m model achieved the best classification performance, with a precision of 83.25% and an inference time of 21.4 ms per frame by using GPU, offering the optimal balance between accuracy and speed. Segmentation accuracy also remained high across all current levels. The YOLOv8n model was the fastest (15.9 ms/frame) but less accurate (75.33%). Classification was most reliable at 160 A, where the thermal field was more stable. The arc reflection class was consistently identified with near-perfect precision, demonstrating the model’s robustness against non-relevant thermal artifacts. These findings confirm the feasibility of using lightweight, dual-task neural networks for reliable weld pool analysis, even with limited training data.

1. Introduction

Gas Tungsten Arc Welding (GTAW) is widely used in applications requiring high-quality joints due to its precision and heat input control. The quality of GTAW welds is strongly influenced by the thermal and fluid dynamics of the molten pool during the process. Recent studies have emphasized this context. Wang et al. [1] used numerical modeling to show that heat input directly affects molten pool geometry and keyhole behavior, influencing weld penetration and uniformity. Jiang et al. [2] demonstrated that variations in current modulate the molten pool’s thermal profile and stability, which are directly linked to weld bead formation and consistency. Wu et al. [3] highlighted how molten pool convection patterns contribute to porosity formation in hybrid laser–TIG welding, stressing the need for precise heat control. Additionally, Zhang et al. [4] showed through simulation that fluid flow instabilities in the molten pool can cause undercut defects and proposed strategies to suppress these based on optimized arc behavior.
Even minor fluctuations in heat input or pool geometry can lead to defects such as incomplete penetration or internal discontinuities, which compromise structural integrity [5]. Consequently, real-time monitoring and control strategies have become essential to ensure weld quality. Visual and thermal image processing, in particular, has shown potential in supporting quality assurance by enabling in-process evaluation of bead geometry, penetration state, and potential deviations [6,7]. In this context, temperature control is especially critical, as thermal instability can lead to inconsistent weld pool behavior, microstructural changes, and long-term mechanical degradation.
Non-invasive monitoring strategies, such as optical and infrared cameras, are increasingly employed to acquire real-time information about welding processes. These approaches allow the visualization of the molten pool and its thermal distribution, enabling inference of geometrical and metallurgical properties [8,9]. Jorge et al. [10] introduced a two-color pyrometer system to observe the weld pool from the backside, demonstrating its ability to accurately evaluate thermal fields with reduced interference from arc radiation and reflections. Such setups can deliver reliable thermal measurements, provided that emissivity variations and surface oxidation are properly accounted for.
However, several challenges remain in thermal monitoring of welding processes when accessing the molten pool from the topside. Arc radiation can saturate sensors and obscure the weld pool, while metal surfaces present variable emissivity and high reflectivity, introducing noise into temperature measurements [11,12]. Moreover, even using spectral filtering, reflectivity might remain. Reflections from surrounding components such as the electrode or torch nozzle can distort thermal profiles, and oxidation can unpredictably alter emissivity [13]. These complexities underscore the importance of robust models capable of handling noisy or incomplete data, as well as being able to help select the region of interest (ROI) within the molten pool that has meaningful information.
Welding image recognition (WIR) has emerged as a critical component of intelligent welding systems, enabling automated analysis of weld quality. Image-based monitoring supports tasks such as weld tracking, defect detection, and process classification [7]. With the rise of Industry 4.0, deep learning (DL) techniques have been gaining prominence over classical machine learning approaches due to their ability to extract features directly from raw data. This has led to the development of end-to-end DL models capable of real-time decision-making based on visual inputs [14]. DL models such as Convolutional Neural Networks (CNNs) have been successfully trained to classify penetration states, detect common defects, and segment key regions like the weld pool in thermal and optical images [15,16].
Among DL models, the You Only Look Once (YOLO) architecture stands out for its real-time performance and balance between speed and accuracy. Recent versions such as YOLOv5 through YOLOv8 include modules for object detection, image segmentation, and classification, making them suitable for multitask applications in welding monitoring [17,18]. Studies have shown YOLO’s effectiveness in segmenting the weld pool from thermal images, even with limited training data, as well as classifying thermal patterns corresponding to different welding positions or conditions. Jorge et al. [19], for instance, used YOLOv8 and YOLO11 nano models to classify and segment thermal images captured from the backside of GTAW welds. Their findings highlighted YOLO’s capacity to generalize beyond training scenarios and achieve high accuracy while maintaining processing times below 90 ms per frame, demonstrating suitability for real-time applications. Other authors have proposed modified YOLO variants for welding contexts. Gao et al. [20] developed YOLO-Weld, a YOLOv5-based architecture adapted for robust weld feature detection under high-noise environments. Asadi et al. [21] demonstrated the use of YOLOv8 for segmenting melt pools in Directed Energy Deposition (DED), reporting high mean average precision scores and real-time inference rates.
This study aims to explore the application of YOLO for segmentation and classification tasks in thermal monitoring of the weld pool from the rear side during the GTAW process. The goal is to mitigate typical challenges such as arc radiation and arc reflections while enabling efficient and accurate detection of thermal patterns. The research evaluates YOLO’s generalization ability, speed, and precision in this context and contributes to advancing real-time weld quality assessment through deep learning-enhanced thermal monitoring.

2. Methodology and Experimental Procedure

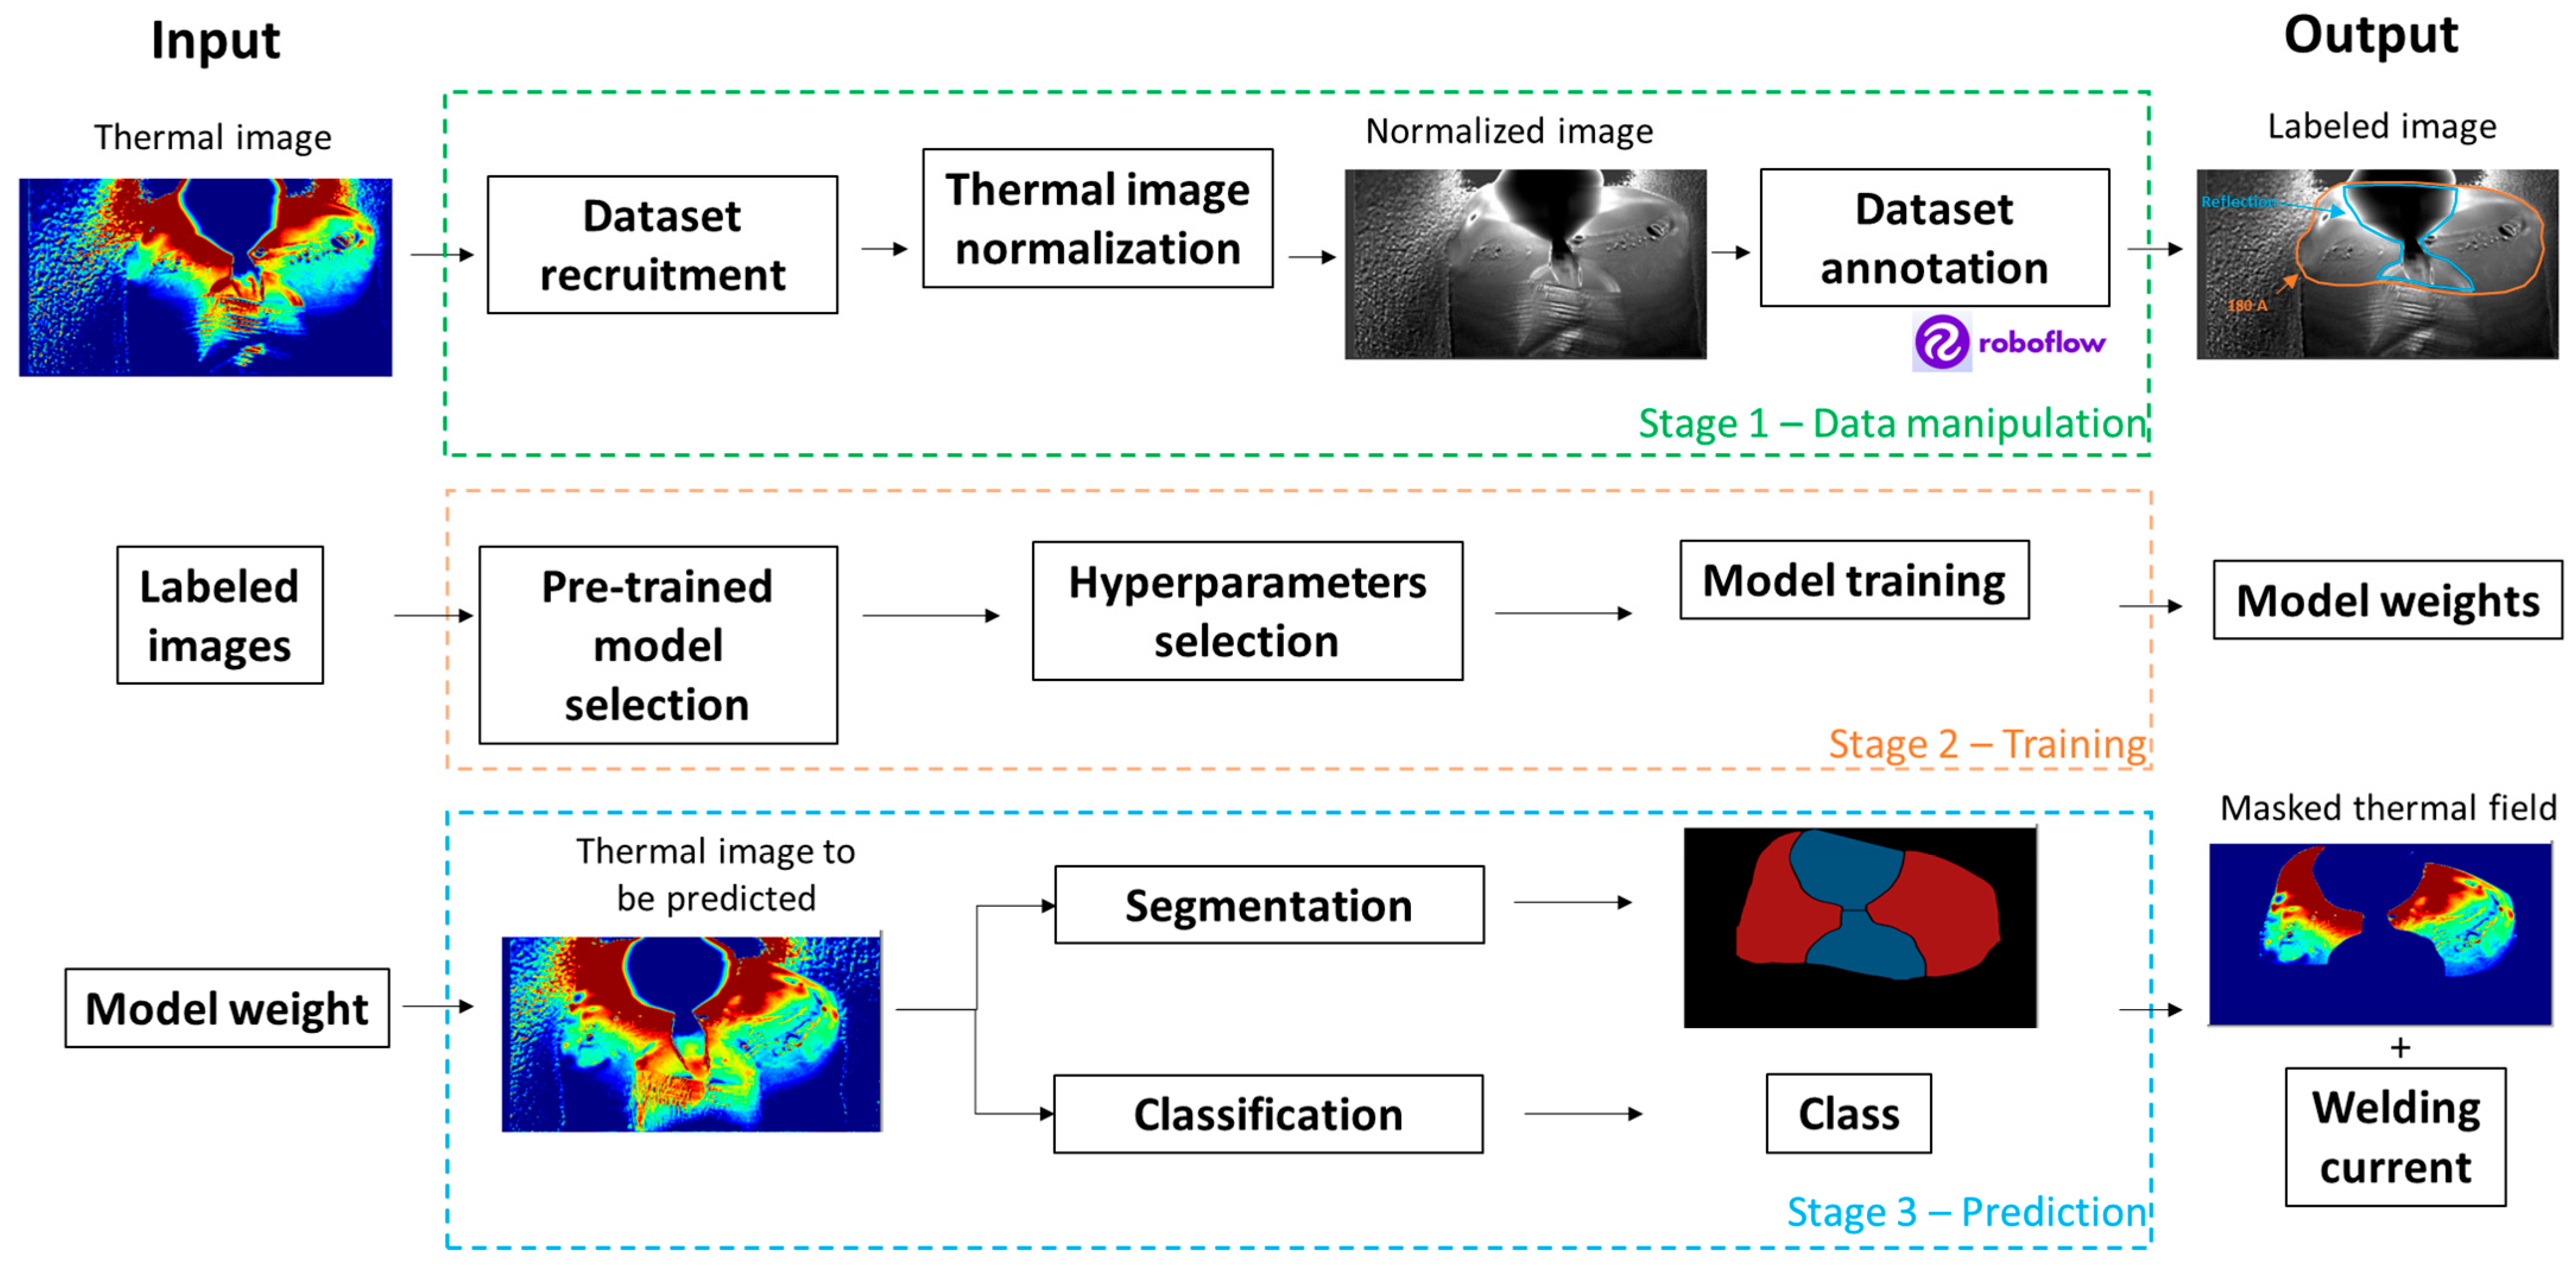
2.1. Overview of the Proposed Methodology

The proposed methodology involves applying DL-based YOLOv8 models to the segmentation and classification of weld-pool thermal images. Thermal images were captured at three different welding current levels under identical parameters, from the start of welding up to a stage within the steady-state (SS) phase. The weld pool’s thermal field was observed from the topside of the plate (rear of the weld pool) during the GTAW process. A subset of thermal frames representing the SS phase was selected and subsequently used for model training. All YOLOv8 model sizes, such as nano (“n”), small (“s”), medium (“m”), large (“l”), and extra-large (“x”), were evaluated. Model inference was then performed on a broad set of frames spanning the welding period, and segmentation performance was evaluated and compared across the models. Classification accuracy was assessed using a fixed confidence threshold, and processing time was quantified for each stage of YOLO’s prediction pipeline.

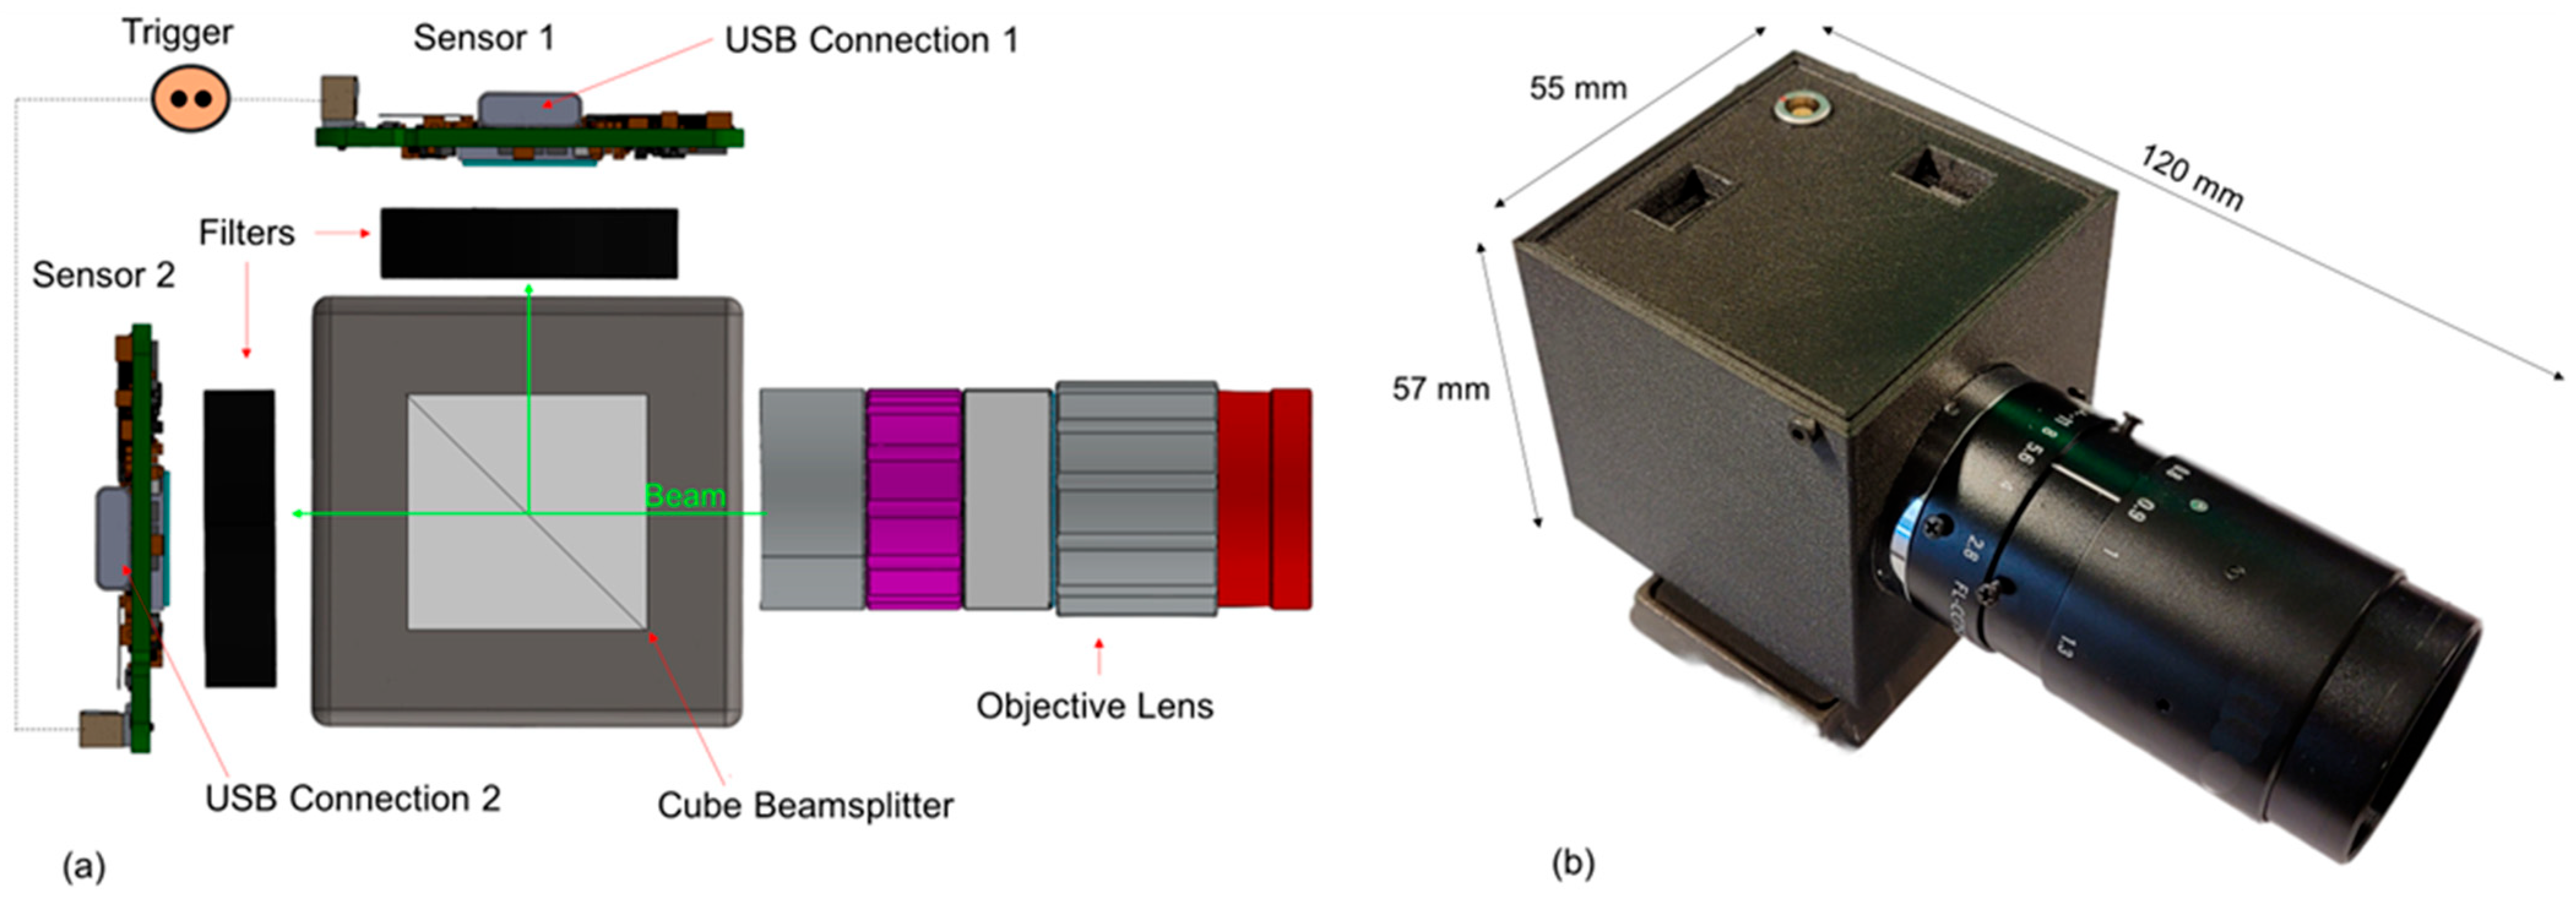
2.2. Thermal Measurement Device

Figure 1 presents a schematic representation of the internal components of the thermal measurement system. A commercially available C-Mount cube beamsplitter with a 50/50 reflection-to-transmission ratio (Edmund Optics®, Barrington, NJ, USA) was used in the optical setup. The thermal measurement system employed in this study follows the methodology originally proposed by Jorge et al. [13]. This approach relies on the simultaneous detection of infrared radiation at two narrowly spaced wavelengths, enabling temperature estimation via the intensity ratio captured by two near-infrared (NIR) sensors (IDS Imaging Development Systems GmbH, Obersulm, Germany). Narrowband optical filters were utilized to minimize the influence of emissivity variations, and a calibration curve relating the radiative intensities at both wavelengths was established to determine the temperature. The calibration approach outlined by Jorge et al. [13] was replicated in this work. A tungsten filament from an Osram E27 WI 17/G 16A 9V lamp (Osram, Schwabmünchen, Germany) capable of reaching the temperature limit of 2856 K was adopted as the reference source. The lamp was powered by a direct current supply, allowing precise current control to cover the temperature range of interest (from 1673 K, the liquidus temperature of 316L stainless steel, up to 2856 K). Two optical filters centered at 890 nm and 990 nm (full width at half maximum of 10 nm) were selected for the two sensing channels. A sensitivity coefficient of 0.328 was used in this work and taken directly from Jorge et al. [13]. This configuration enabled temperature measurements with a maximum combined uncertainty of approximately 6.2%.

2.3. Experimental Rig, Material, and Parametrization

The experimental setup is shown in Figure 2. Bead-on-plate welds with 120 mm of length were fabricated on 316L stainless steel plates having dimensions of 150 mm × 50 mm × 10 mm with wire addition (ER 316L RCC-M conformity) using a DC power supply (Sincosald, Agrate Brianza (MB), Italy). This material was carefully chosen due to its low variation in chemical composition (higher purity) and a low carbon content, which helps minimize oxidation during welding and reduces the impact of the material on thermal analysis. A 2.4 mm tungsten electrode doped with 2% lanthanum and ground at a 38° angle was employed, with an electrode-to-plate distance depending on AVC (Arc Voltage Control) with a voltage value of 10.7 V for each experiment. Shielding was provided by a gas lens nozzle with a 12 mm internal diameter, supplying high-purity argon (grade 4.5, 99.995% purity) at a flow rate of 13 L/min. The arc was initiated using lift-arc, and the displacement system commenced movement 5 s after arc initiation. Using a Labjack T7 data acquisition device (LabJack Corporation, Lakewood, CO, USA), voltage and current signals were recorded at 5000 Hz.
Three welding experiments were conducted under identical parameters at current levels of 160 A, 180 A, and 200 A. A travel speed of 2.5 mm/s and a wire feed speed of 2.7 m/min were used. The wire diameter was 1.0 mm, and it was positioned 2.5 mm ahead of the electrode with an angle approximately of 35° from the plate’s surface. The torch was mounted on a robotic manipulator to ensure consistent travel along the seam. The thermal camera was positioned 0.3 m from the electrode tip at a 50° angle relative to the plate surface. The parameters are summarized in Table 1. Thermal images were captured at 12 frames per second with a resolution of 1896 × 1000 pixels, covering a region approximately 22.8 × 11.5 mm in size, thus fully enclosing the weld pool. The camera’s exposure time was 200 µs.

2.4. Neural Network Architecture

YOLOv8 (You Only Look Once, version 8) architecture developed by Ultralytics was employed as the core neural network model for both segmentation and classification of thermal images. YOLOv8 is a single-stage object detection and segmentation framework that integrates high-speed inference with robust spatial feature extraction, making it particularly well suited for real-time applications such as industrial defect detection, weld monitoring, and robotic automation [17,22].
The YOLO architecture family, originally introduced by Redmon et al. [18], has undergone continuous evolution, introducing architectural refinements aimed at improving accuracy, generalization, and computational efficiency. Unlike traditional two-stage detectors (e.g., Faster R-CNN), YOLO models predict object locations and class probabilities in a single forward pass, which enables low-latency, high-throughput inference.
The YOLOv8 architecture consists of three primary components: a backbone, a neck, and prediction heads [17,22]. The backbone, built on an improved CSPDarknet structure, is responsible for extracting hierarchical spatial features from the input image through successive convolutional layers. YOLOv8 introduces enhancements in activation functions, layer normalization, and input scaling compared to its predecessors, enabling more efficient training and inference.
The neck, implemented using a Path Aggregation Network (PAN), fuses multi-scale feature maps to enhance object detection across different spatial resolutions. This is crucial for thermal imaging tasks, where conditions. Finally, the prediction heads generate the output tensors for bounding box regression, object classification, and segmentation mask generation, all within a single unified architecture.
In the present study, this architecture was configured for multi-task learning: segmenting the weld pool region and simultaneously classifying it based on the associated welding current level (160 A, 180 A, or 200 A). The model was trained on high-resolution grayscale thermal images derived from the rear-side view of the weld pool in the GTAW process. The integrated design of YOLOv8 allowed for efficient processing of spatial features in both segmentation and classification tasks, making it a practical solution for real-time thermal monitoring in constrained-data environments.

2.5. Employing YOLO for Analyzing Thermal Image

The workflow for applying YOLO to the thermal imaging data is summarized in the flowchart of Figure 3. The initial step involved normalization of the recorded thermal frames. The weld pool’s thermal field provides useful process information about the heat input and its correlated features, such as solidification behaviors, microstructure formation, and potential defect occurrence during the welding process, among others. As YOLO requires conventional images as input, the temperature matrix of each frame (1896 × 1000 pixels) was first converted into a grayscale image. These images were then imported into a dedicated annotation platform for object labeling. Among various open-source tools available, the Roboflow® platform was employed in this study due to its compatibility with multiple YOLO data formats. Within this environment, the images were fully uploaded and labeled to highlight the desired features. A total of four object classes were defined for training: for each image, the weld pool region was manually delineated (for segmentation) and labeled according to its corresponding current level (160 A, 180 A, or 200 A), and the arc reflection (present in all frames) was annotated as a separate class. After annotation, the YOLOv8 training process was initiated. The models were trained for 200 epochs; this duration provided satisfactory accuracy while avoiding overfitting due to excessive training. The model weights from the best epoch (highest validation performance) were retained for subsequent inference. As segmentation was the primary task in this study, the trained YOLOv8 models not only localized the molten pool but also classified it by current level. During inference, for each new frame, the predicted segmentation mask was overlaid on the full-resolution thermal image, thereby visualizing the temperature field exclusively within the weld pool region. Subsequently, data augmentation was employed to increase the training sample size. Three reflection-based transformations were applied to every labeled frame: (b) horizontal flip, (c) vertical flip, and (d) a combined horizontal + vertical flip, as displayed in Figure 4. Including the original images, this process quadrupled the dataset to 264 frames. The augmented data were then randomly shuffled and split 80%/20% into training/validation sets.
Accurate data collection and annotation are fundamental for reliable model performance. However, manual annotation can be time-consuming; therefore, only 22 consecutive frames at the beginning of the steady-state phase were selected and annotated from each experiment. The limited dataset used in this study was intentionally selected to reflect real-world constraints where manual annotation is labor-intensive and data availability is limited. This approach allowed us to evaluate model performance under constrained conditions that are typical in industrial settings. This yielded a total dataset of 66 labeled frames, which was split 80%/20% into training/validation sets. Training outcomes for the YOLOv8n model are illustrated in Figure 5 (graphs for the other model sizes and current conditions are provided in the Supplementary Materials). All YOLOv8 model sizes exhibited similar learning curves for training and validation. Effective training is typically characterized by low loss values in the final epochs for both the training and validation sets, indicating successful convergence of the model. Training was conducted for 200 epochs with all images resized to 640 × 640 pixels to meet YOLO’s input requirements. No hyperparameter tuning was performed; all settings were kept at their default values (Table 2). The dataset used for training was entirely separate from the dataset employed in the subsequent inference and evaluation phase.

3. Results and Discussion

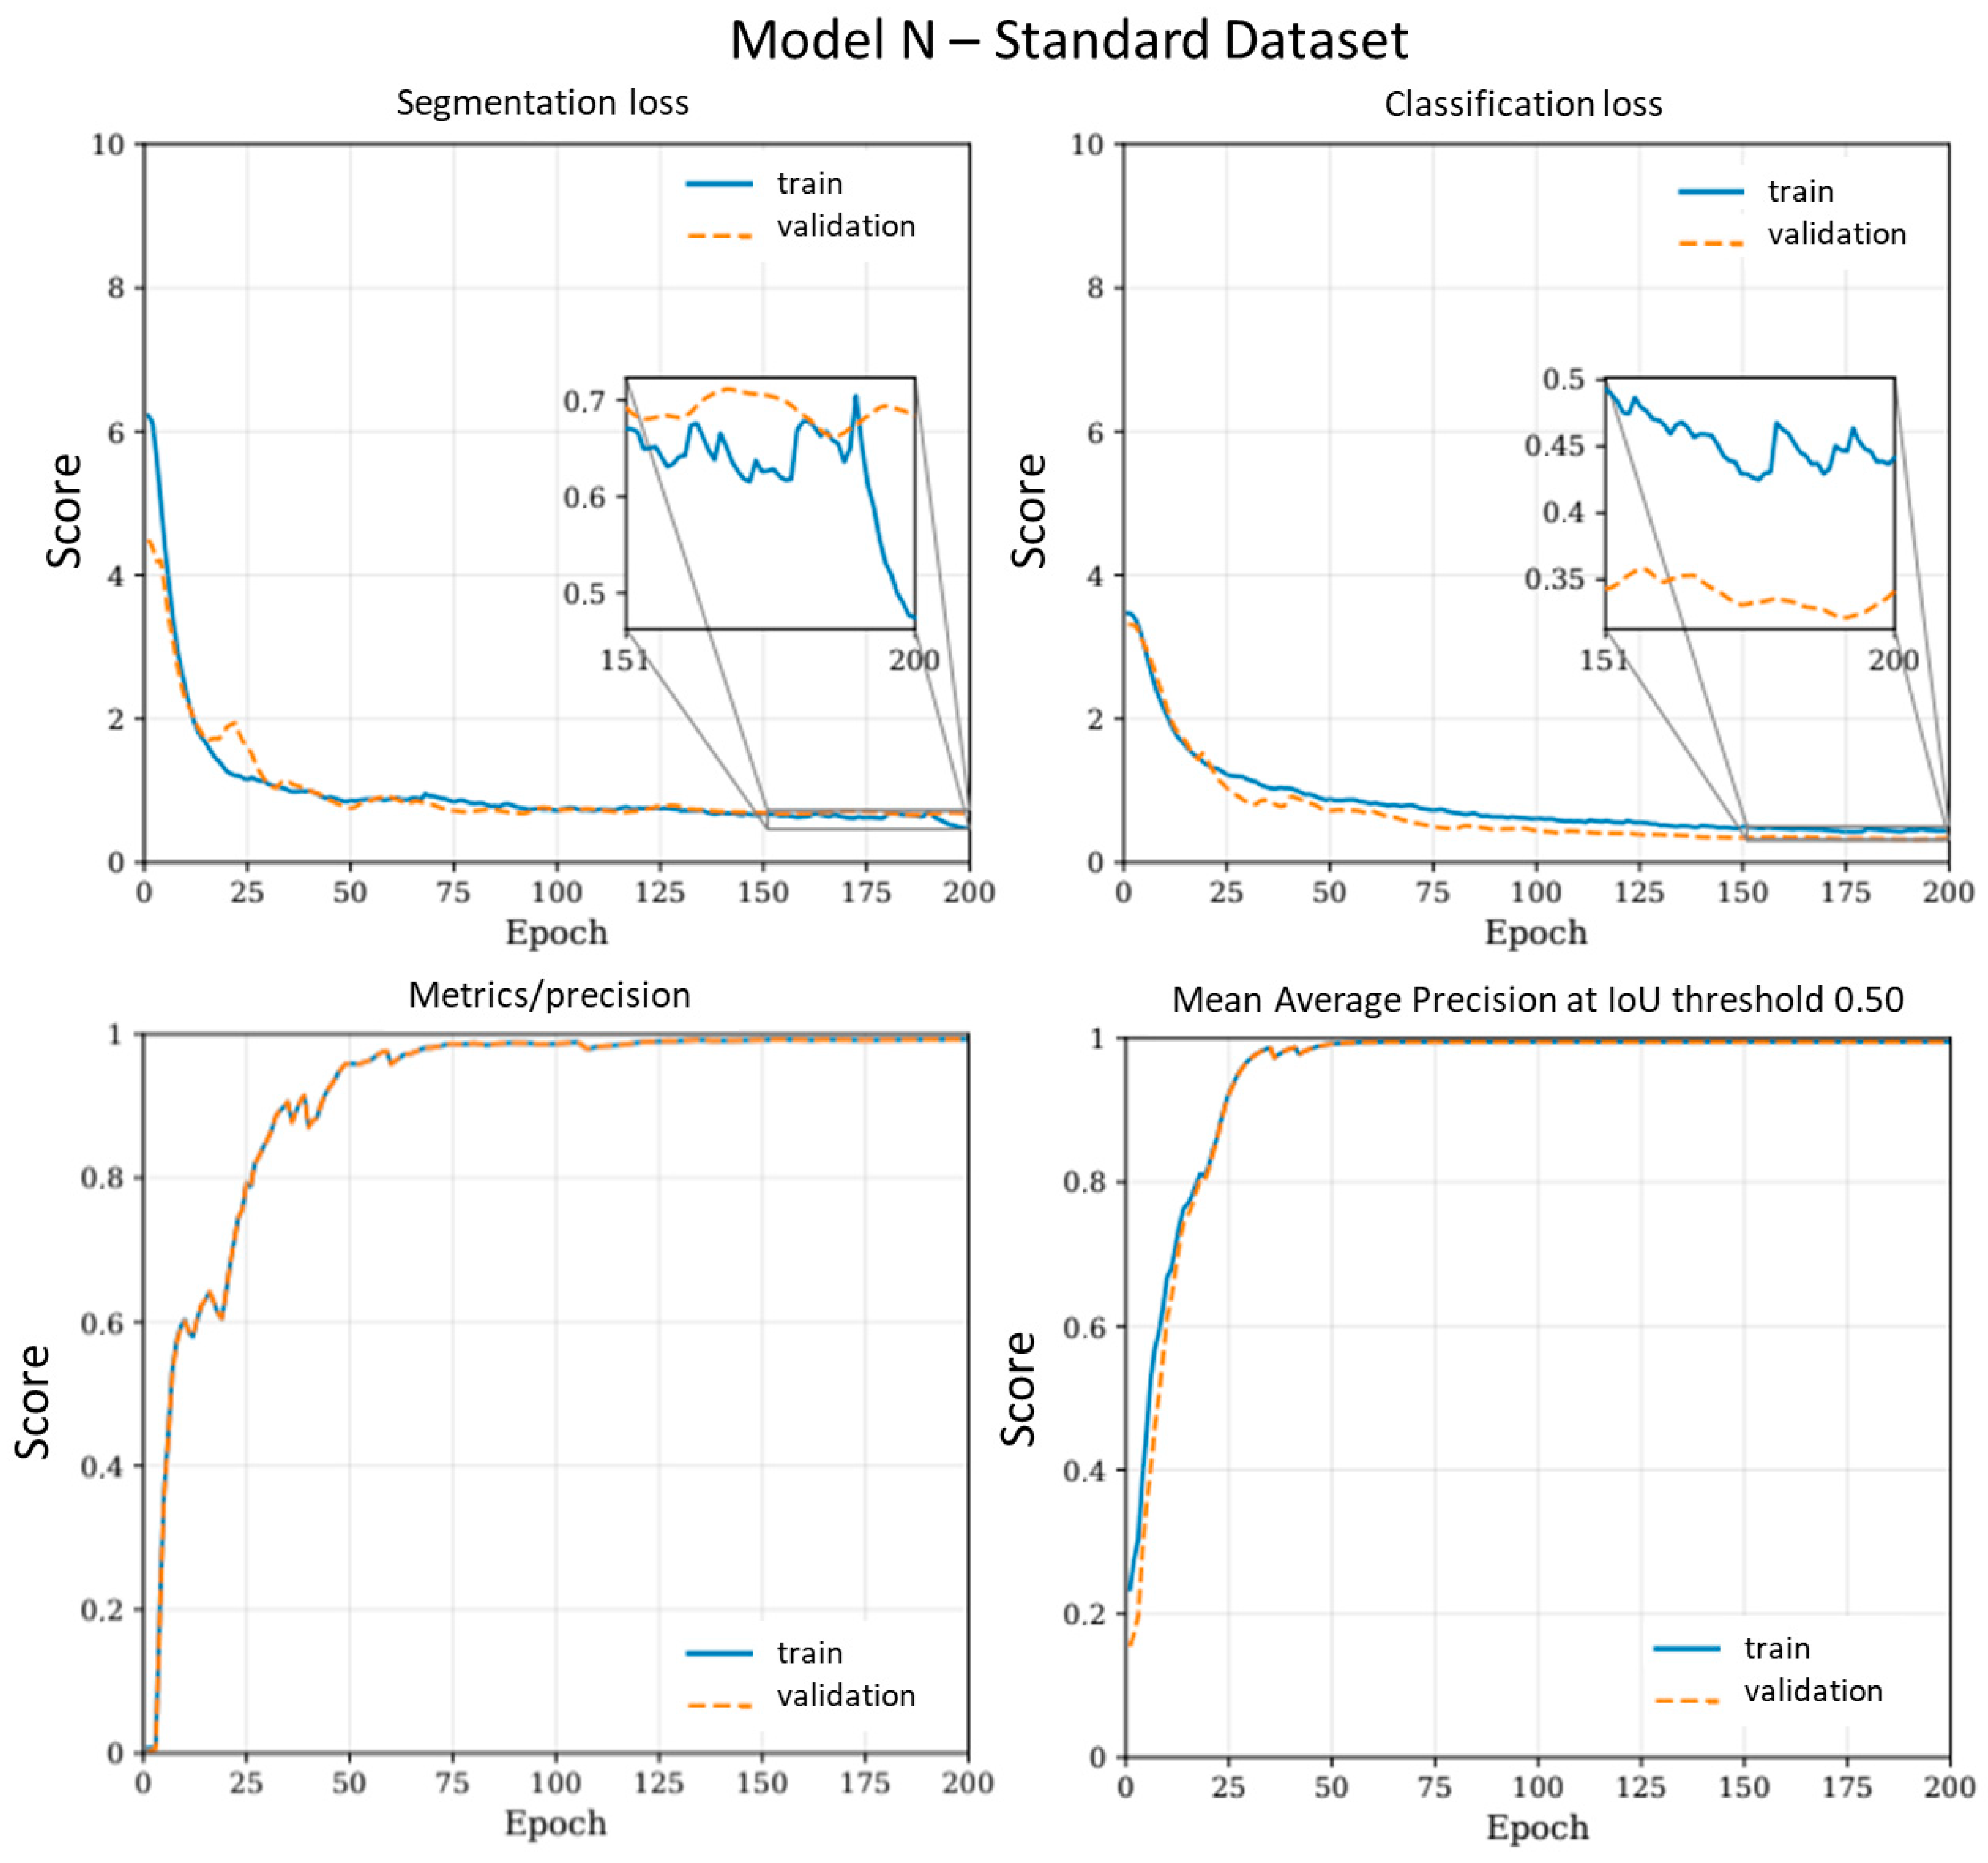
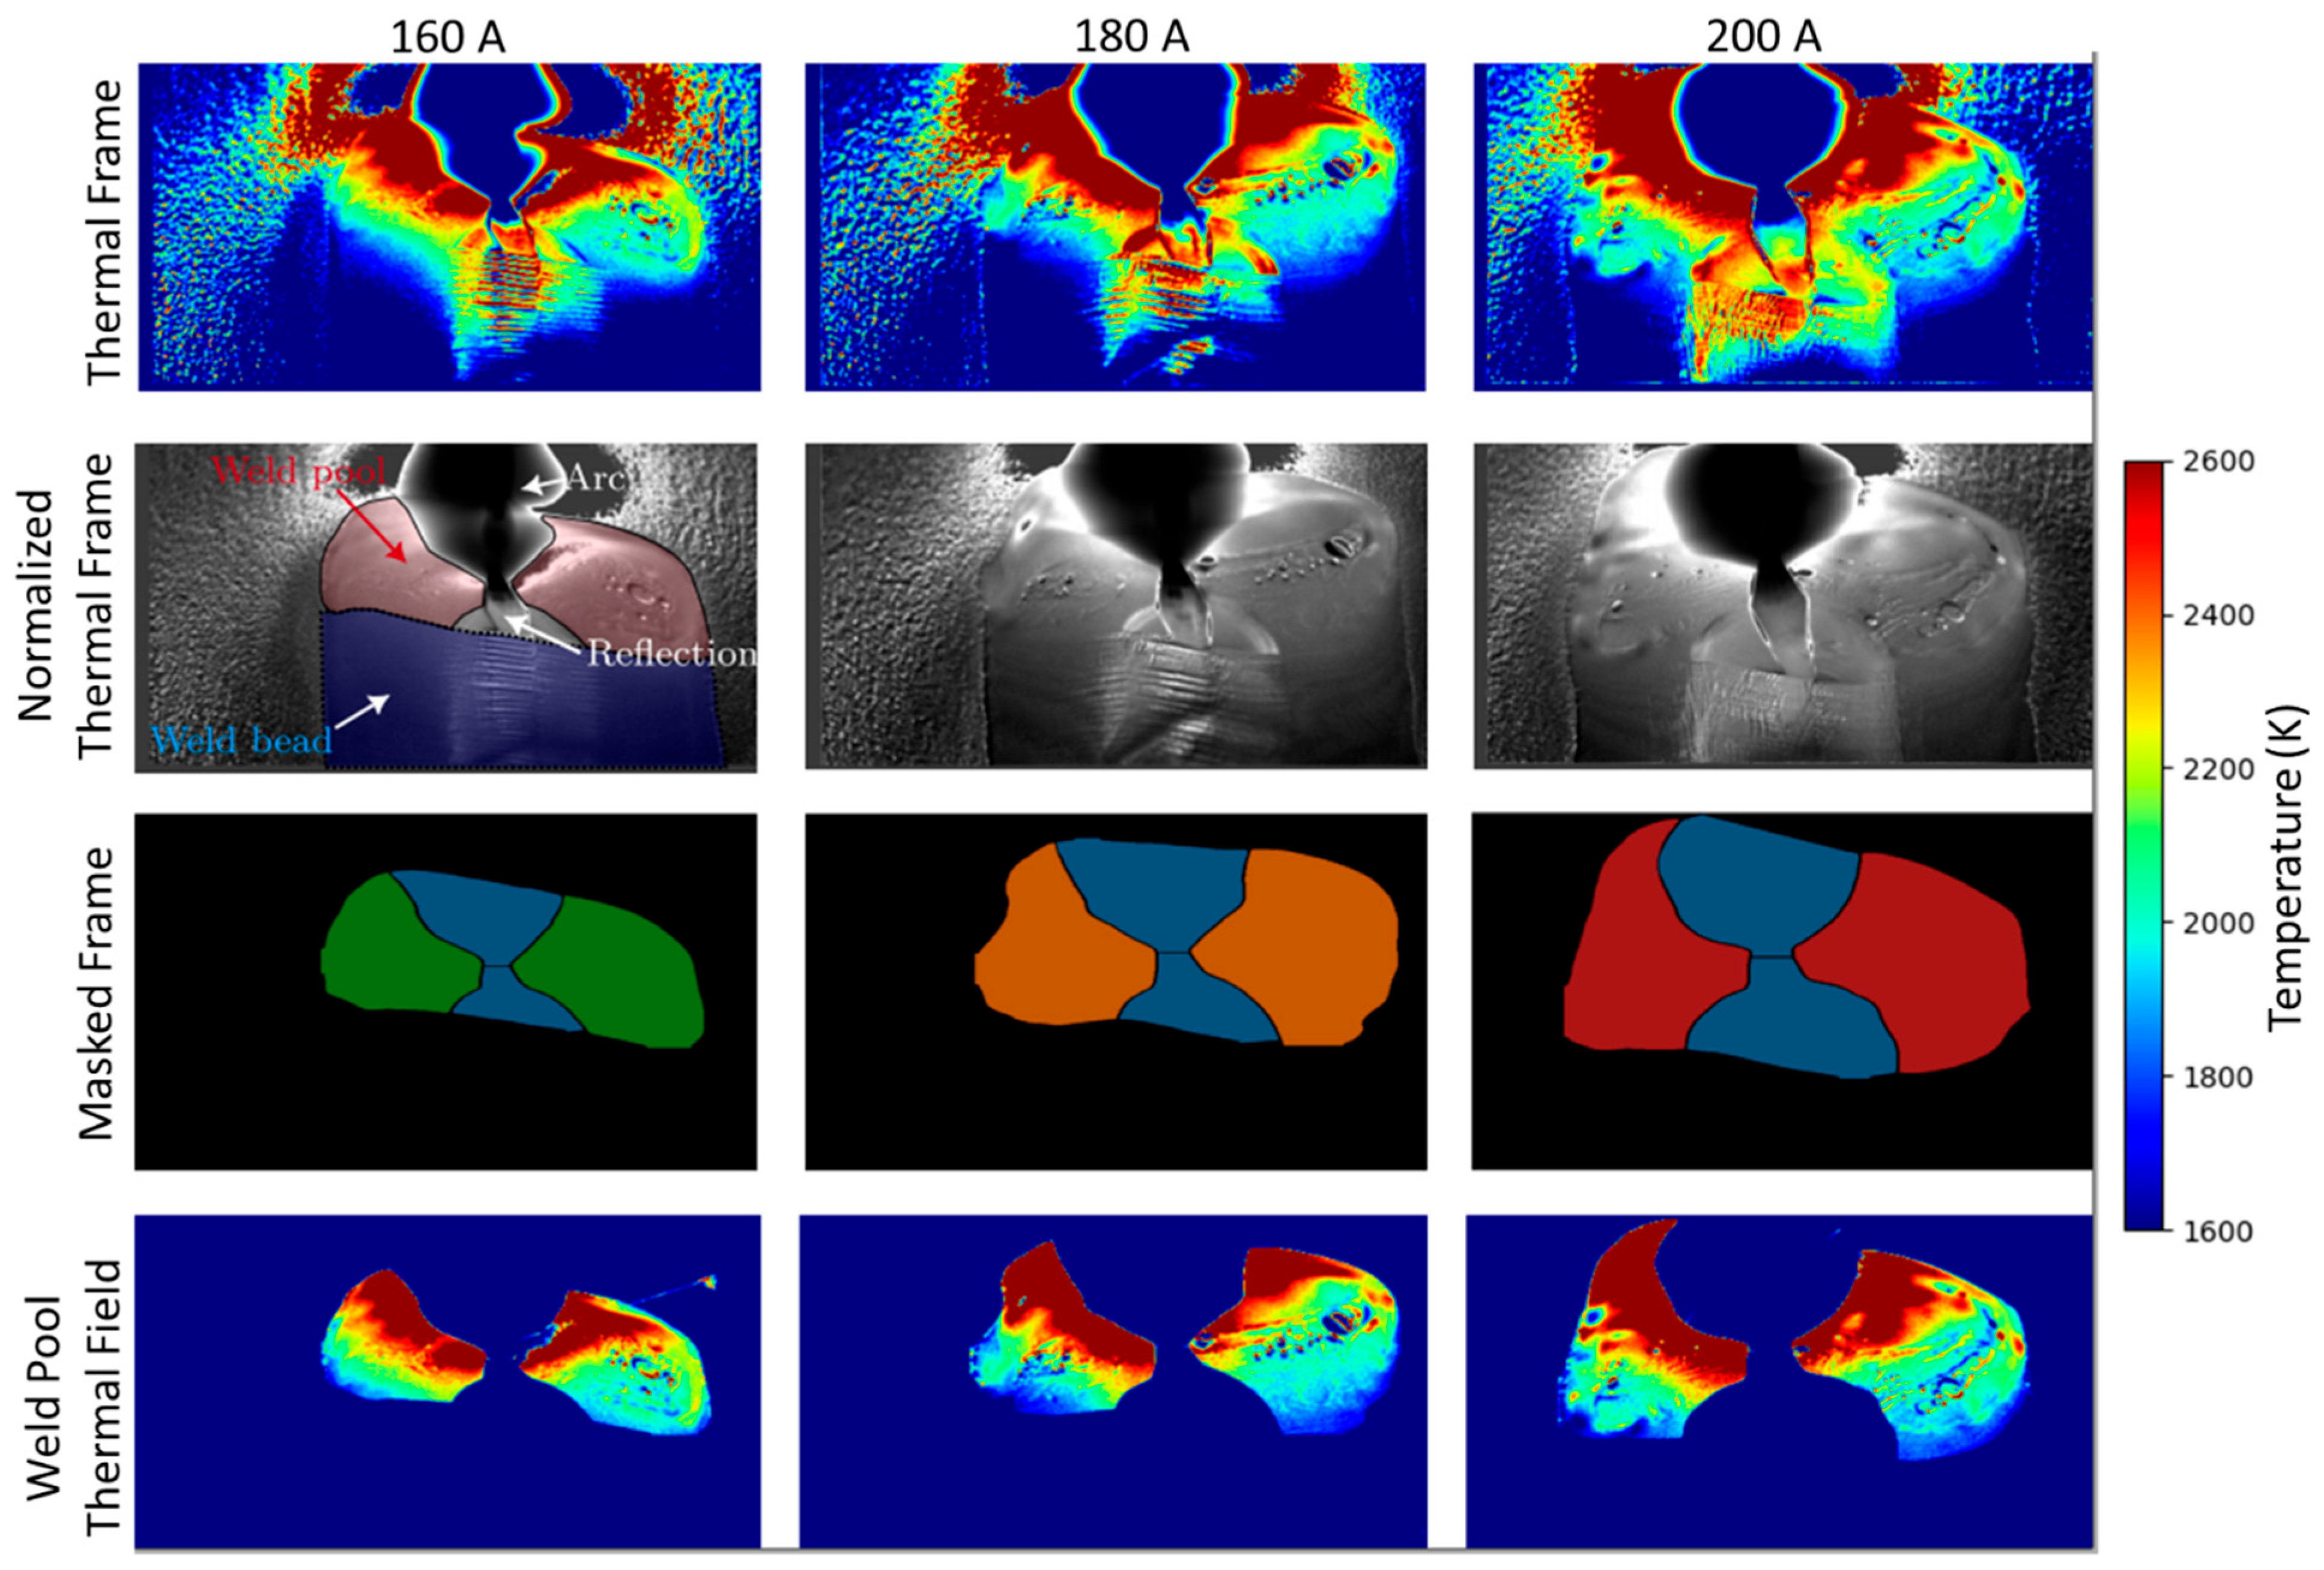
3.1. Segmentation Based on Thermal Field

Figure 6 illustrates the segmentation output generated by the YOLOv8m model for representative frames at each current level (160 A, 180 A, and 200 A). All of the tested models were able to delineate the molten pool region with high spatial precision, despite the limited training dataset (66 frames). Videos illustrating the segmentation performance of each YOLOv8 model variant, applied to the full sequence of thermal frames recorded throughout the welding process, are provided in the Supplementary Materials. Qualitatively, the segmented regions exhibit strong agreement with the actual contours of the thermal field (quantitative analyses through metrics such as IoU or mAP are unfeasible, as it would require all dataset base-truth masks). This suggests that even in the presence of potential disturbances such as arc reflection, oxide-induced emissivity variations, or arc dislocations, the YOLOv8 models can generalize effectively to maintain consistent segmentation performance.
A closer examination of the segmented masks across the three current levels reveals subtle differences in the projected weld pool size and shape, consistent with the expected thermal profile variations associated with the heat input. Notably, the segmentation masks at 200 A exhibited a marginally larger extent, reflecting the larger molten pool at the higher current level. No false positives or misclassified background regions were evident in the analyzed frames, indicating the model’s robustness in rejecting non-relevant thermal artifacts such as arc light. These findings confirm that YOLOv8 can serve not only as a segmentation tool but also as a filtering mechanism to define the region of interest (ROI) for further temperature-based analysis. Compared with traditional pixel-wise thresholding or region-growing techniques, YOLO’s instance segmentation approach might offer faster computation and higher specificity.

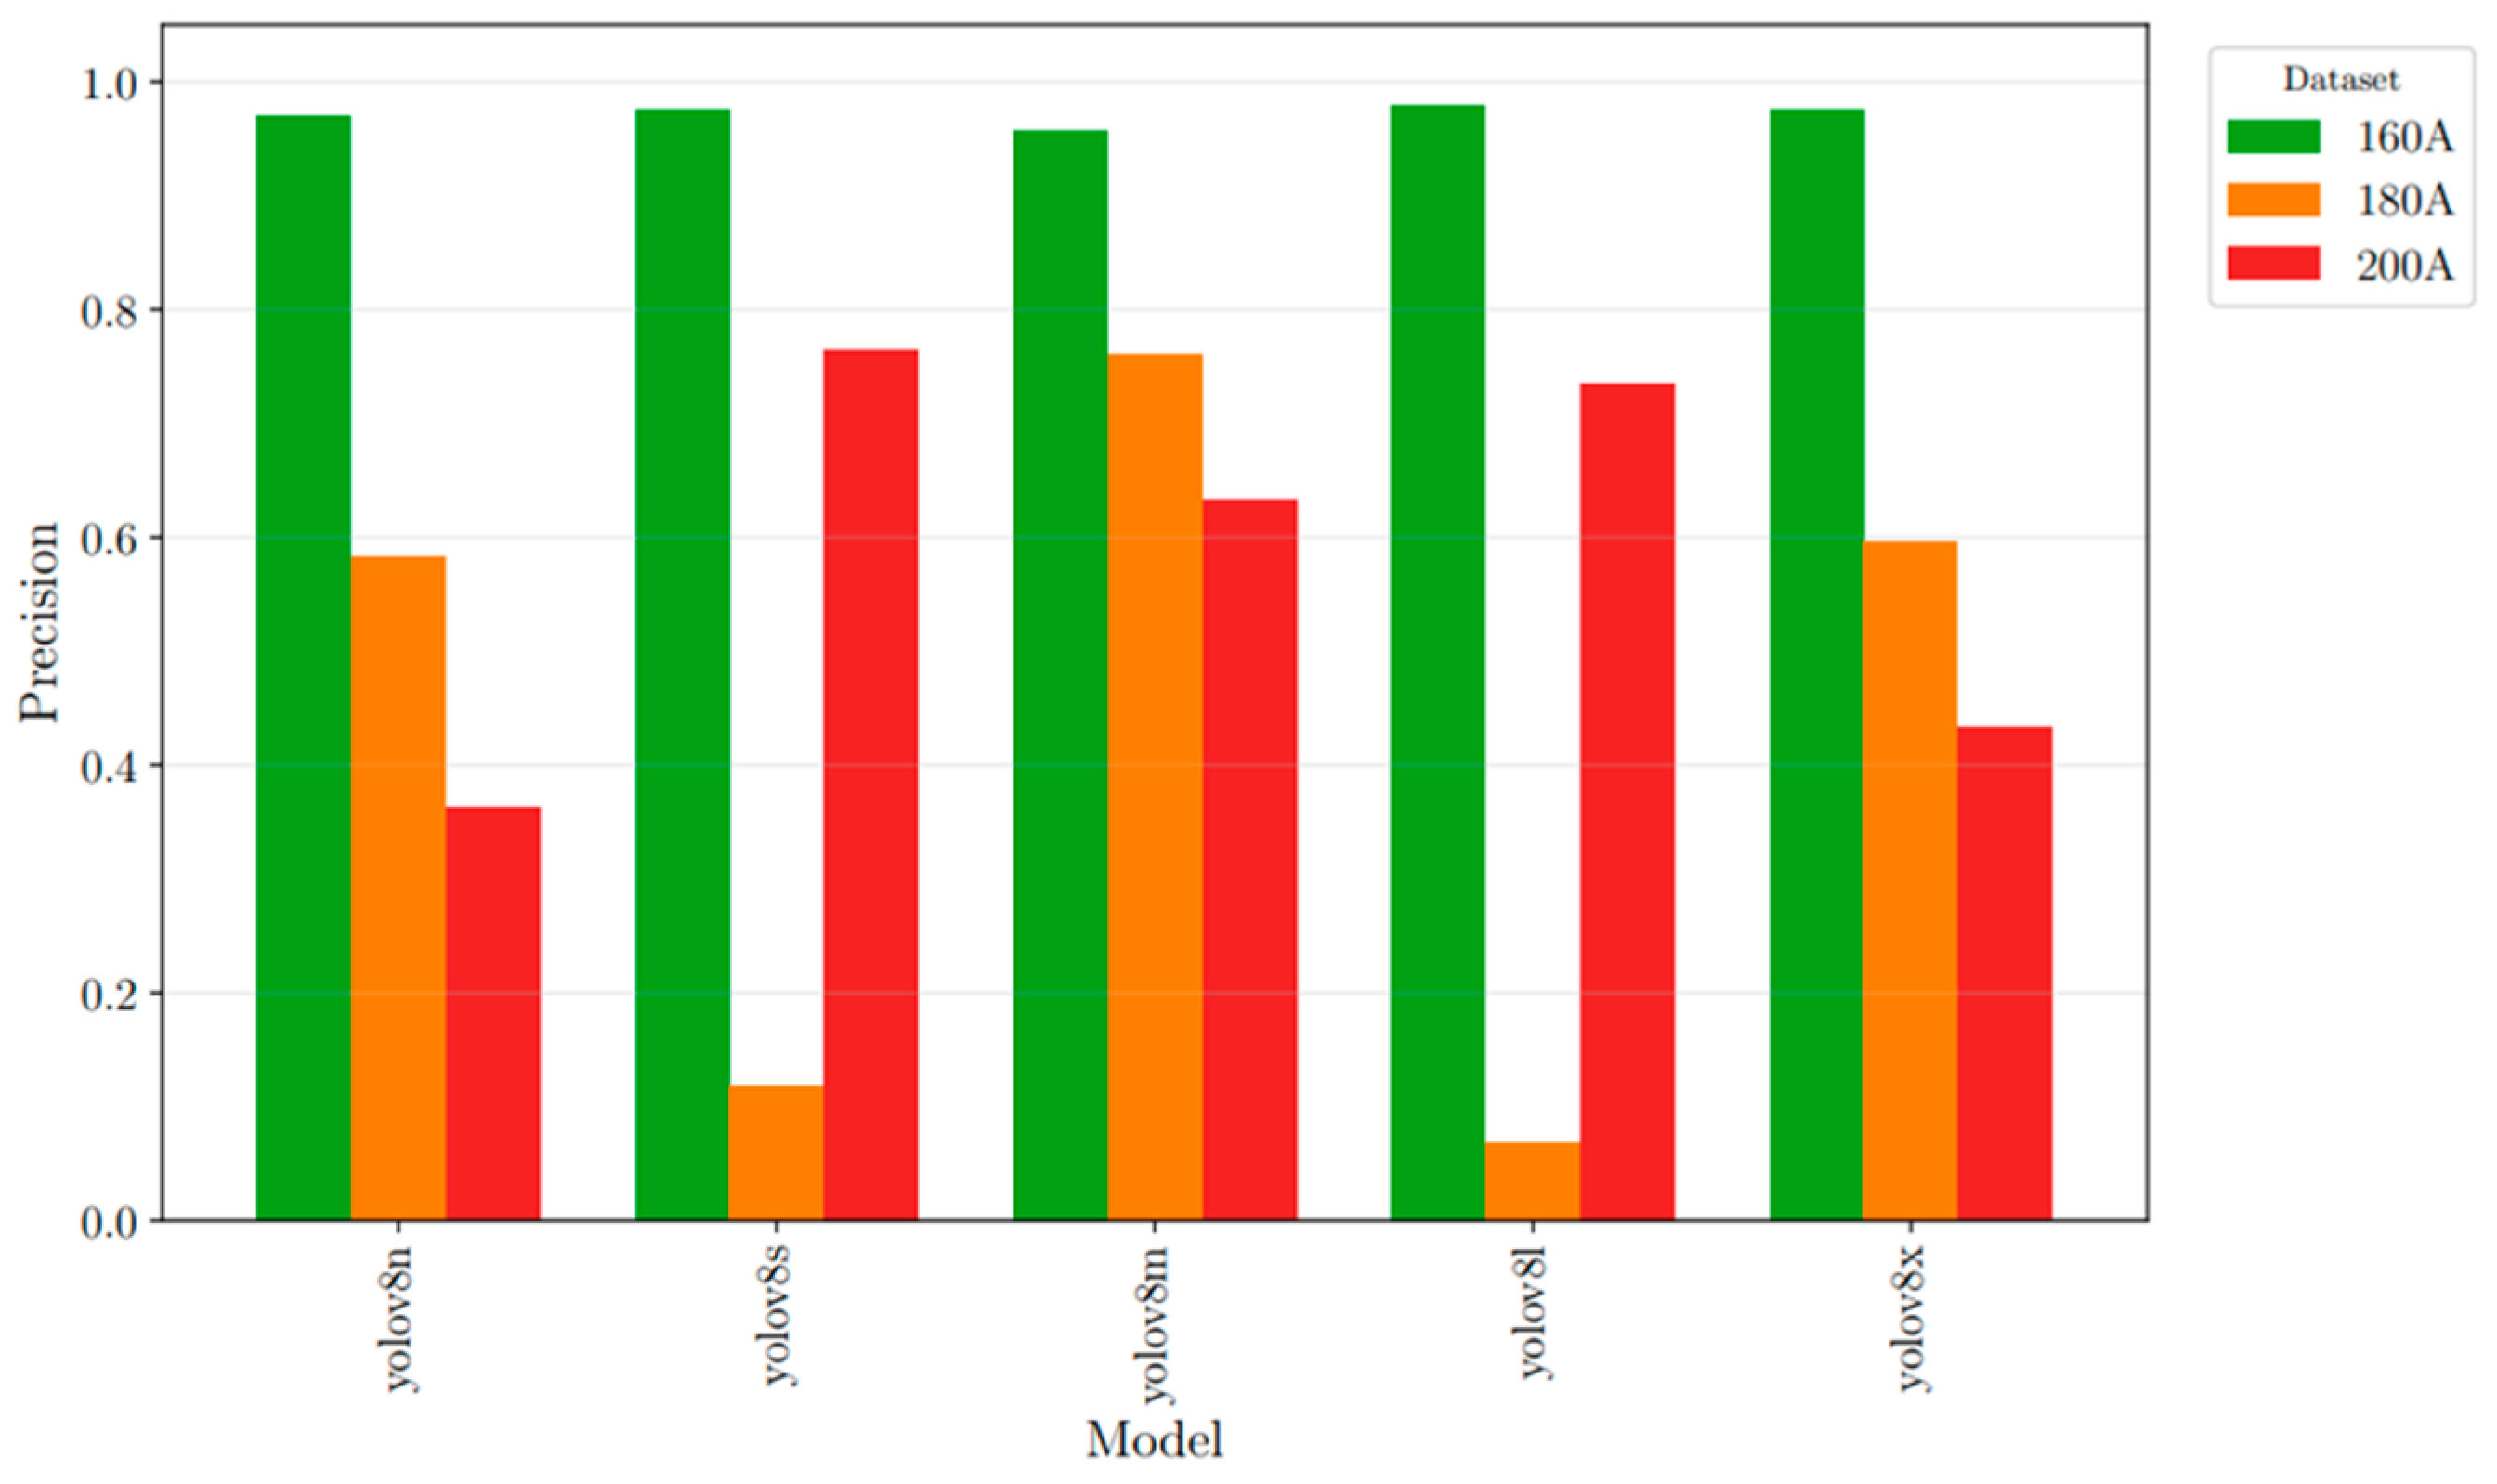
3.2. Classification Based on the Thermal Field Without Augmented Dataset

The classification precision obtained without applying data augmentation is presented in the first chart of Figure 7. The evaluation was conducted under a fixed confidence threshold of 0.7, and frames containing either multiple detected classes or no class at all were treated as incorrect. This strict criterion ensures that the classification accuracy reflects true discriminative performance rather than incidental detections. Interestingly, the highest classification accuracy was obtained at 160 A, while the performance declined at higher current levels (180 A and 200 A). This suggests that the features extracted under lower current conditions may be more stable and easier for the model to learn.
At higher currents, the reduction in classification precision was consistent across model variants. However, no strong qualitative differences were visually observed in the misclassified frames that could reliably explain this trend. Therefore, while hypotheses such as increased thermal instability or emissivity variation might be plausible, they cannot be confirmed based on the available data. Instead, the result may indicate that the thermal field patterns at higher currents present more subtle intra-class variation, reducing the model’s generalization. Alternative strategies beyond acquiring more data should be considered to enhance model robustness. For instance, extracting thermal features that are more sensitive to current-specific dynamics, or incorporating spatio-temporal information (such as the evolution of the weld pool across sequential frames), could improve classification performance under higher heat input conditions. Exploring current-dependent training schemes or multi-stream neural architectures may also help the model to better capture subtle intra-class variations, particularly in more complex thermal regimes.
In terms of model complexity, all YOLOv8 variants (ranging from nano to extra-large) were trained and tested under identical conditions. The nano (n) and small (s) models offered significantly faster inference times and required fewer computational resources, making them suitable for real-time and embedded applications. However, it is not possible to say that the increasing of model size (greater complexity) would lead to higher classification precision. For instance, the large-size model (l) delivered marginally lower performance, particularly in the 180 A case, but with a cost of greater processing time that could limit their applicability in latency-sensitive systems.
Interestingly, the precision advantage of larger models was not linear; the improvement from ‘m’ to ‘x’ was less pronounced than from ‘n’ to ‘m’, suggesting that beyond a certain capacity, gains in accuracy become saturated or outweighed by overfitting tendencies, especially in small datasets. Therefore, considering the trade-off between accuracy and processing cost, the YOLOv8n demonstrated a compelling balance, offering acceptable classification precision with minimal computational demand. This nuanced relationship between current level, thermal image characteristics, and model capacity underscores the importance of selecting a model variant that matches not only the accuracy requirement but also the hardware constraints and process dynamics of the intended deployment scenario.
Although the primary focus of this study was on the classification of weld pools according to current levels, the model was also trained to detect arc reflections as a separate object class. This inclusion was intended to help the model learn to distinguish non-relevant thermal artifacts from the weld pool itself. During evaluation, the detection precision for the “arc reflection” class was consistently close to 100% across all model sizes and current conditions. This outcome indicates that the model successfully recognized and isolated arc reflections without confusing them with the actual weld pool area. The ability to robustly reject such spurious thermal features reinforces the applicability of the model for real-world thermal monitoring tasks.

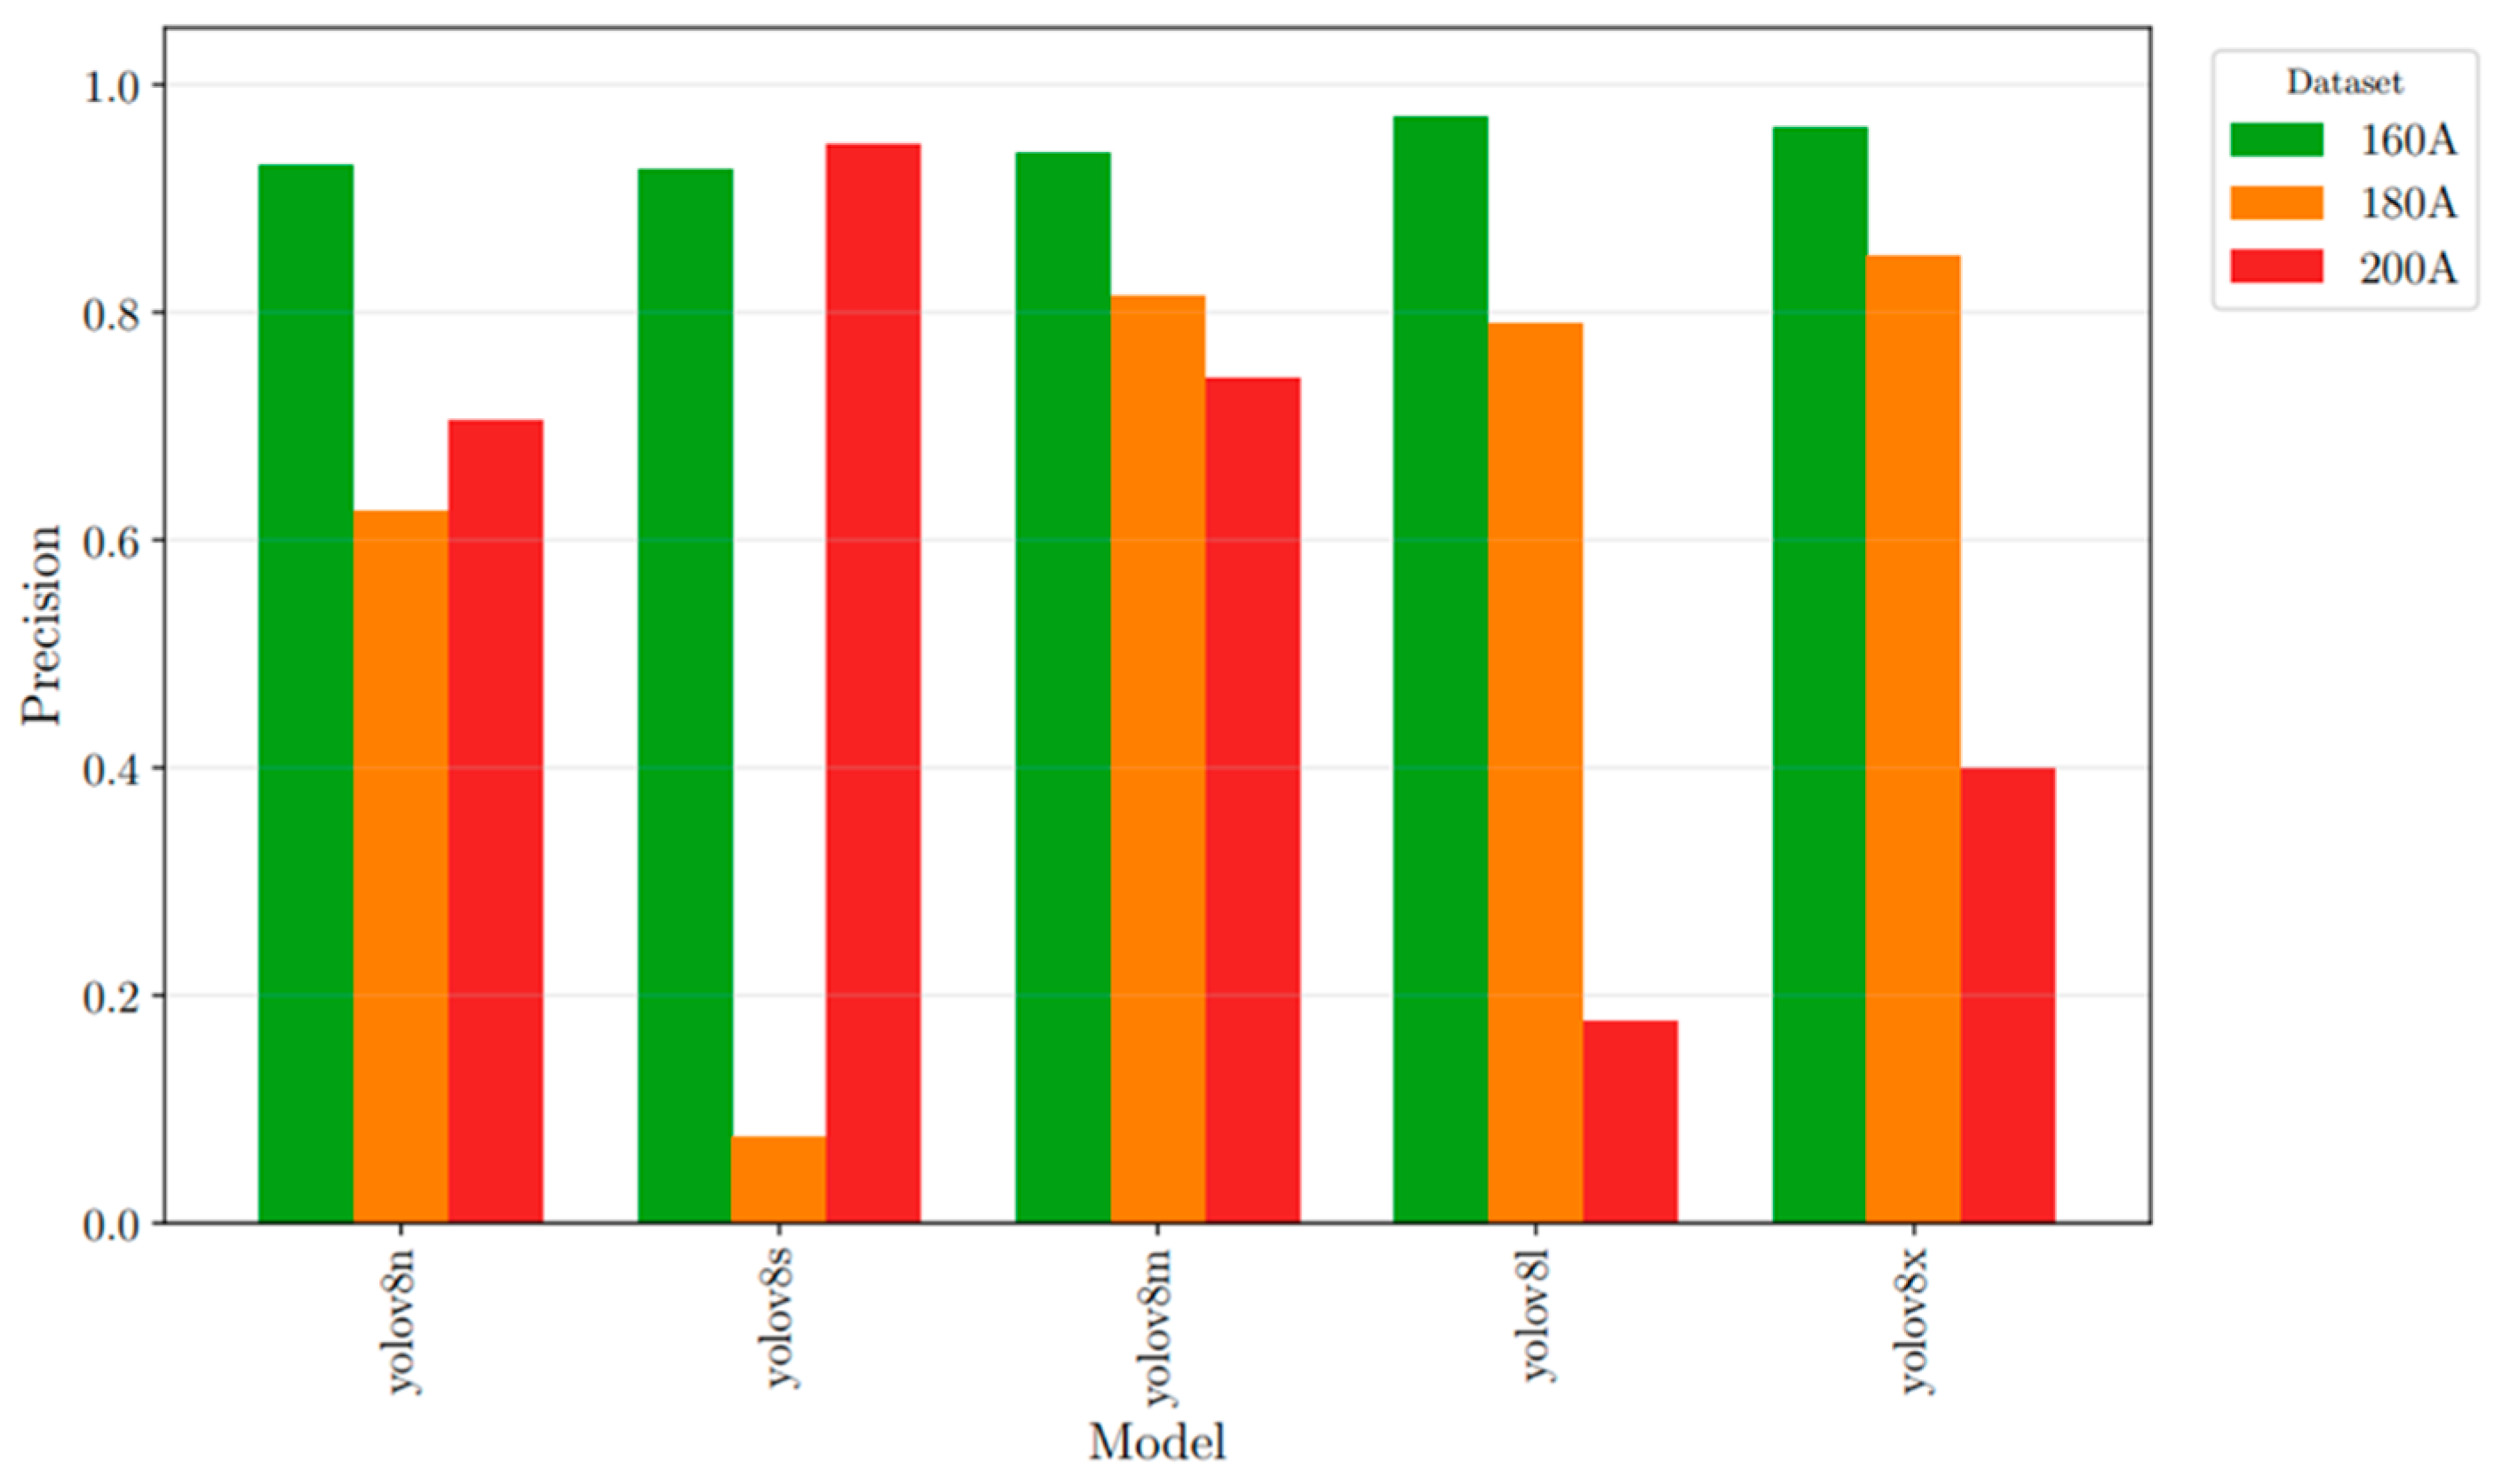
3.3. Classification Based on the Thermal Field with Augmented Data

The plot in Figure 8 presents the classification precision results after applying data augmentation strategies to the training dataset. Three augmentation techniques were implemented (horizontal flip, vertical flip, and combined flip), introducing spatial diversity aimed at improving model robustness, particularly under the limited-data regime of this study. Models with sizes “n” and “m” achieved a noticeable improvement in classification accuracy across all current levels, with the best trade-off between precision observed for YOLOv8m. Notably, the classification precision for 160 A remained the highest for all model sizes.
While it might be expected that larger models would benefit more from the expanded dataset (due to their higher parameter capacity and theoretical ability to learn subtle thermal differences), this trend was not consistently observed. In particular, classification precision at 180 A and 200 A did not improve uniformly with increasing model size. This suggests that beyond a certain model complexity, the marginal gains in classification accuracy may plateau or even diminish in small or moderately augmented datasets. It is possible that the larger models require even greater data variability to fully exploit their representational capacity and avoid overfitting to augmented patterns that do not generalize well across complex thermal fields.
It is also important to highlight that no hyperparameter tuning was performed in this study. All models were trained with the same default learning rate, batch size, and loss weighting settings. This constraint was intentional to allow for a fair comparison of model size effects under identical training conditions. However, it may have limited the ability of larger models to converge to optimal classification boundaries, particularly in scenarios where the data distribution is uneven or contains subtle inter-class overlaps.
To address error and residual analysis, the distribution of true positives (TPs), false positives (FPs), and false negatives (FNs) was examined across different current levels and YOLOv8 model sizes, as displayed in Table 3. The analysis of classification errors based on these metrics did not reveal a consistent or clear trend that could directly link higher error rates to a specific variable such as current intensity or model complexity. While simpler models like YOLOv8s showed higher misclassification rates under high-current conditions (e.g., 180 A), this behavior was not uniform across all architectures. For instance, YOLOv8m demonstrated robust performance at 180 A with and without data augmentation, suggesting that classification accuracy is influenced by a combination of factors, including sample quality, thermal variability, and model design. Moreover, FP and FN alternated as the predominant error sources depending on the current level and model, making it difficult to attribute misclassification to one type of error in particular. This lack of a clear pattern highlights the need for more targeted training strategies.

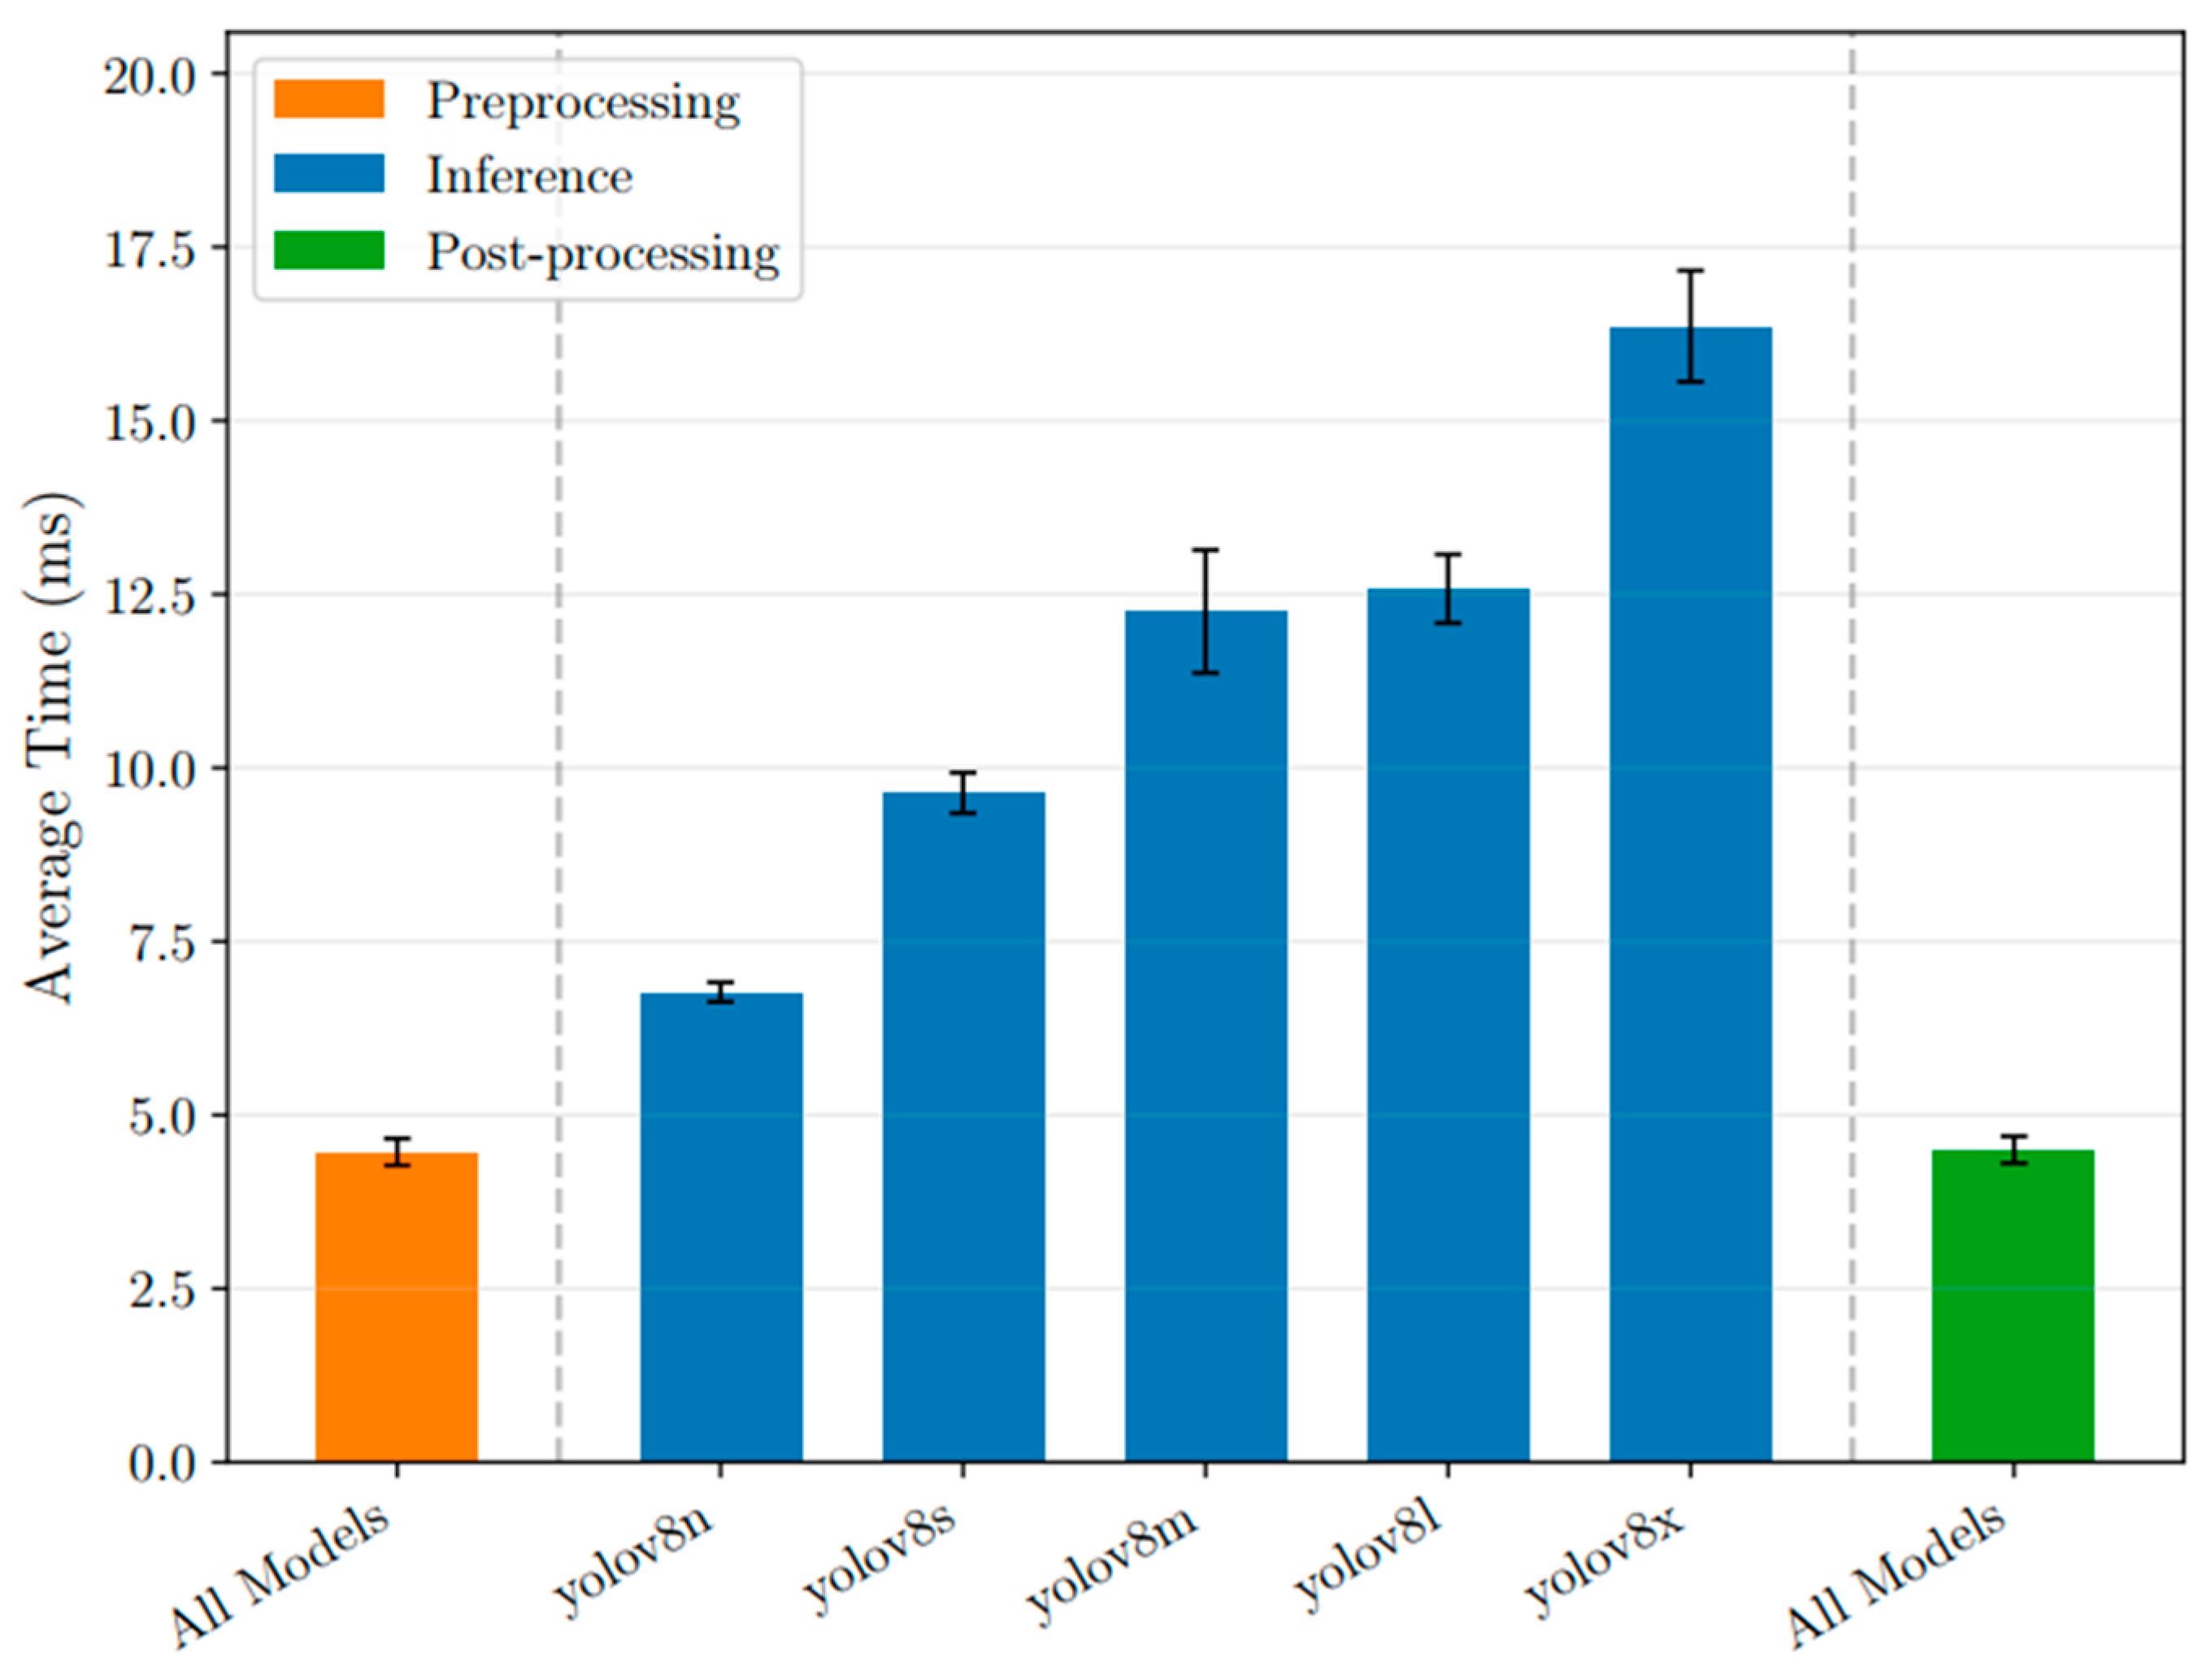
3.4. Processing Time

The average processing times across the three prediction stages (pre-processing, inference, and post-processing) are summarized in Figure 9. As the images had the same size and thus the same number of bits to be processed, pre-processing and post-processing times were the same regardless of the model used. All YOLOv8 model variants (n, s, m, l, x) were evaluated under identical conditions using GPU-based computation.
As expected, model size had a direct impact on inference time, with the YOLOv8n model achieving the lowest latency per frame, followed by its increasing in the order of model size until reaching the size “x”. Despite this increase, all models maintained total processing times (including pre- and post-processing) under 40 ms per frame, demonstrating that even the most complex configurations remain within practical limits for near real-time operation in low-to-medium frame rate applications.
The YOLOv8n model stood out for its optimal balance between speed and functional capability, which could be suitable for integration into high-frequency monitoring loops (e.g., 10–15 Hz) where fast feedback is critical. This includes adaptive process control, early defect warning systems, or dynamic heat input compensation. While the precision of YOLOv8n was slightly lower than that of the larger variants (e.g., the “m” size model), its speed advantage makes it an ideal candidate for real-time deployments where computational resources are limited.
The inference times across model sizes followed a quasi-linear trend with respect to parameter count, but their relative accuracy gains were nonlinear. This suggests that beyond a certain threshold (e.g., from YOLOv8m to YOLOv8x), the added computational cost may outweigh the marginal precision improvements for many industrial scenarios. In all cases, pre-processing and post-processing times remained negligible, indicating that optimization efforts should focus primarily on inference acceleration if further reductions in latency are required. Moreover, the segmentation and classification tasks were performed jointly within a single forward pass of the model, preserving computational efficiency and reducing pipeline complexity.

4. General Discussion

This study advances the current state of YOLO-based thermal weld monitoring by shifting the focus to rear-side observation of the molten pool, a configuration that presents unique challenges compared to the more commonly investigated front-side monitoring. Unlike the prior work by Jorge et al. [19], which employed YOLO architectures for segmentation and classification of back-side plate-view thermal images, the present research addresses thermal field distortions caused by top-side reflections, oxide-driven emissivity variations, and constrained spatial visibility. In addition, the current work introduces a multi-task training scheme, wherein YOLOv8 models are trained to simultaneously segment the weld pool and classify the welding current based solely on the thermal field. This dual-task setup, combined with the explicit annotation of arc reflection as a separate class, enables the model to better discriminate between meaningful and misleading thermal patterns. Furthermore, the investigation was designed under a limited-data regime, reflecting industrial scenarios where high-quality labeled datasets are often scarce. By comparing five YOLOv8 variants and assessing the impact of data augmentation, this study provides practical insights into the trade-offs between model complexity, accuracy, and real-time feasibility, offering a more comprehensive analysis than previous YOLO-based weld monitoring studies.
The model’s ability to generalize effectively from a limited number of training frames can be attributed to the intrinsic low variance of thermal patterns during the steady-state between frames. In this phase, once the arc and wire feeding stabilize, the molten pool geometry and associated temperature gradients become relatively consistent across consecutive frames. This low intra-class variance enables the YOLOv8 models to extract and reinforce reliable spatial features linked to each current condition, even from a small dataset. Furthermore, the use of high-resolution thermal images and precise manual annotations likely contributed to enhancing the quality of feature learning, helping the models distinguish relevant structures.
Table 4 presents an overall comparison of YOLOv8 model sizes by averaging the performance metrics across the three welding current conditions (160 A, 180 A, and 200 A). YOLOv8n, with the smallest number of parameters (3.15 M), offered the fastest inference time (15.9 ms/frame) but showed limited precision (75.33%). YOLOv8s and YOLOv8l did not show consistent precision improvements despite higher complexity, indicating possible overfitting or underutilization of additional parameters. YOLOv8m provided the best balance between precision (83.25%) and processing time (21.4 ms/frame), standing out as the most efficient architecture for the proposed task. In contrast, YOLOv8x, the largest and slowest model, did not deliver proportionally better accuracy, suggesting diminishing returns with increasing model size. These results reinforce the importance of selecting a model that balances accuracy with computational cost, especially in real-time monitoring scenarios.
Although promising, the results are based on a relatively narrow dataset acquired under controlled conditions. Therefore, generalization to broader scenarios involving different materials, camera configurations, or environmental conditions remains a topic for future investigation. Such extensions will be essential to assess the robustness and adaptability of YOLO-based models for more diverse industrial welding applications.

5. Conclusions

This study investigated the application of YOLOv8 models to thermal image analysis in the context of rear-side weld pool monitoring during GTAW. The results provide promising evidence of YOLO’s effectiveness in both segmentation and classification tasks, even under limited training data conditions.
  • All YOLOv8 model variants successfully segmented the molten pool with high spatial precision. Despite visual challenges such as arc reflections, deviations, weld pool boundaries motion, the models maintained accurate delineation of the weld pool across current levels, demonstrating their robustness to thermal field disturbances. Furthermore, the segmented masks preserved essential thermal features, validating YOLO’s use not only as a region-of-interest (ROI) extractor but also as a pre-processing tool for downstream temperature-based analyses.
  • The classification performance of the YOLOv8 models applied to weld pool thermal images showed that it is feasible to distinguish between different welding current levels using rear-side thermal monitoring. Among the evaluated architectures, YOLOv8m achieved the highest classification precision of 83.25%.
  • Moderate data augmentation can enhance generalization, even when the number of original samples is limited. For instance, YOLOv8m architecture benefited from 78.3% to 83.25% with augmented dataset.
  • YOLOv8m emerged as the most balanced architecture, offering high accuracy with acceptable latency (21.4 ms/frame), making it well suited for real-time monitoring applications. YOLOv8n, while the fastest (15.9 ms/frame), had lower precision, and YOLOv8x showed diminishing returns in precision despite its higher complexity.
In summary, the findings confirm the feasibility of employing YOLO-based models for robust, real-time thermal monitoring of the weld pool in GTAW. The approach enables reliable segmentation and classification without requiring extensive datasets. Future work may focus on integrating the YOLO-based pipeline into closed-loop control systems or exploring spatial–temporal models for dynamic welding condition prediction.

Supplementary Materials

The following supporting information can be downloaded at: https://www.mdpi.com/article/10.3390/met15080836/s1, Video S1: standard-dataset-welding-160; Video S2: standard-dataset-welding-180; Video S3: standard-dataset-welding-200; Video S4: augmented-dataset-welding-160; Video S5: augmented-dataset-welding-180; Video S6: augmented-dataset-welding-200.

Author Contributions

Conceptualization: V.L.J., I.B., F.S. and C.B.; methodology: V.L.J.; investigation: V.L.J. and Z.B.; formal analysis: V.L.J. and Z.B.; validation: V.L.J., F.S. and C.B.; data curation: V.L.J., Z.B. and T.B.; writing—original draft preparation: V.L.J.; writing—review and editing: V.L.J., Z.B., T.B., I.B., F.S. and C.B.; supervision: F.S. and C.B., project administration: C.B. All authors have read and agreed to the published version of the manuscript.

Funding

This work was supported by Électricité de France—EDF (grant No. DOS177126) and BPI France.

Data Availability Statement

The original contributions presented in this study are included in the article/Supplementary Materials. Further inquiries can be directed to the corresponding author.

Acknowledgments

The authors gratefully acknowledge the University of Montpellier, France, for their generous support in providing laboratory infrastructure and essential materials, which played a vital role in the success of this research.

Conflicts of Interest

Author Theo Boutin was employed by the company EDF R&D. The remaining authors declare that the research was conducted in the absence of any commercial or financial relationships that could be construed as a potential conflict of interest. Besides, the authors declare that this study received funding from Électricité de France and BPI France. The funder was not involved in the study design, collection, analysis, interpretation of data, the writing of this article or the decision to submit it for publication.

References

  1. Wang, X.; Zhang, J.; Tashiro, S.; Tanaka, M. Study of Molten Pool Dynamics in Keyhole TIG Welding by Numerical Modelling. J. Manuf. Process. 2024, 119, 827–841. [Google Scholar] [CrossRef]
  2. Jiang, Z.; Cong, B.; Zeng, C.; Yang, Q.; Zhang, Q.; Xiao, H.; Zhang, T.; Qi, B. Correlation Analysis of Current, Molten Pool, and Weld Formation in Double-Pulsed Variable Polarity TIG Welding. J. Manuf. Process. 2024, 131, 724–735. [Google Scholar] [CrossRef]
  3. Wu, S.; Zhao, F.; Wang, P.; Gong, S.; Wu, Z. Study on Molten Pool Flow and Porosity Defects in Laser–Tungsten Inert Gas (TIG) Welding of 4J36 Invar Steel. Materials 2025, 18, 1824. [Google Scholar] [CrossRef]
  4. Zhang, Y.; Li, Y.; Zhang, Y.; Zong, R. Numerical Analysis of the Behavior of Molten Pool and the Suppression Mechanism of Undercut Defect in TIG–MIG Hybrid Welding. Int. J. Heat Mass Transf. 2024, 218, 124757. [Google Scholar] [CrossRef]
  5. Xu, F.; Xu, Y.; Zhang, H.; Chen, S. Application of Sensing Technology in Intelligent Robotic Arc Welding: A Review. J. Manuf. Process. 2022, 79, 854–880. [Google Scholar] [CrossRef]
  6. Deshpande, S.; Babu, D.; Pradhan, S.; Kamesh, D.; Venugopal, S. Deep Learning-Based Image Segmentation for Defect Detection in Additive Manufacturing: An Overview. Int. J. Adv. Manuf. Technol. 2024, 134, 2081–2105. [Google Scholar] [CrossRef]
  7. Liu, T.; Zheng, P.; Bao, J. Deep Learning-Based Welding Image Recognition: A Comprehensive Review. J. Manuf. Syst. 2023, 68, 601–625. [Google Scholar] [CrossRef]
  8. Yu, R.; Huang, Y.; Peng, Y.; Wang, K. Monitoring of Butt Weld Penetration Based on Infrared Sensing and Improved Histograms of Oriented Gradients. J. Mater. Res. Technol. 2023, 22, 3280–3293. [Google Scholar] [CrossRef]
  9. Jiang, R.; Xiao, R.; Chen, S. Prediction of Penetration Based on Infrared Thermal and Visual Images during Pulsed GTAW Process. J. Manuf. Process. 2021, 69, 261–272. [Google Scholar] [CrossRef]
  10. Jorge, V.L.; Bendaoud, I.; Soulié, F.; Bordreuil, C. High-Resolution Thermal Imaging for Melt Pool Dynamics Studies in TIG Welding Process. Weld. World, 2025; in press. [Google Scholar] [CrossRef]
  11. Górka, J.; Jamrozik, W. Enhancement of Imperfection Detection Capabilities in TIG Welding of the Infrared Monitoring System. Metals 2021, 11, 1624. [Google Scholar] [CrossRef]
  12. Buongiorno, D.; Melchiorri, A.; Cammarano, A.; Grasso, M. Inline Defective Laser Weld Identification by Processing Thermal Image Sequences with Machine and Deep Learning Techniques. Appl. Sci. 2022, 12, 6455. [Google Scholar] [CrossRef]
  13. Jorge, V.L.; Bendaoud, I.; Soulié, F.; Bordreuil, C. Rear Weld Pool Thermal Monitoring in GTAW Process Using a Developed Two-Colour Pyrometer. Metals 2024, 14, 937. [Google Scholar] [CrossRef]
  14. Yu, R.; Huang, Y.; Wu, H.; Yang, H.; Zhang, H. Deep Learning-Based Real-Time and In-Situ Monitoring of Weld Penetration: Where We Are and What Are Needed Revolutionary Solutions. J. Manuf. Process. 2023, 93, 15–46. [Google Scholar] [CrossRef]
  15. Zhang, Z.; Wen, G.; Chen, S. Weld Image Deep Learning-Based On-Line Defects Detection Using Convolutional Neural Networks for Al Alloy in Robotic Arc Welding. J. Manuf. Process. 2019, 45, 208–216. [Google Scholar] [CrossRef]
  16. Knaak, C.; Gennrich, B.; Kuhn, R.; Kalms, M. A Spatio-Temporal Ensemble Deep Learning Architecture for Real-Time Defect Detection during Laser Welding on Low Power Embedded Computing Boards. Sensors 2021, 21, 4205. [Google Scholar] [CrossRef]
  17. Hussain, M. YOLO-v1 to YOLO-v8, the Rise of YOLO and Its Complementary Nature toward Digital Manufacturing and Industrial Defect Detection. Machines 2023, 11, 677. [Google Scholar] [CrossRef]
  18. Redmon, J.; Divvala, S.; Girshick, R.; Farhadi, A. You Only Look Once: Unified, Real-Time Object Detection. In Proceedings of the 2016 IEEE Conference on Computer Vision and Pattern Recognition (CVPR), Las Vegas, NV, USA, 27–30 June 2016; pp. 779–788. [Google Scholar] [CrossRef]
  19. Jorge, V.L.; Bendaoud, I.; Soulié, F.; Bordreuil, C. Deep Learning-Based YOLO for Semantic Segmentation and Classification of Weld Pool Thermal Images. Int. J. Adv. Manuf. Technol. 2025; in press. [Google Scholar] [CrossRef]
  20. Gao, A.; Han, Y.; Song, S.; Lu, L.; Zheng, L. YOLO-Weld: A Modified YOLOv5-Based Weld Feature Detection Network for Extreme Weld Noise. Sensors 2023, 23, 5640. [Google Scholar] [CrossRef]
  21. Asadi, R.; Rahmani, A.; Garmabi, H.; Asadi, R. Process Monitoring by Deep Neural Networks in Directed Energy Deposition: CNN-Based Detection, Segmentation, and Statistical Analysis of Melt Pools. Robot. Comput. Integr. Manuf. 2024, 87, 102710. [Google Scholar] [CrossRef]
  22. Jocher, G.; Chaurasia, A.; Qiu, J.; Stoken, A. YOLO by Ultralytics. GitHub Repository. 2023. Available online: https://github.com/ultralytics/ultralytics (accessed on 18 July 2025).
Figure 1. (a) Top-view schematic illustrating the internal components of the optical cage assembly; (b) External view of the complete measurement system.
Metals 15 00836 g001
Figure 2. Experimental setup used in the experiments.
Metals 15 00836 g002
Figure 3. Flowchart of YOLO-based thermal image analysis implementation.
Metals 15 00836 g003
Figure 4. Three reflection-based transformations employed data augmentation.
Metals 15 00836 g004
Figure 5. Metrics achieved after 200 epochs of training by using YOLOv8 (yolov8n-seg.pt pre-trained model) from 66 thermal frames (22 frames from each experiment).
Metals 15 00836 g005
Figure 6. One representative frame of each current demonstrating the results obtained from the segmentation task (frames taken from the YOLOv8m model applied to thermal frames recorded).
Metals 15 00836 g006
Figure 7. Precision was obtained for the classification without dataset augmentation at a confidence threshold of 0.7 (only the correctly classified target class in the respective welding current experiment frame during the steady-state period was considered). Frames with multiple recognized classes or no detections were treated as classification errors.
Metals 15 00836 g007
Figure 8. Precision was obtained for the classification using dataset augmentation at a confidence threshold of 0.7 (only the correctly classified target class in the respective welding current experiment frame during the steady-state period was considered). Frames with multiple recognized classes or no detections were treated as classification errors.
Metals 15 00836 g008
Figure 9. Average processing time across the three stages involved in the prediction of a single frame (pre-processing, inference, and post-processing), addressing both segmentation and classification tasks.
Metals 15 00836 g009
Table 1. Main process parameters and material specifications used in the GTAW experiments for thermal image acquisition.
ParameterValue
Welding processGTAW (DC power mode)
Base material316L Stainless Steel (150 × 50 × 10 mm)
Filler wireER 316L (RCC-M), Ø 1.0 mm
Welding current levels160 A, 180 A, 200 A
Travel speed2.5 mm/s
Wire feed speed2.7 m/min
Electrode2.4 mm tungsten, 2% La, 38° grinding angle
Electrode-to-work distanceAVC-controlled (10.7 V)
Shielding gasArgon 99.995% (Grade 4.5)
Gas flow rate13 L/min
Table 2. Training hyperparameters configuration.
ArgumentValueFunction
Batch size8The number of samples processed simultaneously in a single forward and backward pass during training
Workers8Data loading threads utilized during training
Box7.5Box loss contribution in the overall loss function
Cls0.5Classification loss contribution in the overall loss function
Seed0It governs the random number generation used in operations involving randomness
Lr00.01Initial learning rate
Lrf0.01Final learning rate as a fraction of the initial rate
Epochs200Total number of training iterations over the dataset
Image size640 × 640Input image size resized to match YOLOv8 requirements
Confidence threshold0.7Minimum confidence for prediction to be considered valid during inference
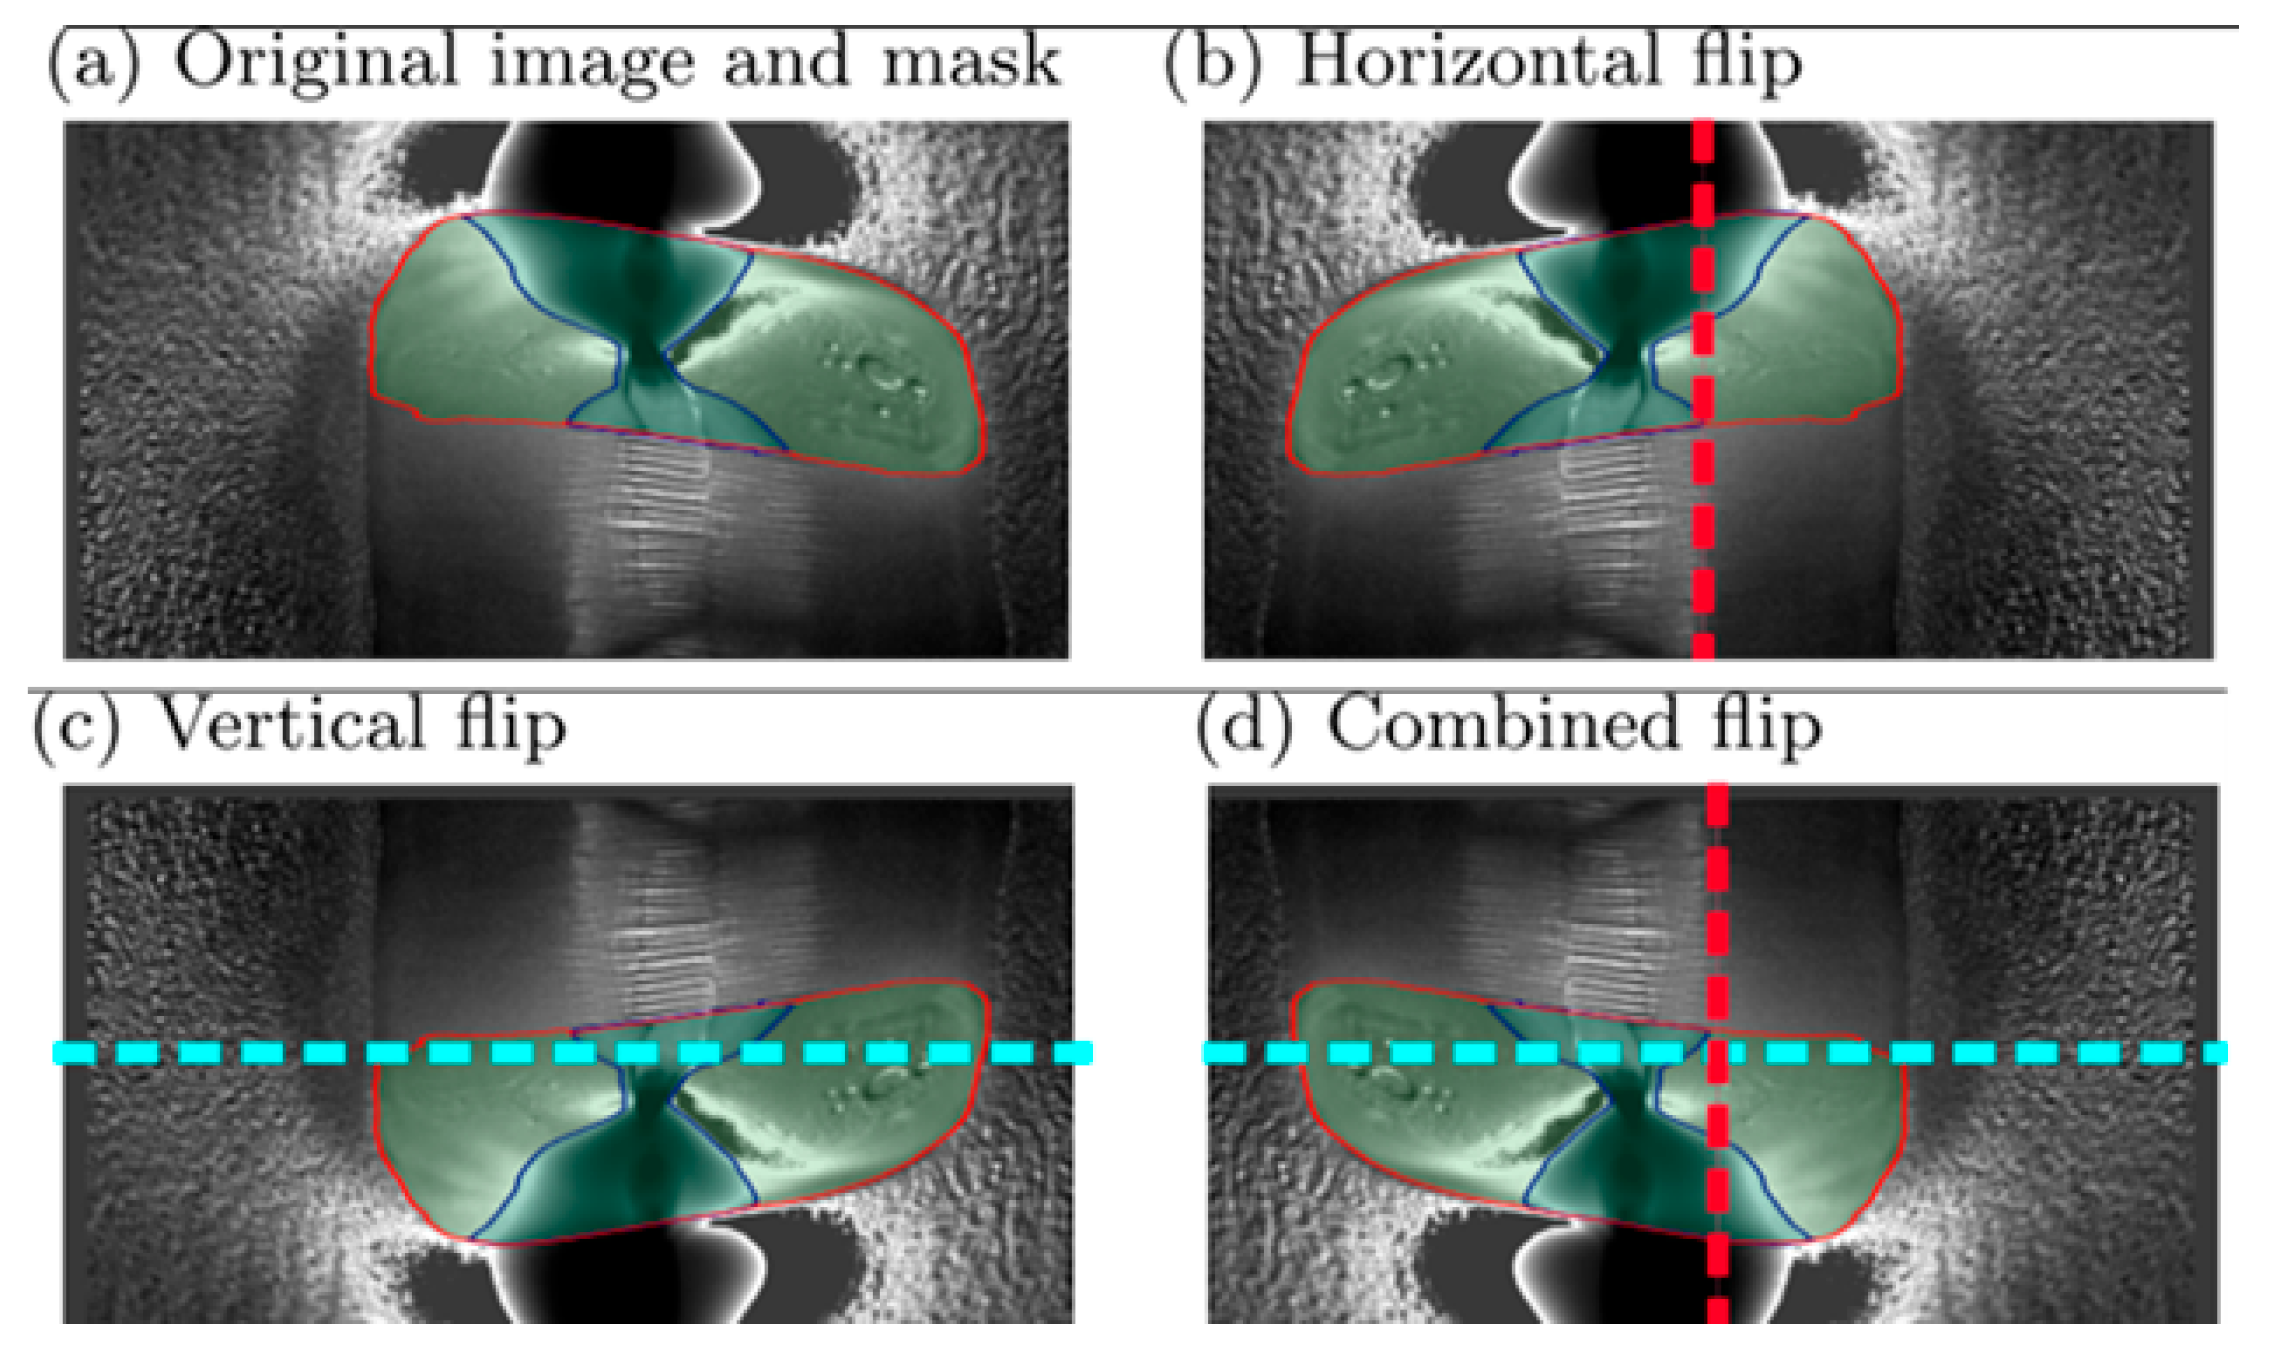
AugmentationFlip only (H, V, H + V)Data augmentation through geometric flips
Table 3. Summary of classification performance for each YOLOv8 model variant across different welding current levels (160 A, 180 A, and 200 A). The table reports the number of true positives (TPs), false positives (FPs), false negatives (FNs), and corresponding classification precision (%), with and without data augmentation.
Without Data AugmentationWith Data Augmentation
ModelClassTPFPFNPrecision (%)TPFPFNPrecision (%)
yolov8n160A38811197.0037219993.00
180A233158958.252501173362.50
200A1452253036.25282714770.50
yolov8s160A39001097.5037042692.50
180A4715519811.75302011697.50
200A306266876.5037951694.75
yolov8m160A38351295.7537642094.00
180A304564076.00326205481.50
200A253141663.25297277674.25
yolov8l160A3926298.003894797.25
180A272091646.75316543079.00
200A294485873.50712785117.75
yolov8x160A3907397.503858796.25
180A238768659.50340431785.00
200A1734618143.251602261440.00
Table 4. Summary of YOLOv8 model performances for thermal image classification. The values represent the average precision (%) and inference time (ms/frame) across the three welding current conditions (160 A, 180 A, and 200 A), along with the corresponding number of parameters (in millions) for each model variant.
ModelParameters
(Million)
Precision (%)Average Total Time (ms/Frame)
YOLOv8n3.175.315.9
YOLOv8s11.164.918.8
YOLOv8m43.783.221.4
YOLOv8l47.164.621.7
YOLOv8x68.273.725.5
Disclaimer/Publisher’s Note: The statements, opinions and data contained in all publications are solely those of the individual author(s) and contributor(s) and not of MDPI and/or the editor(s). MDPI and/or the editor(s) disclaim responsibility for any injury to people or property resulting from any ideas, methods, instructions or products referred to in the content.

