Article

Study on the Kinetics of Carbothermic Reduction of Stainless Steel Dust by Walnut Shell Biochar

1
Key Laboratory for Ferrous Metallurgy and Resources Utilization of Ministry of Education, Wuhan University of Science and Technology, Wuhan 430081, China
2
Hubei Provincial Key Laboratory of New Processes of Ironmaking and Steelmaking, Wuhan University of Science and Technology, Wuhan 430081, China
*
Authors to whom correspondence should be addressed.
Metals 2025, 15(8), 835; https://doi.org/10.3390/met15080835
Submission received: 25 June 2025 / Revised: 21 July 2025 / Accepted: 24 July 2025 / Published: 26 July 2025
(This article belongs to the Special Issue Separation, Reduction, and Metal Recovery in Slag Metallurgy)

Abstract

Stainless steel dust (SSD) is a by-product generated during the smelting process of stainless steel, which is rich in valuable metals such as Fe, Cr, Ni, and Mn. To optimize the carbothermic reduction process of SSD, this study first conducted the thermodynamic analysis of the carbothermic reduction of SSD and then employed walnut shell biochar as a reductant with non-isothermal thermogravimetric analysis with linear heating rates of 5 °C/min, 10 °C/min, 15 °C/min, and 20 °C/min. The activation energies of the carbothermic reduction reactions were calculated using the FWO method, KAS method, and Friedman method, respectively. Subsequently, the corresponding kinetic models were fitted and matched using the Málek method. The results indicate that before 600 °C, the direct reduction of SSD by carbon plays a dominant role. As the temperature increases, the indirect reduction becomes the main reduction reaction for SSD due to the generation of CO. The activation energies calculated by the Flynn–Wall–Ozawa (FWO) method, Kissinger–Akahira–Sunose (KAS) method, and Friedman method are 412.120 kJ/mol, 416.930 kJ/mol, and 411.778 kJ/mol, respectively, showing close values and a general trend of increasing activation energy as the conversion rate increased from 10% to 90%. Moreover, the reduction reaction is staged. In the conversion range of 10% to 50%, the carbothermic reduction reaction conforms to the shrinking core model within phase boundary reactions, coded as R1/4. In the conversion range of 50% to 60%, it conforms to the shrinking core model within phase boundary reactions, coded as R1/2; in the conversion range of 60% to 90%, the carbothermic reduction reaction follows the second-order chemical reaction model, coded as F2.

1. Introduction

Stainless steel dust (SSD) is a by-product generated during the stainless steel smelting process [1,2,3]. In 2024, global crude stainless steel production is estimated to be approximately 60 million tons. During the smelting of each ton of crude stainless steel, 18 to 33 kg of dust are emitted [4,5,6]. The accumulation of large amounts of SSD not only imposes significant pressure on the environment but also poses considerable health risks to humans. Given that SSD is rich in valuable metallic elements such as Fe, Cr, Ni, and Mn, it represents a promising resource for recycling [7]. Therefore, the circular utilization of SSD holds substantial significance [8,9,10].
Currently, the mainstream processes for handling SSD primarily include landfilling, pyrometallurgical treatment, and hydrometallurgical treatment [11,12,13,14]. The landfill method involves solidifying SSD and burying it underground. Although this process is relatively simple, it is gradually being phased out, as it fails to effectively recover valuable metal elements within the dust. Currently, the most common hydrometallurgical treatment methods for stainless steel dust are acid washing, solvent extraction, and chemical precipitation [15]. Acid washing is the process of leaching dissolved metal oxides with inorganic acids (e.g., HNO3, 15~25%vol) to create soluble salts. Solvent extraction is the process of using organic solvents to selectively separate target metals from the leach solution with high recovery rates [16], for example, the use of amine extractants to extract Cr6+ at pH = 1~2. Chemical precipitation alters the pH or adds precipitant to precipitate metal ions; further treatment is required to improve purity [17], for example, precipitating Fe3+ at pH = 4~5 and then adjusting pH = 8~9 to precipitate Cr3+/Ni2+. Hydrometallurgy suffers from high costs and a tendency to generate secondary pollution, which limits its widespread adoption [18,19,20]. In contrast, pyrometallurgical treatment focuses on recovering valuable metals from SSD through carbothermic reduction processes. Representative technologies in this category include the Inmetco process, Fastmet/Fastmelt process, and OxyCup process. The Fastmet and Inmetco processes use a rotating hearth furnace for carbothermal reduction at 1300 °C~1350 °C [21], and the Inmetco process then uses an electric arc furnace for slag–iron separation [22,23]. The OxyCup processes use a shaft furnace for carbothermal reduction with total melting and reduction at 1400 °C [24]. The reduction products of these pyrometallurgical treatments are alloys that can be employed directly as steelmaking raw materials or alloy additives. These technologies feature broad applicability, enabling the efficient recovery of various metals with relatively lower environmental impact and energy consumption. Consequently, they have become the predominant methods employed by steel mills for treating SSD [25].
As a renewable energy source, biomass has gained considerable attention from researchers due to its widespread distribution, diverse types, and low pollution characteristics [26,27,28]. However, biomass also poses several challenges, including low fixed carbon content, high volatile matter content, lower calorific value, and seasonal limitations [29]. Consequently, carbonizing biomass in an anoxic or low-oxygen environment to produce biochar offers advantages such as ease of storage, higher fixed carbon content, greater calorific value, and pollution-free characteristics, showcasing a broad application potential [30,31,32]. In recent years, scholars both domestically and internationally have conducted extensive research on using biochar as a substitute for traditional fossil fuels, applying it in energy development and smelting sectors. Net emissions of 0.5 to 0.8 tons of CO2 can be decreased by melting one ton of iron with biochar. Utilizing biochar as a clean energy source can not only significantly reduce greenhouse gas emissions but also promote a green transformation of the energy structure [33,34,35].
The focus of this study is to conduct thermodynamic analysis and non-isothermal kinetic studies of the carbothermic reduction process of SSD with walnut shell biochar as a reductant using thermal gravimetric analysis under various linear heating rates. The objectives include establishing reduction reaction models, exploring the patterns of activation energy changes, and examining the impact of different heating rates on the reduction process. The study aims to uncover the kinetic behavior of the carbothermic reduction of SSD, thereby providing experimental and theoretical bases for the resource utilization of SSD.

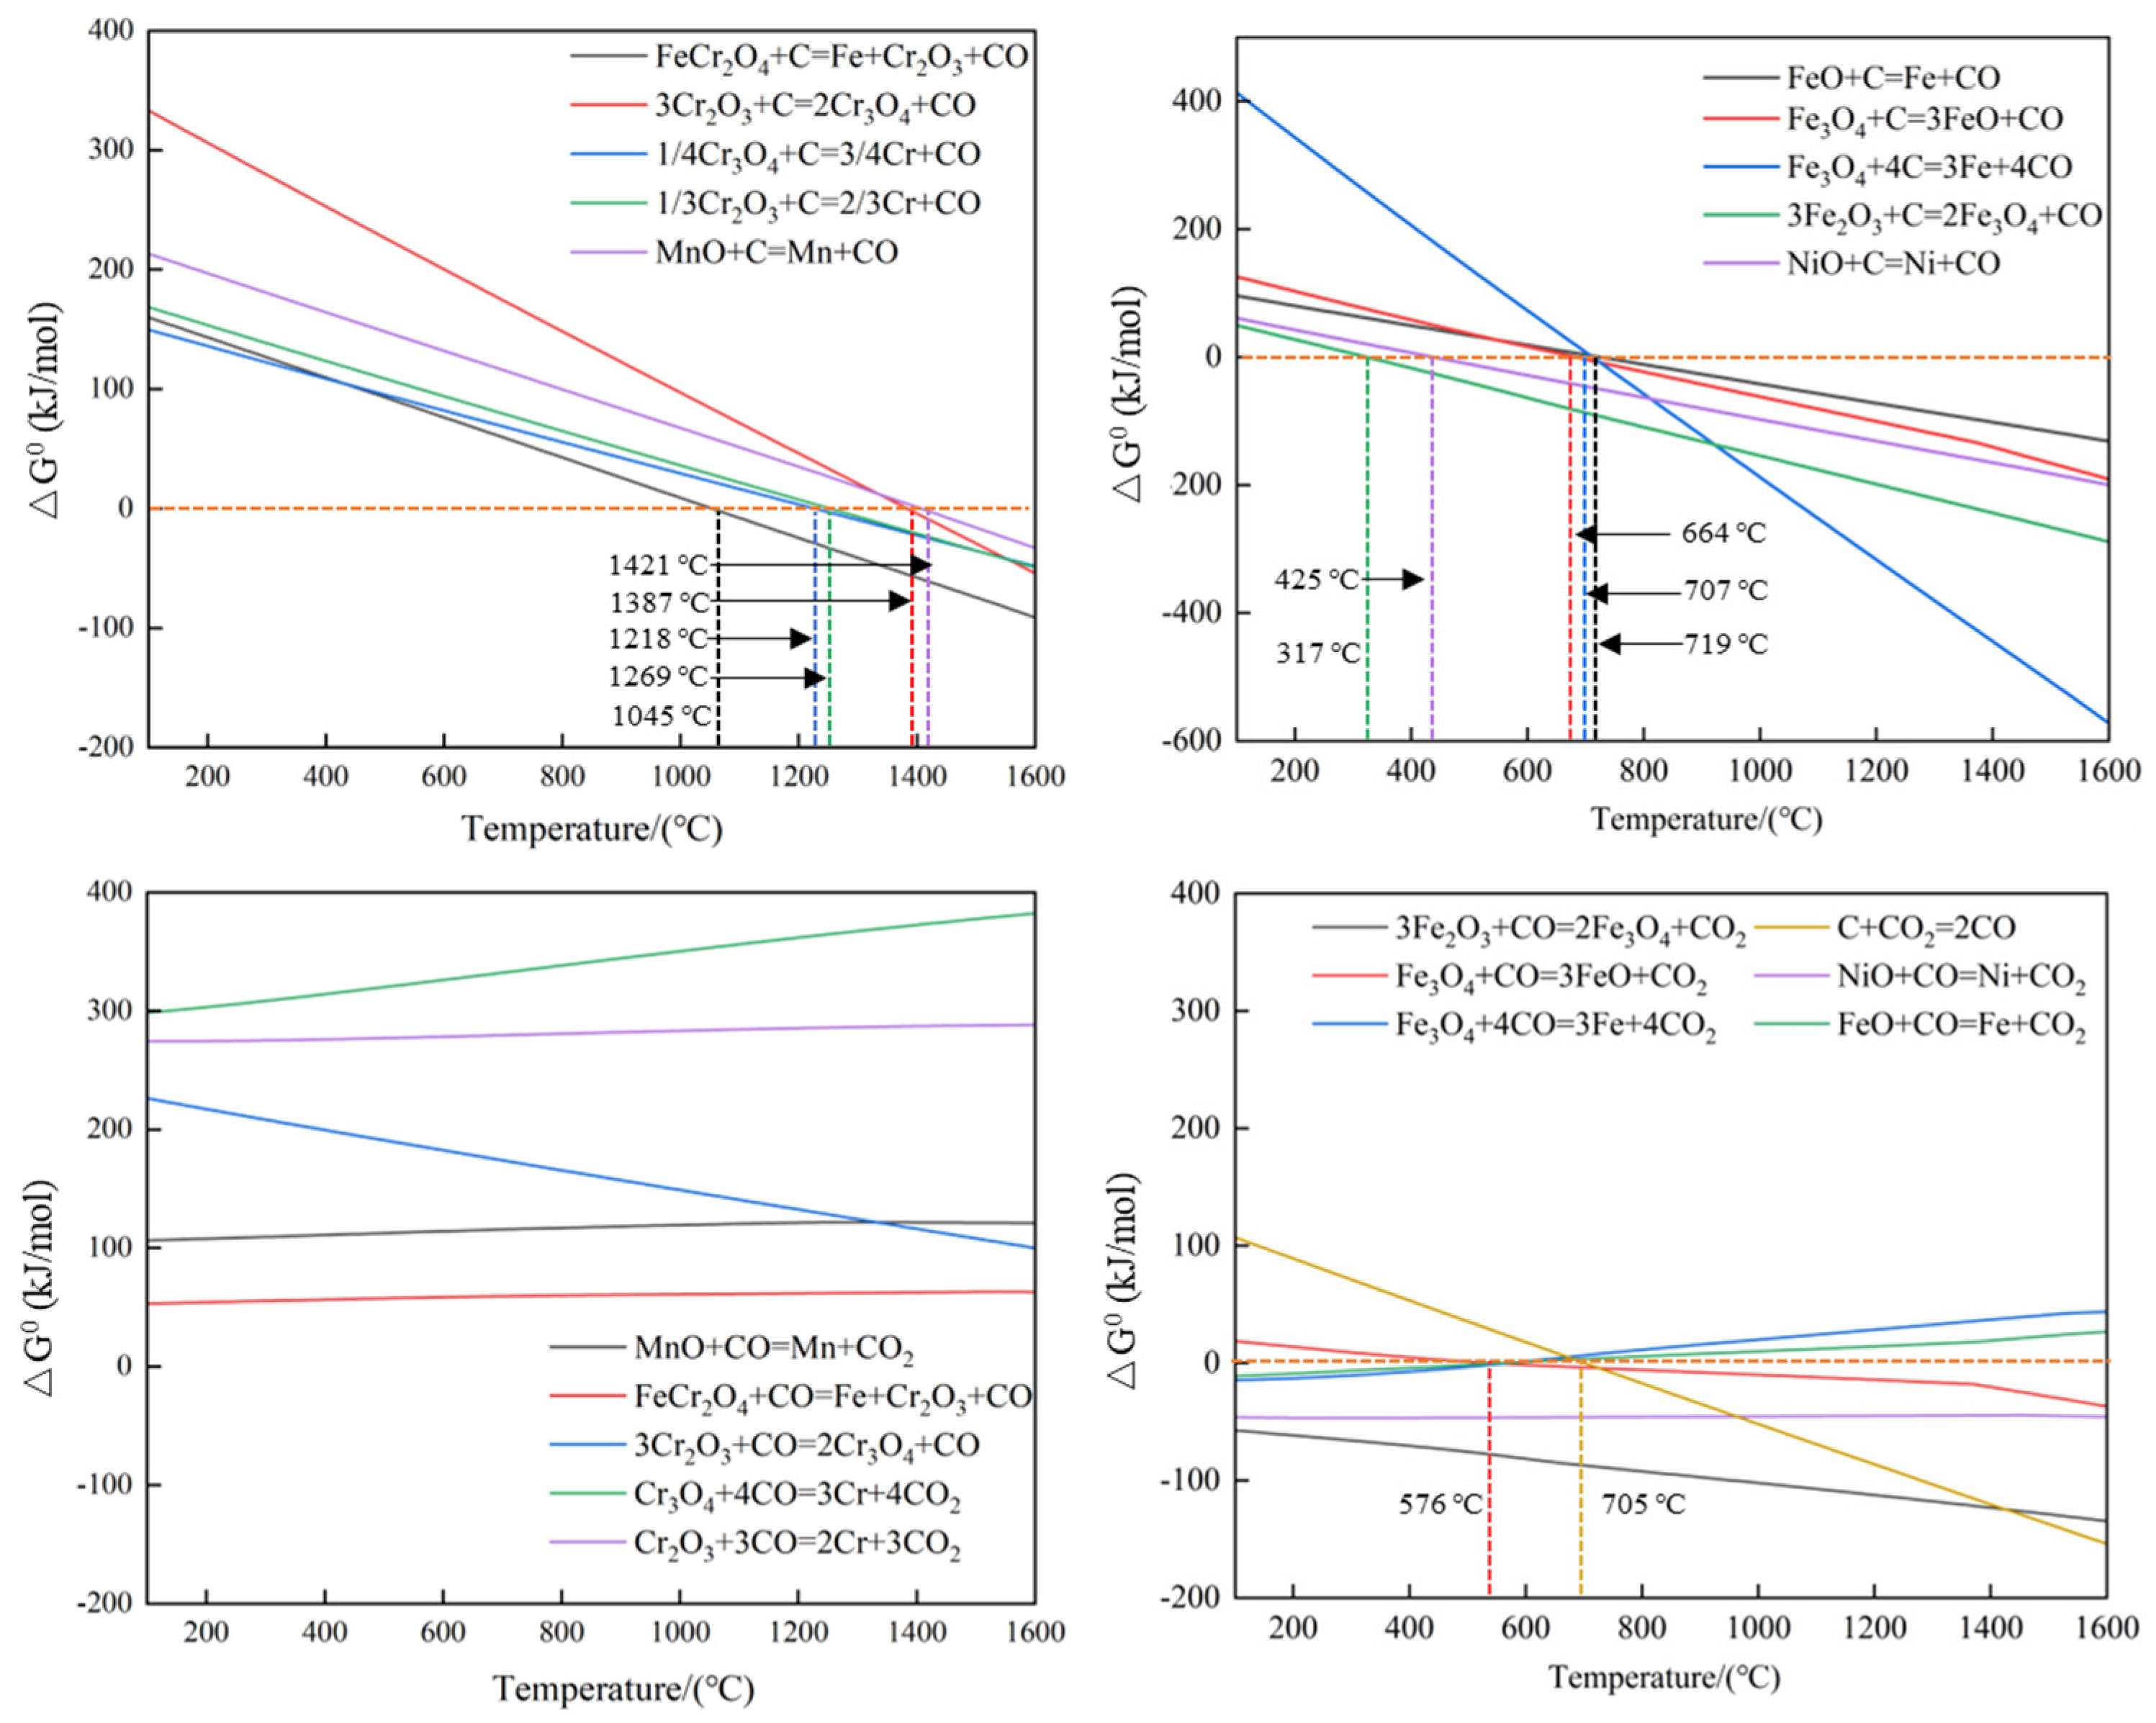
2. Thermodynamics Analysis of the Carbothermic Reduction Process of SSD

To investigate the likelihood of the main components in stainless steel dust undergoing carbothermic reduction reactions and to analyze the trend of the standard Gibbs free energy change of these reactions with temperature, thermodynamic calculations were performed on metal oxides such as Fe, Cr, Ni, and Mn in stainless steel dust using Factsage 8.1 software. The results shown in Figure 1 encompass both direct reduction reactions of metal oxides with carbon and indirect reduction reactions of metal oxides with CO.
As shown in Figure 1, the reduction of iron oxides and nickel oxides, such as Fe2O3, Fe3O4, and NiO, in stainless steel dust occurs in stages. The standard Gibbs free energy change (ΔG0) for direct reduction reactions decreases with increasing temperature, indicating that higher temperatures favor these reduction processes. The initial temperatures for the direct reduction of Fe2O3, Fe3O4, and NiO are 317 °C, 664 °C, and 425 °C, respectively, leading to the formation of lower-valent iron oxides and metal Ni. When the reduction temperature reaches 719 °C, FeO undergoes reduction to metal iron, releasing significant amounts of reductive CO gas.
FeCr2O4 is the primary chromium-containing phase in SSD. It undergoes stepwise reduction at temperatures reaching 1045 °C, 1218 °C, and 1269 °C until it is ultimately reduced to metal chromium. In contrast, the direct reduction of MnO requires a much higher temperature of up to 1421 °C. Moreover, the ΔG0 values for the indirect reduction reactions of MnO and FeCr2O4 are greater than zero (>0), indicating that these reactions are not spontaneous under these conditions. However, the indirect reduction of Fe2O3 to Fe3O4 has a ΔG0 less than zero (<0), suggesting that this reaction can proceed spontaneously. Subsequent indirect reduction of Fe3O4 also starts at a relatively low temperature of only 576 °C. Additionally, the indirect reduction of NiO has a ΔG0 < 0, indicating that it is easy to occur spontaneously. Therefore, selecting an appropriate temperature range can achieve efficient reduction of SSD and effective control of the reduction products.

3. Experimental

3.1. Characterization of Raw Materials

The raw materials used in the experiment consist of two components: stainless steel dust (SSD) sourced from a stainless steel smelting plant in China, and walnut shell biochar obtained from a crop residue processing plant in China. The particle size of the SSD and the walnut shell biochar were measured using a laser particle size analyzer (Matersizer 2000, Malvern Panalytical, Malven, UK), with the particle size distribution shown in Figure 2. As indicated in Figure 2, the particle size of the SSD generally follows a normal distribution, predominantly falling within the range of 1–10 μm, which accounts for 77.72% of the total distribution. The fraction of particles within the 10–100 μm range constitutes 19.29% of the distribution. Overall, the particle sizes are relatively fine, with an average particle size of 14.86 ± 0.57 μm and a median particle size of 3.31 μm. The average particle size of walnut shell biochar was 144.40 ± 0.77 μm.
The chemical composition analysis of the SSD was conducted using Inductively Coupled Plasma–Atomic Emission Spectroscopy (ICP-AES, IRIS Advantage ER/S, Thermo Elemental, Waltham, MA, USA). Table 1 presents the specific chemical composition and content of the SSD. As shown in Table 1, the SSD is primarily composed of Fe2O3, Cr2O3, MnO, and NiO, with their respective weight contents being 69.60 wt%, 11.22 wt%, 6.45 wt%, and 1.03 wt%. The total iron content reaches 48.41 wt%, indicating a high potential for recovery and utilization. The impurity components mainly include CaO, SiO2, MgO, and Al2O3, with their contents at 5.21 wt%, 3.38 wt%, 0.55 wt%, and 0.20 wt%, respectively.
The phase composition of the SSD was analyzed using X-ray diffraction (XRD, X’Pert PRO MPD, PANalytical, Almelo, The Netherlands). The operational conditions were as follows: Cu Kα radiation, a scanning range of 20° to 70°, with a current of 40 mA and tube voltage of 40 kW. The XRD pattern of the SSD is shown in Figure 3. The main phase composition of the SSD includes Fe2O3, Fe3O4, FeCr2O4, and SiO2.
The microscopic morphology of SSD and walnut shell biochar was observed using a field emission scanning electron microscope (SEM-EDS, Nova NanoSEM400, FEI, Hillsboro, OR, USA), as shown in Figure 4 and Figure 5. As indicated by Figure 4, the SSD consists of particles of various sizes, exhibiting spherical and irregular polyhedral shapes. Moreover, there is a certain degree of agglomeration observed among some of the particles. In contrast, the surface of the walnut shell biochar displays a honeycomb-like porous structure, with an interconnected network of channels inside. This porous structure provides a larger contact area for carbothermic reduction reactions.
The industrial analysis and elemental analysis results of the walnut shell biochar are shown in Table 2 and Table 3, respectively. As indicated by Table 2 and Table 3, the fixed carbon content of the walnut shell biochar is 86.48%, with an ash content of merely 1.85%. This is even higher than that of commonly used bituminous coal and anthracite, which have fixed carbon contents ranging from 63% to 75%. Furthermore, the nitrogen and sulfur contents are relatively low at 1.33% and 0.44%, respectively, and the high calorific value is 7891 cal/g, which is beneficial for reducing the emission of harmful gases such as SO2.

3.2. Thermogravimetric Analysis

The non-isothermal thermogravimetric experiments were conducted using a simultaneous thermal analyzer (STA449C, NETZSCH, Selb, Germany). The carbothermic reduction experiments were performed with a mixture of walnut shell biochar and the SSD at a C/O molar ratio of 1.2 (the molar ratio of fixed carbon in the walnut shell biochar to the main metal oxides in the SSD). Each experiment used a sample mass of 20 ± 3 mg, which was heated from room temperature to 1400 °C at heating rates of 5 °C/min, 10 °C/min, 15 °C/min, and 20 °C/min, respectively. All experiments were carried out under an Ar atmosphere, continuously recording the mass change of the samples. Subsequently, based on the thermogravimetric experimental data, the conversion rate of the carbothermic reduction of the SSD was calculated. The activation energy for the carbothermic reduction reaction was then determined by fitting the data using the Flynn–Wall–Ozawa (FWO) method, Kissinger–Akahira–Sunose (KAS) method, and Friedman method [36]. Finally, the kinetic model of the carbothermic reduction of the SSD was fitted using the Málek method.
The conversion rate during the reaction process is denoted by α, as shown in Equation (1). In Equation (1), m0, mt, and m denote the mass of the sample at the initiation of the reaction (g), the mass of the sample at time t (g), and the mass of the sample after the reaction (g), respectively [37].
α = m 0 m t m 0 m
In Equation (2), β represents the heating rate (K/min), which is maintained as a constant value during thermogravimetric experiments.
β = d T d t
Assuming that the reaction process of a substance depends solely on the conversion rate and temperature, and these two parameters are independent of each other, the kinetic equation of differential form and integral form for non-isothermal reactions can be expressed as shown in Equation (3) and Equation (4), respectively.
d α d t = f ( α ) K ( T )
G ( α ) = 0 α d α f ( α ) = K ( T ) t
d α d t denotes the derivative of the conversion rate, expressed in units of percent per minute (%/min). f(α) represents the differential mechanism function, and G(α) represents the integral mechanism function. K(T) represents the relationship between the rate constant and temperature, expressed by the Arrhenius equation, as illustrated in Equation (5).
K ( T ) = A exp ( E R T )
In Equation (5), A is the frequency factor (s−1), E is the activation energy (kJ/mol), R is the universal gas constant (8.314 J/(mol·K)), and T is the reaction temperature (K).
By inserting Equation (5) into Equation (3), it can be transformed into Equation (6) [38].
d α d t = ( A β ) exp ( E R T ) f ( α )
By combining Equations (4) and (6), the integral form of the kinetic equation is obtained, as shown in Equation (7).
G ( α ) = 0 α d α f ( α ) = A β T 0 T exp ( E R T ) d T
In Equation (7), T0 represents the initial reaction temperature (K), and T denotes the instantaneous temperature at a given time (K).
Model-free kinetic analysis, known as iso-conversional methods, refers to techniques that directly determine the apparent activation energy without assuming a specific reaction mechanism function. This approach avoids errors that may arise from incorrect assumptions about different reaction mechanisms, making it widely applicable in kinetic analysis. Commonly used model-free kinetic methods include the FWO method, KAS method, and Friedman method [39,40,41].
In the FWO method, the kinetic equation can be expressed as Equation (8):
lg β = lg ( A E R G ( α ) ) 2.315 0.4567 × E R T
In the KAS method, the thermokinetic equation can be expressed as Equation (9):
ln β T 2 = ln ( A E R G ( α ) ) E R T
The Friedman method is a model-free analysis approach based on the differential form, and its thermokinetic equation can be expressed as shown in Equation (10):
ln ( β d α d T ) = ln A + ln f ( α ) E R T
The Málek method is an advanced kinetic calculation approach. It first determines the activation energy E of the reaction using iso-conversional methods such as the FWO method. Then, it compares experimental data points with graphs generated based on various model functions to identify the appropriate reaction kinetic model function f(α). The advantage of this method starts from the calculation of activation energy using iso-conversional methods and progressively obtaining comprehensive kinetic results, thus avoiding the hassle and subjective errors associated with individually testing each f(α). However, when applying the Málek method, it is crucial to have a sufficient number of experimental data points to avoid difficulties in determining the reaction model. Equations (11) and (12) represent the specific mathematical expressions for the Málek method [42], G(0.5) denotes the value of G(α) for a conversion rate of 0.5, and f(0.5) denotes the value of f(α) for a conversion rate of 0.5:
y ( α ) = G ( α ) f ( α ) G ( 0.5 ) f ( 0.5 )
y ( α ) = ( T T 0.5 ) 2 d α d t ( d α d t ) 0.5

4. Results and Discussion

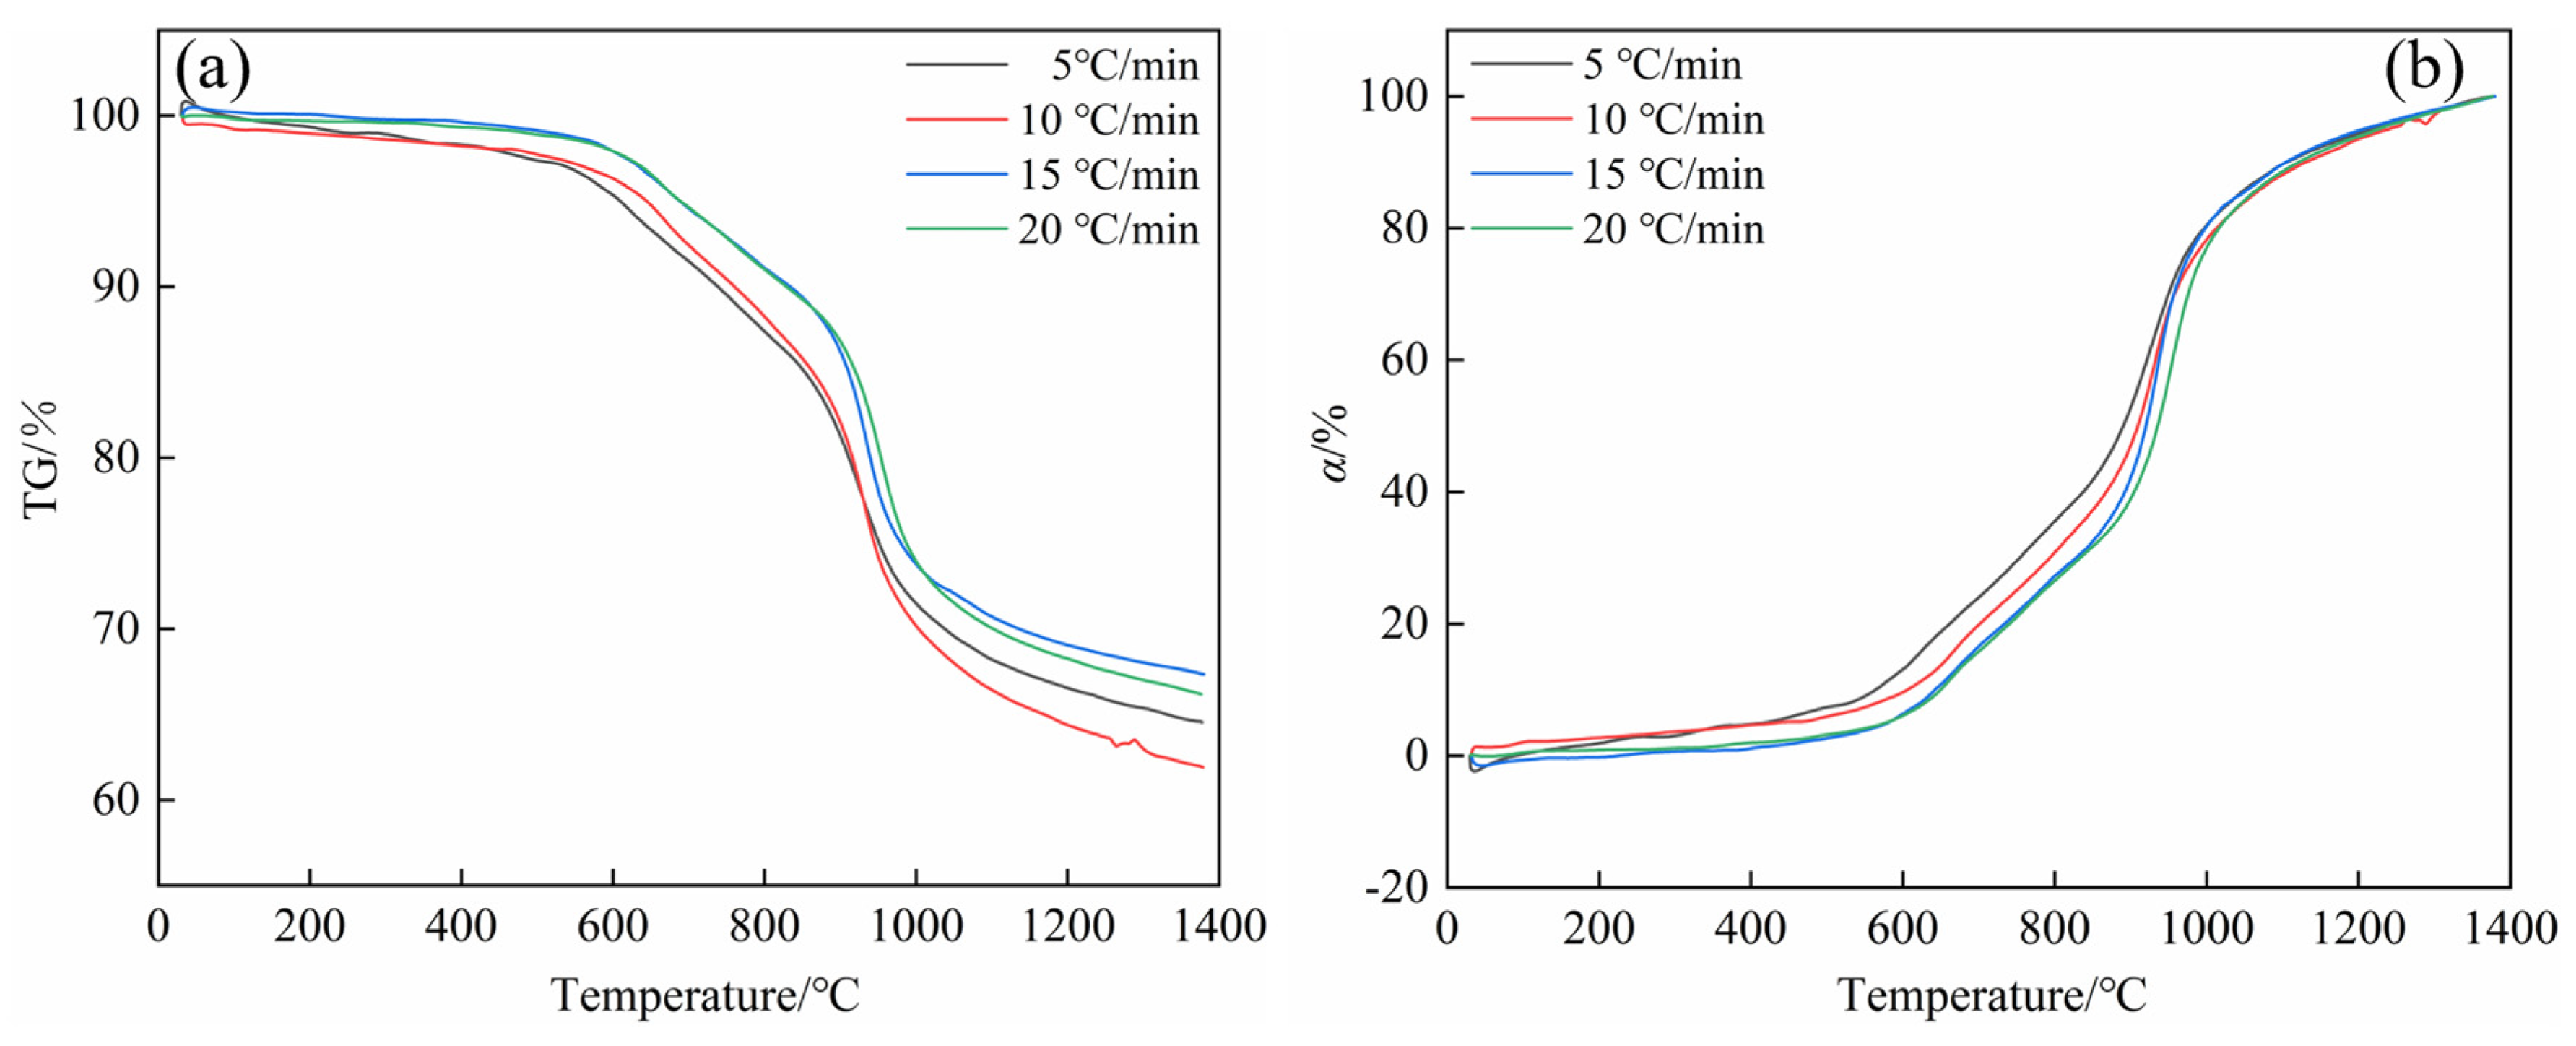
4.1. Thermogravimetric Analysis Results

Figure 6 shows the thermogravimetric analysis and conversion rate curves of a mixture of SSD and walnut shell biochar at a C/O molar ratio of 1.2, recorded during heating from room temperature to 1400 °C at different heating rates (5 °C/min, 10 °C/min, 15 °C/min, and 20 °C/min). Combining the thermodynamic calculation results from Figure 1, it can be observed that when the reaction temperature is below 600 °C, the thermogravimetric curves are relatively flat, indicating slow reaction progression. This stage corresponds to the reduction processes of 3Fe2O3 + C→2Fe3O4 + CO, along with minor reactions such as NiO + C→Ni + CO. As the temperature gradually increases to 1200 °C, the mass loss of the sample sharply increases, indicating more vigorous reactions. This stage corresponds to the stepwise reduction of iron oxides and the reduction of ferric chromite, represented by the following reactions: Fe3O4 + C→3FeO + CO, FeO + CO→Fe + CO2, Fe3O4 + CO→3FeO + CO2, and FeCr2O4 + C→Fe + Cr2O3 + CO. Within this temperature range, the iron oxides in the SSD are largely reduced to metallic iron. Between 1200 °C and 1400 °C, the rate of mass loss gradually decreases, indicating that the primary reactions occurring are the stepwise reduction of chromium oxides, mainly through the reactions Cr3O4 + 4C→3Cr + 4CO and Cr2O3 + 3C→2Cr + 3CO.
As the heating rate increases, the onset reaction temperature of the sample rises, and the residual mass also increases. Specifically, at a heating rate of 5 °C/min, the onset reaction temperature is 524.12 °C, with a residual mass of 65.26%. When the heating rate is increased to 20 °C/min, the onset reaction temperature rises to 541.04 °C, and the residual mass increases to 67.93%. This indicates that while increasing the heating rate accelerates the thermal motion of reactant molecules and promotes the reaction, it can also lead to discrepancies between the diffusion rate of the reactants and the reaction rate, potentially resulting in incomplete reactions. Therefore, a relatively lower heating rate may facilitate a more thorough diffusion of the reactants, ensuring a more complete reaction [43].

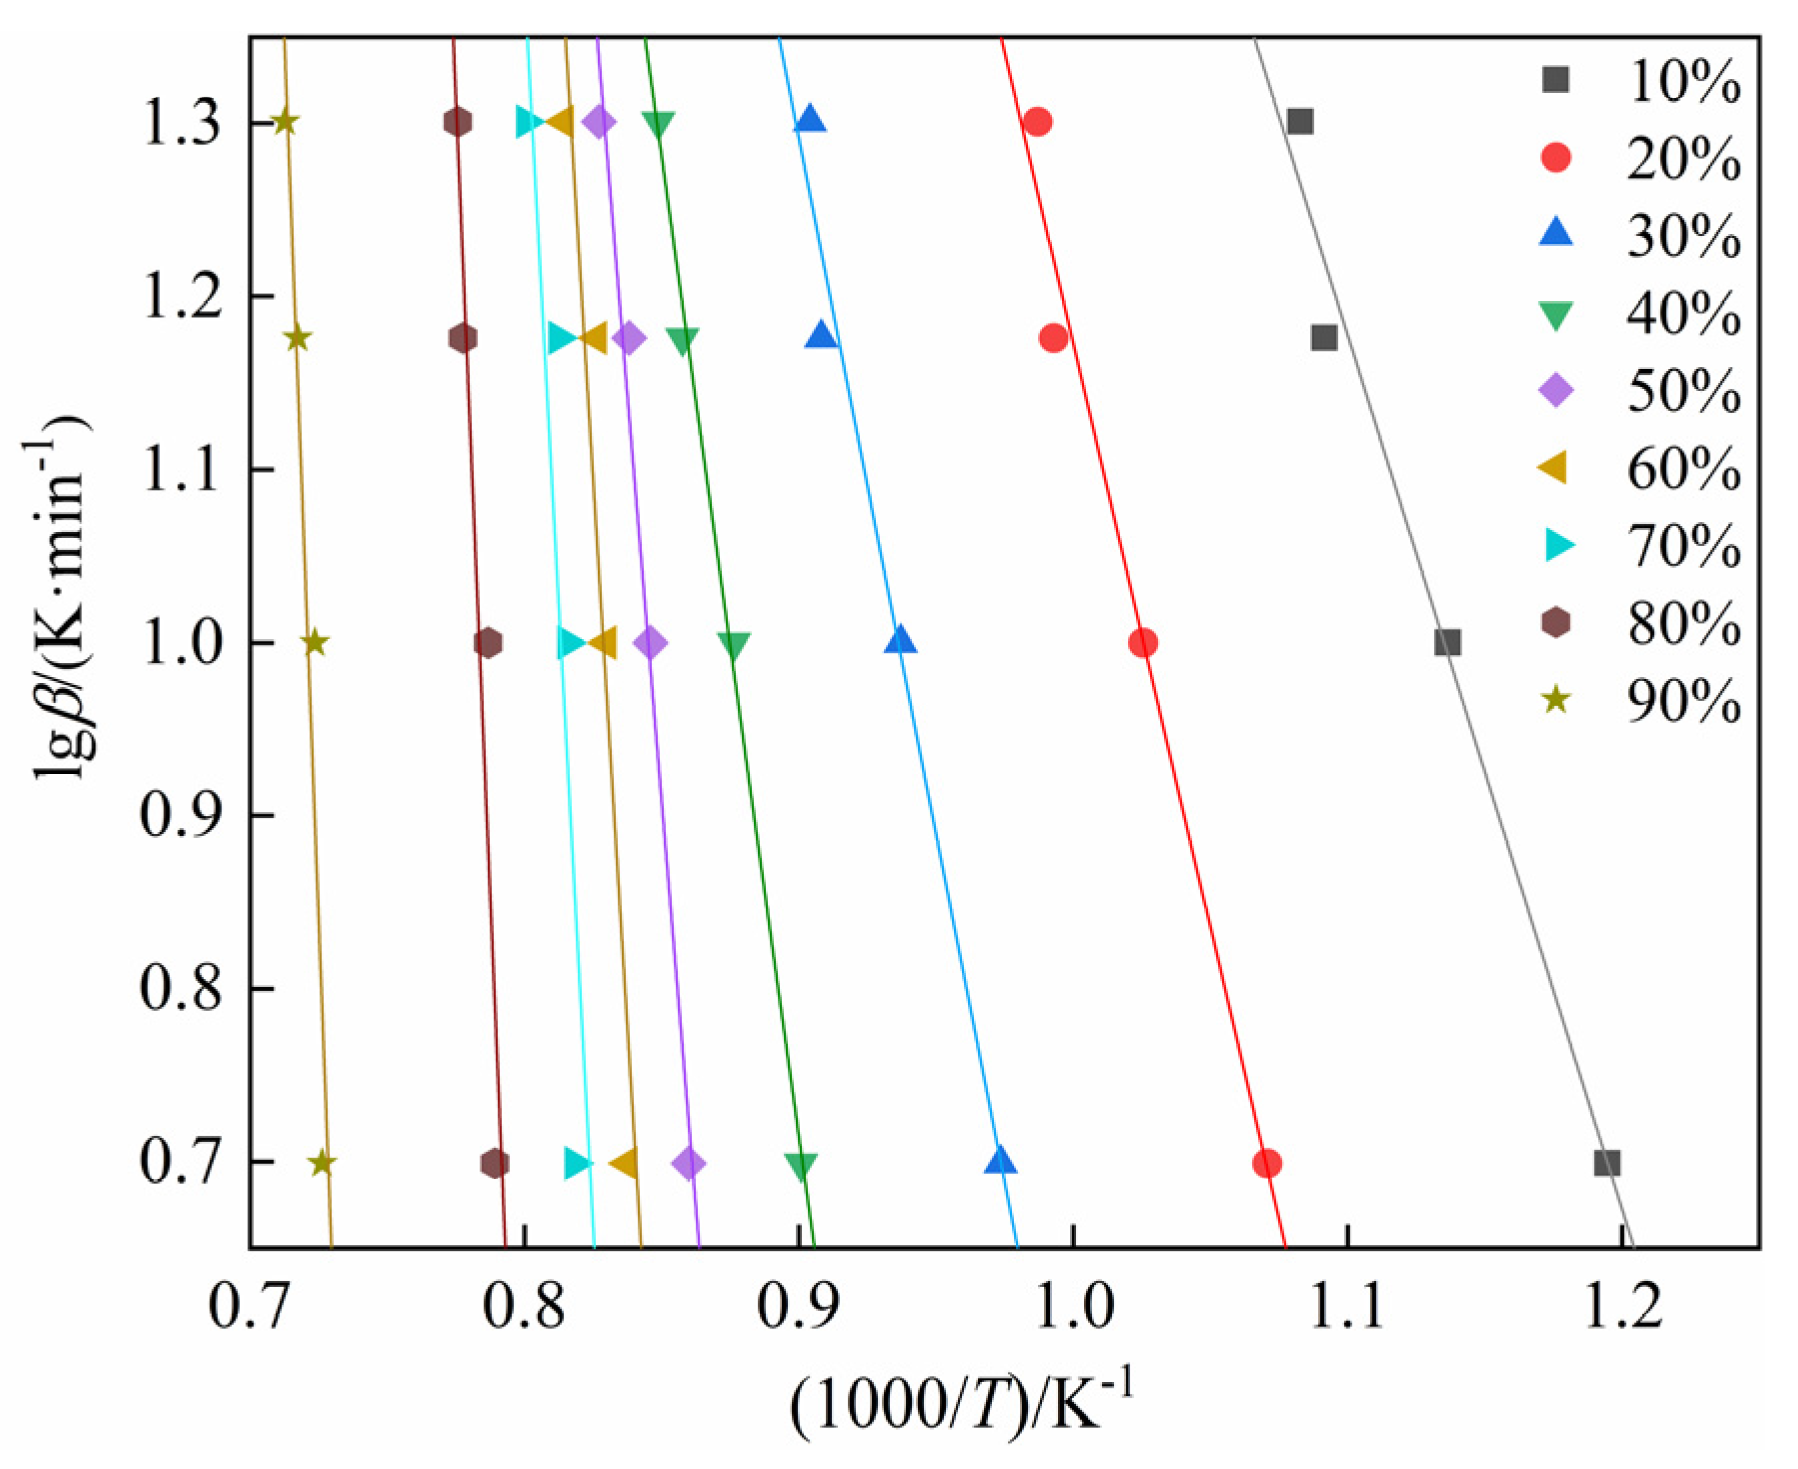
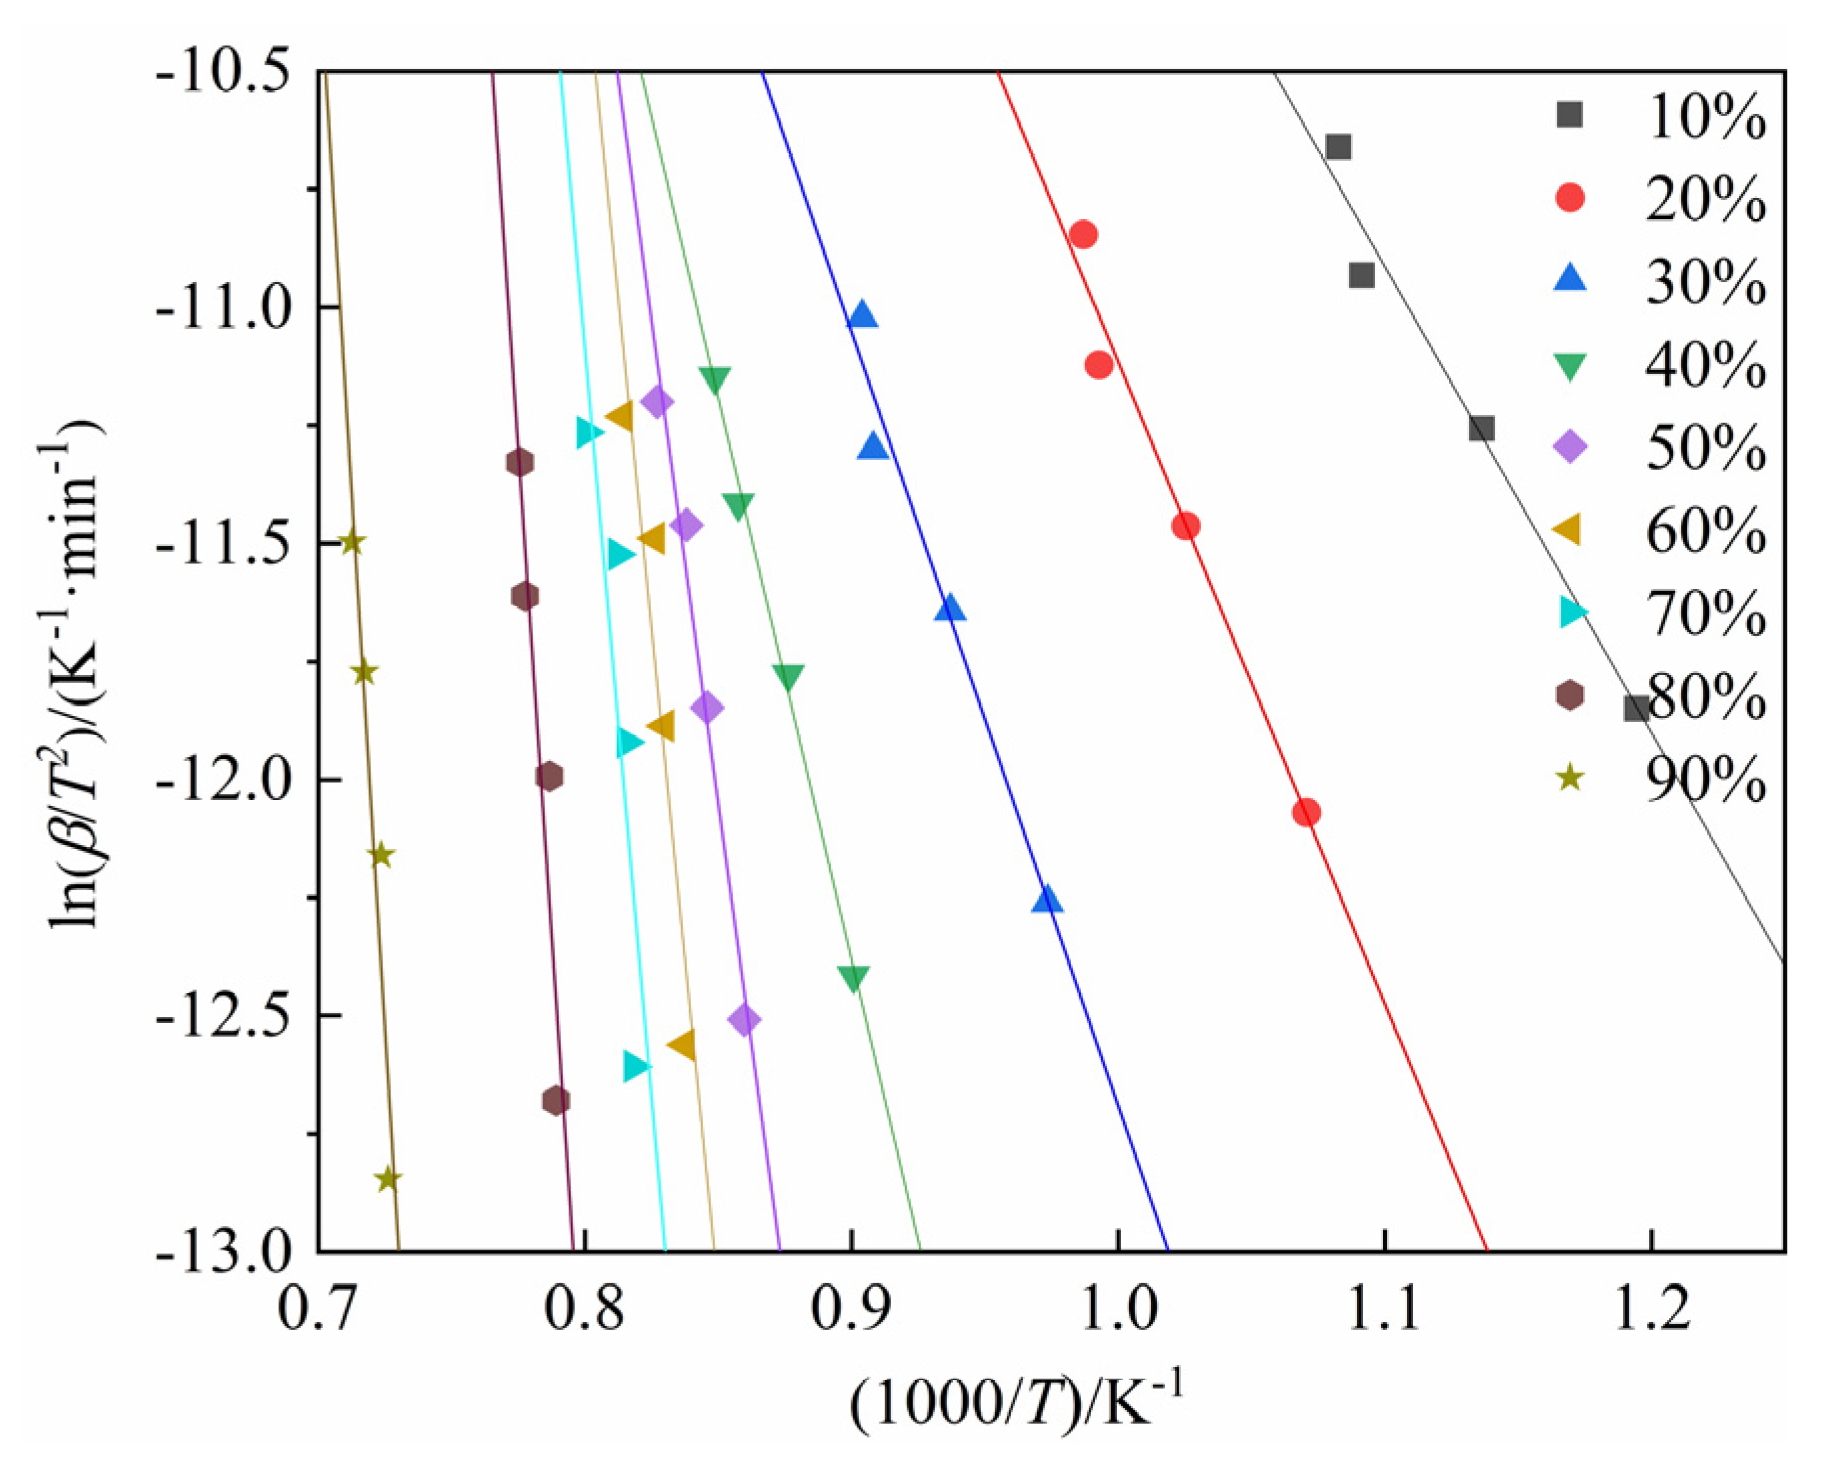
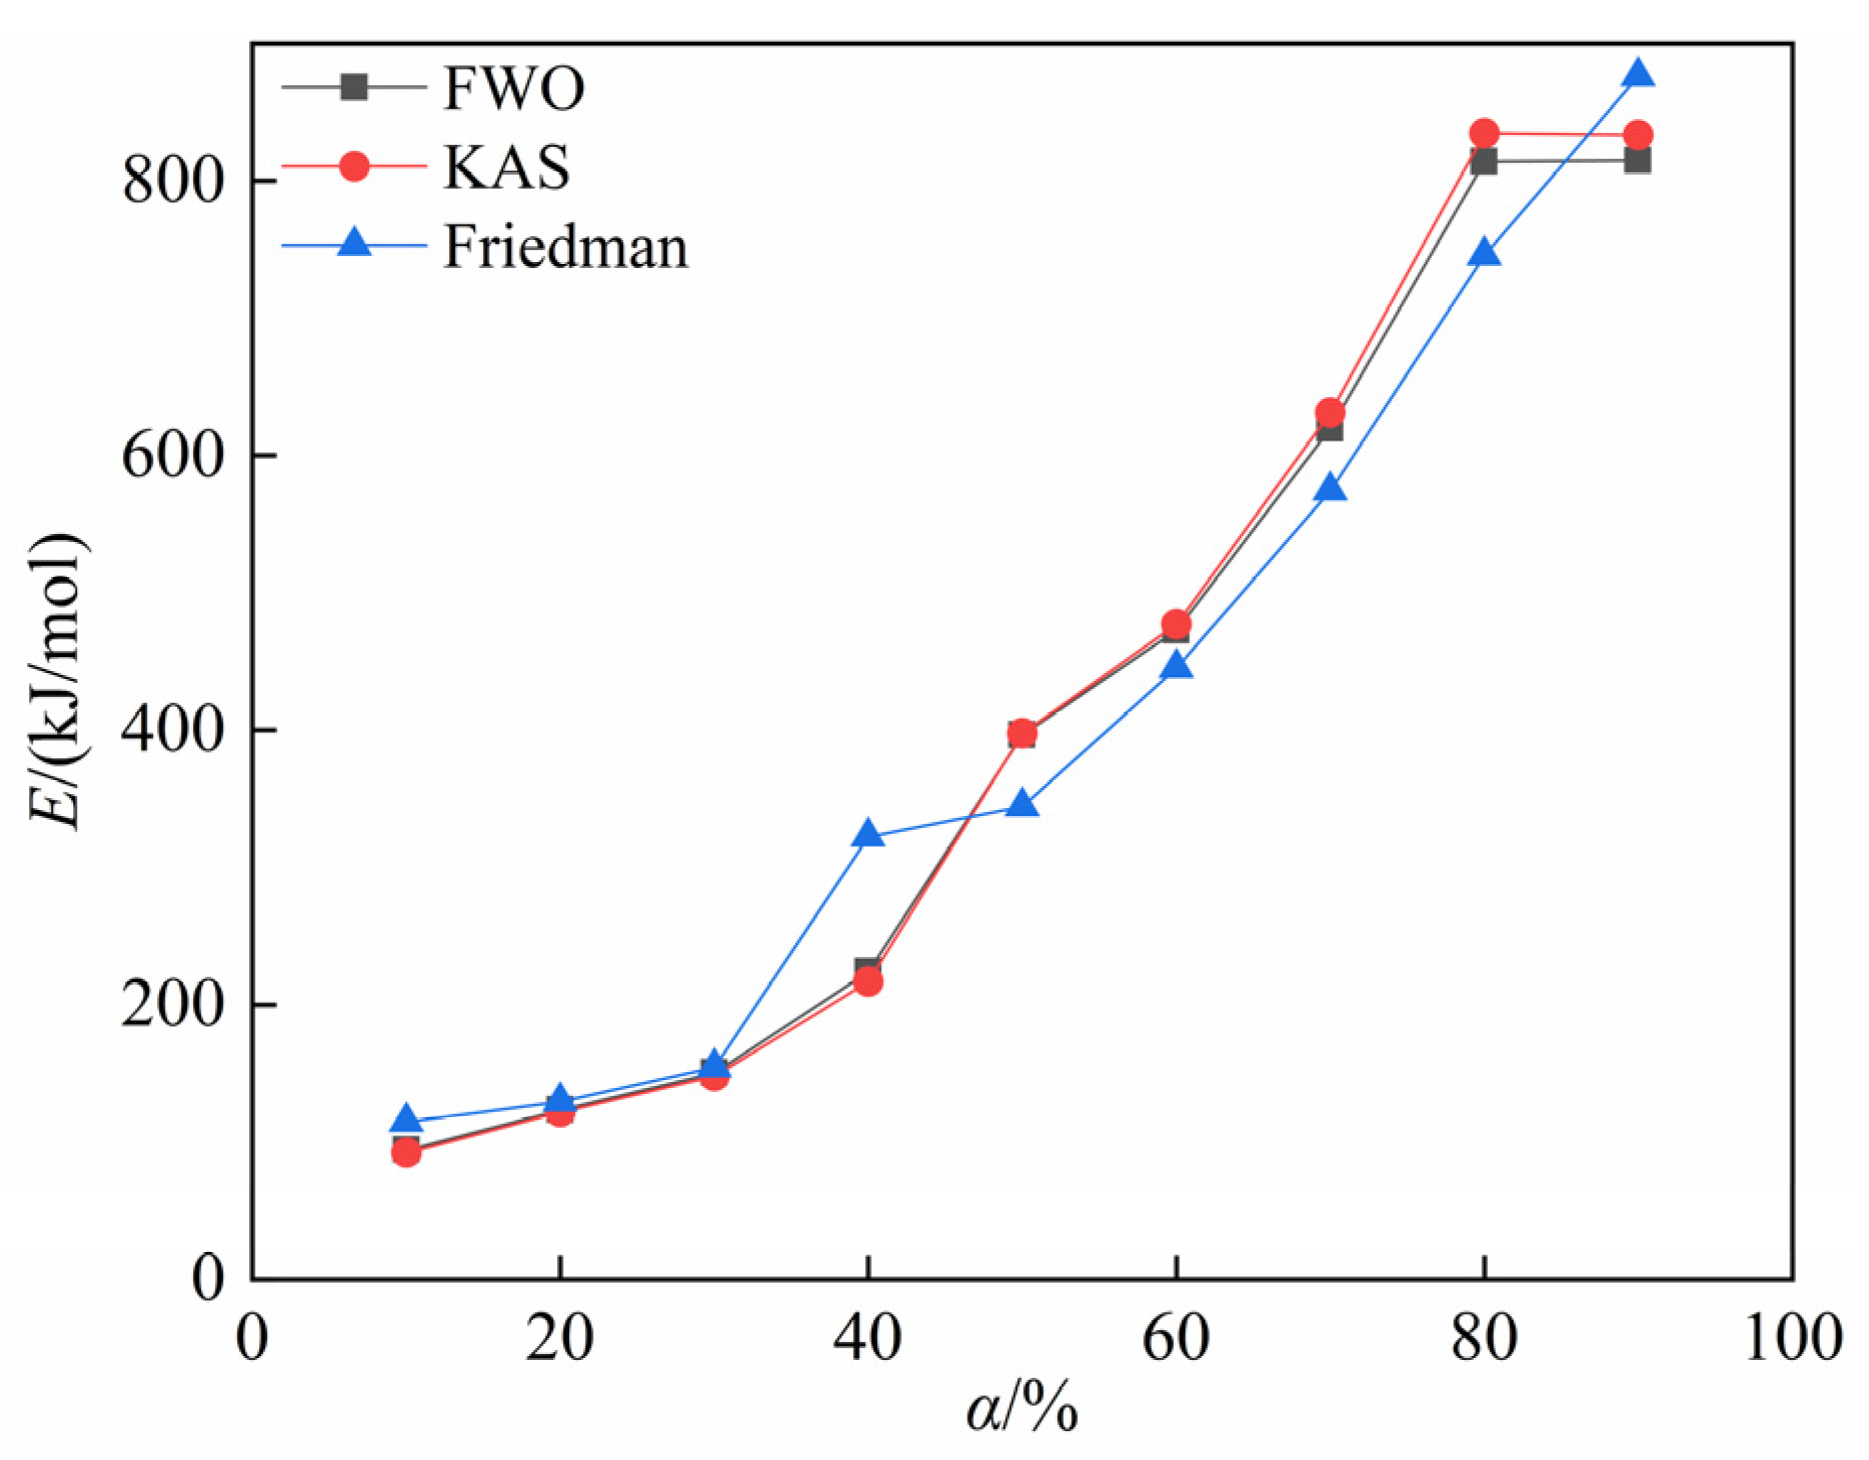
4.2. Calculation of Activation Energy for the Carbothermic Reduction Process of SSD

Based on the Flynn–Wall–Ozawa (FWO) equation, a relationship can be established between the logarithm of the heating rate (lgβ) and the reciprocal of the reaction temperature (1000/T), as illustrated in Figure 7. In the process of calculating the activation energy, only the conversion range from 10% to 90% is considered to mitigate potential biases that could be introduced by experimental data from the initial and final stages of the reaction. The thermogravimetric experimental data were subjected to linear fitting using the data points corresponding to the same conversion rate but under four different heating rates. It was observed that the correlation coefficients (R2) of the fitted curves were consistently high. Consequently, the activation energy for the carbothermic reduction reaction between SSD and walnut shell biochar can be determined by calculating the slopes of these fitted curves. Furthermore, as the conversion rate increases, the slope of the fitted line gradually becomes steeper, indicating that the activation energy increases with the rise in conversion rate. This suggests that the reaction becomes progressively more difficult to proceed as the conversion rate increases.
Similarly, the KAS method also focuses on the conversion range from 10% to 90%. It examines the relationship between ln(β/T2) and the reciprocal of the reaction temperature (1000/T). Thermogravimetric experimental data were subjected to linear fitting using data points corresponding to the same conversion rate but under four different heating rates. The outcomes are presented in Figure 8. The correlation coefficients (R2) of the fitted curves are relatively high. Consequently, the activation energy for the carbothermic reduction reaction between the SSD and walnut shell biochar can be determined by calculating the slopes of these fitted curves. From the fitting results, it can be observed that, similar to the FWO method, the slope of the fitted line increases as the conversion rate rises. This indicates that the required activation energy becomes higher as the reaction progresses, suggesting that the reaction becomes progressively less active.
The Friedman method similarly focuses on the conversion range from 10% to 90%. It examines the relationship between ln(β·/dT) and the reciprocal of the reaction temperature (1000/T) based on thermogravimetric experimental data. This relationship is depicted in Figure 9. The fitting results obtained using this method are consistent with those from the preceding two methods. It is observed that as the conversion rate α increases, the slope of the fitted line gradually becomes steeper, indicating a progressive increase in the activation energy.
The variation trends of the activation energy calculated by the three methods with respect to the conversion rate, along with the specific fitting parameters, are shown in Figure 10 and Table 4, respectively. From Figure 10 and Table 4, it can be observed that the activation energy derived from the FWO method ranges from 94.282 to 814.574 kJ/mol, with an average value of 412.120 kJ/mol. The activation energy derived from the KAS method ranges from 92.147 kJ/mol to 834.552 kJ/mol, with an average value of 416.930 kJ/mol, whereas the activation energy obtained via the Friedman method spans from 114.511 kJ/mol to 876.140 kJ/mol, with an average value of 411.778 kJ/mol.
It is noted that the activation energy increases as the conversion rate increases. This phenomenon can be explained by the initial stage of the reaction, where the reactants are in close contact, and reactions predominantly take place on the surface of the powders or particles. During this phase, reactions are relatively facile, necessitating lower activation energy. However, as the conversion rate increases, the quantity of unreacted solid material diminishes, and the remaining reactive sites may become less active or increasingly inaccessible. Thus, higher activation energy is required for subsequent reactions to overcome these challenges.

4.3. Fitting Results of Kinetic Models for the Carbothermic Reduction Process of SSD

Table 5 lists sixteen frequently encountered kinetic models, detailing their model code, corresponding differential equations, and integral equations.
Figure 11 shows the fitting results obtained using the Málek method. As indicated by Figure 11, the carbothermic reduction of SSD is a complex process. Specifically, within the conversion range of 10% to 50%, the reaction process conforms to R1/4. Within the conversion range of 50% to 60%, the reaction process conforms to R1/2. Within the conversion range of 70% to 90%, the reaction process conforms to F2.

5. Conclusions

(1)
Based on the thermogravimetric analysis results at different heating rates, the carbothermic reduction of stainless steel dust with biochar can be primarily divided into three stages: when the reaction temperature is below 600 °C, this stage is characterized by the direct reduction of Fe2O3 and partial direct reduction of NiO; when the reaction temperature is between 600 °C and 1200 °C, the reduction process is mainly dominated by the indirect reduction of Fe3O4 and FeO, accompanied by the direct reduction of FeCr2O4; and when the reaction temperature is between 1200 °C and 1400 °C, the primary reactions involve the stepwise reduction of chromium oxides.
(2)
The activation energy for the carbothermic reduction of stainless steel dust, as determined by the FWO method, ranges from 94.282 to 814.574 kJ/mol, with an average value of 412.120 kJ/mol. Utilizing the KAS method, the activation energy range is from 92.147 to 833.485 kJ/mol, with an average value of 416.930 kJ/mol. The activation energy computed using the Friedman method spans from 114.511 to 876.140 kJ/mol, with an average value of 411.778 kJ/mol. Furthermore, it is noted that the activation energy increases as the conversion rate increases.
(3)
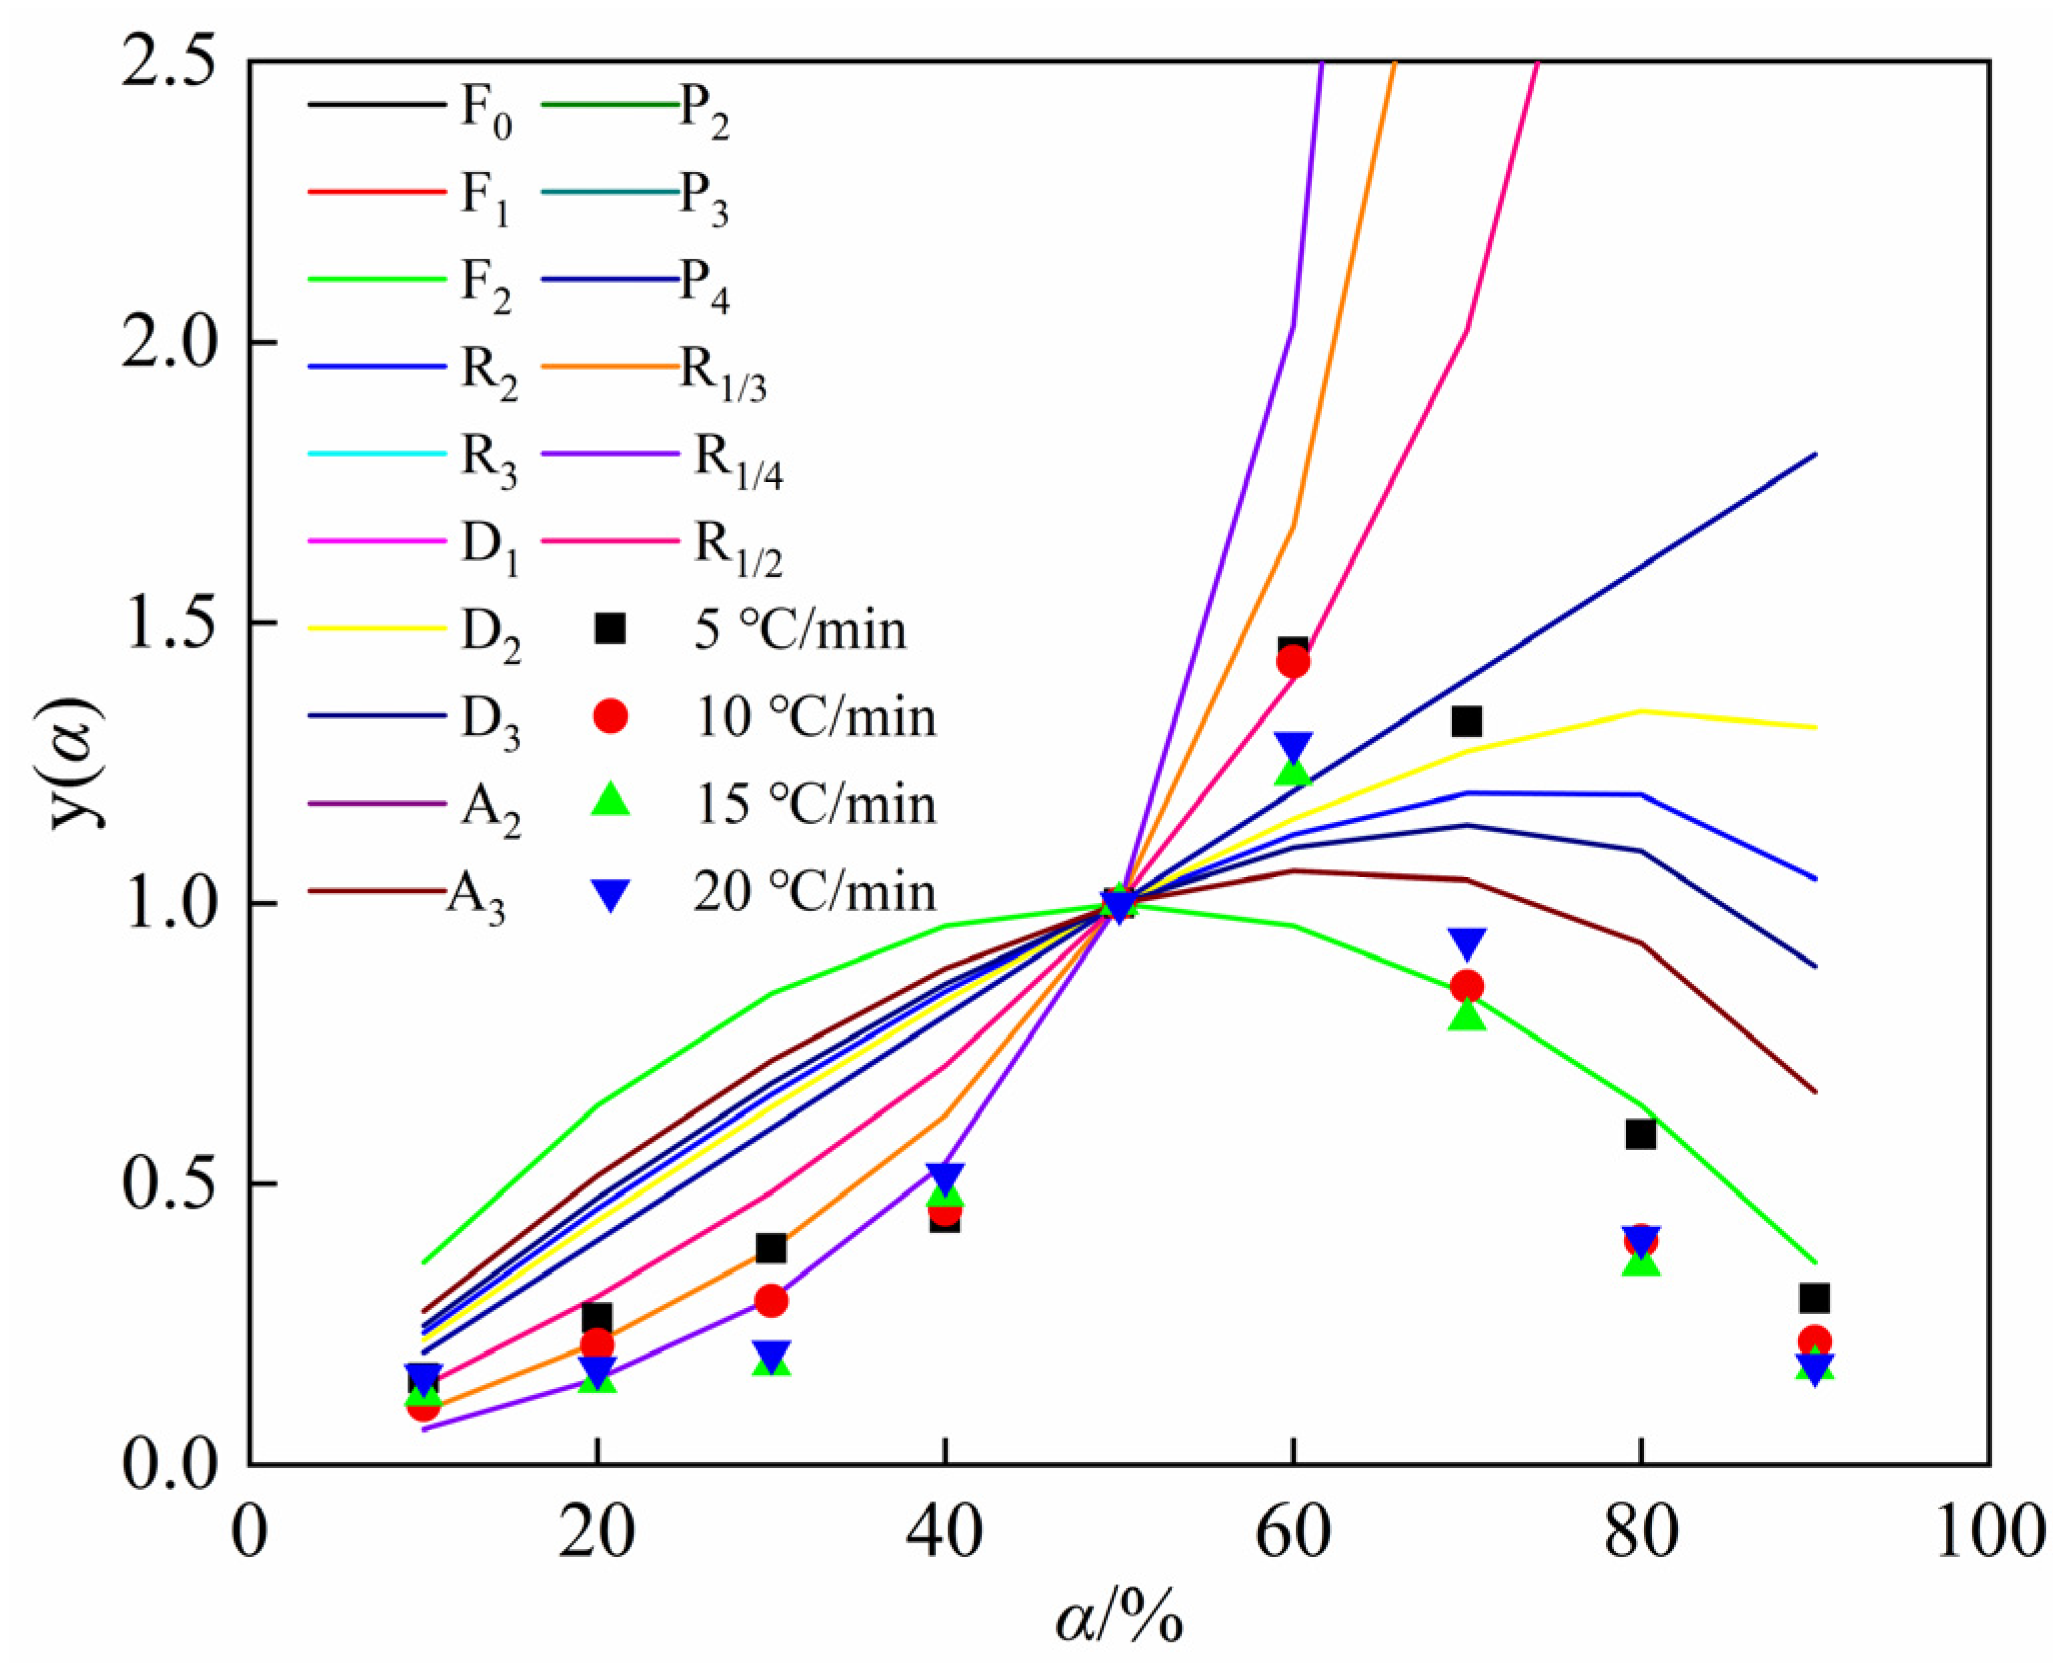
Using walnut shell biochar as the reductant, SSD’s carbothermic reduction reaction is staged. In the conversion range of 10% to 50%, the carbothermic reduction reaction conforms to the shrinking core model within phase boundary reactions, coded as R1/4. In the conversion range of 50% to 60%, it conforms to the shrinking core model within phase boundary reactions, coded as R1/2, and in the conversion range of 60% to 90%, the carbothermic reduction reaction follows the second-order chemical reaction model, coded as F2.

Author Contributions

Data curation, G.C.; investigation, G.C. and X.Z.; methodology, D.Z., X.Z. and G.M.; resources, X.Z., D.Z. and G.M.; Validation, G.C., Y.X. and J.X.; Formal analysis, G.M., Y.X. and J.X.; writing—original draft, G.C., X.Z. and Y.X.; writing—review and editing, J.X., Y.X. and D.Z. All authors have read and agreed to the published version of the manuscript.

Funding

This research was supported by the National Natural Science Foundation of China (Grant No. 51904212) and Hubei Provincial International Science and Technology Cooperation Program (Grant No. 2023EHA013).

Data Availability Statement

The original contributions presented in this study are included in the article. Further inquiries can be directed to the corresponding authors.

Conflicts of Interest

The authors declare no conflicts of interest.

References

  1. Liu, P.J.; Liu, Z.G.; Chu, M.S.; Yan, R.J.; Li, F.; Tang, J. Carbothermal reduction of stainless steel dust and laterite nickel ore: Slag phase behavior regulation and self-pulverization control mechanism. ISIJ Int. 2023, 63, 586–595. [Google Scholar] [CrossRef]
  2. Li, J.; Wu, M.L.; Wu, Z.; Liu, W.Z.; Lin, Z.; Li, X.Q. Efficient extraction of refractory Cr from stainless steel dust by sodium persulfate oxidation roasting. Waste Manag. 2024, 190, 423–431. [Google Scholar] [CrossRef]
  3. Liu, P.J.; Liu, Z.G.; Chu, M.S.; Yan, R.J.; Li, F.; Tang, J. A novel process for preparing Fe–Cr-Ni-C Alloy: Synergetic reduction of stainless steel dust and laterite nickel ore. Environ. Sci. Pollut. Res. 2022, 29, 65500–65520. [Google Scholar] [CrossRef]
  4. Li, Z.Q.; Zhang, X.; Ma, G.J.; Zheng, D.L.; Xu, J.; Xu, J. Effect of the Fe/Cr molar ratio and calcination temperature on the preparation of black ceramic pigment with stainless steel dust assisted by microwave processing. J. Clean. Prod. 2022, 372, 133751. [Google Scholar] [CrossRef]
  5. Li, Z.Q.; Zhang, X.; Ma, G.J.; Zheng, D.L.; Du, T.Y.; He, R.X. Effect of the nickel molar content on the preparation and properties of spinel-type black ceramic pigment by microwave processing from stainless steelmaking dust. Mater. Today Commun. 2022, 32, 104151. [Google Scholar] [CrossRef]
  6. Liu, P.J.; Liu, Z.G.; Chu, M.S.; Yan, R.J.; Li, F.; Tang, J. New understanding on metal recovery of Fe, Ni and Cr during carbon-thermal reduction of stainless steel dust. Adv. Powder Technol. 2021, 32, 4273–4285. [Google Scholar] [CrossRef]
  7. Liu, P.J.; Liu, Z.G.; Chu, M.S.; Yan, R.J.; Li, F.; Tang, J. Silicate slag system in carbothermal reduction of stainless steel dust: Strengthening mechanism and stable regulation. Mater. Chem. Phys. 2023, 304, 127850. [Google Scholar] [CrossRef]
  8. Wang, J.; Zhang, Y.Y.; Cui, K.K.; Fu, T.; Gao, J.J.; Hussain, S.; AlGarni, T.S. Pyrometallurgical recovery of zinc and valuable metals from electric arc furnace dust—A review. J. Clean. Prod. 2021, 298, 126788. [Google Scholar] [CrossRef]
  9. Liu, P.J.; Liu, Z.G.; Chu, M.S.; Yan, R.L.; Li, F.; Tang, J.; Feng, J.G. Efficient utilization of stainless steel dust and chromium-containing slag by carbothermal direct reduction: Synergistic mechanism and optimization analysis. J. Sustain. Metall. 2022, 8, 1877–1891. [Google Scholar] [CrossRef]
  10. Liu, P.J.; Liu, Z.G.; Chu, M.S.; Yan, R.J.; Li, F.; Tang, J. Effect of basicity on direct reduction and self-pulverization of stainless steel dust. J. Sustain. Metall. 2022, 8, 430–442. [Google Scholar] [CrossRef]
  11. Pu, G.Q.; Du, W.T.; Cheng, H.M.; Tian, M.H.; Chen, Z.; Chen, Y.Q.; Ju, D.C. Research on biomass waste utilization for synergetic reduction of stainless steel sludge and zinc-containing dust. J. Sustain. Metall. 2023, 10, 83–95. [Google Scholar] [CrossRef]
  12. Liu, P.J.; Liu, Z.G.; Chu, M.S.; Yan, R.J.; Li, F.; Tang, J.; Feng, J.G. Detoxification and comprehensive recovery of stainless steel dust and chromium containing slag: Synergistic reduction mechanism and process parameter optimization. Process Saf. Environ. Prot. 2022, 164, 678–695. [Google Scholar] [CrossRef]
  13. Zhu, R.L.; Huang, R.; Xu, A.X.; Li, B.; Zang, Y.G.; Deng, X.; Yang, J.; Li, M.; Long, X.Z. Research status and development of extraction process of zinc-bearing dust from ironmaking and steelmaking—A critical review. J. Iron Steel Res. Int. 2023, 30, 1303–1323. [Google Scholar] [CrossRef]
  14. Ye, Q.; Peng, Z.W.; Li, G.H.; Lee, J.; Liu, Y.; Liu, M.D.; Wang, L.C.; Rao, M.J.; Zhang, Y.B.; Jiang, T. Microwave-assisted reduction of electric arc furnace dust with biochar: An examination of transition of heating mechanism. ACS Sustain. Chem. Eng. 2019, 7, 9515–9524. [Google Scholar] [CrossRef]
  15. Xu, Y.J.; Xia, H.Y.; Zhang, Q.; Cai, W.C.; Jiang, G.Y.; Zhang, L.B. Green and efficient recovery of valuable metals from by-products of zinc hydrometallurgy and reducing toxicity. J. Clean. Prod. 2022, 380, 134993. [Google Scholar] [CrossRef]
  16. Kanagasundaram, T.; Murphy, O.; Haji, M.N.; Wilson, J.J. The Recovery and Separation of Lithium by Using Solvent Extraction Methods. Coord. Chem. Rev. 2024, 509, 215727. [Google Scholar] [CrossRef]
  17. Huang, X.; Liu, H.; Liu, J.; Liu, H. Synthesis of Micro Sphere CeO2 by a Chemical Precipitation Method with Enhanced Electrochemical Performance. Mater. Lett. 2017, 193, 115–118. [Google Scholar] [CrossRef]
  18. Xiao, X.; Zhang, S.F.; Sher, F.; Chen, J.B.; Xin, Y.T.; You, Z.X.; Wen, L.Y.; Hu, M.L.; Qiu, G.B. A review on recycling and reutilization of blast furnace dust as a secondary resource. J. Sustain. Metall. 2021, 7, 340–357. [Google Scholar] [CrossRef]
  19. Terrones-Saeta, J.M.; Suárez-Macías, J.; Moreno-López, E.R.; Corpas-Iglesias, F.A. Leaching of zinc for subsequent recovery by hydrometallurgical techniques from electric arc furnace dusts and utilisation of the leaching process residues for ceramic materials for construction purposes. Metals 2021, 11, 1603. [Google Scholar] [CrossRef]
  20. Xu, J.; Liu, M.K.; Ma, G.J.; Zheng, D.L.; Zhang, X.; Hou, Y.L. Valuable recovery technology and resource utilization of chromium-containing metallurgical dust and slag: A review. Metals 2023, 13, 1768. [Google Scholar] [CrossRef]
  21. Hanewald, R.H.; Munson, W.A.; Schweyer, D.L. Processing EAF Dusts and Other Nickel-Chromium Waste Materials Pyrometallurgically at INMETCO. Min. Metall. Explor. 1992, 9, 169–173. [Google Scholar] [CrossRef]
  22. Kim, G.; Sohn, I. Selective metal cation concentration during the solidification of stainless steel EAF dust and slag mixtures from high temperatures for increased Cr recovery. J. Hazard. Mater. 2018, 359, 174–185. [Google Scholar] [CrossRef]
  23. Ye, L.; Peng, Z.W.; Ye, Q.; Wang, L.C.; Augustine, R.; Perez, M.; Liu, Y.; Liu, M.D.; Tang, H.M.; Rao, M.J.; et al. Toward environmentally friendly direct reduced iron production: A novel route of comprehensive utilization of blast furnace dust and electric arc furnace dust. Waste Manag. 2021, 135, 389–396. [Google Scholar] [CrossRef]
  24. Zhang, H.N.; Hui, L.; Dong, J.H.; Xiong, H.H. Optimization of the stainless steel dust briquette reduction process for iron, chromium, and nickel recovery. High Temp. Mater. Process. 2018, 37, 785–791. [Google Scholar] [CrossRef]
  25. Zheng, L.C.; Malfliet, A.; Ren, H.Y.; Jiang, Z.H.; Blanpain, B.; Guo, M.X. Effect of reduction parameters on the size and morphology of the metallic particles in carbothermally reduced stainless steel dust. J. Sustain. Metall. 2022, 8, 297–309. [Google Scholar] [CrossRef]
  26. Stummann, M.Z.; Høj, M.; Gabrielsen, J.; Clausen, L.R.; Jensen, P.A.; Jensen, A.D. A perspective on catalytic hydropyrolysis of biomass. Renew. Sustain. Energy Rev. 2021, 143, 110960. [Google Scholar] [CrossRef]
  27. Guo, D.B.; Cui, B.H.; Chen, Z.H.; Yan, W.W.; Ji, B.; Zhang, Q.; Liu, Y.H.; Luo, S.Y.; Hu, M.; Ruan, R. Biomass enhances the reduction of oxidized pellets with carbon monoxide. Bioresour. Technol. 2021, 331, 124973. [Google Scholar] [CrossRef]
  28. Wang, L.; Yang, Y.B.; Ou, Y.; Zhong, Q.; Zhang, Y.; Yi, L.Y.; Li, Q.; Huang, Z.C.; Jiang, T. In-depth study on the synergistic conversion mechanism of iron ore with waste biochar for Co-producing directly reduced iron (DRI) and syngas. Energy 2024, 290, 130250. [Google Scholar] [CrossRef]
  29. Deng, J.H.; Ning, X.A.; Shen, J.H.; Ou, W.X.; Chen, J.Y.; Qiu, G.Q.; Wang, Y.; He, Y. Biomass waste as a clean reductant for iron recovery of iron tailings by magnetization roasting. J. Environ. Manag. 2022, 317, 115435. [Google Scholar] [CrossRef]
  30. Yuan, P.; Shen, B.X.; Duan, D.P.; Adwek, G.; Mei, X.; Lu, F.J. Study on the formation of direct reduced iron by using biomass as reductants of carbon containing pellets in RHF process. Energy 2017, 141, 472–482. [Google Scholar] [CrossRef]
  31. Abdulyekeen, K.A.; Umar, A.A.; Patah, M.F.A.; Daud, W.M.A.W. Torrefaction of biomass: Production of enhanced solid biofuel from municipal solid waste and other types of biomass. Renew. Sustain. Energy Rev. 2021, 150, 111436. [Google Scholar] [CrossRef]
  32. Ben, H.X.; Wu, Z.H.; Han, G.T.; Jiang, W.; Ragauskas, A. Pyrolytic behavior of major biomass components in waste biomass. Polymers 2019, 11, 324. [Google Scholar] [CrossRef]
  33. Ibitoye, S.E.; Loha, C.; Mahamood, R.M.; Jen, T.C.; Alam, M.; Sarkar, I.; Das, P.; Akinlabi, E.T. An overview of biochar production techniques and application in iron and steel industries. Bioresour. Bioprocess. 2024, 11, 65. [Google Scholar] [CrossRef]
  34. Waqas, M.; Aburiazaiza, A.S.; Miandad, R.; Rehan, M.; Barakat, M.A.; Nizami, A.S. Development of biochar as fuel and catalyst in energy recovery technologies. J. Clean. Prod. 2018, 188, 477–488. [Google Scholar] [CrossRef]
  35. Ye, Q.; Peng, Z.W.; Li, G.H.; Liu, Y.; Liu, M.D.; Ye, L.; Wang, L.C.; Rao, M.J.; Jiang, T. Rapid microwave-assisted reduction of ferromanganese spinel with biochar: Correlation between phase transformation and heating mechanism. J. Clean. Prod. 2021, 286, 124919. [Google Scholar] [CrossRef]
  36. Du, W.T.; Pu, G.Q.; Cheng, H.M.; Wang, Q.H.; Chen, Z.; Ju, D.C. Kinetic study of biomass Co-disposal of zinc-bearing dust and chromium-bearing sludge. J. Sustain. Metall. 2024, 10, 2020–2031. [Google Scholar] [CrossRef]
  37. Liu, P.; Gong, S.Y.; Chao, Y.W.; Liu, B.G.; Zhang, L.B.; Wu, E.H. Kinetic study on microwave-enhanced direct reduction of titanomagnetite concentrate with coal. J. Iron Steel Res. Int. 2023, 30, 429–445. [Google Scholar] [CrossRef]
  38. Nagata, K.; Fukada, S. Effect of microwave irradiation to kinetics of carbothermic reduction of NiO. Mater. Trans. 2023, 64, 889–895. [Google Scholar] [CrossRef]
  39. Chen, Z.; Zheng, R.Q.; Ju, D.C.; Mao, R.; Ma, H.; Peng, H.B.; Du, W.T. Carbothermic kinetics and reaction mechanism of carbon-containing pellets: A combined treatment of chromium-containing sludge and zinc-bearing dust. J. Sustain. Metall. 2022, 8, 1001–1013. [Google Scholar] [CrossRef]
  40. Li, G.; Lv, X.W.; Ding, C.Y.; Zhou, X.G.; Zhong, D.P.; Qiu, G.B. Non-isothermal carbothermic reduction kinetics of calcium ferrite and hematite as oxygen carriers for chemical looping gasification applications. Appl. Energy 2020, 262, 114604. [Google Scholar] [CrossRef]
  41. Liu, Y.J.; Lv, X.M.; You, Z.X.; Lv, X.W. Kinetics study on non-isothermal carbothermic reduction of nickel laterite ore in presence of Na2SO4. Powder Technol. 2020, 362, 486–492. [Google Scholar] [CrossRef]
  42. Muvunyi, R.A.; Zheng, D.L.; Li, J.L.; Ma, G.J.; Owusu-Acheaw, Y.; Zhang, X. Kinetics of carbothermal reduction of electric arc furnace dust from a stainless steel plant. JOM 2023, 75, 1137–1147. [Google Scholar] [CrossRef]
  43. Yu, Y.; Cai, X.; Cao, Z.; Jiao, X.; Xie, W.; Yu, Y.; Feng, P. Effect of the Heating Rate on the Thermal Explosion Behavior and Oxidation Resistance of 3D-Structure Porous NiAl Intermetallic. Mater. Charact. 2022, 190, 112062. [Google Scholar] [CrossRef]
  44. Özgün, Ö.; Dirba, I.; Gutfleisch, O.; Ma, Y.; Raabe, D. Green ironmaking at higher H2 pressure: Reduction kinetics and microstructure formation during hydrogen-based direct reduction of hematite pellets. J. Sustain. Metall. 2024, 10, 1127–1140. [Google Scholar] [CrossRef]
Figure 1. Standard Gibbs free energy change of reactions with variations in temperature.
Metals 15 00835 g001
Figure 2. Particle size distribution of SSD (a) and walnut shell biochar (b).
Metals 15 00835 g002
Figure 3. XRD pattern of the SSD.
Metals 15 00835 g003
Figure 4. Microscopic morphology and micro-area chemical composition of SSD.
Metals 15 00835 g004
Figure 5. Microscopic morphology of walnut shell biochar.
Metals 15 00835 g005
Figure 6. (a) Thermogravimetric curves and (b) transformation rate curves for mixtures under different heating rates.
Metals 15 00835 g006
Figure 7. The relationship between 1000/T and lgβ fitted using the FWO method.
Metals 15 00835 g007
Figure 8. The relationship between 1000/T and ln(β/T2) fitted using the KAS method.
Metals 15 00835 g008
Figure 9. The relationship between 1000/T and ln(β·dα/dT) fitted using the Friedman method.
Metals 15 00835 g009
Figure 10. Relationship between activation energy and conversion rate using the three methods.
Metals 15 00835 g010
Figure 11. The relationship between α and y(α) fitted using the Málek method.
Metals 15 00835 g011
Table 1. Chemical composition and content of SSD (wt%).
TFeFe2O3CaOMgOZnOMnOCr2O3NiOAl2O3SiO2LOI
48.4169.605.210.550.186.4511.221.030.203.382.72
Table 2. Industrial analysis of walnut shell biochar (wt%).
SampleFixed CarbonVolatile Matter on Air-Dried BasisAsh Content on Air-Dried BasisMoisture Content on Air-Dried BasisHigh Heat Value
Walnut shell biochar86.4811.101.850.567891 cal/g
Table 3. Elemental analysis of walnut shell biochar and graphite (wt%).
SampleCHONS
Walnut shell biochar74.312.358.361.330.44
Table 4. Fitting parameters of FWO, KAS, and Friedman methods for mixture at different conversion rates.
αFWOR2KASR2FriedmanR2
E/(kJ·mol−1)E/(kJ·mol−1)E/(kJ·mol−1)
10%94.2820.991992.1470.9882114.5110.9697
20%123.2060.9910121.6250.9884129.2650.9897
30%150.1690.9894148.0420.9866154.2880.9823
40%223.9500.9924216.7890.9978322.2100.9985
50%396.5920.9892397.5540.9878344.3820.9645
60%472.7700.9654477.0240.9517445.1840.9487
70%619.7180.9722631.1450.9456574.3580.9483
80%813.8190.9384834.5520.9584745.6660.9411
90%814.5740.9480833.4850.9645876.1400.9813
Mean value412.120-416.930-411.778-
Table 5. Differential and integral expressions of common reaction conversion degree function. Adapted from Refs. [36,44].
ModelMechanismCodeDifferential Model f(α)Integral Model G(α)
Order of reaction (n)n = 0F01α
n = 1F11 − α−ln(1 − α)
n = 2F2(1 − α)2(1 − α)−1 − 1
Phase boundary reactionShrinking core, m = 1/4R1/41/4(1 − α)−31 − (1 − α)4
Shrinking core, m = 1/3R1/31/3(1 − α)−21 − (1 − α)3
Shrinking core, m = 1/2R1/21/2(1 − α)−31 − (1 − α)2
Shrinking core, m = 2R22(1 − α)1/21 − (1 − α)1/2
Shrinking core, m = 3R33(1 − α)2/31 − (1 − α)1/3
DiffusionThe one-dimensional diffusionD11/2α−1α2
The two-dimensional diffusionD2[−ln(1 − α)]−1α + (1 − α) ln(1 − α)
The three-dimensional diffusionD3(1 − α)1/2 [1 − (1 − α)1/2] − 1[1 − (1 − α)1/2]2
Random nucleation and nuclei growthTwo dimensionA22(1 − α) [−ln(1 − α)]1/2−ln(1 − α)1/2
Three dimensionA33(1 − α) [−ln(1 − α)]1/3−ln(1 − α)1/3
Exponential nucleationPower series law,
n = 1/2
P21/2α1/2
Power series law,
n = 1/3
P32/3α1/3
Power series law,
n = 1/4
P43/4α1/4
Disclaimer/Publisher’s Note: The statements, opinions and data contained in all publications are solely those of the individual author(s) and contributor(s) and not of MDPI and/or the editor(s). MDPI and/or the editor(s) disclaim responsibility for any injury to people or property resulting from any ideas, methods, instructions or products referred to in the content.

