Abstract
This contribution compares various theories dealing with the assessment of dislocation density in metals subjected to different straining levels. The paper examines both substructure development and the evolution of dislocation densities in 1xxx, 5xxx, and 6xxx Al alloys. Barlat’s dislocation model, Kocks–Mecking–Estrin (K-M-E) theory, and Kubin–Estrin (K-E) type modeling approaches were analyzed. The dislocation model parameters were determined from the microindentation profiles for the rolled Al alloys. It was shown that a strong correlation exists between the K-E and K-M-E models, confirming their reliability in describing the relationship between strain, stress, and dislocation density. These numerical approaches effectively capture the evolution of dislocation density with strain, making them suitable for the analysis of the accumulation of stored energy during deformation. The development of substructure during straining was inferred from the microindentation experiments, and the resulting dependencies tended to align with the characteristic curve observed in various metals.
1. Introduction
Polycrystalline materials contain numerous defects, including linear ones called dislocations. The presence of dislocations disrupts the regular atomic arrangement in grains of metallic materials. In alloyed systems, both impurity atoms and alloying elements tend to induce localized lattice strain, promoting dislocation formation. In the as-cast or annealed metallic systems, the density of linear defects ρ is relatively low (~108–1011 m−2). However, during plastic deformation, the crystallographically resolved shear stress causes atomic planes of highest planar density to slip, thus generating dislocations. The presence of dislocations plays a crucial role in designing the mechanical properties of polycrystalline aggregates, since their motion governs yield strength, flow stress, ductility, work hardening parameters, and hardness. For instance, the Hall–Petch equation [1,2] assumes that the yield stress σy is inversely proportional to the dislocation path expressed in terms of average grain size d:
where represents the material’s base strength (also called friction stress) and is the grain boundary strengthening coefficient.
Exceeding the load above the yield point of a material, the correlation between the macroscopically imposed stress and the dislocation density is expressed by the Taylor relation:
where is a material-dependent parameter and independent of ρ, b is the magnitude of the Burgers vector, G is the shear modulus, α is a geometric constant, M is the Taylor factor, and ρ0 is the dislocation density in fully recrystallized material.
Stress values depend not only on the grain size and dislocation density but also on the temperature during deformation [3]. In this study, all hardness and stress values refer to room temperature conditions, ensuring consistency in comparison.
Taylor factor M is the crystallographically resolved measure of the instantaneous dissipation of plastic power in an arbitrarily oriented crystal. The value of M depends on the crystallographic orientation of the grain/crystal, while Equation (2) employs the average value of the Taylor factor characteristic for a given polycrystalline aggregate. The M is a texture, crystal structure, and strain mode-dependent quantity. For instance, the average M for randomly textured “Face-Centered Cubic” (FCC) material subjected to tension is ≈3, while M ≈ 2.8 when the material is subjected to plane strain compression (PSC) [4]. Furthermore, M tends to change during plastic deformation according to the following expression [4]:
where is Taylor factor prior to rolling (M0 is texture-dependent parameter and in the case of PSC, M0 = 2.88 for random texture, M0 = 2.75 for {001}<100> dominating recrystallization texture, M0 = 2.83 for β-fiber rolling texture and M0 = 2.77 for a mixed β-fiber and recrystallization texture components [4]).
The geometric constant in Equation (2) depends on numerous factors such as material type (via Poisson ratio ν and Burgers vector b), crystal structure, straining level (via the mean free path of dislocations Λ), and type of dislocation. For the mixture of edge and screw dislocations in materials with an FCC crystal structure, α is expressed as follows [1,4]:
As it was concluded elsewhere [4], the mean free path of dislocations is influenced by multiple factors, making Λ a complex function of dislocation density, which is dependent on the degree of straining, as well as the characteristic subcell size Dc. The relationship between the Λ and Dc is intricate due to the complex nature of dislocation interactions taking place during the process of plastic deformation. The dislocation interactions are accompanied by various phenomena such as dislocation multiplication, annihilation, or rearrangement, which further contribute to the evolution of the substructure. Understanding how Λ evolves with increasing strain in different materials has been a subject of extensive study [4,5,6,7,8]. Analyzing the evolution of Λ with strain in different Al alloys, it was concluded that the mean free path of dislocations and the characteristic size of the substructural domain that emerges during plastic deformation can be quantitatively related through the following expression [4]:
The methodology related to the investigation of substructure evolution in metals involves conventional techniques such as transmission electron microscopy, electron backscattering diffraction, or X-ray line profile analysis [9,10]. All these methods have several common disadvantages, which are related to the time-consuming sample preparation, limited field of view, extensive measurement time, and complex data post-processing. In view of this, numerical models dealing with the evolution of linear defects in materials [5,11,12,13,14,15] became powerful tools, making them efficient and accessible for the design of thermomechanical processing of materials. Another major advantage of using dislocation models is the possibility to link experimental observations with various theoretical frameworks, which enables explaining mesoscopic changes leading either to hardening or recovery/recrystallization. However, it is important to emphasize that the accuracy of dislocation density estimation using diverse numerical algorithms depends on both the boundary conditions employed and the precise selection of model parameters.
Understanding and predicting the mechanical behavior of polycrystalline aggregates during plastic deformation by using the Taylor relation (see Equation (2)) or calibrating model parameters might be challenging since measurement of stress in industrial processes such as rolling, forging, or extrusion is complicated by numerous factors. Therefore, employing physical quantities that reflect the stress state of a given material during deformation is of essential importance. Typically, the strain can be assessed by following the shape changes, while the stress can be related to hardness. These two properties provide quite accurate information about the stress state and thus allow modeling the evolution of substructure in metals by a spectrum of available models, which have diverse predictive power. Given this, this contribution aims to compare the performance of a variety of dislocation models and compare the simulated results with experimental observations.
2. Brief Description of Dislocation Models
2.1. Kocks–Mecking and Kocks–Mecking–Estrin Type Dislocation Models
Dislocation models provide insights into the underlying mechanisms operating during plastic deformation. These numerical approaches play a crucial role in understanding the strain hardening and softening phenomena by taking into account both rearrangement and interaction of dislocations, which lead to multiplication, immobilization, or annihilation. The Kocks–Mecking (K-M) [5,14,15] model describes how dislocation density evolves during plastic deformation in metallic systems. The theory links the change of forest dislocation density ρ with strain e:
where the material-dependent constant λ is related to recovery, while the 1/bΛ term is responsible for the dislocation storage.
The Kocks–Mecking–Estrin approach [5,14,15] is based on two competing processes, such as the generation and annihilation of dislocations:
where the material-dependent constant λ1 is related to the storage of dislocations.
The essence of both models assumes that dislocations are produced during plastic deformation due to their interaction and multiplication, and this process is controlled via constant λ1, while the recovery, which tends to occur during straining, is governed by the λ parameter (see Table 1). As it was summarized elsewhere [11], the K-M is accurate at lower strains, whereas K-M-E is more precise at the higher straining levels.

Table 1.
K-M-E model parameters for pure Al and various Al alloys.
2.2. Kubin–Estrin Modeling Approach
This modeling approach tracks how mobile (ρm) and forest (ρf) dislocations tend to evolve with strain and how they contribute to the total dislocation density ρ. The value of ρ in the Kubin–Estrin model (K-E) [12,13] depends on dislocation interactions, which are incorporated in the model via C1–C4 model parameters. The frame of the K-E model is expressed in the form of two differential equations:
where the total dislocation density is a sum of ρm and ρf, C1 controls the multiplication of dislocations, C2 governs the trapping of mobile dislocations, C3 states for the immobilization effect of the forest and mobile dislocations on each other, while C4 conditions the dynamic recovery of forest dislocations.
The differential equation system (Equations (8) and (9)) can be solved numerically by knowing C1–C4 parameters and initial dislocation density (in the recrystallized state ρ0 is assumed to be 1010 m−2). This system of equations can be solved analytically by assuming that the C2 and C4 model parameters are equal. This assumption is reasonable since a variety of materials show comparable values for the C2 and C4 coefficients (see Table 2). The solution was presented by Csanádi et al. [13], in the following form:
Table 2.
K-E model parameters of pure metals and various Al alloys [4,13,21,22,23,24].
The material-dependent model parameters listed in Table 2 were fitted for various experimentally measured dislocation densities in both pure and alloyed metallic systems [13,21,22,23,24]. The major advantage of using Kubin–Estrin models lies in their ability to analyze the evolution of linear defects as a function of strain. In addition to this, K-E-type numerical approaches enable the description of a complex interplay between the hardening and softening mechanisms in metals via C1–C4 coefficients. Compared to purely empirical models, Equations (8)–(10) tend to provide physically meaningful and predictive numerical frameworks. For instance, analyzing the change of model parameters as a function of chemical composition in binary alloys allows for revealing the effect of a particular alloying element on recovery and hardening. This is completed for the Al-Mg binary system, and it was shown that the C1 coefficient tends to increase linearly with the Mg content [22].
The validity of the models, defined by Equations (8)–(10) and Table 2, is supported by several key factors: (i) The models are based on parameter values derived from a wide range of materials (pure metals or binary systems), ensuring broad applicability; (ii) the predicted results exhibit strong correlation with experimental data over a broad strain range (in some instances e = 8 [13]); (iii) the model parameters possess clear physical significance; for example, parameter C4 is associated with the saturation level of the stress [13], whereas the ratio of C2/C4 reflects the relationship between the saturation levels of mobile and forest dislocation densities [13].
2.3. Barlat-Type Modeling Approach
In the frame of this approach [11], mobile dislocations are produced with a particular rate Fs, and after moving a certain distance, they become trapped. The average travel distance of the mobile dislocations is expressed in terms of the mean free path L, which is controlled by the model parameter k1. In this model, the mean free path of dislocations is a function of strain and tends to decrease from the initial value Ly at yielding to the saturation level Ls. The second state variable F (F = (bL)−1) ranges between the initial yielding value Fy and the saturation counterpart Fs, while the degree of change of F with strain e is controlled by the k1 value via the following expression [11]:
The evolution of both mobile and forest dislocations with strain is expressed as follows:
where the k2 model parameter refers to the recovery rate of forest dislocations.
The solution of the above equation system (Equations (12)–(14)) is expressed in terms of two analytical expressions, enabling tracing the evolution of the forest and mobile dislocations:
where the yield stress σy, σ0, and model variables K1, K2, F, Fs, and Fy are related to each other via the following relations:
The model parameters for various Al alloys are listed in Table 3.
Table 3.
Barlat model parameters of pure Al and various Al alloys [11].
The model framework expressed by Equations (11)–(18) was further developed by Balaji et al. [1,25]:
with the following model parameters for pure Al: stress concentration factor , the initial dislocation multiplication factor , the pre-exponential coefficient , exponential factor and the coefficient .
2.4. Performance of Numerical Models
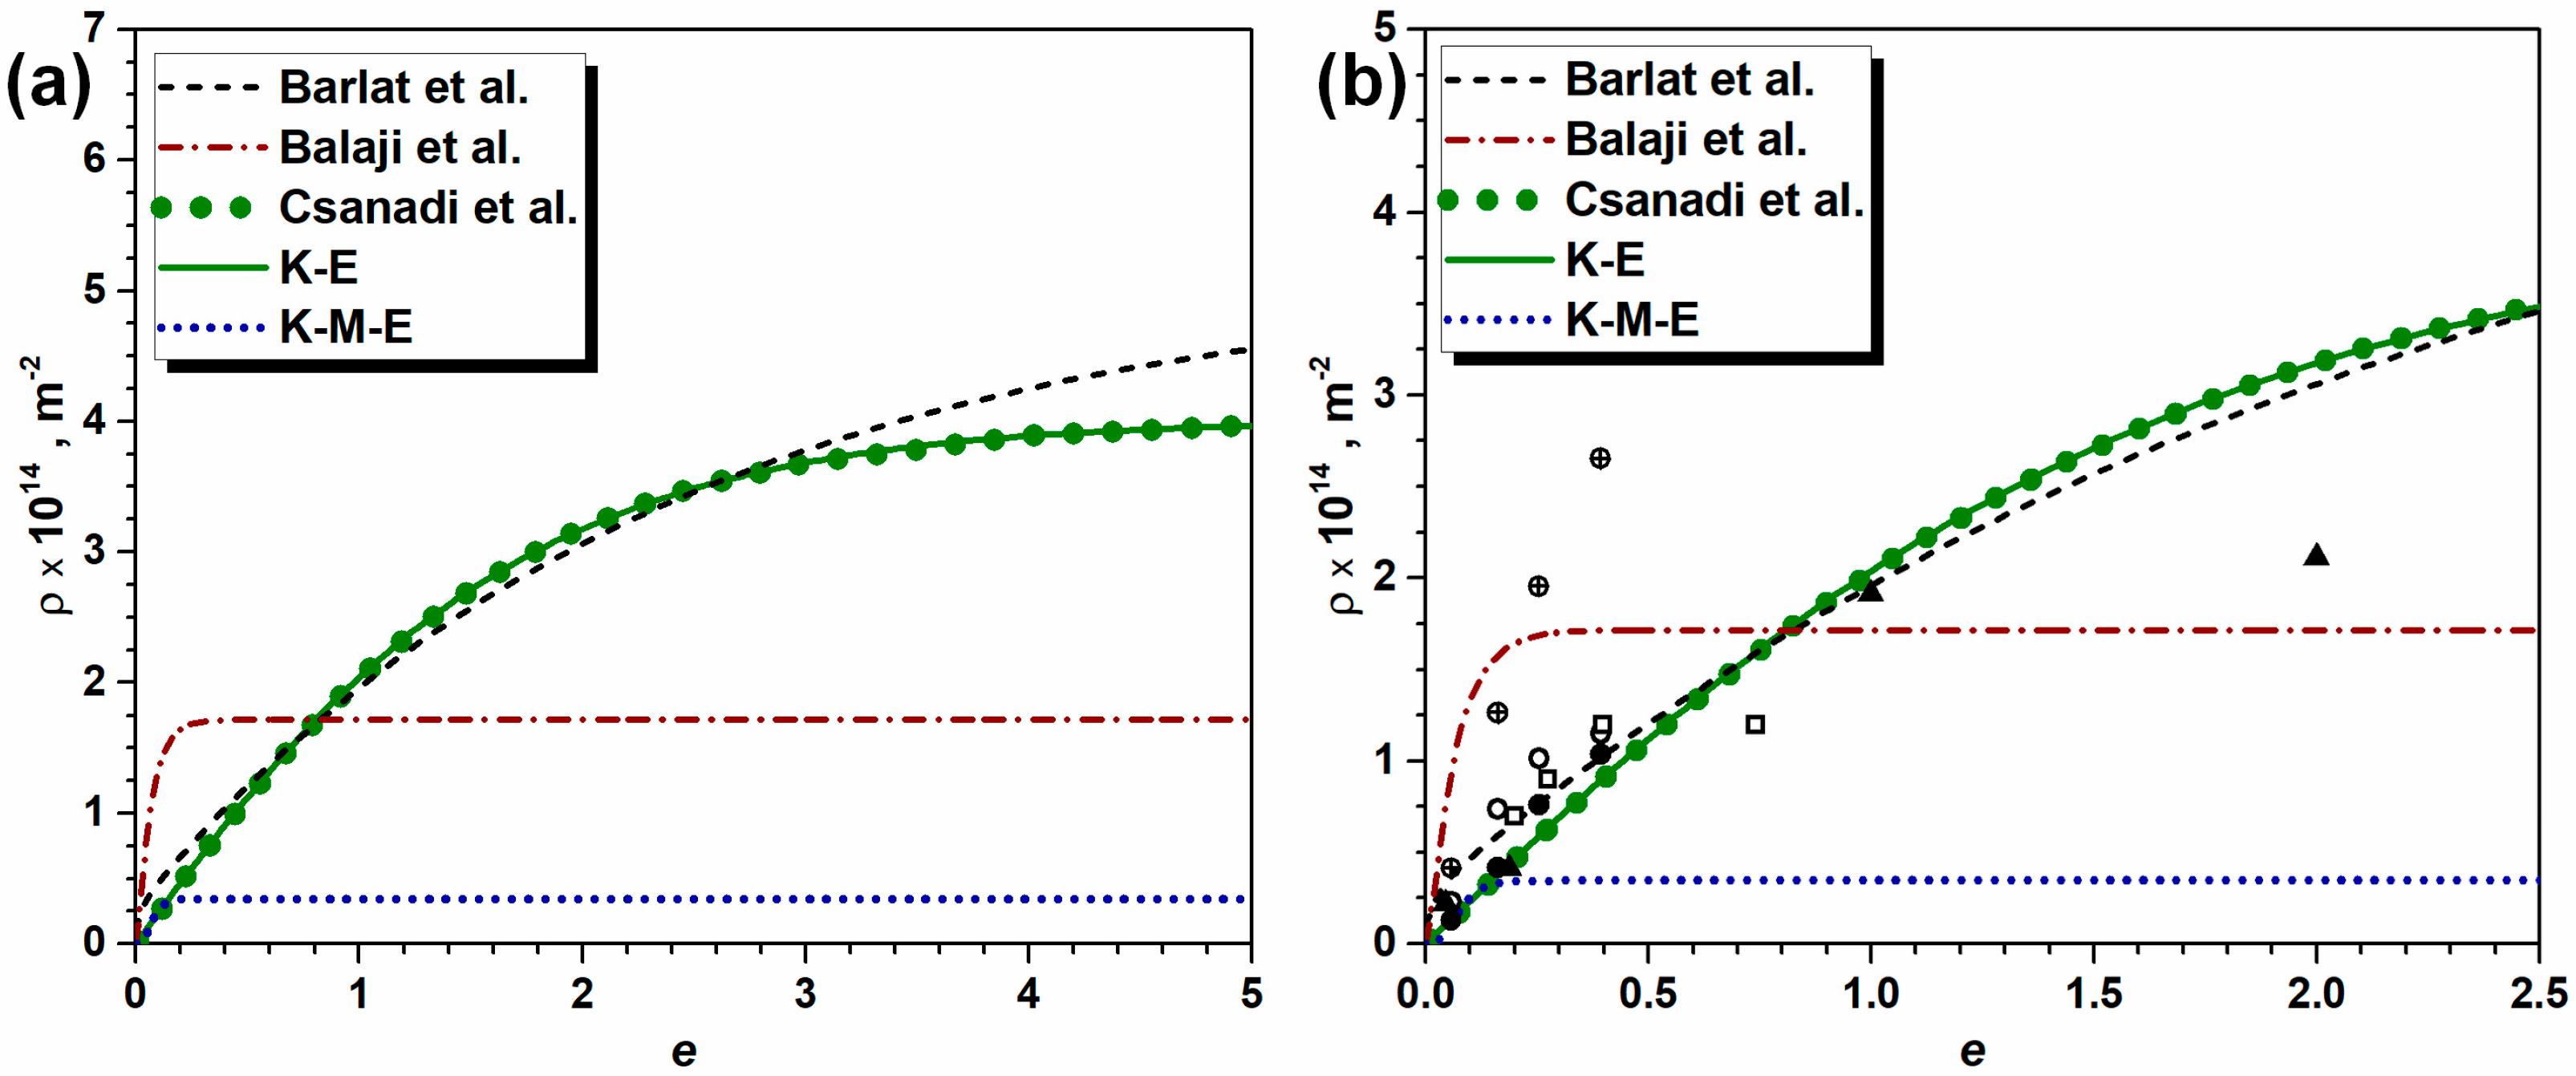
In order to assess the efficiency of the above-described and well-established dislocation models [11,13,25], a systematic comparison has been conducted among diverse model predictions for pure Al with the aim of excluding interactions between dislocations and fine precipitates or secondary phases. Both Al and Al alloys have FCC crystal lattices and exhibit comparatively simple slip behavior during plastic deformation. Therefore, the evolution of dislocation density in this simple polycrystalline system can be modeled with a relatively high degree of reliability.
The results presented in Figure 1 demonstrate that the models employed [11,13,25] are capable of reproducing the intrinsic response of pure aluminum in terms of the generation of dislocations with different degrees of accuracy. In the present cases, the model developed by Barlat et al. [1] was modified as follows: (i) The dependency of the geometric constant α and Taylor factor on strain was taken into account, and (ii) it was considered that the mean free path of dislocations is a function of the cell size developed, as it is described elsewhere [4]. As Figure 1a shows, all models tend to predict comparable order of magnitude for the ρ; however, the major differences among the numerical approaches are related to the work hardening rate (shape of the corresponding ρ-e curve) and the degree of saturation. The evolution of dislocation density as predicted by the Barlat [11], Csanadi [13], and K-E [12] models showed good quantitative agreement with the microstructural observations reported in the literature [11,13,25]. The experimental evidence obtained via “Transmission Electron Microscopy” (TEM) and X-ray line profile analysis tends to scatter along the lines predicted by these models (see Figure 1b).

Figure 1.
Evolution of dislocation density during deformation in pure Al or technically pure Al alloys: (a) evolution of ρ with straining level simulated with diverse modeling approaches, adapted from Refs. [11,13,25] and (b) correlation between the simulated and experimental counterparts reported in different literature sources, adapted from Refs. [26,27,28].
It is obvious that the K-M approach agrees quite well with other models [11] at lower strains, whereas the major discrepancy is observed at the straining levels above 0.2. The reason for this quantitative disagreement is related to the fact that the K-M model parameters were mainly derived from stress–strain behavior, where materials show limited ductility. Despite the acceptable level of agreement with experimental counterparts, an important limitation of the above-mentioned dislocation models [11,13,25] lies in the determination of model parameters. These numerical approaches rely not only on a number of fitting parameters with direct experimental correlations but also require a more extensive dataset. Typically, the initial dislocation density, the multiplication and recovery rates of dislocations, and material-specific constants are required for the simulations. Determination of fitting parameters (dislocation interaction, recovery, and multiplication) with high accuracy is non-trivial inasmuch as in many cases, the related phenomena cannot be observed directly, but the corresponding parameters can be derived (indirectly) from experimental stress–strain curves or extracted either from crystallographically resolved finite element or atomistic simulations. All these factors introduce ambiguity and variability into the modeling of dislocation evolution. In view of this challenge, the current work attempts to find a correlation among the model parameters of different approaches to enhance the applicability of dislocation-based modeling.
3. Materials and Experimental Procedures
The evolution of dislocation density was analyzed in a technically pure Al alloy from the 1xxx series (Al-0.3wt%Si-0.2wt%Fe), Al-4%wtMg-0.6wt%Si alloy from the 5xxx series, and Al-1.2Mg-0.7Si-0.6Mn alloy from the 6xxx series. All investigated materials were subjected to high-temperature annealing (550 °C) in order to get rid of internal stresses and ensure fully recrystallized microstructures with the lowest possible dislocation density. The heat-treated samples were cold-rolled to different straining levels by a laboratory rolling mill with a roll diameter of 150 mm.
The deformed materials were cut and subjected to mechanical grinding. Afterward, the surfaces were polished by using diamond suspensions containing 3 µm particles. The final polishing was performed with 1 µm diamond suspension. The polished materials were soap-cleaned under running water and then dried.
The evolution of Vickers hardness Hv with strain was analyzed with the aim of investigating the evolution of dislocation density in deformed materials by the methodology described elsewhere [4]. The indentation measurements were accomplished by using a Zwick/Roell® ZHVµ-type microhardness tester. The microhardness tests were performed in the mid-thickness of the “Transverse Direction” (TD) plane (plane perpendicular to TD) with a load above 200 gf in order to avoid the so-called indentation size effect [29,30].
4. Correlation Between Model Parameters in Diverse Numerical Approaches
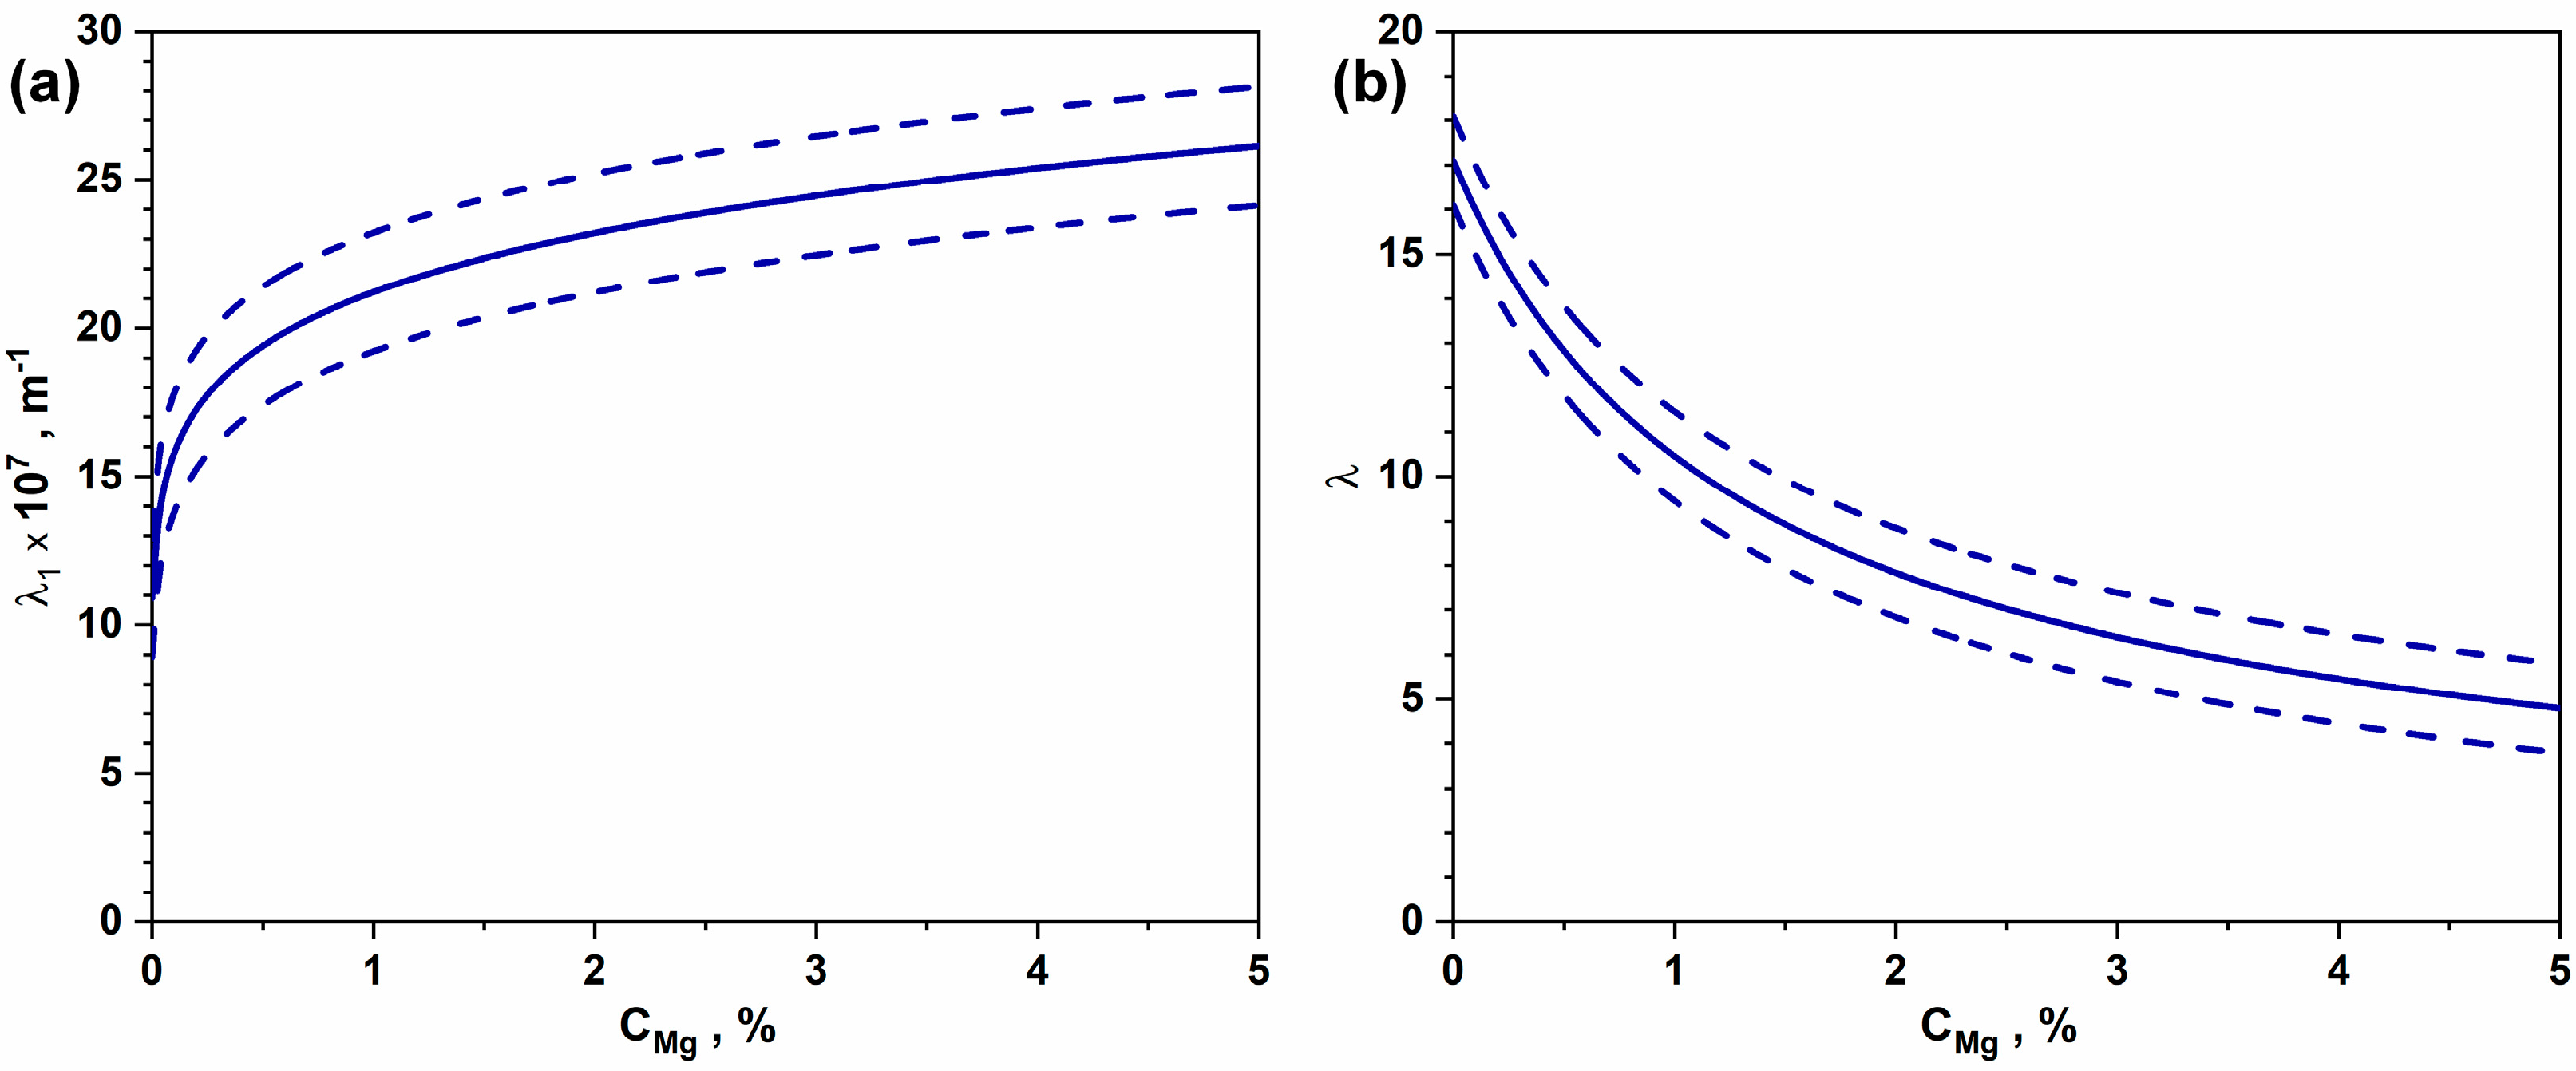
As summarized above, the employed dislocation modeling approaches [5,11,12,13,14,25] use different boundary conditions; therefore, the connection between the model parameters is not always obvious, except for the K-E [12] and simplified K-E approaches [13]. In binary systems, the effect of one alloying element on the model parameters can be fitted by a relatively simple function; however, this task is far more challenging in the case of complex alloys. For Al-Mg alloys listed in Table 1, the λi parameters of the K-M-E approach [11,14,25] can be expressed as functions of Mg content 17] (see Figure 2a,b):
where the content of Mg CMg is given in wt%.
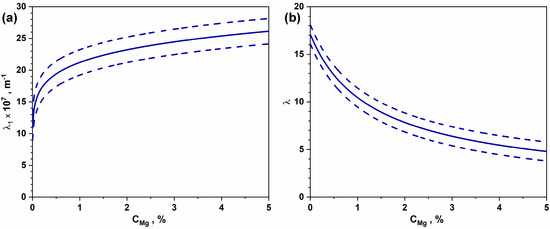
Figure 2.
Change of K-M-E model parameters λ (b) and λ1 (a) as a function of Mg content in binary Al-Mg alloys (adapted from Refs. [11,14,25]). The dashed line shows the upper and lower bounds of the data spread listed in Table 1.
In some instances, the model parameters of a given approach are defined for a variety of materials, yet a different set of constants is needed for another model. It turns out that a correlation exists between the K-E and K-M-E model parameters. In the K-E model, the saturation level is controlled by the C2 and C4 parameters, while in the K-M-E model, it is governed by the λ parameter. The generation of dislocation (hardening) in the mentioned models is governed by the C1 and λ1 material constants. The below derived relationship enables defining a link between the two models, facilitating parameter translation across different modeling approaches, and the correlation between them is expressed as follows:
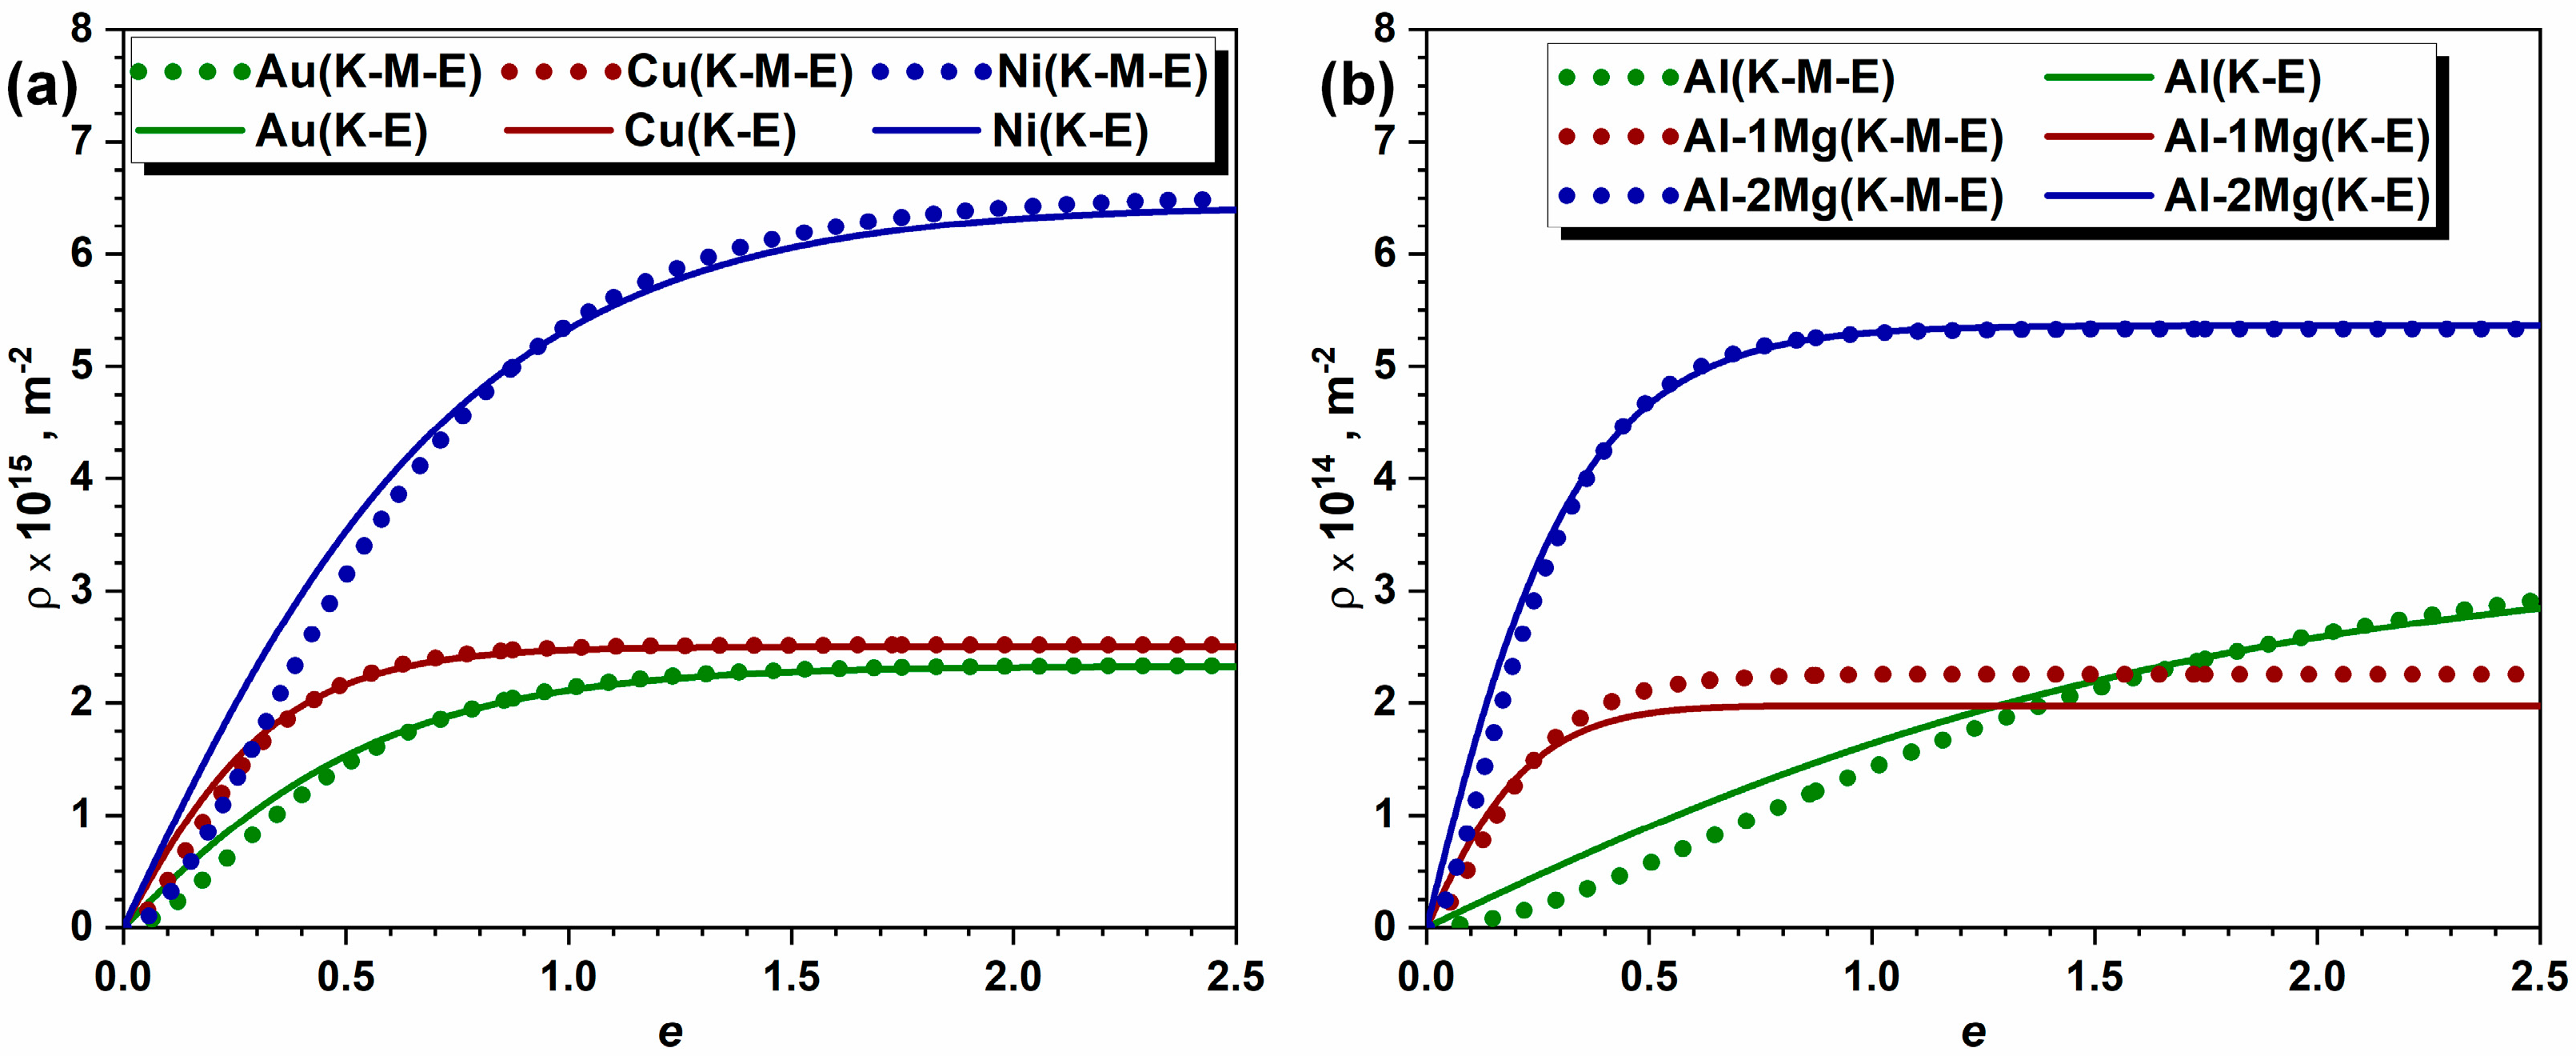
Figure 3 shows that the defined Equations (22) and (23) provide a very reasonable quantitative agreement for the evolution of dislocation density in a vast variety of materials (Au, Cu, Ni, Al, and Al-Mg alloys). The only difference is observed at the early stages of deformation, where the K-M-E model [11,14,25] shows a more sluggish generation of dislocations as compared to the K-E simulations; however, this discrepancy is related to the difference in boundary conditions employed in the two approaches.
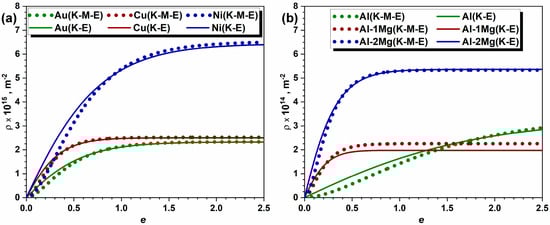
Figure 3.
Evolution of dislocation densities predicted by the K-E, adapted from Refs. [12,13] and K-M-E, adapted from Refs. [5,14] models in (a) pure Al and Al-Mg alloys and (b) pure Au, Cu, and Ni.
5. Assessment of Dislocation Evolution in the Investigated 1xxx, 5xxx, and 6xxx Al Alloys
5.1. Hardening Phenomena During Rolling in 1xxx, 5xxx, and 6xxx Al Alloys
A generalized strain-hardening behavior of metallic materials can be successfully described by the empirical expression developed by Sahoo et al. [31]:
where is the Vickers hardness that corresponds to saturation stress, corresponds to the yielding, and and a are hardening parameters.
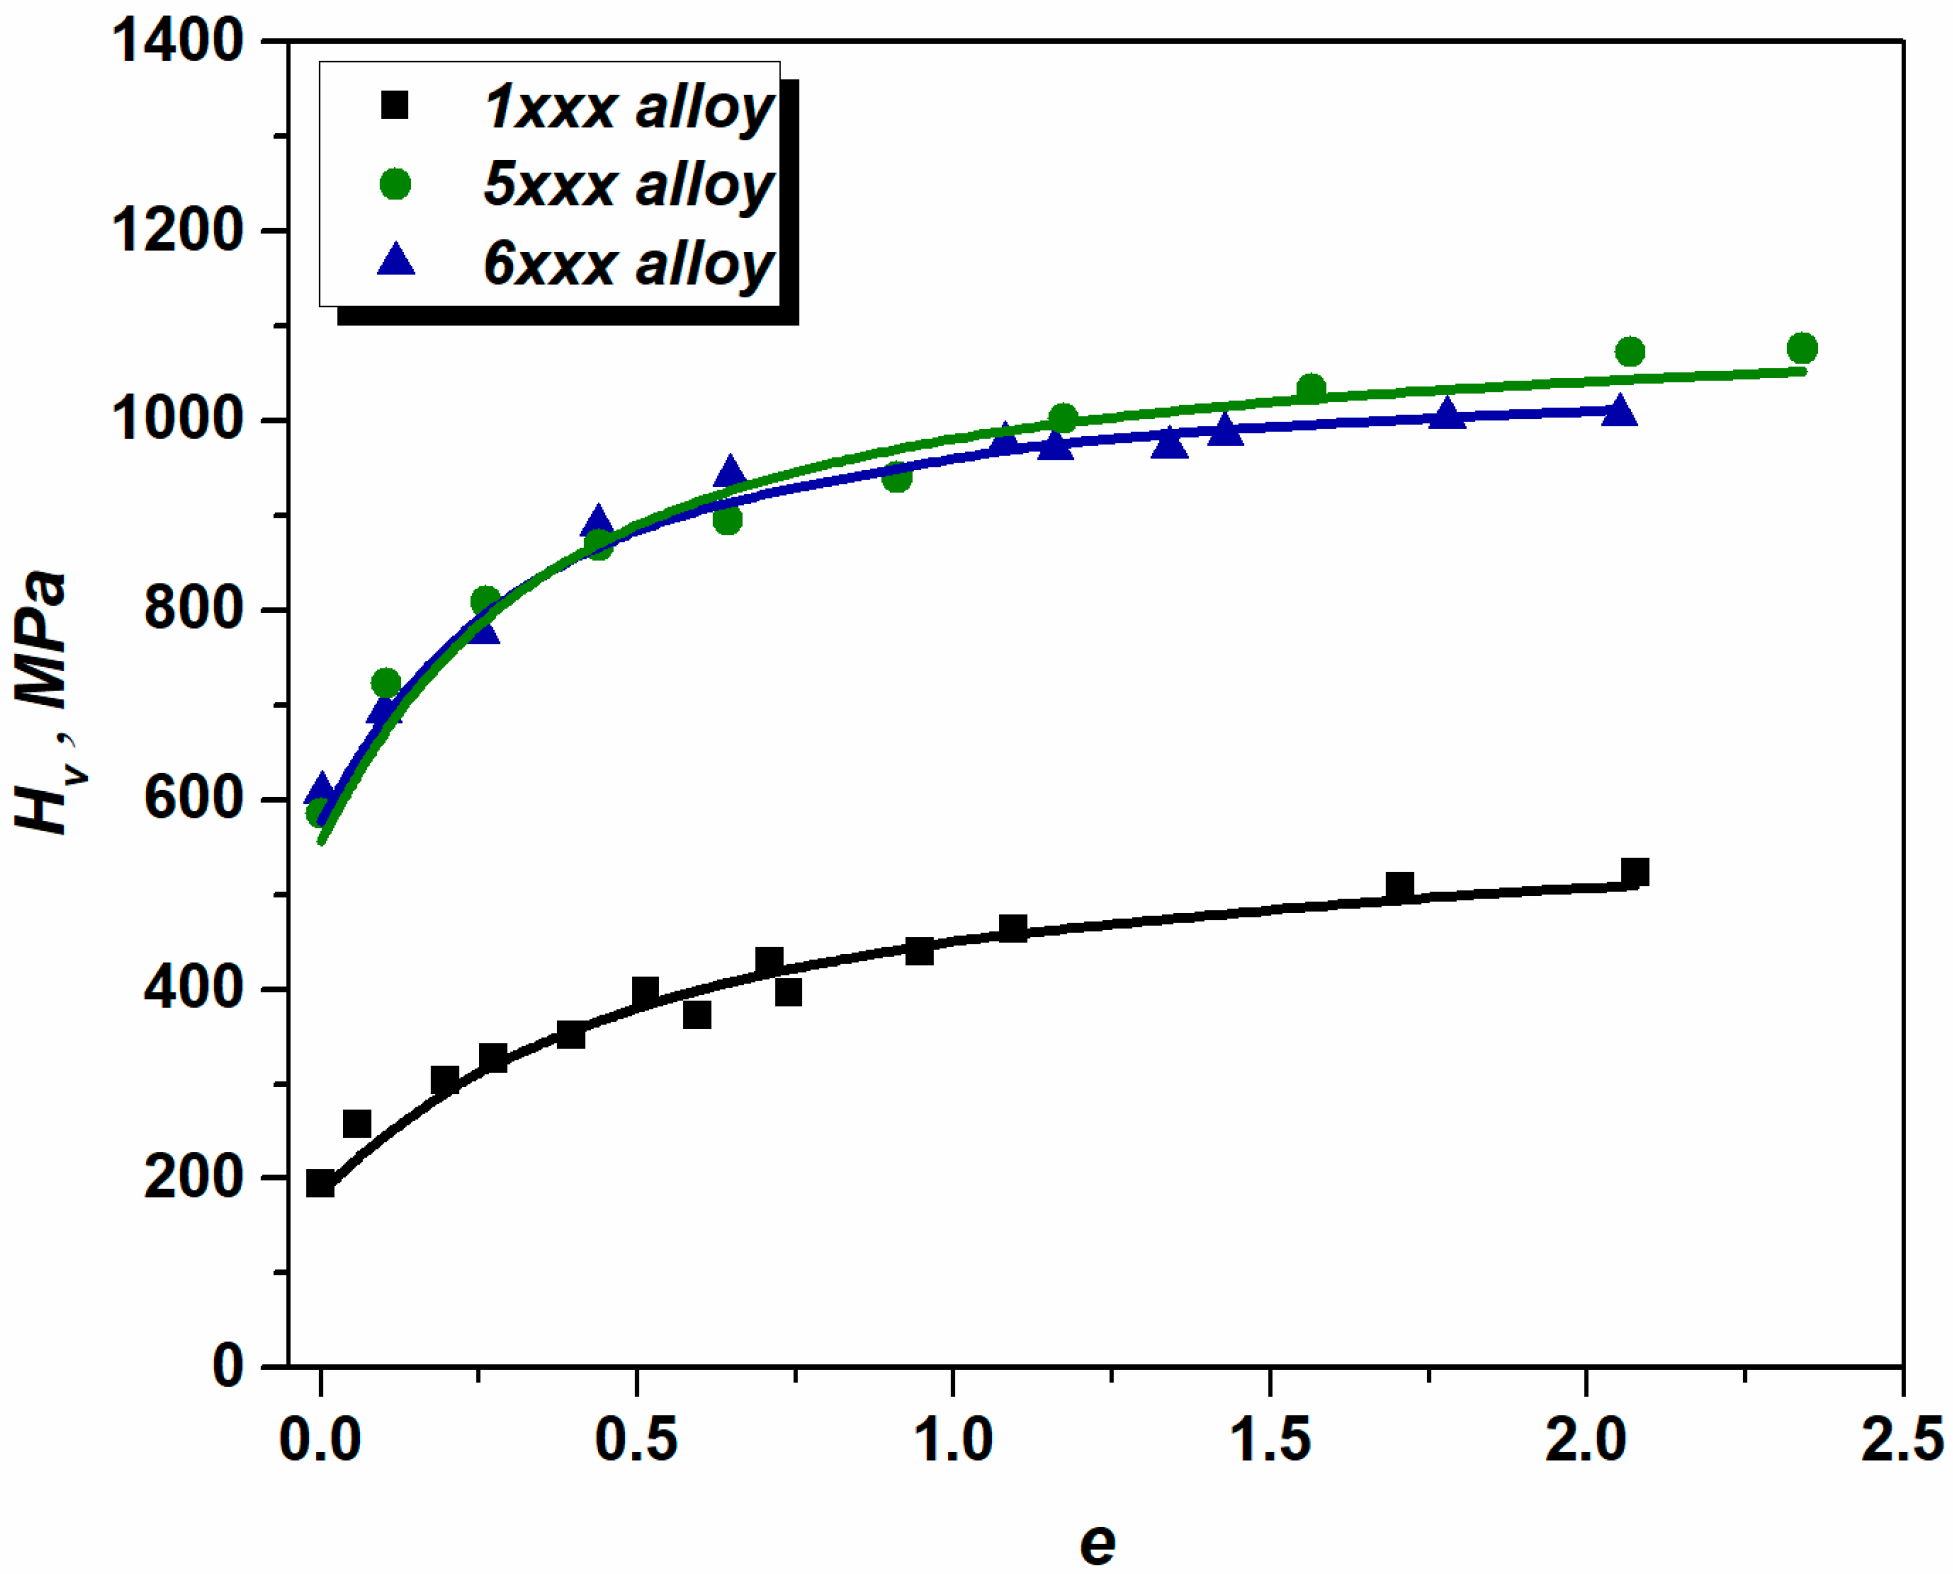
The evolution of Vickers hardness in the investigated Al alloys is presented in Figure 4. The fitted material parameters of Equation (24) are listed in Table 4.
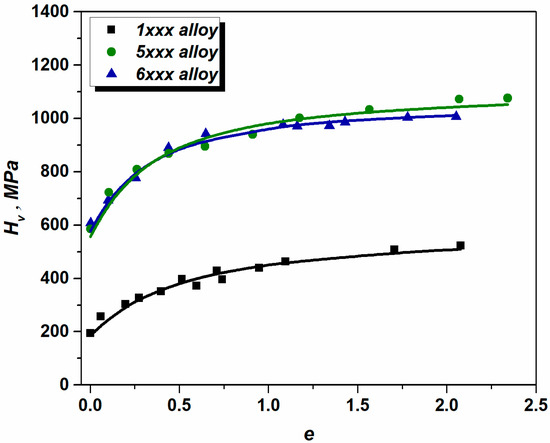
Figure 4.
Strain hardening in the investigated Al alloys, and the fitted Sahoo hardening curves. The continuous lines correspond to hardening modeled by the model of Sahoo et al. Adapted from Ref. [31].
Table 4.
Strain hardening model parameters fitted for the investigated Al alloys.
As Figure 4 reveals, both 5xxx and 6xxx alloys show comparable hardening behavior; therefore, the material-dependent hardening parameters (see Table 4) only slightly deviate from each other. In contrast to alloyed materials, the technically pure 1xxx alloy does not reach the saturation level in the investigated straining range, and the corresponding hardening constant hp is ~4 times lower than that compared to both 5xxx and 6xxx alloys.
The stress measurement during rolling is complicated; however, this quantity can be estimated from the evolution of hardness. Generally, the Vickers hardness and the flow stress are linearly related to one another via the Tabor Factor T [32,33,34] (Hv = σT), which is commonly assumed to be a constant value (~3) [32,33,34]. This is true for the high deformation levels, whereas at a low straining level, T is significantly larger. It was shown [4] that for Al alloys, T tends to change with strain as follows:
Combining Equations (24) and (25) enables the assessment of flow stress evolution with strain in cases when stress cannot be measured directly. It should be noted here that the evaluated stress is of an approximate nature and might deviate from the real one.
5.2. Substructure Evolution
In polycrystalline materials, deformation typically induces the generation of dislocations, leading to the formation of various substructural domains. These micro-sized substructural entities exhibit slight misorientations, typically a few degrees. In metals with high stacking fault energy (e.g., Al and Al alloys), dislocations tend to form interconnected tangles, resulting in block-shaped cellular structures [1,7,26], which deform uniformly by accommodating strain through slip system activation within the blocks. The substructure evolution is typically investigated by transmission electron microscopy, which requires time-consuming sample preparation followed by timely measurements and data postprocessing. In view of this, several indirect techniques [4,9,10] were employed for the assessment of substructure evolution.
Substructure evolution with strain, as described in several studies [1,7,26,35,36], follows a general trend represented by the following expression [4]:
where Dc is the average cell size and D1.5 is the cell size at a strain of 1.5.
The above dependence is generic, and the evolution of substructure can be computed for a variety of metallic materials. For pure metals, the values of D1.5 are as follows: ~0.5 μm for Al, ~0.3 μm for Cu, ~0.3 μm for Ni, ~0.3 μm for Fe, ~0.4 μm for Cr, and ~0.2 μm for Nb [1,7,37]. Equation (26) predicts a decrease in average cell size with increasing strain, primarily due to dislocation formation. At lower strains (up to ~0.5), the fragmentation of cells is quite rapid, while at higher strains, the subdivision becomes relatively linear and tends to saturate. The saturation at large straining levels is attributed to dislocation annihilation and grain boundary sliding [1,7,38].
Adding substitutional elements to pure metals alters strain hardening behavior, as shown in Figure 4, and thus affects substructure evolution. In binary Al-Mg systems, alloying pure Al with 3% Mg increases dislocation density by about tenfold and reduces the average crystallite size by several times [28]. It was also shown that in Al alloys with high solute content of Mg, cellular structure formation is suppressed [23,39]. In Al-5at%Mg alloys, low strain leads to the formation of Taylor lattices (uniformly distributed dislocation tangles in stressed {111} planes) [39]. Higher strains (~20% cold rolling) result in geometrically necessary boundaries that separate misoriented Taylor domains [39]. Thus, in highly alloyed Al systems, Dc refers more accurately to substructural domains.
In complex systems such as commercial Al alloys, the effect of each alloying element on the substructure evolution is not evident due to the fact that some elements remain in solid solution while others tend to form constituent particles or secondary phases. Microindentation seems to be an effective way for the quantitative assessment of substructure evolution [4]. The following equation enables computing the average cell size during deformation by measuring Vickers hardness profiles [4]:
where Hv and Hv0 are Vickers hardness values in Pa in the deformed state and recrystallized material prior to straining, respectively, C* ≈ 2.1, and CH ≈ 0.95.
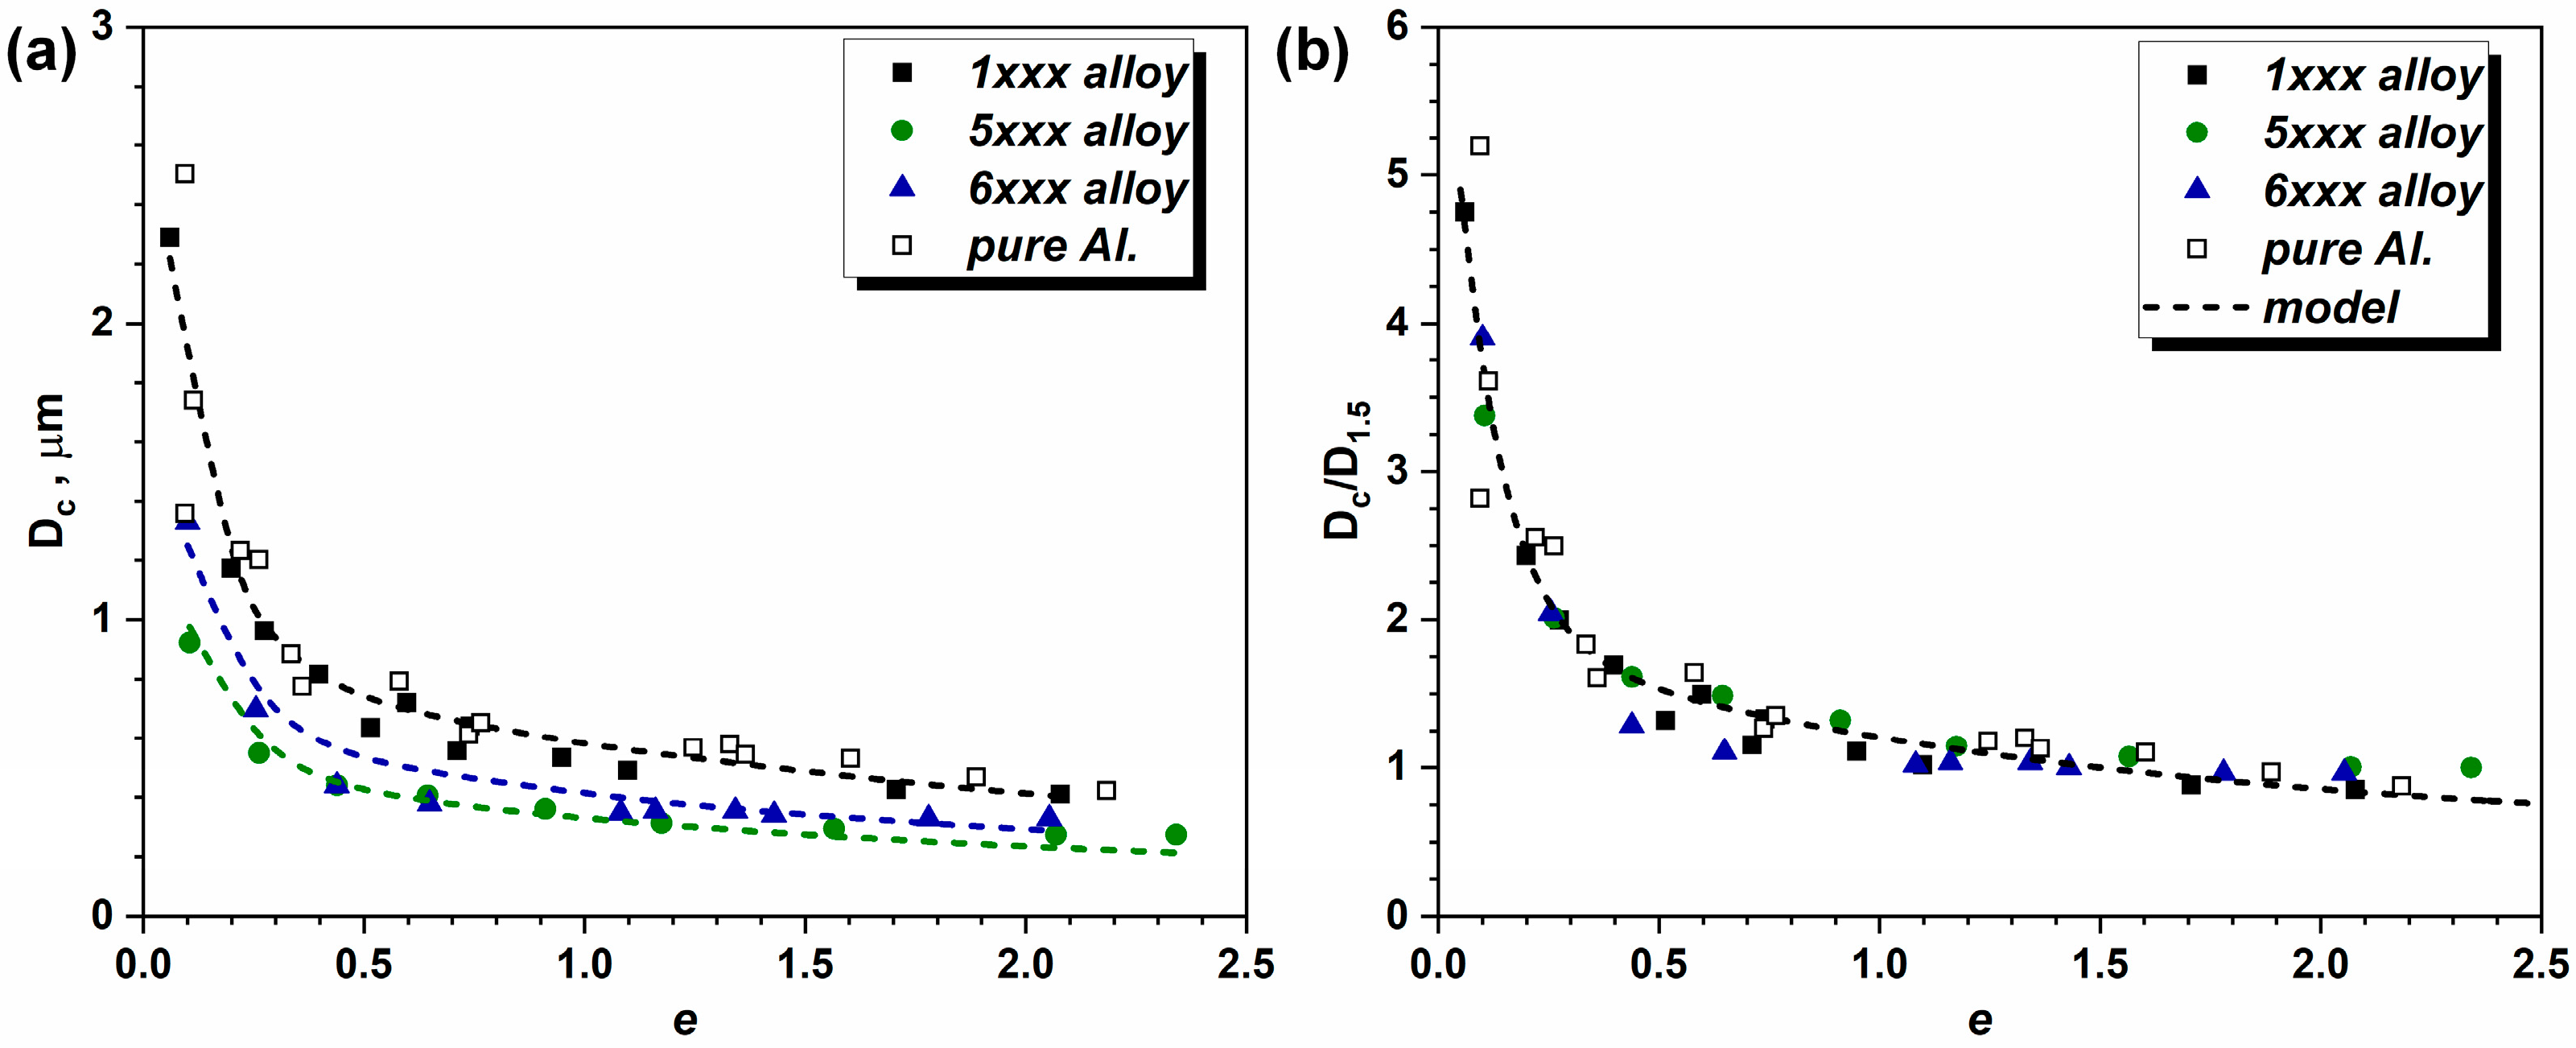
Figure 5a illustrates the calculated cell size values for three investigated alloys, as simulated by using Equation (26). Within the simulation framework, the evolution of the Taylor and Tabor factors with increasing strain was computed based on Equations (3) and (25), respectively. For the investigated 1xxx, 5xxx, and 6xxx Al alloys, the dashed fitting curves were produced by employing Equation (26), with D1.5 (1xxx) = 0.5 μm, D1.5 (5xxx) = 0.273 μm, and D1.5 (6xxx) = 0.341 μm. The fitted value of D1.5 for 1xxx alloy correlates well with the one reported for pure Al [7] (D1.5 (Al) = 0.5 μm), while D1.5 (5xxx) is comparable with the counterpart measured in Al-3Mg alloy (D1.5 (Al-3Mg) = 0.21 μm [28]). As depicted in Figure 5b, there is a strong correlation between the normalized cell sizes (Dc/D1.5) derived from the indentation profiles and the counterparts predicted by Equation (26). This finding confirms both the fundamental nature of the model [4] and the fact that the substructure evolution can be quantitatively inferred from the indentation response across diverse deformation levels. In addition to this, the measured cell size of deformed pure Al (8 passes of ECAP, e = 9.2) is 190 nm [40]. The Dc values computed for Al (by employing Equation (26)) give 252 nm, which correlates well with the reported cell size [40]. The reported cell size in Al at the strain of ~8 [28] is 270 nm, whereas the computed Dc is 253 nm. At lower strains (e = 1.15), the TEM observation of 1xxx alloy [41] reveals the formation of a cellular structure of the size 270 × 430 nm. In the present study, the derived value of Dc for 1xxx alloy at a strain of 1.1 is 490 nm, which proves the validity of the methodology proposed. Assessment of substructure evolution in Al-3Mg alloy [28] claims that the average cell size after straining e = 8 is ~200 nm, while the approximated Dc for the investigated 5xxx alloy (containing 4% of Mg) is 143 nm (Equation (26), with D1.5(5xxx) = 0.273 μm). This computation is consistent with the evolutionary pattern of the substructure evolution in Al-Mg alloys, since Mg tends to refine the substructure.
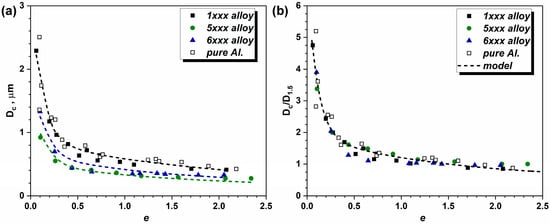
Figure 5.
Evolution of substructure in the investigated Al alloys: (a) dependence of characteristic substructural domain size Dc on strain from calculation and indentation measurements, and (b) variation of normalized cell size (Dc/D1.5) with strain from calculation and indentation measurements. The dotted lines in (a) were computed by Equation (26) with the following D1.5 values: D1.5 (1xxx) = 0.5 μm; D1.5 (5xxx) = 0.273 μm; D1.5 (6xxx) = 0.341 μm. Adapted from Refs. [7,26,36].
The evolution of dislocation density during plastic deformation can also be derived from the microindentation profiles by employing Equation (28):
where ρ0 = 1010, m−2 (dislocation density in recrystallized materials).
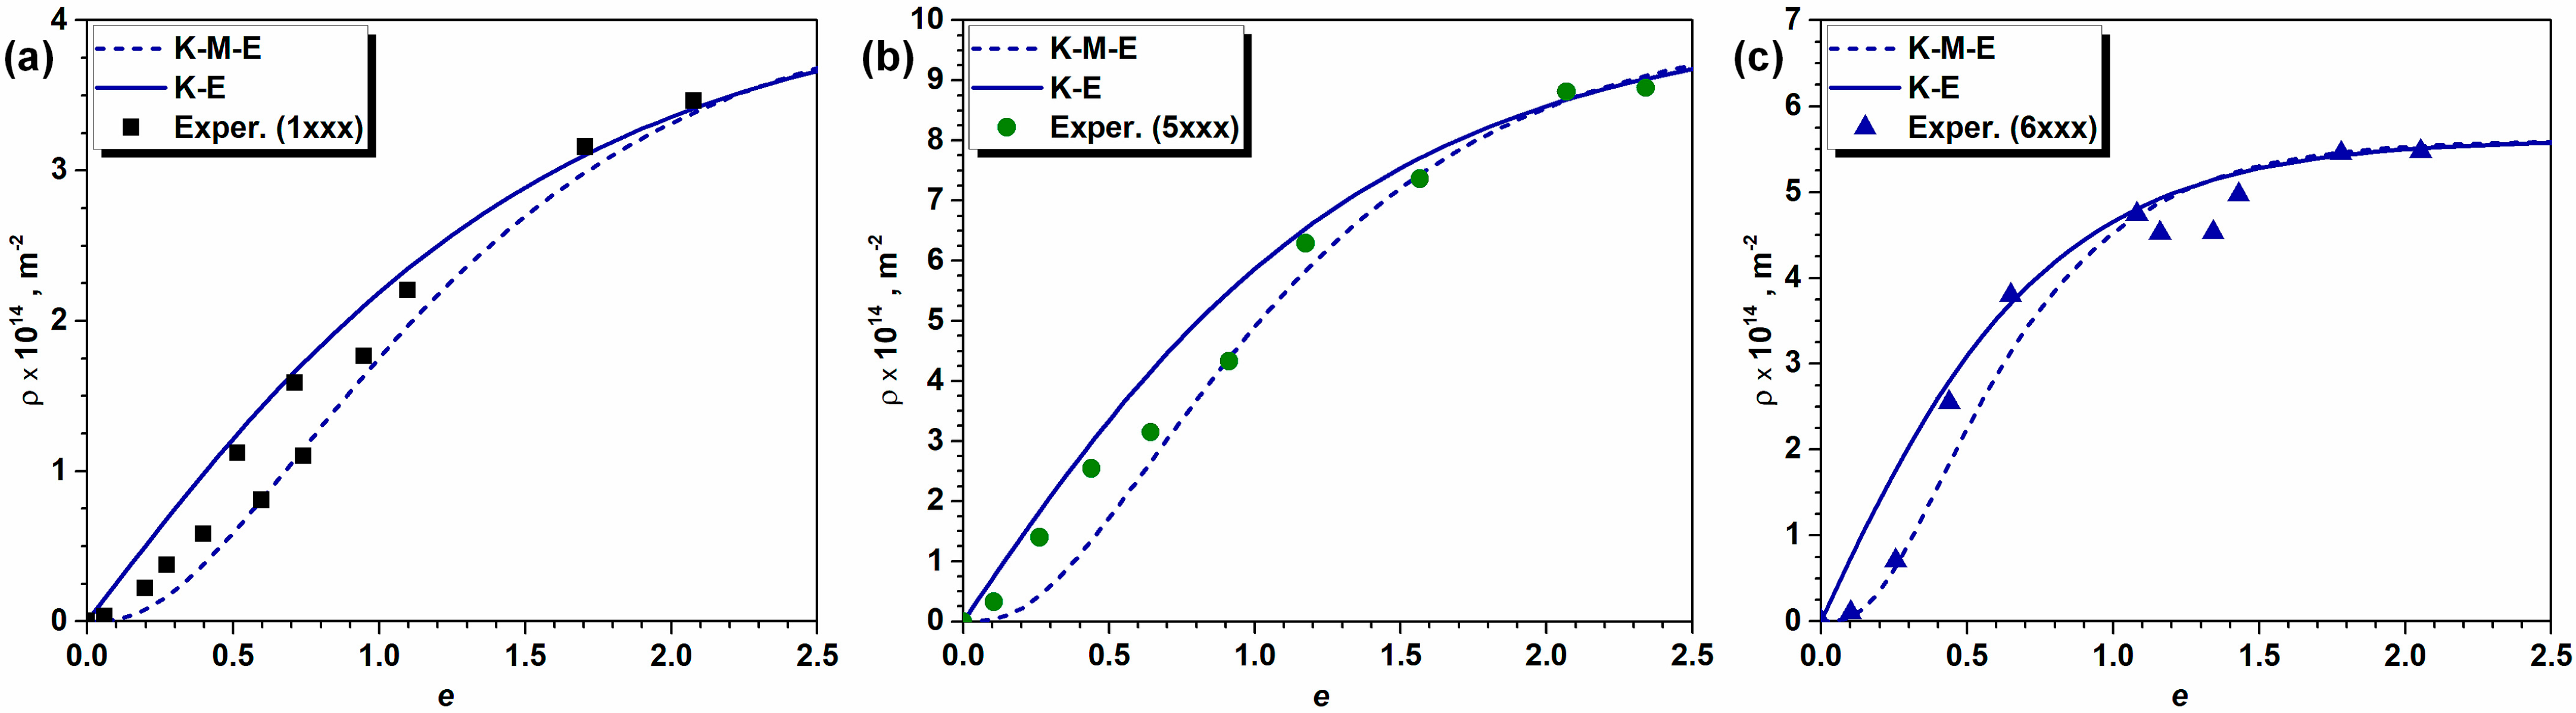
The model parameters T, M, and α can be computed by combining Equations (3)–(5), (25), and (27). Figure 6 shows the development of linear defects with increasing strain in the studied 1xxx, 5xxx, and 6xx alloys. The computed values of ρ in technically pure Al alloy from the 1xxx series tend to align with the evolutionary pattern simulated by both the modified K-E and K-M-E models, though some scatter is observed. The corresponding Ci values of the investigated 1xxx alloy are listed in Table 5 and are comparable to those reported for pure Al (see Table 1). The λi coefficients of the K-M-E model, computed from the corresponding Ci values by Equations (22) and (23), ensure a strain-dependent evolution of ρ that closely resamples the simulated K-E curves.
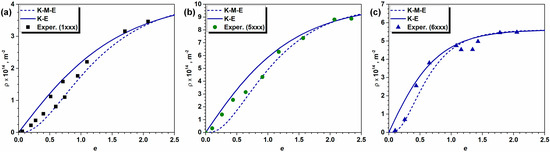
Figure 6.
Measured and simulated dislocation densities in the investigated Al alloys: (a) 1xxx alloy, (b) 5xxx alloy, and (c) 6xxx alloy.
Table 5.
Model parameters fitted for K-E and K-M-E models.
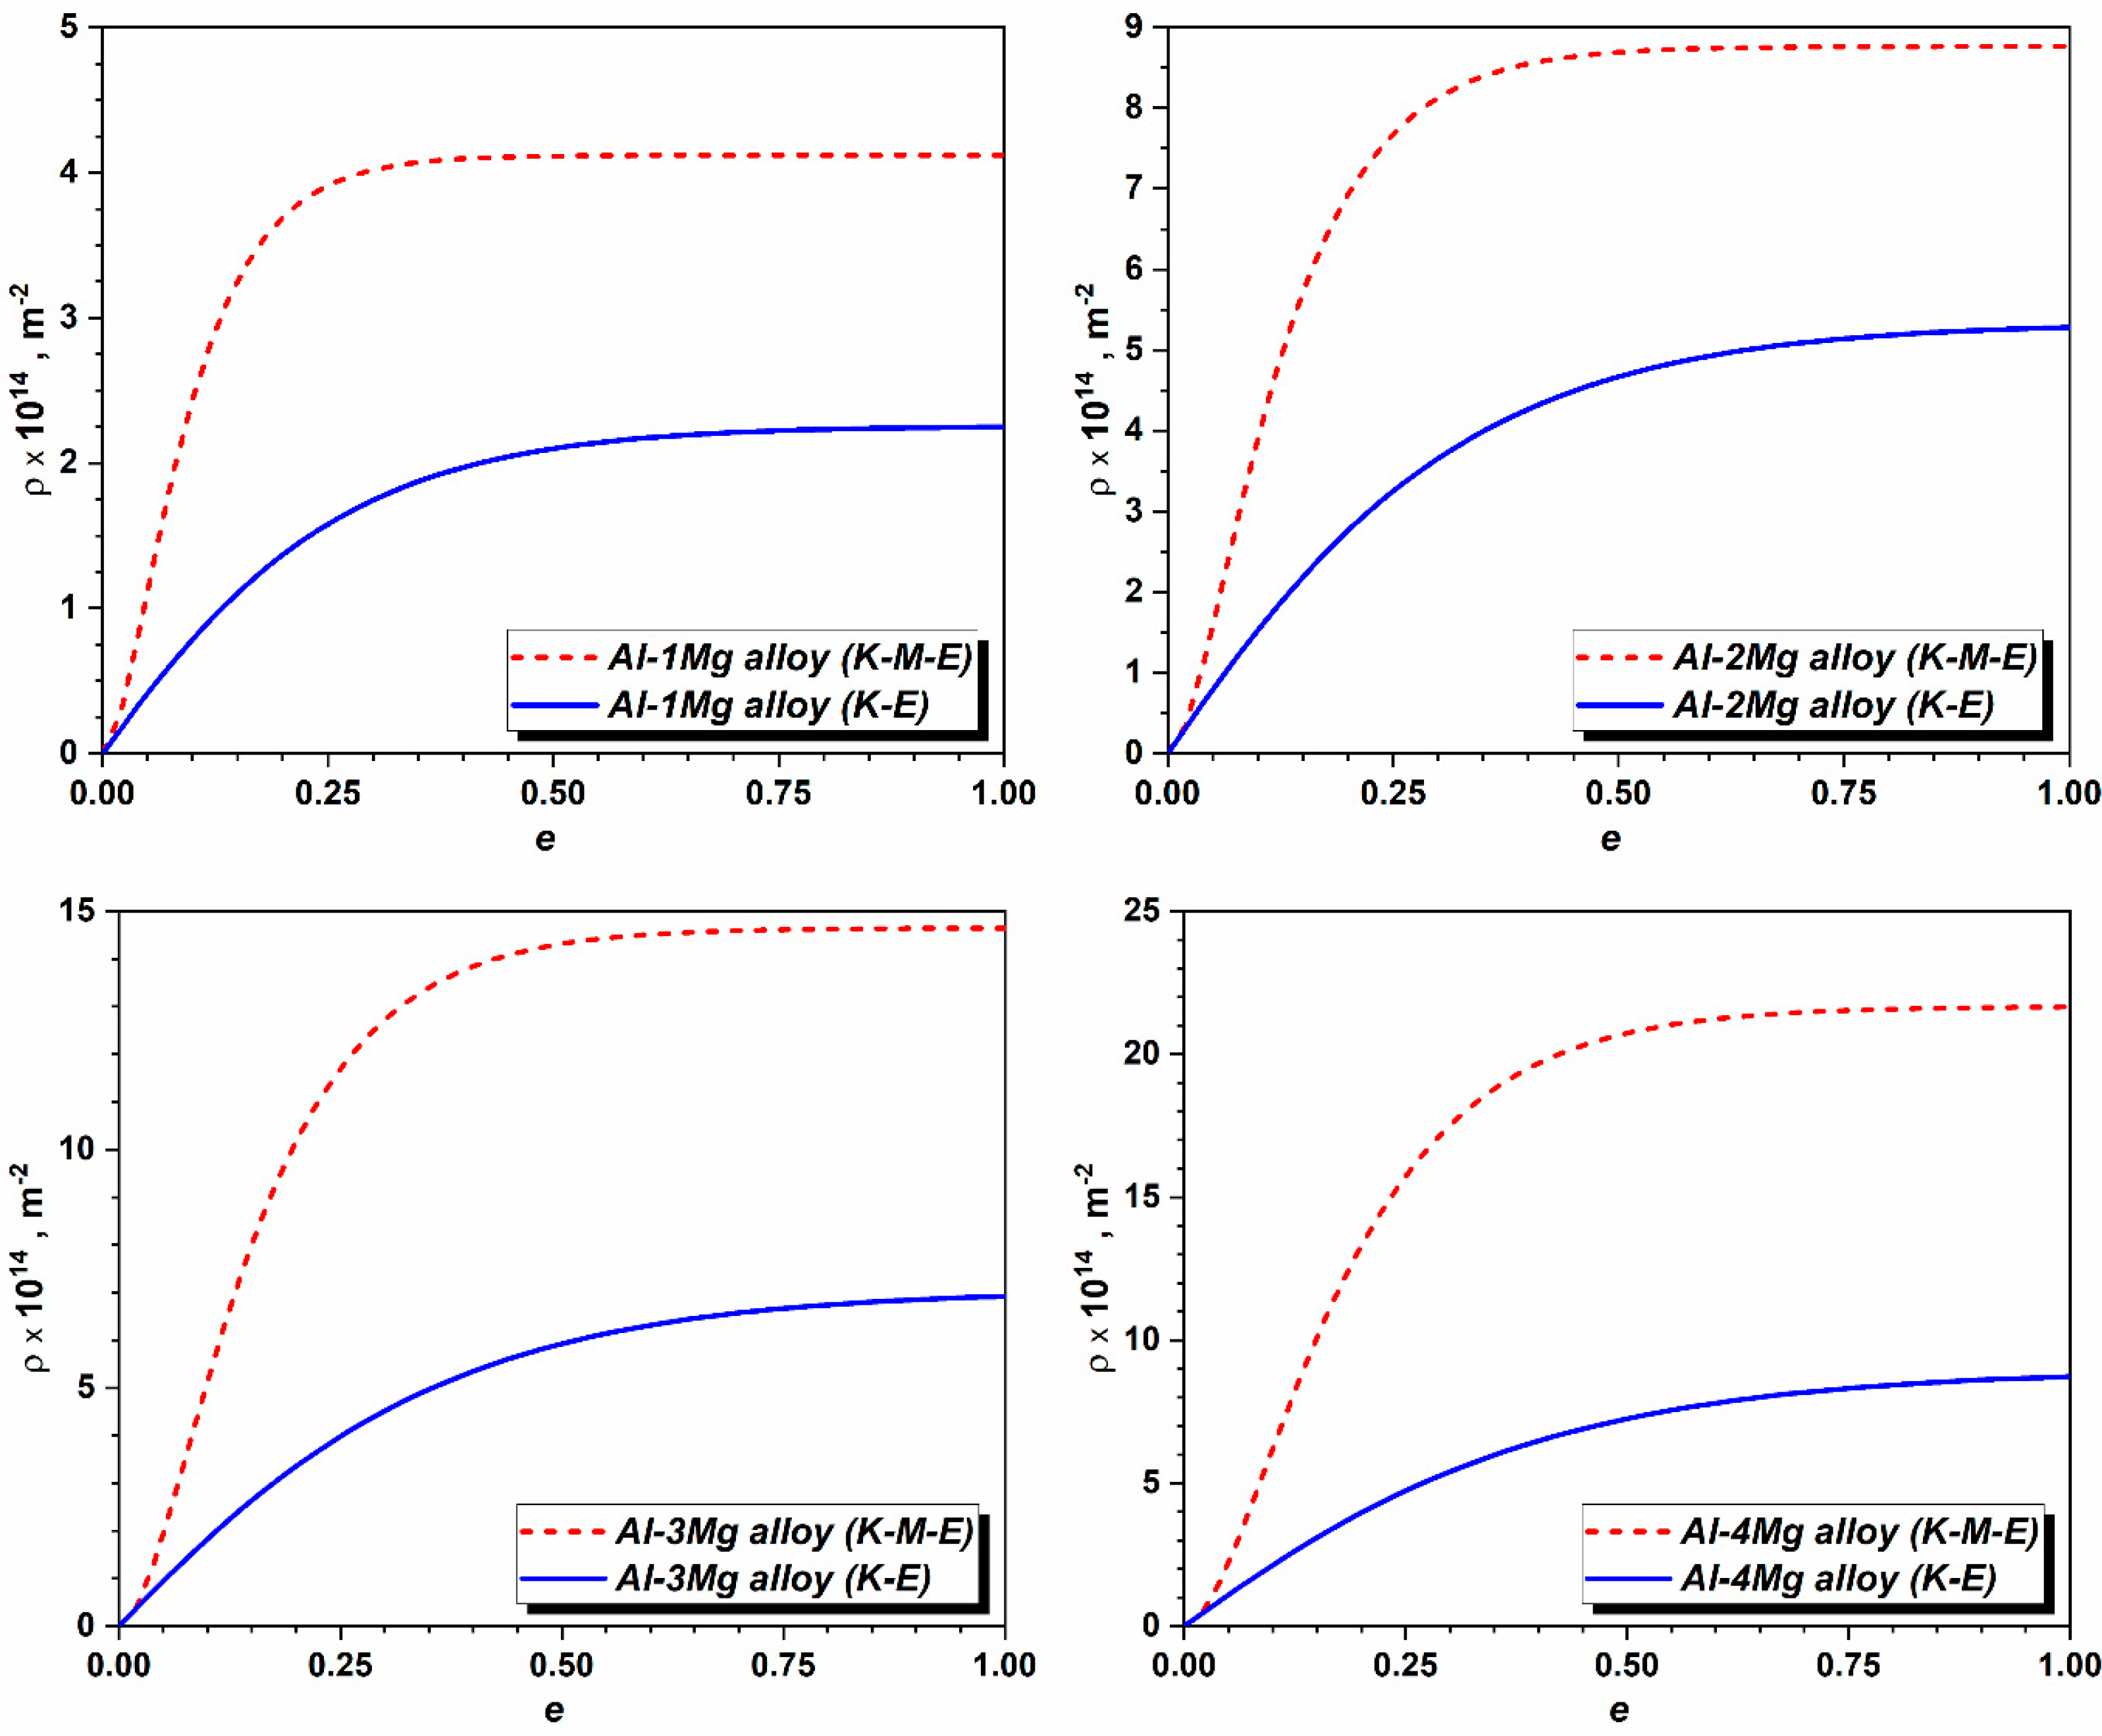
The dislocation density in the 5xxx alloy tends to saturate at higher levels compared to the 6xxx alloy (Figure 6b,c), despite the similar strain hardening behavior observed in both alloys (Figure 4). This quantitative difference in ρ arises from variations in alloying element content. This is particularly true while comparing Mg content in the investigated 5xxx and 6xxx alloys. Analyzing the simulated curves for various Al-Mg alloys (see Figure 7), it becomes obvious that the dislocation density tends to increase with the Mg content in aluminum. The corresponding C1 and C4 coefficients were obtained from literature sources (the values for Al-4% Mg content were approximated based on available data) [28], while the λi model parameters were computed by Equations (20) and (21) (see Table 5). It should be noted here that Ci and λi model parameters were not correlated to each other by Equations (22) and (23) in order to reveal the degree of scatter in dislocation densities reported by various literature sources. It is obvious from Figure 7 that the predicted dislocation densities are of the same order of magnitude; however, the ratio of the upper (K-M-E) and lower (K-E) bounds tends to vary between 2 and 4. This range of variations is justified since materials investigated and described in different literature sources were not subjected to identical strain paths, the initial grain sizes were not identical, both the initial and deformation textures were different, etc. All these factors have an effect on the substructure development; therefore, the reported values of ρ are different. In the case of 5xxx alloy, the dislocation densities estimated from the corresponding hardness measurements are significantly higher than those computed for the Al–3wt%Mg alloy (see Figure 6 and Figure 7). This discrepancy is primarily due to the higher Mg content in the investigated alloy and the presence of additional alloying elements, such as Si, Fe, and Mn. These alloying elements enhance strain hardening either through solid solution strengthening or by contributing to the formation of secondary phases, both of which impede dislocation motion and increase the resistance to deformation. The evolution of dislocation density in the 6xxx alloy falls between the curves computed for Al–1Mg and Al–2Mg alloys. This behavior can be attributed to the alloy’s composition, which includes 1.2 wt% Mg along with significant amounts of Si and Mn, which contribute to strain hardening through either solid solution strengthening or possible formation of secondary phases such as Mg2Si. As compared to 1xxx alloy, the observed higher dislocation densities in the investigated 5xxx and 6xxx alloys are due to both solid solution strengthening and the presence of constituents.
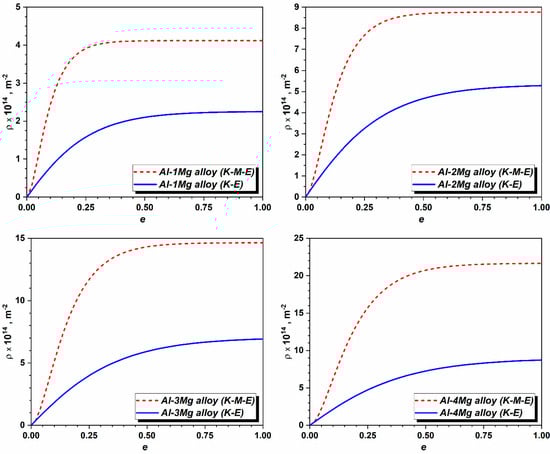
Figure 7.
Simulated evolution of dislocation densities in various Al-Mg alloys.
During severe plastic deformation, the dislocation density tends to saturate at high straining levels. It was shown that after 8 deformation passes by Equal-Channel Angular Pressing (ECAP) with an equivalent strain of e ≈ 9.2, the measured dislocation densities are ρ(Al-1Mg) = 2.8 × 10¹⁴ m−2 and ρ(Al-2Mg) = 4.5 × 10¹⁴ m−2 [40]. The corresponding computed ρ values by the K-E and K-M-E models are as following: ρ(Al-1Mg, K-E) = 2.25 × 10¹⁴ m−2, ρ(Al-1Mg, K-M-E) = 4.12 × 10¹⁴ m−2, ρ(Al-2Mg, K-E) = 5.28 × 10¹⁴ m−2, and ρ(Al-2Mg, K-M-E) = 8.77 × 10¹⁴ m−2. The comparison between experimental results and computed counterparts confirms both the reliability of the modeling frameworks employed and the validity of the derived model parameters.
Comparison of the evolutionary trends of dislocation densities in the investigated materials indicates that higher dislocation densities in the investigated 5xxx and 6xxx alloys are due to both solid solution strengthening and the presence of constituents. Examining Ci coefficients fitted for the investigated Al alloys (see Table 5), it becomes obvious that in highly alloyed systems, the rate of dislocation generation is high (C1(1xxx) < C1(5xxx) < C1(6xxx)), whereas the degree of recovery is also more intensive ((1xxx) < (5xxx) < (6xxx)). In commercial alloys consisting of numerous components, the correlation between the Ci and λi coefficients and the content of alloying elements is intricate due to the complexity of thermodynamic processes involved in the development of phases.
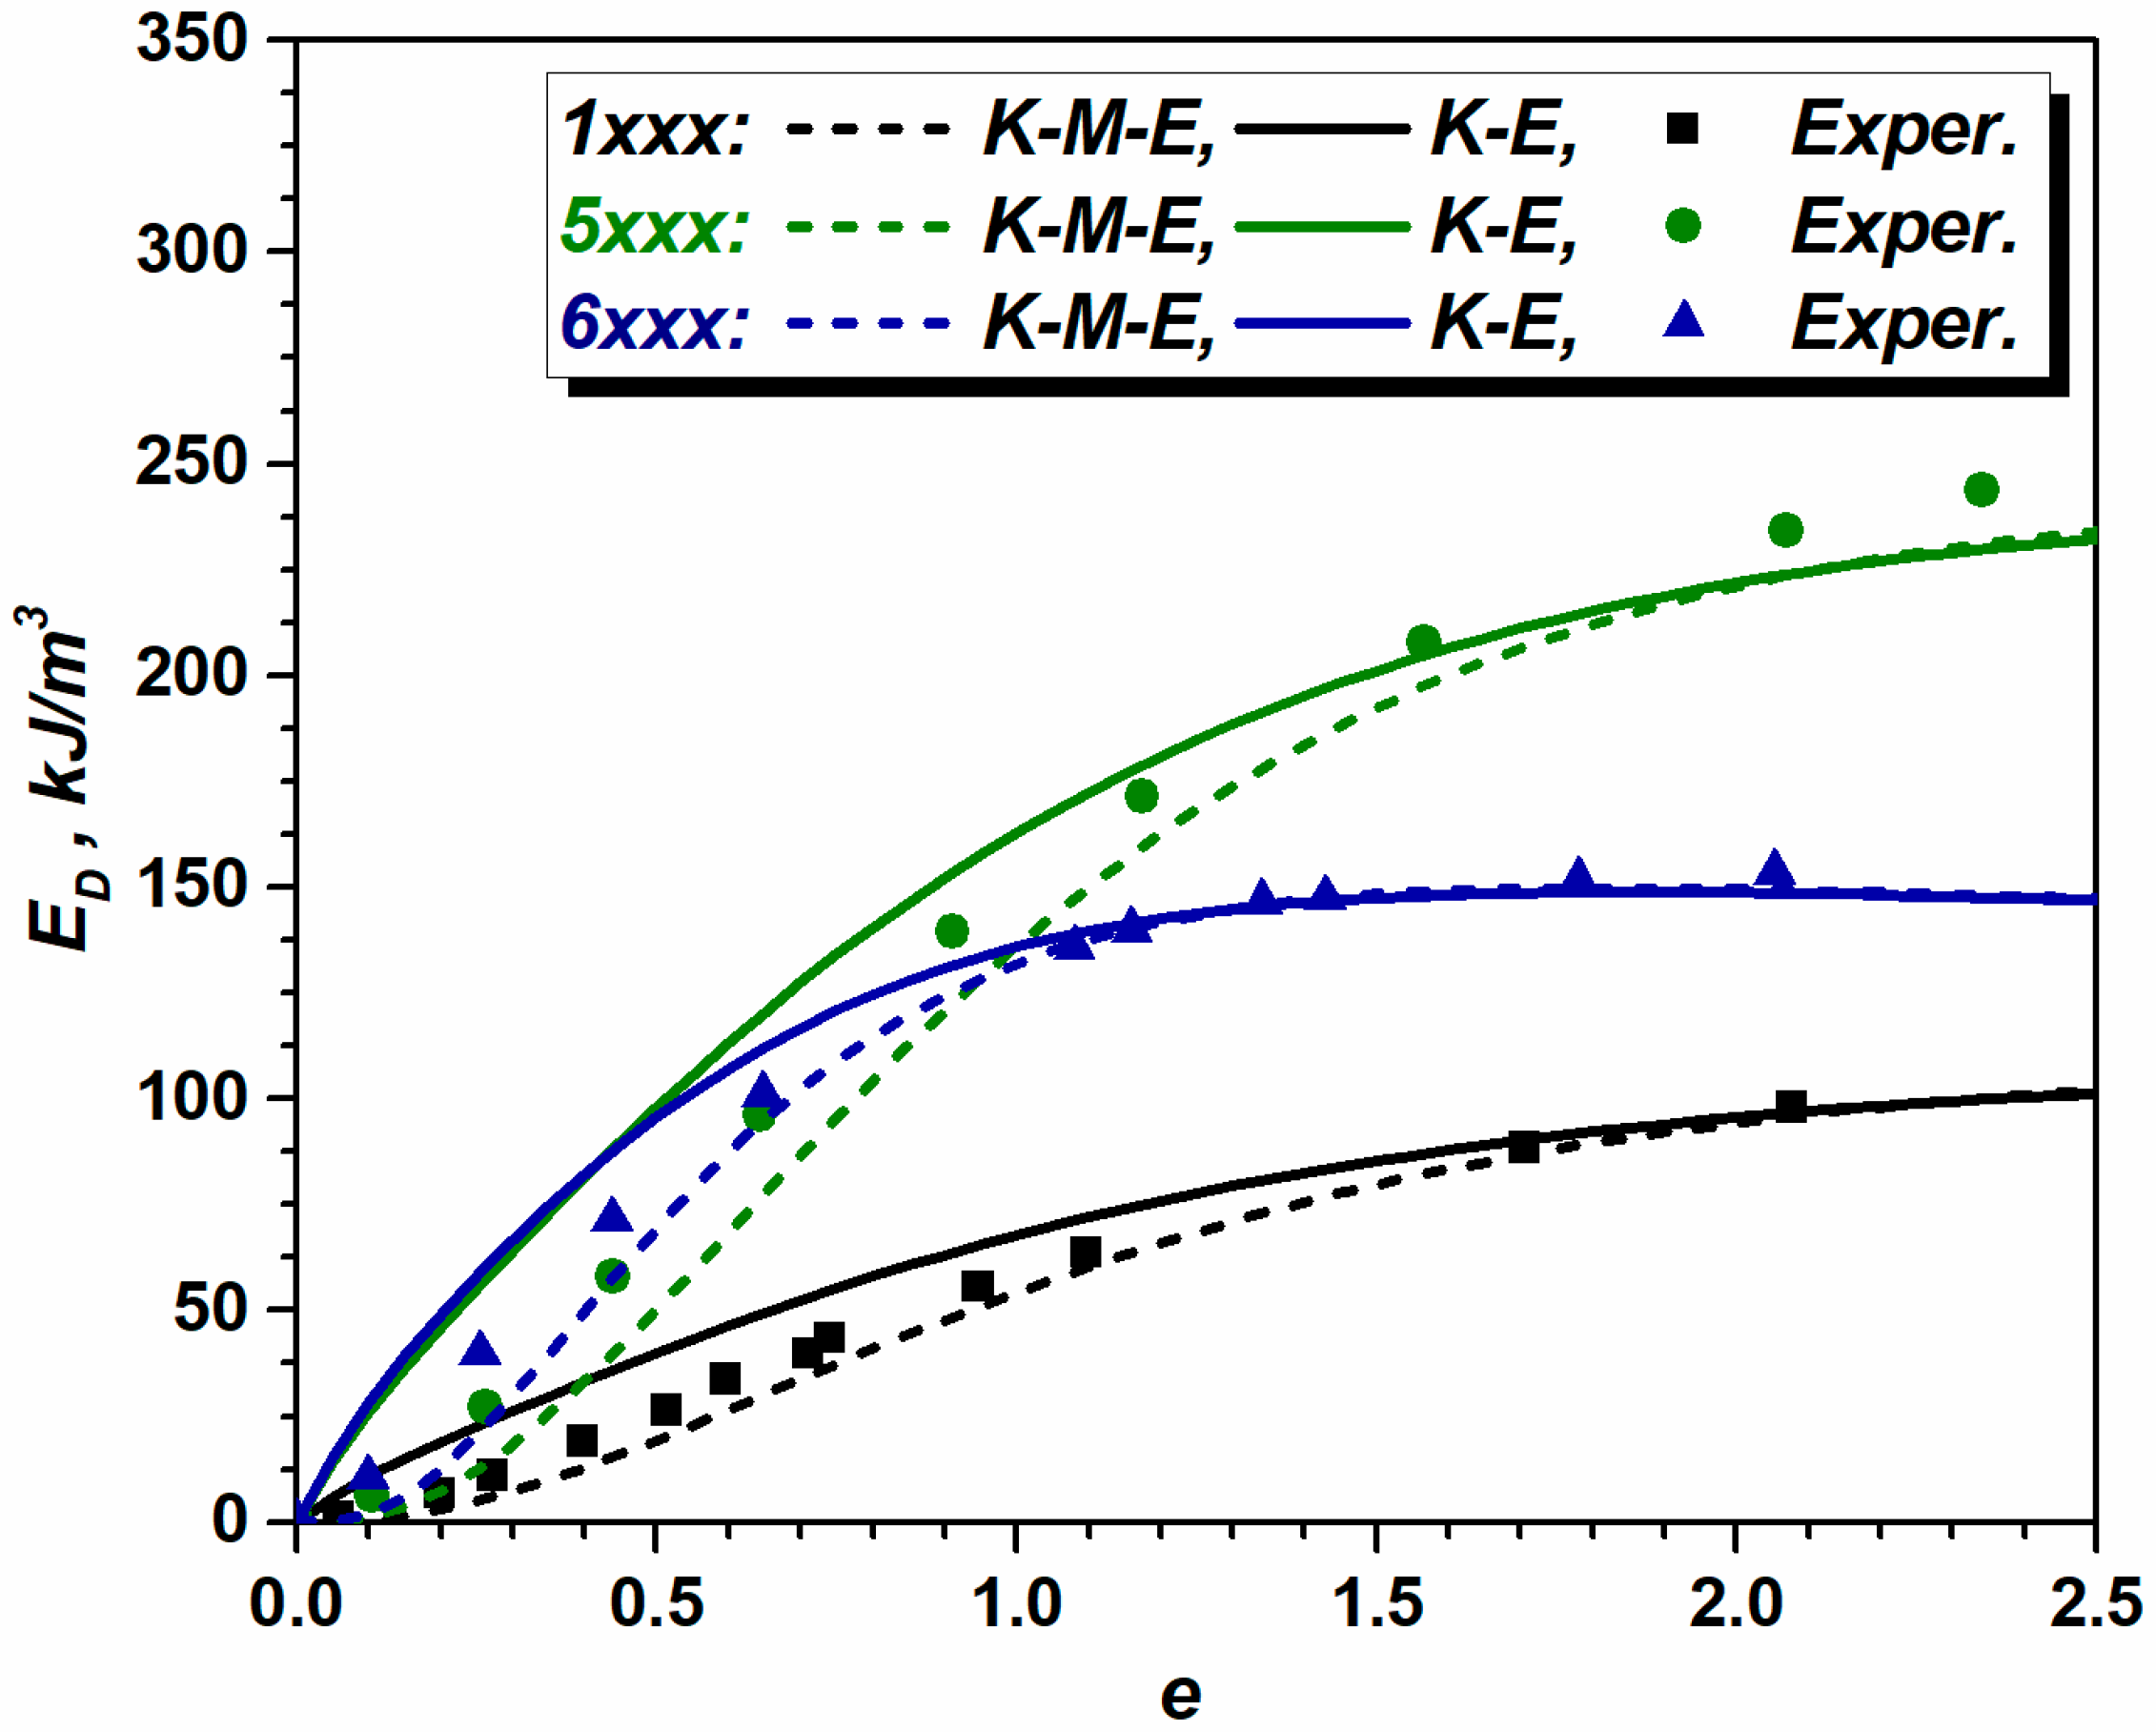
Quantifying the evolution of dislocation density during plastic deformation allows for the calculation of stored energy accumulation by employing the following equation [1]:
Estimating the ED based on dislocation density is crucial for understanding the kinetic aspects of plastic deformation in metals. By examining the evolution of dislocation density (driving force for recovery and recrystallization), one can optimize processing parameters for controlled kinetics of recrystallization and achieve desired mechanical properties. Figure 8 shows the simulated accumulation of stored energy during rolling in the investigated Al alloys. A comparison of the three curves suggests that the presence of Mg, Si, and Mn in Al alloys tends to enhance strengthening and intensifies the accumulation of dissipated plastic work. This, in turn, will ensure diverse kinetics of recrystallization in the investigated alloys.

Figure 8.
Computed accumulation of stored energy in the investigated 1xxx, 5xxx, and 6xxx alloys by employing K-E, adapted from Refs. [12,13] and K-M-E, adapted from Refs. [5,14] dislocation models and derived from the microindentation experiments.
6. Conclusions
The results of the current investigation show that microindentation measurements enable assessing the evolution of substructure during deformation. The derived normalized sizes of substructural domains (Dc/D1.5) for 1xxx, 5xxx, and 6xxx Al alloys tend to align along the curve characteristic of various metals. This finding confirms the fundamental validity of the methodology employed.
The dislocation densities (ρ) derived from microindentation experiments fall between the curves simulated by Kocks–Mecking–Estrin and Kubin–Estrin models. In a technically pure Al alloy from the 1xxx series, the corresponding model parameters fitted to the dependence of ρ on strain are comparable to those reported in the literature for pure Al. In the 5xxx and 6xxx alloys, the computed material-related coefficients qualitatively correlate with the counterparts computed for binary Al-Mg systems.
It was shown that in highly alloyed systems, the rate of dislocation generation is high, while the degree of recovery is also intensive. The corresponding model parameters governing both dislocation generation and their recovery can be defined as functions of chemical composition for binary alloys. However, in alloys consisting of multiple alloying elements, these relations are far more complex and cannot be described by simple dependencies on alloy composition.
Author Contributions
Conceptualization, J.G.B. and J.J.S.; methodology, J.G.B. and J.J.S.; validation, J.G.B. and J.J.S.; formal analysis, J.G.B. and J.J.S.; investigation, J.G.B. and J.J.S.; resources, J.G.B. and J.J.S.; data curation, J.G.B. and J.J.S.; writing—original draft preparation, J.G.B. and J.J.S.; writing—review and editing, J.G.B. and J.J.S.; visualization, J.G.B. and J.J.S.; supervision, J.J.S.; project administration, J.J.S.; funding acquisition, J.G.B. and J.J.S. All authors have read and agreed to the published version of the manuscript.
Funding
Supported by the EKÖP-24 University Excellence Scholarship Program of the Ministry for Culture and Innovation from the source of the National Research, Development and Innovation Fund. Project no. TKP2021-NVA-29 has been implemented with the support provided by the Ministry of Culture and Innovation of Hungary from the National Research, Development and Innovation Fund, financed under the TKP2021-NVA funding scheme.
Data Availability Statement
The data presented in this study are available on request from the corresponding author. The data are under further post-processing for another potential research contribution.
Conflicts of Interest
The authors declare no conflicts of interest.
References
- Humphreys, F.J. Recrystallization and Related Annealing Phenomena, 3rd ed.; Elsevier: Amsterdam, The Netherlands, 2017; ISBN 978-0-08-098235-9. [Google Scholar]
- Hansen, N. The Effect of Grain Size and Strain on the Tensile Flow Stress of Aluminium at Room Temperature. Acta Metall. 1977, 25, 863–869. [Google Scholar] [CrossRef]
- Csanádi, T.; Chinh, N.Q.; Gubicza, J.; Vörös, G.; Langdon, T.G. Characterization of Stress–Strain Relationships in Al over a Wide Range of Testing Temperatures. Int. J. Plast. 2014, 54, 178–192. [Google Scholar] [CrossRef]
- Sidor, J.J.; Bátorfi, J.G. Vickers Indentation-Based Assessment of Dislocation Density and Substructure Evolution in Aluminum Alloys. Mater. Charact. 2025, 221, 114764. [Google Scholar] [CrossRef]
- Kocks, U.F.; Mecking, H. Physics and Phenomenology of Strain Hardening: The FCC Case. Prog. Mater. Sci. 2003, 48, 171–273. [Google Scholar] [CrossRef]
- Devincre, B.; Hoc, T.; Kubin, L. Dislocation Mean Free Paths and Strain Hardening of Crystals. Science 2008, 320, 1745–1748. [Google Scholar] [CrossRef]
- Gil Sevillano, J.; Van Houtte, P.; Aernoudt, E. Large Strain Work Hardening and Textures. Prog. Mater. Sci. 1980, 25, 69–134. [Google Scholar] [CrossRef]
- Sadeghi, A.; Kozeschnik, E. Modeling the Evolution of the Dislocation Density and Yield Stress of Al over a Wide Range of Temperatures and Strain Rates. Met. Mater. Trans. A 2024, 55, 1643–1653. [Google Scholar] [CrossRef]
- Gubicza, J. X-Ray Line Profile Analysis in Materials Science; IGI Global: New York, NY, USA, 2014; ISBN 978-1-4666-5852-3. [Google Scholar]
- Gubicza, J.; Ungár, T. Characterization of Defect Structures in Nanocrystalline Materials by X-Ray Line Profile Analysis. Z. Für Krist.-Cryst. Mater. 2007, 222, 567–579. [Google Scholar] [CrossRef]
- Barlat, F. A Simple Model for Dislocation Behavior, Strain and Strain Rate Hardening Evolution in Deforming Aluminum Alloys. Int. J. Plast. 2002, 18, 919–939. [Google Scholar] [CrossRef]
- Kubin, L.P.; Estrin, Y. Evolution of Dislocation Densities and the Critical Conditions for the Portevin-Le Châtelier Effect. Acta Metall. Mater. 1990, 38, 697–708. [Google Scholar] [CrossRef]
- Csanádi, T.; Chinh, N.Q.; Gubicza, J.; Langdon, T.G. Plastic Behavior of Fcc Metals over a Wide Range of Strain: Macroscopic and Microscopic Descriptions and Their Relationship. Acta Mater. 2011, 59, 2385–2391. [Google Scholar] [CrossRef]
- Estrin, Y.; Mecking, H. A Unified Phenomenological Description of Work Hardening and Creep Based on One-Parameter Models. Acta Metall. 1984, 32, 57–70. [Google Scholar] [CrossRef]
- Kocks, U.F. Laws for Work-Hardening and Low-Temperature Creep. J. Eng. Mater. Technol. 1976, 98, 76–85. [Google Scholar] [CrossRef]
- Jeong, H.T.; Kim, W.J. Strain Hardening Behavior and Strengthening Mechanism in Mg-Rich Al–Mg Binary Alloys Subjected to Aging Treatment. Mater. Sci. Eng. A 2020, 794, 139862. [Google Scholar] [CrossRef]
- Jobba, M.; Mishra, R.K.; Niewczas, M. Flow Stress and Work-Hardening Behaviour of Al–Mg Binary Alloys. Int. J. Plast. 2015, 65, 43–60. [Google Scholar] [CrossRef]
- Lee, B.-H.; Kim, S.-H.; Park, J.-H.; Kim, H.-W.; Lee, J.-C. Role of Mg in Simultaneously Improving the Strength and Ductility of Al–Mg Alloys. Mater. Sci. Eng. A 2016, 657, 115–122. [Google Scholar] [CrossRef]
- Liu, Y.; Liu, M.; Chen, X.; Cao, Y.; Roven, H.J.; Murashkin, M.; Valiev, R.Z.; Zhou, H. Effect of Mg on Microstructure and Mechanical Properties of Al-Mg Alloys Produced by High Pressure Torsion. Scr. Mater. 2019, 159, 137–141. [Google Scholar] [CrossRef]
- Zha, M.; Meng, X.-T.; Zhang, H.-M.; Zhang, X.-H.; Jia, H.-L.; Li, Y.-J.; Zhang, J.-Y.; Wang, H.-Y.; Jiang, Q.-C. High Strength and Ductile High Solid Solution Al–Mg Alloy Processed by a Novel Hard-Plate Rolling Route. J. Alloys Compd. 2017, 728, 872–877. [Google Scholar] [CrossRef]
- Edalati, K.; Horita, Z. High-Pressure Torsion of Pure Metals: Influence of Atomic Bond Parameters and Stacking Fault Energy on Grain Size and Correlation with Hardness. Acta Mater. 2011, 59, 6831–6836. [Google Scholar] [CrossRef]
- Gubicza, J.; Kassem, M.; Ribárik, G.; Ungár, T. The Microstructure of Mechanically Alloyed Al–Mg Determined by X-Ray Diffraction Peak Profile Analysis. Mater. Sci. Eng. A 2004, 372, 115–122. [Google Scholar] [CrossRef]
- Horváth, G.; Chinh, N.Q.; Gubicza, J.; Lendvai, J. Plastic Instabilities and Dislocation Densities during Plastic Deformation in Al–Mg Alloys. Mater. Sci. Eng. A 2007, 445–446, 186–192. [Google Scholar] [CrossRef]
- Chinh, N.Q.; Csanádi, T.; Gubicza, J.; Langdon, T.G. Plastic Behavior of Face-Centered-Cubic Metals over a Wide Range of Strain. Acta Mater. 2010, 58, 5015–5021. [Google Scholar] [CrossRef]
- Balaji, V.; Kumar, S.; Krishnaswamy, H.; Digavalli, R.K.; Lee, M.G.; Barlat, F. Transient Stress Relaxation Test to Identify Material Constants in Dislocation Density Model. Met. Mater. Trans. A 2022, 53, 1969–1990. [Google Scholar] [CrossRef]
- Hansen, N.; Huang, X. Microstructure and Flow Stress of Polycrystals and Single Crystals. Acta Mater. 1998, 46, 1827–1836. [Google Scholar] [CrossRef]
- Sidor, J.J.; Chakravarty, P.; Bátorfi, J.G.; Nagy, P.; Xie, Q.; Gubicza, J. Assessment of Dislocation Density by Various Techniques in Cold Rolled 1050 Aluminum Alloy. Metals 2021, 11, 1571. [Google Scholar] [CrossRef]
- Gubicza, J.; Chinh, N.Q.; Horita, Z.; Langdon, T.G. Effect of Mg Addition on Microstructure and Mechanical Properties of Aluminum. Mater. Sci. Eng. A 2004, 387–389, 55–59. [Google Scholar] [CrossRef]
- Nix, W.D.; Gao, H. Indentation Size Effects in Crystalline Materials: A Law for Strain Gradient Plasticity. J. Mech. Phys. Solids 1998, 46, 411–425. [Google Scholar] [CrossRef]
- Wang, P.; Gao, Y.; Wang, P. A Comparative Study of Indentation Size Effect Models for Different Materials. Sci. Rep. 2024, 14, 20010. [Google Scholar] [CrossRef]
- Sahoo, S.K.; Dhinwal, S.S.; Vu, V.Q.; Toth, L.S. A New Macroscopic Strain Hardening Function Based on Microscale Crystal Plasticity and Its Application in Polycrystal Modeling. Mater. Sci. Eng. A 2021, 823, 141634. [Google Scholar] [CrossRef]
- Galanov, B.A.; Milman, Y.V.; Chugunova, S.I.; Goncharova, I.V.; Voskoboinik, I.V. Application of the Improved Inclusion Core Model of the Indentation Process for the Determination of Mechanical Properties of Materials. Crystals 2017, 7, 87. [Google Scholar] [CrossRef]
- Zhang, P.; Li, S.X.; Zhang, Z.F. General Relationship between Strength and Hardness. Mater. Sci. Eng. A 2011, 529, 62–73. [Google Scholar] [CrossRef]
- Tiryakioğlu, M. On the Relationship between Vickers Hardness and Yield Stress in Al–Zn–Mg–Cu Alloys. Mater. Sci. Eng. A 2015, 633, 17–19. [Google Scholar] [CrossRef]
- Meng, Y.; Ju, X.; Yang, X. The Measurement of the Dislocation Density Using TEM. Mater. Charact. 2021, 175, 111065. [Google Scholar] [CrossRef]
- Bay, B.; Hansen, N.; Kuhlmann-Wilsdorf, D. Deformation Structures in Lightly Rolled Pure Aluminium. Mater. Sci. Eng. A 1989, 113, 385–397. [Google Scholar] [CrossRef]
- Nes, E. Modelling of Work Hardening and Stress Saturation in FCC Metals. Prog. Mater. Sci. 1997, 41, 129–193. [Google Scholar] [CrossRef]
- Figueiredo, R.B.; Kawasaki, M.; Langdon, T.G. Seventy Years of Hall-Petch, Ninety Years of Superplasticity and a Generalized Approach to the Effect of Grain Size on Flow Stress. Prog. Mater. Sci. 2023, 137, 101131. [Google Scholar] [CrossRef]
- Hughes, D.A. Microstructural Evolution in a Non-Cell Forming Metal: Al+Mg. Acta Metall. Mater. 1993, 41, 1421–1430. [Google Scholar] [CrossRef]
- May, J.; Dinkel, M.; Amberger, D.; Höppel, H.W.; Göken, M. Mechanical Properties, Dislocation Density and Grain Structure of Ultrafine-Grained Aluminum and Aluminum-Magnesium Alloys. Met. Mater. Trans. A 2007, 38, 1941–1945. [Google Scholar] [CrossRef]
- May, J.; Höppel, H.W.; Göken, M. Strain Rate Sensitivity of Ultrafine-Grained Aluminium Processed by Severe Plastic Deformation. Scr. Mater. 2005, 53, 189–194. [Google Scholar] [CrossRef]
Disclaimer/Publisher’s Note: The statements, opinions and data contained in all publications are solely those of the individual author(s) and contributor(s) and not of MDPI and/or the editor(s). MDPI and/or the editor(s) disclaim responsibility for any injury to people or property resulting from any ideas, methods, instructions or products referred to in the content. |
© 2025 by the authors. Licensee MDPI, Basel, Switzerland. This article is an open access article distributed under the terms and conditions of the Creative Commons Attribution (CC BY) license (https://creativecommons.org/licenses/by/4.0/).