Article

CFD Modelling of Refining Behaviour in EAF: Influence of Burner Arrangement and Oxygen Flow Rates

1
Center for Innovation Through Visualization and Simulation (CIVS) and Steel Manufacturing Simulation and Visualization Consortium (SMSVC), Purdue University Northwest, Hammond, IN 46323, USA
2
EVRAZ North America, Regina, SK S4P 3C7, Canada
*
Author to whom correspondence should be addressed.
Metals 2025, 15(7), 775; https://doi.org/10.3390/met15070775
Submission received: 30 May 2025 / Revised: 2 July 2025 / Accepted: 4 July 2025 / Published: 9 July 2025

Abstract

The electric arc furnace (EAF) process includes key stages: charging scrap metal, melting using electric arcs, refining through oxygen injection and slag formation, and tapping molten steel. Recently, EAF steelmaking has become increasingly important due to its flexibility with recycled materials, lower environmental impact, and reduced investment costs. This study focuses specifically on select aspects of the refining stage, analysing decarburization and the associated exothermic oxidation reactions following the removal of carbon with oxygen injection. Particular attention is given to FeO generation during refining, as it strongly affects slag chemistry, yield losses, and overall efficiency. Using a Computational Fluid Dynamics (CFD)-based refining simulator validated with industrial data from EVRAZ North America (showing an 8.57% deviation), this study investigated the impact of oxygen injection rate and burner configuration. The results in a three-burner EAF operation showed that increasing oxygen injection by 10% improved carbon removal by 5%, but with an associated increase of FeO generation of 22%. Conversely, reducing oxygen injection by 15% raised the residual carbon content by 43% but lowered FeO by 23%. Moreover, the impact of the number of burners was analysed by simulating a second scenario with 6 burners. The results show that by increasing the number of burners from three to six, the target carbon is reached 33% faster while increasing FeO by 42.5%. Moreover, by reducing the oxygen injection in the six-burner case, it is possible to reduce FeO generation from 42.5 to 28.5% without significantly impacting carbon removal. This set of results provides guidance for burner optimization and understanding the impact of oxygen injection on refining efficiency.

1. Introduction

Steelmaking is a complex and energy-intensive process involving a series of chemical and thermal transformations to convert raw materials like scrap steel or direct reduced iron (DRI) into refined steel. Over the past few decades, the industry has increasingly shifted towards more flexible and sustainable processes, most notably the electric arc furnace (EAF). EAF-based steelmaking offers greater control over operations, facilitates scrap recycling, and generally requires less capital investment than traditional blast furnace–basic oxygen furnace (BF–BOF) methods [1]. This shift has driven extensive research into modelling, optimization, and process enhancement for EAF technology.
The EAF operates by delivering electric energy through graphite electrodes to melt scrap or other metallic inputs. It consists of several tightly integrated subsystems, including arc generation, gas injection, slag control, and post-refining operations. Given this complexity, advanced modelling techniques are necessary to simulate the coupled thermal, chemical, and fluid dynamic behaviours. Experimental studies, such as those conducted by Banks et al. [2], investigated gas jet penetration through liquid surfaces, identifying critical factors like jet momentum and surface tension. Ishikawa et al. [3] experimentally analysed the cavity depth and slopping behaviour in oxygen converter systems, linking jet characteristics directly to cavity geometry. Jones et al. [4] highlighted the role of off-gas analysis in assessing combustion completeness and energy recovery, thereby optimizing furnace efficiency. Furthermore, Mathur et al. [5] presented operational results from Praxair’s CoJetTM system, demonstrating enhanced jet penetration, deeper mixing, and reduced oxygen consumption in industrial settings.
Recent efforts have also emphasized adapting CFD models to account for operational variability. Thongjitr et al. [6] demonstrated that molten steel bath depth significantly affects oxygen jet behaviour and decarburization, highlighting the need to tailor injection strategies to bath levels.
Building upon these experimental insights, significant numerical and modelling work has been developed. Odenthal et al. [7] provided a comprehensive review of EAF modelling methods, highlighting the increasing use of computational tools to predict furnace behaviour. Real-time optimization systems, such as the Dynamic EAF Energy and Material Balance Model developed by Abraham et al. [8], are now commonly deployed in industrial settings to monitor mass flows and energy inputs for improved process stability.
A broader review of EAF modelling strategies by Abadi et al. [9] further supports modular simulation approaches like those used in this study while also identifying opportunities to integrate arc behaviour and slag–metal interactions for more complete process prediction.
Matsuura et al. [10] presented a simulation framework that couples decarburization and slag formation by modelling the oxidation of elements such as carbon, manganese, and iron. Memoli et al. [11] complemented this process by modelling how supersonic oxygen injection systems influence oxidation and carbon monoxide formation, emphasizing oxygen’s central role in refining reactions. Detailed oxidation models incorporating thermodynamics and kinetics were also developed by Wei et al. [12], providing predictive capability regarding reaction heat generation and species oxidation rates.
Coherent jet (co-jet) technology significantly enhanced refining performance by using a high-velocity oxygen stream surrounded by a shrouding flame to maintain jet coherence and the penetration depth. The original jet design patented by Anderson et al. [13] set the standard for industrial coherent jet systems. Computational Fluid Dynamics (CFD) validation by Alam et al. [14] confirmed that supersonic jets retain their momentum and coherence at steelmaking temperatures, with follow-up numerical work by Alam et al. [15] showing how inclined jetting affects flow turbulence and splashing.
Simulations by Oltmann et al. [16] addressed the dynamic balance between carbon oxidation and FeO formation, highlighting that excessive oxygen injection can lead to increased FeO formation, reducing yield and altering slag properties. They emphasized optimizing oxygen distribution for efficient decarburization. Additionally, Szekely et al. [17] modelled decarburization for stainless steel, emphasizing the importance of gas-metal mass transfer, particularly in later refining stages.
Reliable mass and energy balance models are essential for refining performance optimization. Ekmekçi et al. [18] developed a mass balance model for a Turkish EAF–ladle furnace system, enhancing control over alloy addition and input planning. Kirschen et al. [19] and Pfeifer et al. [20] conducted comprehensive numerical studies on EAF energy consumption, identifying arc efficiency, chemical energy input, and thermal losses. Additionally, Wang et al. [1] explored the use of CO2 as an alternative oxidizing agent, assessing its impact on EAF thermal and material balances and demonstrating efficiency improvements from even small process changes.
Improving refining efficiency remains an ongoing goal. Numerical studies by Sano et al. [21] and Ramírez et al. [22] demonstrated how stirring and bath flow patterns, induced by gas injection or arc behaviour, can significantly enhance heat and mass transfer. While focused on ladle refining, Björklund et al. [23] provided valuable thermodynamic insights relevant to EAF operations. His work showed that inclusions often reach equilibrium with the steel bulk before the slag phase, and that oxygen activity is largely governed by the Al/Al2O3 equilibrium after deoxidation. This highlights the importance of accurate oxygen control and inclusion behaviour for achieving high steel quality during the refining process.
While this study focuses on in-bath decarburization and FeO generation, it is important to note the broader implications of refining on slag behaviour. Sukmak et al. [24] showed that FeO content in EAF slag directly influences its potential for reuse in construction applications, underlining the importance of accurate FeO tracking in simulation.
Prior work at Purdue University Northwest has developed models and methodologies for investigating oxygen injection dynamics and refining behaviour in electric arc furnaces. These efforts include modelling coherent jet behaviour, estimating jet-induced cavity formation, and simulating in-bath decarburization reactions under various industrial conditions. Tang et al. [25] investigated the potential core length of coherent jets in EAF environments, demonstrating jet coherence up to 50 nozzle diameters, supporting their suitability for deep bath penetration. Chen et al. [26] developed a fully integrated 3D CFD model coupling coherent jet penetration with decarburization kinetics, creating a unified simulation framework to study interactions between jet-induced flow fields and chemical reactions in the bath. More recently, Ugarte et al. [27] presented a cold-flow study of the EAF refining stage, analysing the impact of injection rates on bath flow development.
Building upon these previous efforts, the current study specifically evaluates the impact of oxygen injection and burner configuration—particularly the number and spatial distribution of co-jet burners—on refining efficiency in industrial-scale EAF operations. Refining performance is assessed by comparing decarburization times, FeO generation, and oxygen utilization efficiency under different burner setups and injection rates. The goal is to identify optimal burner configurations that maximize refining speed and carbon removal while minimizing unwanted iron oxide generation, thereby enhancing overall process efficiency and steel yield in electric arc furnace operations.

2. Methodology

2.1. Description of Refining Simulator

The refining simulator computes the lower half of the electric arc furnace (Figure 1) and only includes the molten steel bath, excluding the slag layer to focus solely on in-bath reactions. To efficiently capture the essential physics of the EAF refining process while minimizing computational cost, the simulation approach is structured into three main components: the co-jet model, cavity estimation, and the in-bath oxidation model.
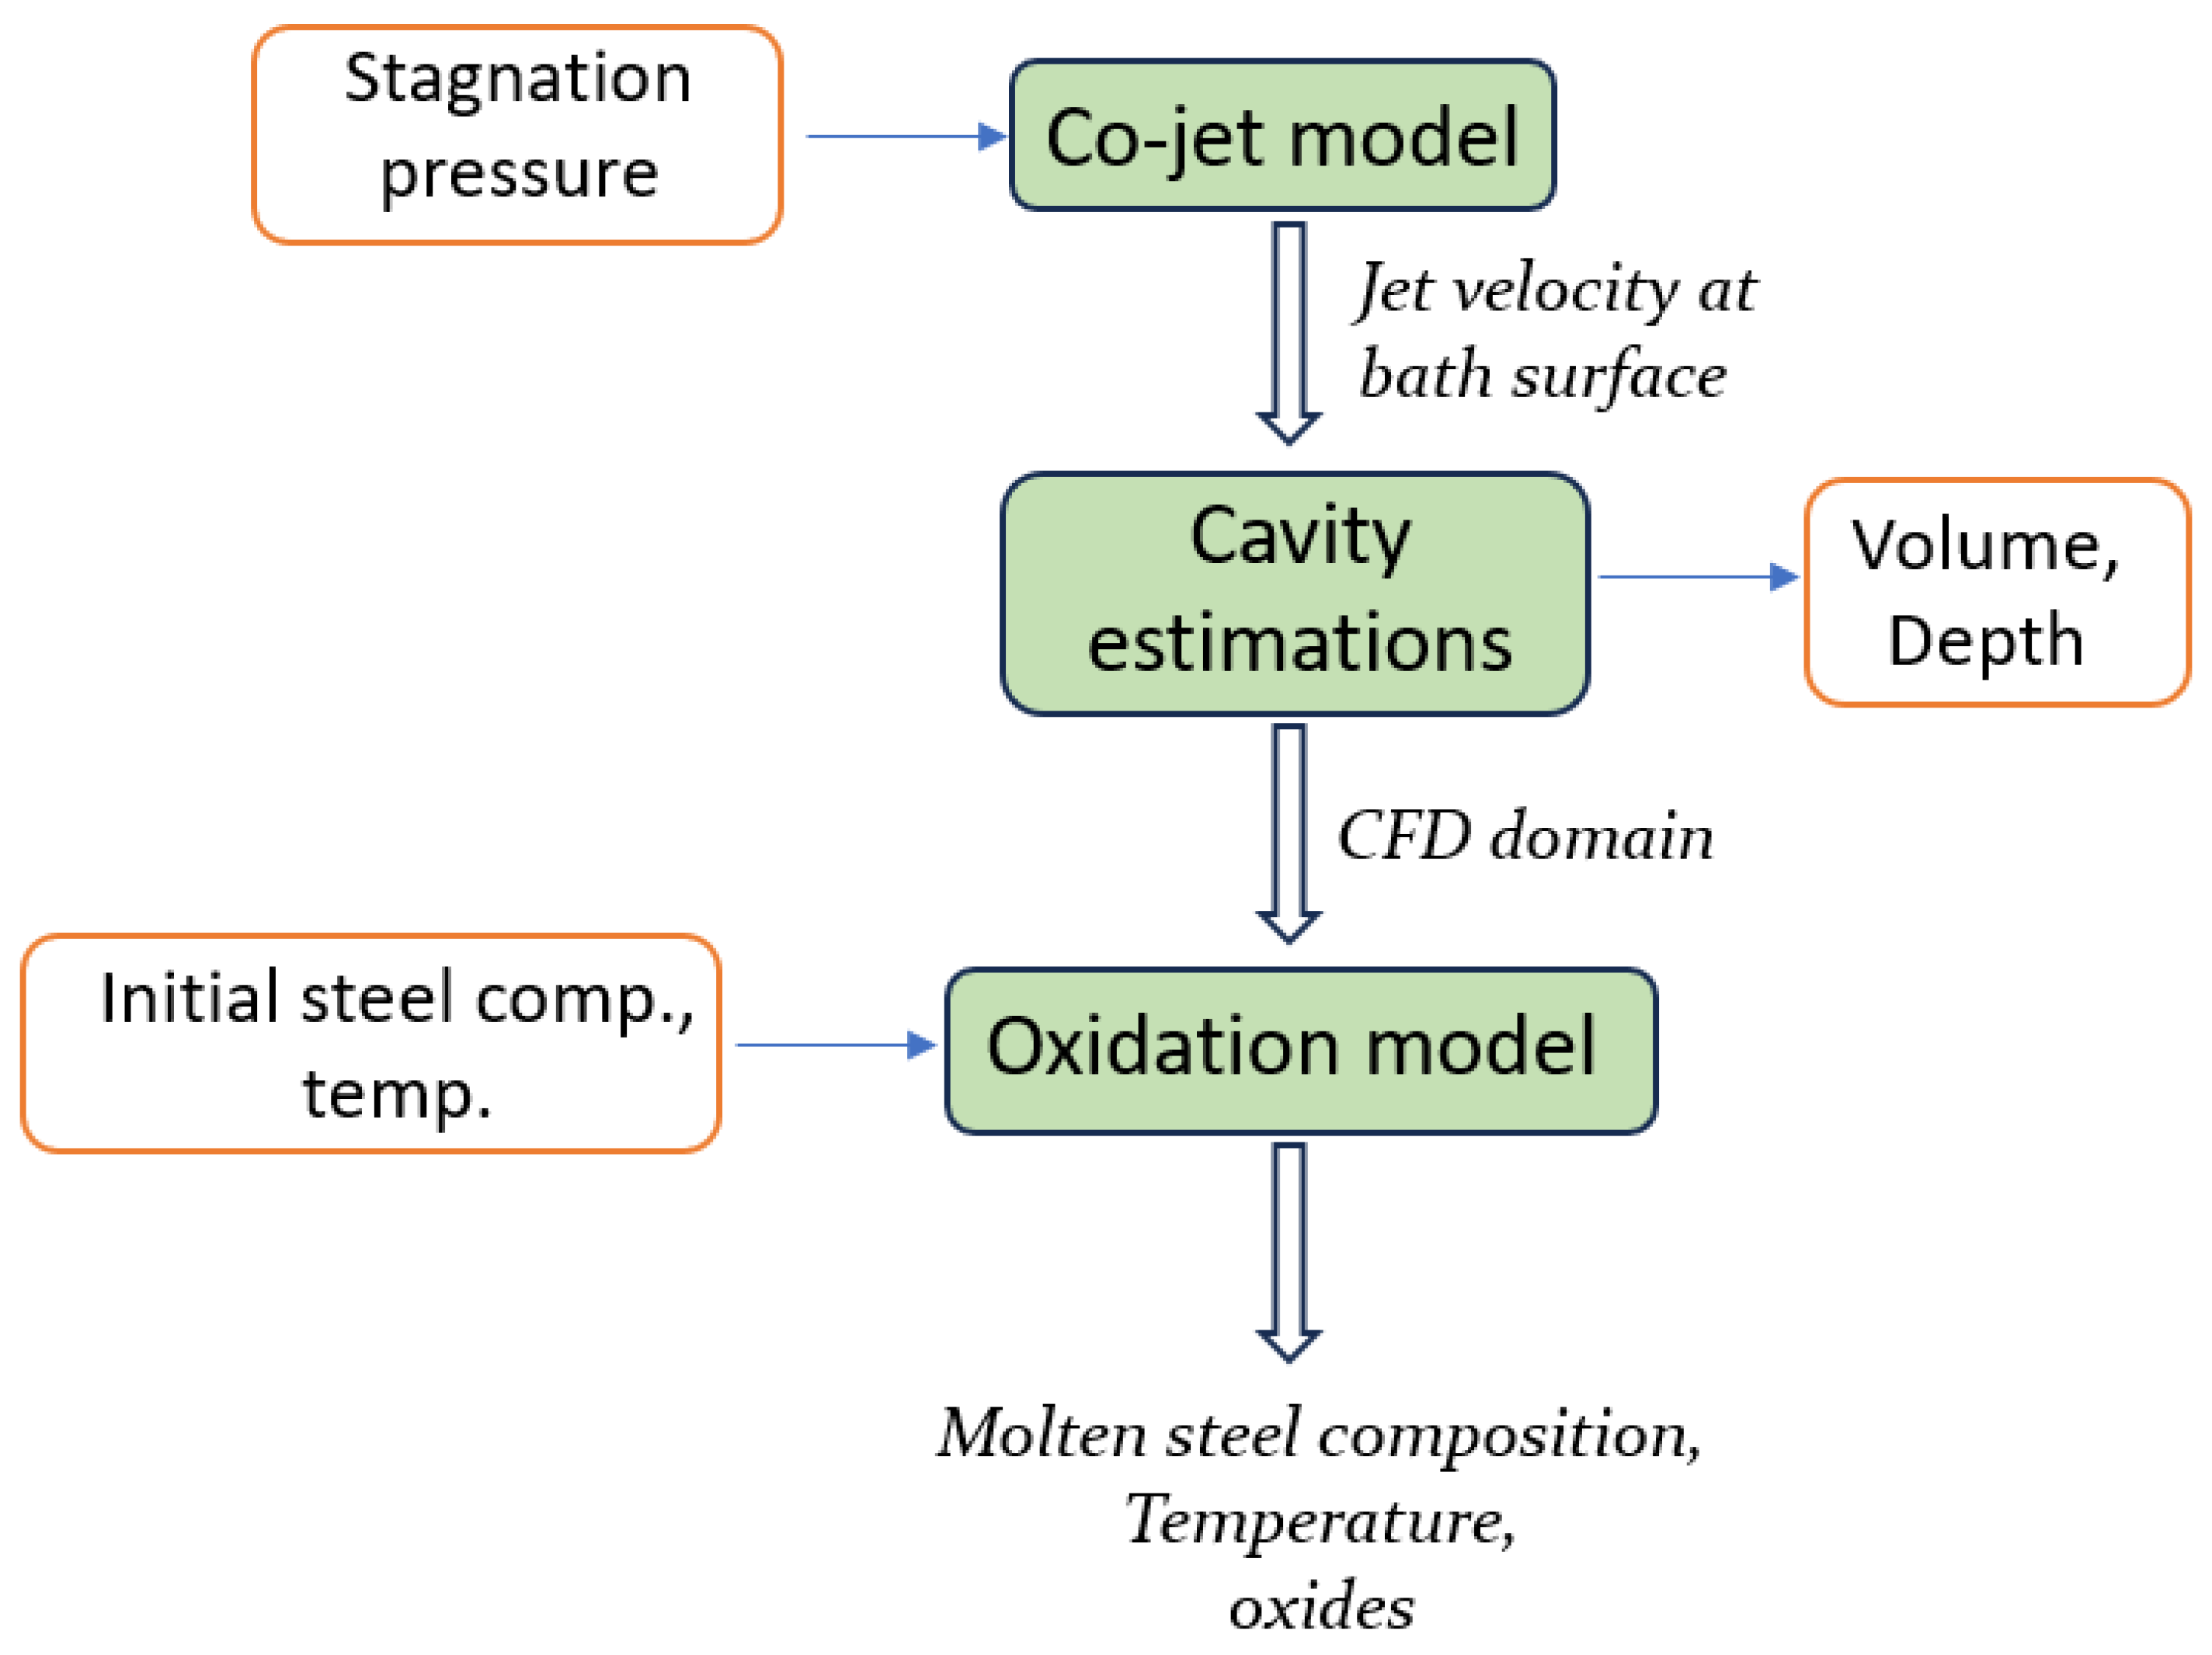
This decoupled strategy (Figure 2) enables the modelling of high-speed oxygen delivery to the liquid bath from the jet and complex chemical reactions without the need for a fully integrated simulation of compressible flow jet impingement on the free liquid surface, which would be significantly more computationally intensive.
The refining simulations include three steps. Firstly, the co-jet model performs a steady-state simulation of supersonic coherent oxygen jets operating in lance mode using ANSYS® Fluent 22.1. These jets, with Mach numbers ranging from 2.0 to 2.4, deliver high-momentum oxygen to the steel bath (Figure 3A). Isentropic flow equations are applied to determine pressure inlet boundary conditions for co-jet simulations to obtain oxygen flow parameters. Following, an estimation of the cavity caused by the jet impact on the molten steel surface, as shown in Figure 3B, is made using empirical relations. The high-speed jets displace the liquid, forming cavities approximated as 3D paraboloid shapes. These cavities are introduced into the CFD domain as part of the physical boundary and serve as the oxygen injection points. This approach transfers most of the jet’s momentum into the cavity structure, reducing flow velocities in the system and lowering the computational cost of the subsequent simulation. Finally, after defining the gas-generated cavities in the CFD domain, an in-bath oxidation model is employed to compute exothermic oxidations reactions and flow characteristics in the liquid bath (Figure 3C). The following sections discuss each of these three modelling stages in detail.

2.1.1. Coherent Jet Model

The first stage of the refining simulator involves modelling the behaviour of the coherent oxygen jets that play a critical role in EAF steel refining. These supersonic jets inject high-momentum oxygen directly into the molten steel, promoting deep penetration and strong mixing, which are essential for effective decarburization and oxidation reactions. Jet modelling is performed under steady-state conditions using ANSYS® Fluent 22.1, where the jets are treated as compressible, non-isothermal flows. A modified k–ε turbulence model is employed to enhance the accuracy of jet behaviour prediction, particularly in capturing the potential core length and velocity profiles of the high-speed stream.
To describe the oxygen jet exit properties, the model uses isentropic flow equations suitable for compressible flow through convergent–divergent (C-D) nozzles. Based on industrial parameters, the following relation [28] is applied:
P P t = 1 + k 1 2 M 2 k k 1
where Pt and P are the stagnation and static exit pressures of the convergent–divergent nozzle, respectively; M is the C-D nozzle exit Mach number; and k is the specific heat ratio, which is typically 1.4 for oxygen. In this study, the exit Mach number is maintained in the range of 2.0 to 2.4, aligning with typical industrial burner conditions ensuring sufficient jet penetration and energy transfer.
According to Anderson et al. [13], coherent jets retain up to 95% of their initial velocity and momentum for distances up to 50 times the nozzle diameter. In the EVRAZ NA furnace, this stand-off distance is approximately 30 nozzle diameters, which lies well within the stable core region.

2.1.2. Estimation of Cavity Surfaces

In this study, cavity characteristics such as their volume and penetration depth were calculated based on empirical correlations that capture the influence of jet dynamics and bath properties. Accurate estimation of these features is critical, as they define both the oxygen injection interfaces and significantly impact the bath flow behaviour during refining.
The cavity volume V and penetration depth D are determined using empirical relationships developed by Banks et al. [2] and Ishikawa et al. [3]. These correlations incorporate parameters, including the gas jet density ρ j , molten steel density ρ s , jet velocity v j , nozzle exit diameter d j , stand-off distance between nozzle and bath surface L, jet inclination angle θ, and oxygen volumetric flow rate V ˙ . For the present case, a single nozzle per cavity is assumed n = 1. The equations employed are
V = π ρ j v j 2 d j 2 4 g ρ s
D = γ h 0 e σ 1 L γ h 0 c o s θ
γ h 0 = σ 2 V ˙ n d 3
where σ 1 = 1.77 and σ 2 = 1.67 are empirical constants obtained from experimental observations.
Once the cavity dimensions are estimated, the surface profile is approximated using a paraboloid of revolution, which is described by
z = x 2 + y 2 c
The parameter c is computed from the previously determined cavity volume and depth from Equations (2) and (3), ensuring that the modeled cavity shape realistically reflects the physical deformation produced by jet impingement.
The modeled cavities are then used as oxygen injection boundaries within the CFD domain. Along these surfaces, oxygen is introduced into the bath, and a momentum source term is applied to account for the flow stirring induced by the supersonic jets.
The average mass flow rate of injected oxygen and the corresponding momentum transfer are defined using the following relations:
m O 2 , a v g = 1 z z 2 z 1 m O 2 z d z
P s , a v g = α ρ O 2 v O 2 2 A = α ρ O 2 A ρ s 1 z   z 2 z 1 v O 2 z d z 2
Here, α is the transferable percentage of the jet total momentum at a liquid steel bath, which is 0.06 [21]; v O 2 is the average jet velocity along the cavity centerline; A is the cavity surface area; z , which is z1 − z2, is the axial length of the cavity along the jet direction; ρ O 2 is the oxygen gas density.

2.1.3. In-Bath Oxidation Model

The in-bath refining reactions were simulated using the transient CFD approach [26] based on the Reynolds-Averaged Navier–Stokes (RANS) solver within ANSYS® Fluent 22.1, utilizing the k–ε turbulence model and an in-house implementation of the Gibbs free energy model to simultaneously resolve fluid flow and chemical reactions in the molten steel bath. The governing equations consist of the continuity equation for mass conservation, momentum equation, and the energy equation, which accounts for heat transfer—including contributions from exothermic oxidation reactions caused by oxygen injection. The key governing equations follow.
The continuity equation:
· ρ v = 0
where ρ and v are the density and velocity vector, respectively.
The momentum equation:
· ρ v v = p + · τ = + ρ g + F
where p , τ = , g , and F are pressure, stress tensor, gravity acceleration, and external body forces, respectively.
The energy equation:
· v ρ E + p = · k + c p · μ t P r t T j h j J j + τ = e f f   ·   v + S h
where E , k , c p , and μ t are total energy, thermal conductivity, specific heat, and turbulent viscosity, respectively. The turbulent Prandtl number P r t is 0.85, J j is the diffusion flux, and S h is the heat source.
The oxidation reactions considered in the simulation are
F e + 1 2 O 2 g = F e O
M n + 1 2 O 2 g = M n O
C + 1 2 O 2 g = C O g
These reactions are highly exothermic, and their heat release contributes to the source term S h in the energy equation, leading to bath stirring and a rise in temperature during refining.
The carbon content in the molten steel bath significantly affects which reactions are dominant. When the carbon mass fraction is greater than 0.3%, oxygen tends to react primarily with carbon, iron, and manganese to form CO, FeO, and MnO, respectively. Additionally, at this stage, an extra reduction reaction occurs:
F e O +   C = F e + C O g
This reduction reaction becomes prominent at high carbon levels because of its favorable thermodynamics, leading to FeO consumption and CO gas generation. In this oxygen-limited regime, the decarburization rate is dominated by the supply of oxygen, which is calculated through Gibbs free energy relations given by
W s 100   M c   d % C d t = 2 n c Q o 2 22400   x c
where WS represents the mass of liquid steel, MC is the molar mass of carbon, and [%C] indicates the mass percent concentration of carbon in the molten steel. Additionally, Q o 2 denotes the supplied oxygen flow rate; n c is the efficiency factor of carbon, which is a function of total mixing of the system; and xC is the distribution ratio of oxygen for carbon in liquid steel.
As the carbon content decreases and falls below the 0.3% threshold, oxygen supply is no longer the limiting factor for decarburization. Instead, the rate becomes controlled by the mass transfer of carbon within the liquid steel, which is represented by
W m d % C d t = ρ m k c A i n t e r % C % C e
k c = 0.59 D C · u r e l / d B 0.5
where kc is the carbon mass transfer coefficient through the bubble surface, Ainter denotes the bubble inter-surface area, [%C] represents the carbon mass concentration in the molten bath, DC signifies the diffusion coefficient of carbon, u r e l is the relative velocity of the liquid steel, and dB is the bubble diameter.
This two-stage model, where decarburization is limited by oxygen at high carbon levels and by carbon transfer at low carbon levels, helps accurately represent how the refining process changes during different phases of EAF operation.
To accurately simulate the material transformations within the bath, a user-defined function (UDF) is implemented to dynamically track mass changes during oxidation reactions. As carbon, iron, and manganese react with injected oxygen, the UDF computes the corresponding mass of oxides (CO, FeO, and MnO) generated at each time step, ensuring mass conservation. The mass of the consumed species is removed from the bath, while the mass of the oxides is added and tracked within each computational cell. Once these oxides reach the bath’s free surface—representing the slag interface—they are removed from the domain to simulate their transfer to the slag phase. The total FeO generation reported at each time step is obtained by summing the instantaneous oxide mass across all cells in the domain. This approach enables a detailed and time-resolved assessment of refining progress and oxidation product formation.

2.2. Computational Domain of Refining Simulator

The oxidation model is employed to simulate oxygen–steel interactions and the resulting chemical reactions in the liquid bath. This stage in the current study accounts for three reacting species—iron (Fe), manganese (Mn), and carbon (C)—and tracks the formation of oxidation products such as CO gas, FeO, and MnO over time. This allows evaluation of the decarburization process and oxide generation during refining.
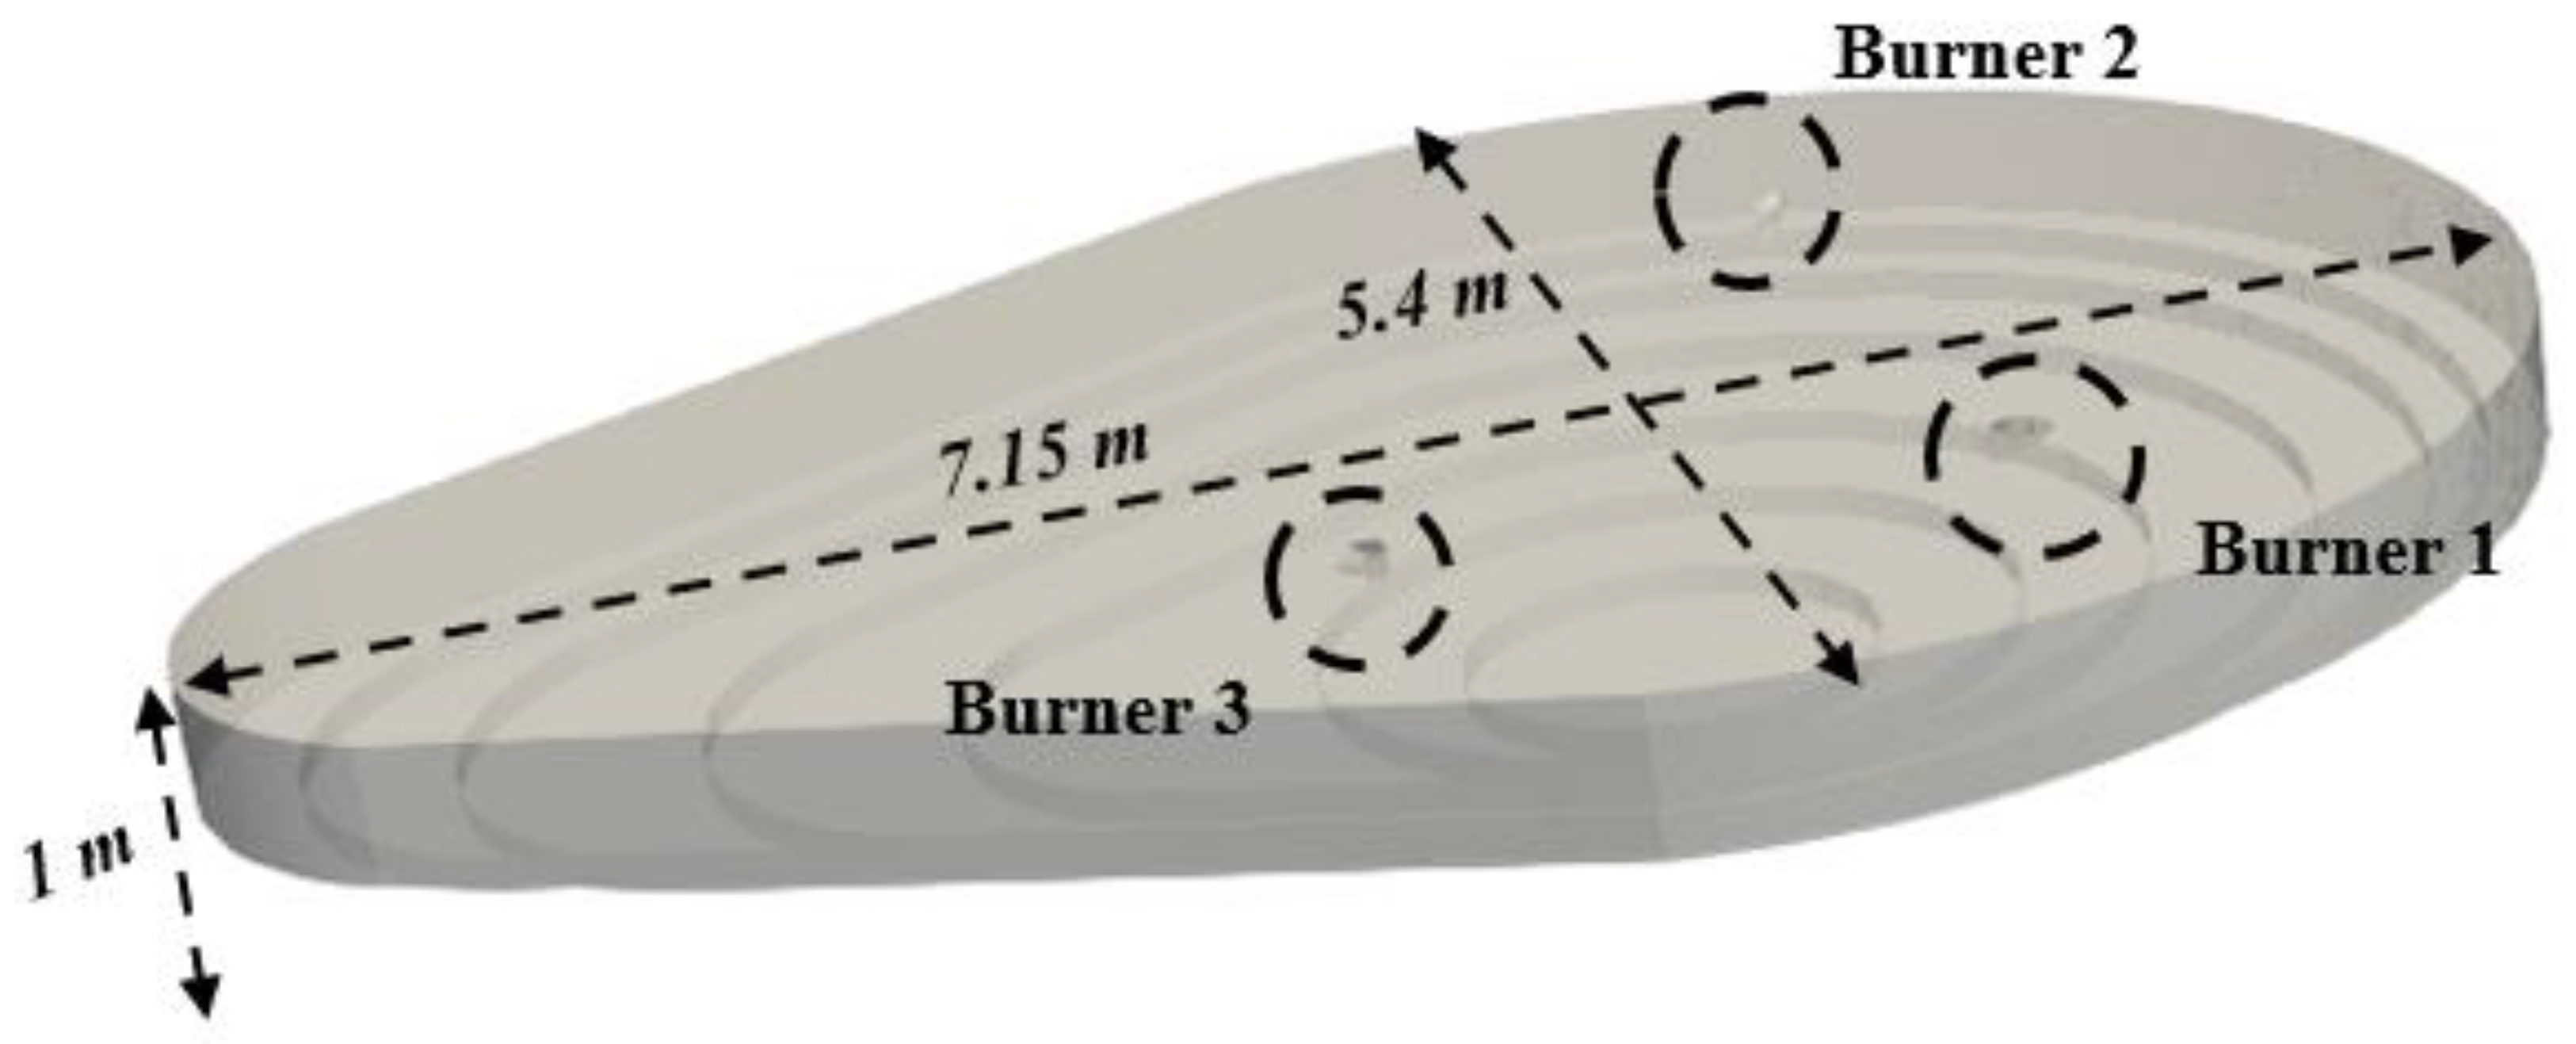
The CFD domain used in this study represents the lower half of EVRAZ NA’s Electric Arc Furnace (EAF), focusing solely on the molten steel bath and deliberately excluding the slag layer. As illustrated in Figure 4, the domain geometry closely reflects the actual furnace and contains approximately 140 tons of liquid steel.
It is acknowledged that excluding the slag layer is a simplification, especially considering that slag can influence convective heat losses from the molten bath. However, the primary focus of this study is on decarburization and FeO generation—processes largely driven by mixing and the availability of oxygen, rather than temperature changes. This is consistent with the decarburization rate Equation (15) used in the simulation, which depends explicitly on oxygen input and does not include temperature as a parameter. While temperature may affect steel and slag properties, its role in the specific oxidation reactions considered here is secondary. As such, the omission of slag and its associated thermal effects is not expected to significantly alter the key findings of this study.
The domain geometry, as shown in Figure 4, closely reflects actual furnace dimensions, containing approximately 140 tons of liquid steel. It measures 1.0 m in height, 7.15 m in top length, and 5.4 m in width. It also includes three impingement cavities incorporated into the surface of the bath, corresponding to the coherent jet impingement zones.
The domain mesh consists of 263,525 cells, generated using tetrahedral elements in ANSYS Mesher, within which the refining reactions and flow characteristics in the liquid bath are resolved. A grid sensitivity analysis was previously conducted in a related cold-flow study by Ugarte et al. [27], demonstrating the adequacy of the mesh resolution employed in this work. The top boundary of the simulation domain is defined as an outlet, allowing gaseous reaction products—such as CO and any unreacted oxygen—to escape freely. Additionally, oxides formed during refining, notably FeO and MnO, escape through this boundary, reflecting the open-surface conditions typical of industrial EAF refining. Although the slag phase is not explicitly modelled in this simulation, the continuous removal of these oxides at the top boundary effectively mimics the slag’s role in absorbing and carrying away oxidation products from the molten steel. This approach simplifies the simulation domain while preserving the critical influence that slag has on refining dynamics. Table 1 shows the boundary conditions of the domain.

3. Validation

The validation process for the refining simulator was carried out in two distinct stages. Initially, the co-jet model was verified by comparing CFD simulation outcomes with theoretical predictions obtained from isentropic flow calculations. Subsequently, the accuracy of the in-bath refining model was validated using industrial trial data provided by EVRAZ NA.

3.1. Validation of Co-Jet Model

The co-jet model setup—including boundary conditions, the simulation scheme, and meshing approach—is detailed in the previous work by Tang et al. [25]. This study does not simulate the internal nozzle design; instead, it applies nozzle exit conditions derived from theoretical calculations and industrial parameters, focusing on the jet’s downstream behaviour after exiting the nozzle. The co-jet model is then validated by comparing the CFD results with values calculated from one-dimensional isentropic-flow equations. In the simulation, the primary oxygen stream enters through a pressure inlet that imposes a Mach number of 2.4 at the nozzle exit. Under these conditions, as shown in Table 2, the isentropic equations (Equation (1)) yield a theoretical exit velocity of 521.2 m s−1 and a corresponding volumetric flow rate of 1288 SCFM (0.6078 m3/s) for the specified coherent jet.
The CFD simulations use pressure inlet boundary conditions for the primary oxygen inlet. Simulated velocity results were considered at 30 nozzle diameters downstream, which matches the stand-off distance between the nozzle exit and the liquid surface in the EVRAZ furnace. CFD solutions predict an exit velocity of 513.73 m s−1 and a flow rate of 1260 SCFM (0.5946 m3/s). These results differ from the theoretical calculations by only 1.45% in velocity and 2.2% in oxygen injection.
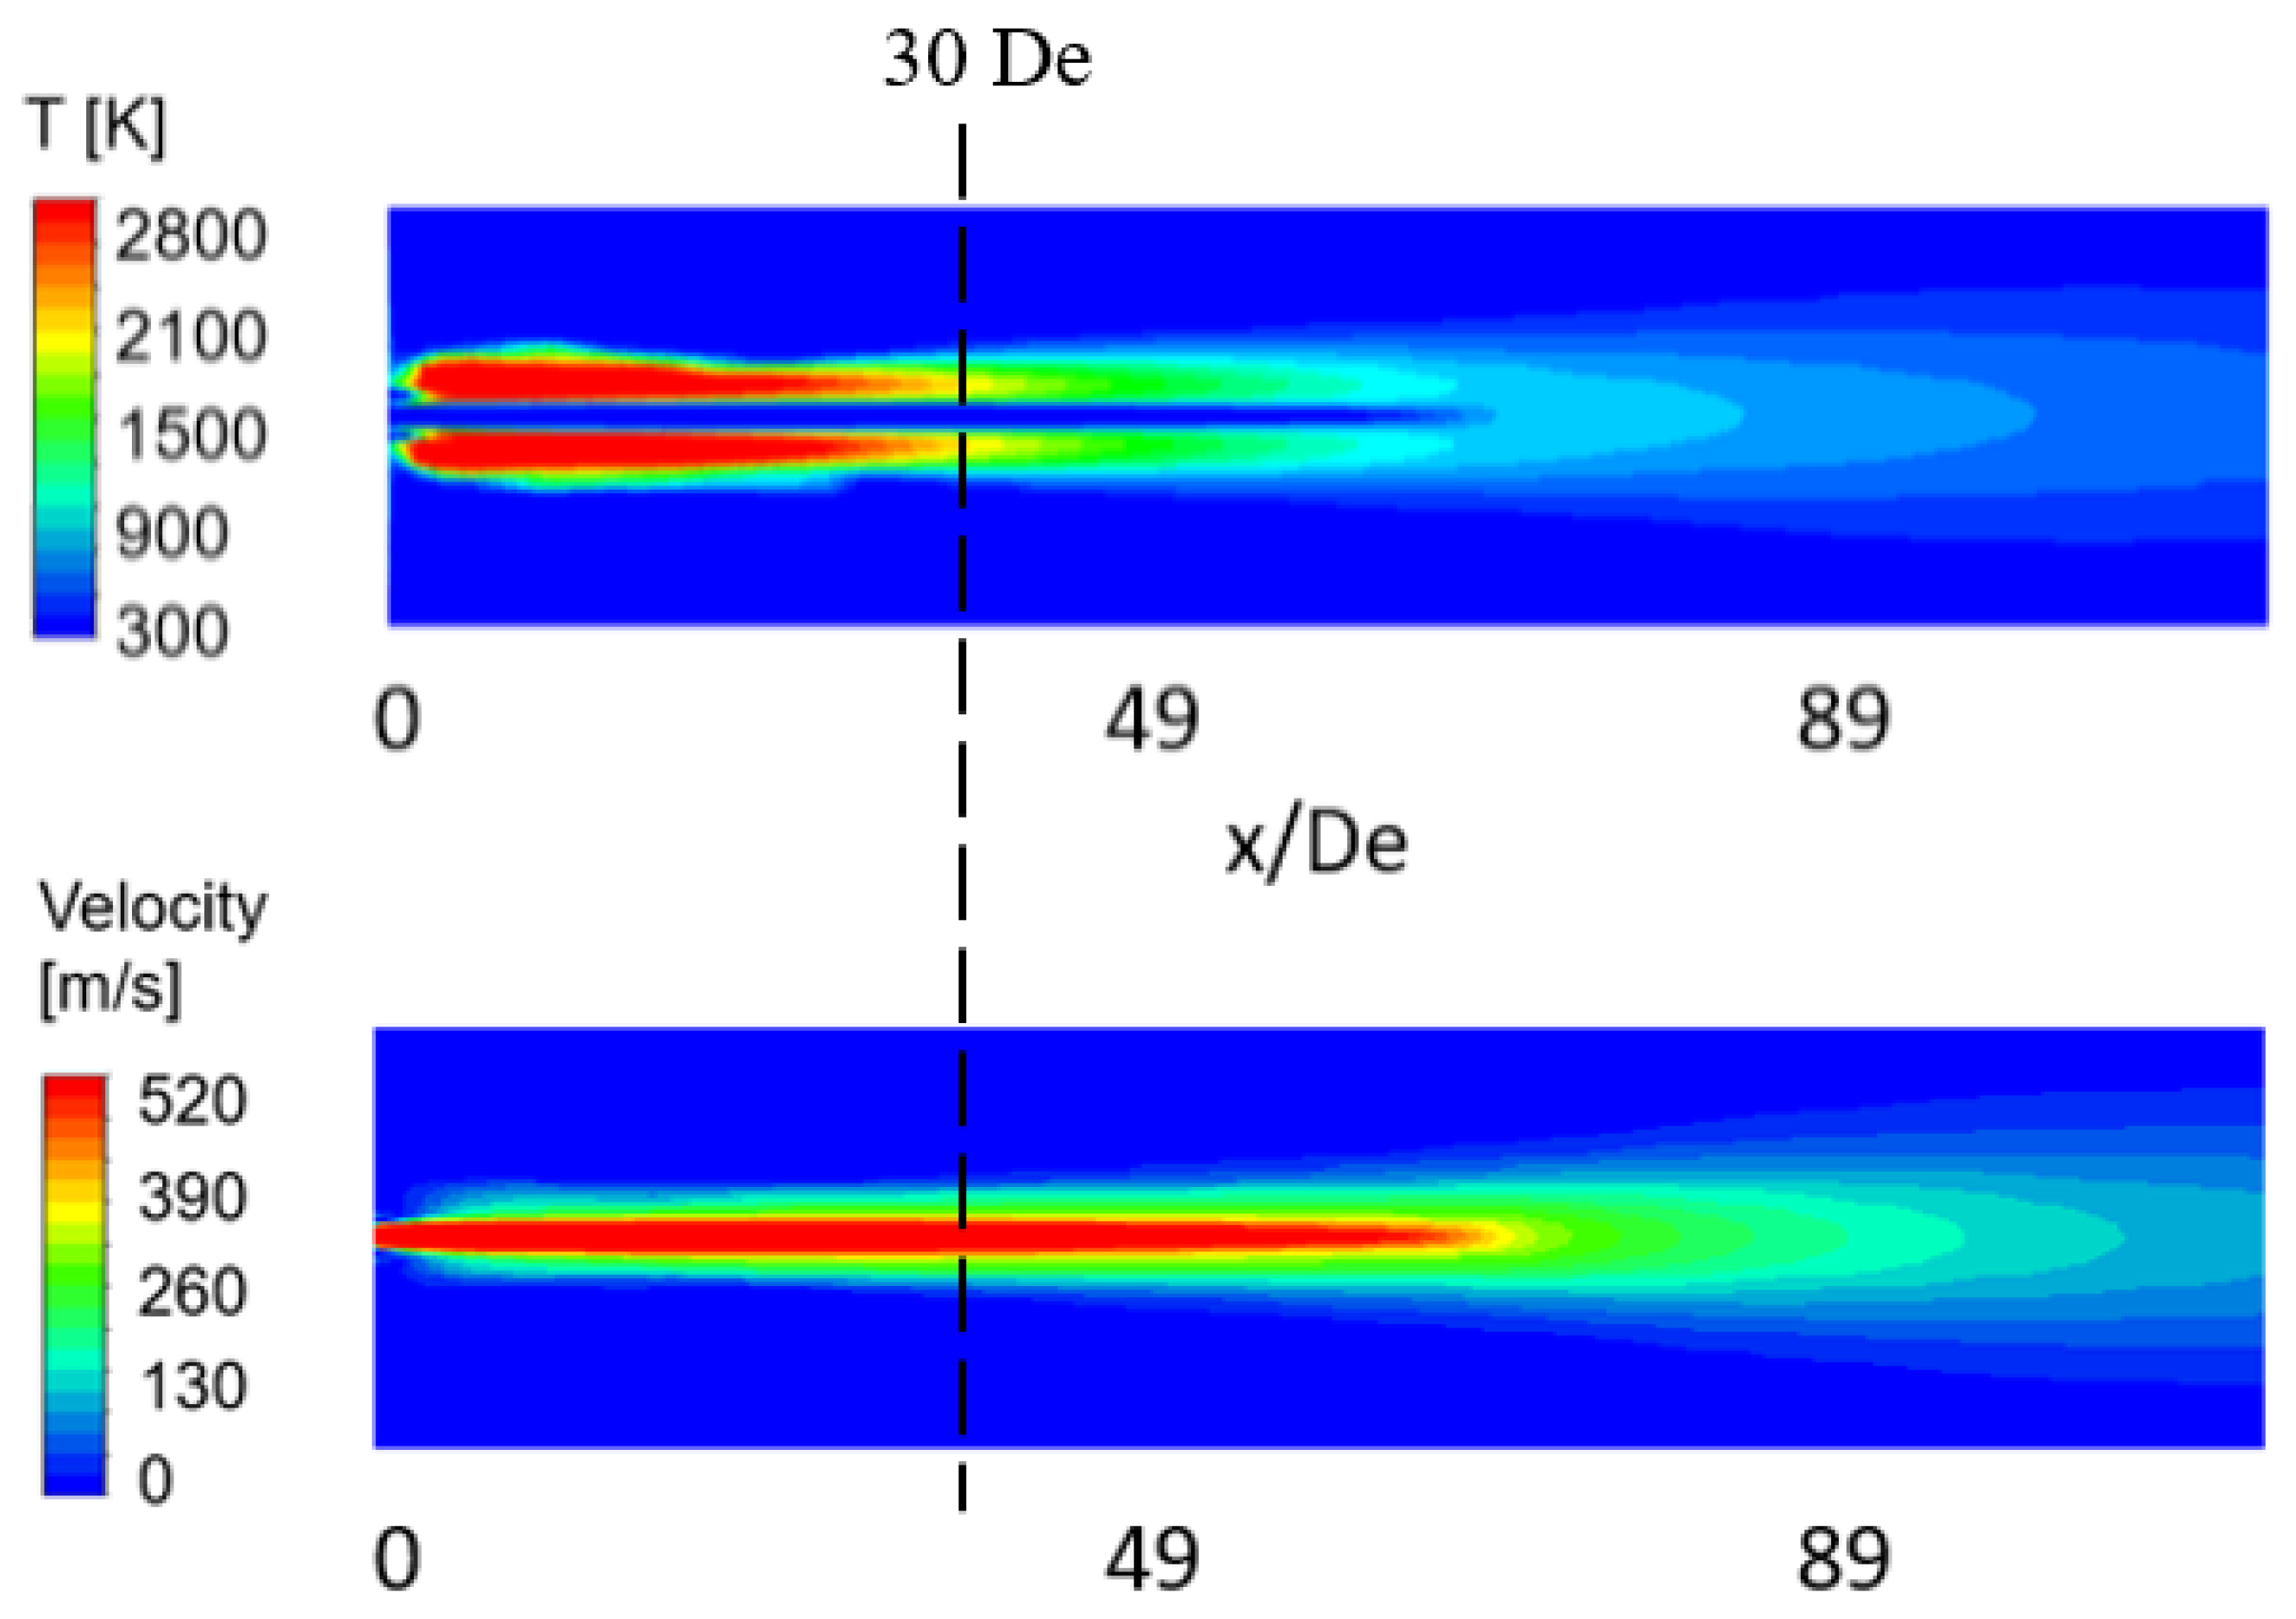
Figure 5 demonstrates that the jet remains coherent, preserving a high centerline velocity and temperature up to approximately 50 nozzle diameters downstream, well beyond the 30 De stand-off distance in the actual furnace. Evaluating jet conditions specifically at 30 De ensures the jet maintains sufficient momentum when it reaches the molten steel bath, thus supporting effective refining operations.

3.2. Validation of In-Bath Refining Model

The oxygen injection rates play a critical role in maintaining supersonic flow conditions and generating high levels of stirring within the EAF. To achieve optimal jet penetration and mixing efficiency, oxygen is supplied through three burners, with Burner 1 operating at 1150 SCFM (0.6078 m3/s), Burner 2 at 930 SCFM (0.4389 m3/s), and Burner 3 at 1210 SCFM (0.5427 m3/s). These flow rates are carefully calibrated to ensure that the oxygen jets achieve supersonic velocities, maintaining Mach numbers between 2.0 and 2.4.
The EVRAZ NA trial parameters (Table 3) reflect typical operational conditions for refining. The steel liquid temperature at this stage is maintained at 1838 K (1565 °C). Additionally, the initial carbon content in the molten steel is 0.065%, which is lower than typical EAF operations. In conventional EAF refining, higher carbon levels, usually around 0.4%, are present at this stage.
The EVRAZ NA trial was conducted without arcing (electrical heat input) or carbon injection (carburization) to isolate and evaluate the impact of oxygen injection on the refining process. To obtain representative data for analysis, steel samples were collected near the slag door, ensuring accurate insight into the composition changes occurring during refining. The trial lasted for 134 s, during which extensive measurements were taken to capture the dynamic behaviour of impurity removal, FeO formation, and overall bath conditions. These industrial operating conditions were then reproduced in CFD simulations, allowing for a direct comparison between experimental data and model predictions. This validation process ensures that the CFD model can accurately replicate key aspects of an industrial-scale refining operations.
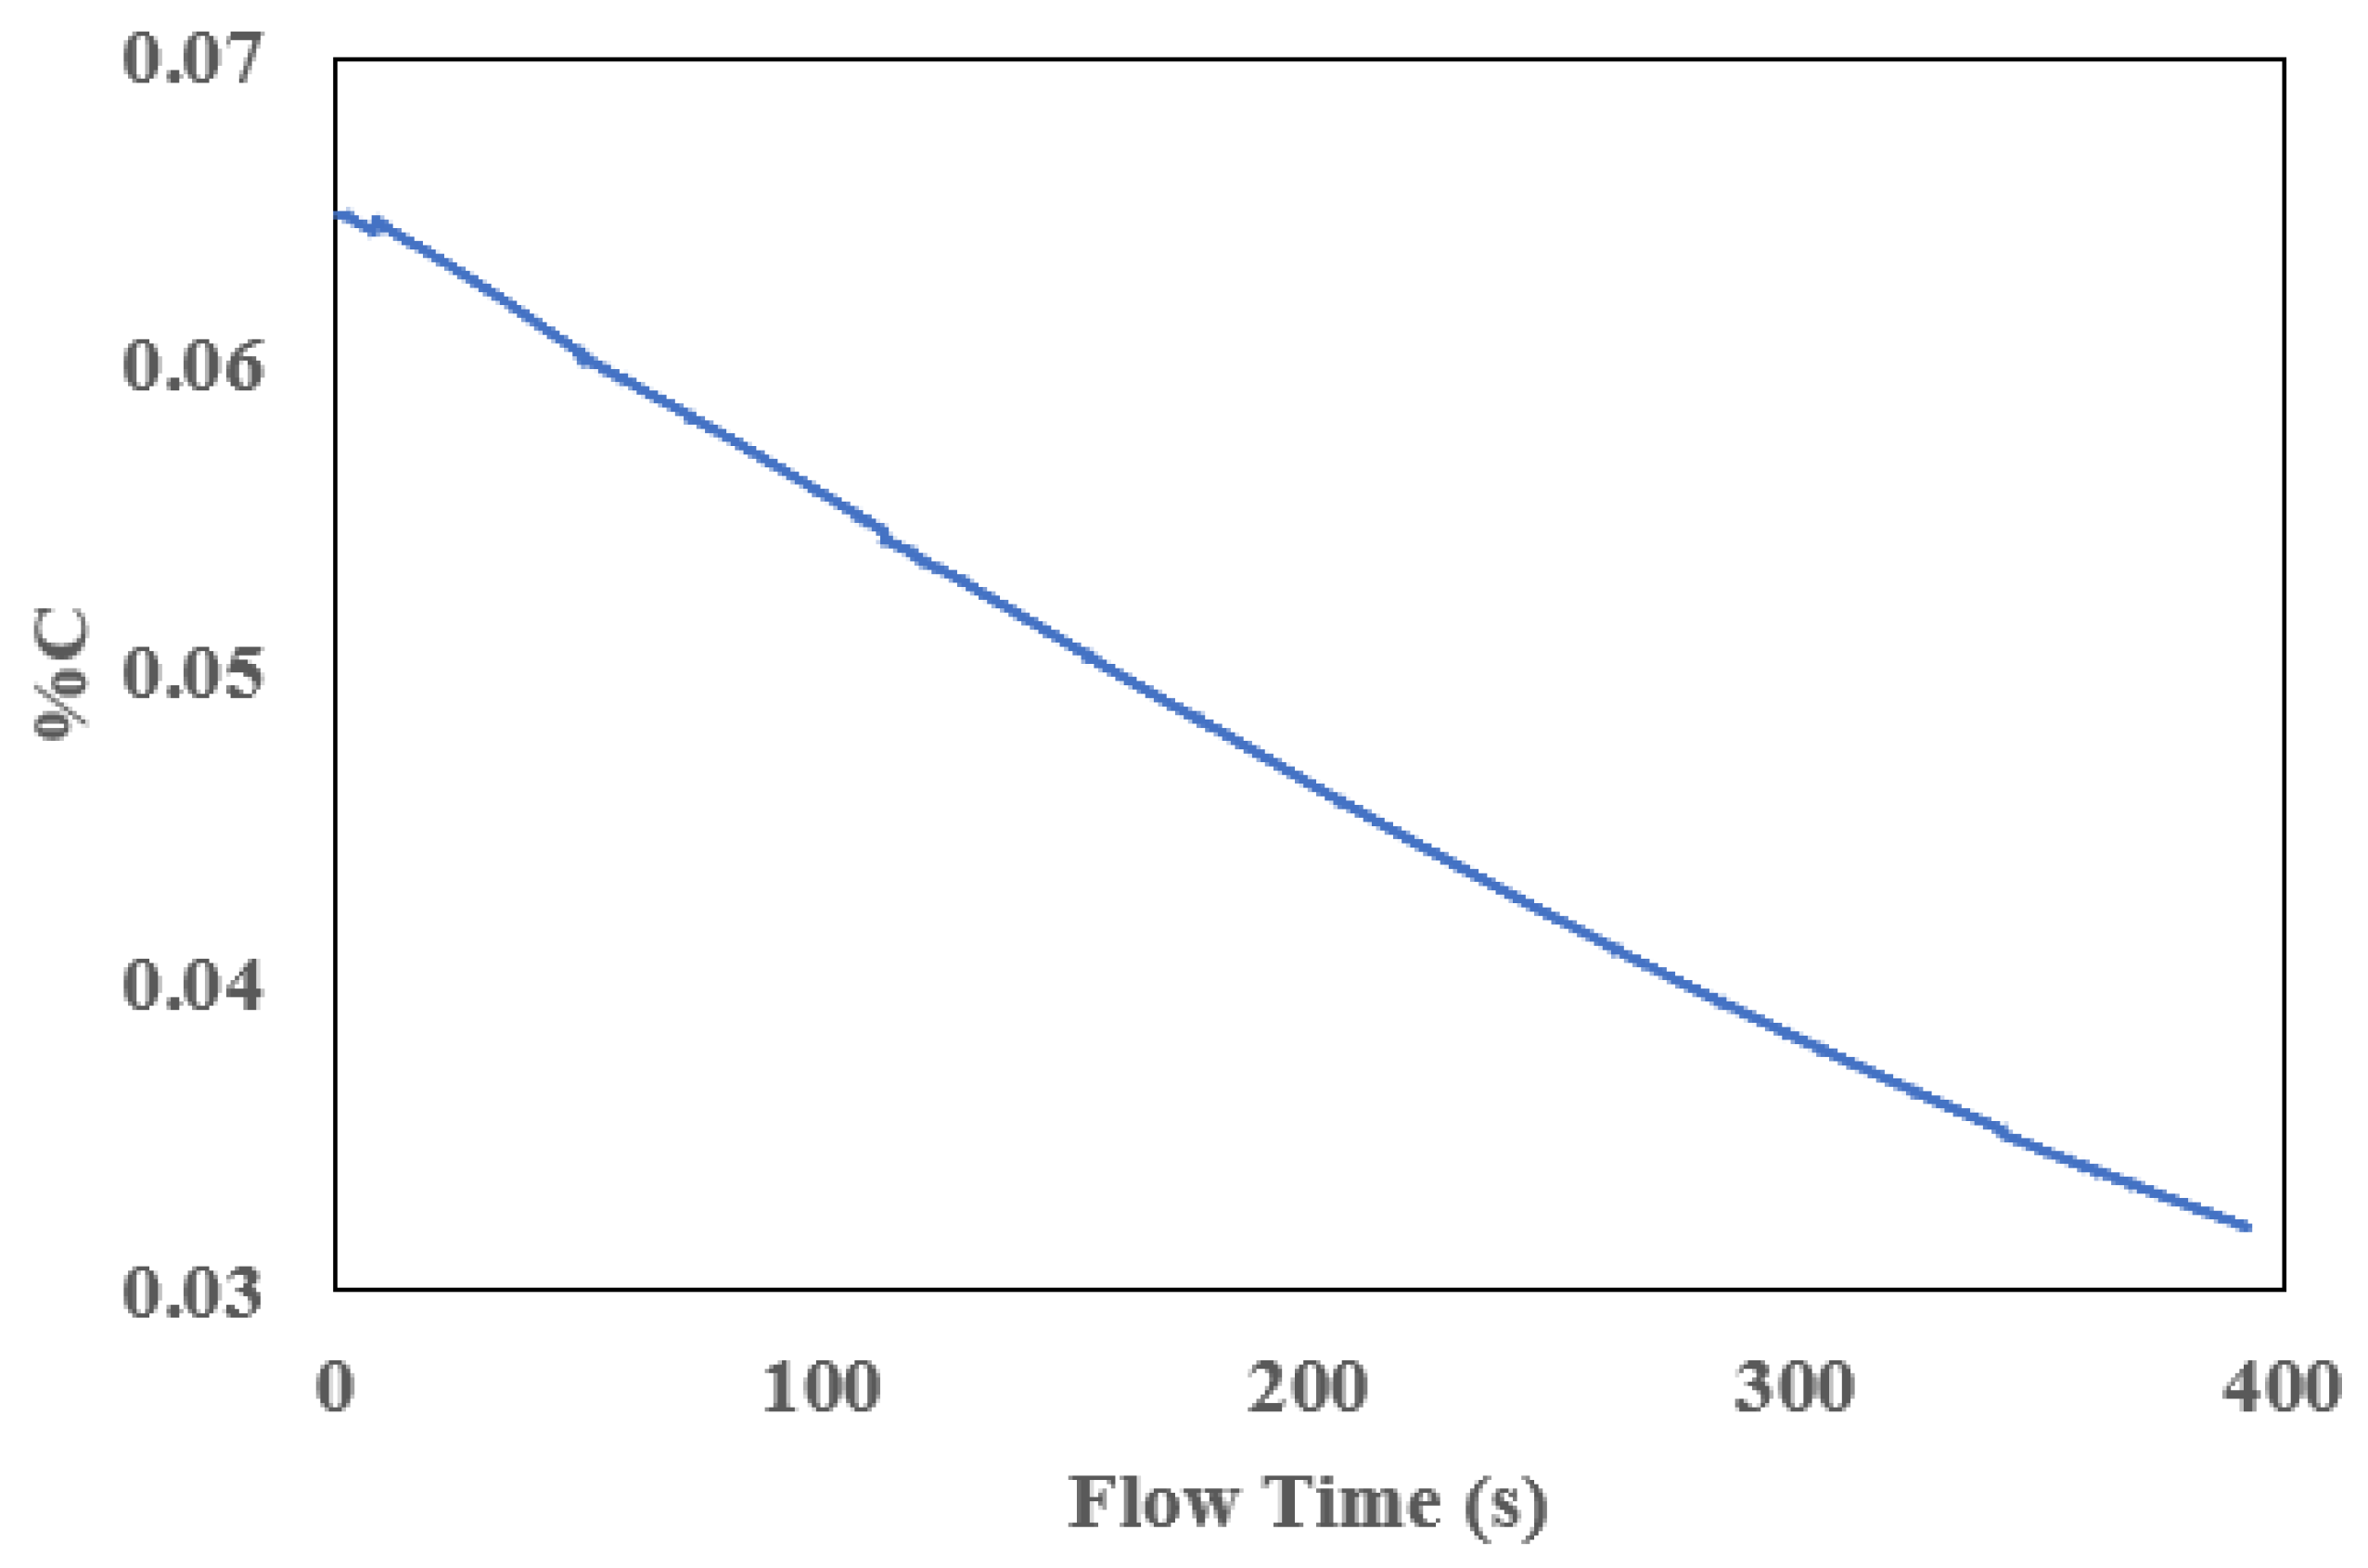
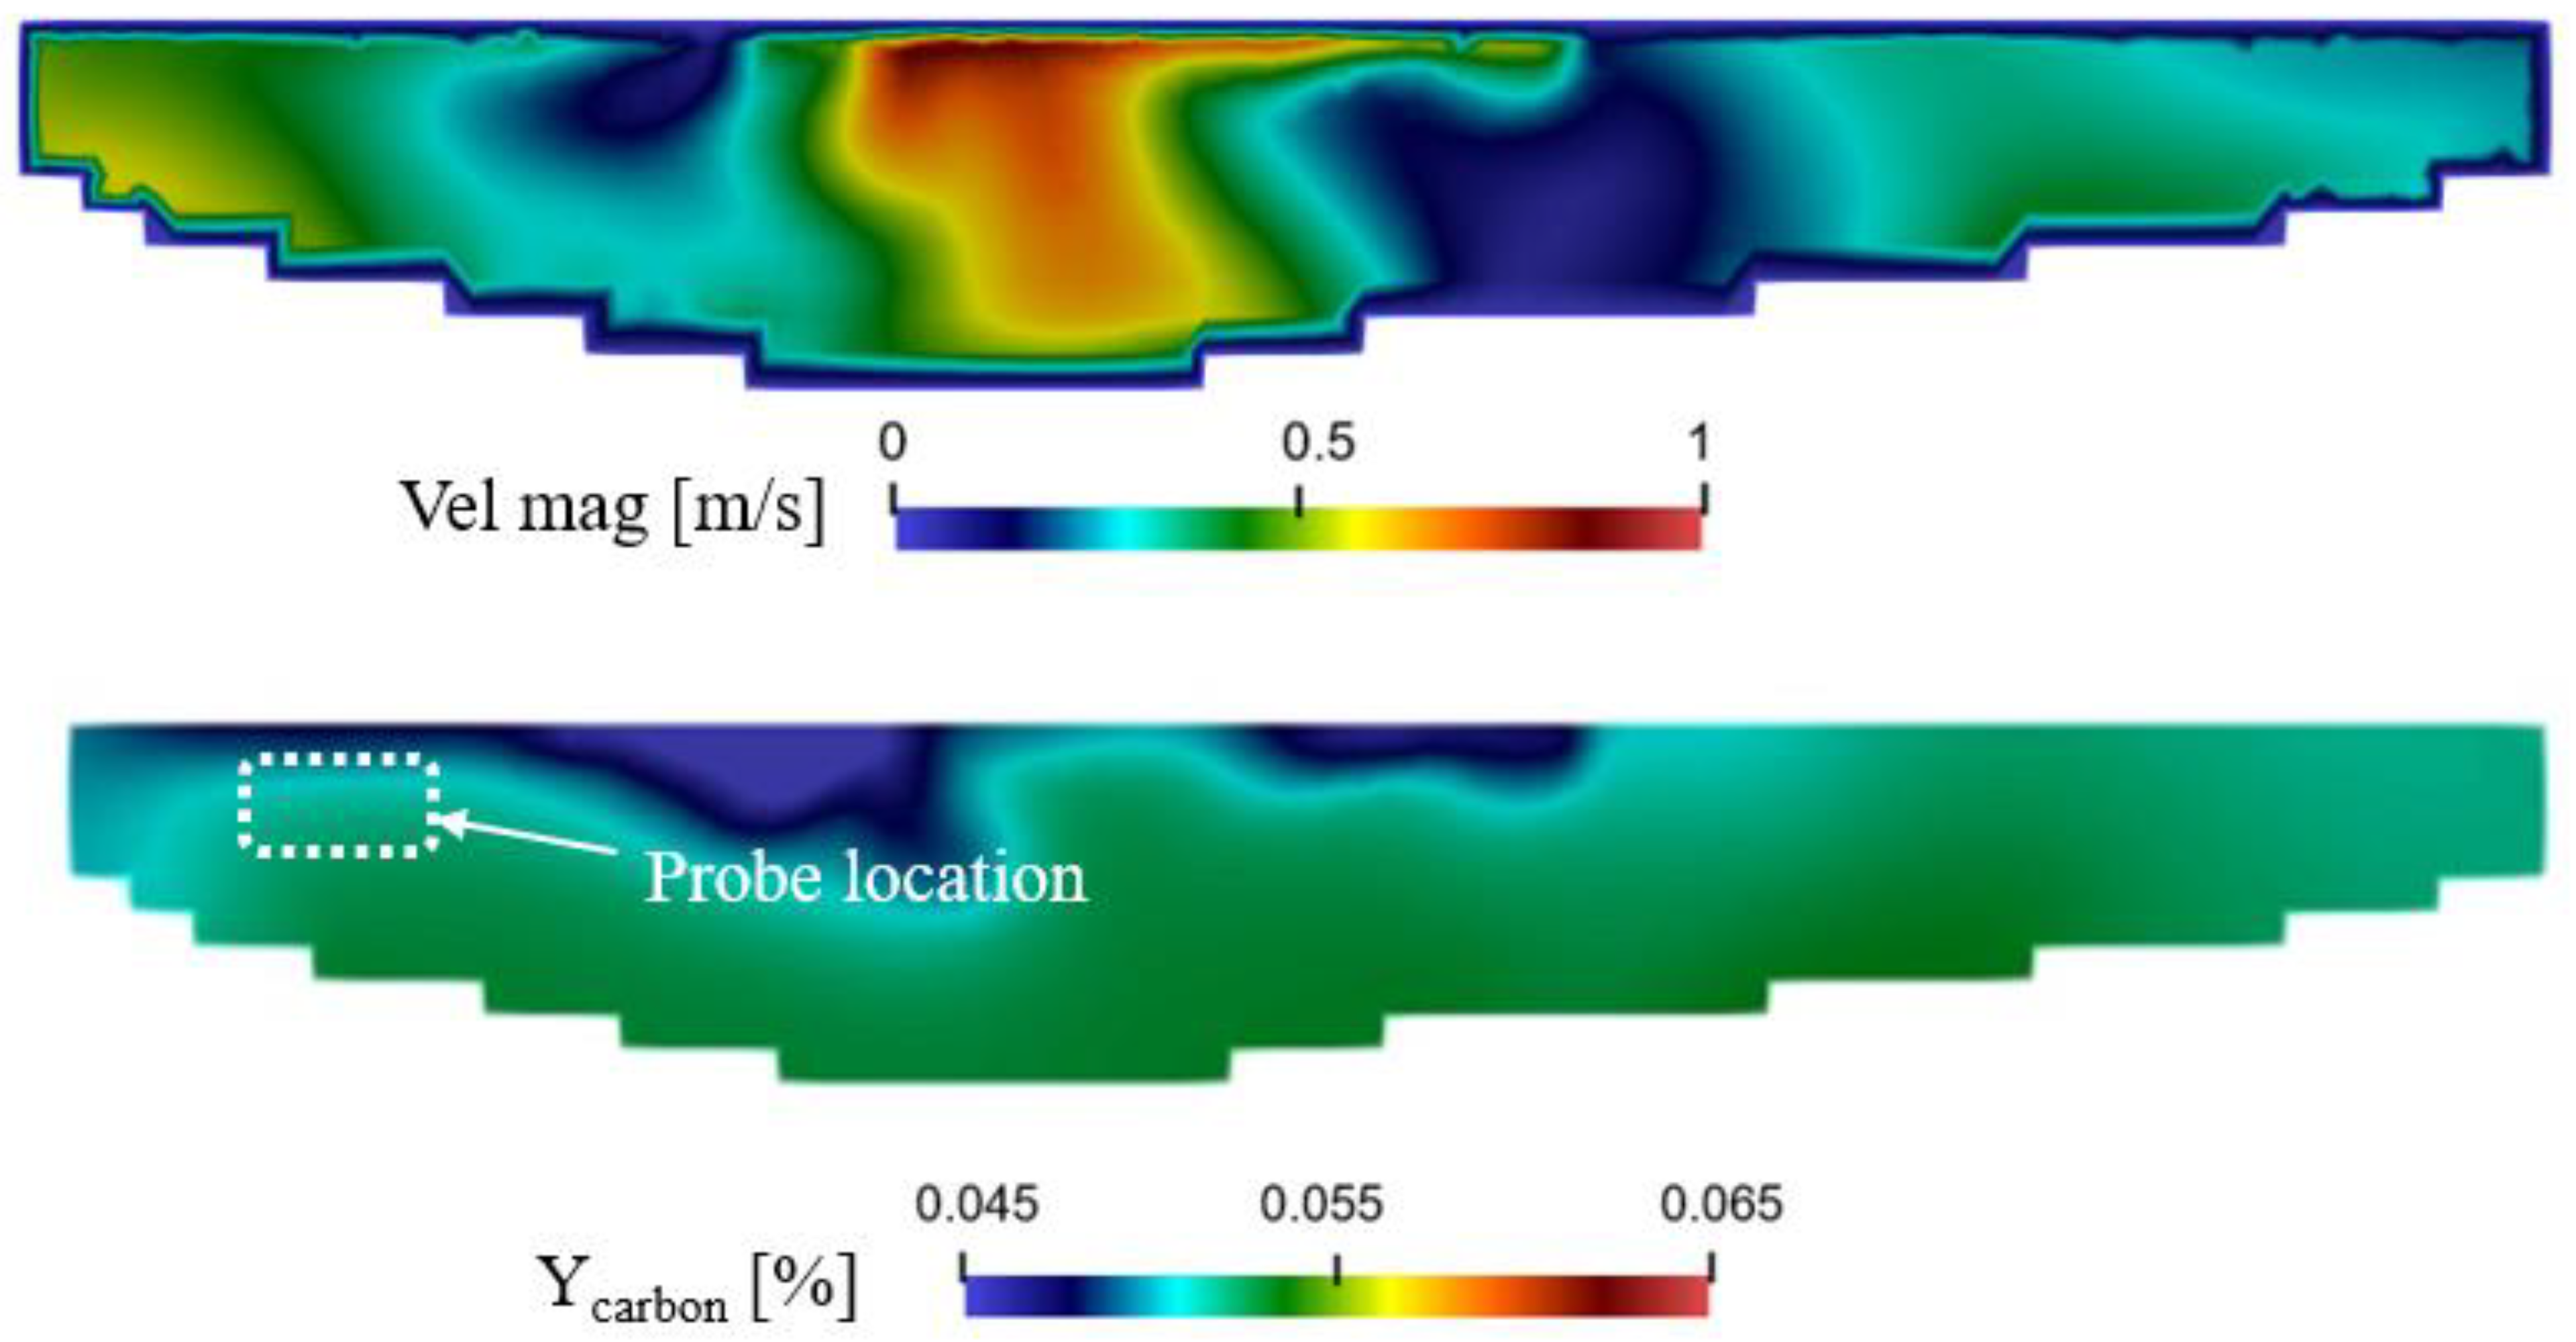
The CFD simulation showed an almost linear decarburization rate (Figure 6) due to the low initial carbon content of 0.065%. Based on experimental measurements, carbon content declines by 13.84% within 134 s. In this time period, CFD simulation predicts a 17.7% carbon reduction. Table 4 shows that at the end of the trial, the experimentally measured carbon content was 0.056%, whereas the simulation estimated 0.0512%, resulting in an 8.57% difference. The region where both experimental and CFD data were collected is marked by the dashed box in Figure 7. Within this region, the carbon content may fluctuate, and these fluctuations can be interpreted as representing the uncertainty or error range inherent in the CFD modelling results.
Furthermore, Figure 7 illustrates the contours of decarburization relative to the velocity distribution within the liquid bath at the slag door plane at the trial’s conclusion. The figure highlights that higher liquid velocities correspond to increased decarburization, driven by enhanced oxidation reactions. Consequently, the most significant decarburization occurs near the bath walls and upper regions, where velocity is greatest.

4. Results

4.1. In-Bath Decarburization for Typical Initial Carbon Content

The EVRAZ NA validation case was repeated as the baseline case to assess the effect of a more representative initial carbon level. Whereas the previous validation trial began at 0.065% C, typical industrial practice starts nearer 0.4% C. Performing a simulation with this higher, industry-standard carbon content establishes a baseline case from which the influence of oxygen injection rates on decarburization and other refining parameters can be evaluated under realistic EAF operating conditions. In this adjusted baseline case, all experimental conditions are identical to the validation case (Table 3), except for the initial carbon content. The oxygen injection rates through the three burners were set at 1150 SCFM for Burner 1, 930 SCFM for Burner 2, and 1210 SCFM for Burner 3, ensuring supersonic jet velocities between Mach 2.0 and 2.4. The steel temperature was maintained at 1838 K (1565 °C), and the molten steel mass was set to 140 t. Temperature-dependent steel density function is used to simulate refining for a typical initial carbon content.
Figure 8 shows that the carbon reduction for an initial carbon content of 0.4% follows a trend commonly observed in the literature [16]. Initially, when the bath carbon is above ~0.3%, nearly all of the injected oxygen reacts with carbon to form CO gas; therefore, the decarburization rate is high—about 0.072% C per minute. Once the carbon level falls below 0.3%, the oxygen-to-carbon reaction becomes less efficient, and the process is limited by how fast carbon can move to the reaction zone As a result, the decarburization rate gradually drops to about 0.018% C per minute, almost to a fourth of the initial case.
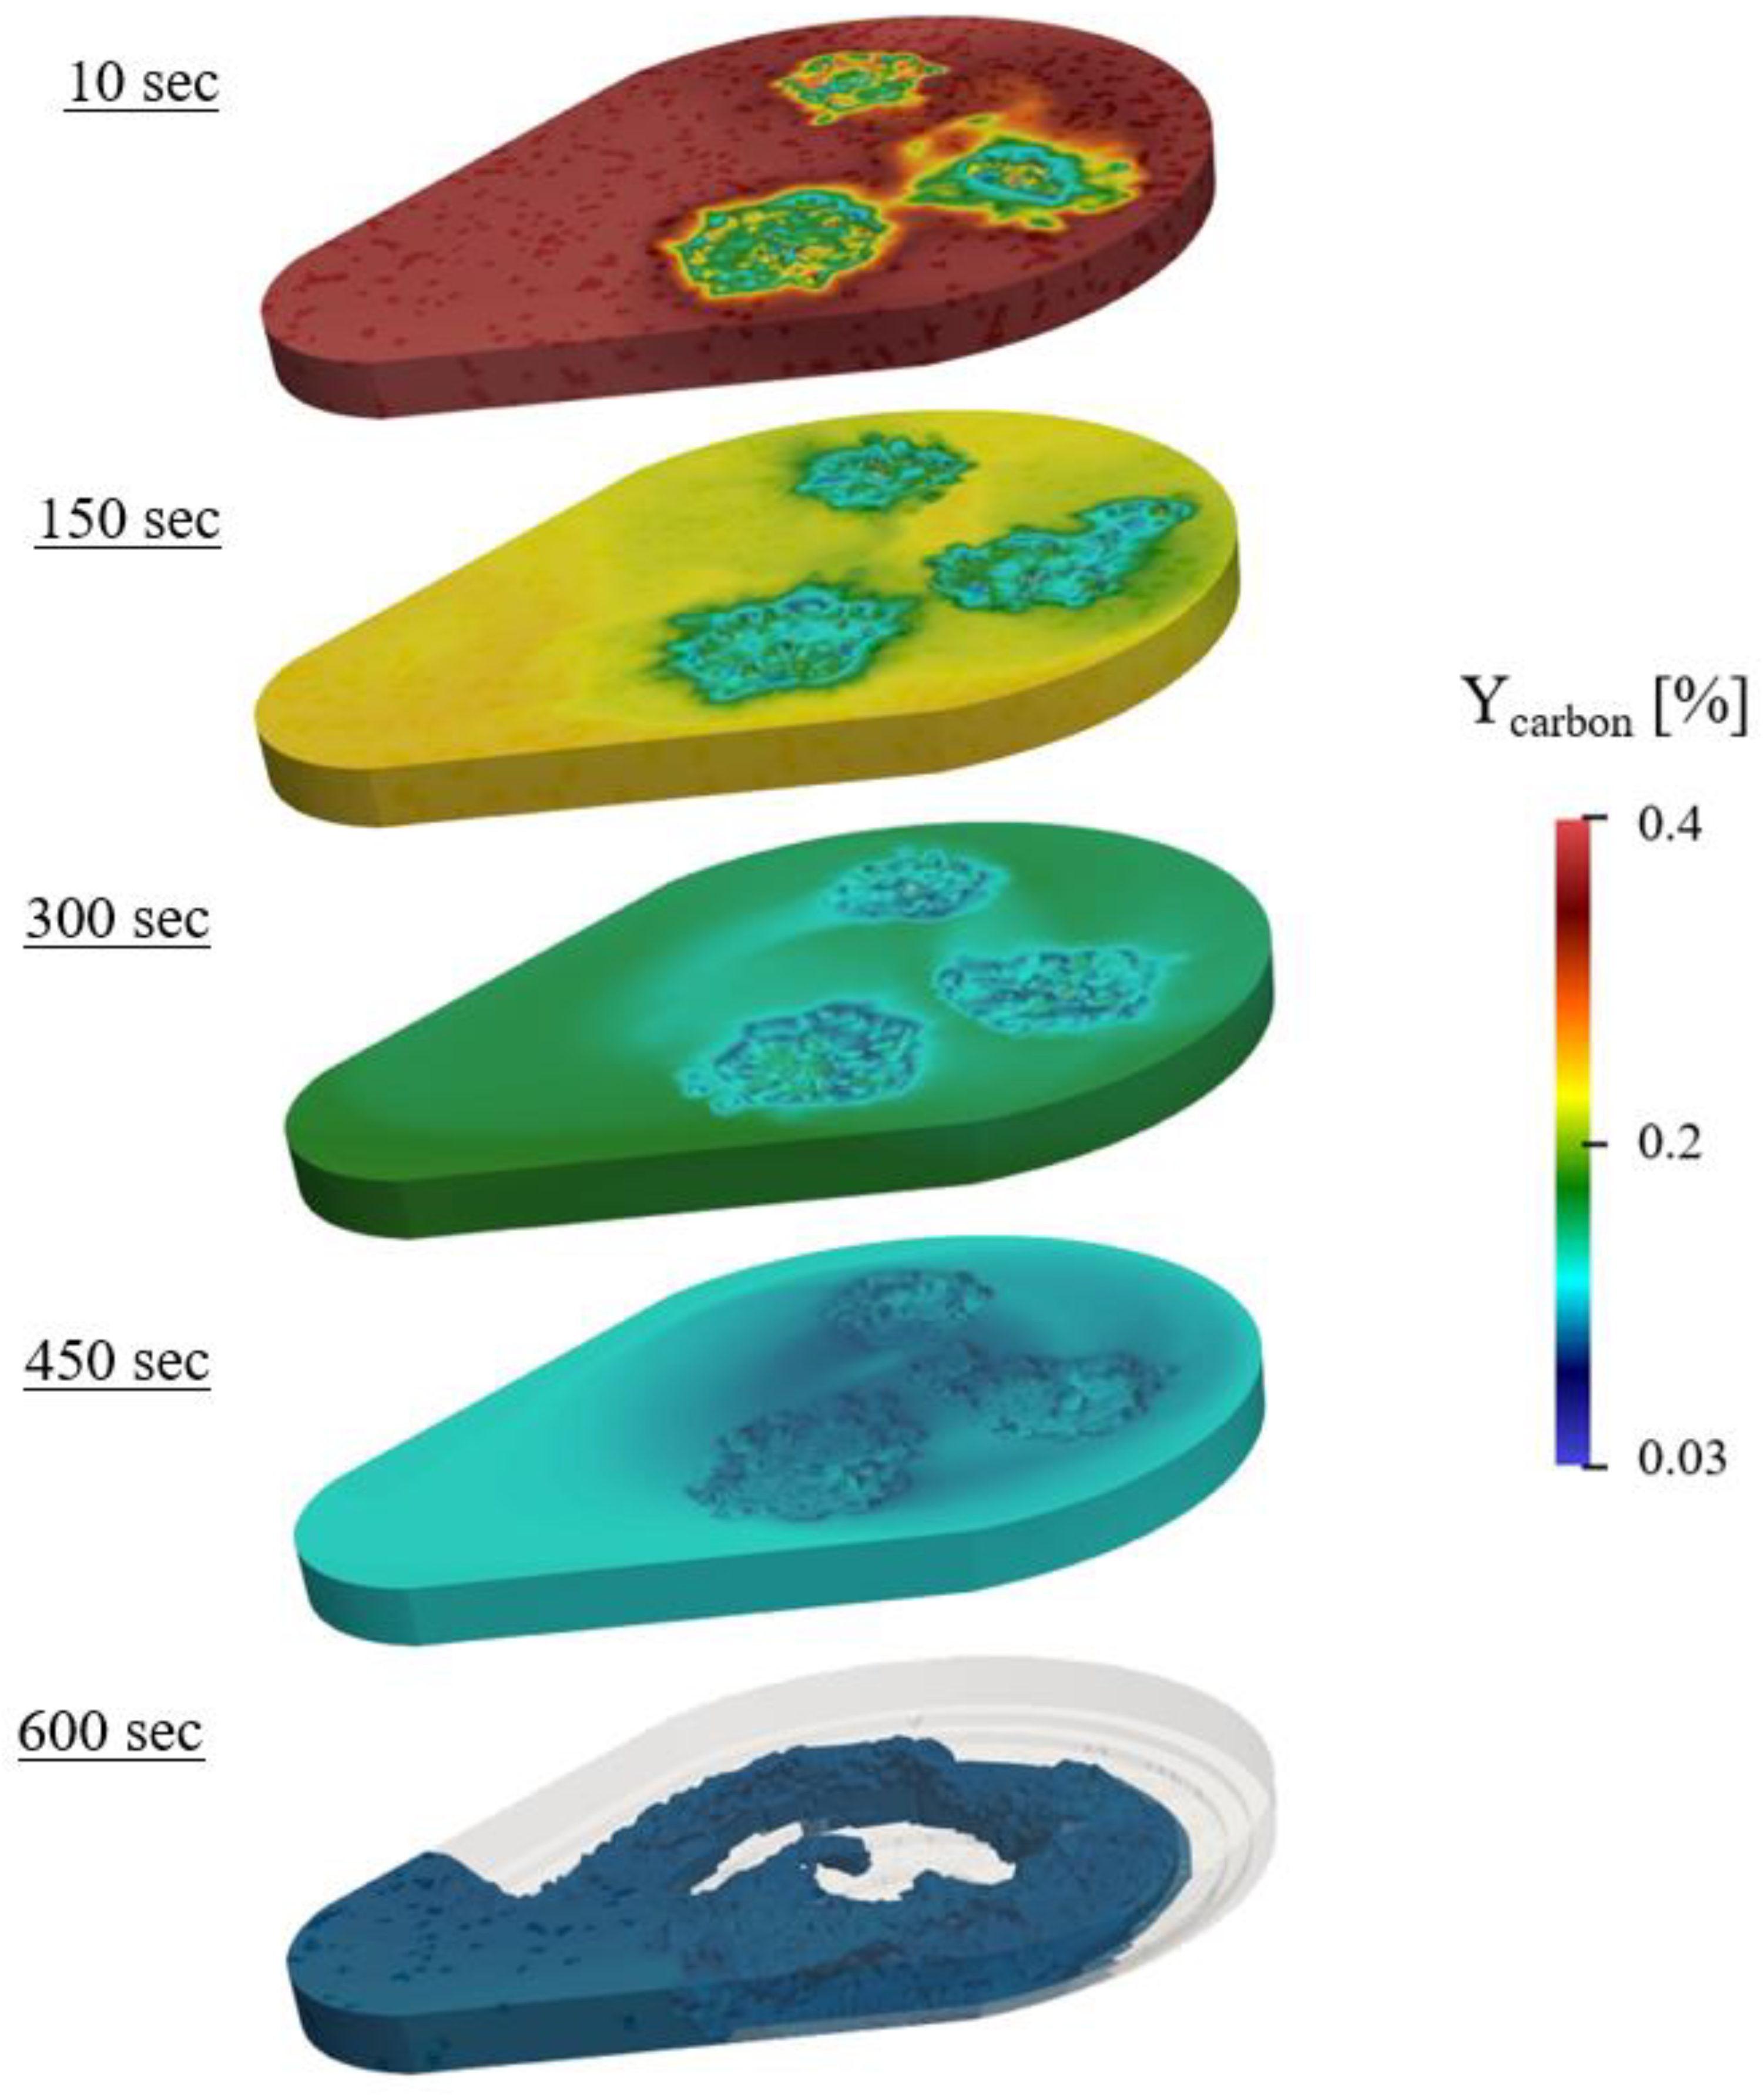
The decarburization evolution is shown in Figure 9. In this set of contours, regions below a 0.1% C threshold are hidden, so carbon reduction is more clearly depicted. At 10 s, the contours reveal compact, high-carbon-reduction areas directly under the jet impingement zones—areas where the oxygen concentration is highest. Here, the reaction rate is dictated almost entirely by the local oxygen, so carbon is removed rapidly while the surrounding bath still retains its initial composition. By 300 s, those areas shrank and became more diffuse, showing that oxygen penetrated much of the liquid bath and that the rate-controlling step shifted from oxygen supply to carbon mass transfer.
The visible contraction of the areas in the contours indicates that, once the bath carbon content falls below roughly 0.3%, the decarburization rate decreases and becomes controlled by carbon diffusion within the molten steel. At 600 s, only a thin band of liquid steel remains above the 0.1% C threshold. The residual carbon is confined to zones with weaker mixing, mainly near the balcony region. This shows that, under the baseline burner arrangement supplying a combined 3290 SCFM (1.5527 m3/s) of oxygen, the liquid bath requires about 600 s to reach 0.1% C throughout the liquid bath.
Figure 10 illustrates the evolution of iron-oxide formation during refining, when the bath begins with 0.40% carbon. Initially, in the liquid bath, carbon is abundant; therefore, essentially all the injected oxygen reacts with the carbon to form CO gas. Locally, very little oxygen is available to oxidize iron, and any FeO that does form reacts with the surrounding abundant carbon and reduces back to Fe through the reduction reaction. Therefore, the FeO generation rate remains low.
As refining proceeds and the carbon content falls towards roughly 0.3%, decarburization efficiency declines. A smaller share of oxygen is consumed by CO formation, leaving more available to react with iron in the melt. FeO generation, therefore, rises from low to moderate levels, indicating the shift from carbon-dominated to iron-dominated oxidation. Once the bath approaches about 0.1% carbon, CO production largely subsided. Oxygen now reacts primarily with iron, and FeO formation stabilizes at a comparatively high rate. At such low-carbon concentrations, the accumulating FeO indicates a reduction in metallic yield. Taken together, the plot shows a clear progression: abundant carbon at first channels oxygen into CO formation and keeps FeO low; as carbon is depleted, CO declines and FeO intensifies, marking the gradual transition from carbon-shielded to iron-focused oxidation throughout the refining cycle. It is to be noted that the apparent oscillations in Figure 10 are due to the very small absolute rate of FeO generation; at this low order of magnitude, even minor variations manifest as noticeable fluctuations.
The same phenomenon is illustrated in the contours shown in Figure 11 in three time frames. At 10 s, FeO shows up as three small regions directly beneath the oxygen jets. By 300 s, these regions expanded and multiplied, spreading across the upper bath and beginning to connect. At 600 s, the once-separate areas merged into broad, continuous sheets that follow the bath’s main flow paths, with a few stray clusters forming along the walls. This progressive spread highlights how iron oxidation starts locally and gradually encompasses the entire melt as refining progresses and more oxygen becomes available for FeO formation.

4.2. In-Bath Flow Velocity and Decarburization Dynamics

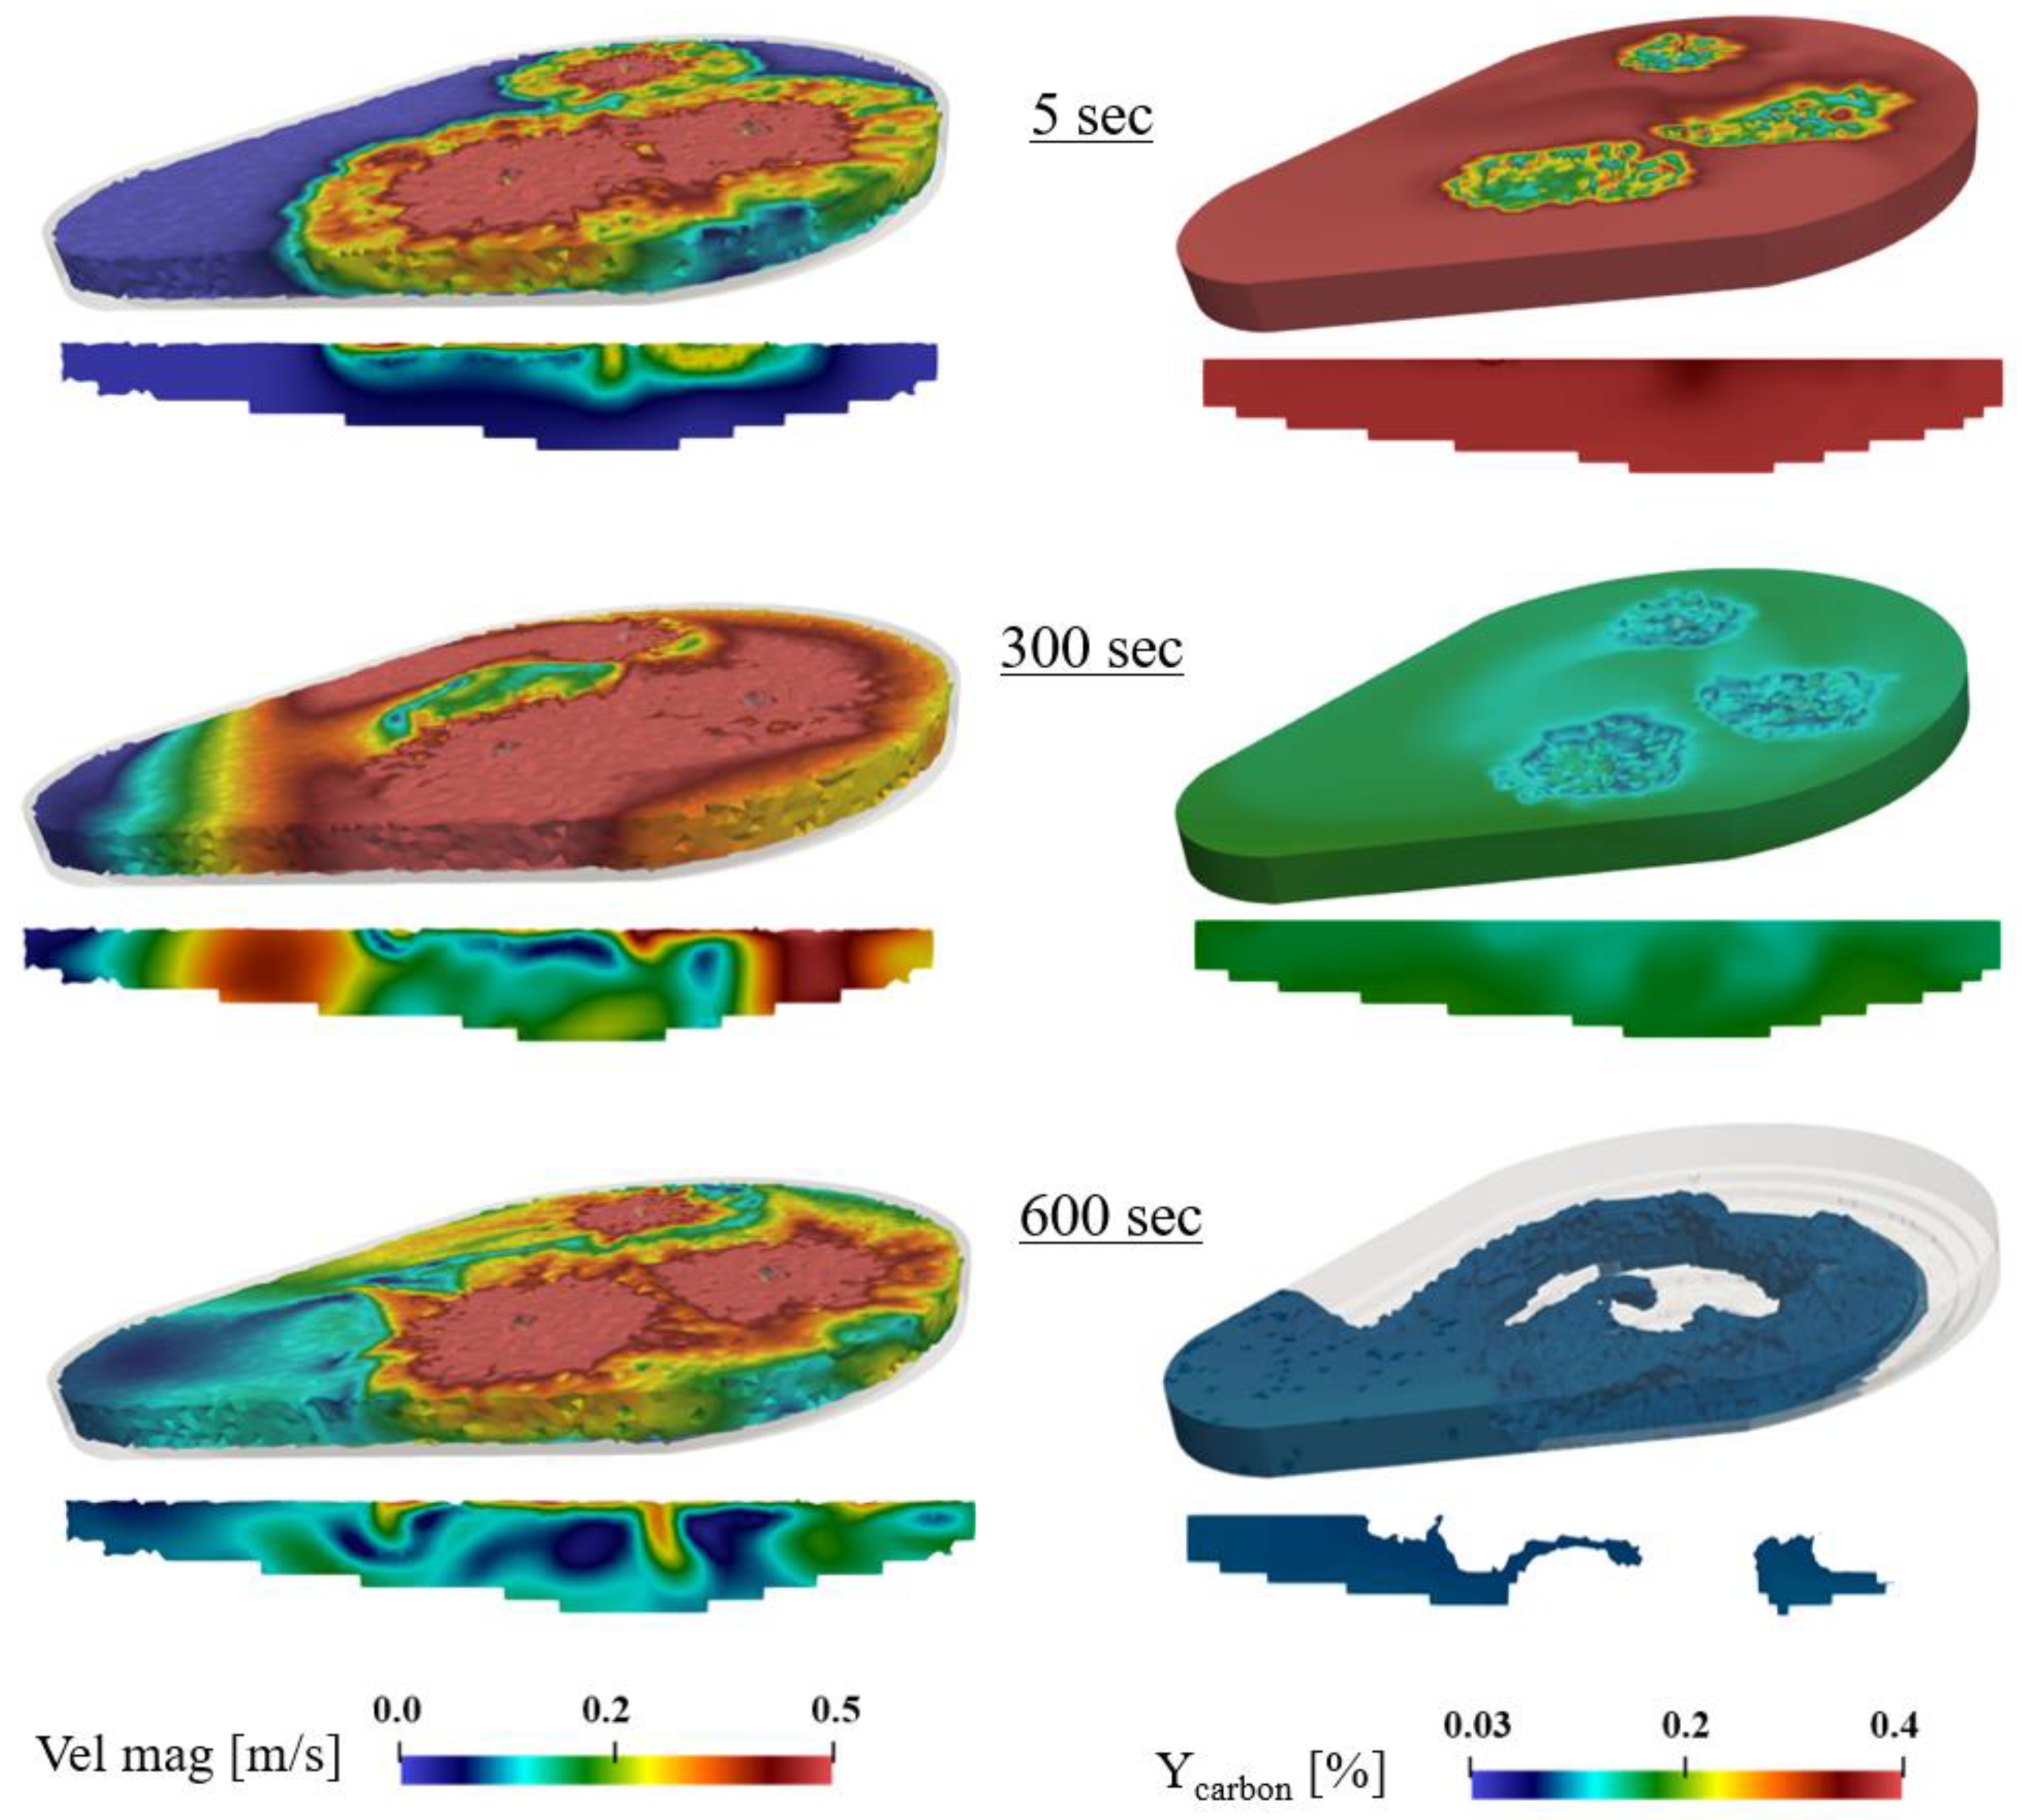
The relationship between liquid velocity and decarburization is illustrated in Figure 12, which represents in-bath decarburization relative to velocity magnitudes at three stages of refining. These figures incorporate iso-surfaces along with the slag door plane of the liquid bath, providing a wide analysis of the refining process.
At 5 s, liquid velocities start forming near the burners and at the bath surface, marking the initial phase of flow agitation driven by impingement by coherent jets. These jets introduce high momentum, initiating decarburization near the burners and spreading it towards the bath corners as liquid steel circulates. The increased velocity near the burners enhances oxygen–carbon interactions, accelerating carbon removal.
At 300 s, the liquid velocities spread well beyond the burner zones, forming a broad circulation pattern that covers most of the bath surface and extends down along the sidewalls. Flow agitation remains strongest near the burners and across the upper bath, but noticeable motion now reaches the mid-depth, carrying oxygen further into the melt. As a result, decarburization advanced across a larger area: carbon concentrations are much lower around the surface and towards the bath corners, while higher-carbon regions mainly persist in the central and lower portions, where velocities are still moderate. This intermediate stage shows the transition from localized jet impact to bath-wide mixing, with oxygen–carbon reactions becoming more uniform throughout the liquid steel.
By 600 s, a fully developed velocity profile is established within the liquid bath. The velocity contours reveal strong flow agitation at the corners and surface, while the middle and lower regions exhibit comparatively lower turbulence. This pattern highlights the ongoing influence of coherent jets, which continue to stir the upper regions of the bath. As seen in Figure 12, the most significant decarburization occurs at the bath corners and surface, where higher liquid velocities enhance oxidation reactions, improving the refining process.

5. Discussion

5.1. Impact of Varied Oxygen Flow Rates on Refining

This study evaluates the influence of varied oxygen injection rates on refining performance by uniformly modifying O2 injection across all three co-jet burners. The primary goal is to understand the effect of oxygen flow rate adjustments on carbon removal efficiency and FeO generation in the liquid bath while maintaining supersonic jet velocities within a Mach number range of 2 to 2.4.
Three cases were analysed for this study, as listed in Table 5. Case 1 represents baseline operational conditions, where the three burners operate at 1150 SCFM, 930 SCFM, and 1210 SCFM, respectively. Case 2 examines the impact of increasing the oxygen injection rate uniformly across all burners to 1210 SCFM, leading to a higher oxygen supply for refining. Conversely, Case 3 investigates the reduced oxygen injection, where each burner operates at 930 SCFM, decreasing the total O2 input.
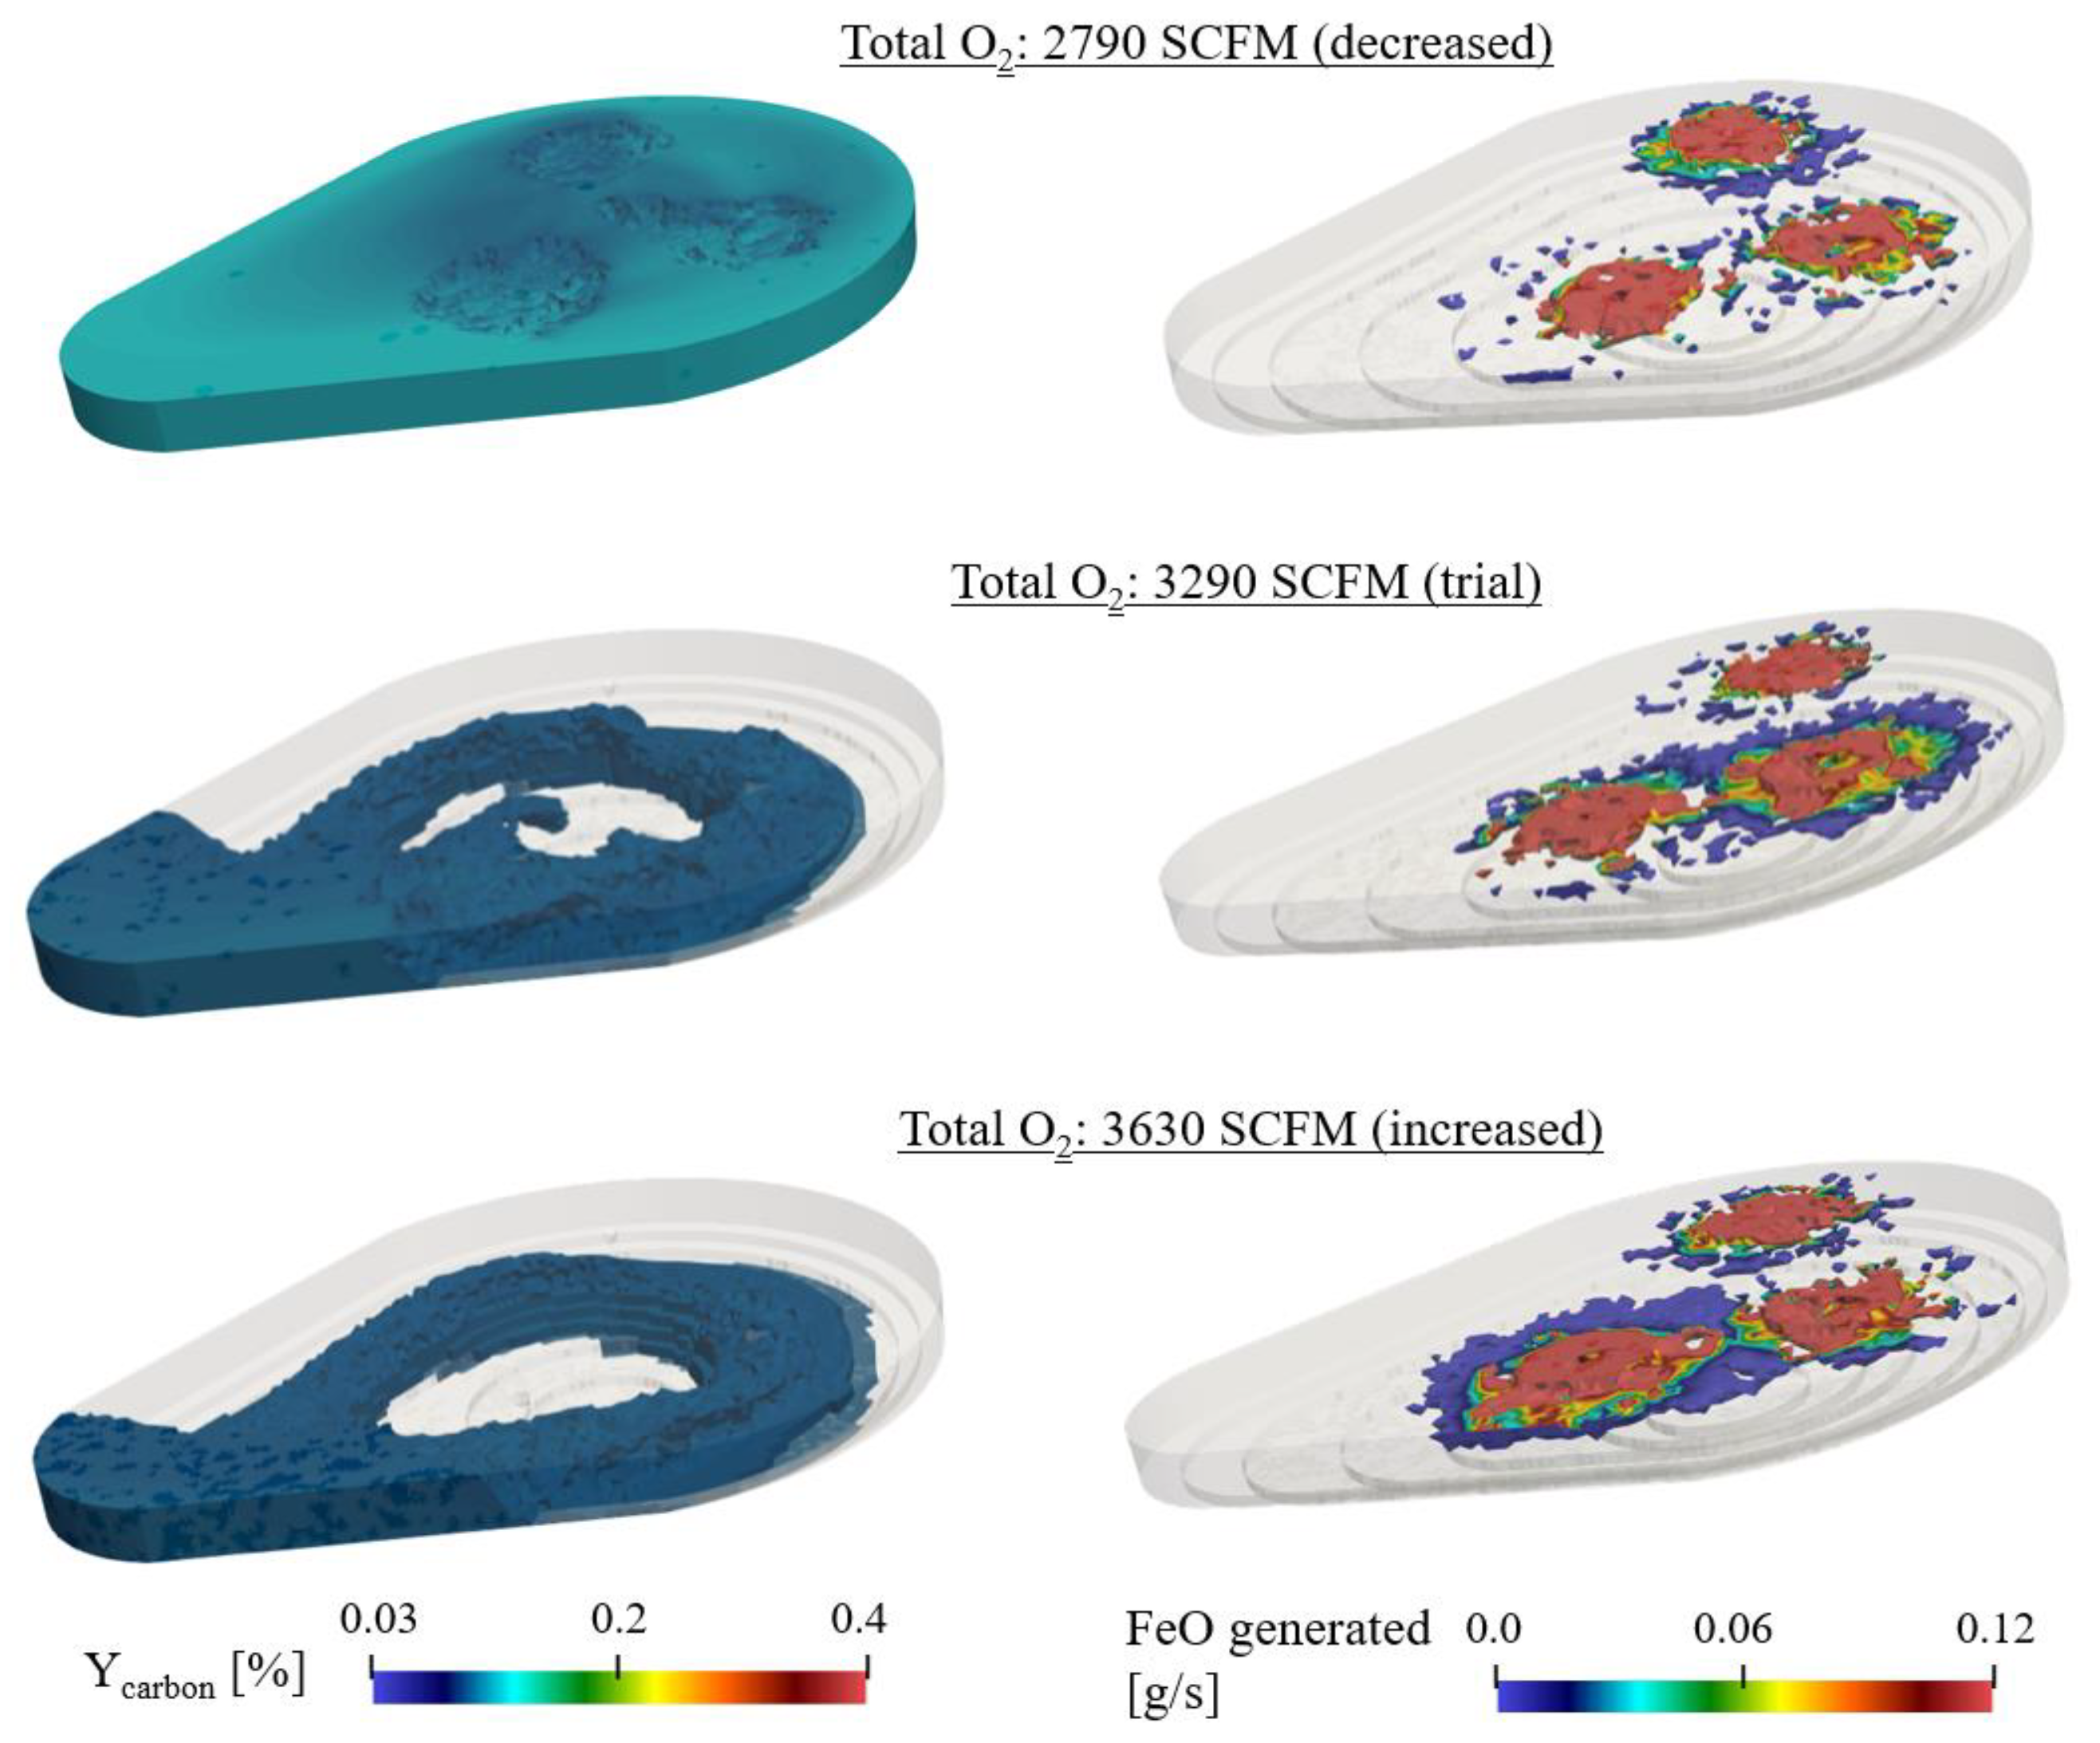
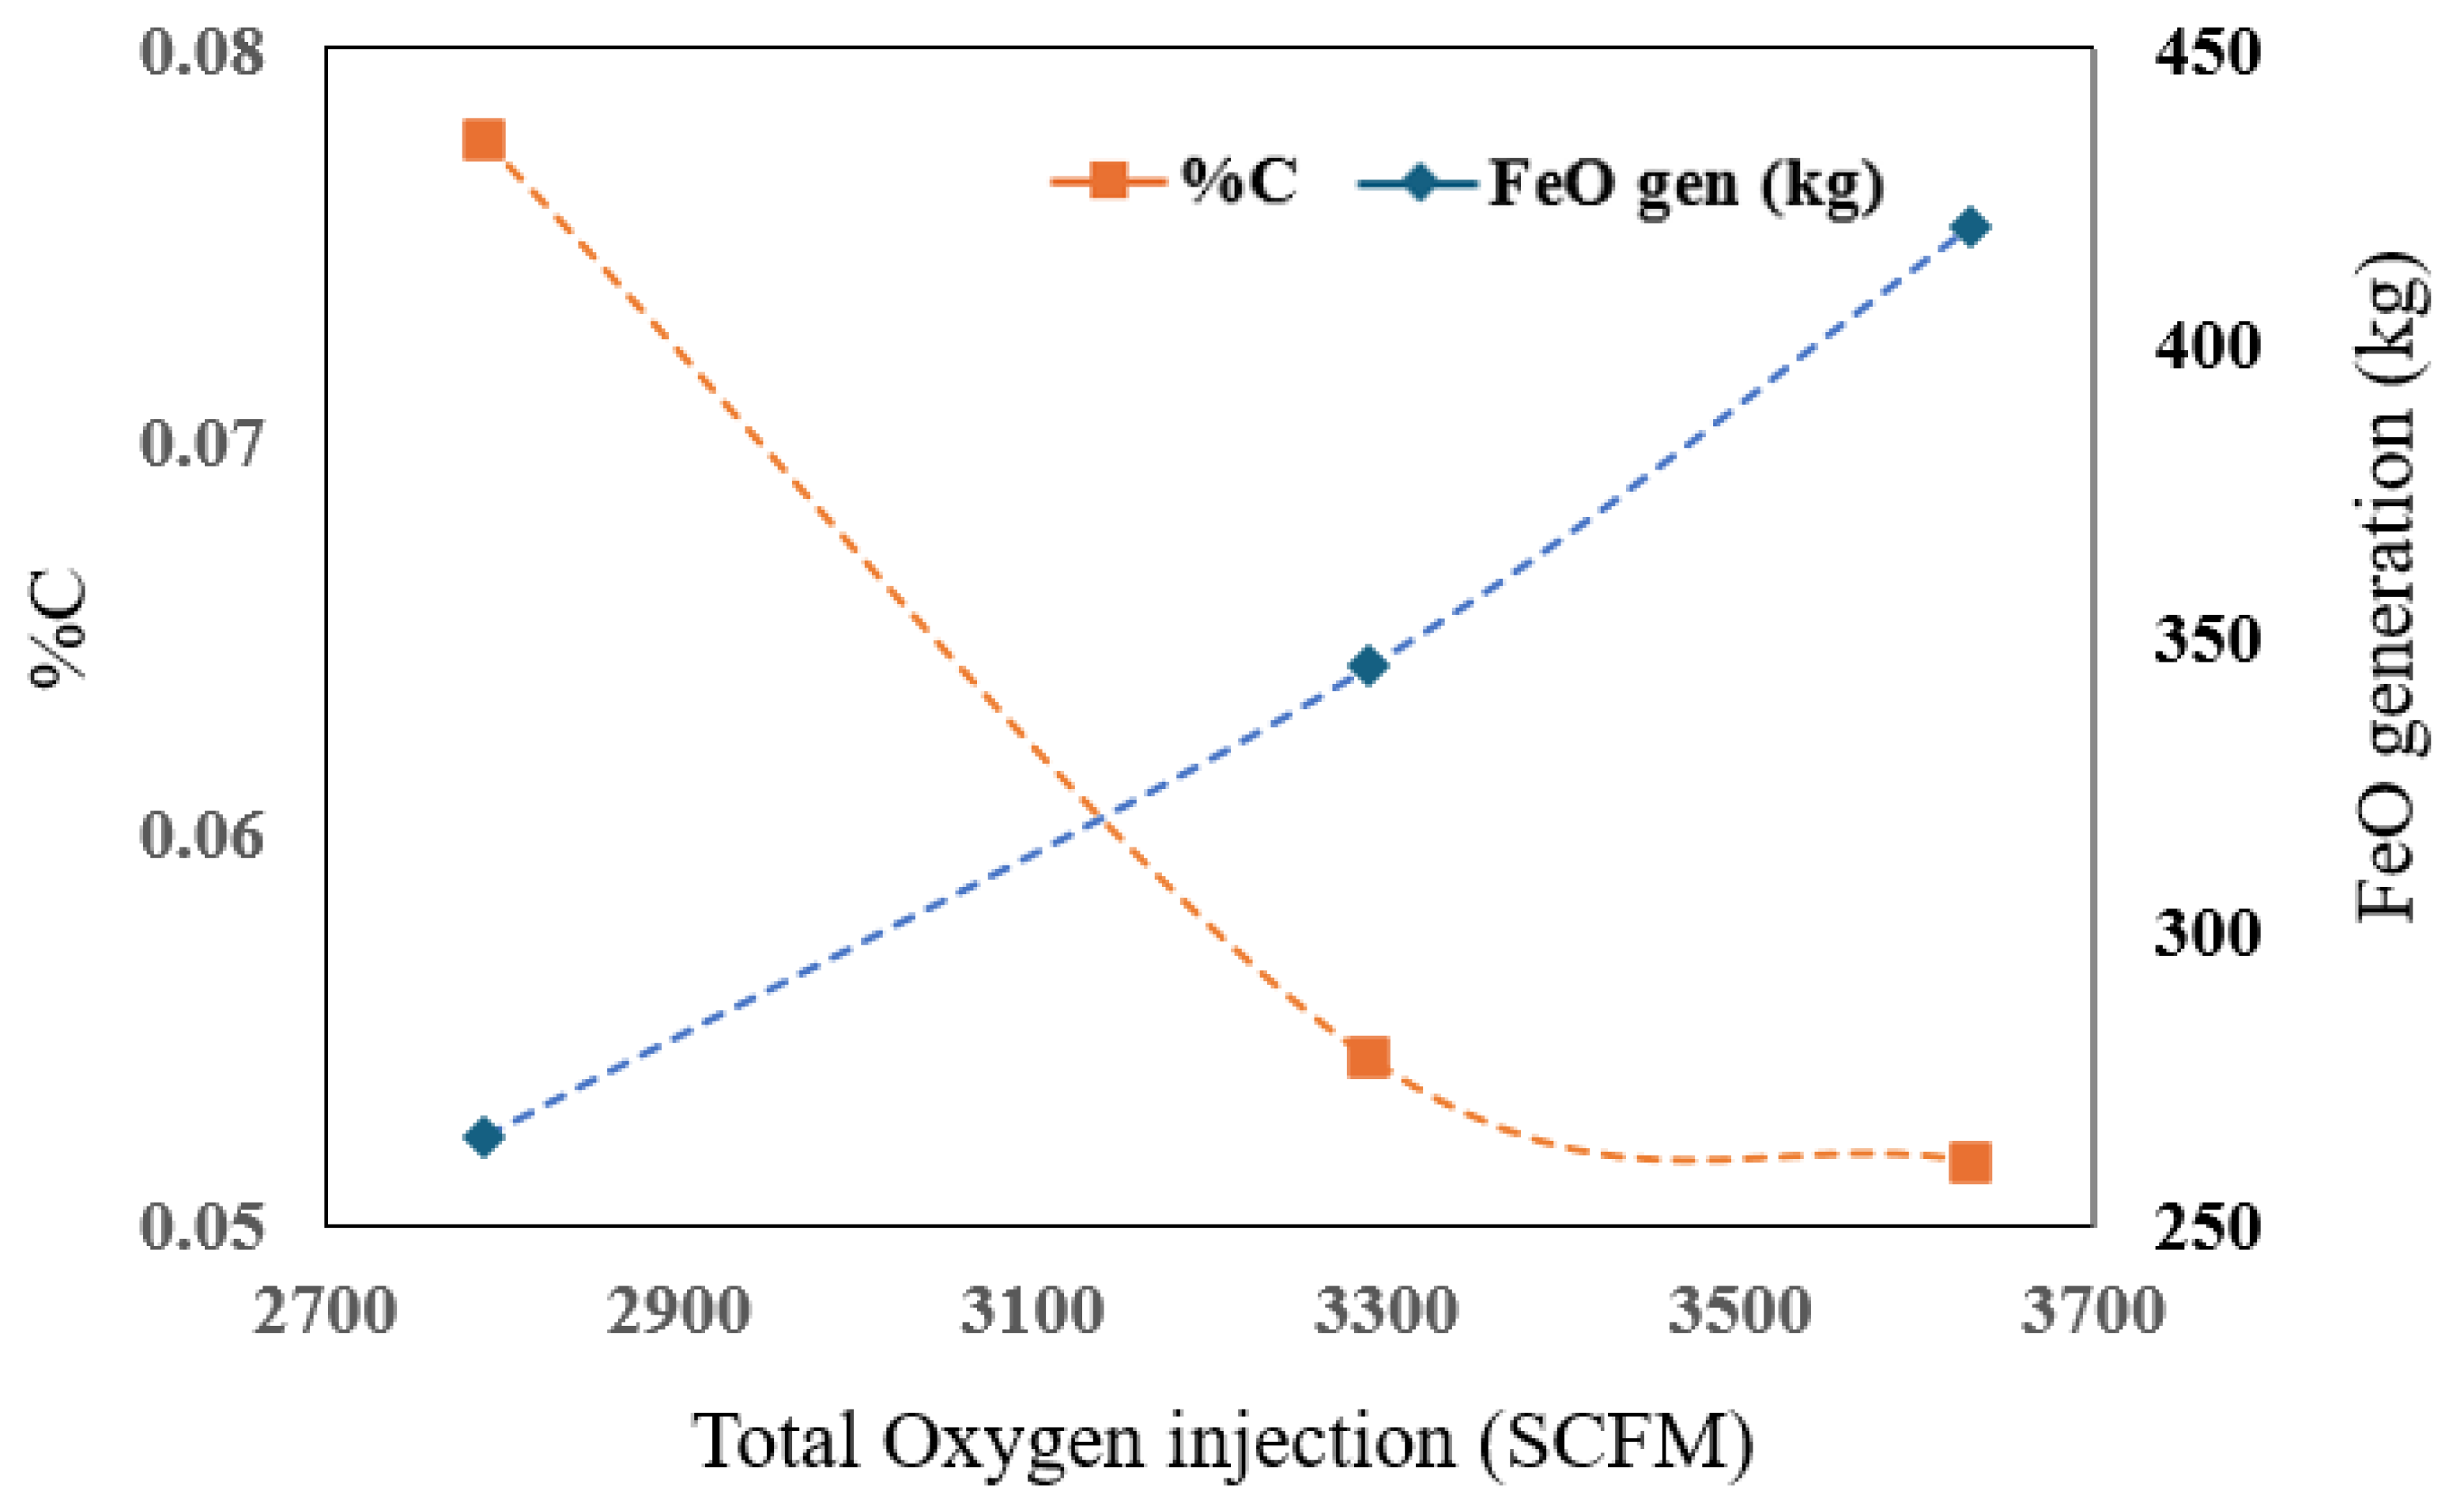
Figure 13 shows results at 600 s. Here, decarburization is higher with the increased oxygen injection rate (Case 2) and lower with the decreased oxygen injection rate (Case 3), as expected. Similarly, FeO generation at 600 s is higher in Case 2 and lower in Case 1 than in the baseline case. FeO formation correlates with the oxygen availability for oxidizing iron; thus, a higher oxygen injection rate increases FeO levels, while a reduced rate limits FeO formation.
The impact of varying oxygen injection rates on the refining process is evident when comparing the results across different cases, as shown in Figure 14. The data was evaluated at 900 s, which is a typical refining duration in industrial operations.
In Case 2, the total oxygen injection rate was increased by 340 SCFM, representing a 10% increase from the baseline case. This led to a minor improvement of a 5% reduction in carbon content. However, this came at the cost of a 21.7% increase in FeO formation, indicating a higher degree of potential yield losses. On the other hand, in Case 3, the total oxygen injection rate was reduced by 500 SCFM, which is a 15% decrease from baseline. As a result, carbon content increased by 43%, indicating a significant slowdown in the decarburization process. Meanwhile, FeO generation dropped by 23%, showing reduced yield losses.
These findings highlight the importance of optimizing oxygen injection to balance carbon removal and FeO generation. While higher oxygen levels promote oxidation, they do not significantly speed up decarburization but instead lead to more FeO formation and material losses. On the other hand, reducing oxygen injection minimizes FeO generation but slows down carbon removal, increasing the refining time.

5.2. Impact of Number of Burners on Refining

In some operations, the number of oxygen jets is significantly higher. As a comparison to assess the impact of an increased number of burners on refining performance, additional simulations were conducted on a second EAF operation. This EAF is of similar size to the EVRAZ NA furnace utilized in the previous modelling process, containing roughly 139 t of liquid steel, with a total height of 0.8 m, 7.7 m in maximum length, and 6.3 m in width. A CFD mesh of 260,145 cells is used in the simulation of the second EAF refining operation.
Figure 15 compares the two furnaces (three and six coherent jet burners, respectively). While the initial conditions for each furnace are matched with industrial operations, both simulations start from very similar conditions including molten-steel masses near 140 t, bath temperatures of about 1838 K (three co-jets) and 1850 K (six co-jets), an initial carbon content of 0.4%, and closely matched bath volumes and shapes, thereby minimizing variability in refining performance due to their minimal difference factors. Thus, an analysis can compare the impact on molten steel reactions and flow characteristics due to the difference in the number of burners, which in turn causes the difference in oxygen injection rates.
Table 6 shows the refining systems of the two furnaces and frames the basis for the CFD comparison. In the EVRAZ configuration, three coherent jet burners inject a combined 3290 SCFM of oxygen—1150 SCFM from Burner 1, 930 SCFM from Burner 2, and 1210 SCFM from Burner 3. The six-co-jet furnace, in contrast, employs six burners (including a door lance), each supplying 1000 SCFM, for a total of 6000 SCFM. All nozzles operate in the Mach range of 2–2.4, ensuring deep jet penetration and enhanced mixing in the molten steel bath.
In addition to providing a higher total oxygen flow rate, the larger burner counts in the six-co-jet domain’s layout double the number of high-momentum jet impingement zones and distribute them more uniformly across the bath surface. This wider spatial arrangement is expected to intensify localized stirring, enhanced mixing turbulence and promote more homogeneous decarburization throughout the liquid bath. In addition, the higher oxygen flow in the six co-jet domain is expected to accelerate oxidation kinetics, particularly the carbon–oxygen reaction that generates CO gas, the primary mechanism for carbon removal in the early stages of refining.

5.2.1. Comparison Between Three-Co-Jet- and Six-Co-Jet Domain with Baseline Injection Rates

The analysis begins by comparing the baseline scenarios for two furnace configurations. The results are determined at the moment each bath reaches 0.1% carbon—the typical desired carbon content at tapping in industrial practice.
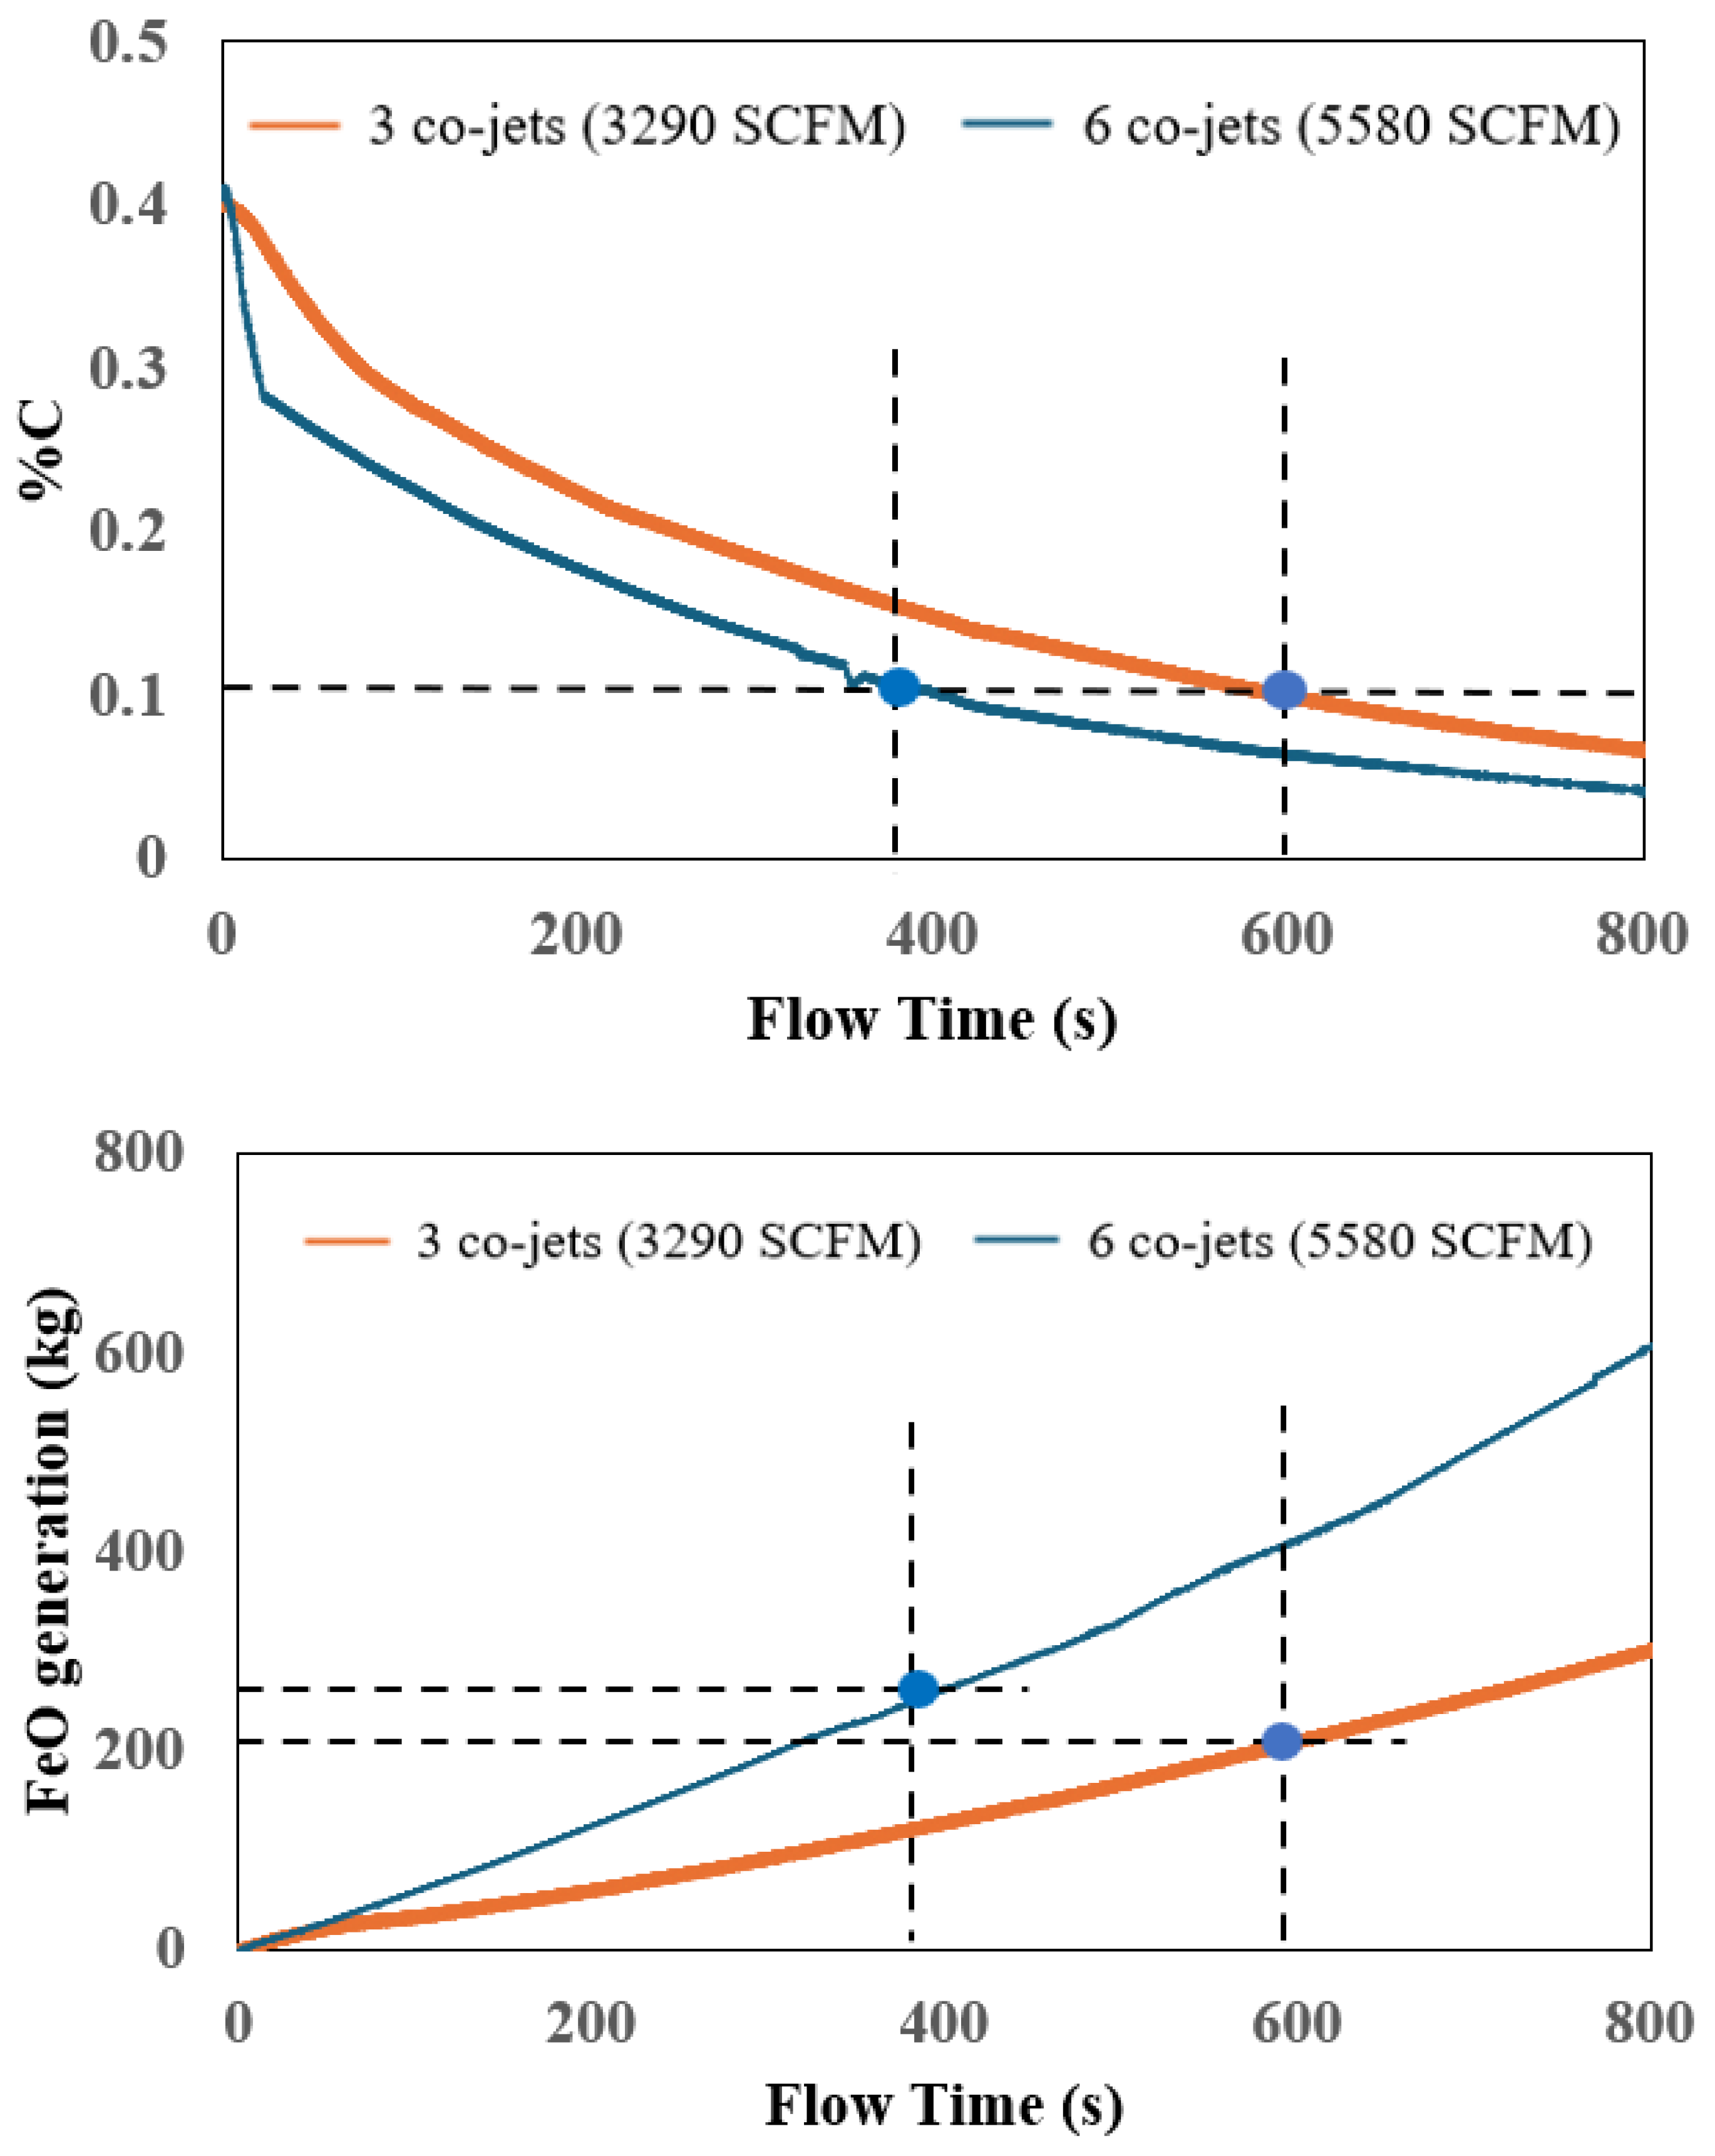
The carbon graph in Figure 16 shows how the carbon content (%C) decreases over time due to the decarburization reaction. The six-co-jet domain, with its 85% higher total oxygen input than the three-co-jet domain, shows a faster decline in %C. It reaches the target 0.1% in 385 s, almost 35% faster when compared to 595 s in the EVRAZ NA case.
Simultaneously, FeO generation is evaluated at the exact moments when each liquid bath domain reaches 0.1% carbon content for a consistent comparison. The FeO graph tracks FeO mass generated in the liquid bath over time, with the six-co-jet furnace generating FeO more rapidly. At the respective time of 0.1% C for each case, the six-jet furnace produced 285 kg of FeO, while the three-jet furnace generated 200 kg. This corresponds to a 42.5% increase in FeO in the six-co-jet domain setup (shown in Table 7). Thus, using more burners and higher oxygen flow speeds up carbon removal but also generates more FeO because of stronger oxidation reactions.
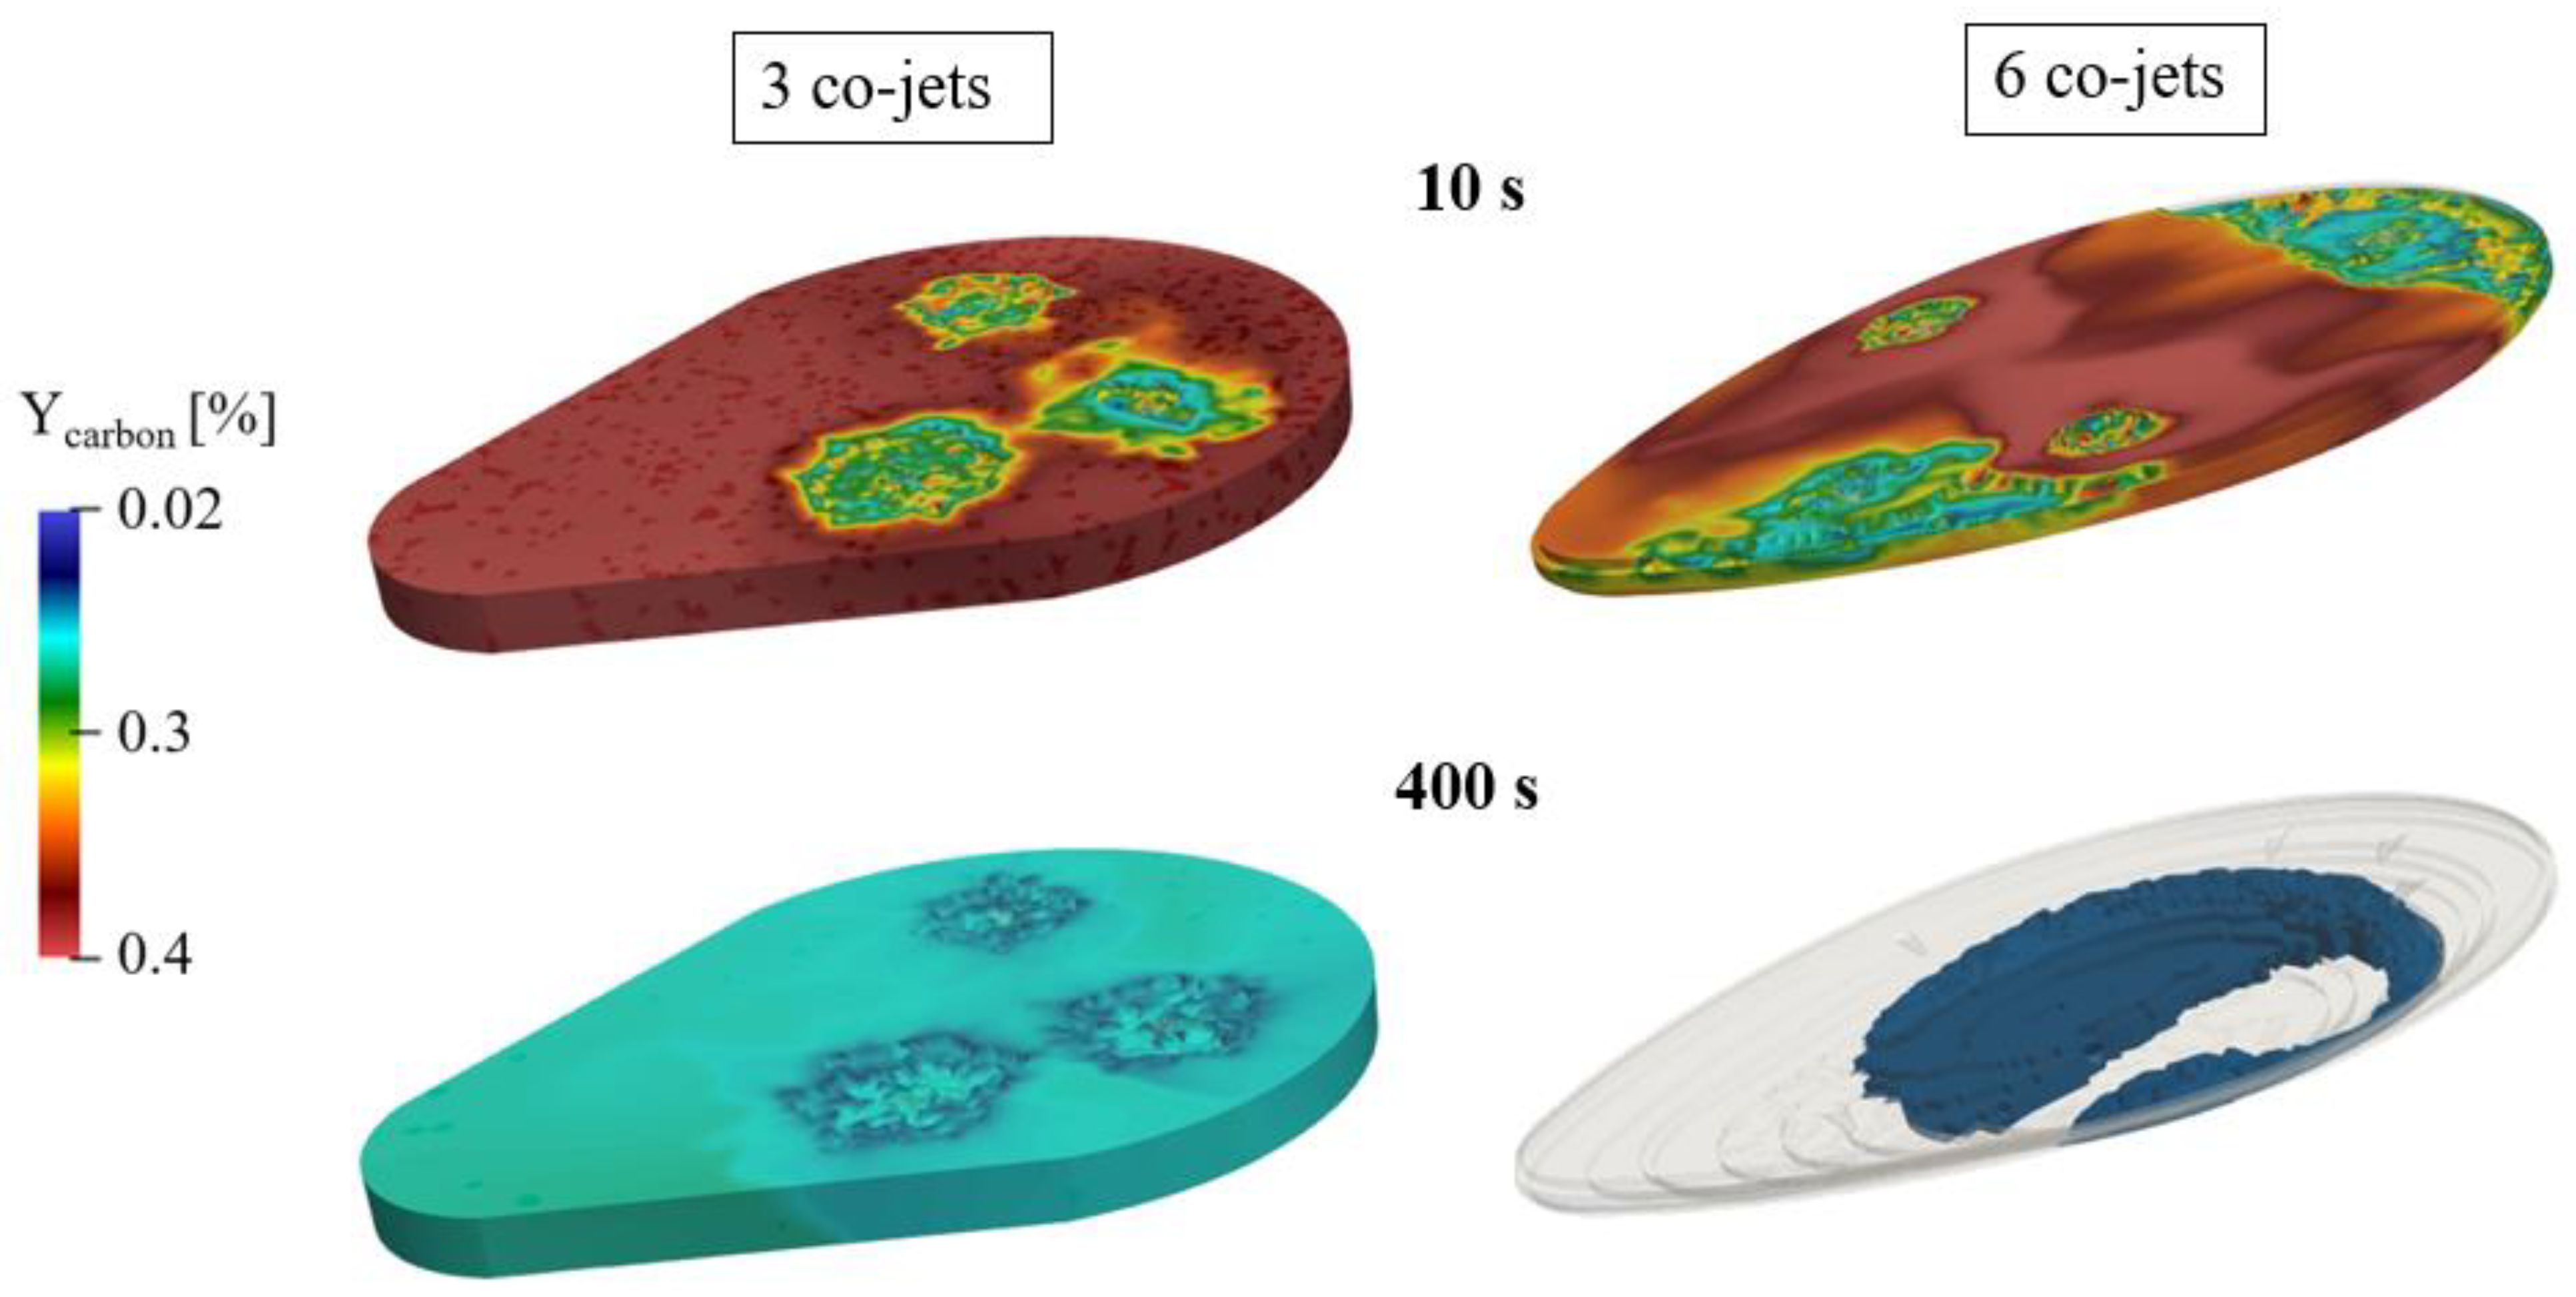
Figure 17 and Figure 18 illustrate the comparative refining performance between domains with three and six co-jet burners by showing decarburization progress and FeO generation over time. In Figure 17, the carbon distribution at 10 s and 400 s reveals that the six-co-jet configuration achieves faster and more uniform carbon removal across the molten steel bath. This is due to the broader spatial coverage and enhanced bath mixing provided by the additional burners. In contrast, the three-co-jet domain exhibits slower decarburization with higher residual carbon concentrations, especially at later stages.
Figure 18 presents the average FeO generation rate in both setups, highlighting that the six-co-jet domain produces more FeO, particularly near the burner impact zones, as a result of the higher total oxygen injection. While this configuration improves the refining speed, it also intensifies oxidation reactions, leading to increased FeO formation. These visualizations support the conclusion that increasing the number of burners enhances refining efficiency, but this must be balanced against the potential for higher FeO-related yield losses. Moreover, a review of the carbon injection and its reaction with FeO in slag and subsequent foaming efficiency will help to optimize the refining capability of the EAFs and reduce tap-to-tap time.

5.2.2. Improved Refining Performance

Next, the three-co-jet baseline configuration is compared with a modified six-co-jet setup where the oxygen injection rate in each co-jet is reduced to 930 SCFM, making the total oxygen injection 70% higher than the three-co-jet domain (Table 8). The goal is to evaluate whether the benefits of oxygen addition can be retained from an increased burner count while minimizing oxidation losses by lowering the overall oxygen input.
In the carbon plot in Figure 19, it is observed that the time to reach 0.1% carbon is 395 s in the reduced-O2 six-co-jet case—only slightly higher than the 385 s in the previous high-flow six-co-jet configuration, and still 32% faster than the 595 s required in the three-co-jet baseline. This shows that refining speed remains nearly the same, confirming that the increased number of burners plays a dominant role in accelerating decarburization through improved bath mixing and oxygen distribution.
However, the key improvement lies in FeO generation. At the time when each case reaches 0.1% carbon, the reduced-O2 six-co-jet setup generates only 257 kg of FeO, which is lower than the 285 kg produced in the previous high-oxygen six-jet case. This represents a noticeable reduction in FeO formation, with only 28.5% more FeO compared to the three-co-jet baseline, as opposed to 42.5% in the earlier case. At the beginning of the refining stage, carbon content is high, and oxygen primarily reacts with carbon to form CO. As carbon content lowers, decarburization is controlled by carbon transport in the bath, which favours FeO production. For this reason, lowering oxygen (while maintaining co-jets working within the Ma = 2–2.4 range) does not impact decarburization significantly as enough oxygen is still supplied, but it impacts FeO production occurring at later stages in the process.
This outcome shows a clear refining efficiency improvement. By increasing the burner count to six co-jets and reducing the oxygen injection rate, the refining time was maintained almost the same as the full-flow case while significantly lowering FeO generation. Therefore, this configuration offers a more balanced approach, retaining the speed of decarburization while minimizing oxidation losses, improving overall furnace performance.

6. Conclusions

This work investigated specific aspects of refining efficiency in electric arc furnaces (EAFs), focusing exclusively on decarburization and FeO generation by simulating and analysing the effects of varied oxygen injection rates and burner configurations. A CFD refining simulator was employed, consisting of three steps: a coherent jet model, cavity calculation, and an in-bath oxidation model.
The coherent jet simulation was carried out using pressure inlet boundary conditions, with inlet parameters derived from isentropic equations applicable to convergent–divergent nozzles. The jet exit Mach numbers were maintained within the industrially relevant range of 2.0–2.4, reflecting typical burner operating conditions.
The accuracy of the in-bath refining simulator was validated using experimental data from an industrial-scale oxygen-only refining trial conducted at EVRAZ NA, where the initial carbon content of the molten steel was 0.065%. The CFD simulation closely matched the experimental decarburization profile, achieving an error margin of only 8.57%. This validation demonstrated the simulator’s ability to reliably predict refining behaviour under realistic operating scenarios.
Following validation, the simulator was applied to model a more typical industrial condition, starting with an initial carbon content of 0.4%, while maintaining all other operational parameters identical to the EVRAZ trial. Subsequently, the model evaluated the effect of uniformly changing the oxygen injection rate. The results indicated that increasing the total oxygen flow by 10% reduced the carbon content by 5% but significantly increased FeO generation by 22%. Conversely, decreasing oxygen injection by 15% resulted in a 43% increase in residual carbon but lowered FeO generation by 23%. These findings highlight that higher oxygen flow rates yield diminishing returns in terms of decarburization while significantly escalating oxidation losses through FeO formation.
Additionally, the influence of burner configuration was assessed by comparing simulations of three and six co-jet furnaces. The furnace with six co-jet burners, along with an 85% increase in total oxygen flow, significantly improves the decarburization speed, reducing the time to reach 0.1% carbon by 35%; however, this enhancement comes with a notable trade-off—a 42.5% rise in FeO generation due to intensified oxidation reactions. In contrast, when oxygen flow per burner was reduced in the six-co-jet furnace, the bath achieved 0.1% target carbon content approximately 32% faster than the three-jet operation (and only slightly slower than the previous six-jet case), with only a moderate increase of 28.5% in FeO generation. This indicates that increasing the number of burners while simultaneously reducing the oxygen injection rate per burner can improve refining performance by accelerating decarburization without significantly raising FeO-related yield losses.
In conclusion, this work demonstrates that both oxygen injection rates and burner configurations substantially influence refining efficiency in EAF steelmaking. The validated CFD simulator—incorporating jet-induced cavity formation and detailed oxidation reactions within the liquid bath—provides a robust computational tool capable of optimizing oxygen delivery strategies, enhancing decarburization efficiency, and minimizing oxidation losses in industrial-scale refining operations.

Author Contributions

Conceptualization, S.K., O.U., T.O. and B.K.; methodology, S.K. and O.U.; software, S.K.; validation, S.K., O.U. and B.K.; formal analysis, S.K. and O.U.; investigation, S.K. and O.U.; resources, T.O. and C.Q.Z.; data curation, S.K. and O.U.; writing—original draft preparation, S.K.; writing—review and editing, S.K., O.U., T.O. and B.K.; visualization, S.K. and O.U.; supervision, O.U., T.O. and C.Q.Z.; project administration, T.O. and C.Q.Z.; funding acquisition, T.O. and C.Q.Z. All authors have read and agreed to the published version of the manuscript.

Funding

This research received no external funding.

Data Availability Statement

The data presented in this study is available on request from the corresponding author due to operation conditions considered in this study are proprietary to Industry partner. Data release needs to be authorized by the Steel Manufacturing Simulation and Visualization Consortium.

Acknowledgments

The author would like to thank the Steel Manufacturing Simulation and Visualization Consortium (SMSVC) for their support. Special thanks are also extended to the Center for Innovation through Visualization and Simulation (CIVS) for providing the tools and environment necessary to carry out this research and to the CIVS staff and students for their valuable guidance, assistance, and collaboration throughout the project.

Conflicts of Interest

Author Bikram Konar was employed by the EVRAZ North America. The remaining authors declare that the research was conducted in the absence of any commercial or financial relationships that could be construed as a potential conflict of interest.

References

  1. Wang, H.; Yu, H.; Teng, L.; Seetharaman, S. Evaluation on Material and Heat Balance of EAF Processes with Introduction of CO2. J. Min. Metall. Sect. B Metall. 2015, 52, 1–8. [Google Scholar]
  2. Banks, R.B.; Chandrasekhara, D.V. Experimental investigation of the penetration of a high-velocity gas jet through a liquid surface. J. Fluid Mech. 1963, 15, 13–34. [Google Scholar]
  3. Ishikawa, H.; Mizoguchi, S.; Segawa, K. A model study on jet penetration and slopping in the LD converter. ISIJ Int. 1972, 58, 76–84. [Google Scholar]
  4. Jones, J.; Safe, P.; Wiggins, B. Optimization of EAF operations through offgas system analysis. In Proceedings of the Electric Furnace Conference, Pittsburgh, PA, USA, 14–16 November 1999; Volume 57, pp. 459–480. [Google Scholar]
  5. Mathur, P.; Messina, C. Praxair CoJet™ technology–Principles and actual results from recent installations. AISE Steel Technol. 2001, 78, 21–25. [Google Scholar]
  6. Thongjitr, P.; Kowitwarangkul, P.; Pratumwal, Y.; Otarawanna, S. Optimization of oxygen injection conditions with different molten steel levels in the EAF refining process by CFD simulation. Metals 2023, 13, 1507. [Google Scholar] [CrossRef]
  7. Odenthal, H.J.; Kemminger, A.; Krause, F.; Sankowski, L.; Uebber, N.; Vogl, N. Review on modeling and simulation of the electric arc furnace (EAF). Steel Res. Int. 2018, 89, 1700098. [Google Scholar]
  8. Abraham, S.; Wang, Y.; Petty, R.; Sprague, T.; Franks, T.; Brown, E. Dynamic EAF Energy and Material Balance Model for On-Line Process Optimization. In Proceedings of the AISTech 2021—The Iron & Steel Technology Conference and Exposition, Nashville, TN, USA, 29 June–1 July 2021. [Google Scholar]
  9. Abadi, M.M.; Tang, H.; Rashidi, M.M. A review of simulation and numerical modeling of electric arc furnace (EAF) and its processes. Heliyon 2024, 10, e32157. [Google Scholar] [PubMed]
  10. Matsuura, H.; Manning, C.P.; Fortes, R.A.; Fruehan, R.J. Development of a decarburization and slag formation model for the electric arc furnace. ISIJ Int. 2008, 48, 1197–1205. [Google Scholar]
  11. Memoli, F.; Mapelli, C.; Ravanelli, P.; Corbella, M. Simulation of oxygen penetration and decarburisation in EAF using supersonic injection system. ISIJ Int. 2004, 44, 1342–1349. [Google Scholar]
  12. Wei, J.H.; Zhu, D.P. Mathematical modeling of the argon-oxygen decarburization refining process of stainless steel: Part I. Mathematical model of the process. Metall. Mater. Trans. B 2002, 33, 111–119. [Google Scholar]
  13. Anderson, J.E.; Farrenkopf, D.R. Coherent Gas Jet. U.S. Patent 5,823,762, 20 October 1998. [Google Scholar]
  14. Alam, M.; Naser, J.; Brooks, G. Computational fluid dynamics simulation of supersonic oxygen jet behavior at steelmaking temperature. Metall. Mater. Trans. B 2010, 41, 636–645. [Google Scholar]
  15. Alam, M.; Irons, G.; Brooks, G.; Fontana, A.; Naser, J. Inclined jetting and splashing in electric arc furnace steelmaking. ISIJ Int. 2011, 51, 1439–1447. [Google Scholar]
  16. Oltmann, H.; Pretorius, E.B.; Refractories, L.W.B. Simulation of the Refining Stage of the EAF Process. In Proceedings of the AISE Conference, Nashville, TN, USA, 30 September–2 October 2002. [Google Scholar]
  17. Szekely, J.; Asai, S. Decarburization of stainless steel: Part II. A mathematical model and a process optimization for industrial scale systems. Metall. Mater. Trans. B 1974, 5, 1573–1580. [Google Scholar]
  18. Ekmekçi, Ī.; Yetisken, Y.; Çamdali, Ü. Mass balance modeling for electric arc furnace and ladle furnace system in steelmaking facility in Turkey. J. Iron Steel Res. Int. 2007, 14, 1–6. [Google Scholar]
  19. Kirschen, M.; Pfeifer, H.; Wahlers, F.J.; Nirosta, T. Mass and energy balances of stainless steel EAF. In Proceedings of the 7th European Electric Steelmaking Conference, Venice, Italy, 26–29 May 2002; Volume 26, p. 29. [Google Scholar]
  20. Pfeifer, H.; Kirschen, M. Thermodynamic analysis of EAF energy efficiency and comparison with a statistical model of electric energy demand. In Proceedings of the 7th European Electric Steelmaking Conference, Venice, Italy, 26–29 May 2002; Volume 26, p. 1. [Google Scholar]
  21. Sano, M.; Mori, K. Fluid flow and mixing characteristics in a gas-stirred molten metal bath. Trans. Iron Steel Inst. Jpn. 1983, 23, 169–175. [Google Scholar]
  22. Ramírez, M.; Alexis, J.; Trapaga, G.; Jönsson, P.; McKelliget, J. Modeling of a DC electric arc furnace—Mixing in the bath. ISIJ Int. 2001, 41, 1146–1155. [Google Scholar]
  23. Björklund, J. Thermodynamic Aspects on Inclusion Composition and Oxygen Activity during Ladle Treatment. Doctoral Dissertation, KTH, Stockholm, Sweden, 2008. [Google Scholar]
  24. Sukmak, P.; Sukmak, G.; De Silva, P.; Horpibulsuk, S.; Kassawat, S.; Suddeepong, A. The potential of industrial waste: Electric arc furnace slag (EAF) as recycled road construction materials. Constr. Build. Mater. 2023, 368, 130393. [Google Scholar]
  25. Tang, G.; Chen, Y.; Silaen, A.K.; Krotov, Y.; Riley, M.F.; Zhou, C.Q. Investigation on coherent jet potential core length in an electric arc furnace. Steel Res. Int. 2019, 90, 1800381. [Google Scholar]
  26. Chen, Y.; Silaen, A.K.; Zhou, C.Q. 3D integrated modeling of supersonic coherent jet penetration and decarburization in EAF refining process. Processes 2020, 8, 700. [Google Scholar] [CrossRef]
  27. Ugarte, O.; Busa, N.; Konar, B.; Okosun, T.; Zhou, C.Q. Impact of Injection Rate on Flow Mixing during the Refining Stage in an Electric Arc Furnace. Metals 2024, 14, 134. [Google Scholar] [CrossRef]
  28. Fraser-Mitchell, A.H. Fundamentals of Aerodynamics, 5th ed.; Anderson, J.D., Ed.; McGraw-Hill: New York, NY, USA, 2011. [Google Scholar]
Figure 1. Domain of refining simulator.
Metals 15 00775 g001
Figure 2. Integration of refining simulator.
Metals 15 00775 g002
Figure 3. Stages of CFD refining model.
Metals 15 00775 g003
Figure 4. CFD simulation domain indicating jet impingement cavities.
Metals 15 00775 g004
Figure 5. Contours indicating the core length up to 50 nozzle diameters (De).
Metals 15 00775 g005
Figure 6. Decarburization in trial case showing linear carbon reduction.
Metals 15 00775 g006
Figure 7. Contours of liquid velocity w.r.t decarburization in slag door plane at 134 s.
Metals 15 00775 g007
Figure 8. Decarburization with typical initial carbon content.
Metals 15 00775 g008
Figure 9. Contours of decarburization in liquid bath.
Metals 15 00775 g009
Figure 10. FeO generation rate throughout refining.
Metals 15 00775 g010
Figure 11. Contours of FeO generation in liquid bath.
Metals 15 00775 g011
Figure 12. Decarburization w.r.t in-bath velocity in liquid bath.
Metals 15 00775 g012
Figure 13. Decarburization and FeO generation at 600 s.
Metals 15 00775 g013
Figure 14. Decarburization and FeO generation w.r.t oxygen injection at 900 s.
Metals 15 00775 g014
Figure 15. CFD domains with three co-jets and six co-jets showing similar geometrical configurations.
Metals 15 00775 g015
Figure 16. Decarburization and FeO generation evaluated at 0.1% C.
Metals 15 00775 g016aMetals 15 00775 g016b
Figure 17. Comparison of decarburization between 3-co-jet and 6-co-jet domains.
Metals 15 00775 g017
Figure 18. Average FeO generation in 3-co-jet and 6-co-jet domains.
Metals 15 00775 g018
Figure 19. Decarburization and FeO generation evaluated at 0.1% C.
Metals 15 00775 g019
Table 1. Boundary conditions of the domain.
SurfaceTypeEquation
Top, Side, and BottomAdiabatic,
no-slip wall
dT/dx = 0,
u = 0, v = 0, w = 0
Table 2. Comparison between theoretical and CFD results of coherent jet.
ApproachVelocity (m/s)SCFM
Theory521.21288
CFD513.71260
Difference1.45%2.2%
Table 3. EVRAZ operation conditions for refining simulations.
ParametersValue
Co-jet quantity3
Steel liquid temperature1838 K (1565 °C)
Initial carbon content [%]0.065
Oxygen rates [SCFM]Burner 1:1150, Burner 2:930, Burner 3:1210
Table 4. Comparison between final C after 134 s of experiment and CFD results of refining simulation.
ApproachValue
Experiment0.056
Simulation0.0512
Difference8.57%
Table 5. Injection parameters of cases considered in this study.
Oxygen Injection [SCFM]
CasesBurner 1Burner 2Burner 3Total
1115093012103290
21210121012103630
39309309302790
Table 6. Parameters comparing three co-jets and six co-jets domain.
Co-Jets36 (1 Door Lance)
Initial Carbon %0.400.41
Initial Temp (K)18381850
Mass Metal (t)140139
O2 inj. (SCFM) “baseline”B1: 1150, B2: 930, B3: 1210B1–B6:1000
Total SCFM32906000
Table 7. Comparing baseline cases for three-co-jet- and six-co-jet domain.
CasesO2 (SCFM)Time to Reach
0.1%C (s)
FeO Gen
@0.1%C (kg)
3 co-jets3290595200
6 co-jets6000385285
Diff85%−35%42.5%
Table 8. Comparison of three co-jet baseline cases and six co-jet reduced O2 cases.
CasesO2 (SCFM)Time to Reach
0.1%C (s)
FeO Gen
@0.1%C (kg)
3 co-jets3290595200
6 co-jets5580395257
Diff70%−32%28.5%
Disclaimer/Publisher’s Note: The statements, opinions and data contained in all publications are solely those of the individual author(s) and contributor(s) and not of MDPI and/or the editor(s). MDPI and/or the editor(s) disclaim responsibility for any injury to people or property resulting from any ideas, methods, instructions or products referred to in the content.