Abstract
This paper deals with “Zn-19Al-6Mg” coatings and their solidification structure is the basis for the study of the alloy’s properties. The solidification equilibrium phase diagram of this alloy was calculated using thermodynamic software. Samples were taken from the billets of this alloy for differential thermal analysis experiments. By combining the phase diagram and the experimental results of differential thermal analysis, the solidification structure of the Zn-19Al-6Mg alloy was obtained. The phases in the solidified structure were identified by means of SEM, EDS, XRD, etc. The research finds that the solidification structure of the Zn-19Al-6Mg alloy is composed of the β-Al phase, the α-Al phase, the MgZn2 phase, and the Mg2Zn11 phase. During the actual solidification process of the alloy, due to the large cooling rate, Zn-rich phases will appear in the microstructure. The research results provide a basis for the regulation of the coating structure when preparing Zn-19Al-6Mg-coated sheets and strips.
1. Introduction
With the gradual expansion of the application fields of metals, the demand for highly corrosion-resistant strip steel products at the application end is gradually increasing [1,2,3]. By adding a coating on the surface of the steel strip through hot-dip galvanizing, the contact between the steel strip and the oxidizing media can be isolated, thereby extending the service life of the metal [4,5,6,7]. Zn was the earliest coating material used in hot-dip galvanizing. With the gradual deepening of research on coating alloys, researchers have found that adding a certain amount of Al and Mg elements to Zn can increase the corrosion resistance of pure Zn coatings by 5 to 10 times [8,9,10]. After continuous research and development, a series of zinc–aluminum–magnesium coating alloy products for the hot-dip galvanizing process of metals have gradually emerged.
Due to the excellent corrosion resistance of zinc–aluminum–magnesium alloy coatings, zinc–aluminum–magnesium alloy-coated products are widely used in fields such as highway guardrails, photovoltaic brackets, and automotive structural components [11,12,13]. At present, the most widely used zinc–aluminum–magnesium alloys are low-aluminum zinc–aluminum–magnesium alloys, Zn-6Al-3Mg and Zn-11Al-3Mg alloys [8,14,15,16,17]. The Zn-19Al-6Mg alloy is a new type of thin strip coating alloy. Steel plates with Zn-19Al-6Mg coatings began commercial production one after another in 2021. The application of this coating marks that the development of hot-dip galvanized steel plates with high corrosion-resistance coatings has entered a new stage. At present, researchers from Japan, the Republic of Korea, and other countries have gradually applied this type of steel strip with a Zn-19Al-6Mg coating in the photovoltaic industry, highway guardrails, agriculture, and other fields. Its corrosion resistance is superior to the currently available Zn-6Al-3Mg and Zn-11Al-3Mg alloys on the market, and its application prospects are very broad [18,19,20]. Scientific researchers have carried out relevant studies on its microstructure and corrosion resistance after hot-dip galvanizing. For example, Mr. Li et al. prepared Zn-19Al-6Mg coatings using a galvanizing simulator and studied the microstructure of the coatings, obtaining the conclusion that the coating structure was composed of aluminum-rich phase, zinc-rich phase and MgZn2 phase [20].
However, during the hot-dip galvanizing process of the Zn-19Al-6Mg coating, due to the high content of Mg and Al in the Zn-19Al-6Mg alloy, hot-dip galvanizing is rather difficult, and surface defects such as missed galvanizing often occur. Moreover, the difficulty of organizational regulation is even greater. Even minor fluctuations in the process will cause significant differences in the organization. Specifically, the cooling rate of the surface coating of the substrate after hot-dip galvanizing has a greater impact on the microstructure. The difference in the cooling rate will cause significant variations in the coating structure. Different structures will exhibit considerable differences in corrosion resistance, which in turn leads to different service lives of the sheet and strip. In order to prepare Zn-19Al-6Mg-coated sheets and strips with excellent and stable corrosion resistance, it is necessary to regulate the microstructure of the Zn-19Al-6Mg alloy coating. The original solidification structure of the Zn-19Al-6Mg alloy is the basis for regulating the structure of the Zn-19Al-6Mg alloy after the formation of the coating. After clarifying the original solidification structure of the Zn-19Al-6Mg alloy, the phases and their phase contents in the coating structure can be regulated by using the hot-dip plating process according to the requirements of the final corrosion resistance. In order to enable the Zn-19Al-6Mg-coated alloy to be widely applied and to make this coated steel strip meet the requirements of the end of the application as much as possible, in this paper, the solidification equilibrium phase diagram of the alloy was calculated using thermodynamic software. Samples were extracted from the billet of the alloy for differential thermal analysis experiments. Combined with the phase diagram and the experimental results of differential thermal analysis, the solidification structure of the Zn-19Al-6Mg alloy was obtained. Meanwhile, the phases in the solidification structure were identified by means of SEM, EDS, XRD, etc. The research finds that the solidification structure of the Zn-19Al-6Mg alloy is composed of the β-Al phase, the α-Al phase, the MgZn2 phase, and the Mg2Zn11 phase. The research results can provide a certain theoretical basis for the regulation of a coating microstructure during the industrial production of a Zn-19Al-6Mg alloy.
2. Experiment
2.1. Thermodynamic Calculation
Thermo-Calc thermodynamic software is a powerful thermodynamic calculation software and has now become a standard tool in many fields such as material thermodynamic analysis [21,22]. It is based on thermodynamic calculations and, through the built-in thermodynamic database and calculation model, can predict the phase diagram and thermodynamic properties of materials. In the process of this study, Thermo-Calc thermodynamic software (the version number is 2023A) was first applied to calculate the temperature-varying phase diagram of the Zn-Al-Mg alloy. The specific operation steps are as follows:
- (1)
- Selection of modules and databases: For the variable-temperature phase diagram of the Zn-xAl-yMg ternary alloy, the “phase diagram” module is selected. After entering the module, the “TCAl7.1” database is used for calculation. The determination of the database represents the determination of the phase diagram calculation model, and then the calculation parameters can be set.
- (2)
- Parameter setting: When calculating the phase diagram, ensure that the degrees of freedom are 0. For the temperature-varying phase diagram of the Zn-Al-Mg ternary alloy, it is necessary to set its component content, temperature, pressure, and molar mass. The Zn-Al-Mg ternary alloy is based on Zn. However, since the database “TCAl7.1” is an Al-based alloy database, when setting the component content, the two elements Zn and Mg are determined. Then, through the function x·ω(Mg) − y·ω(Al) = 0, the contents of Al and Mg elements are correlated, and the temperature, pressure, and molar mass are set. After setting the initial conditions, the parameters in the phase diagram, their variation ranges, and their step sizes are set, and finally the phase diagram calculation is carried out.
- (3)
- Phase diagram optimization: For variable-temperature phase diagrams, after obtaining the complete phase diagram through software calculation, the coordinate axes of the phase diagram are selectively truncated and the microstructure is calibrated based on the alloy composition under study.
- (4)
- Phase diagram output: Save the obtained phase diagram to the computer.
2.2. Induction Melting Furnace Smelting Zn-19Al-6Mg Alloy
The experimental materials are refined by melting pure Zn, Al, and Mg. Cut, clean, and dry the raw materials to ensure that the raw materials are free of impurities. The coating is prepared with 25 wt% talc (Guilin Guiguang Talcum Powder Company, Guangxi, China), 6 wt% water glass (Shandong Jinghuo Technology Co., LTD., Linyi, China), and 69 wt% water, and the surfaces of the melting crucible, agitator, and mold are repeatedly coated until the surfaces are no longer cracked after drying to facilitate casting and release. Heat the crucible and mold to 150 °C, hold for 60 min to preheat; put the preheated crucible into the medium frequency induction furnace to heat (Tuoda Medium Frequency Induction Furnace, Suzhou City, Jiangsu Province, China), add one-third of the treated zinc ingots, add the aluminum alloy and magnesium alloy after the zinc ingots are completely melted, and then add the remaining two-thirds of the zinc ingots into the crucible, add the metal raw materials, and pour the appropriate amount of flux, including the covering agent and the refining agent. The melting point of the covering agent is lower than that of the metal to be melted, and it has a certain surface tension. After melting, it can cover the surface of the metal melt to isolate the air. In order to prevent the metal from oxidizing during melting, it is necessary to protect the metal melt with a covering agent. The refining agent achieves the purpose of refining the melt by wetting and absorbing impurity elements. In the process of Zn-Al-Mg alloy smelting in this experiment, the volatilized zinc vapor can play a certain refining role instead of the refining agent, so only a small amount of refining agent is needed in this smelting. After the metal material in the crucible is completely melted, stir the molten liquid with a mixer for 10 min, keep warm for 10 min, and repeat 2 times to make the molten liquid uniform; the surface scum is salvaged, the temperature of the liquid metal is measured with an infrared temperature gun, and the liquid metal is poured into the preheated rod-like mold at about 550 °C. In order to make the actual solidification conditions closer to the equilibrium solidification conditions, air cooling was adopted to cool to room temperature to obtain the Zn-19Al-6Mg alloy required for the experiment. The zinc–aluminum–magnesium alloy used in the experiment was melted in a 10 kg induction melting furnace. After Zn-19Al-6Mg melting, the alloy was cast into rod-shaped specimens for subsequent experiments. After smelting, the composition of the alloy was tested, and the test results are shown in Table 1.

Table 1.
Composition of the experimental alloy.
2.3. A Test Block Was Cut in the Middle of the Bar Zn-19Al-6Mg Alloy Sample, and DSC Differential Thermal Analysis Experiment Was Carried out
Molybdenum wire cutting method was used to cut the sample of φ3 × 0.5 mm on the edge of the ingot, and the surface of the sample was polished with 1500# water sandpaper to remove the wireline cutting traces and ensure the smooth surface of the sample. The sample thickness after polishing is 0.3 mm. The sample was put into acetone (Sinopharm Group, Beijing, China), the surface was washed with ultrasonic shock to remove the oil, then it was put in anhydrous ethanol ultrasonic cleaning for 5 min, and after this, the sample was taken out and dried. After drying, the sample was placed in the DSC25 differential scanning calorimeter (Q2000 Differential Scanning Calorimetry, TA Company, New Castle, DE, USA). Under dynamic argon purge conditions, it was heated to 500 °C at a rate of 10 K/min and held for 10 min. Then, it was cooled to 200 °C at a cooling rate of 5 K/min to obtain the differential thermal analysis curve.
2.4. Microstructure Observation and EDS Analysis of Zn-19Al-6Mg Alloy
When preparing metallographic samples, first use a molybdenum wire cutter to cut samples of an appropriate size on the rod-shaped ingot. The sampling position should be controlled at the center of the rod-shaped ingot. The metallographic sample is a cubic sample with dimensions of 10 mm × 10 mm × 10 mm. The surface of the metallographic sample is ground with 240#-600#-1000#-1500#-2000#-3000# sandpaper, respectively. After there are no obvious scratch marks, the sample is finely polished on a polishing cloth with a polishing cloth. After no polishing marks can be observed under an optical microscope, the sample is placed in anhydrous alcohol for 60 s, and the polished surface of the sample is corroded with 2% nitric acid alcohol. Then the sample is cleaned with anhydrous alcohol. After drying, the microstructure of the sample was observed using a GeminiSEM500 field emission scanning electron microscope (SEM, Zeiss, Oberkochen, Germany), and then EDS tests were conducted using energy dispersive spectroscopy. XRD can identify phases in tissues based on the principle that different phases have distinct crystal structures, thereby generating specific diffraction patterns [23]. It is an important method for identifying phases in material analysis. Therefore, XRD tests were finally conducted on the samples. During the sample testing process, the 2θ angle was set from 10° to 100°, the scanning speed was 0.5°/min, the scanning step size was 0.03°, the tube voltage was set at 40 kV, and the tube current was set at 20 mA. The experimental data of XRD were processed accordingly. The information such as the 2θ angle and the relative intensity of the diffraction peaks of the samples obtained after processing was compared with the diffraction data of the standard phases in the database to draw peak plots and conduct phase identification.
3. Experimental Results and Analysis
3.1. Calculation and Analysis of Phase Diagram of Zn-19Al-6Mg-Coated Alloy
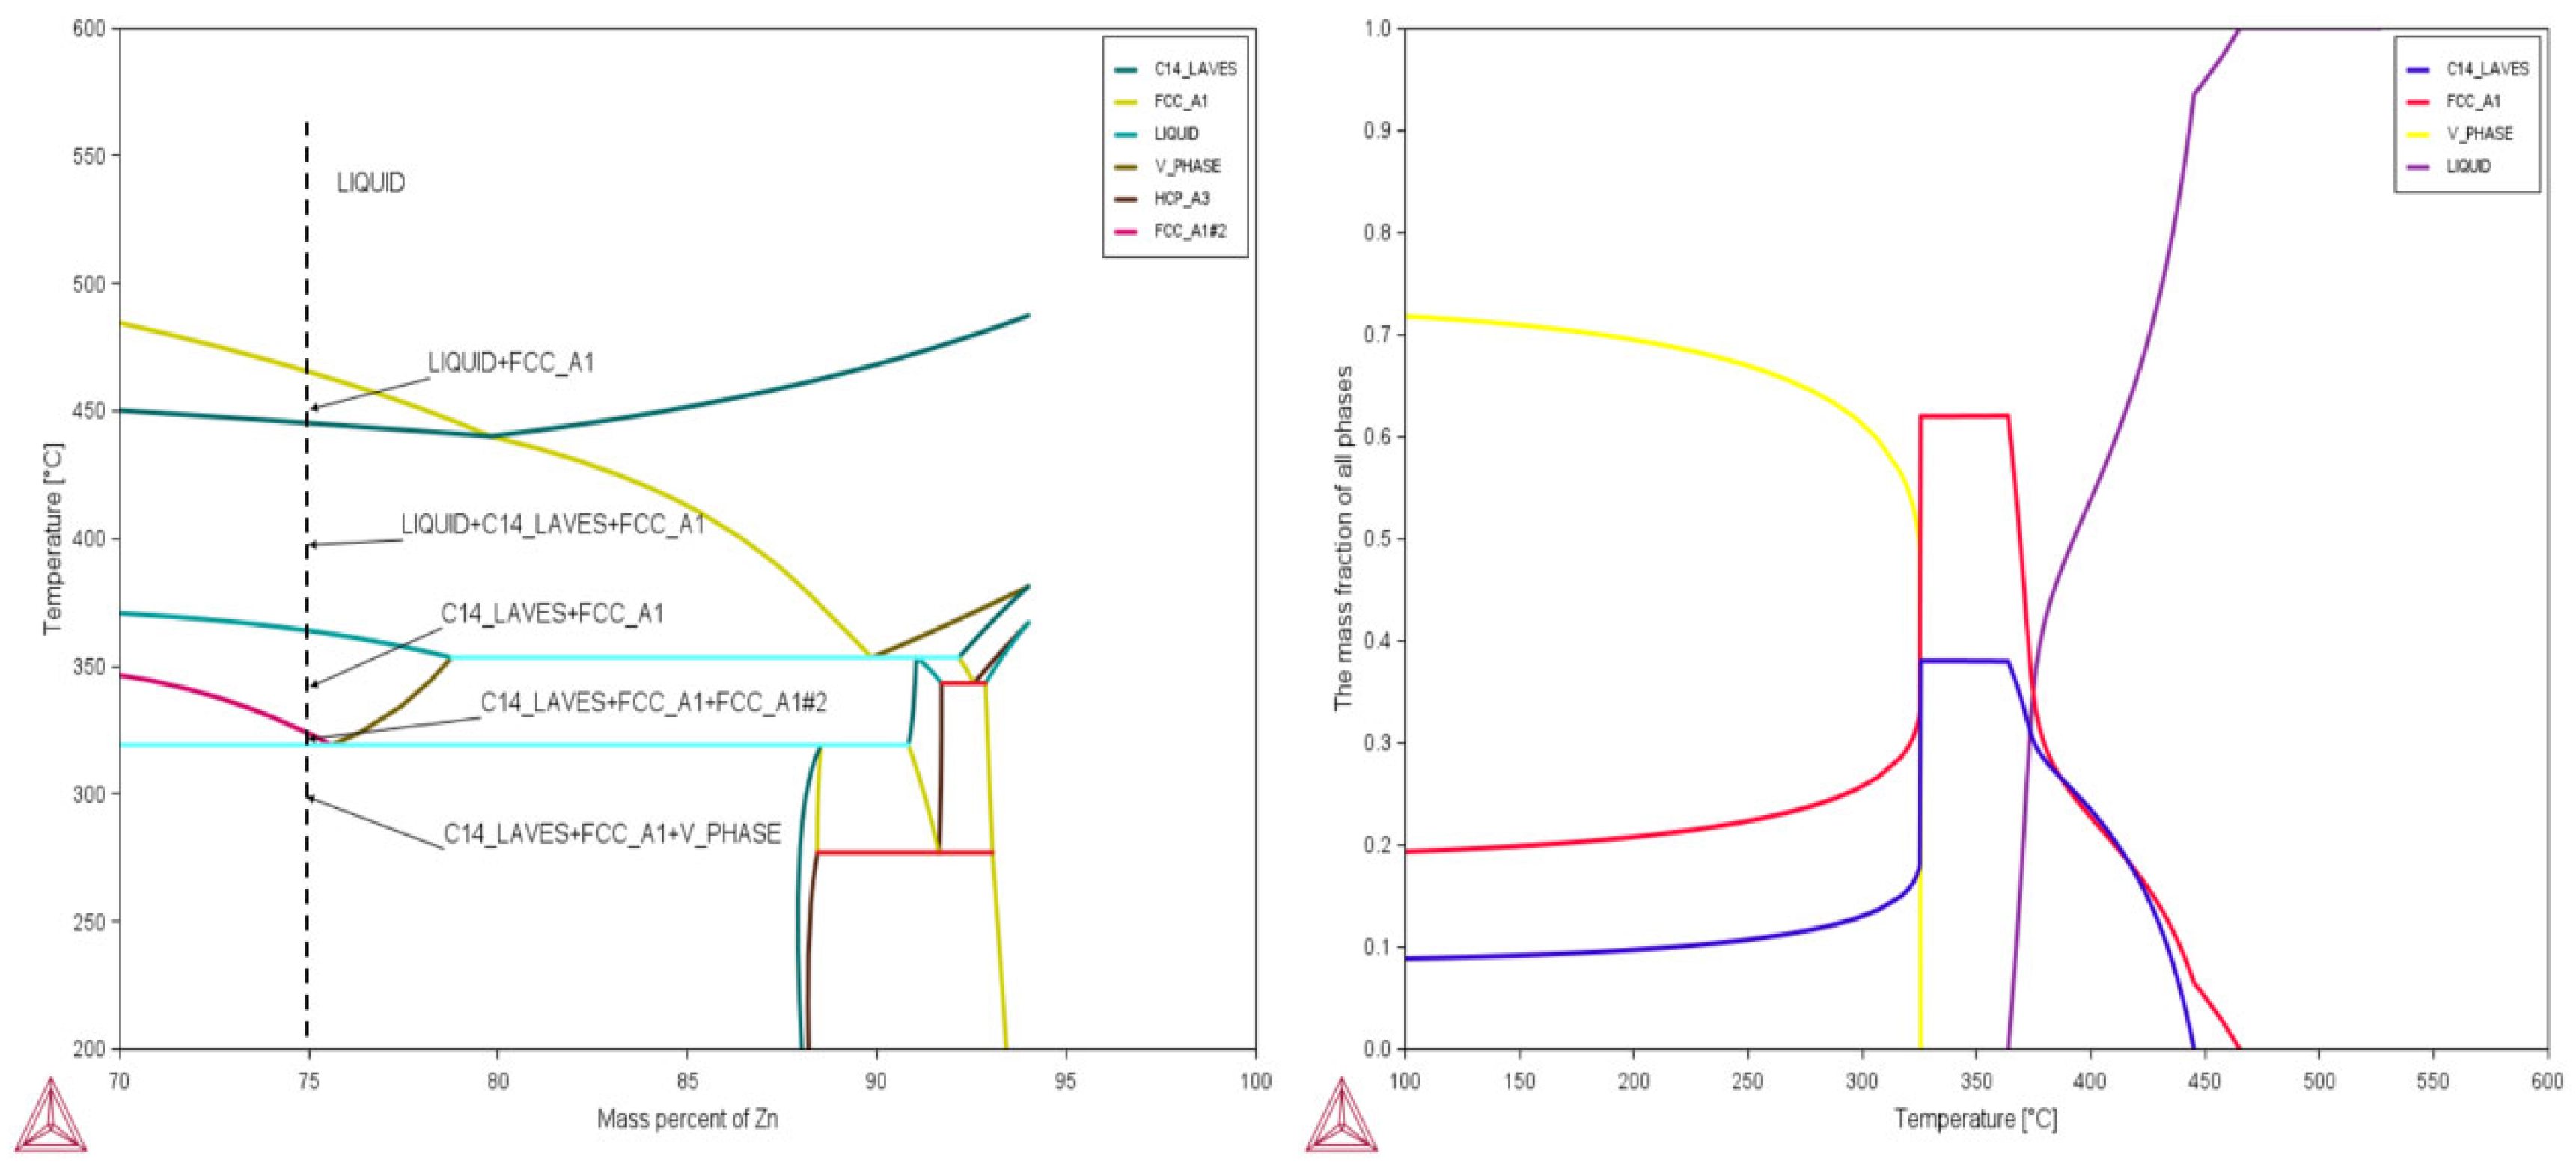
The equilibrium phase diagram of the Zn-19Al-6Mg-coated alloy was obtained using thermal-calc thermodynamic software, as shown in Figure 1. For the convenience of analysis, a vertical and horizontal line was drawn at the position where the Zn content was 75%. This line represents the Zn-19Al-6Mg-coated alloy. By analyzing this line from top to bottom, the solidification path of the Zn-19Al-6Mg-coated alloy can be obtained. It can be seen from the picture. The liquidus temperature of the alloy is 459 °C and the solid phase temperature is 364 °C.
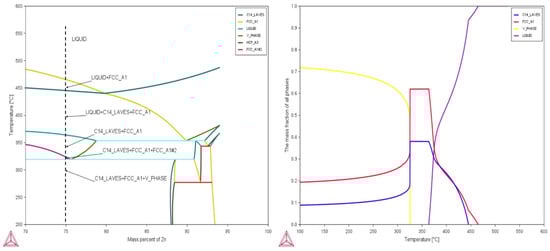
Figure 1.
Zn-19Al-6Mg vertical section phase diagram, and phase mass fraction ratio diagram.
The high-temperature liquid Zn-19Al-6Mg coating alloy began to solidify when the temperature was reduced to 459 °C, and the primary β-Al phase (FCC_ Al) began to precipitate in the liquid phase. At 445 °C, the MgZn2 phase (C14_LAVES) was precipitated from the liquid phase, and the contents of the primary β-Al phase (FCC_ Al) and MgZn2 phase (C14_LAVES) increased with the continuous decrease in temperature. At 364 °C, the liquid phase disappeared and solidified completely, and the solidified structures were the β-Al phase and the MgZn2 phase.
At 325 °C, β-Al→α-Al+ Zn isomeric phase transition occurs, and the primary β-Al phase transforms into the α-Al phase and Zn. The primary Al-rich phase has a large number of Zn atoms in solid solution. With the decrease in temperature, the solid solubility of Zn in the primary β-Al phase gradually decreases, and Zn atoms are gradually precipitated. The β-Al phase causes the change in the lattice constant due to the precipitation of Zn, and the isomeric transformation occurs, forming the secondary α-Al phase.
Subsequently, at 318 °C, the precipitated Zn forms the Mg2Zn11 phase with the MgZn2 phase, which gradually increases and decreases. At room temperature, MgZn2, aluminum-rich, and Mg2Zn11 phases were formed.
3.2. Verification of Thermodynamic Calculation Results
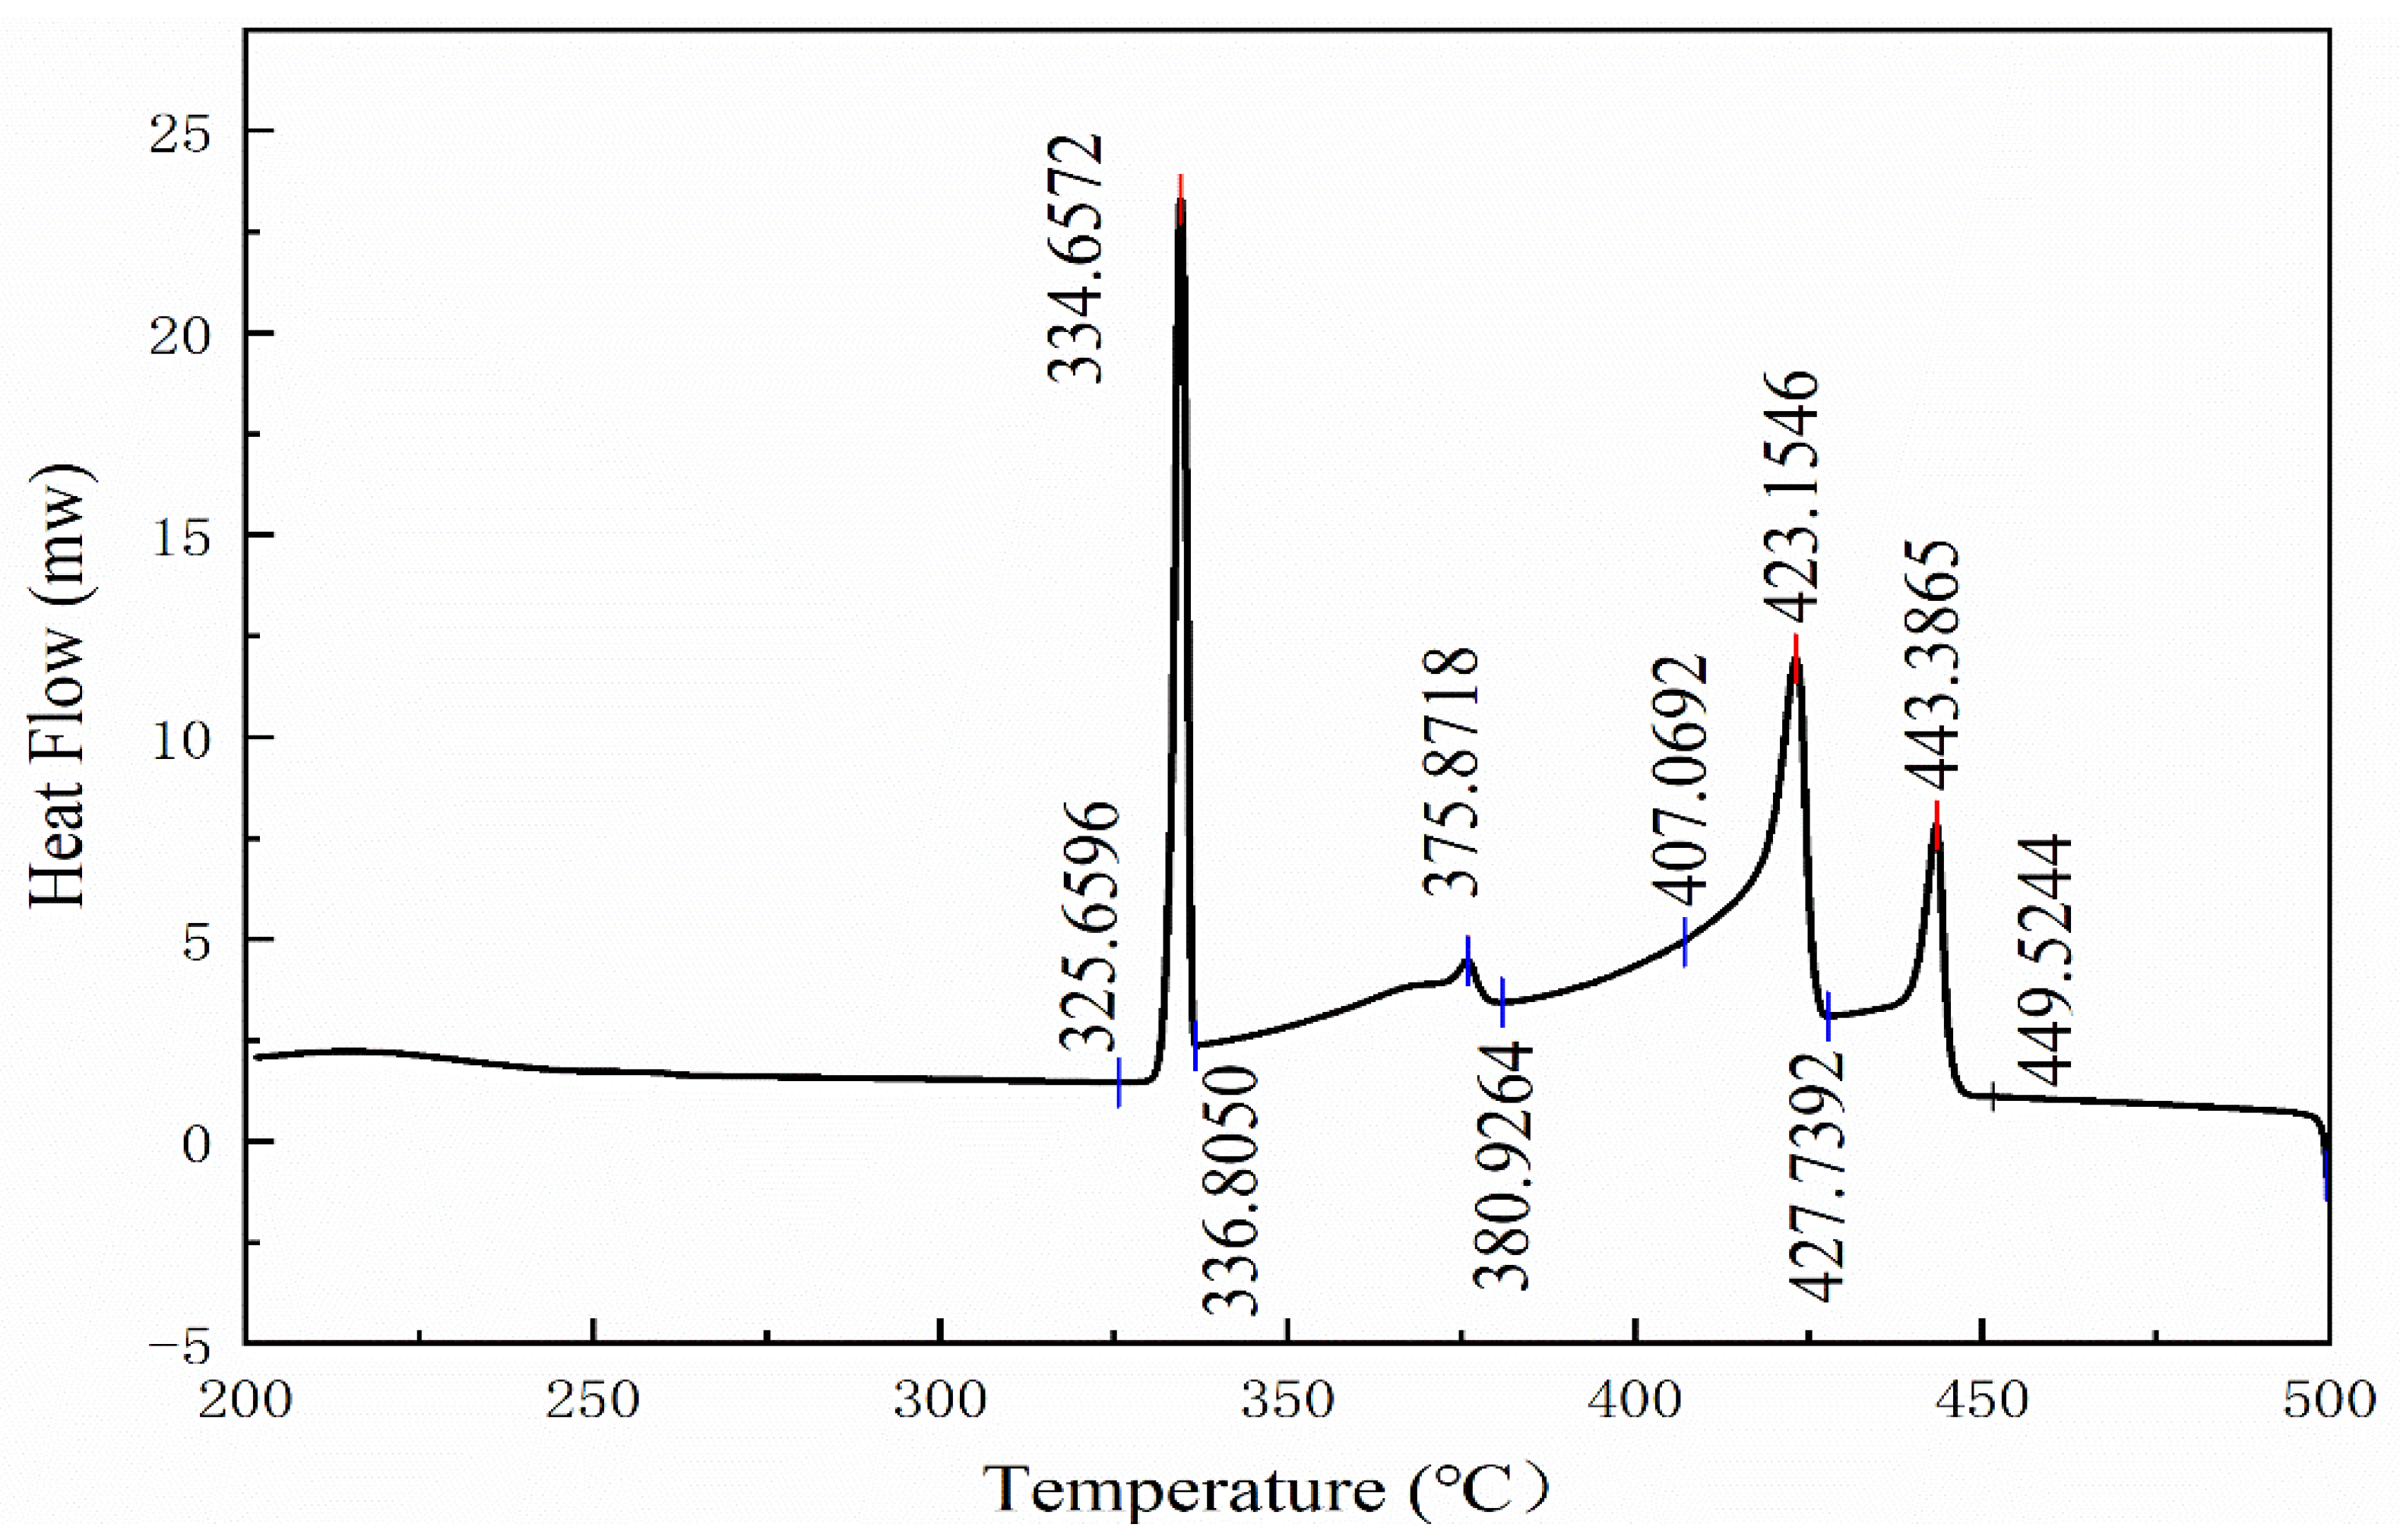
The experimental results of DSC are shown in Figure 2. The results show that there are four phase transitions during the actual solidification of the alloy. The number of phase transitions is consistent with the information reflected in the phase diagram. According to the solidification path information obtained in the phase diagram, it can be seen that during the actual solidification process, the solidification begins at 449.5 °C, and the primary β-Al phase (FCC_ Al) begins to precipitate in the liquid phase. At 427.7 °C, the MgZn2 phase (C14_LAVES) was precipitated from the liquid phase. At 380.9 °C, the β-Al→α-Al + Zn solid phase transition occurs, and the primary β-Al phase transforms into the α-Al phase and the Zn-rich phase. At 336.8 °C, the precipitated Zn forms the Mg2Zn11 phase with the MgZn2 phase.
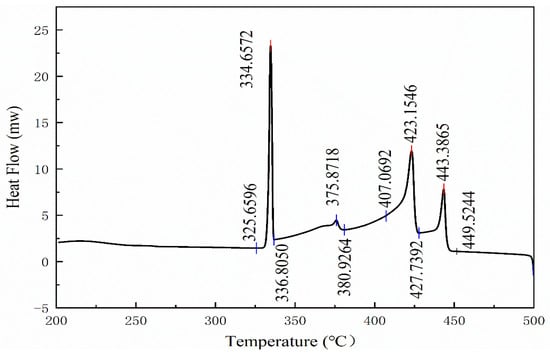
Figure 2.
Results of differential thermal analysis of Zn-19Al-6Mg alloy.
However, the phase transition temperature predicted by the phase diagram is different from that in the actual solidification process. During the first phase transformation, the temperature predicted by the phase diagram is 9.5 °C higher than the actual solidification temperature. During the second phase transition, the temperature predicted by the phase diagram is 17.3 °C higher than the actual solidification, and the reason for the difference is the hysteresis during the metal phase transition. During the phase transition, due to the time required for nucleation and the certain degree of supercooling required by the phase deformation nucleus, the actual phase transition often lags behind the phase transition temperature. This is the same as the mechanism of Ar3 and Ar1 in the classical Fe-C phase diagram analysis.
During the third phase transition, the temperature predicted by the phase diagram is 55.9 °C lower than the actual temperature, and during the fourth phase transition, the temperature predicted by the phase diagram is 18.8 °C lower than the actual temperature. As shown in the phase diagram in Figure 1, the third primary β-Al phase changes instantaneously to the α-Al phase and Zn-rich phase at 325 °C, and then MgZn2 reacts with the Zn-rich phase to form the Mg2Zn11 phase. However, the solid-state phase transition of β-Al→α-Al + Zn occurs due to the decrease in the solid solubility of Zn in the primary β-Al phase due to the decrease in temperature, which is a diffusion process. At the high temperature of 380.9 °C, diffusion has begun to occur. After the formation of the primary β-Al phase and MgZn2 phase, when the temperature drops to 380.9 °C, the content of Zn in the primary β-Al phase has begun to exceed the solid solubility of Zn in the primary β-Al phase, and Zn atoms begin to precipitate. The β-Al phase precipitates Zn and becomes the α-Al phase with a slightly different composition. At the beginning of the diffusion of Zn, the β-Al phase precipitates Zn into the α-Al phase with a slightly different composition, and the heat flow difference generated in this change process has been detected by the thermal analyzer to form a peak value. This is the reason why there is a gap between the temperature information shown in the phase diagram and the information read in the DSC experimental results, resulting in the third phase transition temperature obtained in the DSC being higher than the calculated temperature in the phase diagram.
The results of the differential thermal analysis experiment reveal that the equilibrium phase diagram of the Zn-19Al-6Mg alloy obtained through thermodynamic calculation can reflect the solidification path of the alloy. The phase diagram can guide scientific researchers in predicting the solidification structure of the alloy.
3.3. Observation and Analysis of Microstructure of Zn-19Al-6Mg Coating Alloy
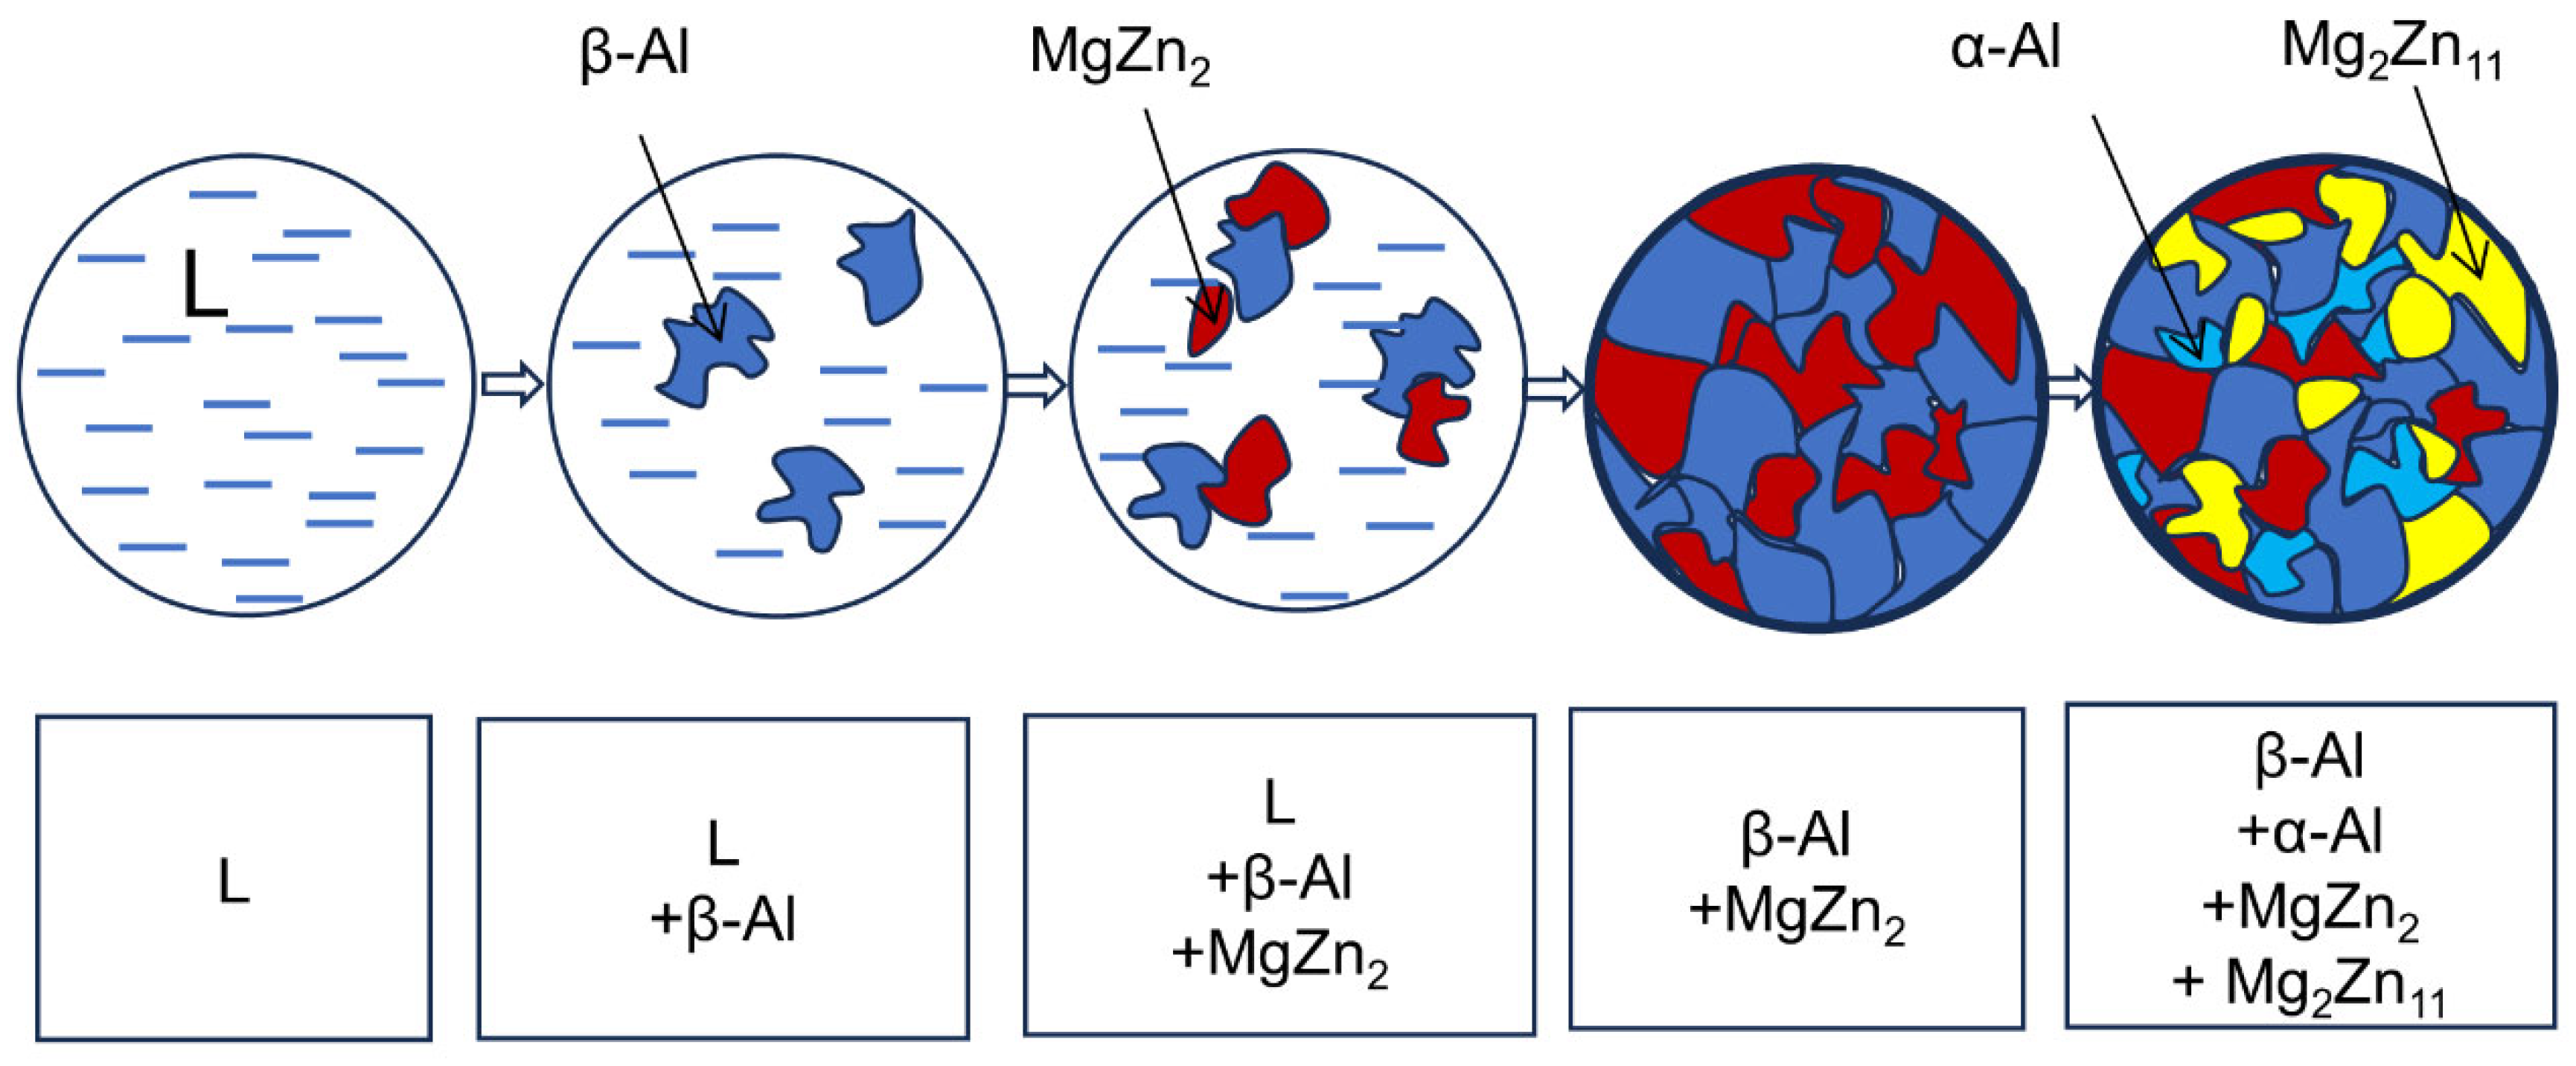
In order to more clearly characterize the formation process of the Zn-19Al-6Mg alloy from high-temperature liquid to the final solidification structure, based on the analysis results of the solidification path of the Zn-19Al-6Mg alloy at (Mass percent of Zn is 75) in the phase diagram of Figure 1, the formation diagram of the equilibrium structure of the alloy was drawn, as shown in Figure 3.

Figure 3.
Schematic diagram of the solidification process of the Zn-19Al-6Mg alloy.
According to the analysis and prediction of the solidification process of the Zn-19Al-6Mg alloy in phase diagram, it can be seen that the β-Al phase, α-Al phase, MgZn2 phase, and Mg2Zn11 phase will be formed after the solidification of Zn-19Al-6Mg alloy. The formation path is L→β-Al→β-Al + MgZn2→MgZn2 + β-Al + α-Al + Mg2Zn11.
Figure 4 shows the microstructure of the refined Zn-19Al-6Mg alloy in the laboratory and its EDS test results. For the convenience of characterization, we marked the morphological differences in the combined phases and the contrast differences between different phases, as shown in the positions of Points 1 to Point 7 in Figure 4. Meanwhile, combined with the organizational composition predicted by the phase diagram, the phases in the actual organization were identified.
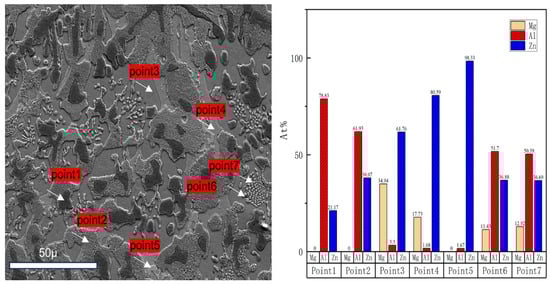
Figure 4.
The microstructure of the Zn-19Al-6Mg alloy and its EDS test results.
The detection results of the EDS spectra combined with each feature were analyzed. At Point 1, the atomic percentage of aluminum is as high as 78.83%, Mg is 0, and the rest is Zn. The phase judgment can be obtained by combining the phase diagram to predict the structure, and this is the primary β-Al phase. The atomic percentage of aluminum at Point 2 is 61.93%, Mg is 0, and the rest is Zn, which is also an aluminum-rich phase. The phase at Point 2 with a low aluminum content is obtained by combining the phase diagram to predict the phase in the structure, and it is judged that this phase is the α-Al phase formed by the precipitation of Zn from the primary β-Al phase during the phase transformation process. At Point 3, the atomic percentage of magnesium is 34.94% and that of zinc is 62.24%, which is close to the atomic percentage of MgZn2 1:2, so this type of phase is the MgZn2 phase. The atomic percentage of magnesium at Point 4 is 17.73% and that of zinc is 80.59%. The composition of this phase is very different from that of MgZn2 at Point 3, and the atomic percentage here is closer to that of Mg2Zn11 2:11, so it is judged that this phase is the Mg2Zn11 phase. At Point 5, the atomic percentage content of zinc is 98.33%, Mg is 0, and the rest is Al. This type of phase is a Zn-rich phase. Point 6 and Point 7 are typical eutectic structure features, and it is found through energy spectrum detection that this region simultaneously contains Al, Mg, and Zn elements, while Mg exists only in the form of the MgZn2 phase and the Mg2Zn11 phase in the alloy. Based on the analysis of the atomic percentage content of magnesium in this region, Mg in this region can only exist in the form of the MgZn2 phase, and the components of other components are close to those of the β-Al phase. In the phase diagram analysis, it is found that only when MgZn2 and β-Al increase simultaneously are the conditions for eutectic structure formation available. Therefore, it can be determined that Point 6 and Point 7 are binary eutectic structures formed by the β-Al phase and MgZn2 phase.
Comparing the actual microstructure of the Zn-19Al-6Mg alloy with the equilibrium microstructure predicted by the phase diagram, it is found that the actual microstructure has a more Zn-rich phase than that predicted by the phase diagram. The main reason for the appearance of a Zn-rich phase is that during the actual cooling process of the Zn-19Al-6Mg alloy, an α-Al phase with a slightly different composition is formed due to the precipitation of Zn in the primary β-Al phase in the solidification structure, which is caused by the diffusion of Zn, and the diffusion in the solid state takes time, due to the rapid cooling rate in the actual transformation process. The diffusion of Zn was not fully carried out, and the precipitated Zn could not completely enter the MgZn2 phase to transform into the Mg2Zn11 phase, resulting in the accumulation of Zn in some areas of the actual solidified structure and the formation of the Zn-rich phase.
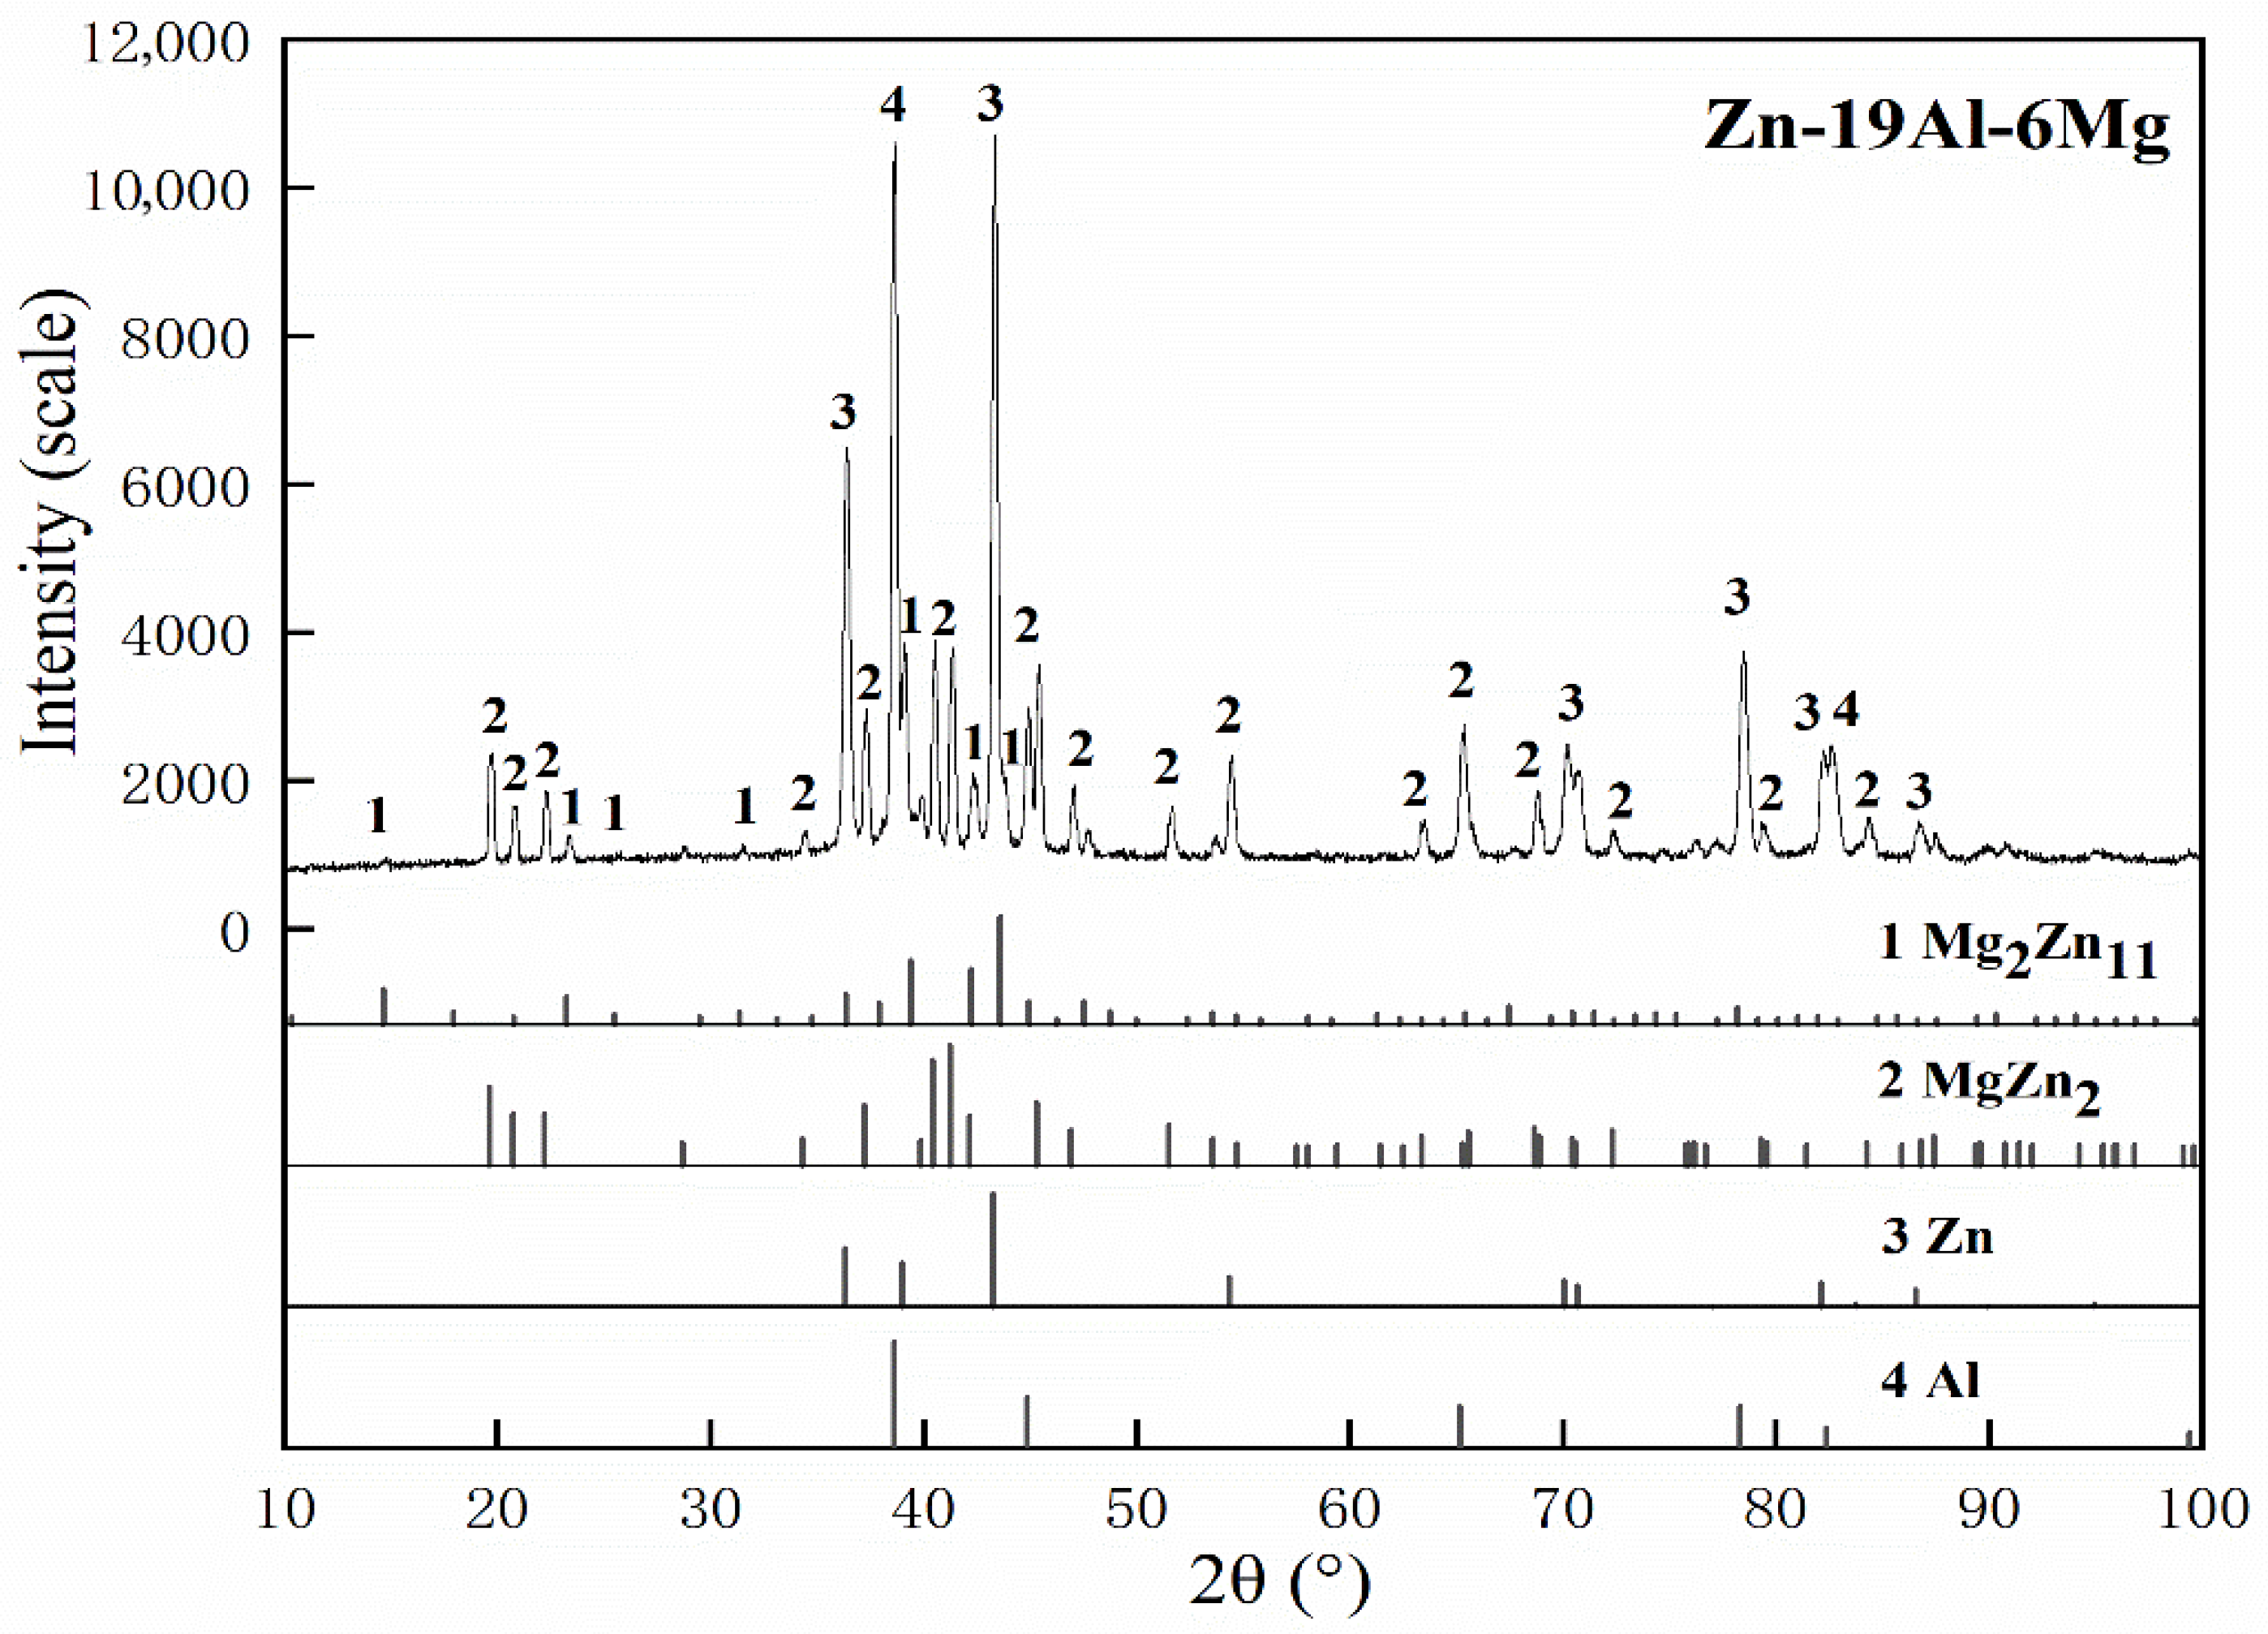
In order to further confirm the phase in the solidification structure of the Zn-19Al-6Mg alloy, XRD was used to analyze it, and the analysis results were shown in Figure 5. As can be seen from Figure 5, after the alloy sample was tested, a fine spectral peak structure was obtained without any impurity peaks, which is consistent with the standard PDF cards of the MgZn2, Mg2Zn11, Al, and Zn phases. Among them, the strength peaks of the Al-rich phase and the Zn-rich phase are relatively high, which indicates that there are a large number of Al-rich phases and Zn-rich phases in the alloy. This has a good corresponding relationship with Point 1 (Al-rich phase), Point 2 (Al-rich phase), and Point 5 (Zn-rich phase) in the SEM image of Figure 4, and they appear in large quantities in Figure 4. The intensity peaks of MgZn2 and Mg2Zn11 are relatively weak and dispersed, which corresponds to Point 3 (MgZn2 phase) and Point 4 (Mg2Zn11 phase) in Figure 4. They are small in volume and widely distributed. The results show that there is an Al-rich phase, Zn-rich phase, MgZn2 phase, and Mg2Zn11 phase in the solidification structure of the Zn-19Al-6Mg alloy. This is consistent with the results of EDS detection.
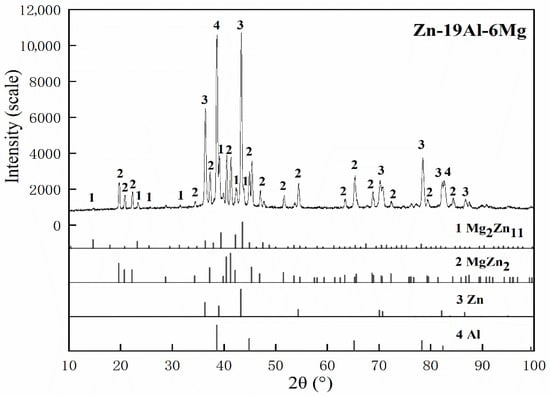
Figure 5.
XRD results of Zn-19Al-6Mg alloy.
4. Conclusions
In this study, based on the analysis of the solidification equilibrium solidification phase diagram of the Zn-19Al-6Mg alloy calculated by thermodynamic software, the experimental results of differential thermal analyses of samples extracted from the alloy billets refined in the laboratory, and the identification of phases in the solidification structure of this alloy by means of SEM, EDS, XRD, etc., are shown. Finally, the solidification microstructure of the Zn-19Al-6Mg alloy was obtained.
- (1)
- The solidification microstructure of the Zn-19Al-6Mg alloy consists of an β-Al phase, α-Al phase, MgZn2 phase, and Mg2Zn11 phase.
- (2)
- The microstructure formation path of the Zn-19Al-6Mg alloy at room temperature is L→β-Al→β-Al + MgZn2→MgZn2 + β-Al + α-Al + Mg2Zn11.
- (3)
- During the formation of the solidification structure of the Zn-19Al-6Mg alloy, the primary β-Al phase precipitates Zn and forms the α-Al phase. Due to the cooling rate in the actual transformation process, the precipitated Zn cannot completely form Mg2Zn11 with the MgZn2 phase, resulting in the Zn-rich phase in some regions of the structure.
Author Contributions
Conceptualization, data curation, writing—original draft, writing—review and editing, J.W. Data curation, methodology, investigation, J.X. Data curation, conceptualization, writing—review and editing, S.Y. Data curation, resources, visualization, K.C. Data curation, software, validation, supervision, D.W. Methodology, supervision, writing—review and editing, A.Z. All authors have read and agreed to the published version of the manuscript.
Funding
Fundamental Research Funds for the Central Universities (FRF-BD-23-02).
Data Availability Statement
The original contributions presented in this study are included in the article. Further inquiries can be directed to the corresponding author.
Conflicts of Interest
The authors declare that they have no known competing financial interests or personal relationships that could have appeared to influence the work reported in this paper.
References
- Ma, G.; Chen, Y.; Wang, S.; Wu, H.; Gao, J.; Wu, G.; Mao, X. Study on Corrosion Behavior and Mechanism of Ultrahigh-Strength Hot-Stam** Steel Based on Traditional and Compact Strip-Production Processes. Materials 2023, 16, 3064. [Google Scholar] [CrossRef] [PubMed]
- Li, B.; Zhang, Z.; Liu, H.; Luo, M.; Lan, P.; Tang, H.; Zhang, J. Characteristics and evolution of the spot segregations and banded defects in high strength corrosion resistant tube steel. Acta Met. Sin 2019, 55, 762–772. [Google Scholar]
- Zhao, X.; Zhang, Z.; Liu, X.; Liu, Q.; Jiang, S.; Zhang, Q. Enhanced Corrosion Protection of Steel Strip through Advanced Zn-Mg Alloy Coatings manufactured by Continuous Physical Vapor Deposition: A Review. Mater. Chem. Phys. 2024, 328, 129884. [Google Scholar] [CrossRef]
- Ahmadi, M.; Salgın, B.; Kooi, B.J.; Pei, Y. Genesis and mechanism of microstructural scale deformation and cracking in ZnAlMg coatings. Mater. Des. 2020, 186, 108364. [Google Scholar] [CrossRef]
- Ahmadi, M.; Salgın, B.; Ahmadi, M.; Kooi, B.J.; Pei, Y. Unraveling dislocation mediated plasticity and strengthening in crack-resistant ZnAlMg coatings. Int. J. Plast. 2021, 144, 103041. [Google Scholar] [CrossRef]
- Ahmadi, M.; Salgın, B.; Kooi, B.J.; Pei, Y. The effect of grain refinement on the deformation and cracking resistance in Zn–Al–Mg coatings. Mater. Sci. Eng. A 2022, 840, 142995. [Google Scholar] [CrossRef]
- Prosek, T.; Nazarov, A.; Goodwin, F.; Šerák, J.; Thierry, D. Improving corrosion stability of ZnAlMg by alloying for protection of car bodies. Surf. Coat. Technol. 2016, 306, 439–447. [Google Scholar] [CrossRef]
- Fan, D.W.; Cooman, B.D. State-of-the-knowledge on coating systems for hot stamped parts. Steel Res. Int. 2012, 83, 412–433. [Google Scholar] [CrossRef]
- Marder, A.R. The metallurgy of zinc-coated steel. Prog. Mater. Sci. 2000, 45, 191–271. [Google Scholar] [CrossRef]
- Munroe, P.R.; Laksmi, C.S.; Gleeson, B. Effects of 0.1 and 0.2 wt.% aluminium addition to zinc on the interdiffusion between zinc and iron at 400 C. Mater. Sci. Eng. A 1998, 251, 87–93. [Google Scholar]
- Chen, W.; Liu, Y.; Tu, H.; Wu, C.; Su, X.; Wang, J. The Effects of B on the Microstructure and Corrosion Resistance of Zn-6Al-3Mg Alloy Coating. Steel Res. Int. 2024, 95, 2400180. [Google Scholar] [CrossRef]
- Zhou, H.; Wei, J.; Tian, G.; Qie, R.; Yan, L.; Zhao, A. Effect of al content on microstructure and corrosion resistance of Zn-Al-Mg alloy. Mater. Sci. Technol. 2024, 02670836241292174. [Google Scholar] [CrossRef]
- Chaouki, A.; Ben Ali, M.; El Maalam, K.; Aouadi, K.; Benabdallah, I.; El Fatimy, A.; Naamane, S. Optimizing corrosion protection: Performance comparison of Zn and Zn-Al-Mg alloys Hot-Dip galvanized coatings. J. Alloys Compd. 2024, 1007, 176371. [Google Scholar] [CrossRef]
- Li, S.W.; Gao, B.; Tu, G.F.; Sun, S.C.; Yin, S.H.; Hu, L. The Effects of RE and Si on the Thickness and Cross Section Morphology of Zn-6Al-3Mg Alloy Coating. Key Eng. Mater. 2013, 562, 935–941. [Google Scholar] [CrossRef]
- Wang, S.X.; Ma, X.H.; Bai, J.T.; Du, T.; Ma, R.; Du, A.; Zhao, A.; Fan, Y.; Li, G. Study of the corrosion behavior and mechanism of a hot-dipping Zn–6Al–3Mg alloy coating in 3.5 wt% neutral NaCl solution. Surf. Coat. Technol. 2023, 464, 129576. [Google Scholar] [CrossRef]
- Zhang, M.; Zhou, G.; Sun, H.; Teng, X.; Zhao, Z. Effect of Ti and Zr elements with equal mass ratio on microstructure and corrosion resistance of Zn-11Al-3Mg alloy. Mater. Corros. 2021, 72, 585–595. [Google Scholar] [CrossRef]
- Li, B.; Dong, A.; Zhu, G.; Chu, S.; Qian, H.; Hu, C.; Sun, B.; Wang, J. Investigation of the corrosion behaviors of continuously hot-dip galvanizing Zn–Mg coating. Surf. Coat. Technol. 2012, 206, 3989–3999. [Google Scholar] [CrossRef]
- Tokuda, K.; Goto, Y.; Saito, M.; Takebayashi, H.; Konishi, T.; Fukuda, Y.; Nakamura, F.; Kawanishi, K.; Ueda, K.; Shindo, H. New Corrosion-Resistant Zn-Al-Mg Alloy Hot-Dip Galvanized Steel Sheet. Corros. Sci. Technol. 2024, 23, 121–130. [Google Scholar]
- Tokuda, S.; Nishida, Y.; Nishimoto, M.; Muto, I.; Shoji, H. Initial dissolution of Mg-containing phase and corrosion product formation in cut-edge corrosion of Zn-11% Al-3% Mg-0.2% Si coated steel. Corros. Sci. 2023, 225, 111605. [Google Scholar] [CrossRef]
- Li, Z.; Li, Y.; Jiang, S.; Zhang, J.; Liu, X.; Zhang, Q.; Liu, Q. Calculation and Experimental Verification of Zn-Al-Mg Phase Diagram. Coatings 2024, 14, 468. [Google Scholar] [CrossRef]
- Atapek, Ş.H.; Erişir, E.; Gümüş, S. Modeling and thermal analysis of solidification in a low alloy steel. J. Therm. Anal. Calorim. 2013, 114, 179–183. [Google Scholar] [CrossRef]
- Andersson, J.-O.; Helander, T.; Höglund, L.; Shi, P.; Sundman, B. Thermo-Calc & DICTRA, computational tools for materials science. Calphad 2002, 26, 273–312. [Google Scholar]
- Minakshi, M.; Appadoo, D.; Martin, D.E. The anodic behavior of planar and porous zinc electrodes in alkaline electrolyte. Electrochem. Solid-State Lett. 2010, 13, A77. [Google Scholar] [CrossRef]

Disclaimer/Publisher’s Note: The statements, opinions and data contained in all publications are solely those of the individual author(s) and contributor(s) and not of MDPI and/or the editor(s). MDPI and/or the editor(s) disclaim responsibility for any injury to people or property resulting from any ideas, methods, instructions or products referred to in the content. |
© 2025 by the authors. Licensee MDPI, Basel, Switzerland. This article is an open access article distributed under the terms and conditions of the Creative Commons Attribution (CC BY) license (https://creativecommons.org/licenses/by/4.0/).