Article

The Influence of Hot Deformation on the Mechanical and Structural Properties of Mild Carbon Steel for Industrial Application

by
Mariana Pop
,
Ioana-Monica Sas-Boca
*,
Dan Frunză
and
Adriana Neag
Faculty of Materials and Environmental Engineering, Technical University of Cluj-Napoca, 28 Memorandumului Street, 400114 Cluj-Napoca, Romania
*
Author to whom correspondence should be addressed.
Metals 2025, 15(7), 756; https://doi.org/10.3390/met15070756
Submission received: 23 May 2025 / Revised: 30 June 2025 / Accepted: 2 July 2025 / Published: 4 July 2025
(This article belongs to the Special Issue Hot Forming/Processing of Metals and Alloys)

Abstract

The aim of this work was to study the influence of temperature and strain rate on the formability and structure of C22 steel. This study was based on tensile and compression tests. In the case of the compression test, the study of the influence that the process parameters (temperature and strain rate) have on the nonuniformity of the deformation was taken into account. This work presents an experimental analysis of the effects of temperature and strain rate on the mechanical and structural properties of C22 mild steel. Uniaxial tension and compression testing at high temperatures (800 °C, 900 °C, 1000 °C, and 1100 °C) and strain rates 0.001 1/s, 0.012 1/s, and 0.089 1/s for tension and 6.35 1/s, 5.72 1/s, 4.67 1/s and, respectively, 0.106 1/s for the compression hammer and hydraulic press served as the foundation for the studies. Analysis was carried out on how temperature and strain rate affected yield stress, strain to fracture, hardness, and structural evolution. Additionally, the nonuniformity of the deformations obtained at various temperature and strain rate values was examined. The fracture behavior of C22 steel can be enhanced by raising the deformation temperature and lowering the strain rate. In the tensile tests, the study of stress and strain distribution and the variation in the normalized Latham–Cockroft failure criterion was performed by numerical simulation using FORGE® NxT 4.1 software.

1. Introduction

Steel is continuously becoming more commercially available, and it finds extensive use in the transportation and construction industries (such as in automobiles, trucks, the aerospace sector, shipbuilding, and railroads). Mild steel is becoming an option in many industries because of its exceptional workability, weldability, and affordability. There are many uses for mild steel because it is a material that is adaptable. It is readily adaptable, fabricable, and modifiable to satisfy needs. Since mild steel is one of the least expensive varieties of steel, it is a cost-effective option for numerous projects and sectors. It provides a decent trade-off between price and performance. The precise composition, production method, and heat treatment of mild steel can all affect its mechanical qualities [1,2,3,4].
Mild steel is appropriate for a variety of applications due to its good mechanical qualities, which include strength and ductility. It is extensively utilized for general fabrication, machinery, automotive parts, and structures in manufacturing, construction, and other industries. Mild steel is easily shaped, molded, and welded due to its low carbon content, which also makes it malleable and weldable. However, mild steel could be less durable and resistant to wear than higher carbon steel. Additional coatings or finishes can increase their resistance to corrosion [5,6,7,8,9].
C22 steel is a mild, low-carbon steel that is categorized as a medium-carbon alloy steel. It is mainly distinguished by its composition, which consists of iron as the primary alloying element and a small amount of carbon. C22 steel’s strength and ductility are balanced in part by its normal carbon content, which falls between 0.18% and 0.22%. C22 steel is a versatile material that meets the demands of many engineering applications, providing a reliable option for manufacturers and fabricators alike. The combination of mechanical properties makes C22 steel suitable for applications requiring moderate strength and good ductility. Its yield strength (at room temperature 220–300 MPa) and elongation (at room temperature 20–25%) values indicate that it can withstand significant deformation before failure, making it ideal for structural applications. C22 steel is commonly used in automotive and construction applications. Its good weldability makes it ideal for structural components and its machinability allows for the efficient manufacturing of machinery parts. Other grades, such as A36 and S235JR, which are frequently utilized in structural applications, are frequently contrasted with C22 steel.
C22 is a mild steel for quenching and tempering and is intended to simultaneously achieve high strength and toughness. The precise determination of the plastic and thermal treatments for such a steel, in order to perform satisfactorily in service, requires knowledge of the static and dynamic stresses and the concrete working conditions in order to be able to determine the shape, dimensions, and surface condition. In a simplified way, this steel is usually used in mechanical constructions intended for assembly organs, for parts with moderate stress, or parts that can be replaced in case of wear and do not endanger the use of the equipment [9].
Parts for automobiles (shafts, crankshafts, and camshafts), machine tool parts (gear, main shafts), heavily stressed components (bolts for chains, snails, axles, bolts, sleeves, screws, flanges, worm wheels), and parts for transportation equipment, etc., are among the primary applications for C22 steel, which is used as steel for heat-treated, moderately stressed parts. As industries grow, mild steel will undoubtedly remain a dependable material.
The amount of deformation that may be accomplished with a certain metalworking process without causing a fault is known as workability. Temperature, strain, and strain rate are the main factors that affect workability in a metal forming process. These days, laboratory equipment and specialized software that can easily simulate the actual operating conditions numerically or physically can be used to determine the characteristics of a material’s deformation.
The formability study of C22 steel was also studied through tensile testing. The material’s tensile stress, maximum elongation, and area reduction are among the parameters determined following a tensile test. Plotting on the stress-strain curve yields the Young’s modulus and Poisson’s ratio. A component’s stiffness and strength can be visualized using finite element analysis (FEA), which can also forecast how the component will behave under typical operating conditions. This makes it possible to optimize and improve the component’s design prior to manufacturing [3,10].
For a better understanding of C22 and mild steel in general workability and to optimize its parameters [10,11,12,13,14,15,16,17,18,19], it is necessary to expand research in order to determine how hot working process parameters affect the microstructural evolution, stress, and strain distribution in the deformed material [11,12,13,14,15,16,17,18,19]. Because materials are used in so many diverse applications, it is important to research how they behave under various operating situations [20,21]. There is ongoing interest in finding out more about the mechanical characteristics of C22 steel, despite the fact that its qualities have been studied.
The behavior of C22 steel has been the subject of some studies in the past [22,23,24,25,26]. As can be seen from the research conducted so far, the cooling rate and various types of heat treatment operations carried out can increase the mild steel’s tensile strength and hardness. The role of heat treatments applied to these steels depending on the field of application is very important [27,28,29,30].
Research has also been carried out on the deformability of the material by tensile and compression tests studying the influence of process parameters (temperature and strain rate) on it [23]. Most of the research conducted to date on C22 steel or other steel grades in the same mild steel category has focused on studying their weldability. Dewangan, S.; Nemade, V.; Nemade, K. studied welding behavior in three distinct physical conditions—water-quenched, oil-quenched, and annealed—which were attained based on the heat treatment. Tensile strength, hardness, and microstructure tests were performed on each specimen. A tensile strength of 439 MPa, which is 85% greater than the as-welded specimen, was demonstrated by the annealed specimen. Compared to as-welded specimens, specimens quenched in water or oil had lower strength. Two distinct observations were made regarding hardness. While the base metal section reported lower hardness values, the as-welded and annealed specimens showed the highest hardness near the welded connection. On the other hand, the base metal zone had harder water and oil quenched specimens than the welded zone. The microstructural appearance was found to be positively correlated with both strength and hardness [23]. Mokas, N.; Boulanouar, L.; Amirat, A.; Gautier L., in a study using twist high-speed steel (HSS)-grade drill bits, contributed to our understanding of the machinability of hardened C22 steel under drilling operation conditions. C22 steel that has been annealed and toughened was the subject of experimental research using a cutting regime. Cutting speed, feed rate, and drill diameter were the input factors; tool wear associated with tool life was the output parameter. The most intriguing phenomenon, aside from the widely held belief that tool life diminishes with increasing cutting speed, is the contentious impact of cutting speed when drilling steel that has hardened. Exploratory studies of the chip microstructure have been used to evaluate the latter [26]. Based on weld strength, hardness, and microstructural distribution, the viability of a welded junction between AISI 1020 carbon steel (CS) and Inconel-718 (IN) are examined in this work [27]. Equations and constitutive models were created to explain C22 steel’s hot behavior. Numerical studies were also carried out to analyze the stress and strain states in the specimens tested.
A computer program named Abaqus/CAE was used to perform the finite element approach for the tensile test analysis of mild steel [18].
Cadoni, E.; Forni, D.; Gieleta, R.; Kruszka, L. studied the behavior of the strain rate hardening and isotropic hardening of C22 structural steel under static and dynamic tension and compression stress. The results of the studies show that the material is sensitive to strain rate in both compression and tension.

2. Materials and Methods

Considering the multiple applications of C22 steel and the fact that, until now, the research carried out has dealt little with the behavior of the material at high temperatures, this work aimed to study how elevated temperatures and strain rates affect the formability and structural evolution of C22 mild steel. The deformation temperature, strain rate, and the degree of triaxiality of the stress states created in the material under stress can all have an impact on the fracture behavior. The tensile and compression tests were used to study the influence of the abovementioned process parameters on the hot formability of C22 steel. At the same time, in the case of the compression test, the nonuniformity of the strains present in the material was highlighted as a result of the presence of friction on the material–deformation tool contact surface. The presence of this friction and, therefore, the nonuniformity of the deformations constitute a disadvantage of this method. The complete elimination of friction in the case of the compression test is almost impossible. The experimental details are as follows.

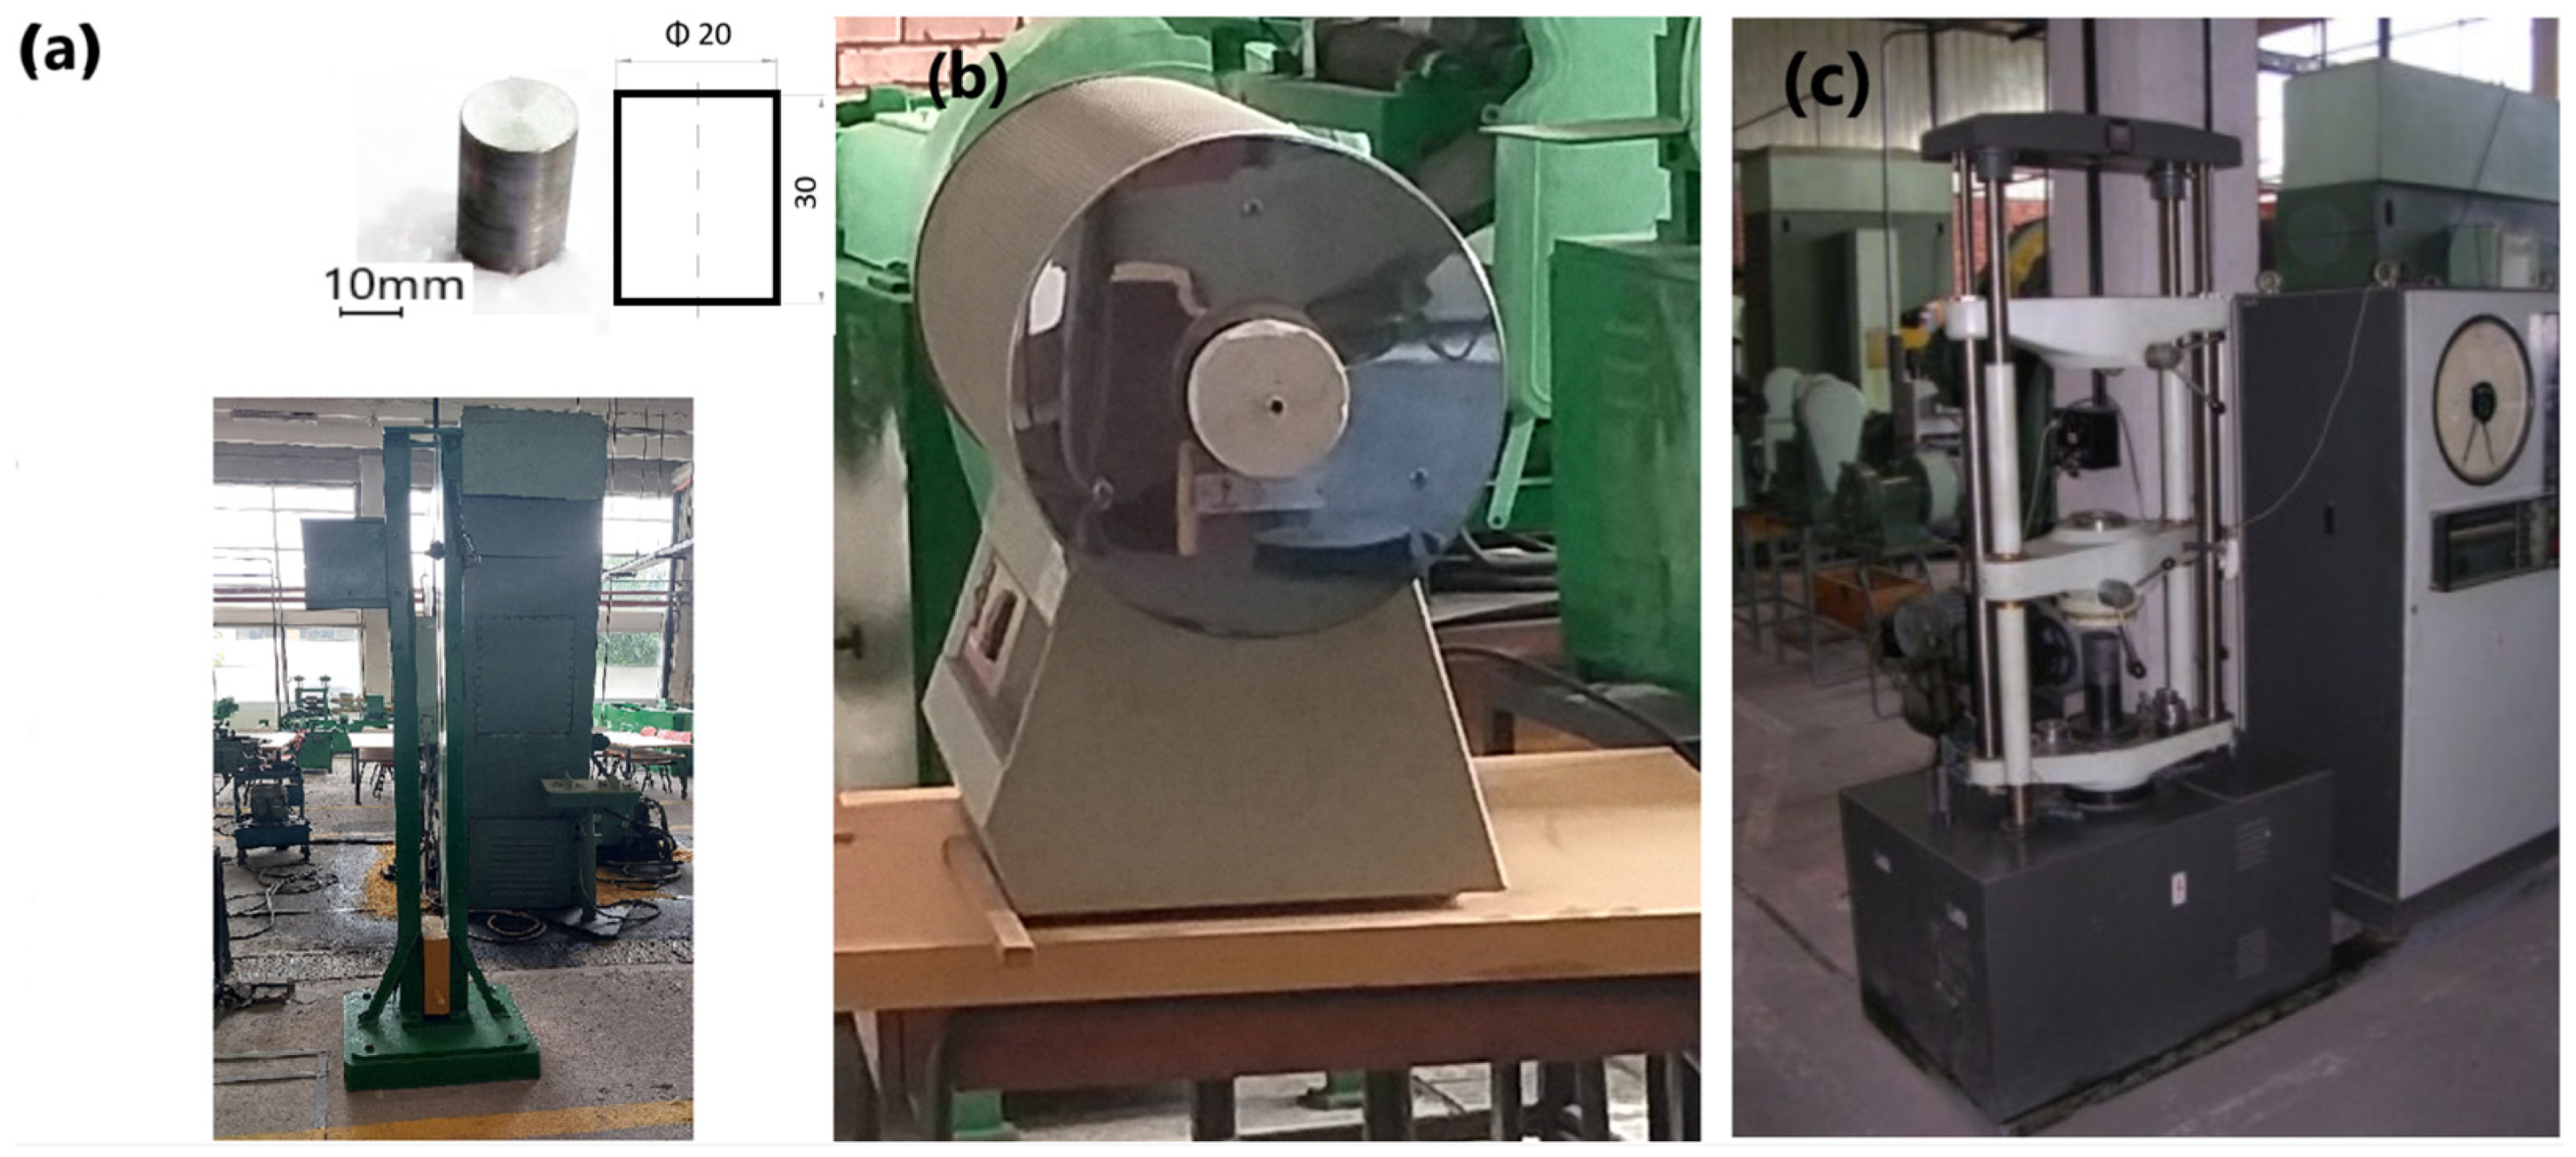
2.1. Material and Tests Characteristics

The material used in this study was the commercial steel C22 (EN 10250-2: 2000) [31] and its chemical composition is provided in Table 1. According to EN 10250-1:2022 [32] this steel is characterized by the yield strength of the cold material, which is 210 MPa, while the tensile strength [33,34,35,36] is 410 MPa. Our experimental research aimed to study the influence of the temperature and strain rate on the mechanical and structural properties of C22 steel. Tensile, compression, and hardness tests were carried out, as well as optical microscopy.
The hot tensile tests were performed on a Heckert-type hydraulic press with a maximum force of 200 KN (200 kN hydraulic Heckert-EDZ-20S testing machine, WEB Werkstoffprüfmaschinen, Leipzig, Germany). The tensile and compression specimens were prepared from 30 mm diameter extruded round bars. The geometry and dimensions of the specimen were determined by ASTM E21 standards. The hot tensile test, ASTM E21 [37], is carried out at extreme temperatures. In contrast to the ASTM E8/E8M standard [38], it is recognized to refer to a temperature higher than room temperature, or greater than 38 °C. Figure 1 and Figure 2 show the shape and dimensions of the specimens and the experimental devices that were used for experiments. Four different temperatures were selected for the hot tensile tests (800 °C, 900 °C, 1000 °C, and 1100 °C), and three different strain rates (0.001 1/s, 0.012 1/s, 0.089 1/s) were used. After hot tensile tests, the specimens were quenched.
The compression tests were carried out on a hammer and on a hydraulic press at three different values of temperatures (800 °C, 900 °C, and 1000 °C). In the case of the hammer, the impact heights of the ram were 1000, 1500, and 1850 mm, respectively, with strain rates of 4.67 1/s, 5.72 1/s, and 6.35 1/s. In the case of the hydraulic press, the pressing speed was 3.2 mm/s, and the strain rate was 0.106 1/s.
Following the tests, Vickers hardness was determined. In the case of tension, three measurements were made at three points of the fractured area, while in the case of compression, the measurements were made at five significant points of the cross-section of the specimen.

2.2. Numerical Simulation

The Optical Microscopy Study Was Carried out with the Aim of Establishing the Influence of Temperature and Strain Rate on the Structural Changes in the Material.
Through finite element method (FEM) numerical simulation using the FORGE® NxT 4.1 software, the Latham–Cockroft failure criterion and the distribution of von Mises equivalent stresses and strains in the deformed material were determined in the case of the tensile test. The numerical simulation process includes creating the ASTM-compliant tensile test specimen and the clamping heads in SolidWorks ® 2019, importing and assembling the parts into a 3D hot forming numerical analysis model, specifying the material for the specimen, and setting the boundary conditions. The dimensions of the specimen that was evaluated experimentally and in the simulations were identical. In the numerical simulation with FEM, two temperature values were adopted, representing the minimum and maximum temperature (800 °C and 1100 °C, respectively) at which the experimental tests were performed. Since in the experimental tests the tensile loading starts after a holding period, in order to homogenize the temperature in the specimen, during the numerical analysis, low heat transfer conditions were assumed, but the values of the friction parameters were defined to be high. A homogeneous initial temperature of the specimen was considered in the region subjected to the tensile test, with a value of 800 °C or 1100 °C, and defined in the input file.
A Hansel–Spittel thermo-viscoplastic constitutive model was used to numerically analyze the behavior of C22 steel under hot tensile conditions (Equation (1)). The Hansel–Spittel model describes the dependence of tensile stress on temperature, strain rate, and strain, and is implicitly implemented in many FE material behavior modeling software [35,39]. Equation (1) is as follows:
σ = A · e m 1 T · ε m 2 · ε ˙ m 3 · e m 4 ε
where σ is rheological stress [MPa]; ε is strain [-]; ε ˙ is strain rate [1/s]; T [°C] is temperature; A, m1, …, m4 are material constants, where m1 defines the material’s sensitivity to temperature, m2 and m4 define the material’s sensitivity to strain, and m3 is the strain rate sensitivity index. The material model parameters were obtained from the FPDBase rheology database of the FORGE® NxT 4.1 software. The parameters of the simplified Hansel–Spittel equation are provided in Table 2.

3. Experimental Results

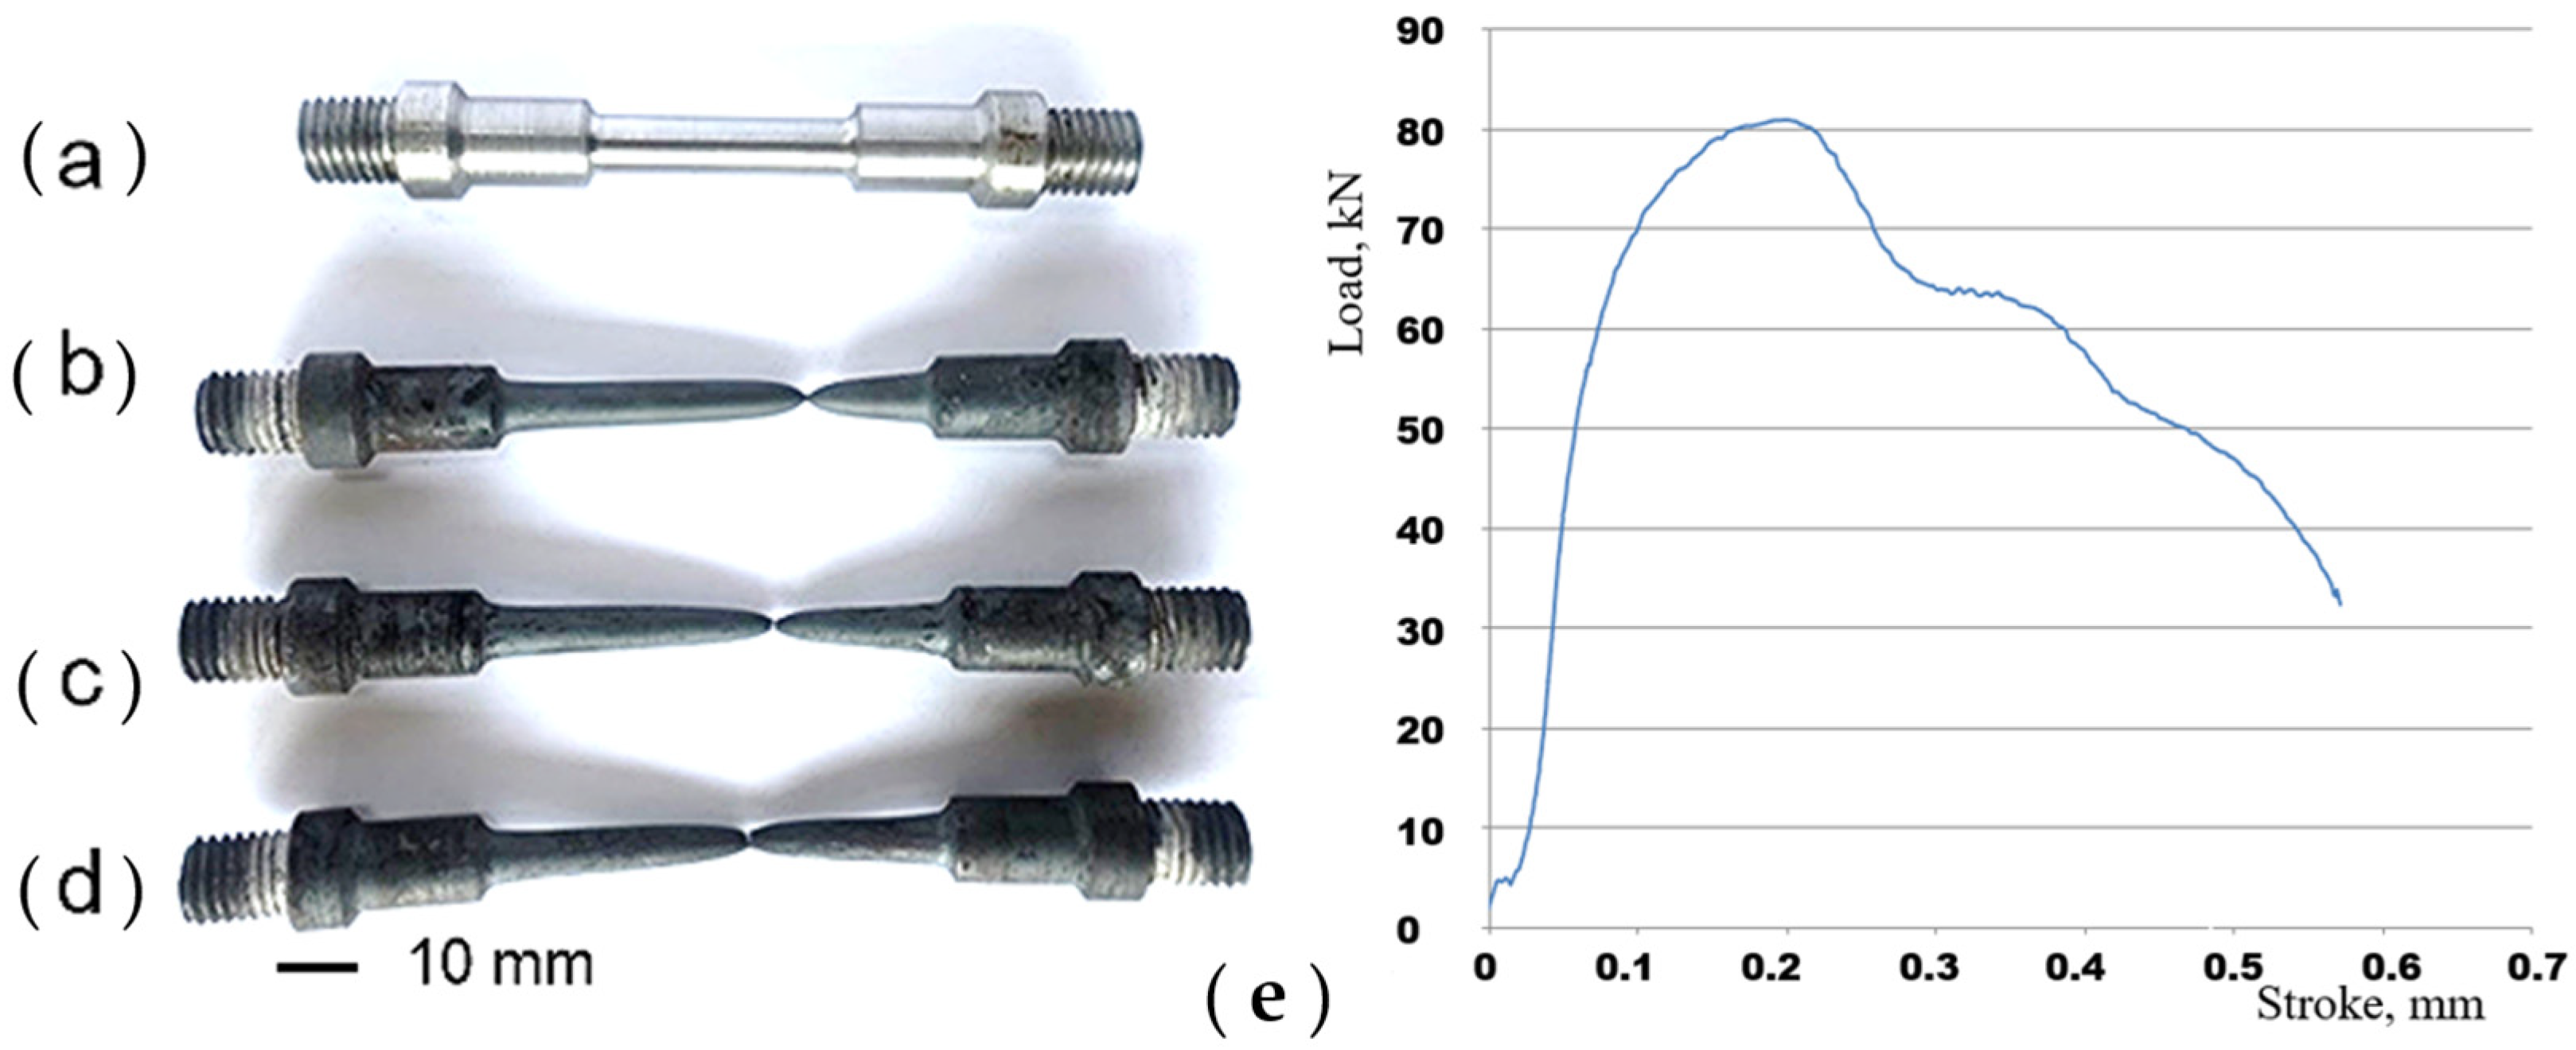
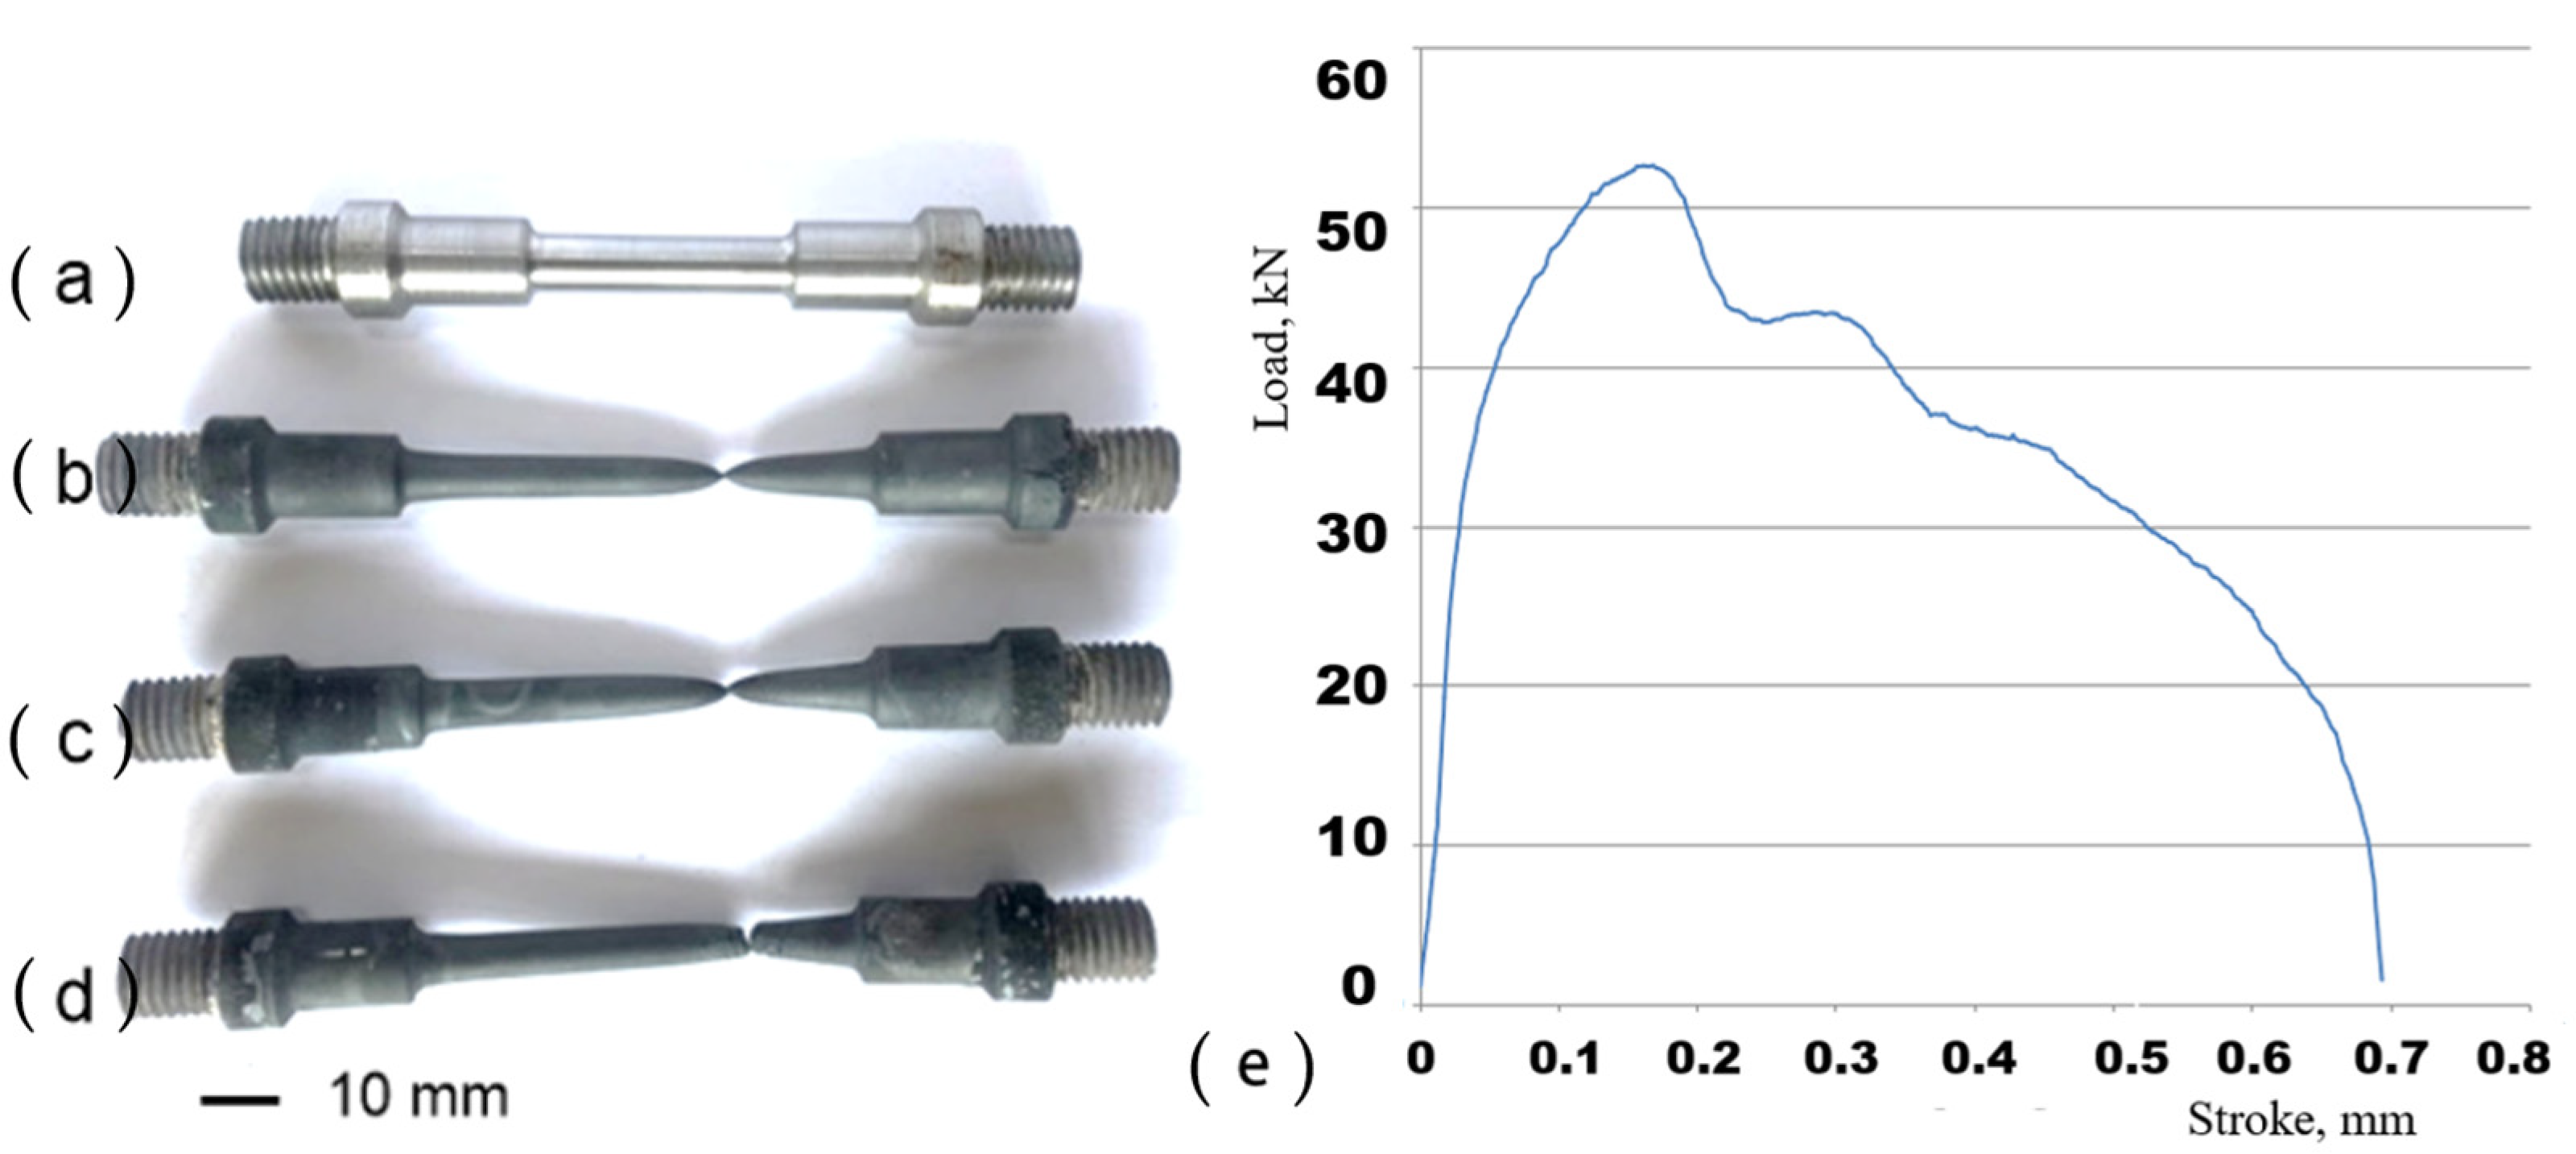
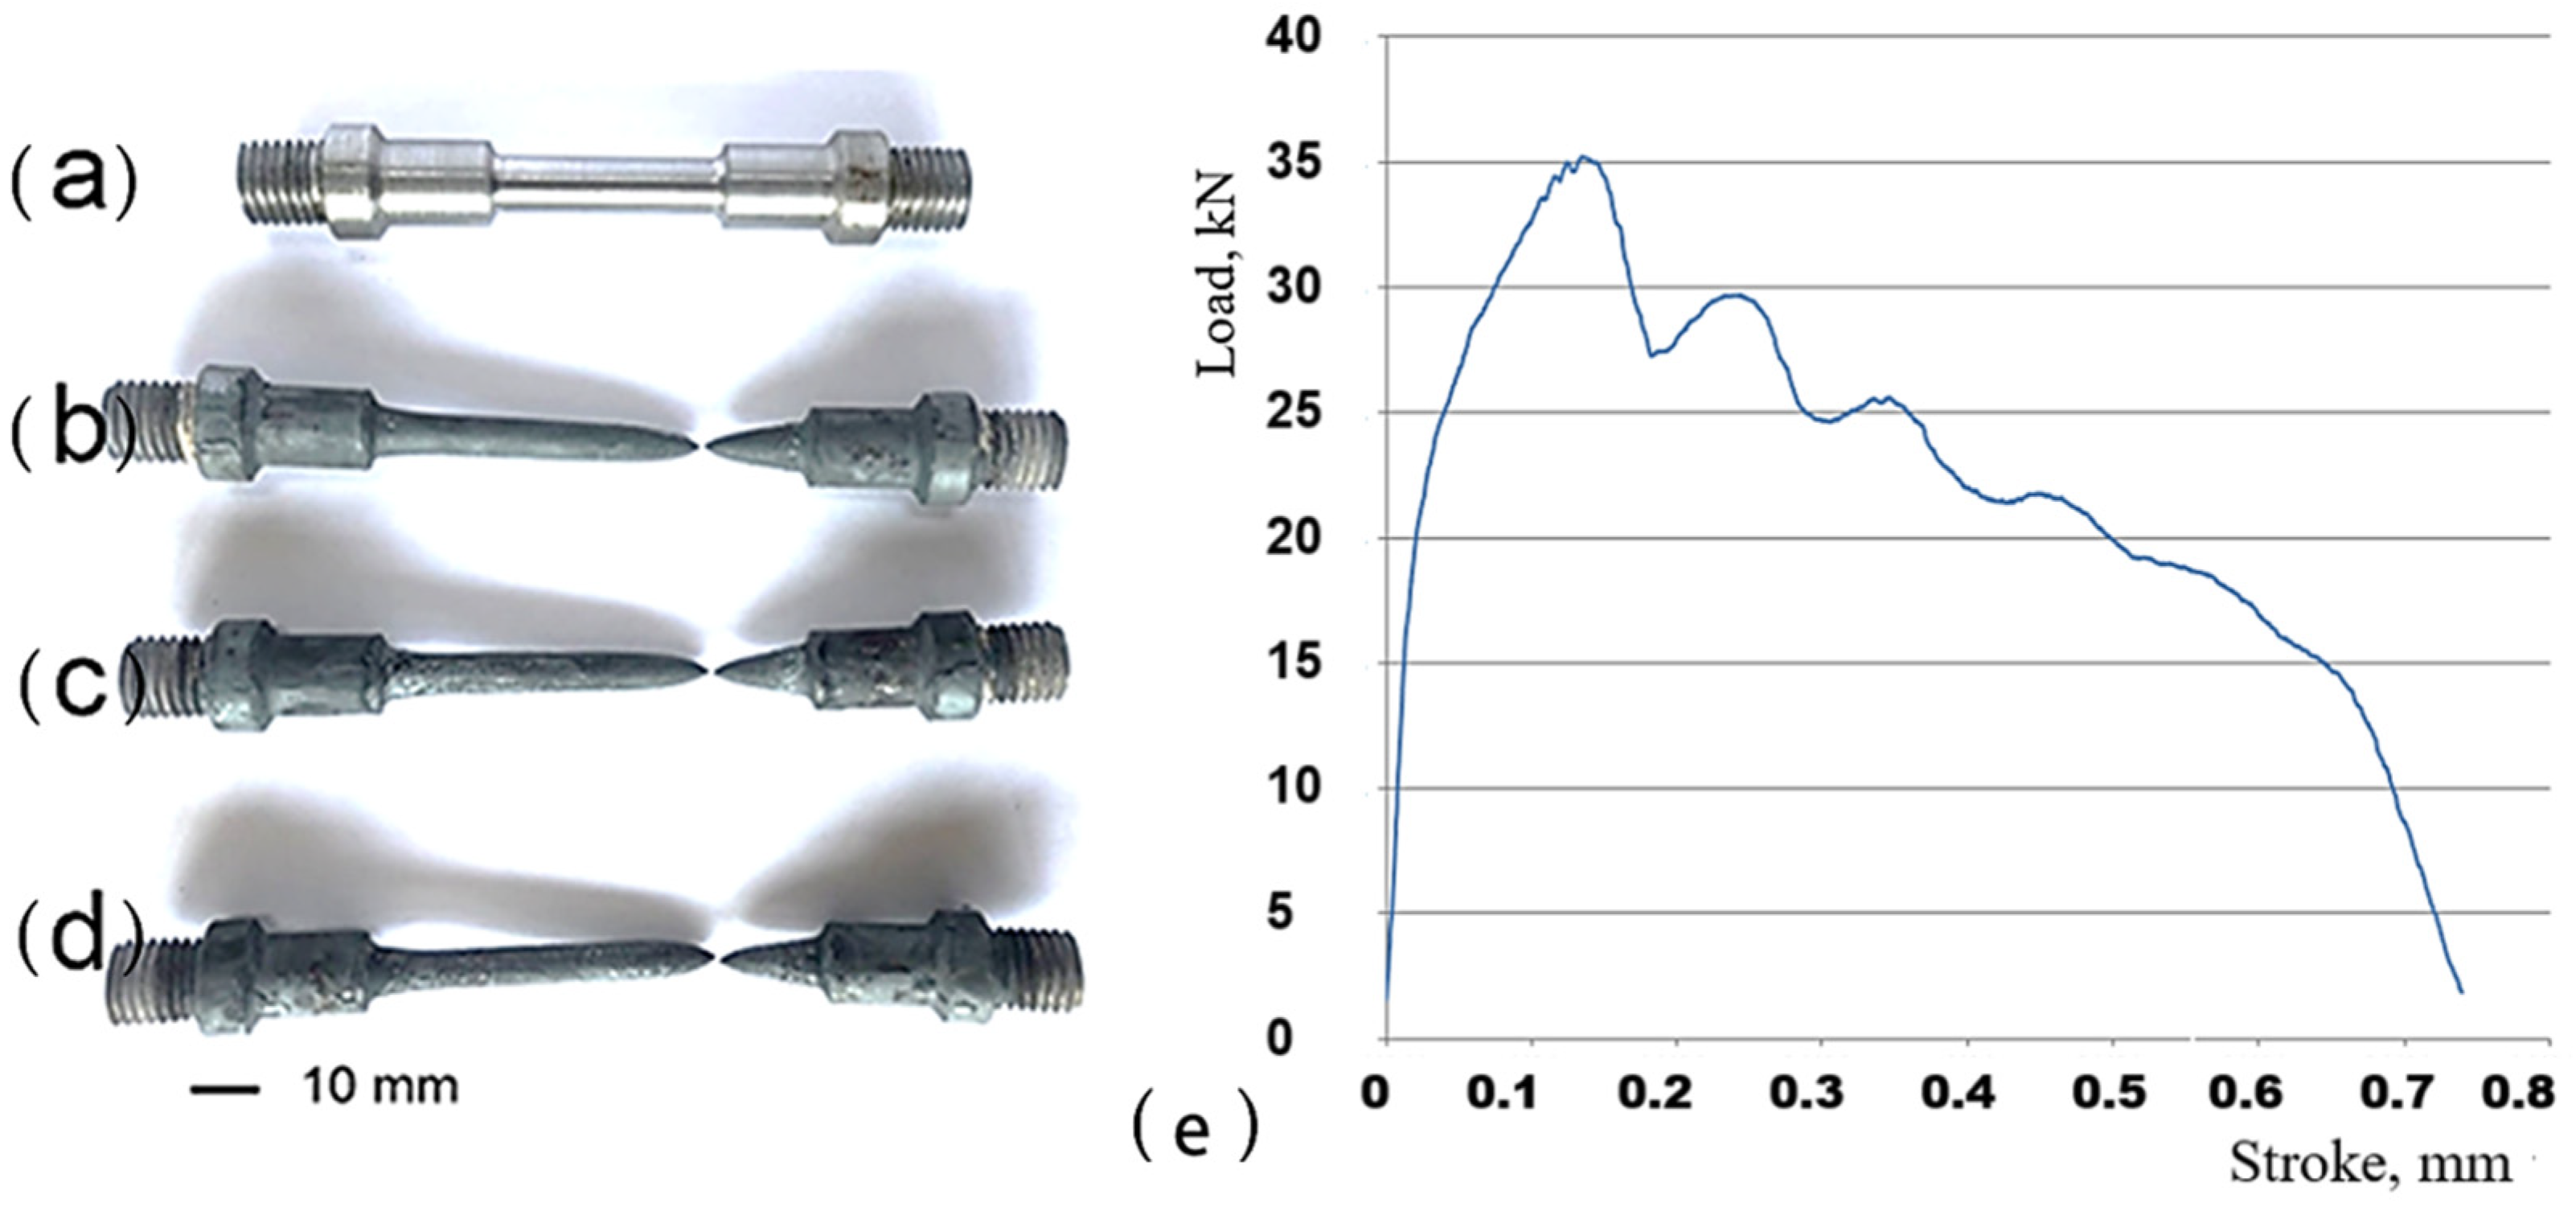
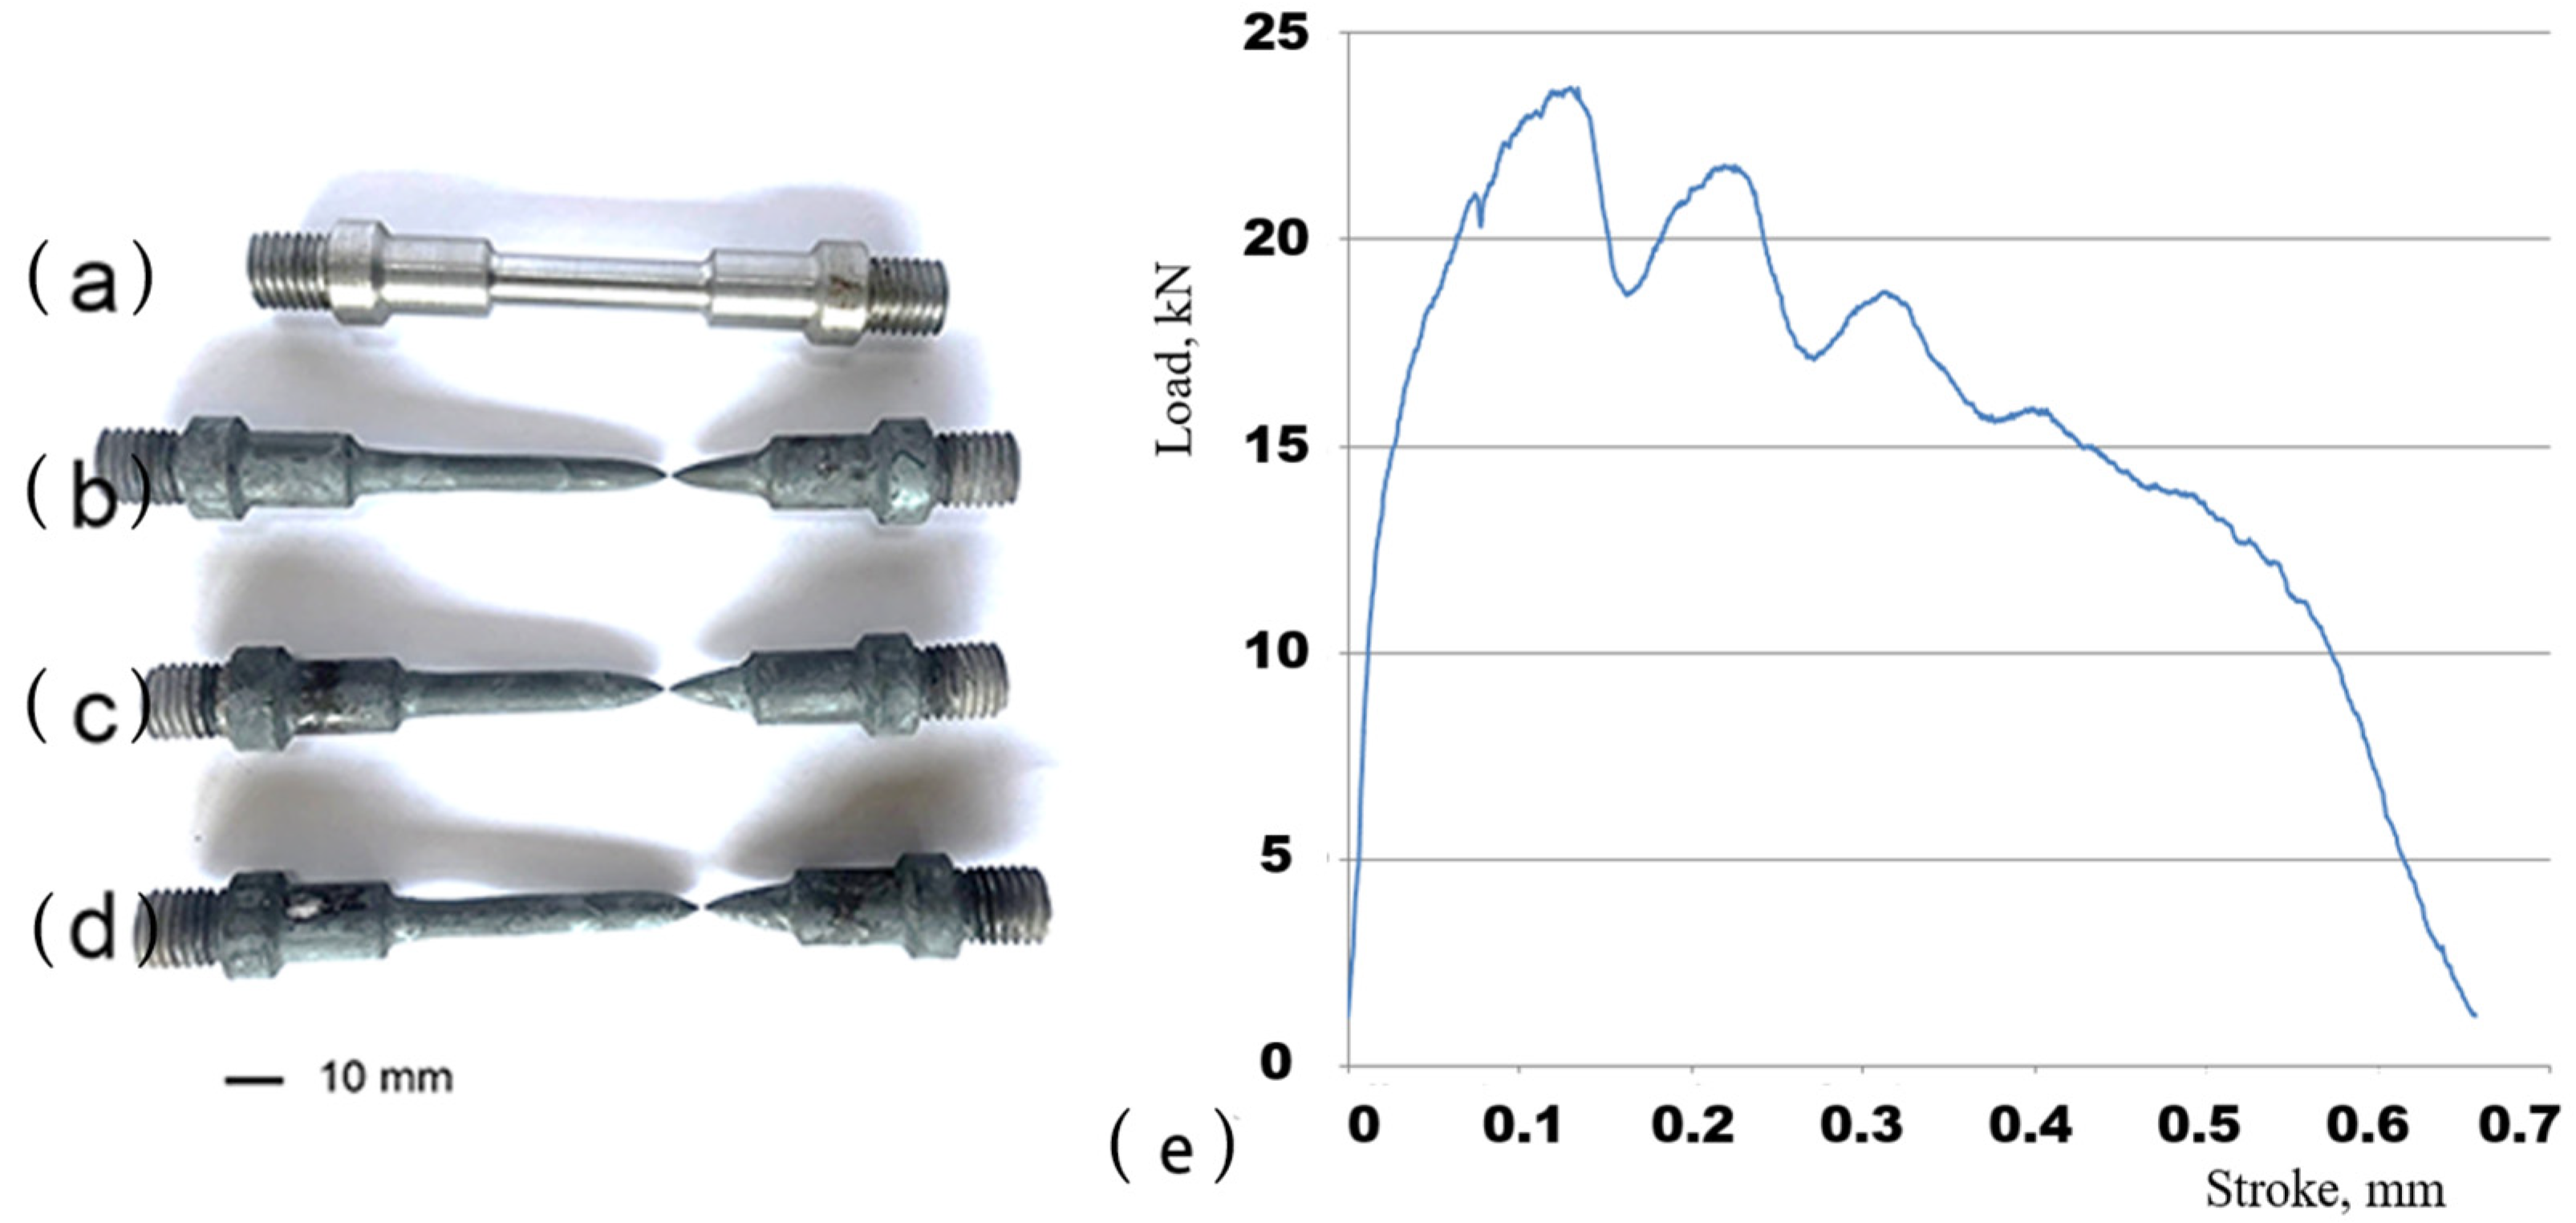
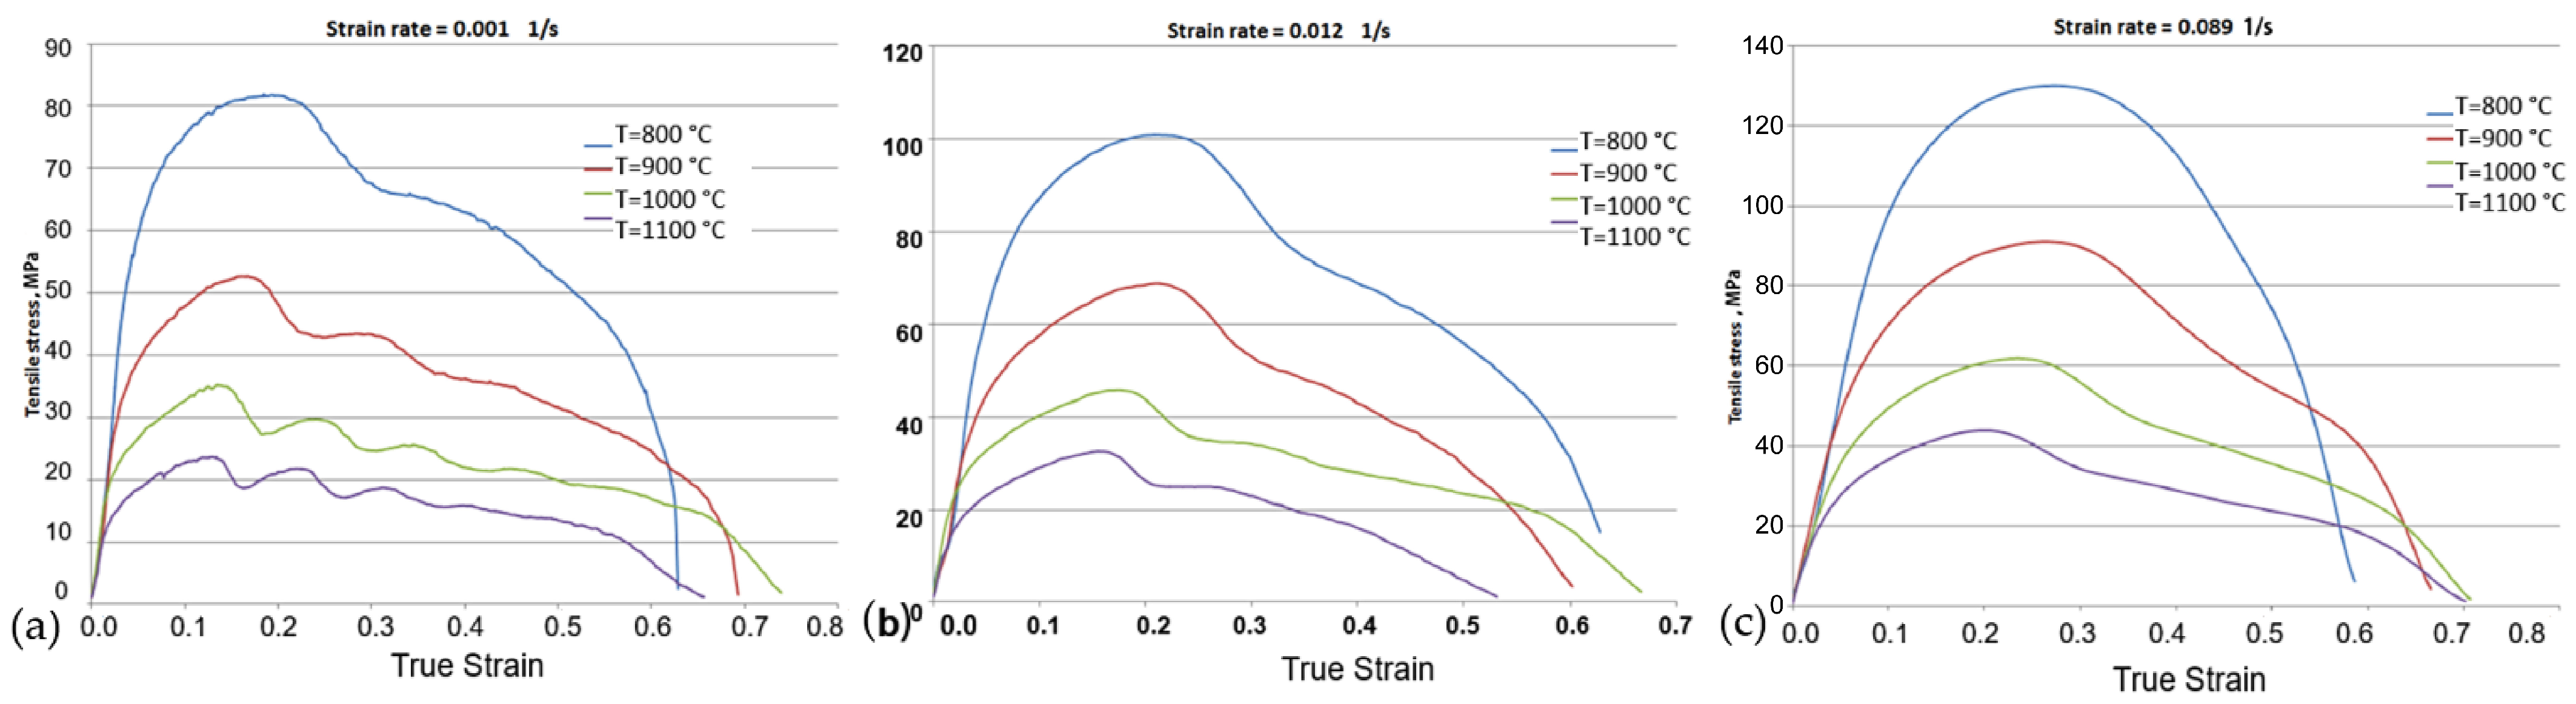
3.1. Hot Tensile Behaviour

The macromorphology data of the specimens obtained following tensile tests under various temperature and strain rate conditions are displayed in Figure 3, Figure 4, Figure 5 and Figure 6.
The tensile test specimens from Figure 3, Figure 4, Figure 5 and Figure 6 tested at 800 °C, 900 °C, 1000 °C, and 1100 °C showed a ductile fracture behavior. The necking becomes more noticeable when the strain rates are increased from 0.001 1/s to 0.012 1/s and 0.089 1/s at 1000 °C and 1100 °C, respectively.
Table 3 displays the results obtained from the experimental tensile testing. Equations (2)–(3) are as follows:
ε = l 1 l 0 l 0
r = A 0 A 1 A 0
ε ˙ = v l 0
where the terms are defined as follows:
  • ε strain;
  • l0 initial length of the specimen, mm;
  • l1 final length of the specimen after deformation, mm;
  • r reduction in area;
  • A0 initial cross-sectional area of the specimen, mm2;
  • A1 final cross-sectional area of the specimen, mm2;
  • ε ˙ strain rate, s−1;
  • v pressing speed, mm/s;
  • T specimen testing temperature, °C.
Table 3. Experimental results.
No.
crt
l0
mm
d0
mm
T
°C
v
[mm/s]
l1
[mm]
d1
[mm]
εr ε ˙
[ 1 / s ]
1.3388000.06665.830.990.850.001
2.3388000.46266.52.21.010.920.012
3.3388003.2621.10.870.970.089
4.3389000.0667141.150.750.001
5.3389000.46264.81.40.960.960.012
6.3389003.267.61.11.040.980.089
7.33810000.06675.51.11.280.980.001
8.33810000.46269.41.11.100.980.012
9.33810003.270.211.120.980.089
10.33811000.06668.39.81.060.500.001
11.33811000.46259.440.80.750.012
12.33811003.269.841.110.750.089
The effect of deformation temperature on the C22 steel behavior is shown in the tensile stress vs. true strain diagrams presented in Figure 7 for different values of strain rate. It is evident that by increasing the temperature at the same strain rate, the deformation increases and the formability of the material increases.
The flow stress decreases gradually as the deformation temperature rises. For example, at a strain rate of 0.001 1/s, when the deformation temperature increases from 800 °C to 1100 °C, the peak stress decreases by 58 MPa, from 82 MPa to 24 MPa. This phenomenon occurs because the higher the temperature, the higher the thermal activation energy of the material, which decreases the sliding resistance of dislocations and favors deformation, thus increasing the dynamic softening effect. Also, at the same deformation temperature, the flow stress gradually increases with the increasing strain rate, demonstrating positive strain rate sensitivity. As shown in Figure 7, when the strain rate increases from 0.001 1/s to 0.089 1/s during deformation at 1100 °C, the peak stress increases from 82 MPa to 128 MPa, reflecting an increase of 46 MPa. This increase is attributed to the short deformation time and high dislocation density of material at a high strain rate. Figure 8 illustrates the influence of temperature and strain rate on ultimate tensile stress. As can be observed, the ultimate tensile stress significantly drops as the temperature rises in all the deformation situations that were examined. At the same time, by increasing strain rate the ultimate tensile stress increases. At 800 °C, the ultimate tensile stress is at its peak of 132 MPa for a strain rate of 0.089 1/s, while at 1100 °C, it is at its lowest of 25.8 MPa for a strain rate of 0.001 1/s.
This phenomenon can be explained by the longer time it takes for energy to accumulate due to the low strain rate. Concurrently, the high temperature determines the nucleation and development of dynamically recrystallized grains, and the flow stress is reduced by removing the obstacles brought on by dislocations [18].

3.2. Compression Behavior

3.2.1. Compression Tests with a Hammer

One of the often-employed methods to understand the material behavior during extreme plastic deformation is the upsetting test. This type of test provides the data needed to determine the mechanical characteristics of the material. During forming processes, frictional conditions have an impact on material flow and deformation behavior, particularly during upsetting operations. The flow of material at the contact surface and around it is significantly impacted by friction between the plate and the specimen. There is no frictional effect in the specimen’s central region. Thus, the specimen experiences heterogeneous deformation when subjected to axial compression. We refer to this behavior as barreling. The correct application of lubricants could reduce the amount of specimen barreling. However, it is exceedingly challenging to fully eliminate the friction [24]. It is, therefore, necessary to introduce an adjustment factor as a corrective measure to take account of this heterogeneous deformation phenomenon [21,30,35].
The shapes of the specimens resulting from the compression tests with a hammer for different strain rates and different temperatures are presented in Figure 9. The experimental results obtained by compression tests with a hammer at different temperatures and impact heights are presented in Table 4, Table 5 and Table 6. Equations (5)–(7) are as follows:
L = σ d m V l n h 0 h ,   [ Nmm ]
σ d = L m V l n h 0 h ,   [ M P a ]
m = 1 + 0,1 d m i n h .
where the terms are defined as follows:
  • L—the energy consumed to deform the specimen, Nmm;
  • σd—the deformation strength, M P a ;
  • m—the factor that takes into account frictional forces;
  • V—the volume of the specimen, mm3;
  • d0, h0—the initial dimensions of the specimen, mm;
  • dmin—the minimum diameter of the specimen after compression, mm;
  • dmax—the maximum diameter of the specimen after compression, mm;
  • h—the final height of the specimen, mm.
Figure 10 presents the deformation strength calculated with Equation (5) as the function of temperature at different values of impact heights. It can be observed that when the temperature increases, the deformation strength reduces; hence, the material formability increases. This influence is more pronounced at strain rates of 4.67 1/s and 5.72 1/s. In these situations, the plastic deformation strength is reduced by more than 50%. In the case of a 6.35 1/s strain rate, the influence of temperature on the strength is lower. This phenomenon was due to the longer duration of the process, in which the material cooled more than in the other two situations studied.
Figure 11 shows the variation in the nonuniformity of strains on the diameter of the specimen studied as a function of temperature. The nonuniformity is expressed as the ratio between the maximum and minimum diameter of the specimen as a result of barreling.
By increasing the deformation temperature from 800 °C ÷ 1000 °C, the degree of nonuniformity of the strains decreases significantly for all strain rates.

3.2.2. Compression Tests on a Hydraulic Press

In order to compare the influence of strain rate on the compressive strength of alloy C22, uniaxial compression tests were performed on a hydraulic press, where the strain rate is much lower than in the case of the hammer. More precisely, the strain rate in the case of hydraulic press was 0.106 1/s.
The shapes of the specimens resulting from the uniaxial compression tests realized on a hydraulic press at different temperatures are presented in Figure 12.
The variation of compression stress vs. true strain for different temperatures and 0.106 1/s strain rate on hydraulic press is shown in Figure 13.
At a strain rate of 0.106 1/s (Figure 13), an expected increase in compression stress was obtained by increasing the true strain. It can be observed that the slope of the compressive stress is steeper in the first stage of the deformation (but not so sharp as in the tensile test). The rate of increase in the compression stress slows down until the stress reaches its maximum value. By increasing temperature from 800 °C to 1000 °C, lower values of compression stress were obtained. The material exhibits a ductile flow, and when the temperature increases, the slope of the compression stress variation curve becomes smoother. At the same value of true strain with increasing temperature the compression stress decreases. For a value of 0.22 of true strain, the compression stress ranged from 310 MPa at a temperature of 800 °C to 220 MPa at a temperature of 1000 °C. As can be seen in the case of uniaxial compression on the hydraulic press, the formability of the material is much better than in the case of traction (Figure 7 vs. Figure 13).

3.3. Hardness Test

Figure 14 schematically indicates the position of the points where Vickers hardness measurements were performed on both drawn and compressed specimens.
Table 7 centralizes the Vickers hardness values obtained from the specimens subjected to tensile tests. The hardness values were measured on the specimen studied at different values of temperature and strain rate.
Figure 15 presents the variation of Vickers hardness vs. deformation temperature for specimens subjected to tensile tests. By increasing the strain rates from 0.001 1/s to 0.089 1/s the hardness values increase. The highest hardness value was 168 HV at 0.089 1/s and 800 °C and the lowest was 146 HV at 0.001 1/s and 1100 °C. A more significant influence on hardness was the deformation temperature. This can be seen by increasing the temperature from 800 °C to 1100 °C, resulting in a decrease in the hardness values for all strain rates.
Table 8 centralizes the Vickers hardness values obtained for the specimens subjected to compression tests at different temperatures and strain rates. Vickers hardness vs. temperature and strain rates are presented in Figure 16.
The hardness values decreased steadily with increasing temperature up to 900 °C. Above 900 °C, a slight increase in hardness was observed for all strain rates. The greatest increase in hardness at temperatures above 900 °C was observed at strain rates of 5.72 1/s and 4.67 1/s.

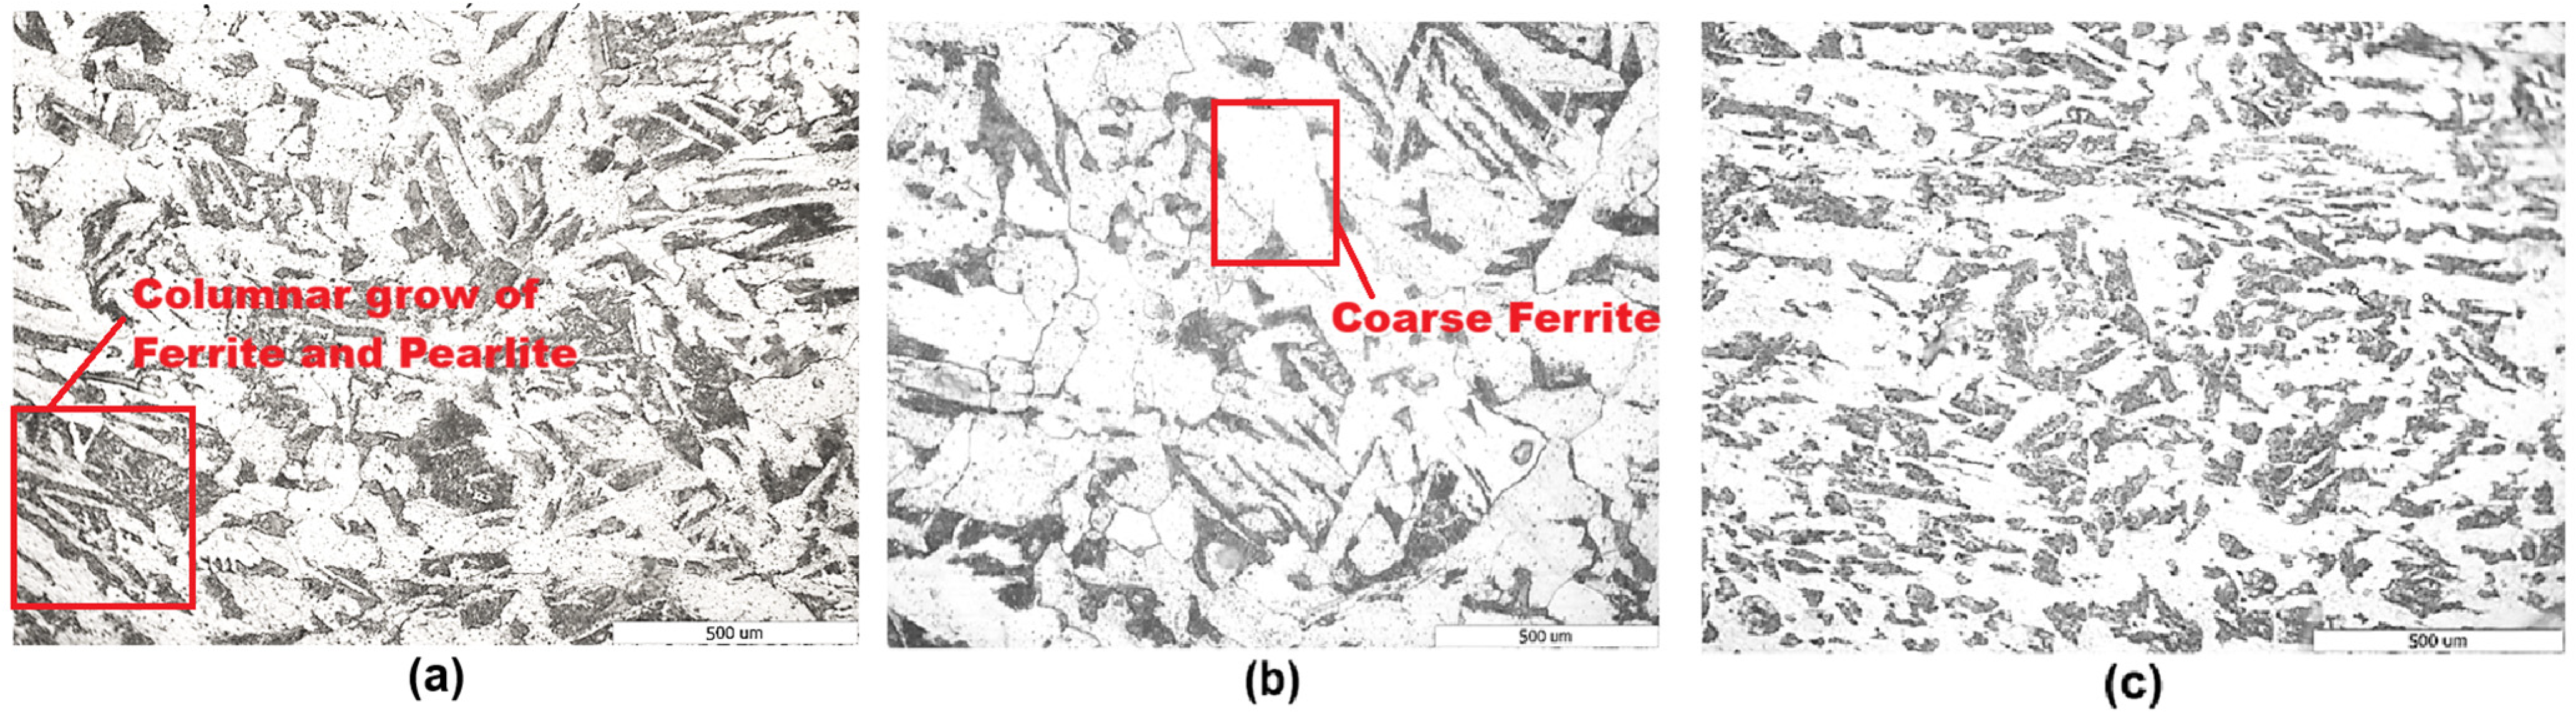
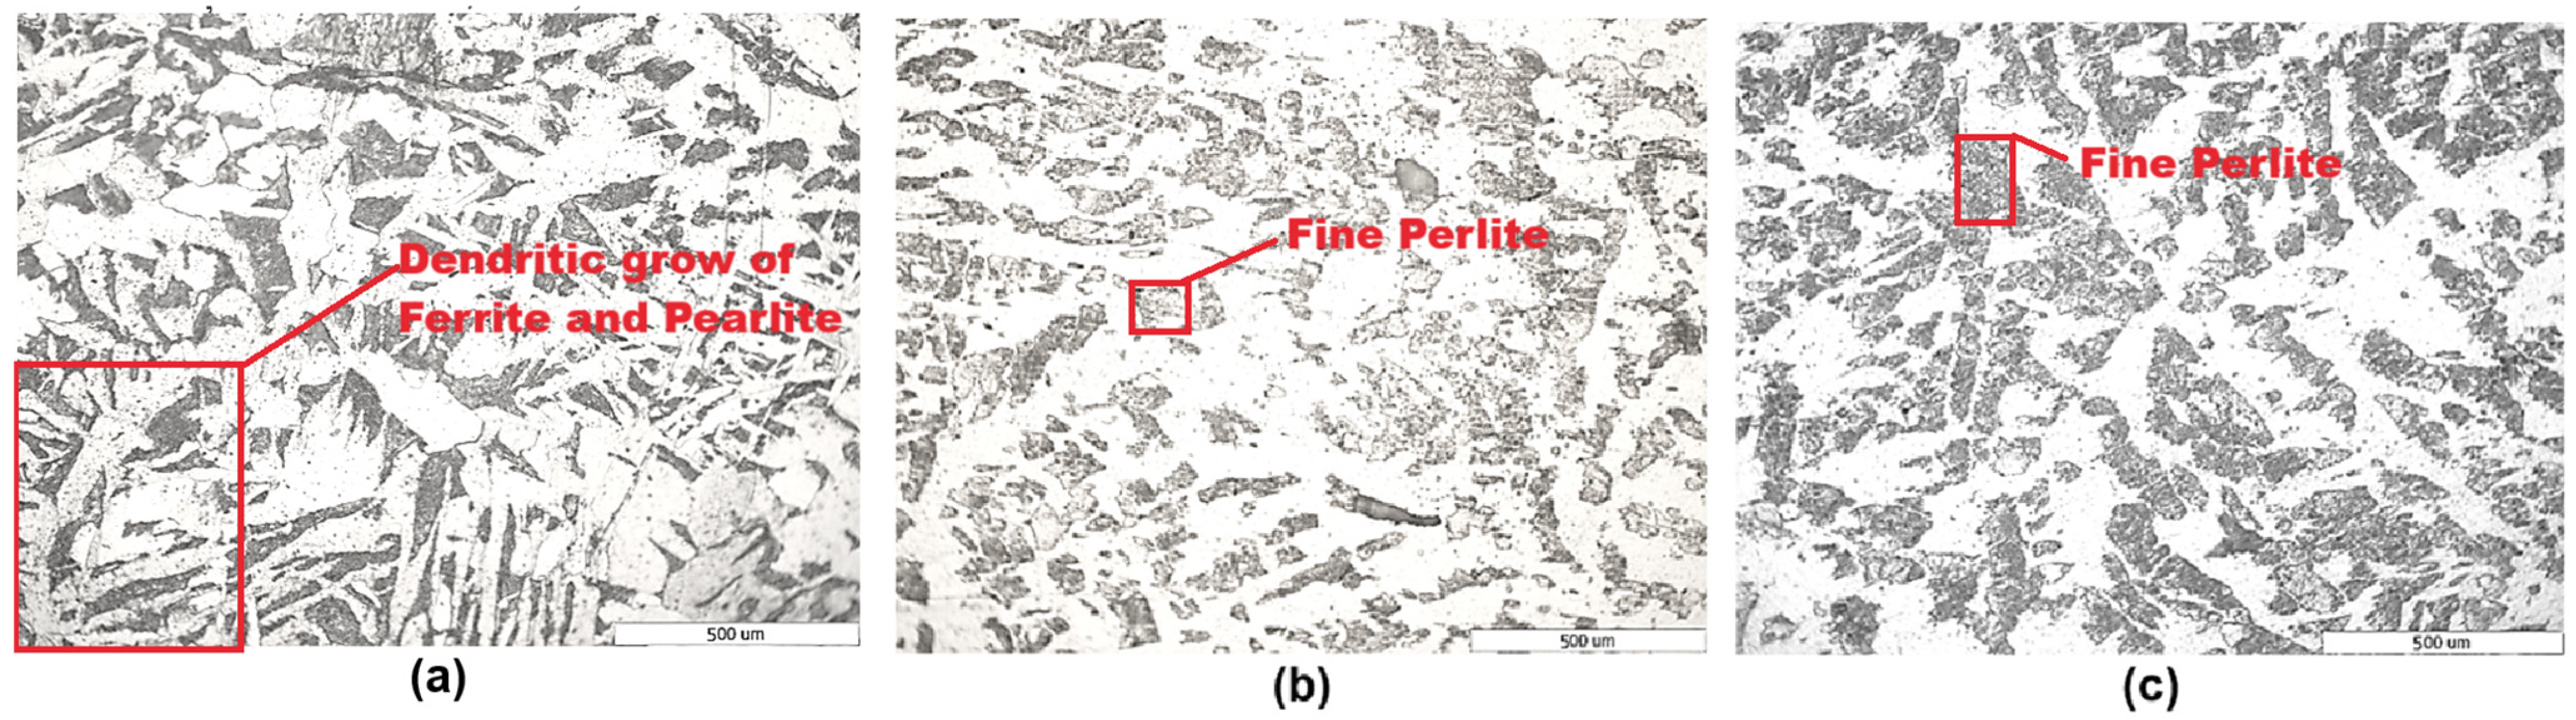
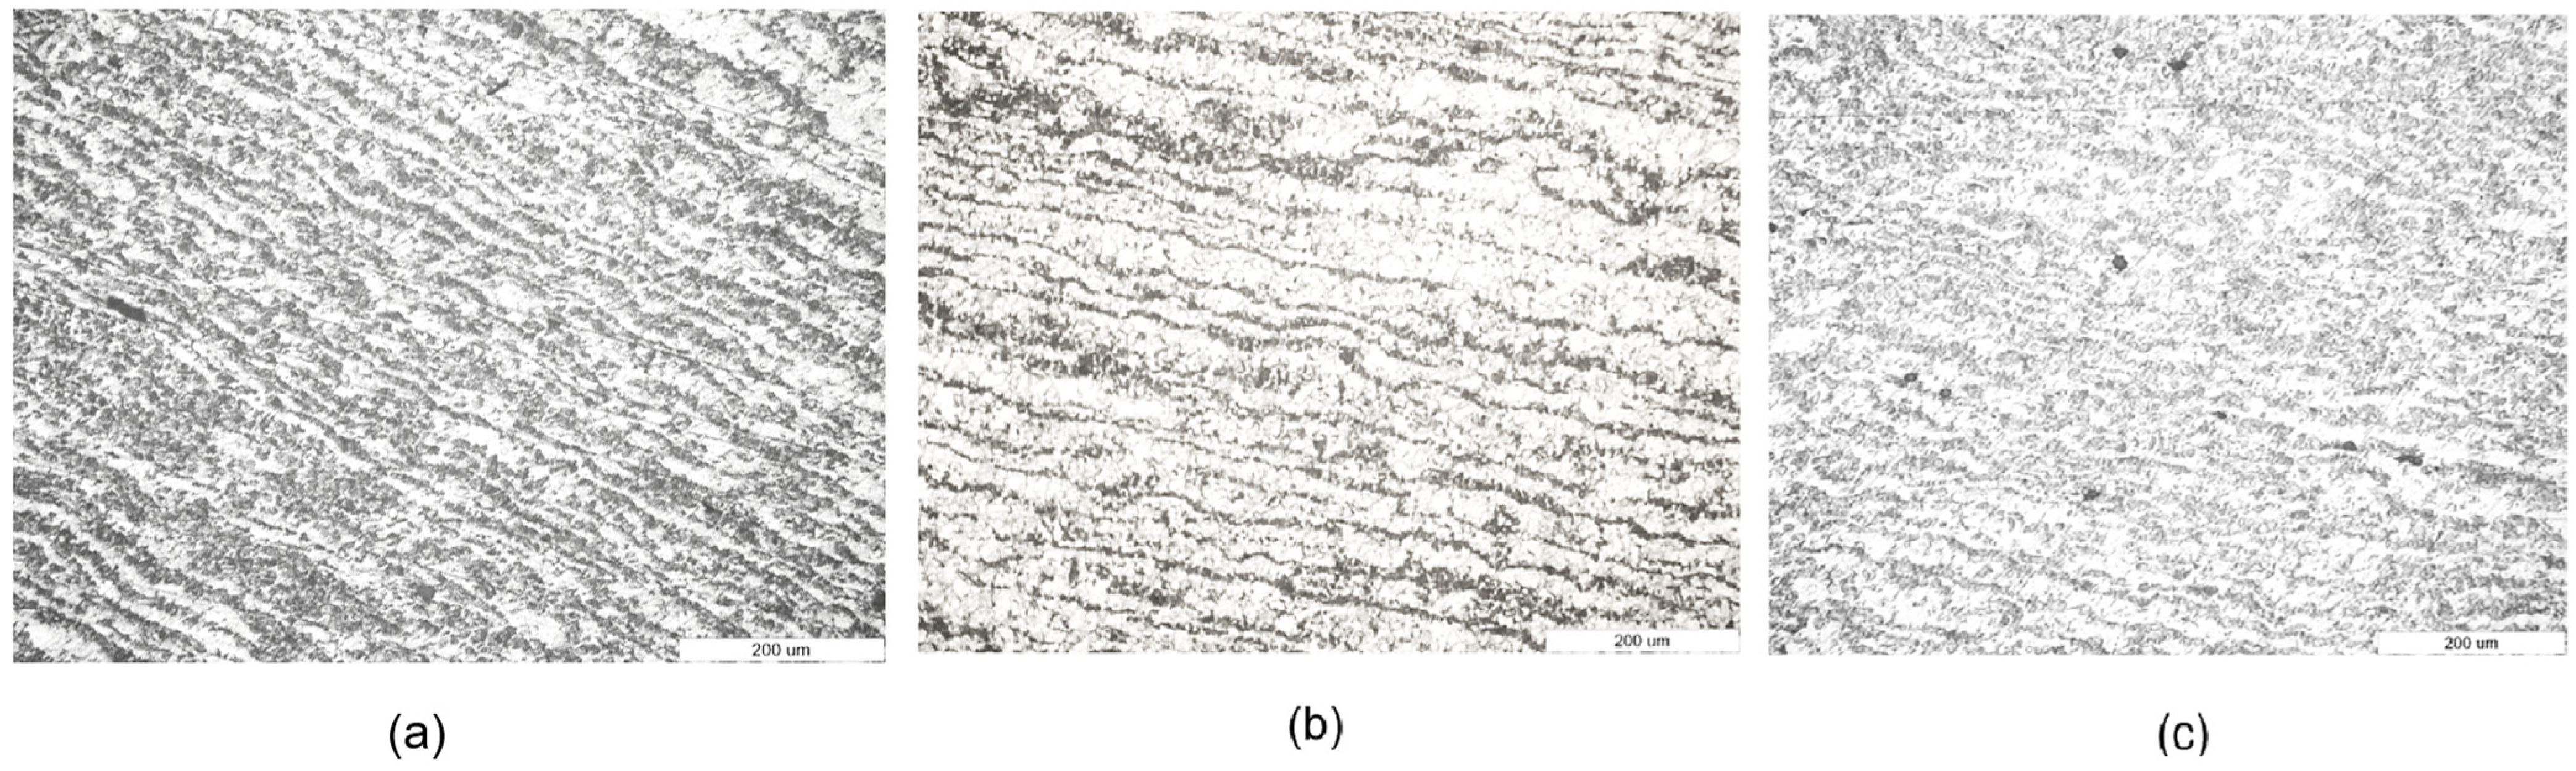
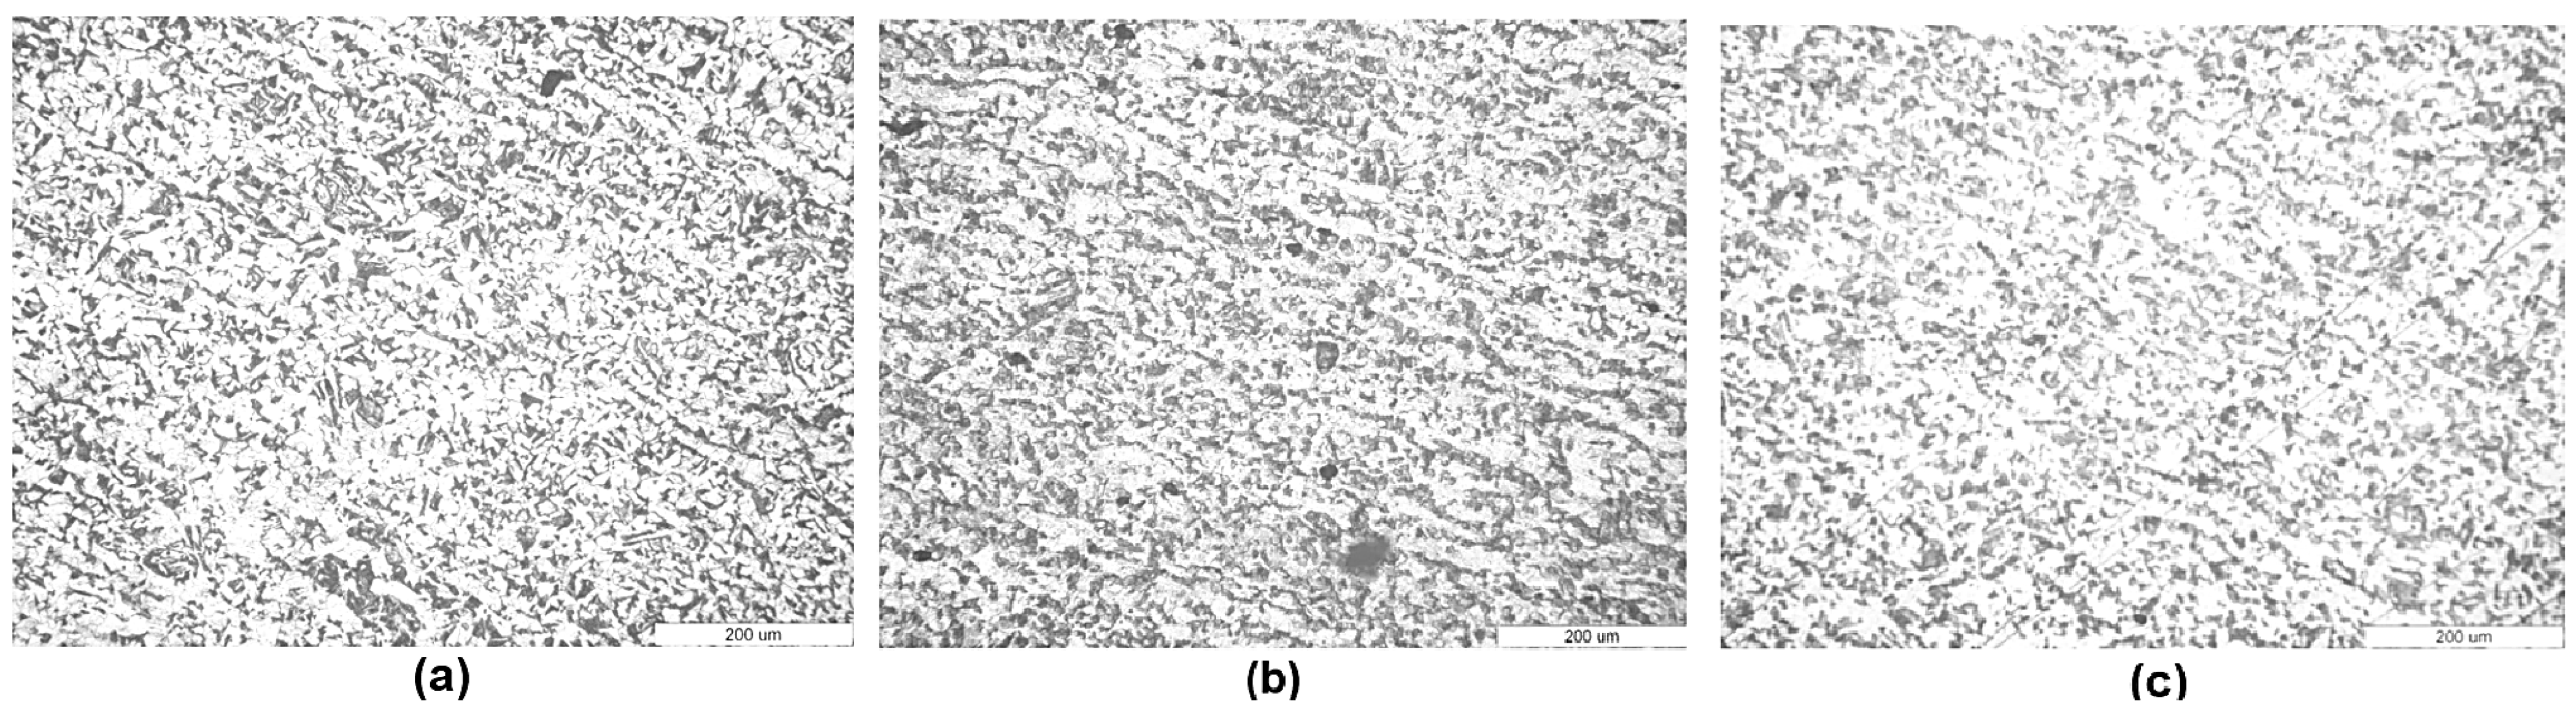
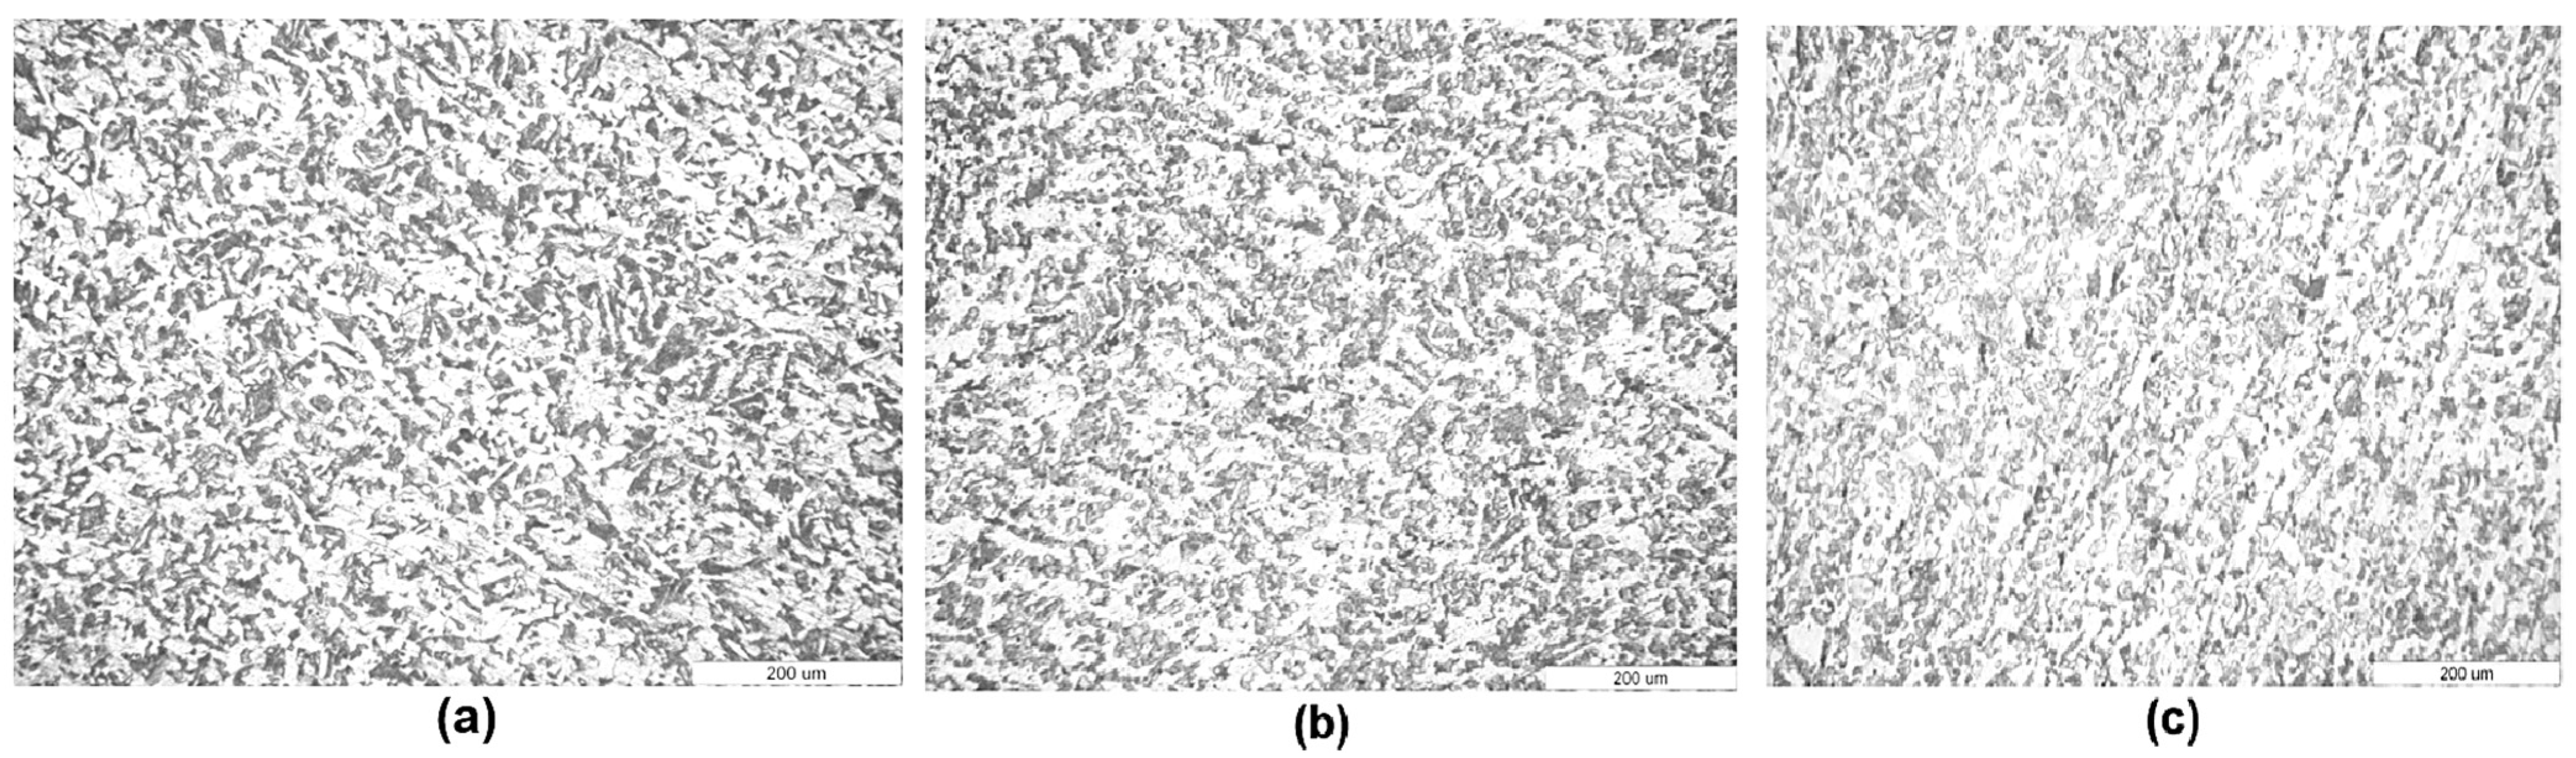
3.4. Microstructural Analysis

The fracture’s microstructure was optically inspected in order to analyze the effects of the temperature and strain rate on C22 steel. In order to obtain optical microscopy images, it is necessary to prepare the surfaces of the metallographic specimens to be analyzed. The specimens were ground on a grinding machine with abrasive paper, then polished on a felt that was sprinkled with alumina. Following the grinding and polishing operations, the metallographic specimens were chemically etched with a 2% nital solution. The presence of ferrite–pearlite microstructures was observed in Figure 17. The ferrite is light in color and the pearlite is dark in color.
Figure 18, Figure 19, Figure 20 and Figure 21 present the optical microscopy images of the tensile test specimens at various temperatures and strain rates. It can be observed that as the temperature increased, so did the formability. At temperatures of 800 °C, the transformation into austenite was not complete following deformation and water quenching; weak traces of austenite and traces of bainite could still be observed. The austenitization temperature of C22 steel is 1060 °C.
By increasing the temperatures to 900 °C, 1000 °C, and 1100 °C after deformation and water quenching, the amount of martensite increases. Figure 19b, Figure 20a–c and Figure 21a,b show this aspect. Martensite appears in an acicular form as a result of the rapid quenching of the steel. In Figure 19c and Figure 21c, a recrystallization of grains with a clustered fine pearlitic structure can be observed. In Figure 20a and Figure 21a, an increase in columnar dendritic grains can be observed, while in Figure 20b, the ferrite appears coarse, with a shiny appearance. The presence of dendrites influences the Vickers hardness.
Coarse ferrite is present throughout the area. The ferrites are mostly elongated together with the pearlite [26].
In Figure 18 and Figure 19, the equiaxial zone formed by isotropic crystals is highlighted; those with larger dimensions are due to the longer nucleation period and lower deformation temperature, namely 800 °C or 900 °C. A strong temperature gradient determines the columnar zone, and crystals develop along the gradient, increasing anisotropy, as in Figure 20 and Figure 21.
At the temperature of 1100 °C and at low strain rates, as in Figure 21a, we can observe a tendency of dendrite growth, while at high strain rates we can observe numerous zones of fine pearlite. The microstructures after the compression tests for different deformation conditions are presented in Figure 22, Figure 23 and Figure 24. All optical microscopy images of the specimens were obtained in the compression direction. During deformation at high temperatures, with different deformation rates, the microstructure is formed by coarser ferrite and lamellar pearlite, as in Figure 22, Figure 23 and Figure 24a–c.
Following the microscopic examination, as in Figure 20, Figure 21, Figure 22, Figure 23 and Figure 24, it was revealed that, after hot plastic deformation by compression, the structural elements resulting after water quenching at the deformation temperature were most probably ferritic–pearlitic with traces of martensite, bainite in some cases, and residual austenite. The structure was ferrite-pearlitic, and ferrite, which is light in colour and shows a more noticeable elongation perpendicular to the direction of compression. A compression test does not reveal the cavitation phenomenon. Cavities may cause premature failures to occur during deformation in the case of heat processing, and they may also result in worse qualities in the finished product.

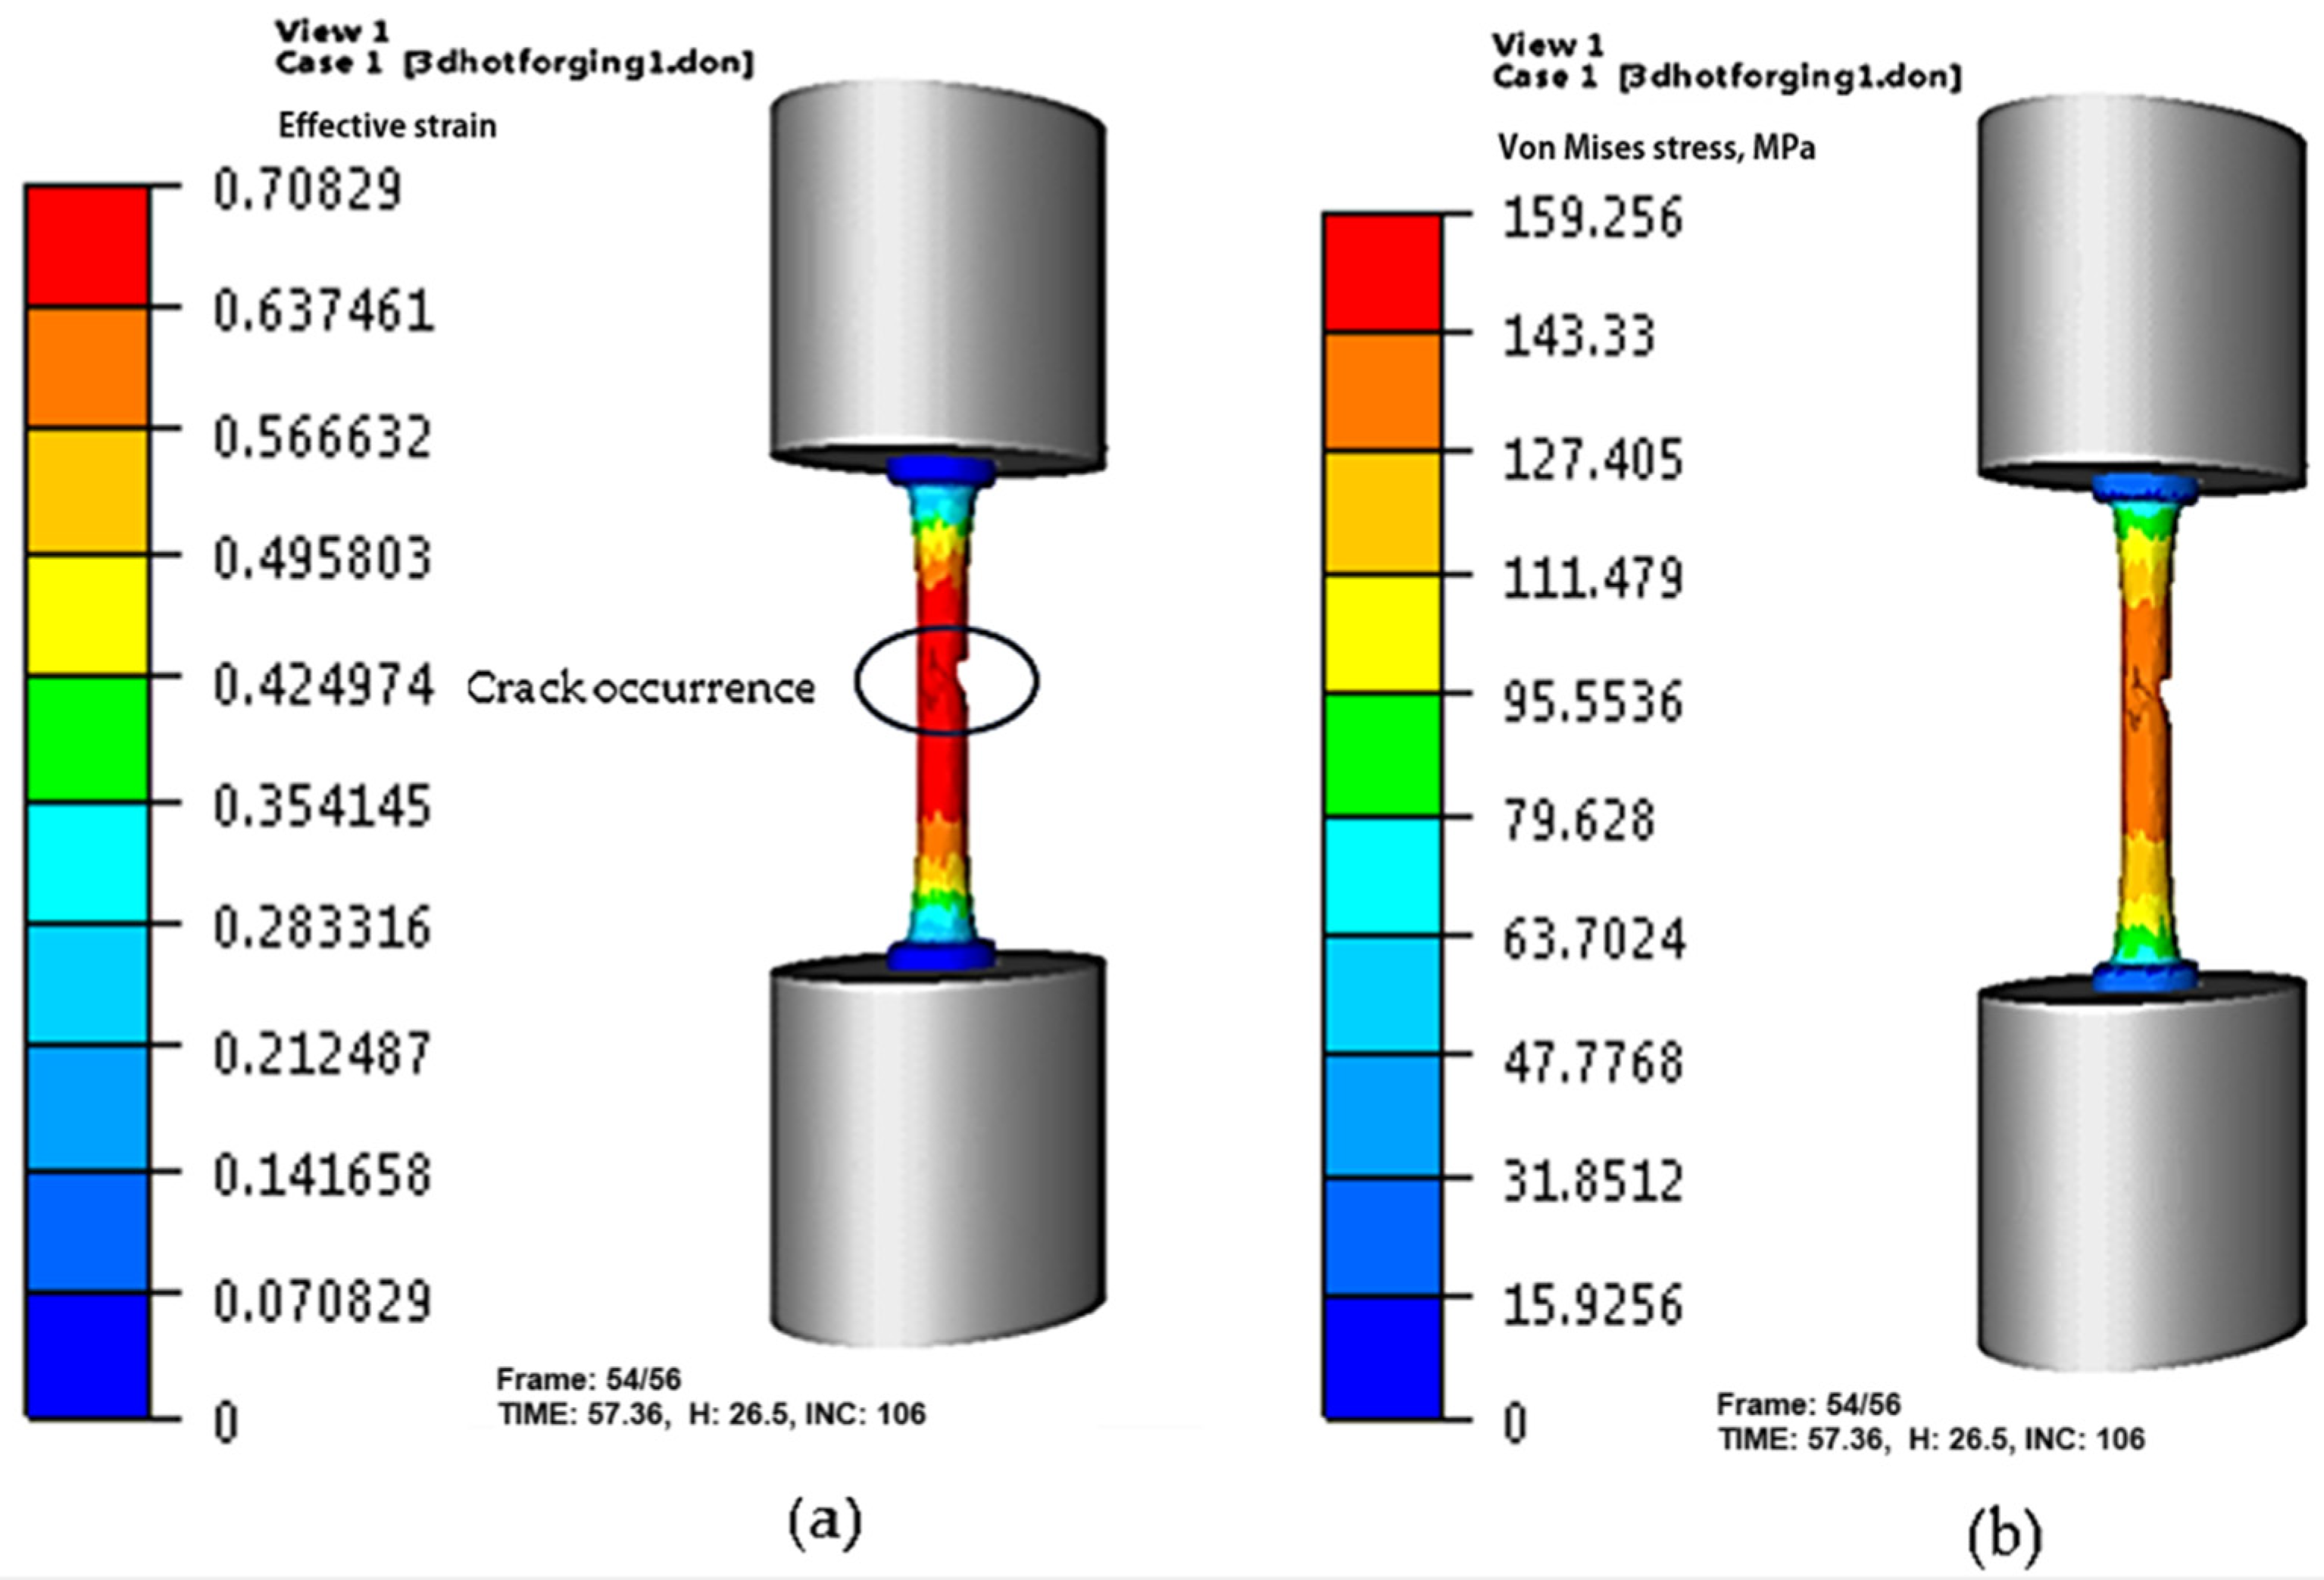
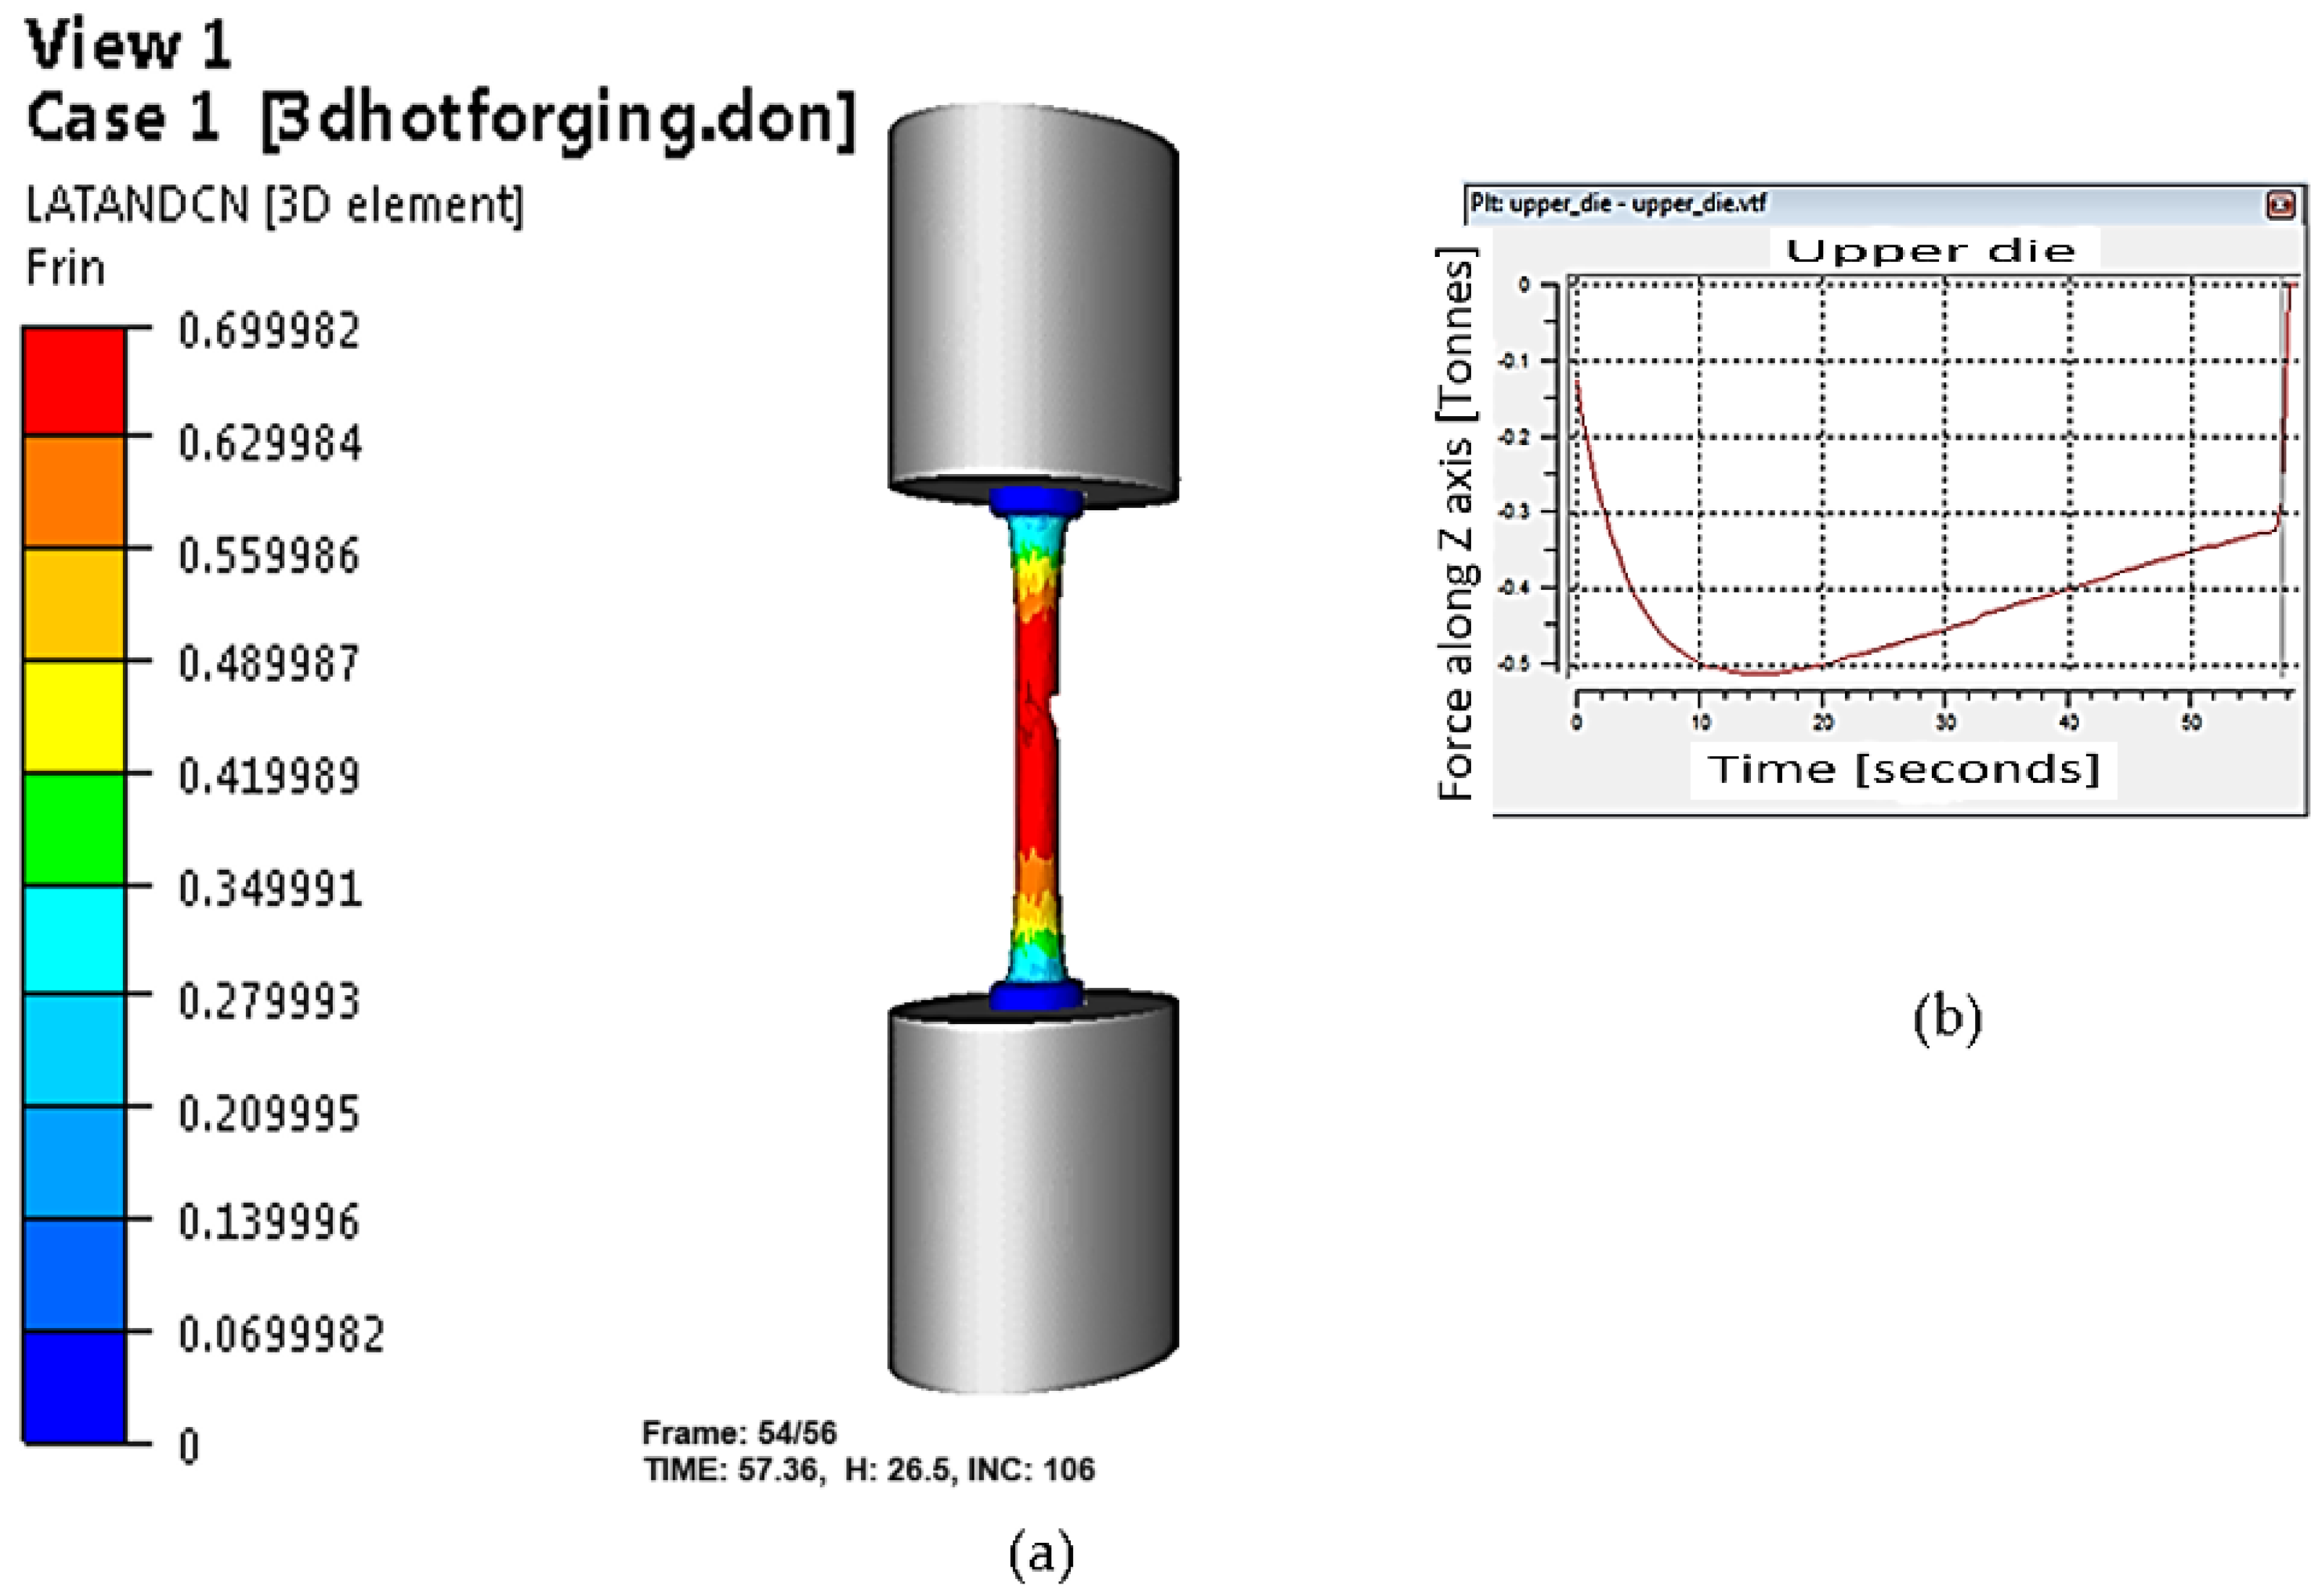
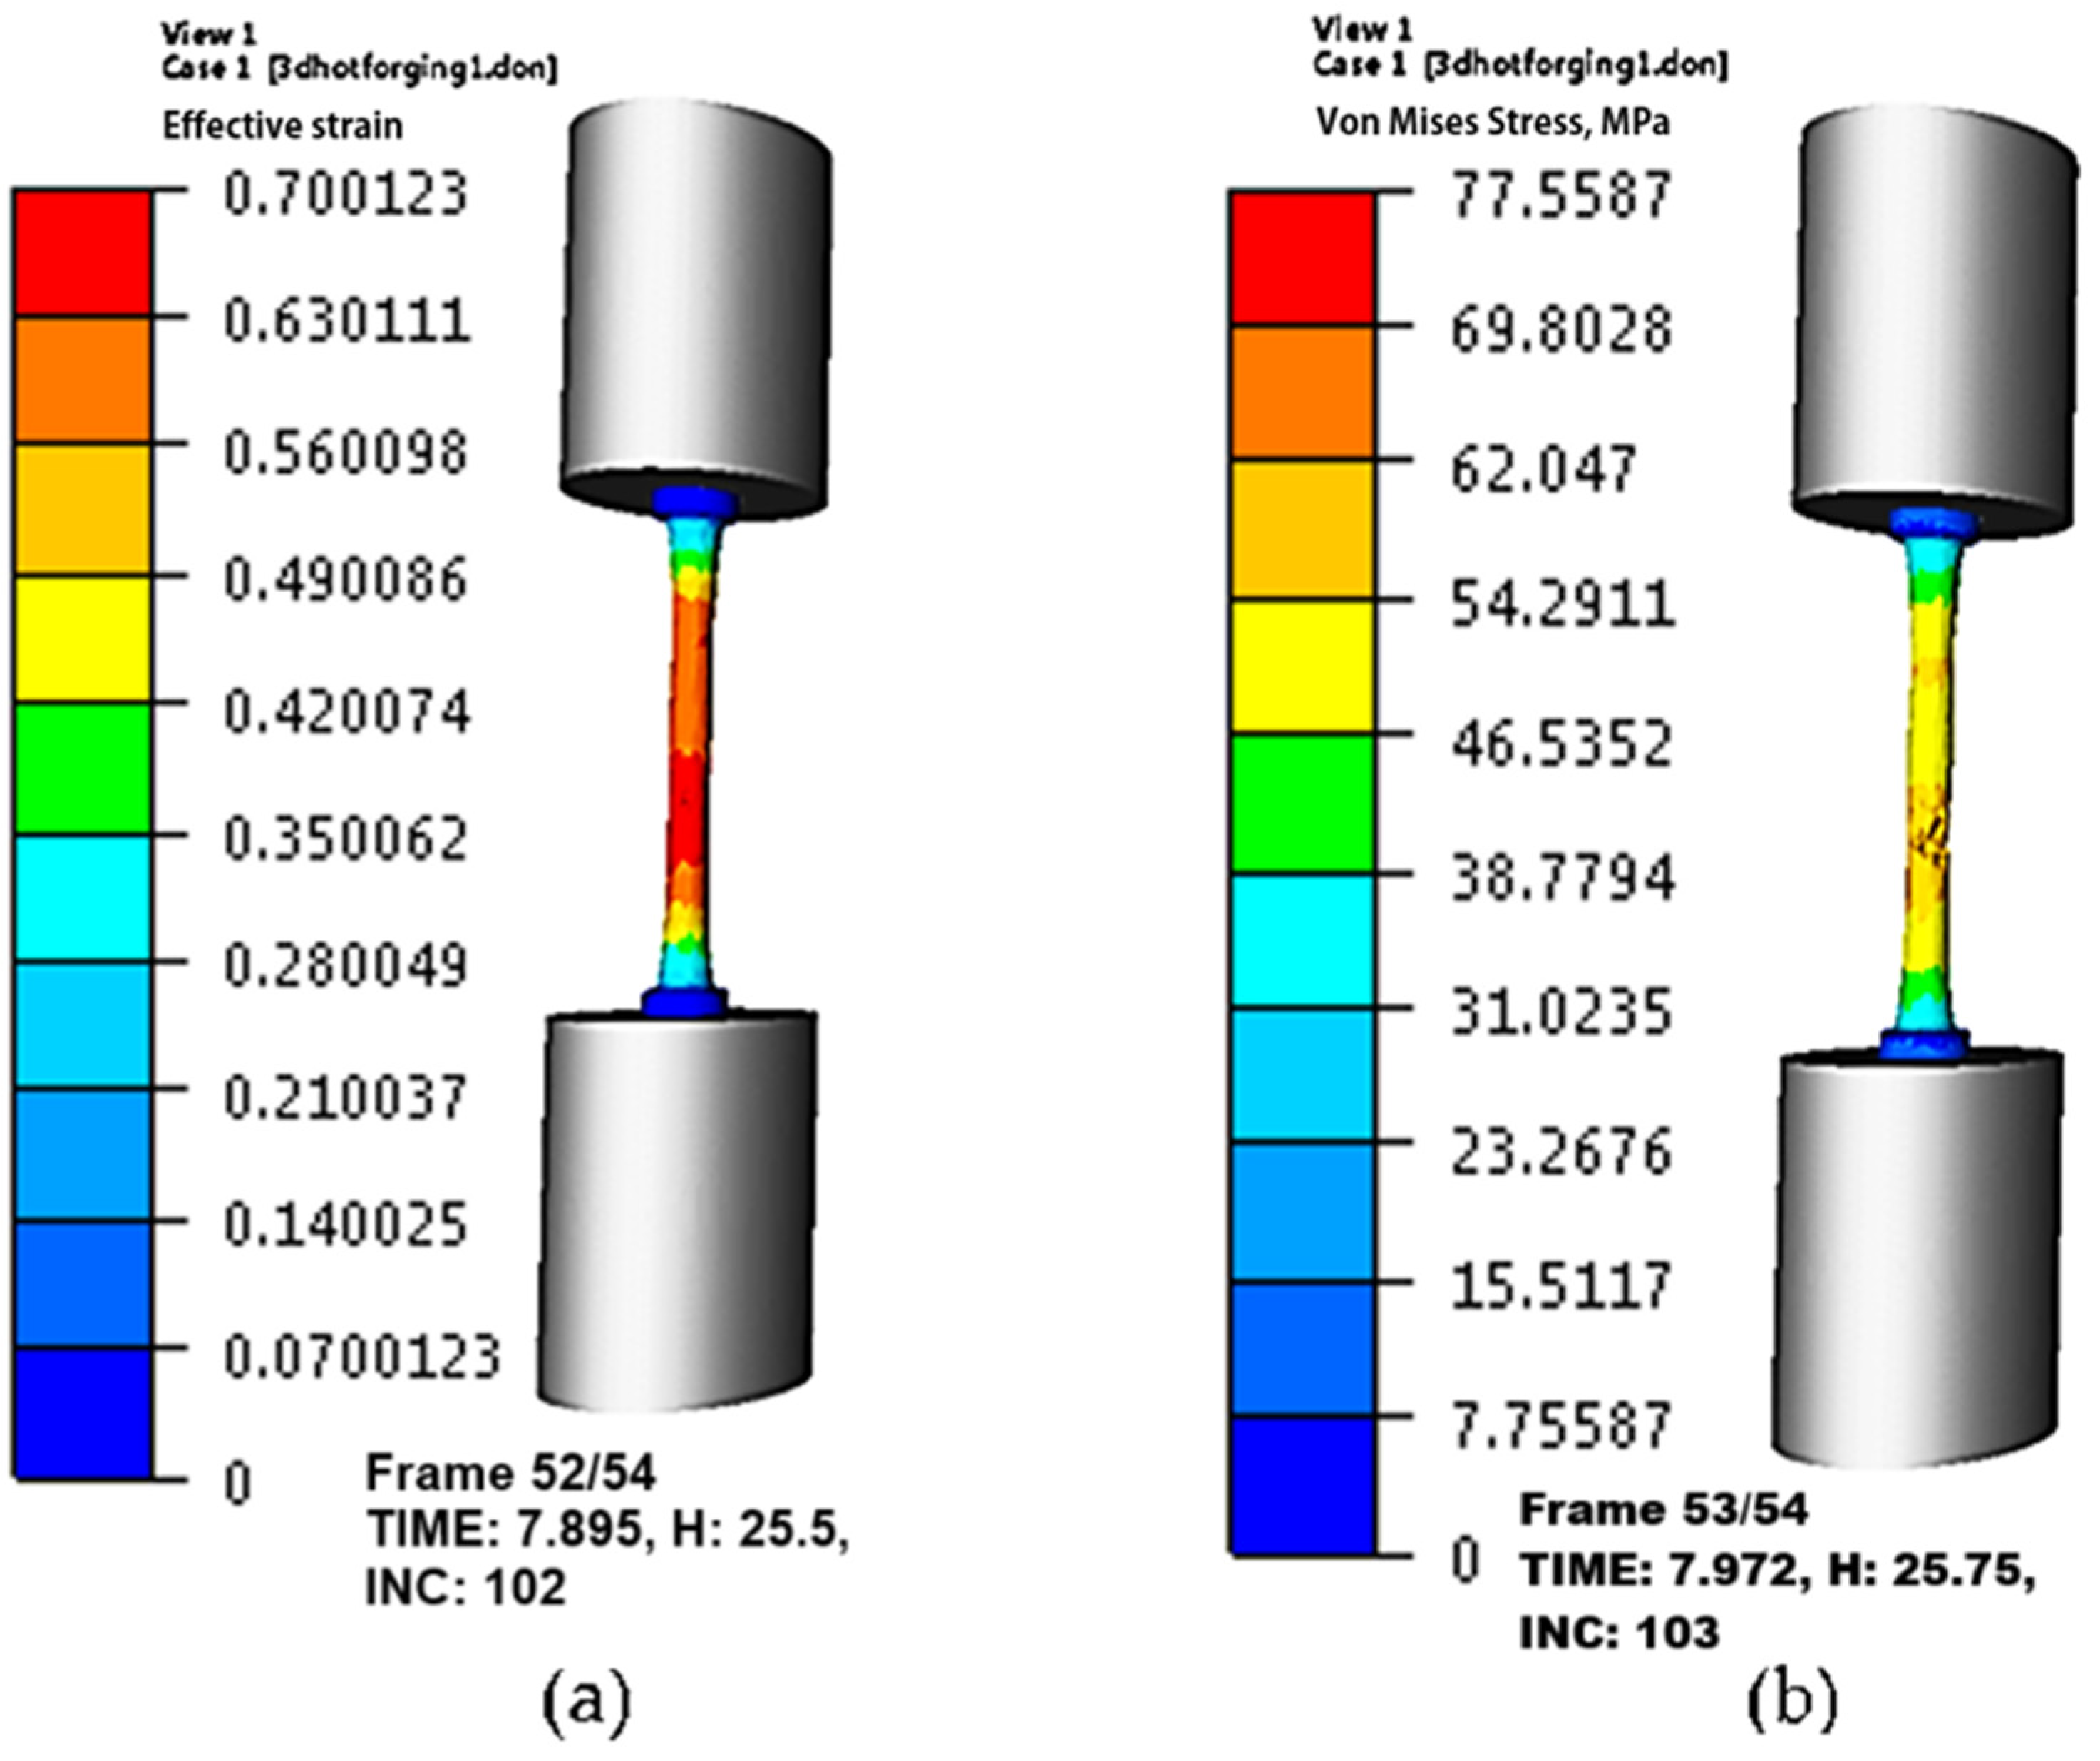
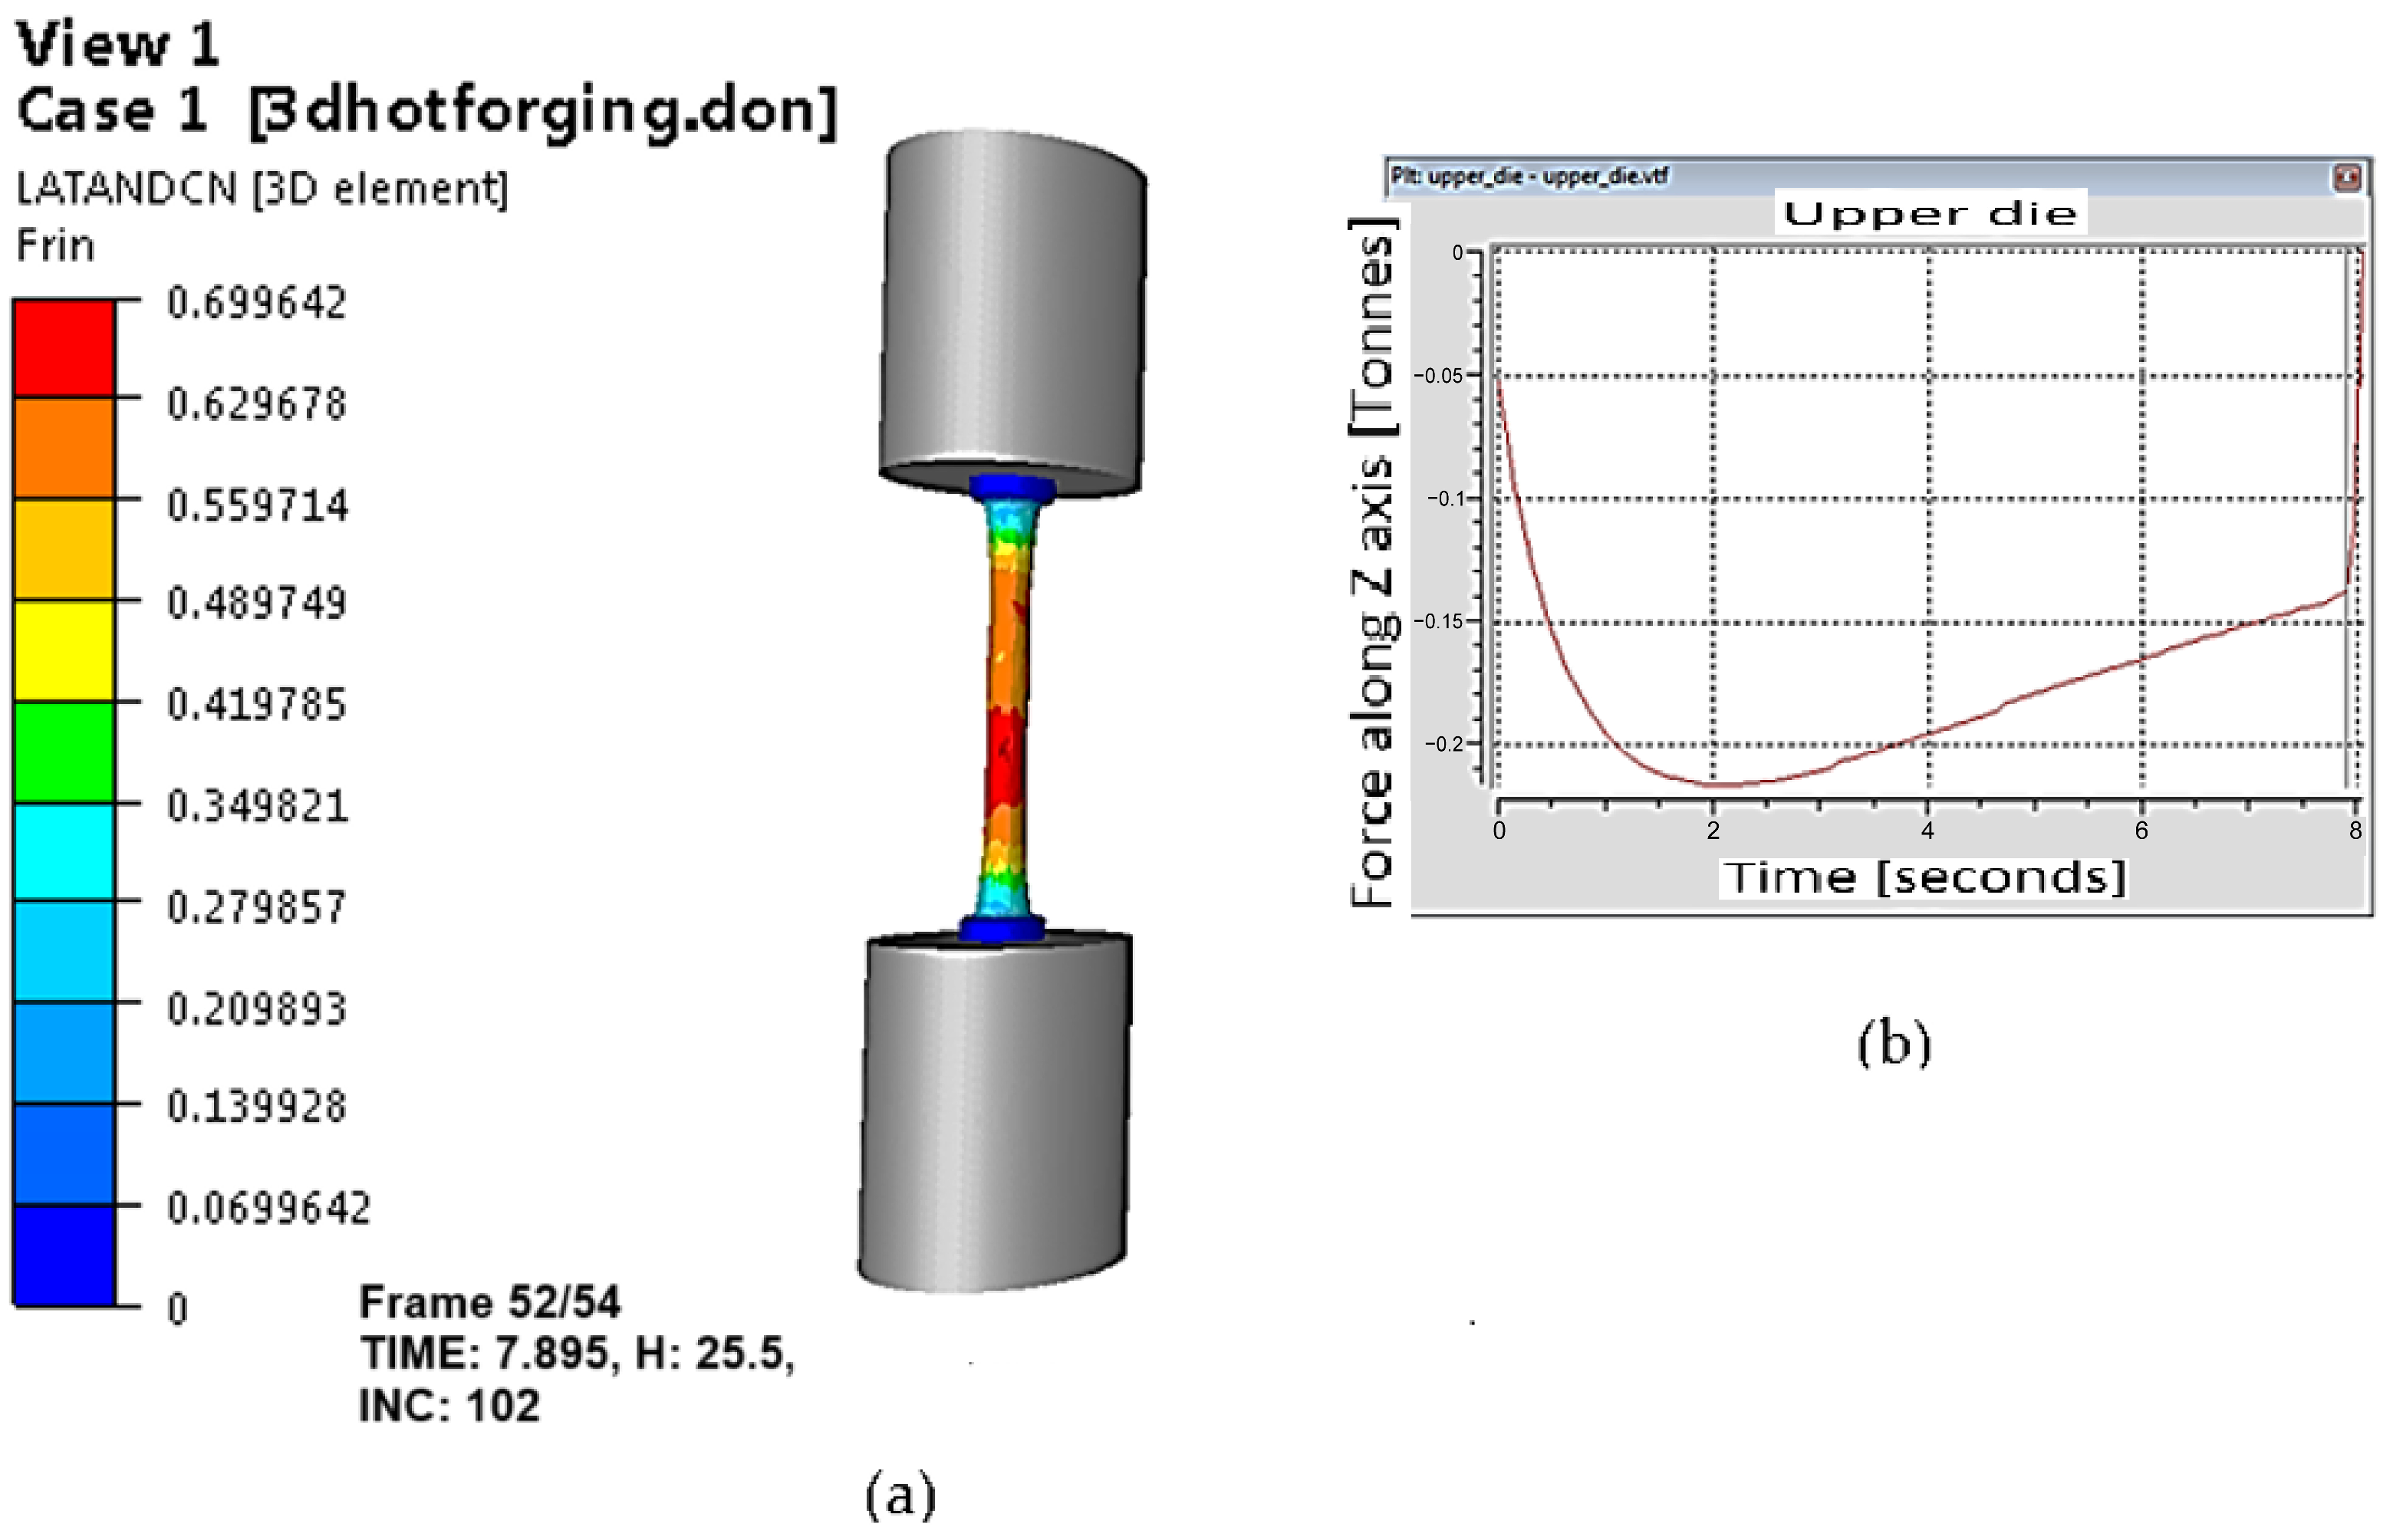
4. Numerical Simulation of Hot Tensile Tests

Since ductile fracture is one of the most prevalent failure patterns in real manufacturing processes, it is a highly significant phenomenon when considering metal forming at high temperatures. A material’s strain bound in a particular thermomechanical pathway is defined by the occurrence of ductile fracture, which is linked to the material’s energy conversion as a result of the accumulation of plastic strains that cause fracture. Several studies have examined the fracture and degradation of materials subjected to tensile stress in order to anticipate their propensity to crack during actual machining. In this study, the cumulative damage was calculated, and the steel’s fracture was predicted using the normalized Latham–Cockroft (L-C) fracture criterion, which emphasizes the direct relationship between tensile stress and damage buildup [26,27]. The Latham–Cockroft fracture model (Equation (8)) assesses damage based on the accumulation of maximum tensile main stress ( σ m a x ) and differential plastic strain ( d ε ¯ ). The following is the standard formula for the normalized L-C criterion [34]:
0 ε ¯ f σ m a x σ ¯ d ε ¯ = C f
where the critical damage value at the time of crack onset is denoted by Cf. It describes the maximum plastic deformation work per unit volume prior to material fracture and, thus, establishes the material’s fracture-resisting capacity. It is the definite integral of the maximum principal stress, σmax, over the equivalent plastic stress σ ¯ , from zero to the strain at fracture, ε ¯ f . The maximum primary stress, equivalent plastic strain, equivalent fracture strain, and critical damage value all equal the tensile flow in the uniaxial tensile condition.
These fracture criteria stipulate that once the actual damage accumulation equals or exceeds the corresponding critical damage values, the cracking occurs. Among these criteria, the normalized L-C criterion focuses more on the direct action of the tensile stress on the damage accumulation and can be used to accurately predict the surface cracking tendency of metallic materials during actual processing by employing finite element (FE) calculations [10,12,18,27,33,36,39].
The results of the numerical simulations with FE of the material’s behavior under tensile stress are shown in Figure 25, Figure 26 and Figure 27. The nonuniform distribution of the effective stress can be observed due to its localization and the occurrence of the failure phenomenon. In the 3D model simulation of the tensile test, in deformation conditions of T = 800 °C, ε ˙   = 0.089 1/s, the maximum effective strain was 0.70 and the equivalent (von Mises) stress was 143 MPa in the fracture region located in the central part of the specimen (Figure 17).
During the tensile tests, ductile failure of the C22 steel specimen occurred due to the accumulation of plastic tensile strain and tensile stresses. The amount of damage accumulated during the tensile test is reflected in the damaged value.
Figure 26a presents the L-C-normalized criterion for deformation conditions of T = 800 °C and ε ˙   = 0.089 1/s, where the maximum value was 0.69. It can be seen that the maximum damage values calculated by the normalized L-C fracture criterion occurred in the central area of the specimen which is inconsistent with the experimental results. Under these process conditions, the force value increases in the first 15 s until the onset of cracking, after which the force decreases until the specimen breaks occurs after 58 s (Figure 26b).
In the 3D model simulation of the tensile test, under the deformation conditions of T = 1100 °C and ε ˙ =   0.089 1/s, the maximum effective strain value of 0.70 was observed at an equivalent (von Mises) stress of 77.5 MPa in the fracture region of the specimen (Figure 27).
Figure 28a presents the L-C-normalized criterion for deformation conditions of T = 1000 °C and ε ˙ = 0.089 1/s, where the maximum value was 0.69. Also in this case, it can be observed that the maximum damage values calculated by the normalized L-C fracture criterion occurred in the central area of the specimen, which is inconsistent with the experimental results. Under these process conditions, the force value increases in the first 2 s until the onset of cracking, after which the force decreases, and the specimen breaks after 8 s (Figure 28b).
From the deformation force distribution plots in the two cases presented, it can be seen that the force required for deformation is 50% lower after an increase in the deformation temperature value from 800 °C to 1100 °C for the same deformation rate. At the same time, the duration of the deformation process until the occurrence of specimen breaks decreases from 58 s to 8 s.

5. Conclusions

These experimental and numerical analyses led to the following observations:
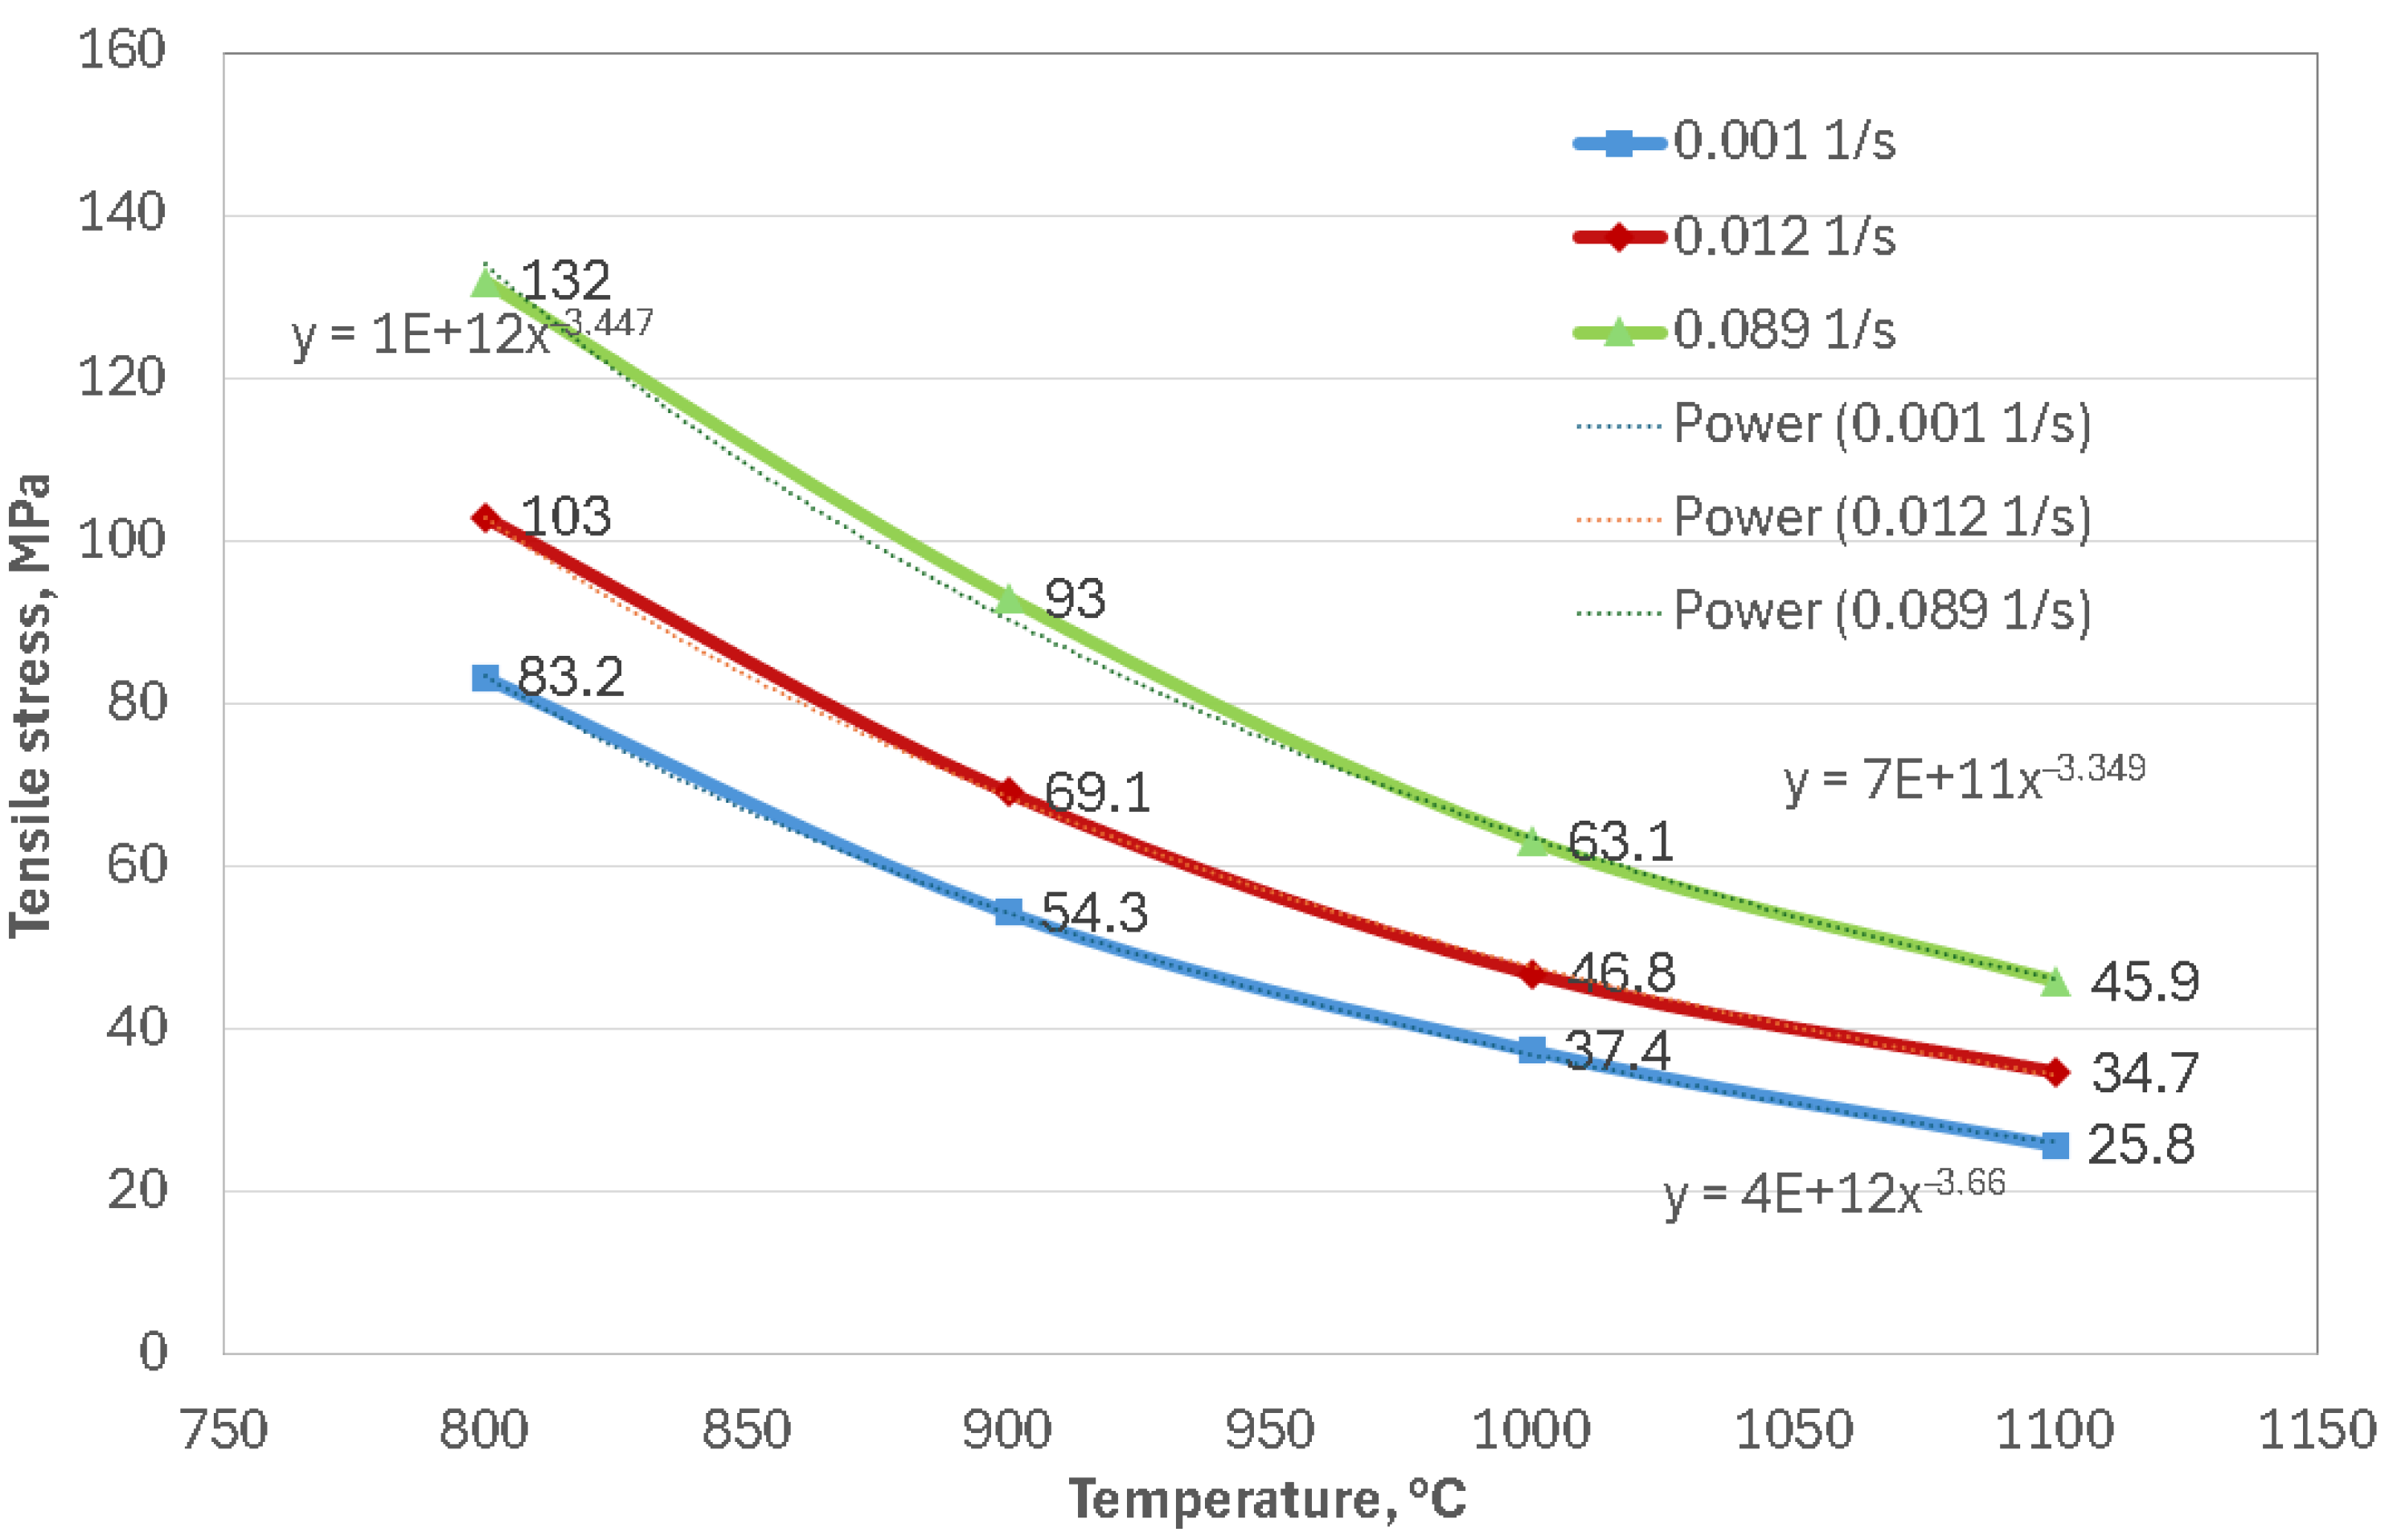
  • Temperature and strain rate have a major impact on tensile stress value. As strain rate increases, yield stress rises, and as temperature rises, yield stress is impacted. The highest tensile stress values are 132 MPa at the maximum strain rate of 0.089 1/s, 103 MPa at 0.012 1/s, and 83 MPa at 0.001 1/s. Additionally, its macro-tensile fracture surface showed obvious necking, indicating the ductile behavior of the material.
  • The flow stress decreases gradually as the deformation temperature rises. For example, at a strain rate of 0.001 1/s, when the deformation temperature increases from 800 °C to 1100 °C, the peak stress decreases by 58 MPa, from 82 MPa to 24 MPa. The strain rate increases from 0.001 1/s to 0.089 1/s during deformation at 1100 °C, while the peak stress increases from 82 MPa to 128 MPa, reflecting an increase of 46 MPa. This increase is attributed to the short deformation time and high dislocation density of material at a high strain rate.
  • The typical features of the experimental curves indicate the existence of dynamic recrystallization at low strain rates and high temperatures. When the balance between hardening and dynamic recovery occurs, the flow curves exhibit a steady phase with a roughly constant flow stress at the deformation temperatures of 800 °C, 900 °C, 1000 °C, and 1100 °C.
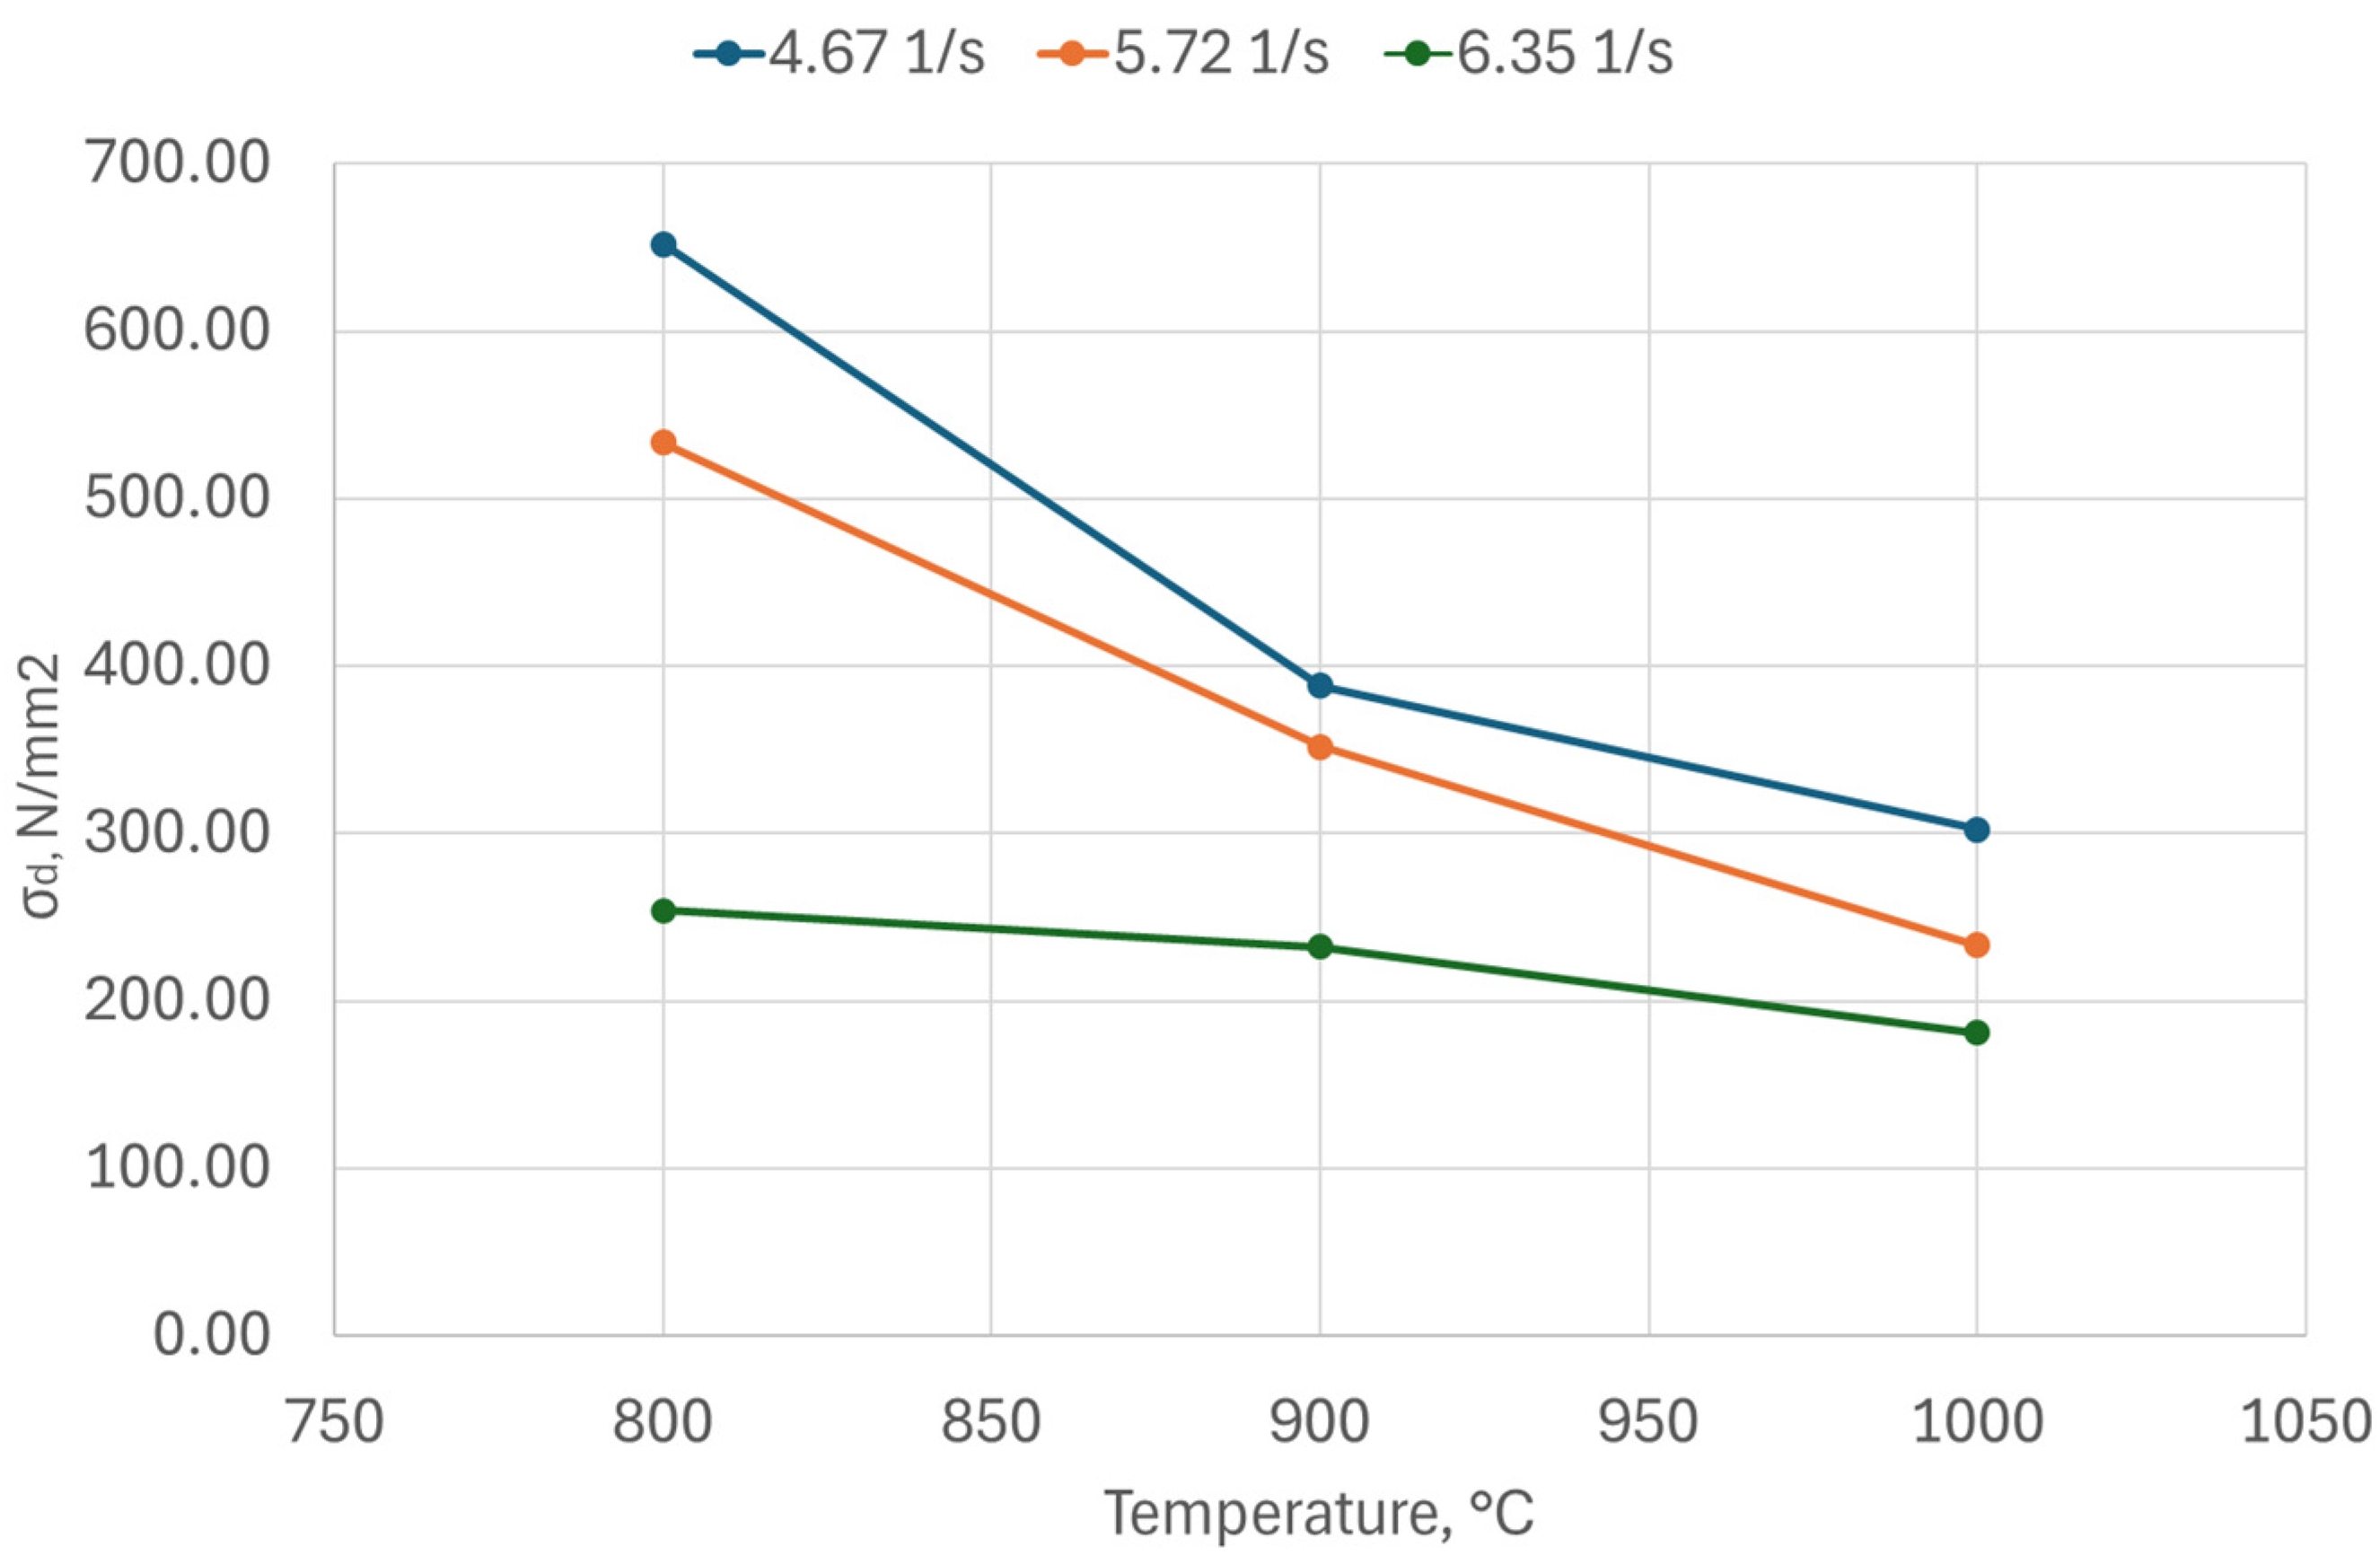
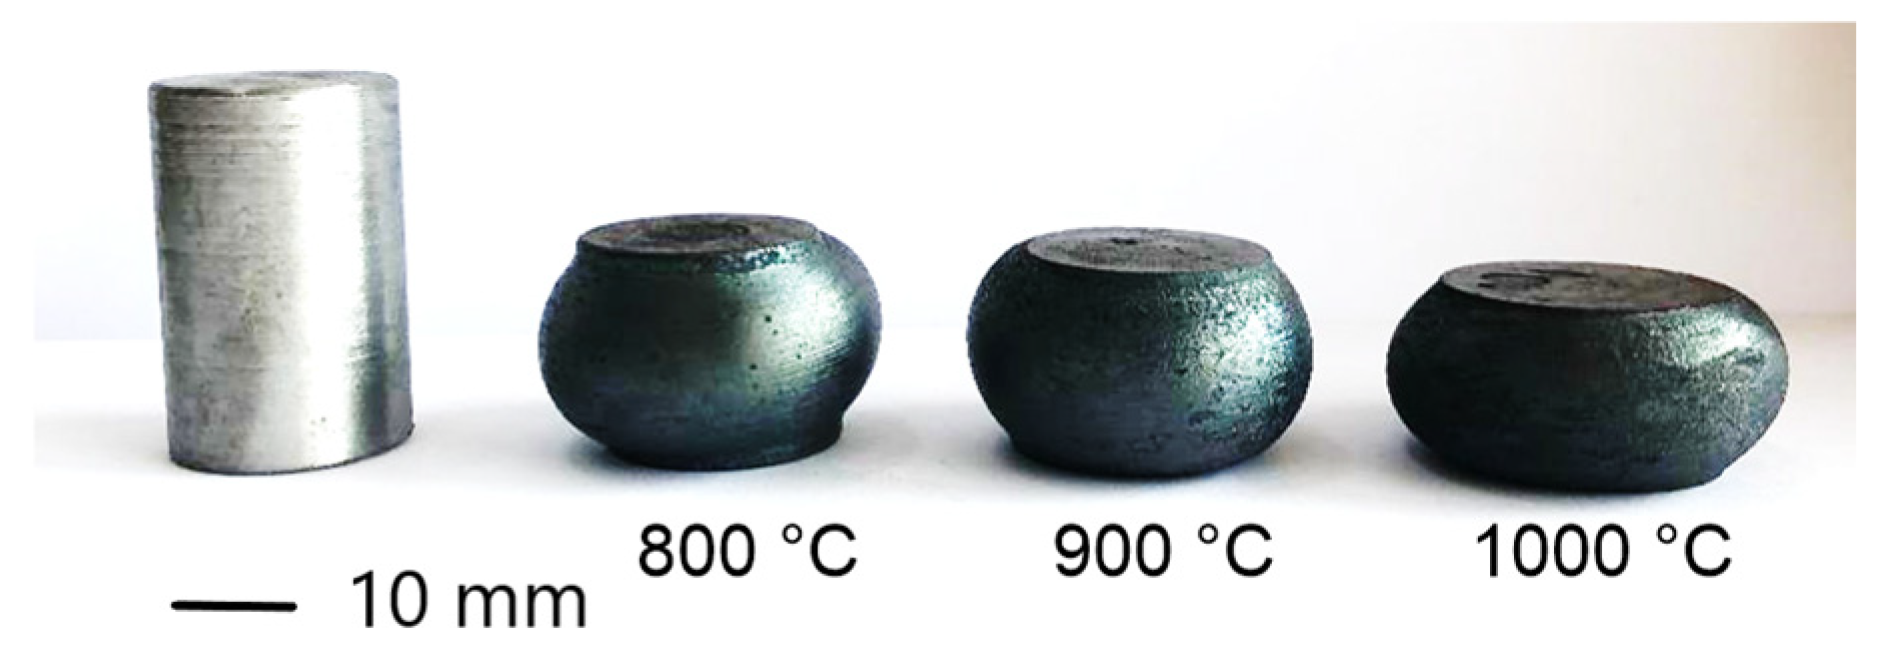
  • The compression test without cracking also indicated ductile behaviour. For the temperature ranges studied in the case of the hammer compression deformation tests, an increase in the strain rate led to a decrease in the strength of the material, and, thus, to an increase in formability.
  • It was found that, depending on temperature, the genuine strain increases slightly as the strain rate increases in the compression testing.
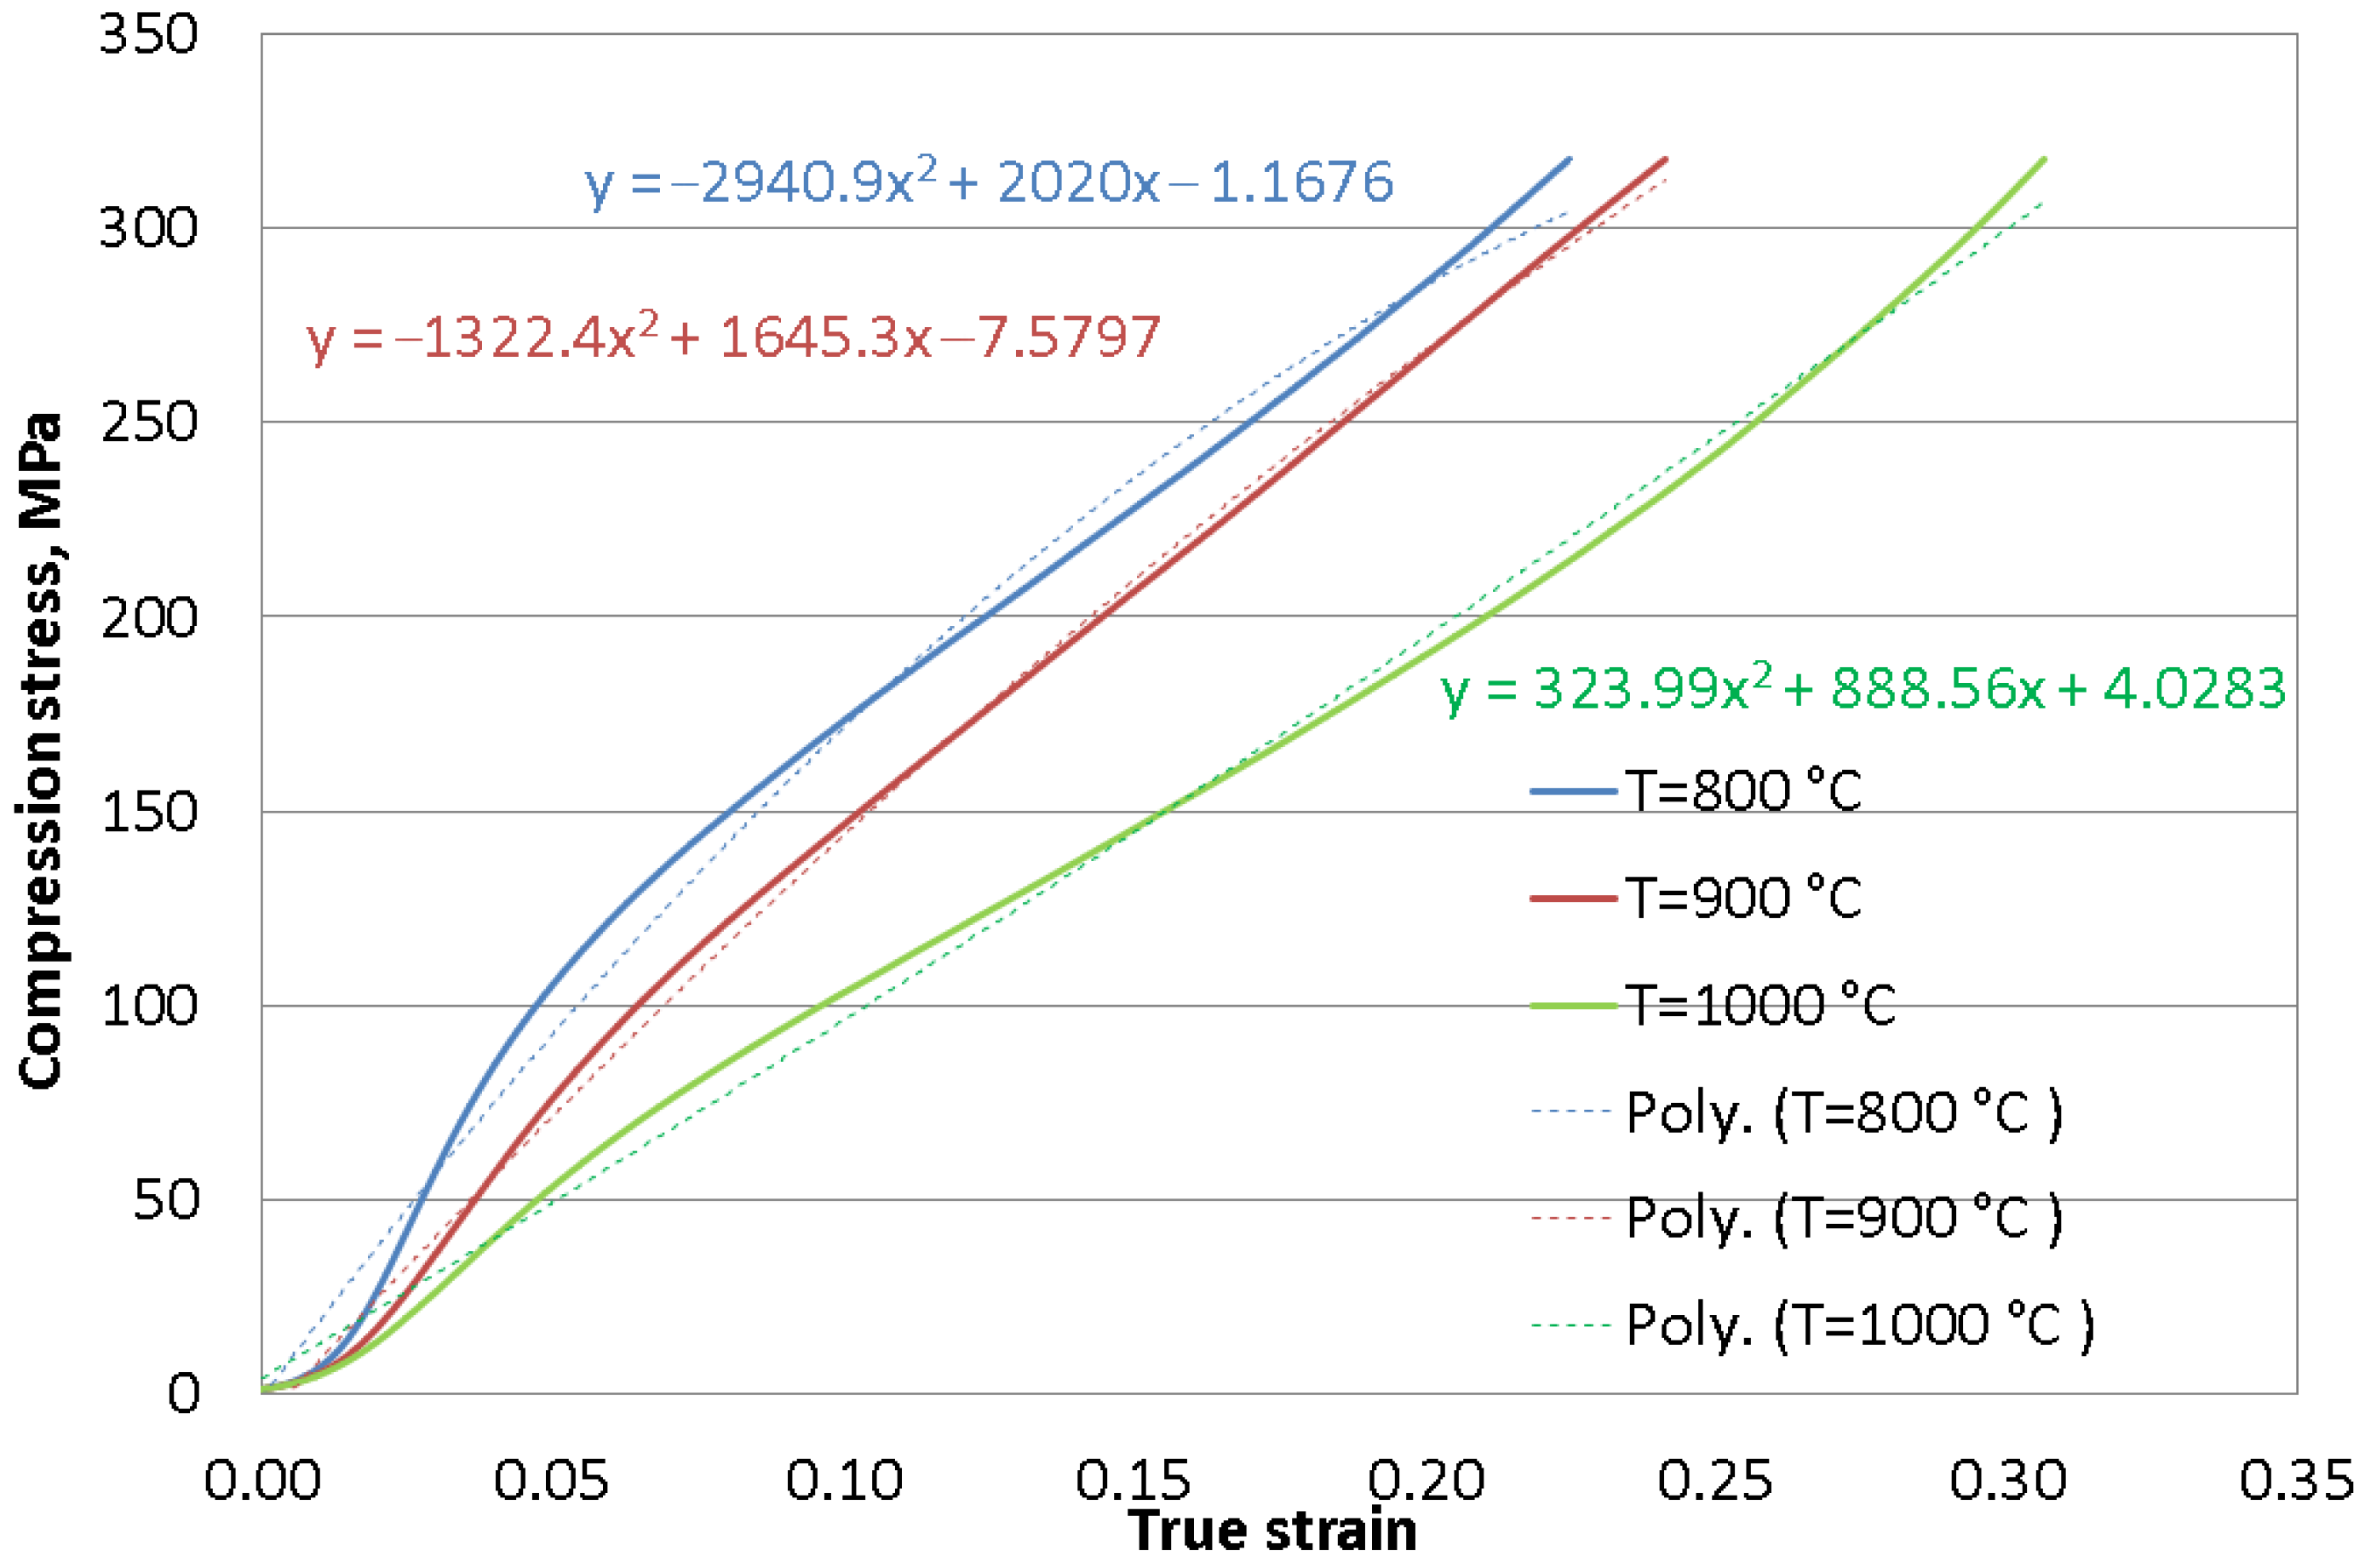
  • At 800 °C, the most significant nonuniformity of the deformations was noted. The nonuniformity of the deformations increased as the strain rate increased. At a strain rate of 0.106 1/s, an expected increase in compression stress on hydraulic press was obtained by increasing the true strain. By increasing temperature from 800 °C to 1000 °C, lower values of compression stress were obtained. The material exhibits a ductile flow, and, when increasing the temperature, the slope of the compression stress variation curve became smoother.
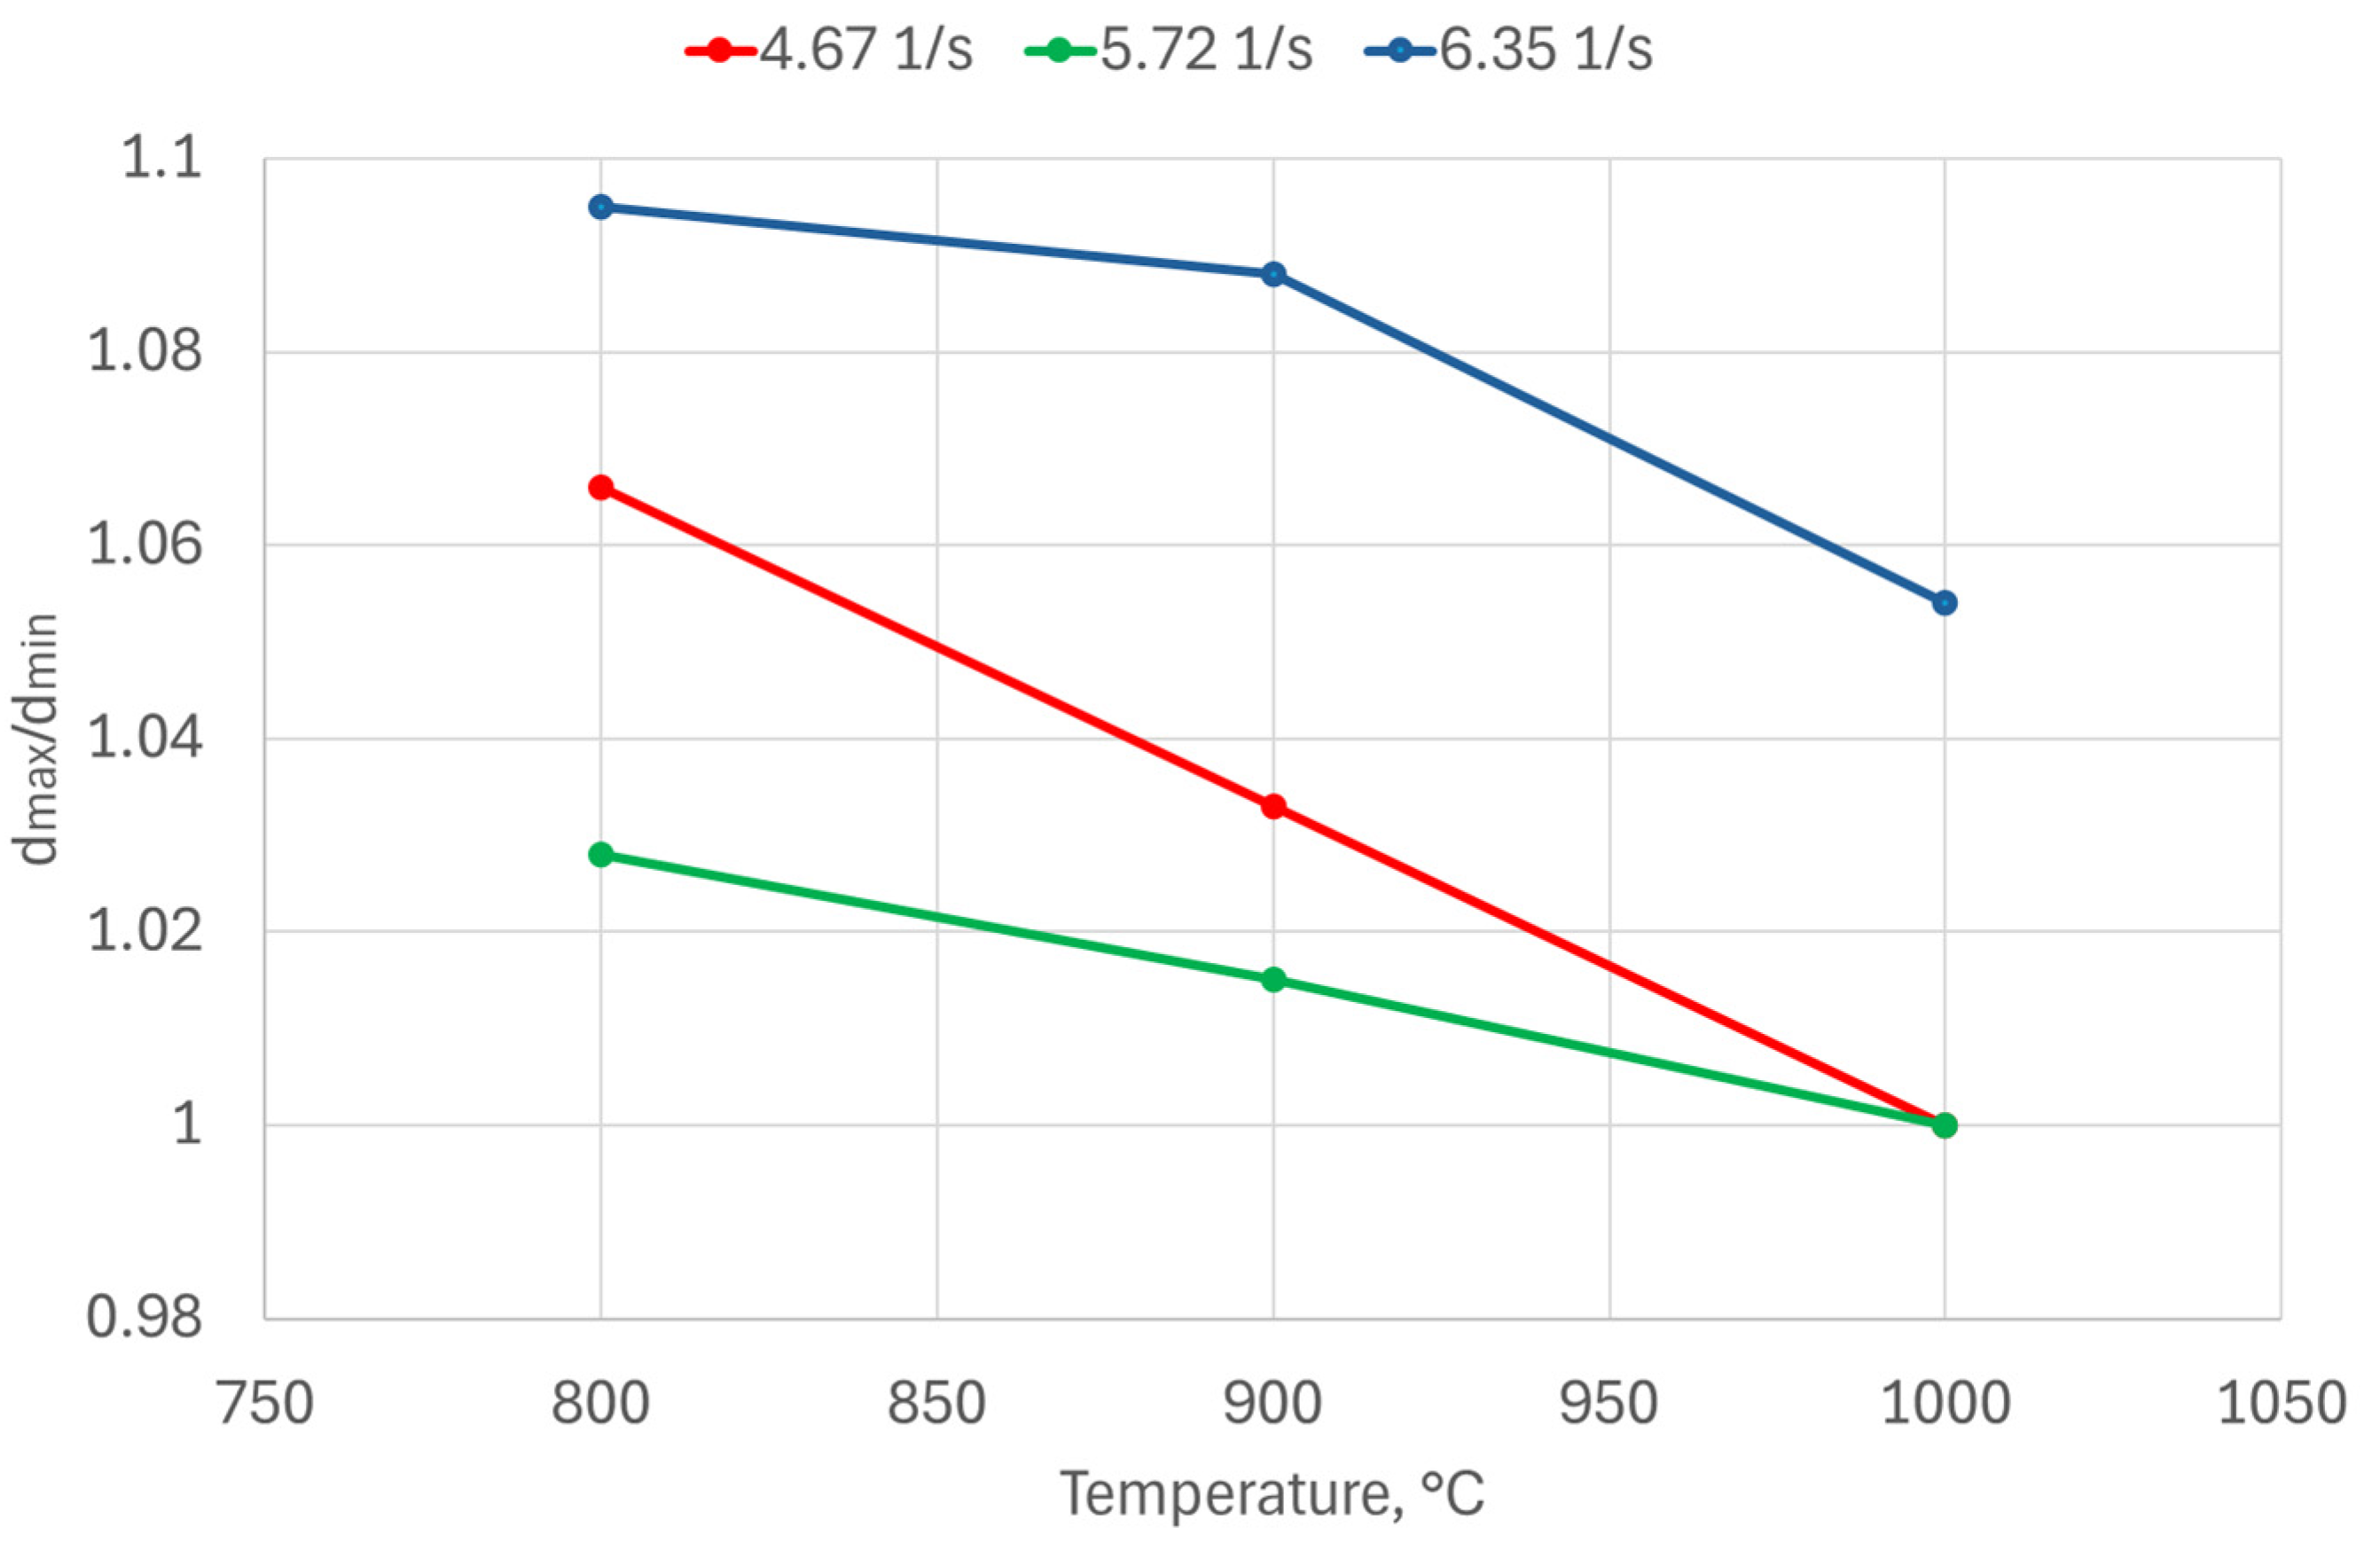
  • Also, the temperature in the compression tests has a major impact on the nonuniformity of the deformations. The degree of nonuniformity rises as the temperature decreases. When the temperature is 800 °C, the most significant nonuniformity of the deformations is seen.
  • Regarding hardness measurements, in the case of the tensile test, when increasing the strain rate from 0.001 1/s to 0.089 1/s, the hardness of the material increases for all studied temperatures. The increase in hardness was, on average, from 162 HV to 169 HV at a temperature of 800 °C and from 146 HV to 149 HV at a temperature of 1000 °C. Regarding the influence of temperature, its increase leads to a decrease in the hardness of the material.
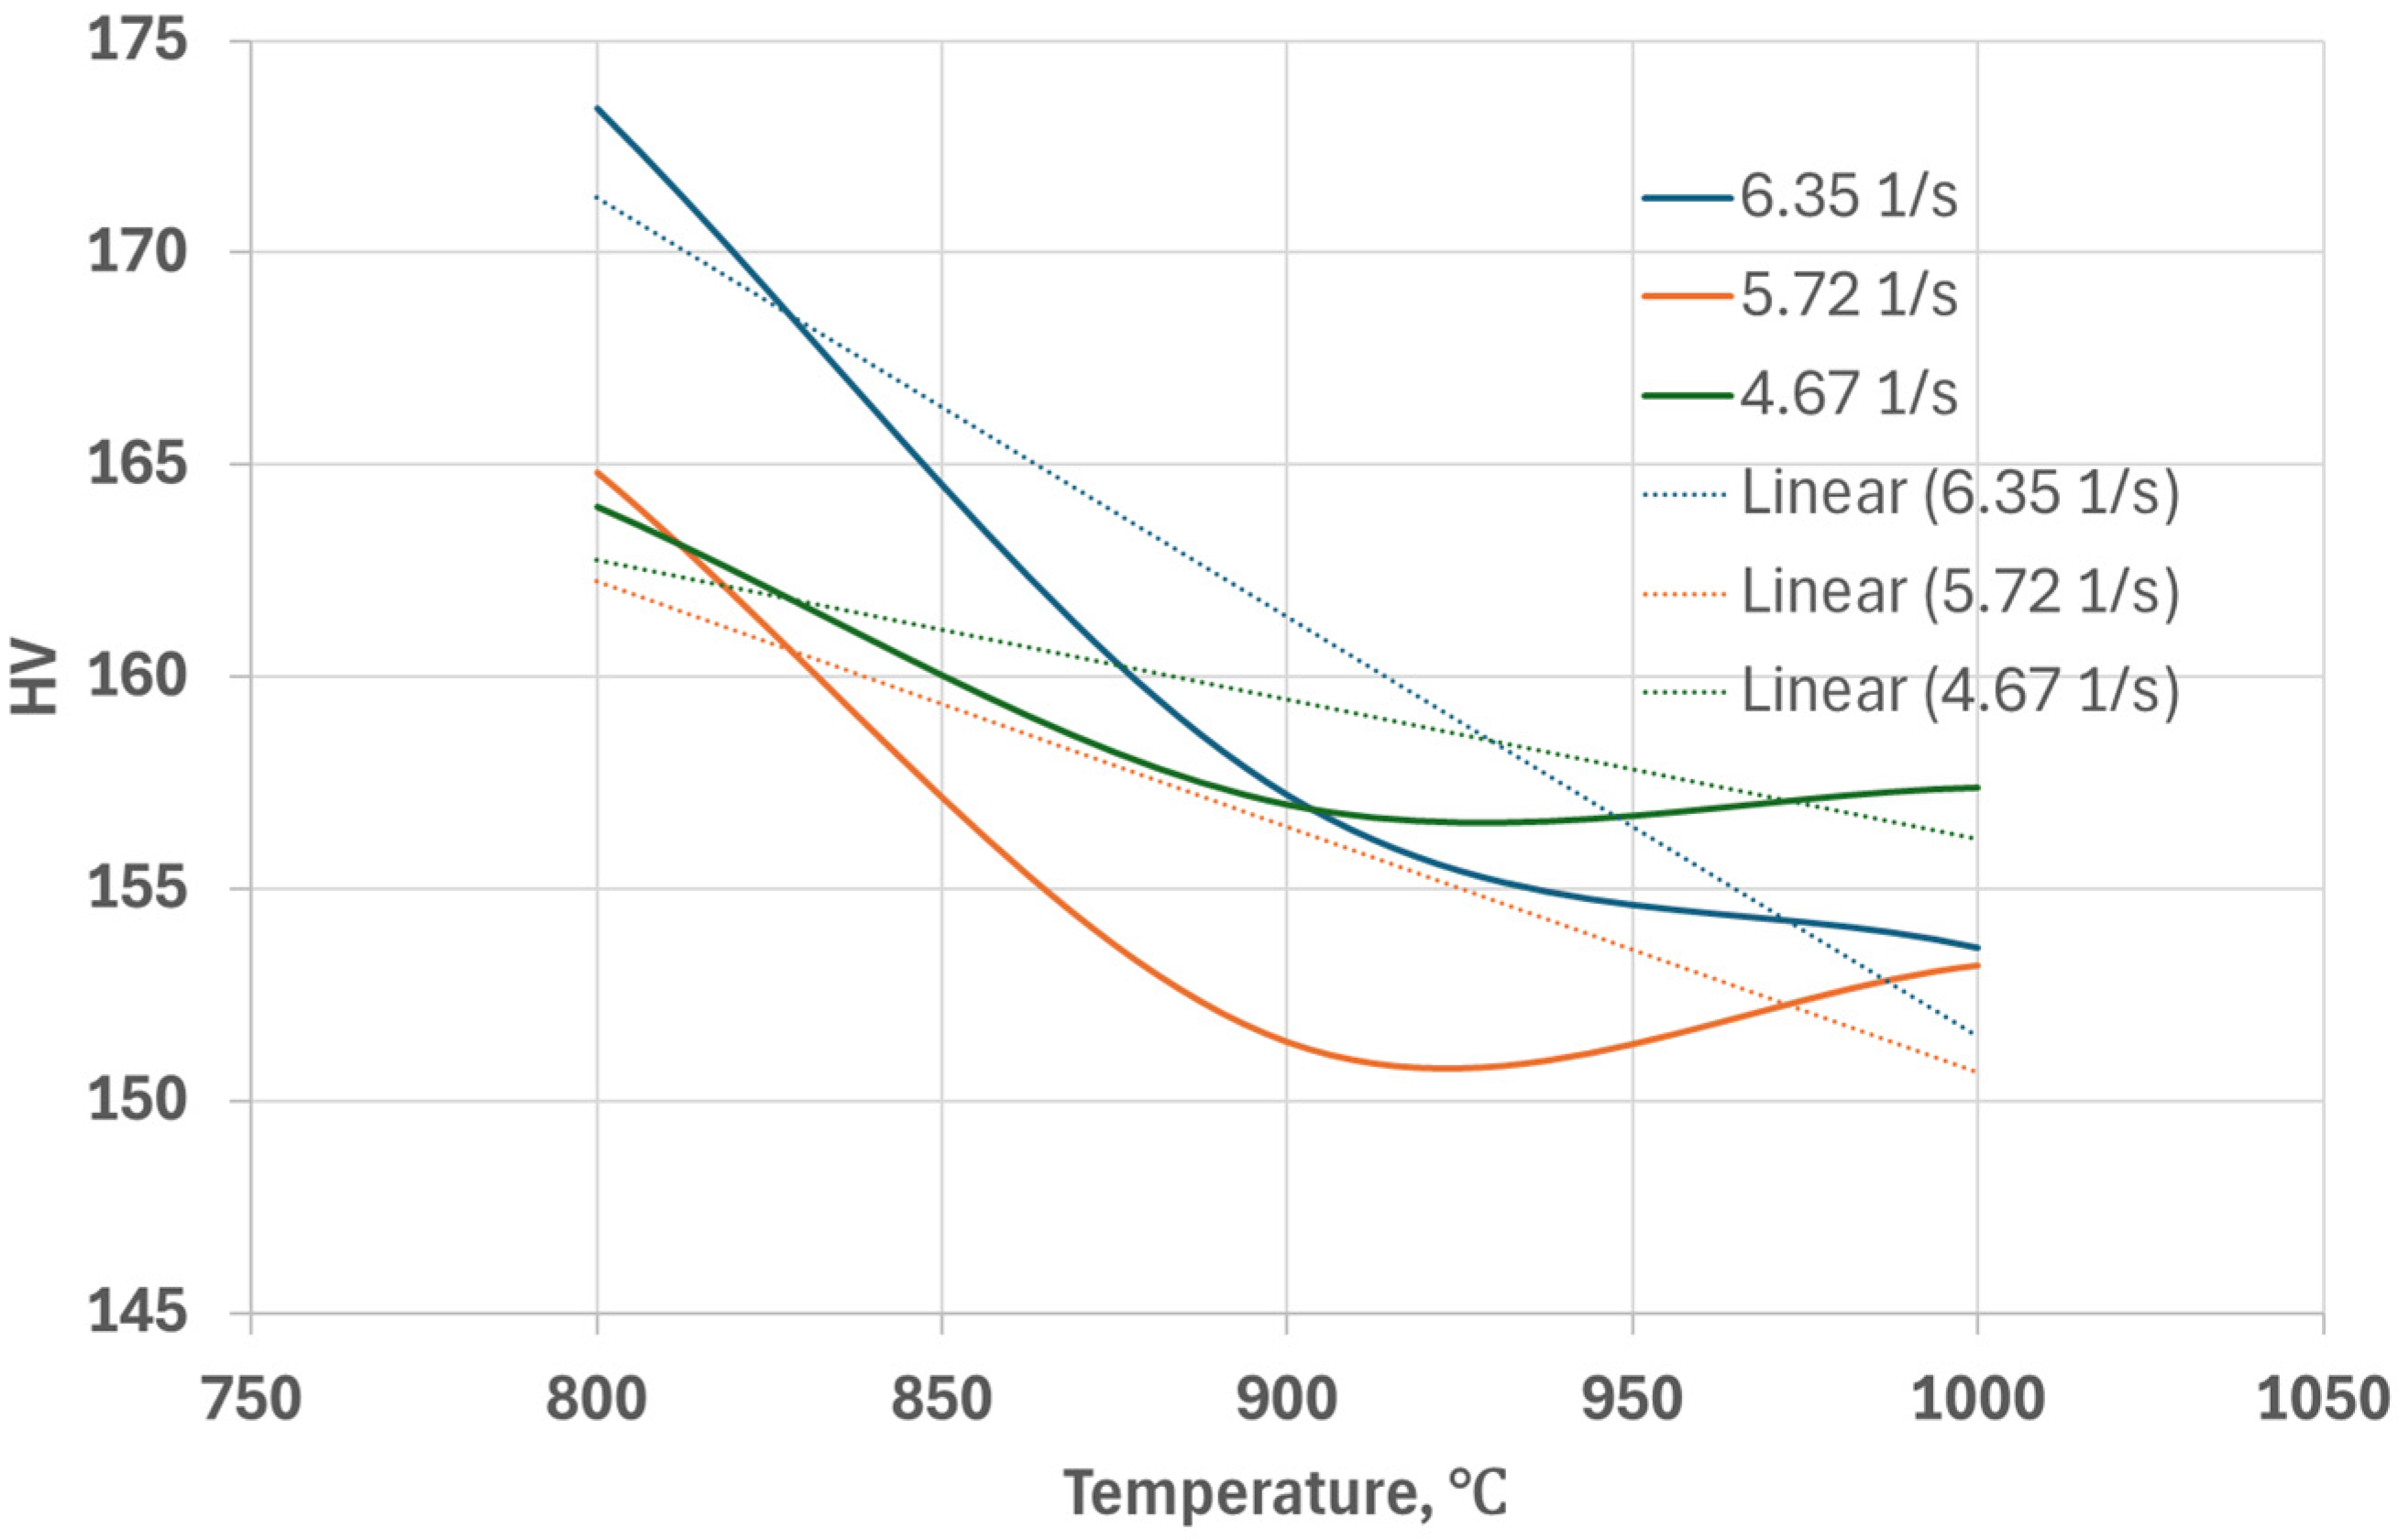
  • In the case of compression, the hardness value decreases up to a temperature of 900 °C, after which a slight increase trend is noted. Thus, in the case of a speed of 6.35 1/s, the hardness varied between 173.4 HV at 800 °C and 153.6 HV at 1000 °C. At a speed of 4.67 1/s, the hardness varied between 164 HV and 157.4 HV.
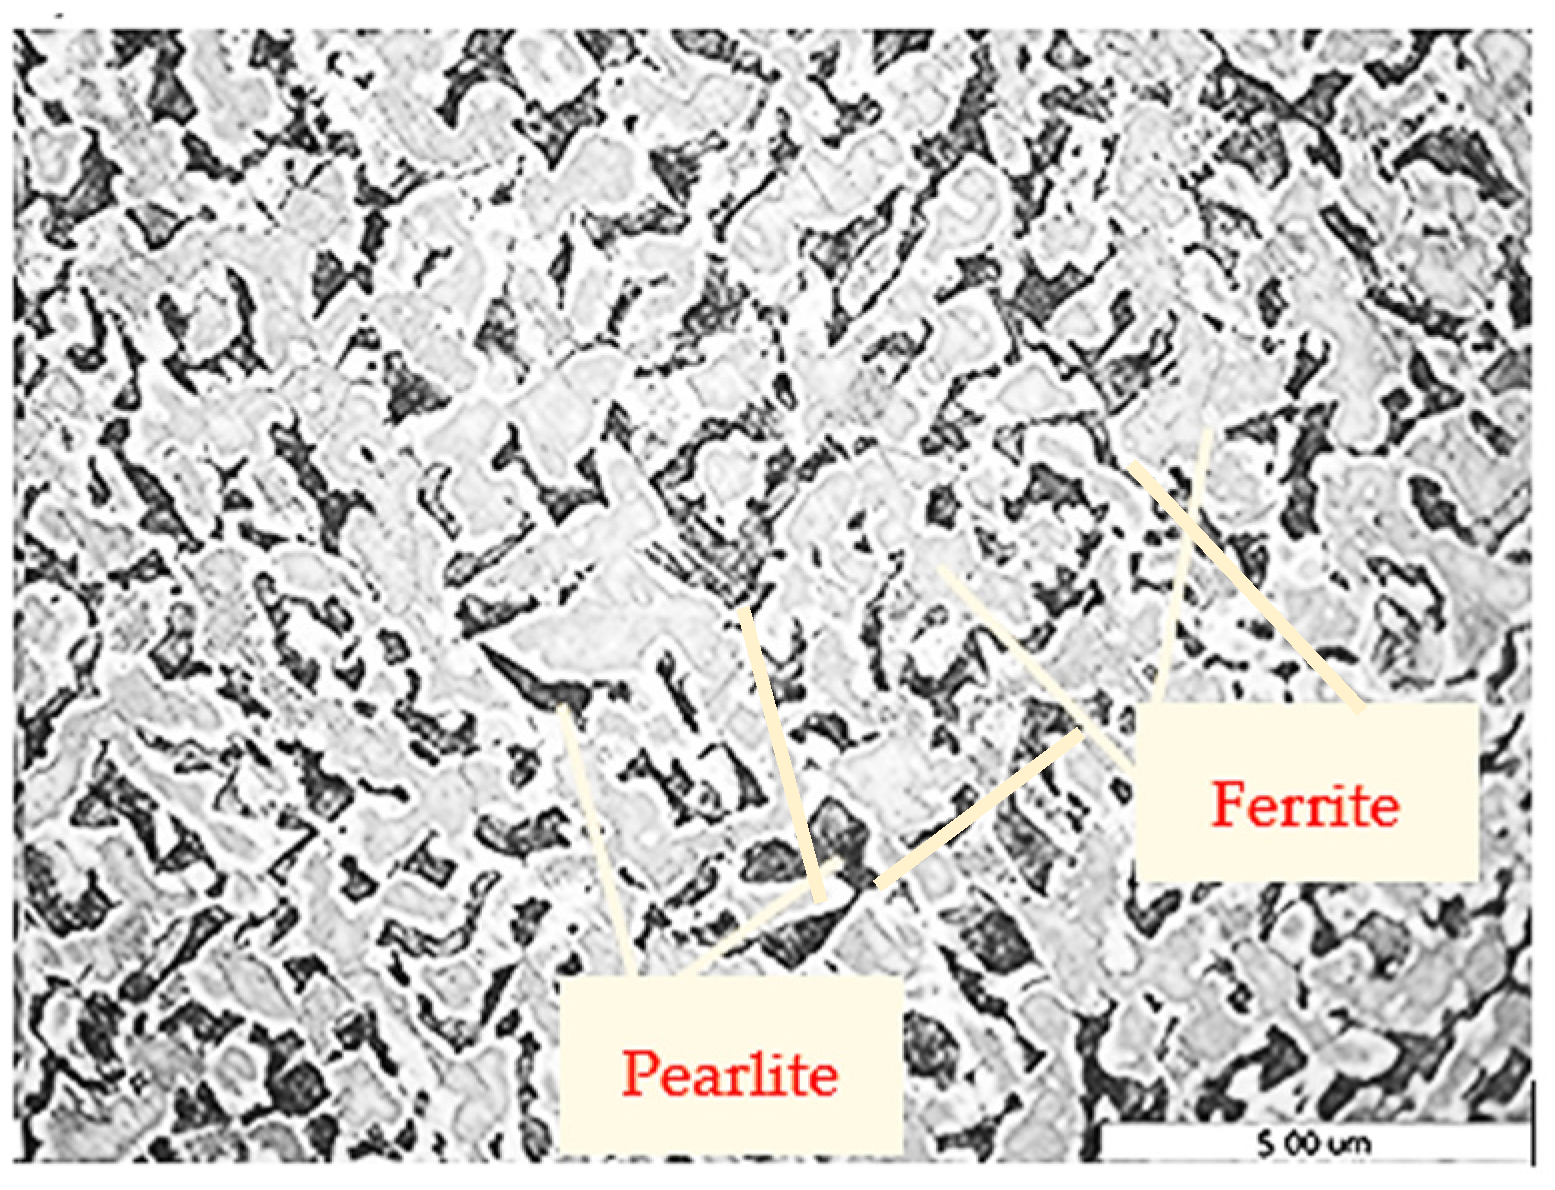
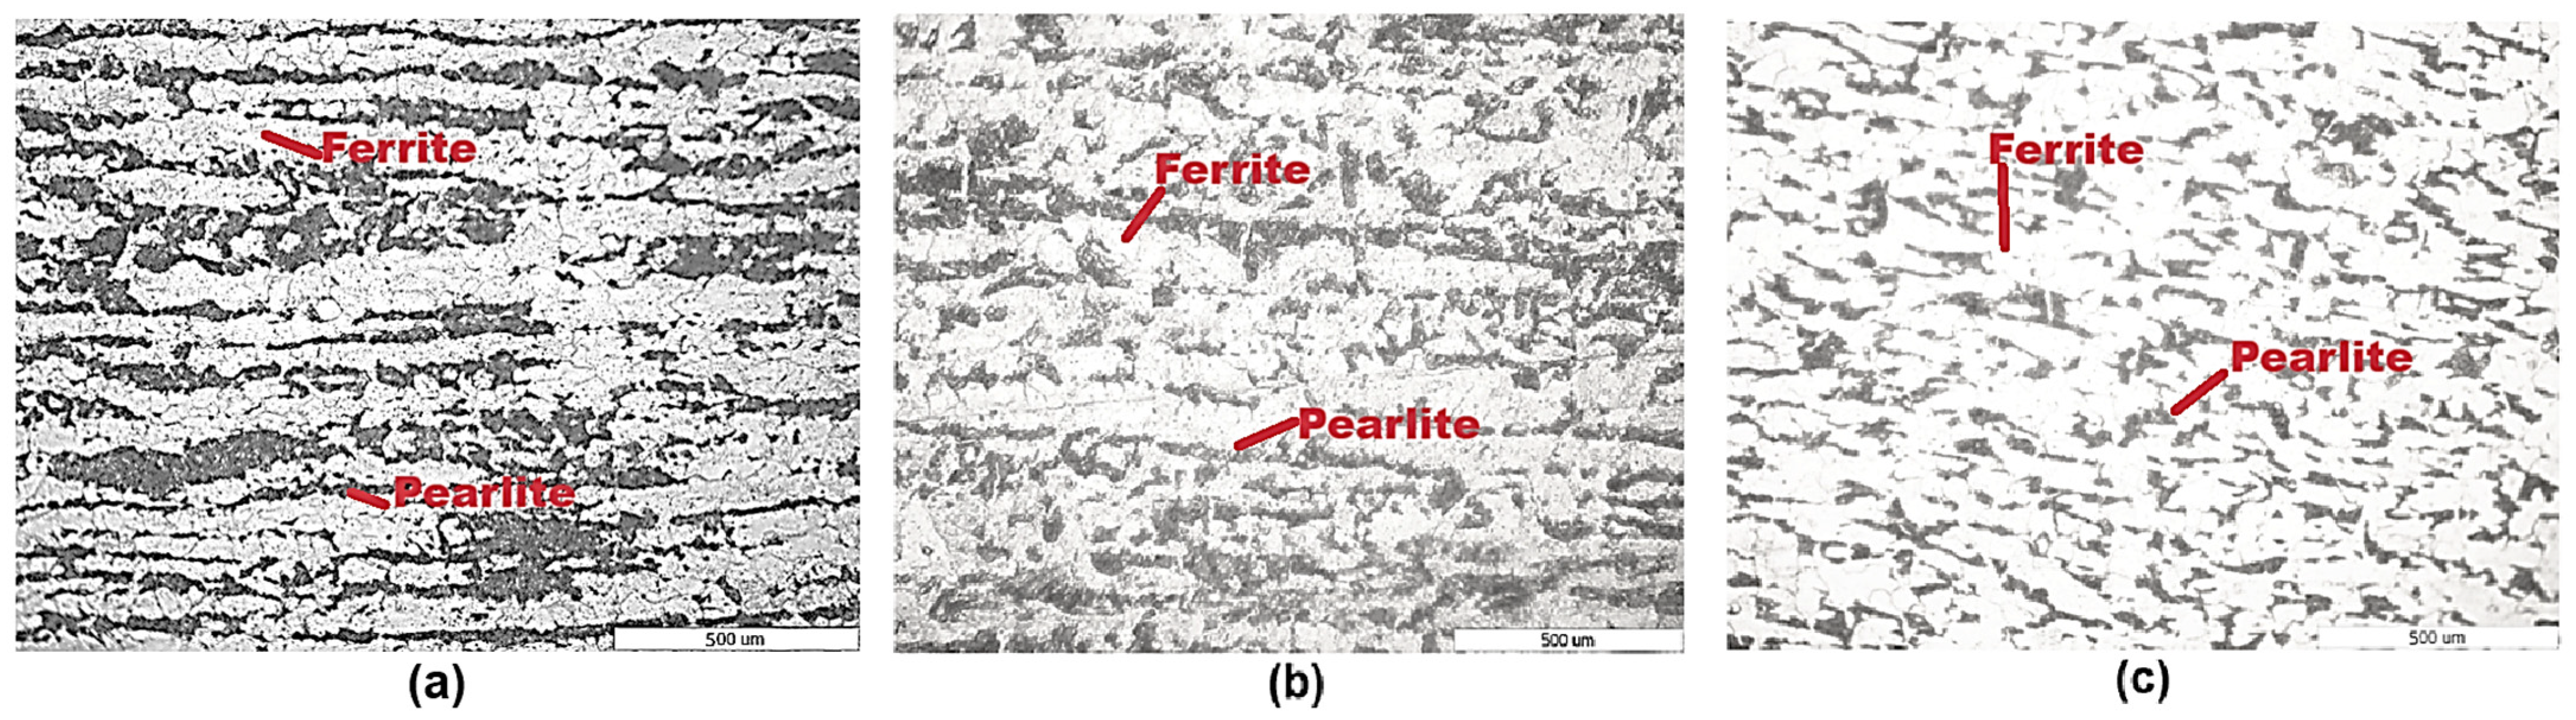
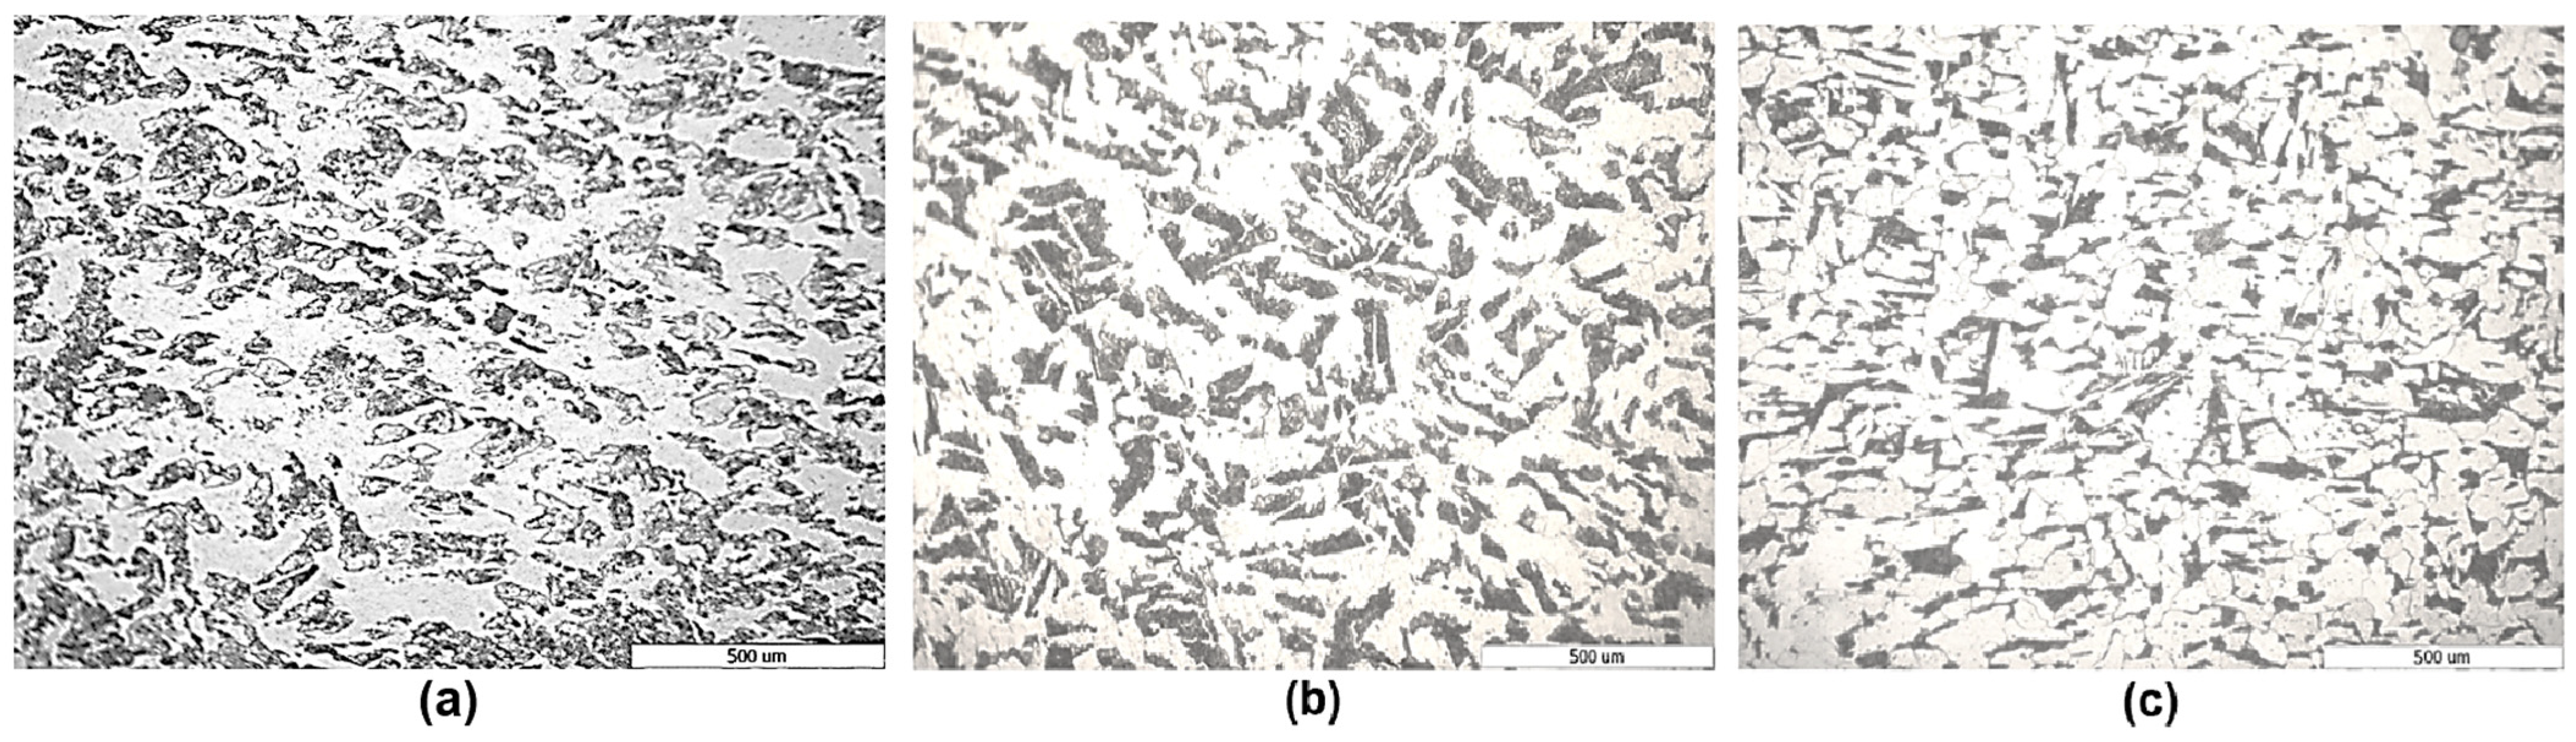
  • It is observed that when the temperature increases, the structure becomes coarser. At a low deformation rate (0.0018 1/s) and temperatures of 1000 °C and 1100 °C, respectively, the presence of the acicular structure in the optical microstructure can be observed, which can be explained by the material reaching the austenitization temperature and rapid cooling in water, which favors the formation of the martensitic structure.
  • The L-C fracture criterion was applied using fracture strain and flow stress models to predict the cracking tendency of C22 steel at elevated temperatures. By comparing the experimental and simulated necking of tensile specimens, the findings show that temperature and strain rate have a significant impact on critical damage values, which is consistent with variations in the flow instability in C22 steel.

Author Contributions

Conceptualization, M.P., A.N. and I.-M.S.-B.; methodology, M.P. and D.F.; validation, M.P., I.-M.S.-B. and A.N.; formal analysis, M.P. and A.N.; investigation, M.P., D.F. and A.N.; resources, M.P., I.-M.S.-B. and D.F.; data curation, M.P. and I.-M.S.-B.; writing—original draft preparation, M.P. and I.-M.S.-B.; writing—review and editing, M.P. and I.-M.S.-B.; visualization, M.P., I.-M.S.-B. and A.N.; supervision, M.P. All authors have read and agreed to the published version of the manuscript.

Funding

This research received no external funding.

Data Availability Statement

The original contributions presented in the study are included in the article. Further inquiries can be directed to the corresponding author.

Conflicts of Interest

The authors declare no conflicts of interest.

Nomenclature

σrheological stress [MPa];
A, m1, …, m4material constants;
m1material’s sensitivity to temperature;
m2, m4define the material’s sensitivity to strain;
m3strain rate sensitivity index
Tdeformation temperature [°C];
ε ˙ strain rate [1/s];
ε elongation [-]
l0,initial length of the specimen [mm];
l1final length of the specimen [mm];
d0initial diameter of the specimen [mm];
d1final diameter of the specimen [mm];
drdiameter of the specimen in the fracture area [mm];
ε 1 longitudinal strains [%];
  ε d transversal strains [%];
Vdeformation speed [mm/s];
h0initial height of the specimen [mm];
h1final height of the specimen [mm];
dmin,minimum diameter of the deformed specimen [mm].
dmaxmaximum diameter of the deformed specimen [mm].
σ m a x maximum tensile main stress, [MPa];
d ε ¯ differential plastic strain;
Cfcritical damage value at the time of crack;
σ ¯ the equivalent plastic stress, [MPa];
ε ¯ f strain at fracture, [%].

References

  1. Sas-Boca, I.M.; Frunza, D.; Popa, F.; Ilutiu-Varvara, D.A.; Tintelecan, M.C. Influence of Temperature and Strain Rate on Microstructure and Fracture Mechanism of Mild Steel. Procedia Manuf. 2020, 46, 891–898. [Google Scholar] [CrossRef]
  2. Pop, M.; Frunză, D.; Neag, A. Experimental and numerical aspects regarding hot formability of mild carbon steel. Acta Tech. Napoc. Appl. Math. Mech. Eng. 2021, 64, 553–560. [Google Scholar]
  3. Pravin, N.; Sanket, T.; Prachit, S.; Prajwal, P. An Investigation of Behaviour of Mild Steel Under Tensile Test for Industrial Applications. In Advances in Systems Engineering. Lecture Notes in Mechanical Engineering; Saran, V.H., Misra, R.K., Eds.; Springer: Singapore, 2021. [Google Scholar] [CrossRef]
  4. Nourani, M.; Aliverdilu, H.; Monajati Zadeh, H.; Khorsand, H.; Shokuhfar, A.; Milani, A.S. A Study on the Formability of IF and Plain Carbon Mild Steels. In Proceedings of the ASME 2010 International Design Engineering Technical Conferences and Computers and Information in Engineering Conference. 6: 15th Design for Manufacturing and the Lifecycle Conference; 7th Symposium on International Design and Design Education, Montreal, QC, Canada, 15–18 August 2010; ASME: New York, NY, USA, 2010; pp. 333–339. [Google Scholar] [CrossRef]
  5. Srivastava, A.; Jain, A.; Rajput, S.; Singh, H.O.; Kandpal, B.C.; Yadav, M.; Varshney, S.; Johri, N. Structural and FEM analysis of heat treatment effects on mild steel. Mater. Today Proc. 2021, 46, 11064–11071. [Google Scholar] [CrossRef]
  6. Garai, S.; Biswas, S.; Panda, S.; Kumar, S. A Study of Heat Treatment of Steel. Int. J. Adv. Res. Sci. Eng. Technol. 2019, 6, 10184–10192. [Google Scholar]
  7. Sahu, G.; Sen, P.K.; Sharma, R.; Bohidar, S. A Review on Effect of Heat Treatment Process on Micrograin Structure of Steel. Int. J. Eng. Sci. Invent. 2014, 3, 46–52. [Google Scholar]
  8. Sanusi, K.O.; Akinlabi, E.T. Experiment on Effect of heat treatment on mechanical and microstructure properties of AISI steel. Mater. Today Proc. 2018, 5, 17996–18001. [Google Scholar] [CrossRef]
  9. Singh, G. A review on effect of heat treatment on the properties of mild steel. Mater. Today Proc. 2020, 27, 10. [Google Scholar] [CrossRef]
  10. Azra, U.-E.; Ramesh Nayak, B.; Appaiah, M. Design of Mild Steel specimen using FEA and tensile test data, materials today. In Proceeding of the International Conference on Advanced Material and Application (ICAMA 2016), Beijing, China, 21–22 October 2016; pp. 1–4. [Google Scholar]
  11. Jha, S.K. Investigation of micro-structure and mechanical properties of three steel alloys. Int. J. Autom. Mech. Eng. 2017, 14, 4315–4331. [Google Scholar] [CrossRef]
  12. Xie, C.L.; Nakamachi, E. Investigations of the formability of BCC steel sheets by using crystalline plasticity finite element analysis. Mater. Des. 2002, 23, 59–68. [Google Scholar] [CrossRef]
  13. Liu, X.C.; Wu, Y.F.; Leung, A.Y.T.; Hou, J.G. Mechanical behavior of mild steel compressive yielding blocks. In Proceedings of the Asia-Pacific Conference on FRP in Structures (APFIS 2007), Hong Kong, China, 12–14 December 2007; pp. 12–14. [Google Scholar]
  14. Singh, N.K.; Cadoni, E.; Singha, M.K.; Gupta, N.K. Dynamic Tensile and Compressive Behaviors of Mild Steel at Wide Range of Strain Rates. J. Eng. Mech. 2013, 139, 1197–1206. [Google Scholar] [CrossRef]
  15. Lin, Y.C.; Zhang, J.; Zhong, J. Application of neural networks to predict the elevated temperature flow behavior of a low alloy steel. Comput. Mater. Sci. 2008, 43, 752–758. [Google Scholar] [CrossRef]
  16. Gouveia, B.P.P.A.; Rodrigues, J.M.C.; Martins, P.A.F. Ductile fracture in metalworking: Experimental and theoretical research. J. Mater. Process. Technol. 2000, 101, 52–63. [Google Scholar] [CrossRef]
  17. Alemayehu, D.B.; Huang, S.J.; Koricho, E.G. Experimental and FEM analysis of three carbon steel characterization under quasi-static strain rate for bumper beam application. MATEC Web Conf. 2017, 123, 00019. [Google Scholar] [CrossRef]
  18. Jose, E.; Anto, T. Analysis of tensile test of mild steel using finite element method. Int. J. Innov. Eng. Technol. (IJIET) 2015, 5, 247–251. [Google Scholar]
  19. Cadoni, E.; Forni, D.; Gieleta, R.; Kruszka, L. Tensile and compressive behaviour of S355 mild steel in a wide range of strain rates. Eur. Phys. J. Spec. Top. 2018, 227, 29–43. [Google Scholar] [CrossRef]
  20. Malayappan, S.; Narayanasamy, R.; Esakkimuthu, G. Barrelling of aluminium solid cylinders during cold upset forging with constraints at both ends. Mat. Des. 2007, 28, 1404–1411. [Google Scholar] [CrossRef]
  21. Zhang, Z.; Shen, F.; Liu, H.; Konemann, M.; Munstermann, S. Temperature-dependent deformation and fracture properties of low-carbon martensitic steel in different stress states. J. Mater. Res. Technol. 2023, 25, 1931–1943. [Google Scholar] [CrossRef]
  22. Callister, W.D.; Rethwisch, D.G. Materials Science and Engineering: An Introduction, 10th ed.; Wiley: New York, NY, USA, 2018; ISBN 978-1-119-40549-8. [Google Scholar]
  23. Dewangan, S.; Nemade, V.; Nemade, K. Critical analysis of material behaviour in welded plates of AISI 0.2%–C steel under as-welded, quenched and annealed conditions. Acta Met. Slovaca 2023, 29, 26–33. [Google Scholar] [CrossRef]
  24. Kannan, T.D.; Sivaraj, P.; Sonar, T. Effect of Forging Pressure on Evolution of Microstructure and Tensile Properties of Rotary Friction-Welded Shaft-to-Plate Joints of Dissimilar Low-Carbon-Grade C22 and C15 Steels. Met. Microstruct. Anal. 2025, 14, 44–58. [Google Scholar] [CrossRef]
  25. Yang, Y.; Ma, S.; Liu, G.; Wang, T.; Lei, J. Nano and micron WC particles reinforced Hastelloy C22 coatings manufactured by directed energy deposition. J. Alloys Compd. 2024, 970, 172540. [Google Scholar] [CrossRef]
  26. Mokas, N.; Boulanouar, L.; Amirat, A.; Gautier, L. Effect of hardening on the machinability of C22 steel under drilling operations using twist HSS drill bit. Int. J. Adv. Manuf. Technol. 2018, 96, 3227–3234. [Google Scholar] [CrossRef]
  27. Dewangan, S.; Sunder, S.S.S.; Bhadoriya, Y.; Mohite, S.; Praveen, A. Reddy Investigation into the Feasibility of Welded Joint Between AISI 1020 and Inconel-718 Based on Mechanical Properties and Microstructural Attributes. J. Inst. Eng. India Ser. D 2024, 105, 1451–1462. [Google Scholar] [CrossRef]
  28. dos Santos, F.J.; Dutra, G.B.; da Cunha, T.V. Microstructural and mechanical evaluation of a dissimilar joining between SAE 1020 and AISI 304 steel obtained via ultra-high-frequency-pulsed GTAW. J Braz. Soc. Mech. Sci. Eng 2019, 41, 26. [Google Scholar] [CrossRef]
  29. Wang, J.; Kang, Y.; Yu, H.; Ge, W. Effect of Quenching Temperature on Microstructure and Mechanical Properties of Q1030 Steel. Mater. Sci. Appl. 2019, 10, 665–675. [Google Scholar] [CrossRef]
  30. Pop, M.; Sas-Boca, I.-M.; Frunză, D.; Popa, F.; Neag, A. The Influence of Hot Deformation on the Mechanical and Structural Properties of 42CrMo4 Steel. Metals 2024, 14, 647. [Google Scholar] [CrossRef]
  31. EN 10250-2: 2000; Open Steel Die Forgings for General Engineering Purposes, Non-Alloy Quality and Special Steels. Scribd: San Francisco, CA, USA, 2000.
  32. EN 10250-1:2022; Open Die Steel Forgings for General Engineering Purposes-Part 1: General Requirements. iTeh Standards: Newark, DE, USA, 2022.
  33. Li, Q.; Guo, B.; Li, X.; Zhang, Y.; Jian, J.; Ao, J.; Tang, Q.; Lu, Y. Fracture prediction of powder metallurgical Fe-Cu-C steel at elevated temperatures via finite element-aided hot tensile tests. J. Mater. Res. Technol. 2021, 12, 423–436. [Google Scholar] [CrossRef]
  34. Bilbao, O.; Loizaga, I.; Alonso, J.; Girot, F.; Torregaray, A. 42CrMo4 steel flow behavior characterization for high temperature closed dies hot forging in automotive components applications. Heliyon 2023, 9, e22256. [Google Scholar] [CrossRef]
  35. Dhondapure, P.; Tize Mha, P.; Nayak, S.; Ebacher, L.; Dourandish, S.; Champliaud, H.; Morin, J.-B.; Jahazi, M. Influence of deformation path on the stress state and damage evolution along the central axis of a large size forged ingot of AISI H13 steel. J. Mater. Res. Technol. 2023, 27, 8244–8257. [Google Scholar] [CrossRef]
  36. Karimi Firouzjaei, M.; Naeini, H.M.; Kasaei, M.M.; Mirnia, M.J.; da Silva, L.F.M. Microscale modeling of the ductile fracture behavior of thin stainless steel sheets. Thin-Walled Struct. 2024, 196, 111457. [Google Scholar] [CrossRef]
  37. ASTM E21-20; Standard Test Methods for Elevated Temperature Tension Tests of Metallic Materials. iTeh Standards: Newark, DE, USA, 2020.
  38. ASTM E8/E8M-24; Standard Test Methods for Tension Testing of Metallic Materials. ASTM International: West Conshohocken, PA, USA, 2024.
  39. Available online: https://www.transvalor.com/en/forge (accessed on 15 November 2024).
Figure 1. The hot tensile tests. (a) Dimensions of the experimental tensile specimen. (b) Specimen placed in a vertical electrically heated furnace.
Metals 15 00756 g001
Figure 2. The hot compression tests equipment. (a) Compression test specimen and hammer. (b) Carbolite electrical tube furnace used for heating specimens. (c) Hydraulic Heckert-EDZ-20S testing machine.
Metals 15 00756 g002
Figure 3. Tensile tests at T = 800 °C and different strain rates conditions: (a) initial specimen; (b) ε ˙ = 0.001 1/s; (c) ε ˙ = 0.012 1/s; (d) ε ˙ = 0.089 1/s; (e) load vs. stroke diagram for ε ˙ = 0.001 1/s.
Metals 15 00756 g003
Figure 4. Tensile tests at T = 900 °C and different strain rates conditions: (a) initial specimen; (b) ε ˙ = 0.001 1/s; (c) ε ˙ = 0.012 1/s; (d) ε ˙ = 0.089 1/s; (e) load vs. stroke diagram for ε ˙ = 0.001 1/s.
Metals 15 00756 g004
Figure 5. Tensile tests at T = 1000 °C and different strain rates conditions: (a) initial specimen; (b) ε ˙ = 0.001 1/s; (c) ε ˙ = 0.012 1/s; (d) ε ˙ = 0.089 1/s; (e) load vs. stroke diagram for ε ˙ = 0.001 1/s.
Metals 15 00756 g005
Figure 6. Tensile tests at T = 1100 °C and different strain rates conditions (a) initial specimen; (b) ε ˙ = 0.001 1/s; (c) ε ˙ = 0.012 1/s; (d) ε ˙ = 0.089 1/s; (e) load vs. stroke diagram for ε ˙ = 0.001 1/s.
Metals 15 00756 g006
Figure 7. Tensile stress vs. true strain, at different temperatures and strain rates: (a ε ˙ = 0.001   1 / s ;   ( b )   ε ˙ = 0.012   1 / s ;   ( c )   ε ˙ = 0.089   1 / s .
Metals 15 00756 g007
Figure 8. Tensile stress vs. temperature for different strain rates.
Metals 15 00756 g008
Figure 9. Specimens formed by compression with a hammer at different temperatures and an impact height of 1000 mm.
Metals 15 00756 g009
Figure 10. Deformation strength vs. temperature at different strain rates.
Metals 15 00756 g010
Figure 11. Influence of temperature and strain rate on deformation nonuniformity.
Metals 15 00756 g011
Figure 12. Specimens formed by uniaxial compression on a hydraulic press at different temperatures.
Metals 15 00756 g012
Figure 13. Compression stress vs. true strain at different temperatures.
Metals 15 00756 g013
Figure 14. Hardness measuring points: (a) Tensile specimen; (b) compressed specimen.
Metals 15 00756 g014
Figure 15. Vickers hardness vs. temperature for different strain rates.
Metals 15 00756 g015
Figure 16. Vickers hardness vs. temperature after compression tests.
Metals 15 00756 g016
Figure 17. Optical microstructures initial state.
Metals 15 00756 g017
Figure 18. Optical microstructures after the tensile stress for different deformation conditions at 800 °C: (a) ε ˙ = 0.001 1/s; (b) ε ˙ = 0.012 1/s; (c) ε ˙ = 0.089 1/s.
Metals 15 00756 g018
Figure 19. Optical microstructures after the tensile stress for different deformation conditions at 900 °C: (a) ε ˙ = 0.001 1/s; (b) ε ˙ = 0.012 1/s; (c) ε ˙ = 0.089 1/s.
Metals 15 00756 g019
Figure 20. Optical microstructures after the tensile stress for different deformation conditions at 1000 °C: (a) ε ˙ = 0.001 1/s; (b) ε ˙ = 0.012 1/s; (c) ε ˙ = 0.089 1/s.
Metals 15 00756 g020
Figure 21. Optical microstructures after the tensile stress for different deformation conditions at 1100 °C: (a) ε ˙ = 0.001 1/s; (b) ε ˙ = 0.012 1/s; (c) ε ˙ = 0.089 1/s.
Metals 15 00756 g021
Figure 22. Optical microstructures after compression tests for different deformation conditions at 800 °C: (a) ε ˙ = 4.67 1/s; (b) ε ˙ = 5.72 1/s; (c) ε ˙ = 6.35 1/s.
Metals 15 00756 g022
Figure 23. Optical microstructures after compression tests for different deformation conditions at 900 °C: (a) ε ˙ = 4.67 1/s; (b) ε ˙ = 5.72 1/s; (c) ε ˙ = 6.35 1/s.
Metals 15 00756 g023
Figure 24. Optical microstructures after compression tests for different deformation conditions at 1000 °C: (a) ε ˙ = 4.67 1/s; (b) ε ˙ = 5.72 1/s; (c) ε ˙ = 6.35 1/s.
Metals 15 00756 g024
Figure 25. The tensile test simulation at T = 800 °C and ε ˙ = 0.089 1/s: (a) effective strain distribution; (b) von Mises stress distribution.
Metals 15 00756 g025
Figure 26. (a) Normalized L-C criterion; (b) time-dependent force variation.
Metals 15 00756 g026
Figure 27. The tensile test simulation at T = 1100 °C and ε ˙ = 0.089 1/s: (a) effective strain distribution; (b) von Mises stress distribution.
Metals 15 00756 g027
Figure 28. (a) Normalized L-C criterion; (b) time-dependent force variation.
Metals 15 00756 g028
Table 1. The chemical composition of C22 steel (wt.%). EN 10250-2: 2000.
CSiMnNiPSCrMoCr + Mo + Ni
0.17…0.24Max. 0.40.4…0.7Max. 0.4Max. 0.045Max. 0.045.Max. 0.4Max. 0.1<0.63
Table 2. Parameters of the simplified Hansel–Spittel equation.
Am1m2m3m4
1521.30−0.0022−0.12650.1454−0.0595
Table 4. Compression test results for impact height of 1000 mm and strain rate 4.67 1/s.
No.
crt
MaterialT
[°C]
d 0
[mm]
h 0
[mm]
V
[ mm 3 ]
d m i n
[mm]
d m a x
[mm]
h
[mm]
mL
[Nmm]
σ d
[ M P a ]
d m a x d m i n
1.C2280020309424.7819.520.828.61.068313,600651.911.066
2.C2290020309424.7820.821.527.71.075313,600388.051.033
3.C22100020309424.782222.127.11.081313,600302.771
Table 5. Compression test results for impact height of 1500 mm and strain rate 5.72 1/s.
No.
crt
MaterialT
[°C]
d 0
[mm]
h 0
[mm]
V
[ mm 3 ]
d m i n
[mm]
d m a x
[mm]
h
[mm]
mL
[Nmm]
σ d
[ M P a ]
d m a x d m i n
1.C2280020309424.7821.121.727.51.075470,400533.591.028
2.C2290020309424.7821.321.926.31.078470,400351.741.015
3.C22100020309424.7822.222.4224.651.090470,400233.121
Table 6. Compression test results for impact height of 1850 mm and strain rate 6.35 1/s.
MinimumMaterialT
[°C]
d 0
[mm]
h 0
[mm]
V
[ mm 3 ]
d m i n
[mm]
d m a x
[mm]
h
[mm]
mL
[Nmm]
σ d
[ M P a ]
d m a x d m i n
1.C2280020309424.7820.321.4241.085580,160254.251.095
2.C2290020309424.7820.422.223.51.086580,160232.121.088
3.C22100020309424.782123221.095580,160181.251.054
Table 7. Vickers hardness values specimen for tensile specimens.
No.crt T
[ ° C ]
ε ˙
[ 1 / s ]
HV
1
HV
2
HV
3
18000.089174168167
28000.012174165160
38000.001162159161
49000.089169167159
59000.012170160156
69000.001165158154
710000.089158165152
810000.012155160148
910000.001150158156
1011000.089146155147
1111000.012144152149
1211000.001145151143
Table 8. Vickers hardness values for compressed specimens.
Specimen No. T
[ ° C ]
ε ˙
[ 1 / s ]
HV
1
HV
2
HV
3
HV
4
HV
5
110004.67155154158151150
210004.67148154165151148
310004.67162155173147150
49005.72155162155155159
59005.72154153150147153
69005.72174152151152156
78006.35174174173172174
88006.35177170165159153
98006.35167165162165161
Disclaimer/Publisher’s Note: The statements, opinions and data contained in all publications are solely those of the individual author(s) and contributor(s) and not of MDPI and/or the editor(s). MDPI and/or the editor(s) disclaim responsibility for any injury to people or property resulting from any ideas, methods, instructions or products referred to in the content.

