1. Introduction
Copper (Cu) alloys are pivotal in modern electrical and mechanical systems due to their exceptional conductivity and tunable strength [
1]. Among these, precipitation-strengthened Cu alloys, such as Cu-Cr, Cu-Zr, and Cu-Ag systems, are widely employed in applications ranging from conductive wires to high-performance lead frames [
2,
3,
4,
5,
6]. However, a persistent challenge lies in balancing strength and electrical conductivity, as precipitates that enhance mechanical properties often introduce electron scattering, degrading conductivity [
7,
8,
9,
10]. Recent studies highlight that alloying Cu with
3d transition metals (e.g., Ti and Fe) typically exacerbates this trade-off [
11,
12,
13], yet Cr-doped Cu alloys defy this trend by retaining high conductivity alongside improved strength [
3,
14,
15]. This anomaly has spurred extensive research into the electronic and microstructural mechanisms governing Cu-Cr systems.
Conventional density functional theory (DFT) predicts that Cr additions elevate the density of states (DOS) at the Fermi level (E
F), which should reduce conductivity [
16,
17]. However, experimental results contradict this, showing minimal conductivity loss in dilute Cu-Cr alloys [
18]. To resolve this paradox, recent work emphasizes the role of spin polarization. For instance, Pan et al. [
16] proposed that Cr-induced spin splitting suppresses E
F -DOS, aligning theory with experimental conductivity values. Similarly, Curtarolo et al. [
19] linked Cr’s half-filled “d” orbitals to localized magnetic moments, which mitigate electron scattering. These findings suggest that Cr’s electronic configuration—distinct from other “
3d” elements—enables unique band structure modifications. Although the concept has been proposed, there is no real band structure calculation to prove it. This is mainly due to the difficulty of electrical conductivity calculation. In this work, the density of states was calculated to reflect the relative variation of electrical conductivity.
Advances in computational methods have further illuminated these mechanisms. Jin et al. [
20] employed machine learning to optimize Cr distribution in Cu matrices, revealing that uniform dispersion minimizes DOS peaks at E
F. Meanwhile, Zhang et al. [
21] used hybrid functional calculations to show that Cr-Cu “d”-orbital hybridization enhances both strength and conductivity. Such studies underscore the importance of atomic-scale interactions in tailoring alloy performance. Despite progress, a unified framework for designing high-conductivity Cu alloys remains elusive, particularly regarding the interplay between spin effects, precipitate morphology, and defect dynamics [
14,
22,
23].
This study integrates first-principles calculations and experimental data to unravel the origins of high conductivity in Cu-Cr alloys. We propose that spin-polarized Cr atoms reduce EF -DOS via exchange splitting, while nanoscale Cr precipitates strengthen the matrix without disrupting long-range electron transport. Our model also addresses the role of aging treatments in optimizing precipitate distribution, offering a roadmap for alloy design. Finally, we introduce a computational protocol to screen potential alloying elements based on their electronic and magnetic properties, accelerating the discovery of next-generation conductive materials.
4. Results and Discussion
Pure Cu is one of the most applied metals for its very high electrical conductivity. It has been learned that such an advantage originates in its electron band structure.
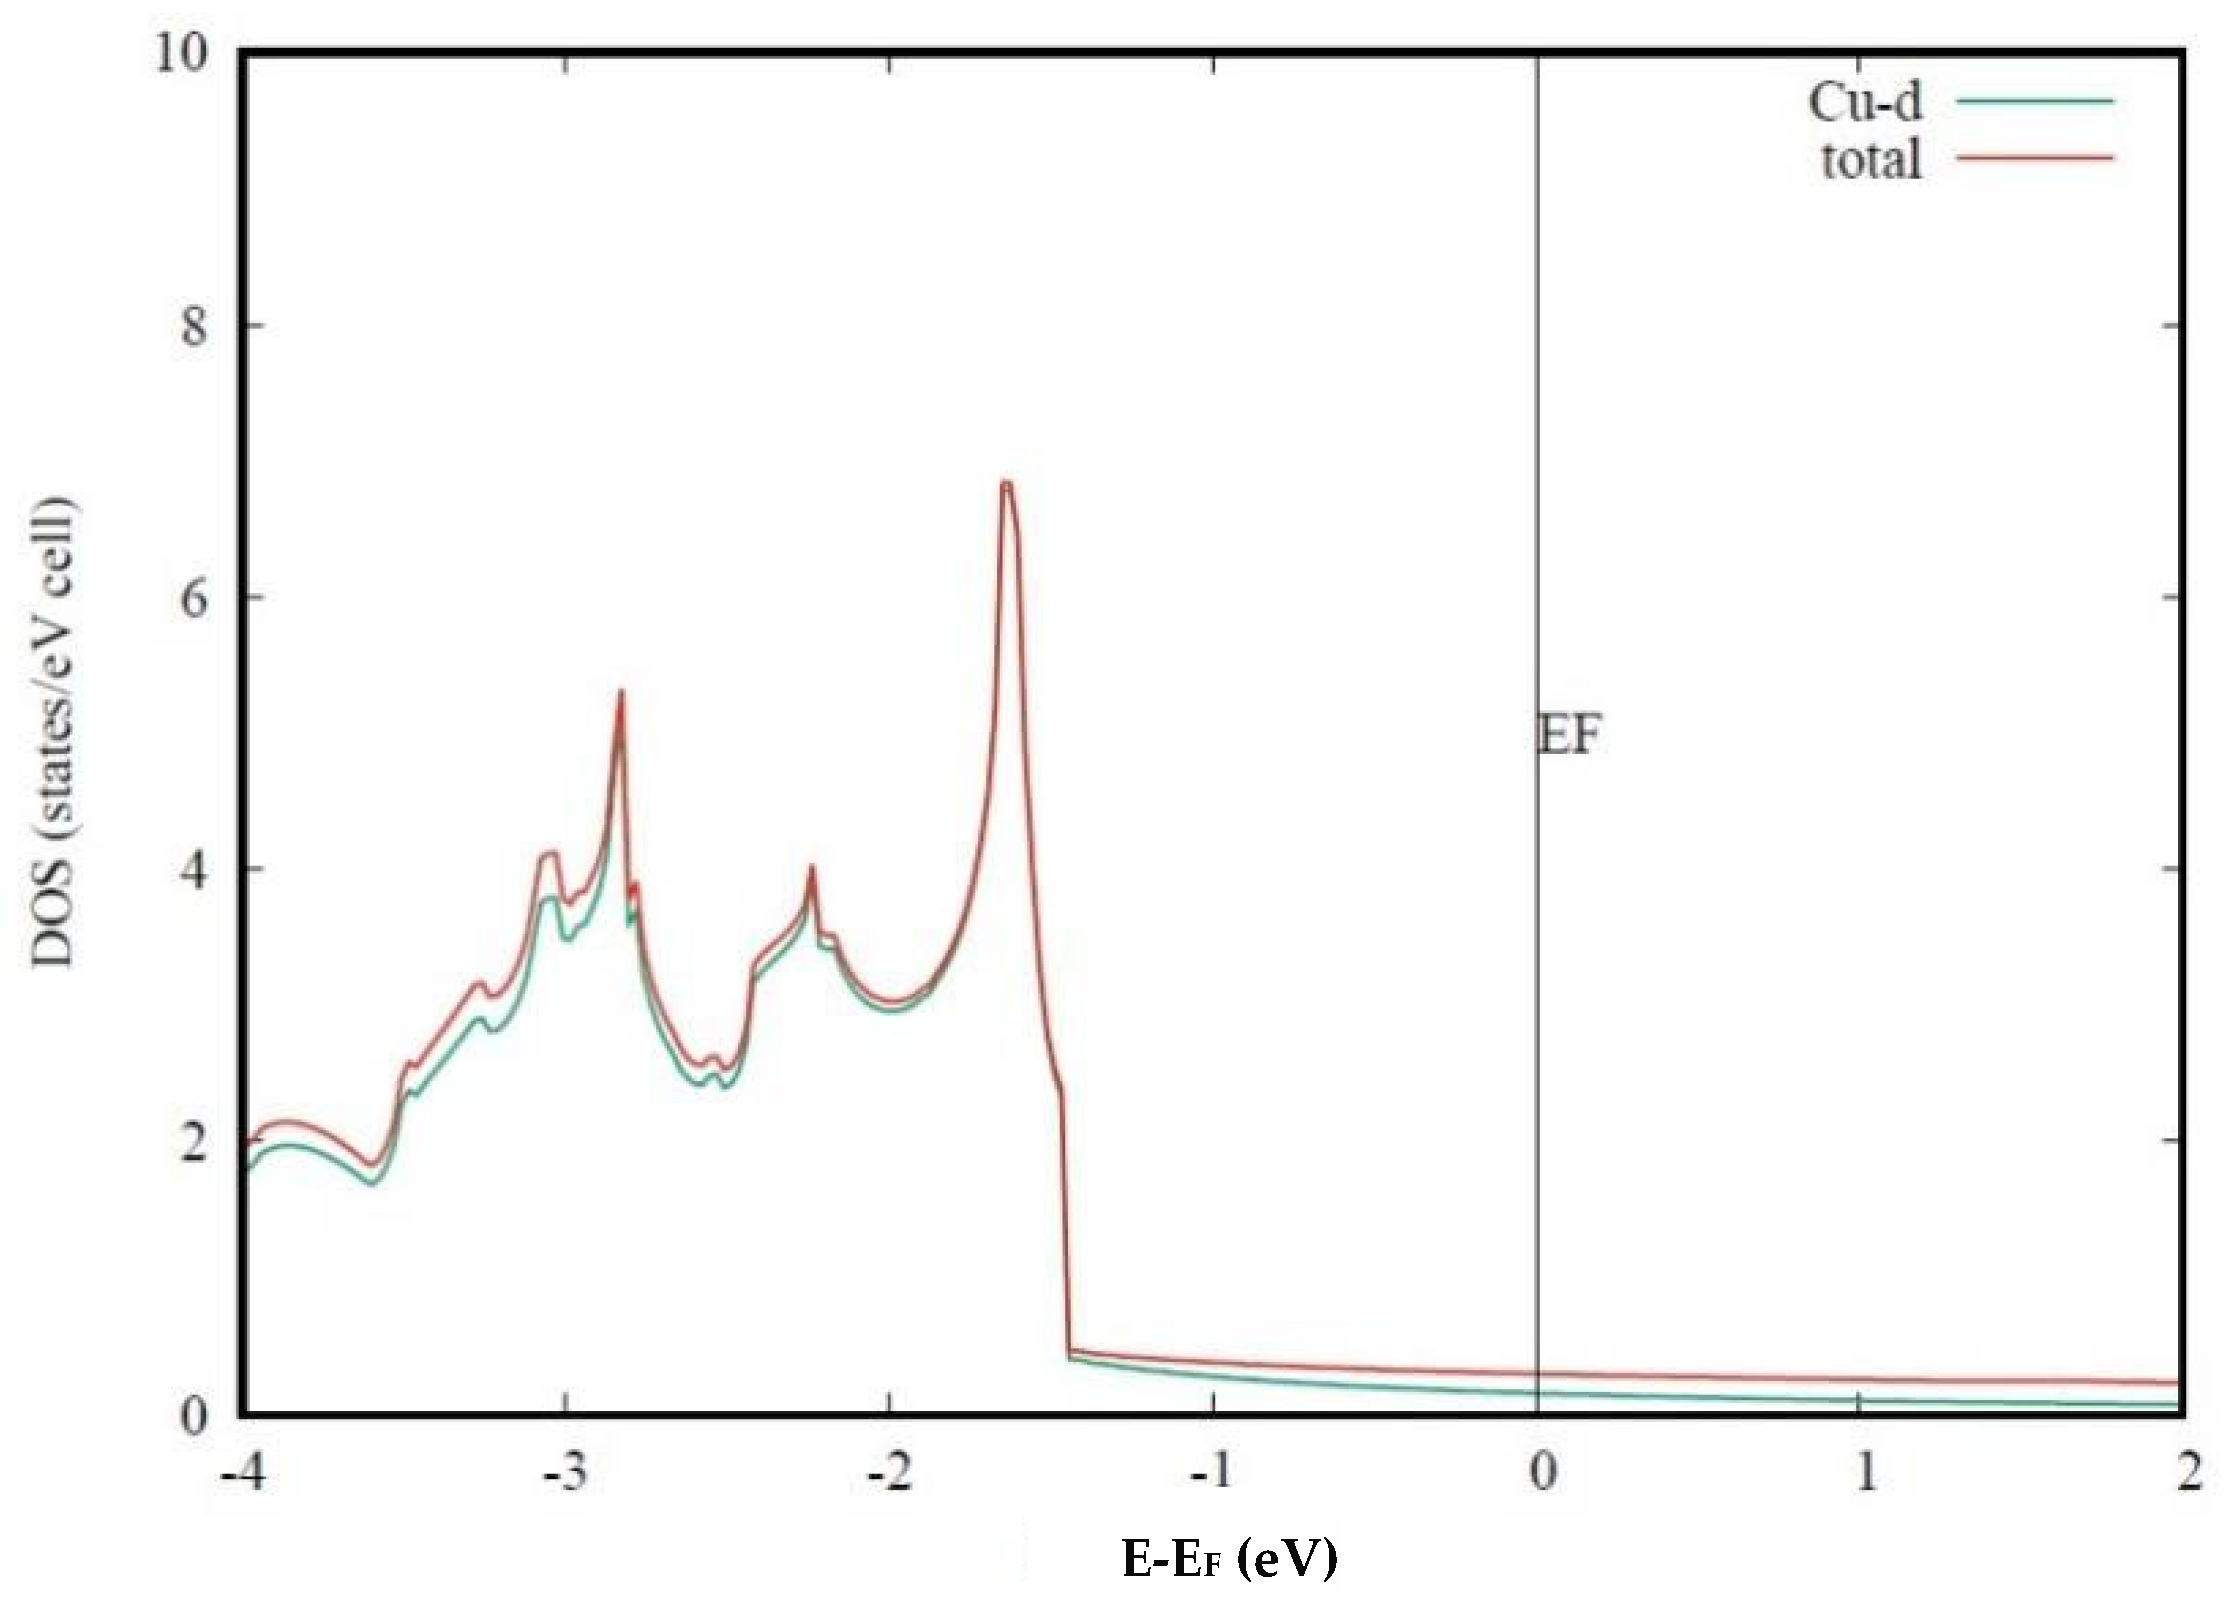
Figure 1 displays the calculated density of states (DOS) of Cu, as well as the partial DOS of the Cu-
d orbital. As may be seen, the Cu-
d orbital contributes to the high DOS from −4 to −1.5 eV, while the Cu-
d character is much less around the Fermi level. This result shows that the 10 Cu-
d orbitals are fully occupied, and the DOS around the Fermi level is mainly from the Cu-
s orbital. For the s orbital that is highly delocalized, the DOS at the Fermi level is very low.
The electrical conductivity can be described by the Drude formula:
where
VF and
NF are the electron velocity and density of state at the Fermi level, and
Vscat is the scattering potential. It is clear that the electrical conductivity is mainly determined by the electronic band structure at the Fermi level, and it is inversely proportional to the DOS.
Figure 1 shows that the low DOS at the Fermi level of Cu is due to the fully occupied
d orbital, and therefore, the high electrical conductivity is from the same reason. On the other hand, the low strength of pure Cu can also be attributed to the fully occupied
d orbital. In the transition metals with partly occupied d orbitals, such as Ti and Fe, the localized
d orbitals can form the covalent-like
d-d bonding, leading to the high strength of these materials. Thus, high electrical conductivity and high strength are difficult to achieve in a single system, not only in Cu. It is conceivable that the strength of Cu may be enhanced by alloying some transition metals, while its electrical conductivity has certainly decreased. In Cu-Fe, Cu-Co, and Cu-Ti alloys, a rapid decrease in electrical conductivity was confirmed. For this reason, the high electrical conductivity of Cu-Cr alloy is kind of unexpected. To understand this problem, we performed electronic band structure calculations for Cu-Cr and Cu-Ti.
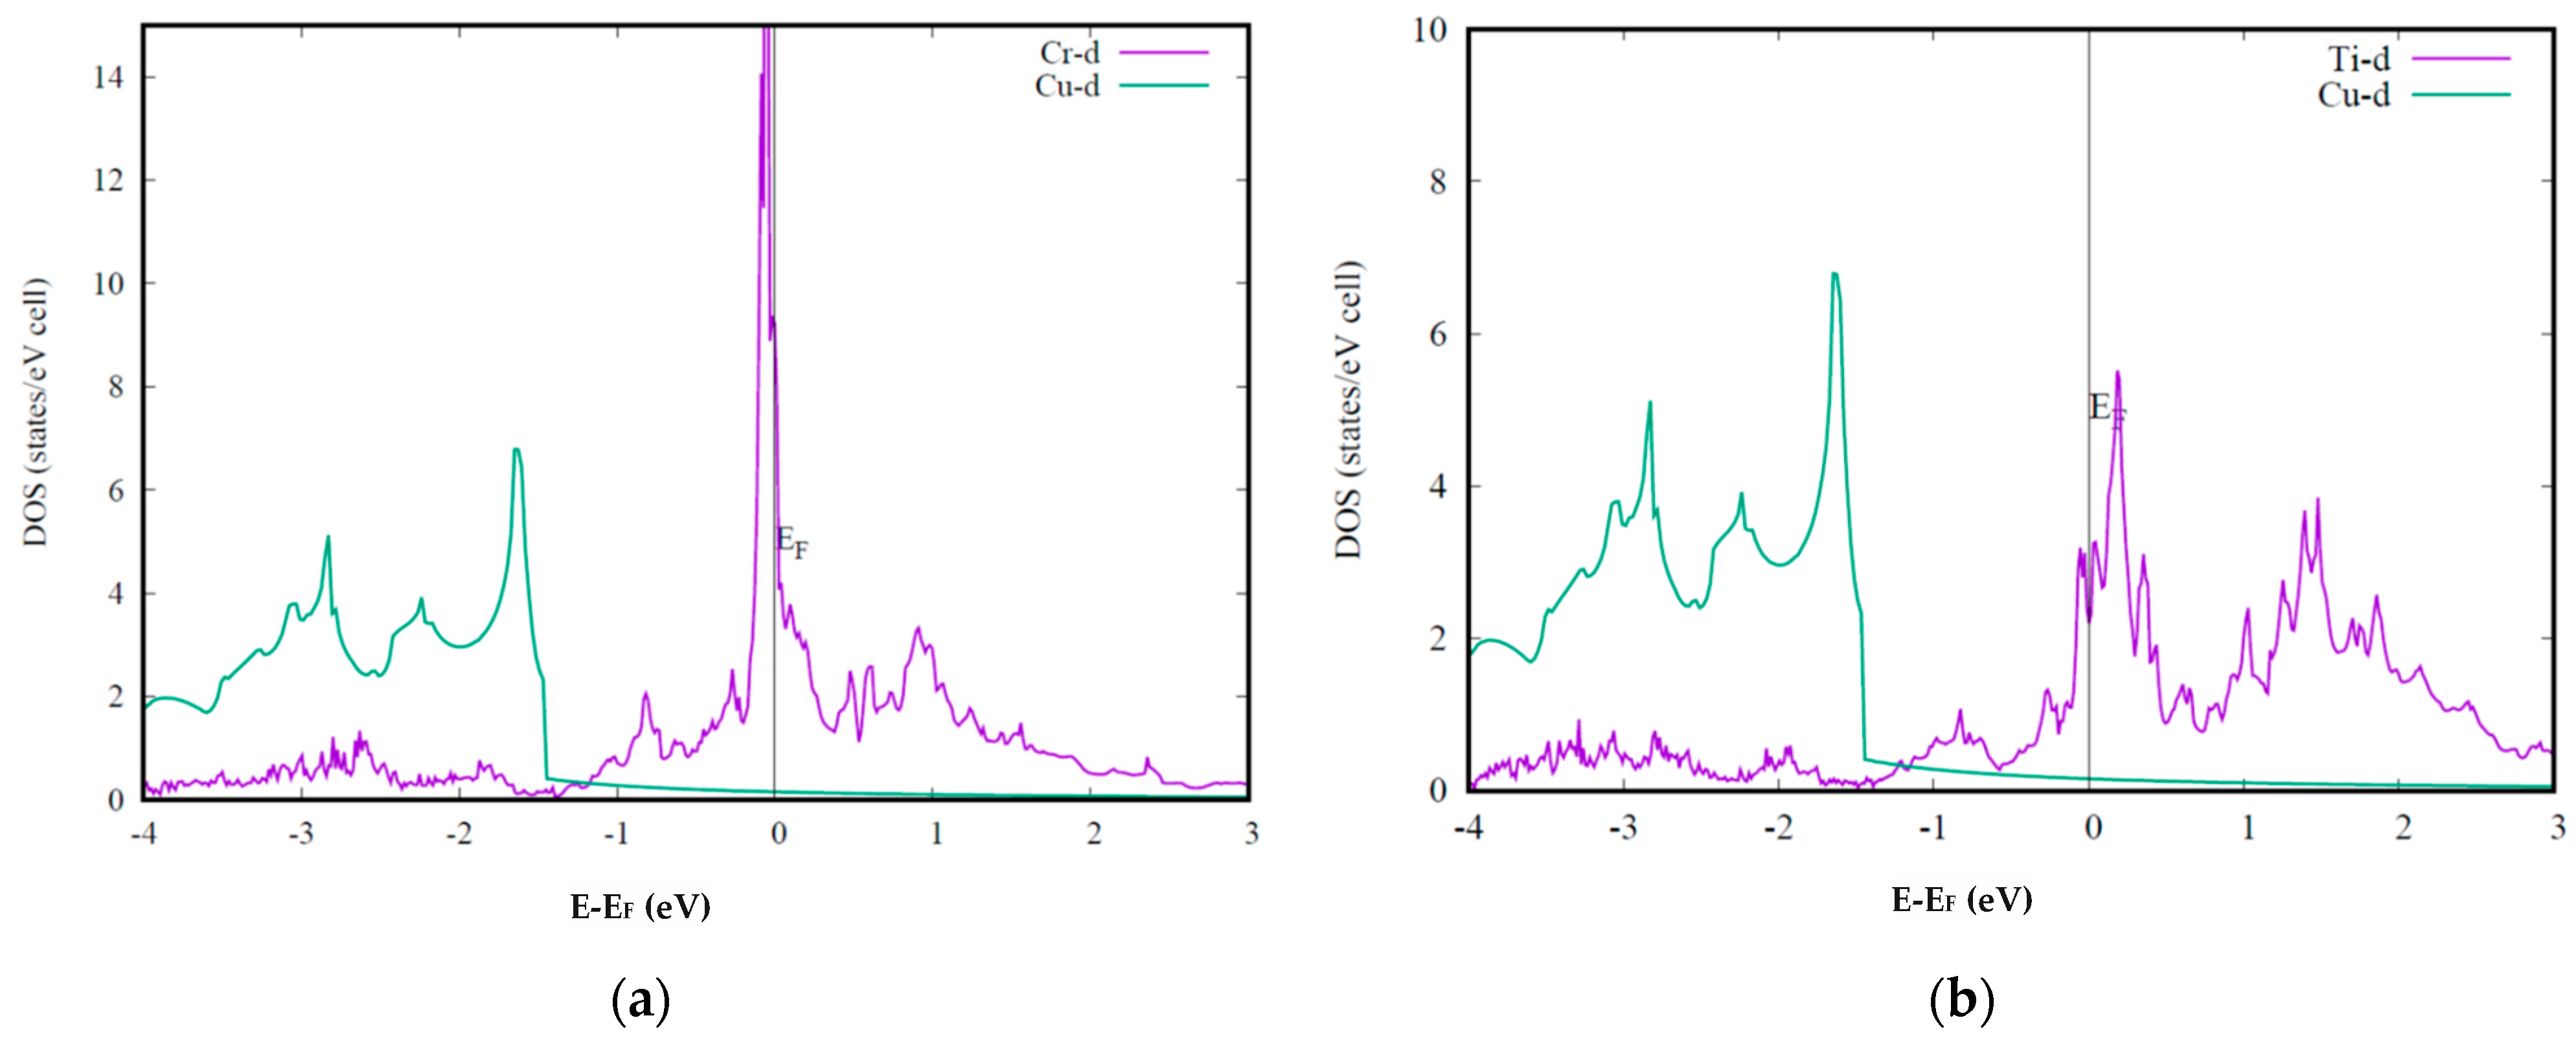
Figure 2 presents the calculated DOS for Cu-Cr and Cu-Ti alloys compared with pure Cu DOS. The presented results are calculated with the super cell including 64 atoms, while one Cu is substituted by Cr or Ti. The results are examined using a larger supercell with 125 atoms. Both Cu-Cr and Cu-Ti alloys show a high DOS at the Fermi level. As we discussed that the peak DOS of Cu-Ti alloy is consistent with the rapidly decreased electrical conductivity in Cu-Ti alloy. However, the DOS peak at the Fermi level of Cu-Cr alloy is even higher than that of Cu-Ti alloy. Therefore, the calculation results suggest the lower electrical conductivity in Cu-Cr than that in Cu-Ti. This conclusion contradicts the experimental results, apparently. Seemingly, the theoretical band structure calculation fails on this problem. To explain this puzzle, some authors proposed that Cr in bulk Cu can form complicated nano-size alloys, which lessen the influence of Cr atoms on the electrical conductivity. This presumption is difficult to examine, and it cannot explain why the other
3d transition metals cannot form nanoparticles. According to the previous reports, the electrical conductivity of Cu-Cr alloy decreases linearly as the amount of Cr increases. This behavior cannot be explained by the nanoparticles either.
Although Cr and Ti are close elements in the periodic table, the calculated density of states for the two alloys are quite different. As we mentioned that the electrical conductivity is mainly determined by the DOS at the Fermi level, those differences may contain some important information. In Cu-Cr alloy, the Cr-d orbital expands from −1 to 3 eV. There are two peaks located at 0 and 1 eV, which may be identified as t2g and eg contributions, respectively. In Cu-Ti alloy, the Ti-d orbital expands from 0.5 to 3 eV, while the two peaks are at 0.2 and 1.4 eV. Compared with the Ti-d orbital, the Cr-d orbital is a little lower. This is reasonable, as the atom energy level of the 3d orbital decreases with the increasing atomic number. As may be seen, the Cu-d orbital is nearly below the Fermi level. The two peaks of the Cr-d and Ti-d orbitals are due to the crystal filed splitting. Within the cubic field, d-orbitals are split into the lower t2g and higher eg orbitals. Due to the lower energy level of Cr-d orbitals, the crystal field splitting in Cr is much weaker than in Ti. The high peak at the Fermi level in Cu-Cr alloy is thus contributed by the higher eg orbitals as well. For the above reasons, the highest DOS peak of Cr is much higher than that of Ti. Meanwhile, the electronic configurations of Cr and Ti are 3d54s and 3d24s2, respectively. All 10 Cr-d orbitals are nearly half occupied, and therefore, the highest DOS peak is very close to the Fermi level.
According to the Stoner theory, the high density of states at the Fermi level would cause magnetic instability. As for the Cu-Cr alloy, band structure calculation may need to consider the spin polarization induced by its high density of states at the Fermi level, although there are no experimental reports on the magnetic structure of Cu-Cr alloy. It needs to be emphasized that the high density of states of Cr originates in its atomic number, which is highly element-selective.
To test the above idea, a magnetic calculation is performed for Cu-Cr alloy. A computational detail is worth mentioning. Using the direction spin polarized calculation, the system is found to be non-magnetic. This may be due to the very small amount of Cr relative to the Cu matrix. To search for a magnetic solution, we perform the non-magnetic calculation in the first step and then give a large local magnetic moment to the Cr atom while the magnetic moments on the Cu atoms are all set to zero. In the next step, magnetic band structure calculations are performed. Surprisingly, a stable magnetic solution is finally obtained, considering the lack of experimental reports. The calculated total energies show that the magnetic solution is even more stable than the non-magnetic solution. Using the super cell containing 1/64 Cr, the total energy of the magnetic solution is about 0.05 eV lower than that of the non-magnetic solution. Using the super cell containing 1/125 Cr, the total energy of the magnetic solution is about 0.03 eV lower than that of the non-magnetic solution. The obtained magnetic moment is 3.50 μB within the 64-atom super cell and 3.52 μB within the 125-atom super cell. The calculated magnetic moment is less than the theoretical value for the Cr2+ ion. This decrease may be due to two reasons. Firstly, the calculation was applied using the muffin-tin orbitals method, while the magnetic moment is counted only within the muffin-tin sphere. Secondly, the hybridization of s-d orbitals may reduce the magnetic moment.
In
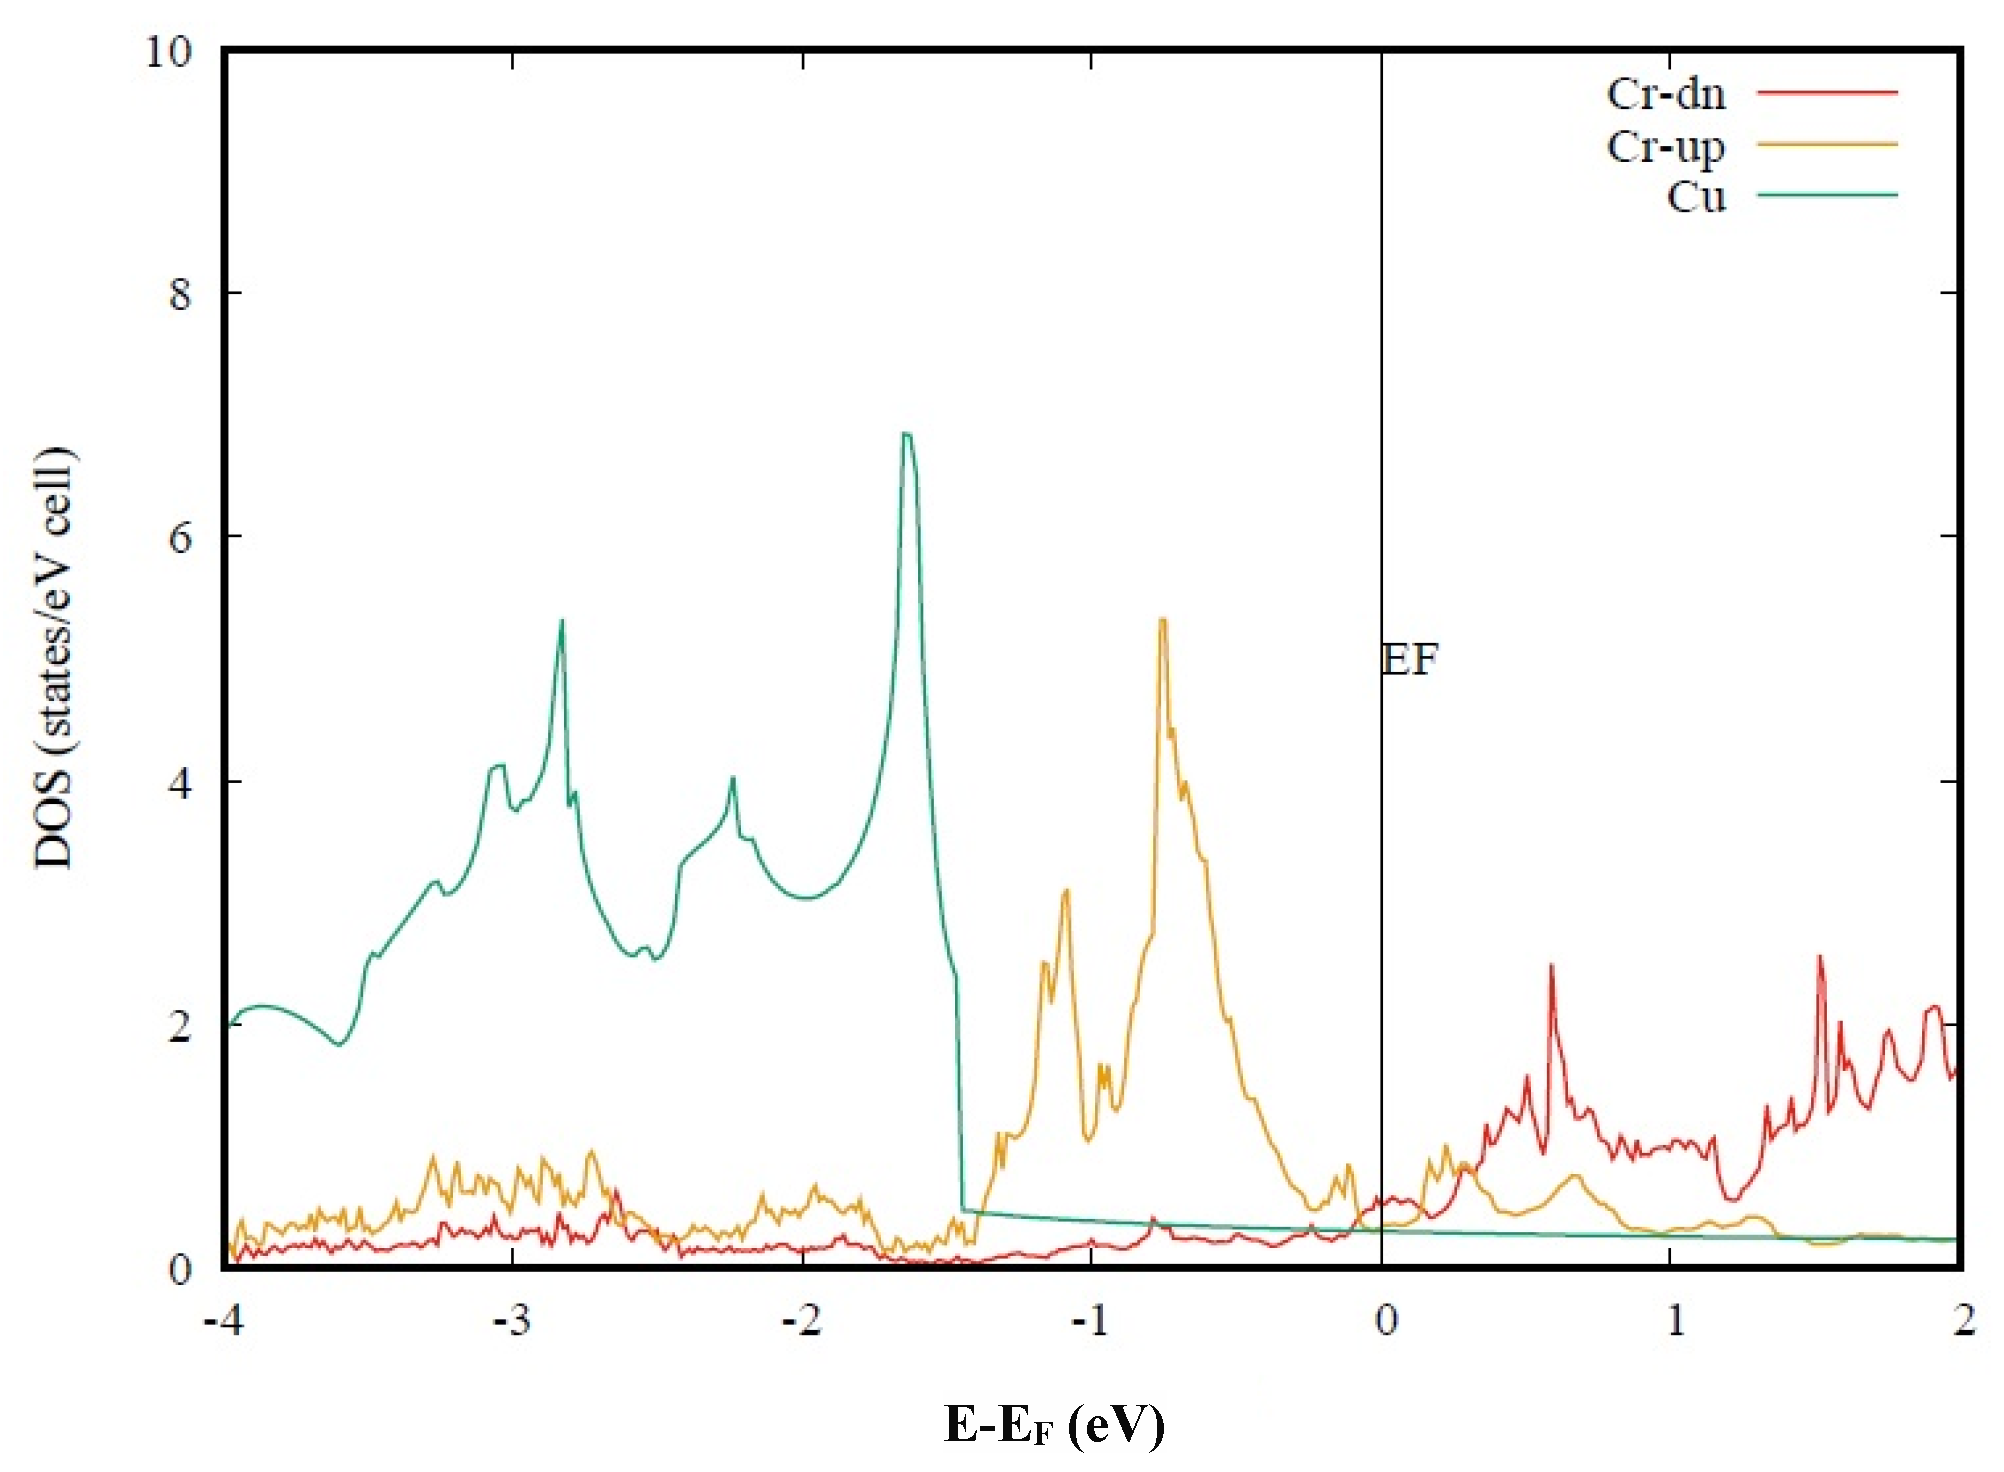
Figure 3, we present the calculated spin-dependent DOS for Cu-Cr alloy. At first glance, one may find that the density of states at the Fermi level is largely reduced. In the figure, the Cr-d orbitals are separated into the spin-up channel and spin-down channel, plotted with different colors. Compared with the non-magnetic results shown in
Figure 2, the spin-up channel is downwards shifted, while the spin-down channel is upwards shifted. The DOS peak for spin-up is shifted to −0.8 eV, while the first peak for spin-down is shifted to 0.7 eV. At the Fermi level, both spin-up and spin-down orbitals contribute to the low density of states, due to the well-separated two channels. To be consistent with
Figure 1 and
Figure 2, the Cu-d density of states is spin degenerate. The total DOS of Cu should be doubled when it is compared with the magnetic calculation results. The calculated low density of states at the Fermi level is then consistent with the high electrical conductivity of Cu-Cr alloy. Meanwhile, one may find that the Cr-d orbital also contributes to the DOS from −2 to −3.5 eV, obviously. Those Cr-d characters indicate the strong hybridization between Cr-d and Cu-d orbitals. The enhanced d-d bonding would certainly increase the strength of the Cu-Cr alloy. Therefore, the high strength and high electrical conductivity of Cu-Cr alloy can be explained self-consistently by our simple calculation model.
We have shown that the electronic band structure calculation can explain the high electrical conductivity of Cu-Cr alloy only if spin polarization is considered. This conclusion does not mean that the alloy system has a long-range magnetic order, neither ferromagnetic nor antiferromagnetic. Our explanation only requires the local spin splitting, and the whole system can be paramagnetic. As spin polarization at the Cr site is required by the high electrical conductivity, we may learn an important condition for Cu-Cr alloy. If two Cr sites are close, the interaction between the two Cr-d orbitals would increase, leading to a decrease in spin splitting. As shown in
Figure 3, the low density of states at the Fermi level is sensitive to the strength of spin splitting. So, the distribution of Cr would strongly influence the electrical conductivity of Cu-Cr alloy. High electrical conductivity can be achieved only in well-distributed material.
Table 1 presents the electrical conductivity for Cu-1.5%Cr, Cu-0.5%Ni, and Cu-23%Ni alloys. The electrical conductivity of the Cu-1.5Cr alloy was measured as 46 MS/m, while that of the Cu-0.5Ni alloy reached 50.1 MS/m. However, when the Ni content increased to 23%, the conductivity exhibited a sharp decline to 2.9 MS/m.
Figure 4 presents the magnetization curves for Cu-1.5%Cr, Cu-0.5%Ni, and Cu-23%Ni alloys. The measurements were implemented at three temperatures, 200, 300, and 370 K. Cu-Ni alloy is also known as a high-strength and high-conductivity Cu-based alloy.
Figure 3 shows that dilute Cr doping in Cu tends to be spin polarized. The calculated local magnetic moment for a single Cr atom is about 3.50 μ
B, that is to say, Cr-doped Cu is easy to be magnetized. As may be seen, the magnetization of Cu-1.5%Cr under 500 Oe at 200 K is about 0.0015 A/m, while Cu-0.5%Ni exhibits a much smaller value of 0.000097 A/m. As Ni content is increased to 23%, the magnetization of Cu-Ni under 500 Oe at 200 K is about 0.0014. As the temperature increases, the magnetic susceptibility of the three samples decreases, indicating a paramagnetic behavior. The measurements in
Figure 4 reveal that Cu-Cr is much easier to magnetize than Cu-Ni, even though Cr and Ni are all magnetic elements. This confirms the calculation results shown in
Figure 3. Only if the Cr-d orbital is spin-polarized is the Cu-Cr alloy stabilized. Meanwhile, the decrease in density of states at the Fermi level lowers the electrical resistance.
Figure 5 presents the microstructure for Cu-1.5%Cr, Cu-0.5%Ni, and Cu-23%Ni alloys. The Cu-0.5%Ni and Cu-23%%Ni alloys exhibit solid solution microstructures, with the Cu-23%Ni alloy demonstrating a finer grain size compared to the Cu-0.5%Ni alloy. In contrast, the Cu-1.5%Cr alloy presents a dual-phase structure where chromium exists in two distinct forms: A portion of Cr atoms are dissolved in the copper matrix through solid solution, while the remaining chromium exists as elemental Cr precipitates that constitute the secondary phase.
Figure 6 shows the XRD patterns. In the Cu-1.5%Cr alloy, a small amount of elemental Cr remains undissolved and is not completely solid-solved into the matrix. In contrast, the Cu-0.5%Ni alloy forms a single-phase copper solid solution. Even when the Ni content is increased to 23%, the alloy still maintains a copper solid solution structure. However, compared to the standard PDF card, its diffraction peaks exhibit a distinct shift to lower angles.
As we mentioned, numerical electrical conductivity is very difficult to calculate accurately due to the problem of many-body interactions. It is nearly impossible to select a high electrical Cu alloy from numerical calculations. In this work, we present a much simpler method to describe the relative change of electrical conductivity in the lightly alloyed Cu, while only basic electronic band structure calculation is required. We have shown that the careful analysis of band structure can qualitatively explain the high electrical conductivity in Cu-Cr alloy, as well as the high strength. Based on the presented simple calculation model, we may construct a computational program for the automatic selection of Cu alloy.
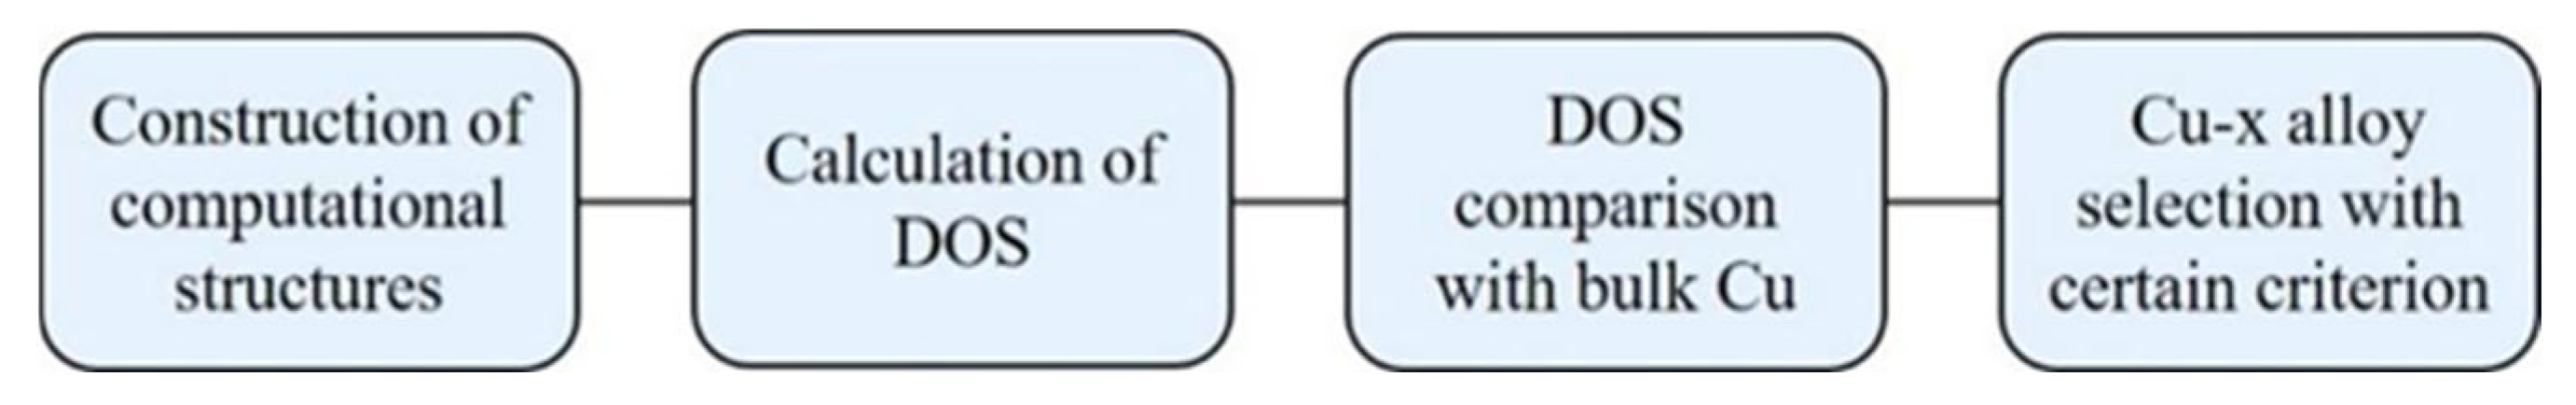
Figure 7 shows the schematic program of the computational selection method. Firstly, the computational structures are constructed with the picked alloy elements and their amounts. Secondly, the self-consistent band structure calculations are performed, and then the partial density of states on the alloy elements is calculated. Thirdly, the calculated density of states is compared with a standard Cu result. Fourthly, certain criteria to select the possible high electrical conductivity systems is built based on the relative change of density of states at the Fermi level. The systems with a very high density of states need to be picked out for further spin polarization calculations. To describe a lightly alloyed system, the computational structure needs to include at least 100 atoms. As for the first-principles calculations, such a super cell is too large to implement a large number of selections.
Figure 7 is just a schematic process, while a real machine learning program requires a more detailed design. The program of LMTO provides a fast band structure calculation, even though its accuracy is relatively low. Since the total energy in the selective program is not critical, this program can be applied to our specific goals.


