Article

Extraction of Valuable Metals from Spent Li-Ion Batteries Combining Reduction Smelting and Chlorination

School of Minerals Processing and Bioengineering, Central South University, Changsha 410083, China
*
Author to whom correspondence should be addressed.
Metals 2025, 15(7), 732; https://doi.org/10.3390/met15070732
Submission received: 28 May 2025 / Revised: 26 June 2025 / Accepted: 29 June 2025 / Published: 30 June 2025
(This article belongs to the Special Issue Green Technologies in Metal Recovery)

Abstract

Pyrometallurgical recycling of lithium-ion batteries presents distinct advantages including streamlined processing, simplified pretreatment requirements, and high throughput capacity. However, its industrial implementation faces challenges associated with high energy demands and lithium loss into slag phases. This investigation develops an integrated reduction smelting–chloridizing volatilization process for the comprehensive recovery of strategic metals (Li, Mn, Cu, Co, Ni) from spent ternary lithium-ion batteries; calcium chloride was selected as the chlorinating agent for this purpose. Thermodynamic analysis was performed to understand the phase evolution during reduction smelting and to design an appropriate slag composition. Preliminary experiments compared carbon and aluminum powder as reducing agents to identify optimal operational parameters: a smelting temperature of 1450 °C, 2.5 times theoretical CaCl2 dosage, and duration of 120 min. The process achieved effective element partitioning with lithium and manganese volatilizing as chloride species, while transition metals (Cu, Ni, Co) were concentrated into an alloy phase. Process validation in an induction furnace with N2-O2 top blowing demonstrated enhanced recovery efficiency through optimized oxygen supplementation (four times the theoretical oxygen requirement). The recovery rates of Li, Mn, Cu, Co, and Ni reached 94.1%, 93.5%, 97.6%, 94.4%, and 96.4%, respectively. This synergistic approach establishes an energy-efficient pathway for simultaneous multi-metal recovery, demonstrating industrial viability for large-scale lithium-ion battery recycling through minimized processing steps and maximized resource utilization.

1. Introduction

The recycling of lithium-ion batteries (LIBs) is a critical measure in addressing global energy transition and environmental protection [1]. With the widespread adoption of electric vehicles and electronic devices, the volume of spent LIBs has surged [2]. Improper disposal can result in high density metal pollution and resource wastage. Recycling enables the efficient extraction of scarce metals such as Li, Co, and Ni, thereby reducing reliance on mineral resources, lowering energy consumption in mining, and mitigating ecological damage [3,4]. Additionally, the circular economy model helps alleviate supply chain risks, fosters green industrial value creation, and drives sustainable development. This approach combines ecological benefits with strategic significance, advancing both environmental health and long-term economic resilience [5,6,7].
In recent years, research and industrial applications in the recycling of spent LIBs have driven significant advancements in recycling technologies, yet numerous challenges persist [8]. Currently, direct regeneration lacks large-scale production experience and suffers from limited technical applicability, making it difficult to process complex, large-scale feedstock of spent LIBs [9,10,11]. Hydrometallurgical processes require intricate pretreatment steps to obtain the “black powder”, followed by multiple stages of leaching and extraction, resulting in cumbersome recycling procedures and a high risk of impurity introduction [12,13].
In contrast, pyrometallurgical processes, despite their high energy consumption due to the need to maintain elevated smelting temperatures, offer strong feedstock adaptability [14]. They can handle mixed and complex LIB types without requiring meticulous sorting. Pyrometallurgical processes also feature simplified pretreatment—typically involving only discharge and crushing before direct feeding into smelting furnaces [15]. Moreover, their high scalability, rapid processing speed, and large throughput make pyrometallurgy particularly suitable for addressing the impending surge in spent LIBs.
Conventional studies often argued that pyrometallurgical processes were less economically and environmentally favorable compared to hydrometallurgy and direct regeneration technologies, particularly due to the substantial energy consumption required to maintain high smelting temperatures [14,16]. However, recent advancements in pyrometallurgical technology have challenged this view [17]. A latest study employing a simulated process approach to assess the life cycle of LIBs revealed that integrating chloridizing volatilization processes with smelting for Li recovery is environmentally and economically viable [17]. Additionally, Hoof et al. [18] argued that hydrometallurgical processes may not necessarily result in fewer indirect emissions across the entire treatment chain compared to pyrometallurgy. Meanwhile, Rajaeifar et al. [19] suggested that optimizing the pyrometallurgical process route could further reduce its environmental footprint, demonstrating the potential for continuous improvement in this field [20].
Therefore, compared to the complex hydrometallurgical process, the pyrometallurgical route offers the distinct advantages of a shorter process and higher throughput. Usually, the pyrometallurgical process directly recycles the entire spent lithium-ion battery, including cathode materials, anode materials, copper foil, aluminum foil, etc. This makes it highly promising for future large-scale lithium battery recycling. However, traditional pyrometallurgy faces economic challenges, including significant energy consumption and low profitability. This study investigates an integrated reduction smelting–chloridizing volatilization approach for the comprehensive recovery of strategic metals (Li, Mn, Cu, Co, Ni) from spent ternary lithium-ion batteries, and CaCl2 was chosen as the chlorinating agent. The thermodynamics of this approach was analyzed in detail. Preliminary experiments were performed using commercial NCM111 powder as feedstock and carbon and aluminum powder as reducing agents to optimize the reduction smelting conditions. On this basis, actual Li-ion batteries (after pretreatment) were processed by top blowing N2-O2 into the molten bath, and the usage of oxygen was optimized to achieve the maximum metal recovery. Finally, the smelting products (dust, alloy, and slag) were characterized to demonstrate element partitioning during this hybrid approach.

2. Experimental Section

2.1. Materials and Chemicals

Pure commercial NCM111 powder (composition data are listed in Table 1) was used in the preliminary experiments. In the validating experiment, the raw material used was 18650-type spent LIBs. After pre-treatment of the spent LIBs, a powdered material was obtained, and the content of recoverable elements in this powder was analyzed using ICP-OES. As shown in Table 2, the elemental composition of the raw material was as follows: 13.8 wt.% Ni, 8.2 wt.% Cu, 7.7 wt.% Mn, 5.4 wt.% Co, 5.2 wt.% Al and 3.4 wt.% Li. Other reagents, including NaCl (98% purity), SiO2 (99% purity), CaO (98% purity), CaCl2 (97% purity), Cu powder (99% purity) and Al powder (99% purity), were of analytical grade and were used without further purification.

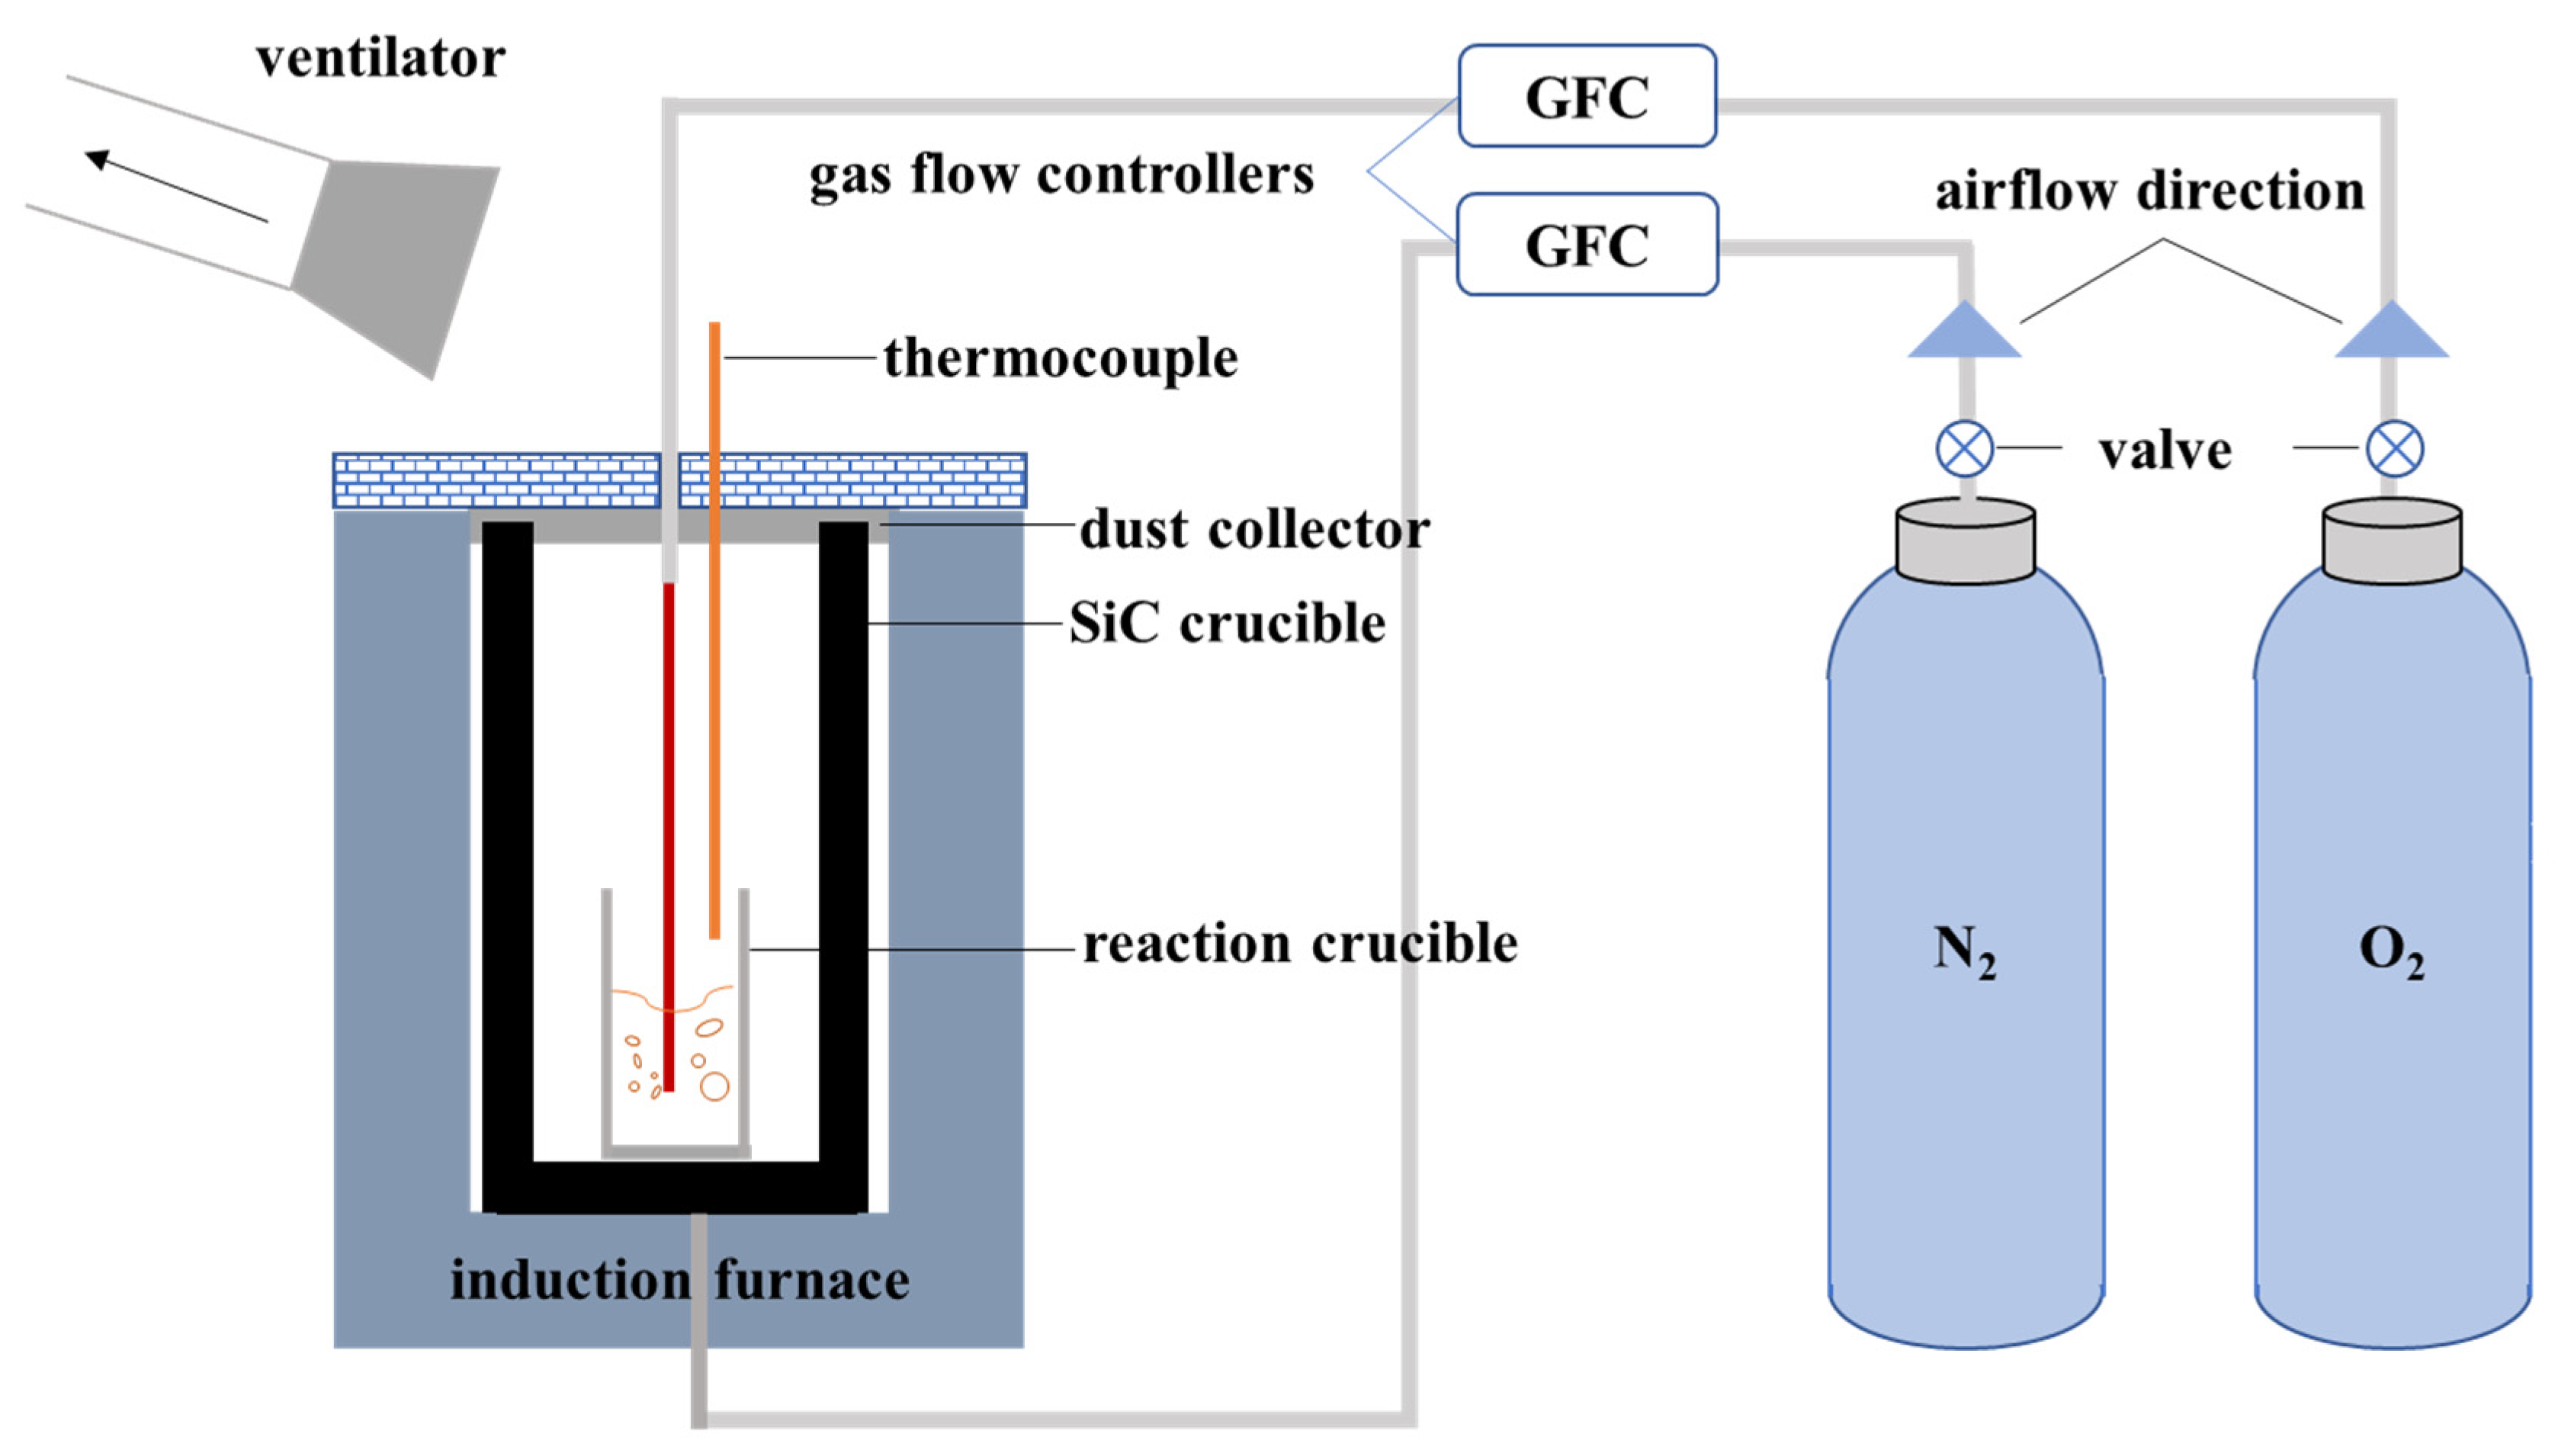
2.2. Experimental Procedure

2.2.1. Pretreatment of Spent Batteries

First, the spent LIBs were soaked in a saturated NaCl solution for 24 h. After removal and drainage, a multimeter was used to measure the voltage of the batteries. When the measured voltage was below 0.3 V, the batteries were confirmed to be fully discharged. Subsequently, the plastic outer casing and iron shell of the batteries were removed using a manual peeling method. The peeled components were then cut into powdered material using a shear-type crusher, which was prepared as the raw material for the smelting experiment.

2.2.2. Preliminary Experiments

Preliminary experiments were performed in a horizontal tube furnace, as illustrated in Figure 1. The raw materials consisted of NCM111 cathode material mixed with copper powder and aluminum powder, proportioned according to their mass ratios in NCM111 lithium-ion batteries, simulating the main components of spent LIBs targeted for recycling. Predetermined amounts of reductants (aluminum powder was replaced with alumina during the carbothermic reduction, with added carbon powder; aluminum powder was introduced during aluminothermic reduction), chlorinating agent (CaCl2), and slag-forming agents (CaO and SiO2) were incorporated. The prepared mixture was thoroughly ground and homogenized before being transferred into a square crucible for subsequent processing. The crucible containing the sample was loaded into the tube furnace, and N2 was introduced at a flow rate of 1 L/min. Subsequently, the furnace was heated, held at temperature, and cooled according to a predefined temperature program. Throughout the smelting process, a continuous N2 flow was maintained to preserve a reducing atmosphere. After the smelting process, the samples were allowed to cool to room temperature inside the furnace. Finally, the cooled crucible was taken out to obtain the alloy and smelting slag, and the dust were collected from the gas washing bottle. The separated smelting products were used for subsequent detection and characterization.

2.2.3. Validating Experiment on the Actual Spent LIBs

Process validation using actual pre-treated LIBs was conducted in an induction furnace with N2-O2 top blowing, as shown in Figure 2. A crucible was loaded with thoroughly mixed raw materials, chlorinating agents, and slag-forming agents in predetermined ratios. The charged crucible was then placed in the induction furnace and subjected to programmed temperature control involving heating, holding, and cooling stages. During the high-temperature smelting process, O2 (95% purity) was continuously injected through a corundum tube (outer diameter: 10 mm, inner diameter: 6 mm) at a flow rate of 100 mL/min onto the slag surface to oxidize excess reducing agents and plastic separator membranes. The injected time of O2 is determined by the required quantity. Notably, N2 (98% purity, a flow rate of 900 mL/min) was supplied continuously through the furnace bottom as a protective atmosphere throughout the smelting process. Following oxygen injection and smelting reactions, the crucible samples underwent programmed cooling within the furnace. The cooled samples were subsequently removed, separated, and subjected to post-experiment characterization and analysis.

2.3. Materials Characterization

The phase composition of the samples was analyzed using an X-ray diffractometer (XRD, D8 ADVANCE, Bruker, Berlin, Germany). The concentrations of metals in the samples were determined using inductively coupled plasma optical emission spectrometry (ICP-OES, ICAP7400 radial, Thermo Fisher Scientific, Waltham, MA, USA). The microscopic morphology analysis of alloy samples was conducted using a scanning electron microscope (SEM-EDS, Sigma300, Carl Zeiss AG, Oberkochen, Germany).
The distribution rates of the elements in each smelting product (ε) were calculated according to Equation (1).
ε = M i ω i M 0 ω 0 × 100 %
In Equation (1), ε (%) indicates the distribution rates of elements in each smelting product, Mi (g) indicates the mass of a specific smelting product, ωi (wt.%) indicates the mass fraction of the element in the specific smelting product, M0 (g) indicates the mass of the raw material, ω0 (wt.%) indicates the mass fraction of the element of the raw material.

3. Results and Discussion

3.1. Thermodynamic Analysis

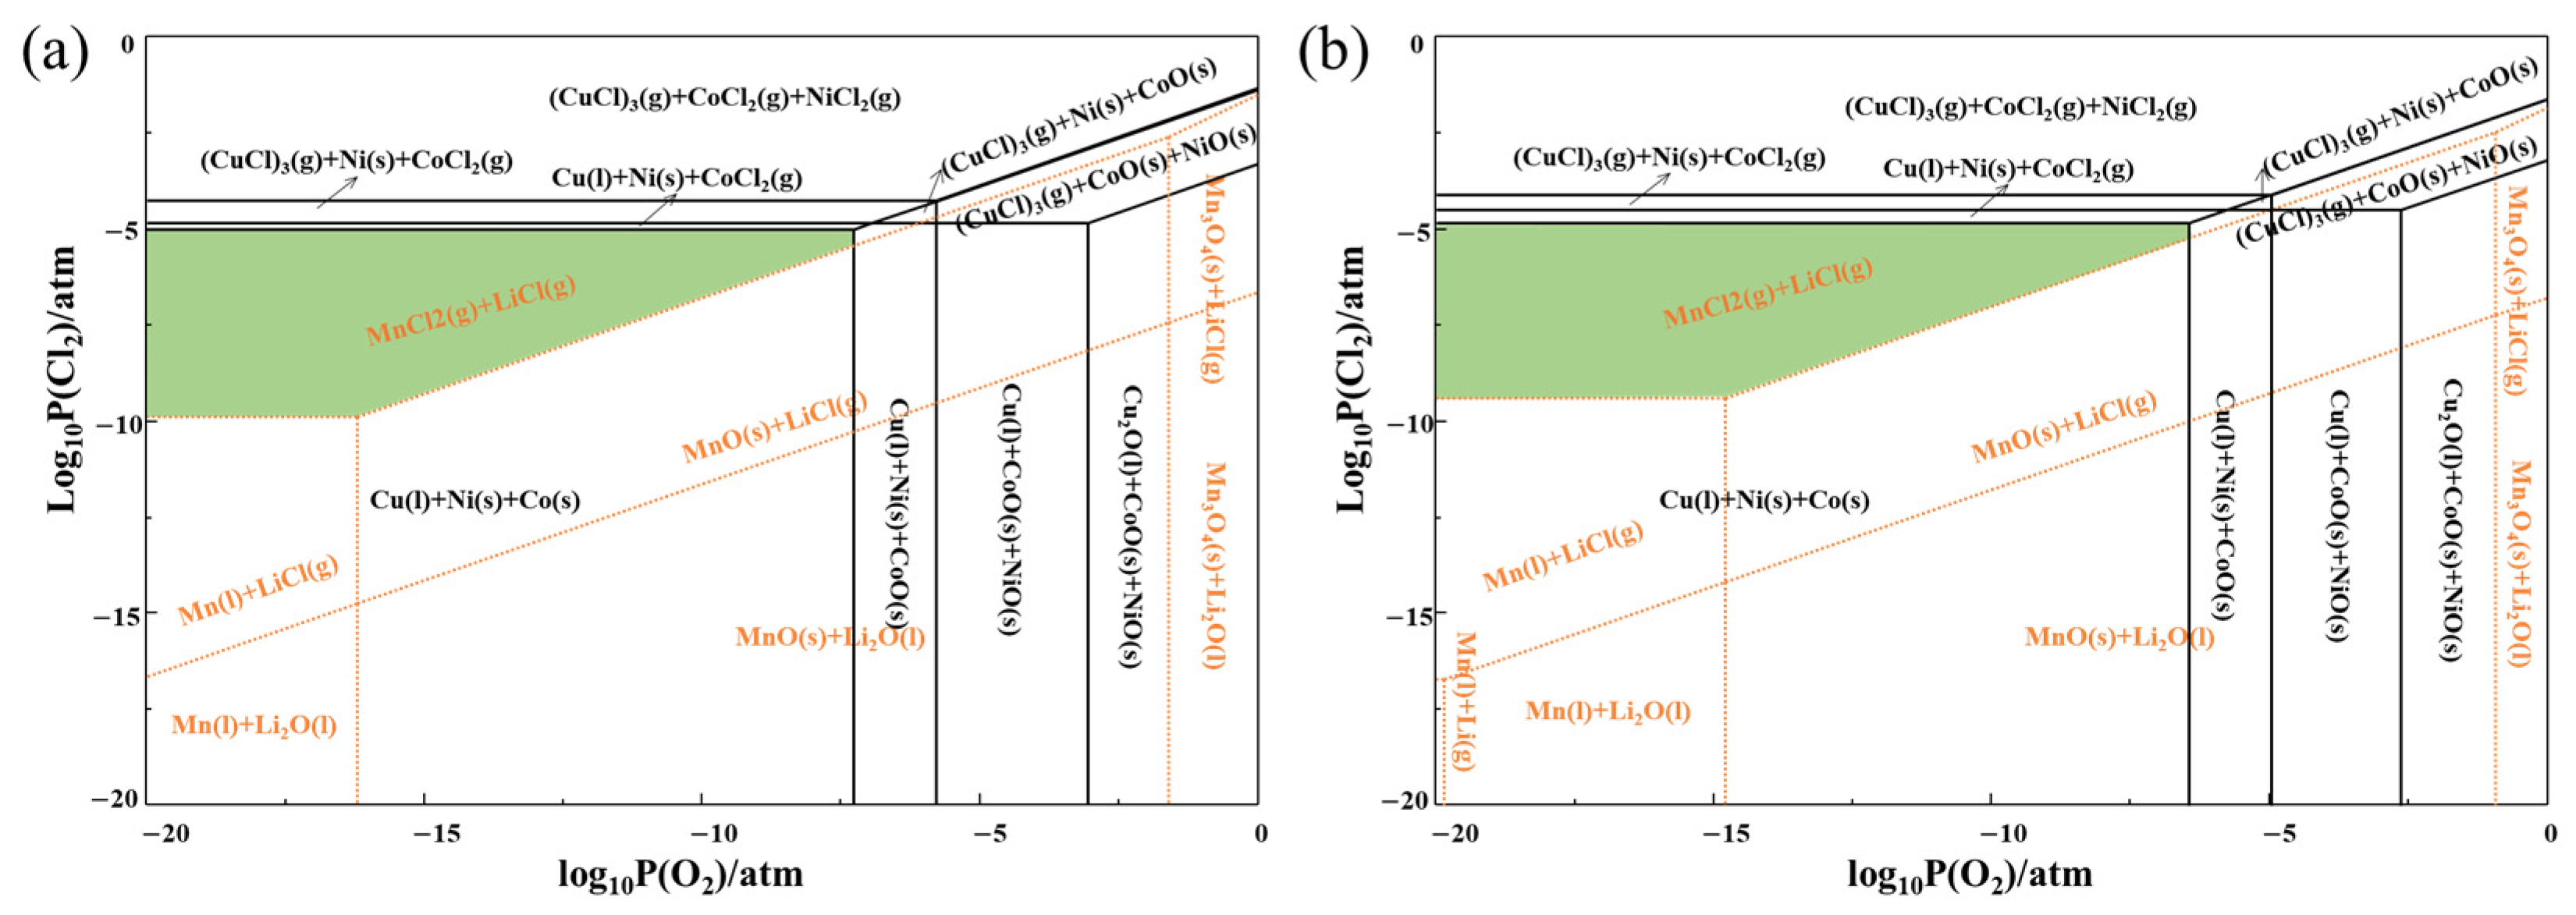
3.1.1. Predominance Phase Diagrams of Li-Mn-Cl-O and Cu-Co-Ni-Cl-O Systems

Reaction predominance phase diagrams can be used to describe the stable substances formed by various elements after reactions in a given system. In this section, based on the atmosphere constructed in the experiment of reduction smelting–chloridizing volatilization of spent LIBs, the reaction dominance phase diagrams of the Li-Mn-Cl-O system and the Cu-Co-Ni-Cl-O system were calculated and plotted using FactSage 8.0.
Figure 3a,b present superimposed diagrams of the Li-Mn-Cl-O and Cu-Co-Ni-Cl-O systems at 1400 °C and 1500 °C, respectively. The smelting process requires control of the reducing and chloridizing atmospheres to enable Li and Mn conversion into volatile chlorides (LiCl(g) + MnCl2(g)), corresponding to the region above the upper orange dashed line in the Li-Mn-Cl-O diagram; Cu, Co, and Ni transformation to metallic forms (Cu(l) + Co(s) + Ni(s)), corresponding to the square region in the lower-left corner of the Cu-Co-Ni-Cl-O diagram.
The green shaded areas in Figure 3a,b represent the optimal oxygen and chlorine partial pressure ranges satisfying both conditions. Comparative analysis shows that increasing temperature expands the Cu(l) + Co(s) + Ni(s) stability region but shifts the Mn volatilization boundary upward, thereby reducing the LiCl(g) + MnCl2(g) stability area. This indicates that higher temperatures weaken the demand for reducing atmospheres while strengthening the requirement for chloridizing atmospheres during reduction smelting.

3.1.2. Slag Selection and Adjustment for Reduction Smelting

Constructing a suitable type of smelting slag is crucial for the smelting process. The characteristics such as the melting points and viscosity of the metallurgical slag during the smelting process can be changed by adjusting the proportion of slag types. In this experiment, a ternary slag type of CaO-SiO2-Al2O3 was constructed. The melting points and viscosities of various slag types were calculated using FactSage 8.0, providing a reference for the slag type in the smelting experiment process.
Phase diagrams can visually illustrate the influence of different CaO-SiO2-Al2O3 ratios on the stable phase formation of final slag at specified temperatures. Figure 4a,b show the calculated CaO-SiO2-Al2O3 ternary phase diagrams at 1400 °C and 1500 °C, respectively, using the FactSage 8.0 phase diagram module. The shaded areas in the diagrams represent the liquid phase regions of the slag. By comparison, it can be observed that the liquid phase region expands as the temperature increases. During smelting experiments, CaO-SiO2-Al2O3 ratios located within the liquid phase region should be selected to ensure that the slag fully melts into a liquid phase at the smelting temperature, thereby facilitating the separation of the molten slag from the alloy. The liquid phase regions in the phase diagrams are divided into two distinct zones: a larger liquid phase region exists under conditions of low Al2O3 mass fraction, while a smaller liquid phase region appears when the SiO2 mass fraction is relatively low. Additionally, considering that the aluminum foil content in the raw materials of spent lithium batteries in this study is limited, the slag composition with low Al2O3 mass fraction (controlled at 10 wt.%) is adopted in subsequent computational studies to avoid introducing additional Al2O3 into the slag-forming process.
With the Al2O3 mass fraction fixed in the slag composition, the influence of CaO and SiO2 mass fractions on the formation of liquid-phase slag was analyzed. Figure 4c presents a phase diagram showing the effect of CaO mass fraction (under fixed Al2O3 content) on slag composition and its temperature-dependent behavior. The orange-shaded region in the diagram indicates the area where the slag fully transforms into a liquid phase. The CaO mass fraction required for complete liquid-phase formation ranges approximately from 10 wt.% to 50 wt.%. By observing the lower boundary of the liquid-phase region (at a fixed Al2O3 mass fraction of 10 wt.%), the following trends are revealed: as the CaO mass fraction increases from 10 wt.% to 25 wt.%, the slag melting point decreases, indicating that higher CaO content promotes slag melting; further increases from 25 wt.% to 40 wt.% in CaO raise the melting point, suggesting that excessive CaO begins to hinder the slag melting; the melting point decreases again with increasing CaO from 40 wt.% to 50 wt.%; but beyond 50 wt.% CaO, the melting point rises rapidly. To achieve smelting experiments at relatively low temperatures, the CaO mass fraction is controlled within 30 wt.%~50 wt.%, while the SiO2 mass fraction is adjusted to 40 wt.%~60 wt.%.
The viscosity of molten slag, a critical physical property, reflects the internal friction during slag flow in its liquid state. Lower viscosity enhances slag fluidity, facilitating effective separation between the molten slag and liquid metal during smelting. This section further analyzes the viscosity of this slag composition using Equation (2).
V s + l = V l W l 2.5
where Vs+l indicates the fitted slag viscosity, Vl indicates the viscosity of the liquid slag calculated by the viscosity module of FactSage 8.0, and Wl indicates the liquid slag fraction obtained from the equilibrium module of FactSage 8.0.
Figure 4d illustrates the viscosity–temperature relationship of the CaO-SiO2-Al2O3 slag system under varying compositions. The results show that increasing the CaO content from 30 wt.% to 50 wt.% reduces slag viscosity. Based on the typical viscosity range (0.25~0.5 Pa·s) for Cu and Ni smelting processes, controlling slag viscosity within this range promotes alloy aggregation during smelting. As shown in Figure 4b, the optimal slag composition to achieve the desired viscosity in this study is 50 wt.% CaO + 40 wt.% SiO2 + 10 wt.% Al2O3 (CaO/SiO2 = 1.25, Al2O3/SiO2 = 0.25).

3.2. Effect of Smelting Conditions on the Recovery Rate of Valuable Metals

In this part of the experiment, pure cathode materials along with aluminum and copper powders were used to simulate the composition of spent lithium-ion batteries. Both aluminothermic and carbothermic reduction systems were employed to investigate the effectiveness of each reduction method and determine the optimal smelting reaction conditions.
The slag composition in the smelting experiment is designed with CaO/SiO2 of 1.25, Al2O3/SiO2 of 0.25. The theoretical Al powder dosage required to reduce Ni and Co oxides to their metallic states and Mn4+ to Mn2+ is determined as 8.2 wt.% based on the weight of the raw materials. And the theoretical C powder dosage is determined as 5 wt.%. Similarly, the theoretical dosage of CaCl2, necessary to convert Li into LiCl and Mn into MnCl2, is set at 33.3 wt.% of the raw material weight. A single-factor experimental design was employed to systematically investigate the effects of CaCl2 dosage, smelting temperature, and smelting time on the recovery rates of metallic elements.

3.2.1. Dosage of Calcium Chloride

Under the conditions of a melting temperature of 1500 °C and a melting time of 120 min, the influence of the dosage of CaCl2 on element migration in the two systems of aluminothermic reduction and carbothermic reduction was studied. CaCl2 was selected because repeated verification and theoretical calculations confirmed its effectiveness as a chlorinating agent in this study. Furthermore, the Ca in molten CaCl2 contributes to slag formation during smelting.
Figure 5a demonstrates the critical influence of CaCl2 dosage on lithium and manganese volatilization efficiency in flue dust. At the stoichiometric CaCl2 dosage (33.3 wt.%), lithium volatilization demonstrates superior kinetics with 95.8% recovery, contrasting sharply with manganese’s 20.7% volatilization rate—a thermodynamic preference hierarchy favoring LiCl formation. Progressive CaCl2 addition enhances volatilization efficiency, achieving near-quantitative lithium recovery (99.9%) at 2.5× stoichiometric dosage. Manganese behavior exhibits distinct biphasic kinetics: rapid escalation from 20.7% to 95.5% between 1.0× and 2.5× stoichiometry, followed by marginal improvement to 99.2% at 3.0× dosage. In this regard, a CaCl2 dosage of 2.5 times the theoretical value is considered optimal for concurrent Li and Mn recovery. Figure 5b shows the influence of CaCl2 dosage on the recovery rates of Cu, Co, and Ni in the alloy. The Cu recovery rate increases slowly as the CaCl2 dosage rises from the theoretical value to 2.0 times, accelerates between 2.0 and 2.5 times, and then declines with further increases. The recovery rates of Co and Ni follow a similar trend: they rise with CaCl2 dosage up to 2.5 times the theoretical value and subsequently decrease. Figure 5c,d illustrated the variations in elemental recovery rates with CaCl2 dosage in the carbothermic system, demonstrating a similar trend to that observed in the aluminothermic reduction system.
In summary, the optimal CaCl2 dosage is 2.5 times the theoretical value (83.3 wt.% of the spent LIBs feedstock), balancing high volatilization rates of Li, Mn and maximizing the recovery of Cu, Co, and Ni.

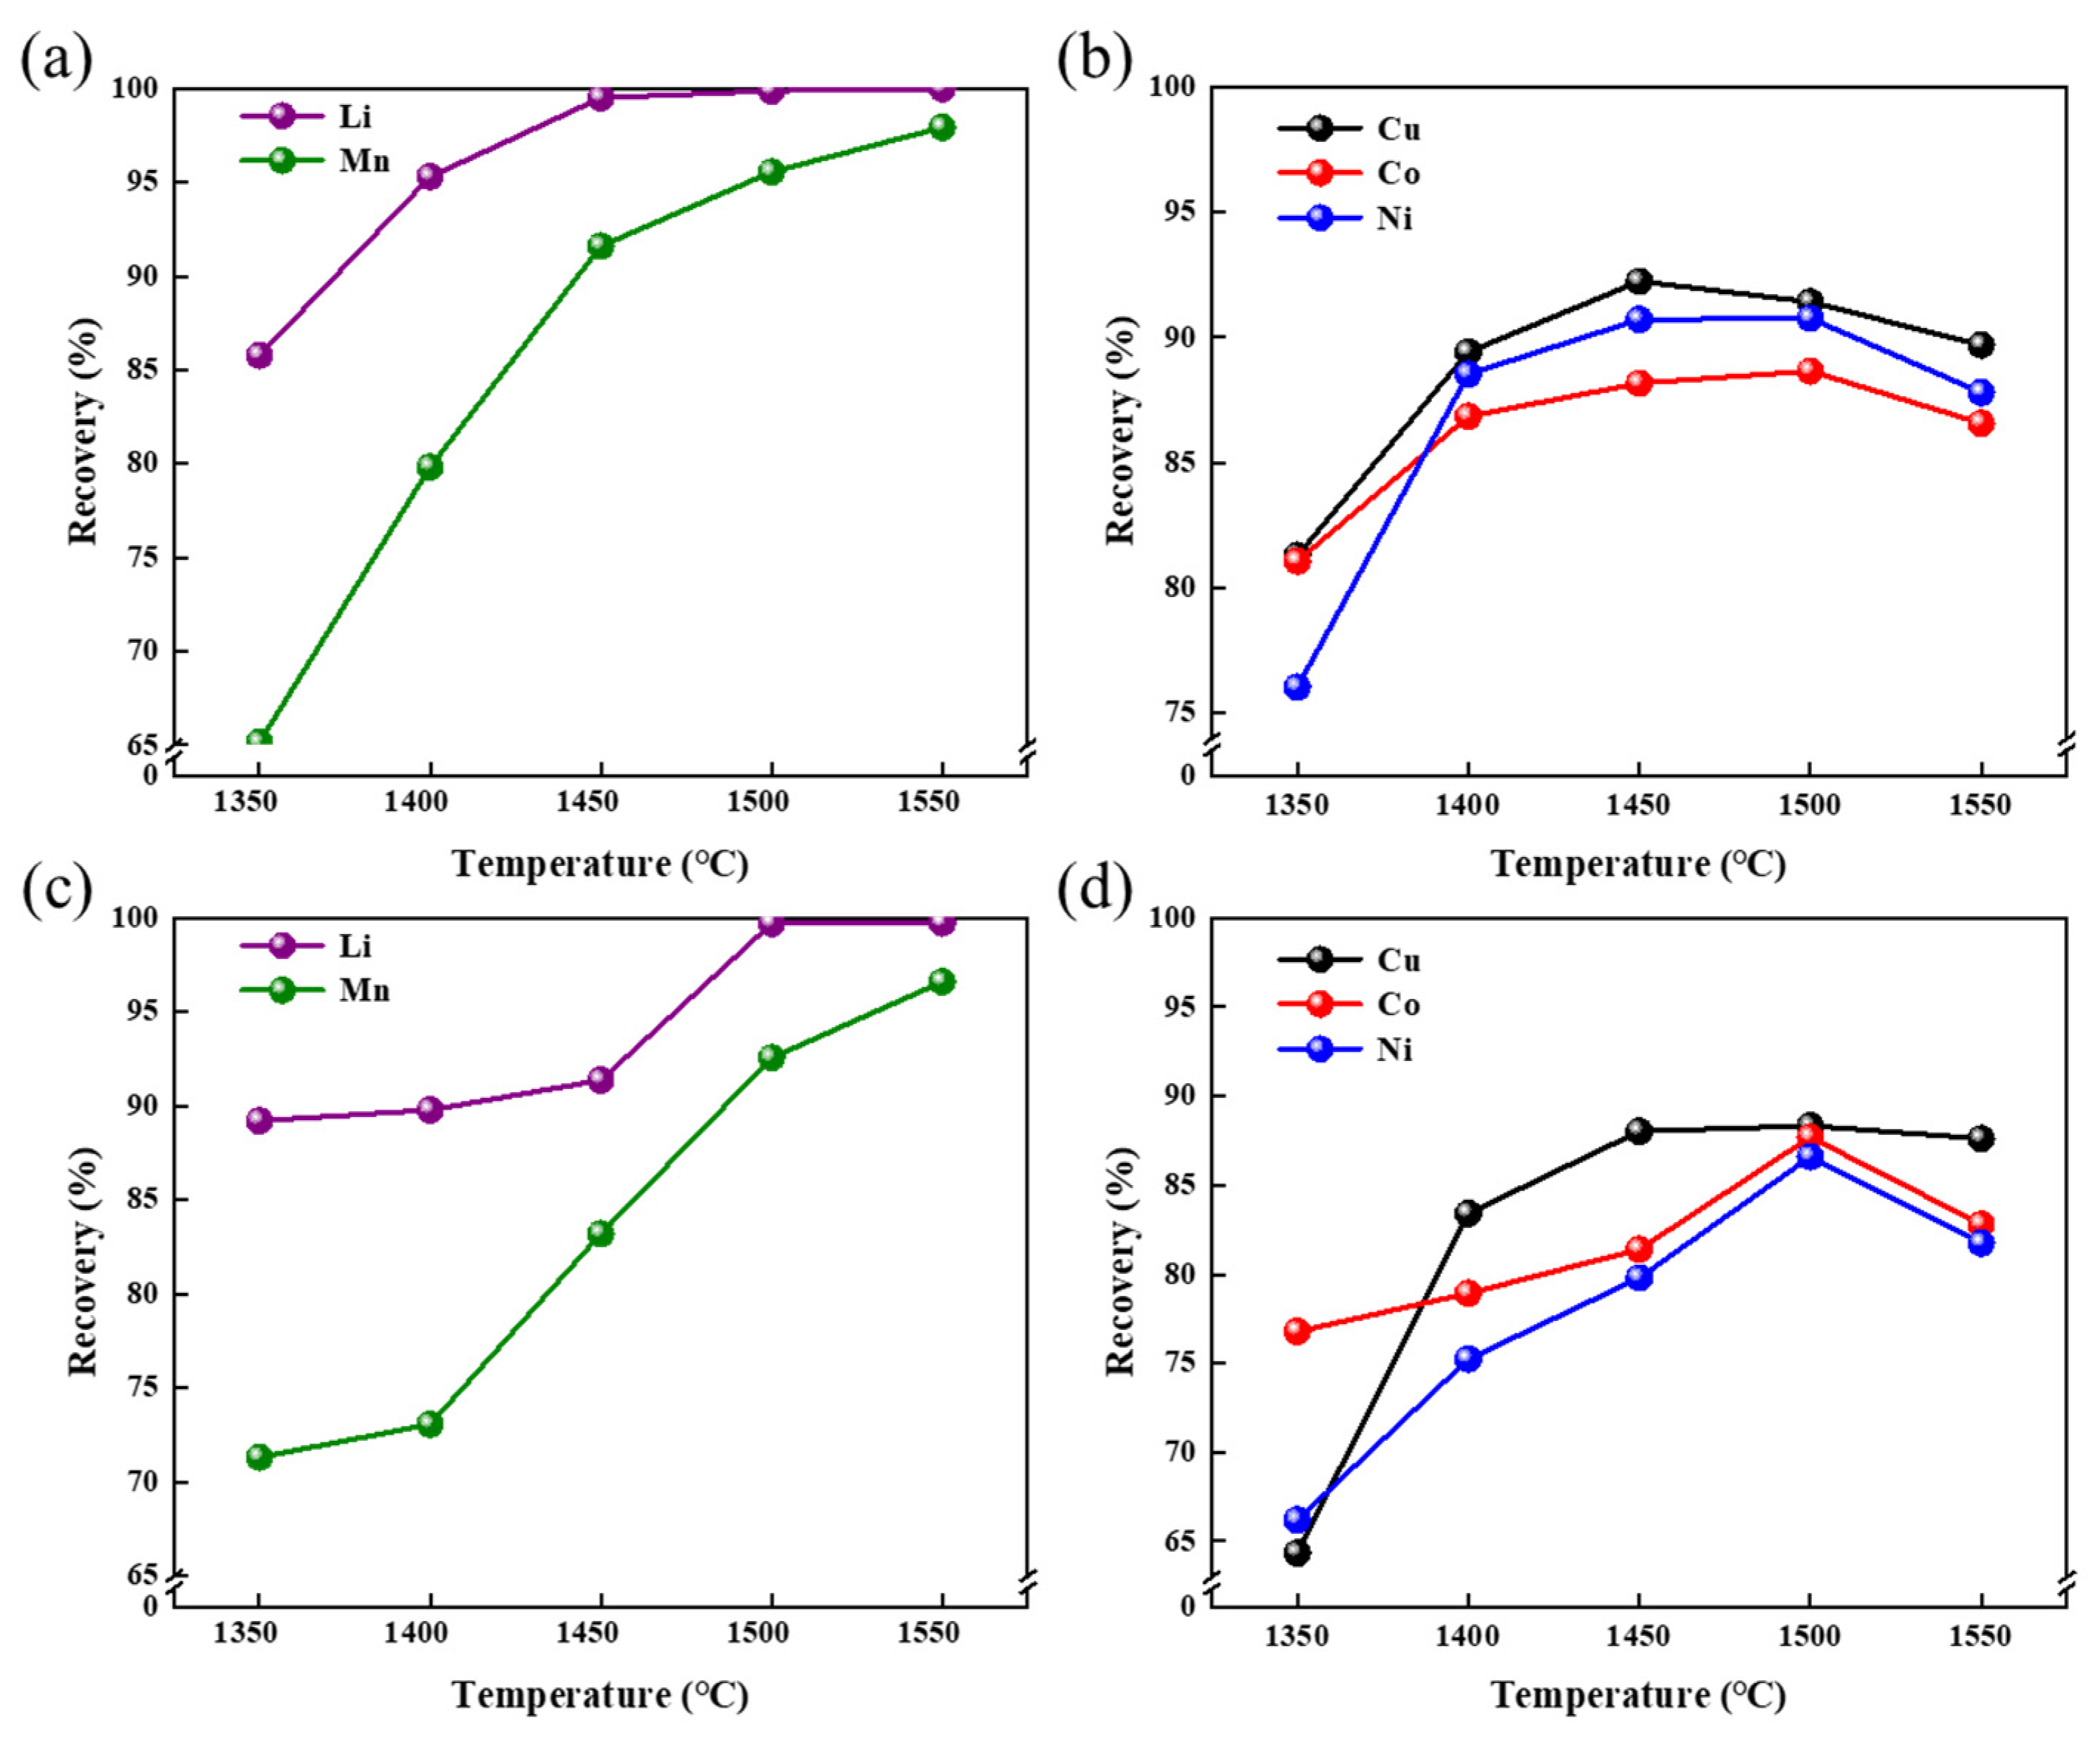
3.2.2. Smelting Temperature

With the dosage of CaCl2 fixed at 2.5 times the theoretical amount and smelting time set at 120 min, the influence of smelting temperature on elemental migration during recovery was investigated.
Figure 6a shows the effect of smelting temperature on the volatilization rates of Li and Mn in the dust. It can be observed that as the smelting temperature increased from 1350 °C to 1450 °C, the volatilization rate of Li rose from 85.8% to 99.5%, approaching complete volatilization. Further increases in temperature stabilized the Li volatilization rate around 99.5%. Meanwhile, the volatilization rate of Mn increased from 65.2% to 91.6% as the temperature rose from 1350 °C to 1450 °C. When the temperature continued to climb from 1450 °C to 1550 °C, the Mn volatilization rate increased from 91.6% to 98.0%, albeit at a slower growth rate. Experimental results at 1450 °C indicated that the vast majority of Li and Mn could be volatilized, confirming this temperature as optimal for their volatilization. Figure 6b illustrates the effect of smelting temperature on the recovery rates of Cu, Co, and Ni in the alloy. As the temperature increased from 1350 °C to 1450 °C, the recovery rates of Cu, Co, and Ni rose from 81.3% to 92.2%, 81.1% to 88.2%, and 76.1% to 90.7%, respectively. However, when the temperature increased further from 1450 °C to 1500 °C, the recovery rate of Cu slightly declined, while those of Co and Ni remained nearly unchanged. Beyond 1500 °C, the recovery rates of all three elements began to decrease. The maximum recovery rates for Cu, Co, and Ni were achieved around 1450 °C, making this temperature most favorable for their recovery. Figure 6c,d show the variation in element recovery with the smelting temperature in the carbon–thermal system, and the pattern presented was similar to that of the aluminothermic reduction system.
By comprehensively considering the volatilization rates of Li, Mn alongside the recovery rates of Cu, Co, and Ni, 1450 °C was selected as the optimal smelting temperature.

3.2.3. Smelting Duration Time

With the dosage of CaCl2 fixed at 2.5 times the theoretical amount and the smelting temperature set at 1450 °C, the influence of smelting time on elemental migration was investigated.
Figure 7a illustrates the effect of smelting time on the volatilization rates of Li and Mn in the dust. As the smelting time increased from 30 min to 90 min, the volatilization rate of Li rose from 90.4% to 99.3%, while that of Mn increased from 74.6% to 90.2%. With further extension of smelting time, the volatilization rate of Li stabilized at approximately 99.5%, and the volatilization rate of Mn showed only a 1.6% increase when the time was prolonged from 90 min to 150 min. Therefore, for the volatilization of Li and Mn elements, a smelting time of 90 min was sufficient, as prolonging the duration further did not significantly enhance the volatilization rates. Figure 7b presents the effect of smelting time on the recovery rates of Cu, Co, and Ni in the alloy. As the smelting time increased from 30 min to 120 min, the recovery rates of Cu, Co, and Ni rose from 70.6% to 92.2%, 60.2% to 88.2%, and 48.4% to 90.7%, respectively. However, when the smelting time exceeded 120 min, the recovery rates of all three elements began to decline slightly: Cu decreased from 92.2% to 88.1%, Co from 88.2% to 86.3%, and Ni from 90.7% to 85.0%. Figure 7c,d depicted the elemental recovery rates as a function of smelting time in the carbothermic system, demonstrating a comparable trend to the aluminothermic reduction system.
Thus, from the perspective of maximizing the recovery rates of Cu, Co, and Ni, a smelting time of 120 min was optimal.

3.3. Validation Experiment

The conditional exploration experiments in the previous study confirmed that both the aluminothermic reduction and carbothermic reduction systems can achieve the expected smelting effect, with their optimal conditions being close. Therefore, during the smelting of actual spent battery materials, aluminum foil and graphite from spent LIBs can be utilized as reducing agents. However, challenges arise from excessive reductant quantities (with graphite accounting for over 20% of the raw material mass) and the treatment of plastic separators in the batteries. Due to graphite’s stable nature and high melting point, it may not be completely consumed during reduction smelting, and the residual graphite would hinder alloy aggregation and slag formation. To address this issue, an oxygen-enriched top-blowing process is introduced, where excessive graphite and plastic separators could be combusted, providing heat for the smelting and contributing to the separation of slag and alloy.

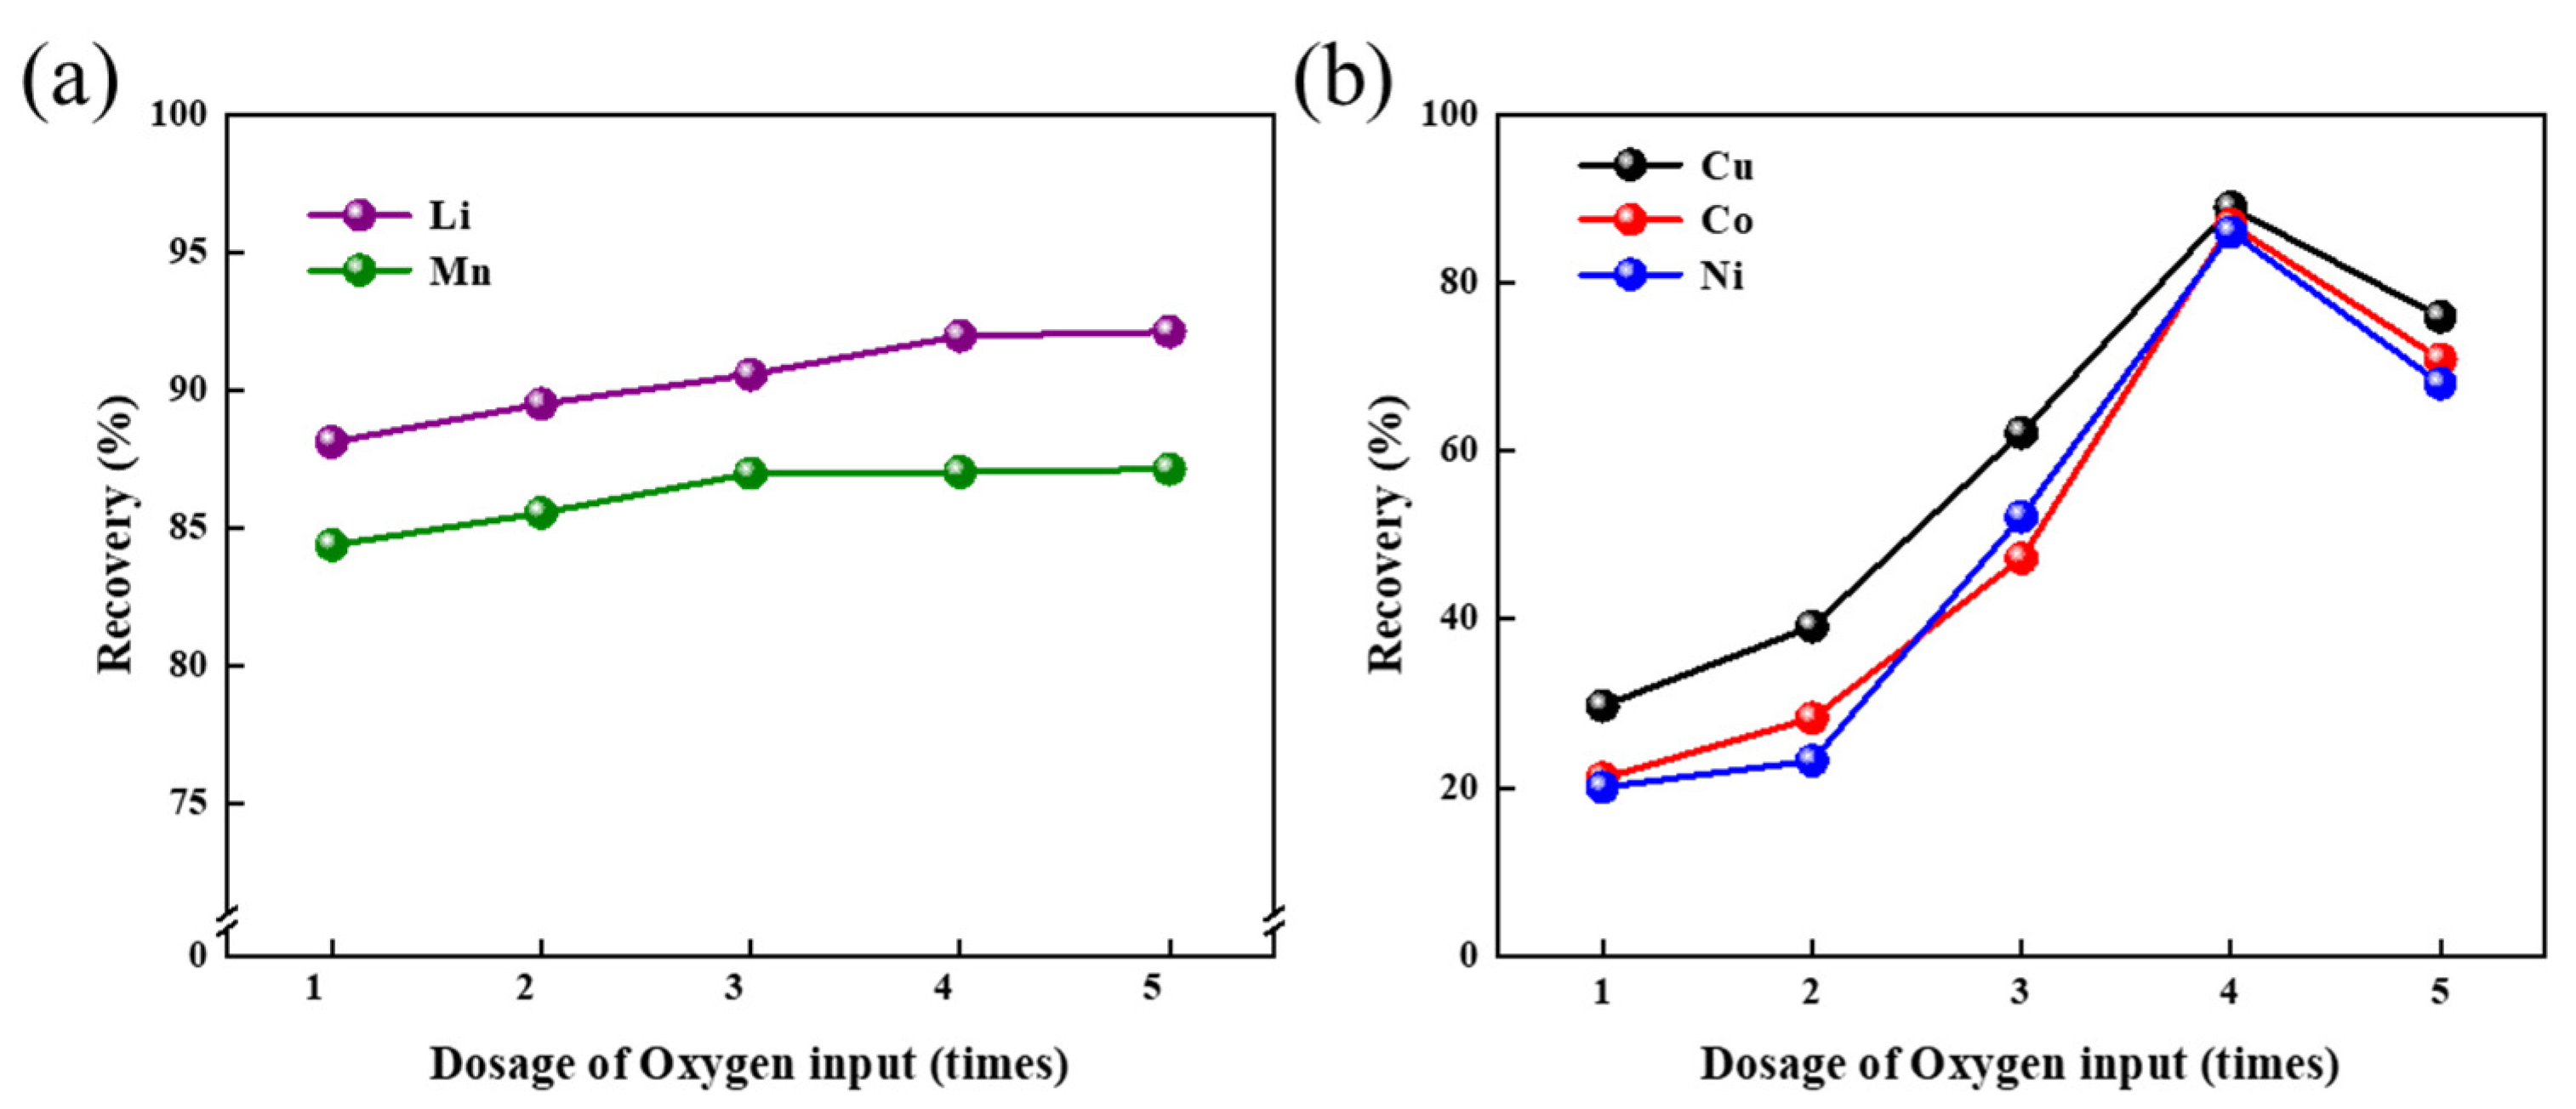
3.3.1. The Influence of Oxygen Flux on Metal Recovery

Oxygen injection is applied to oxidize excess graphite, with the theoretical oxygen requirement calculated based on the difference between the reductant content in the raw materials and the actual consumption during smelting. A series of experiments with varying oxygen flow rates were conducted to investigate its impact on element recovery. In this series of experiments, the smelting conditions adopted were the previous optimal ones (the dosage of CaCl2 fixed at 2.5 times the theoretical amount, the smelting temperature set at 1450 °C, smelting duration time set at 120 min).
Figure 8a illustrates the effect of oxygen supply on the volatilization rates of Li and Mn in the fume. As the oxygen input increased from the theoretical value to five times the theoretical value, the volatilization rate of Li rose modestly from 88.1% to 92.1%, while Mn volatilization increased slightly from 84.4% to 87.1%. This indicates that oxygen injection had minimal impact on the volatilization of Li and Mn. Figure 8b depicts the influence of oxygen supply on the recovery rates of Cu, Co, and Ni in the alloy. When oxygen input increased from the theoretical value to four times the theoretical value, the recovery rates of Cu, Co, and Ni surged significantly: Cu from 29.7% to 88.9%, Co from 21.1% to 86.9%, and Ni from 20.1% to 86.0%. However, further increasing oxygen to five times the theoretical value caused marked declines: Cu recovery dropped by 13%, Co by 16%, and Ni by 18%. The reactivity of Ni and Co is similar, and both are more reactive than Cu, making them more prone to oxidation. Therefore, when there is just excess oxygen, the recovery rates of Ni and Co decrease more significantly than that of Cu. These results suggest that an oxygen supply of approximately four times the theoretical value optimally consumes excess graphite carbon. Beyond this threshold, the reducing atmosphere weakens, leading to partial oxidation of the alloy and reduced recovery efficiency. Thus, the optimal oxygen input was determined to be four times the theoretical value.

3.3.2. Characterization of the Smelting Products

Under the optimized smelting conditions and oxygen flow rate, multiple repeated validation experiments were conducted using actual spent LIBs. The content of target elements (Li, Mn, Cu, Co, Ni) in the dust, alloy, and slag were analyzed to calculate their distribution rates across these products. The average values from multiple experimental groups are summarized in Table 3; Figure 9 shows the macroscopic morphology of the samples in the verification experiment.
The distribution rates reveal that Li and Mn predominantly migrated to the fume via chlorination volatilization, while Cu, Co, and Ni were reduced and concentrated in the alloy. Although residual amounts of the target elements were present in the slag, their contents in the slag did not exceed 0.5%. Subsequently, the slag underwent harmless treatment, while the fume and alloy—as primary products—were subjected to further separation and reuse of their valuable metals. The overall recovery rates of the elements were thus calculated as the sum of their recoveries in the fume and alloy. The final results indicated that the comprehensive recovery rates of Li, Mn, Cu, Co and Ni were 94.1%, 93.5%, 97.6%, 94.4% and 96.4%, respectively.
Further SEM-EDS analysis was conducted on the alloy product from the verification experiment to investigate the distribution of Cu, Co, and Ni elements, with the results shown in Figure 10a. The microstructural morphology revealed two distinct regions in the alloy: Cu was predominantly concentrated in the light-colored regions, while Co and Ni were mainly distributed in the dark-colored regions. The alloy exhibited a dual-phase structure comprising a copper-dominated matrix and a nickel–cobalt alloy phase, which may facilitate subsequent Cu separation.
Figure 10b presents the XRD analysis results of the flue dust, which indicate that the flue dust primarily contains LiCl and MnCl2 phases. The absence of CuCl2, CoCl2, and NiCl2 phases in the XRD analysis could be attributed to their low content. The XRD phase analysis of the smelting slag is shown in Figure 10c. The slag was predominantly composed of dicalcium silicate (Ca2SiO4), gehlenite (Ca2Al2SiO7), calcium aluminum silicate (CaAl4Si2O11), and calcium silicoaluminate chloride (Ca11Si3AlO18Cl). To ensure effective volatilization of Li and Mn elements, excessive CaCl2 was employed in this study, resulting in residual Cl in the slag that primarily formed the Ca11Si3AlO18Cl phase.
Figure 11 is a summary of a mass balance flow chart for the entire process. The smelting slag undergoes alkaline leaching to separate Li, leveraging the difference in solubility between LiOH and Mn(OH)2. The alloy can be treated with dilute sulfuric acid leaching to isolate Cu, as Cu remains insoluble in dilute acid while Ni and Co dissolve. Following the detoxification treatment, the processed smelting slag can be repurposed as construction material.

3.3.3. Mechanism Analysis of the Smelting Process

A synchronous thermal analyzer was used to analyze the samples. Heating was performed from room temperature to 1200 °C at a rate of 10 °C/min under a N2 protective atmosphere. Analyses were conducted on the cathode materials, cathode materials + CaCl2, cathode materials + C, and cathode materials + CaCl2 + C. The materials were mixed according to the optimal ratios determined from conditional experiments. The detection results are shown in Figure 12.
Figure 12a: TG-DSC curve of the cathode materials. This figure shows that this material exhibited no significant weight change during heating from 30 °C to 1000 °C. However, it began to show a trend of weight loss beyond 1000 °C. The DSC curve indicates no obvious endothermic or exothermic peaks within the tested temperature range, suggesting that the cathode materials themselves did not decompose at this stage.
Figure 12b: TG-DSC curve of cathode materials + CaCl2. After adding CaCl2, the TG curve showed significant weight loss starting around 30 °C and continuing to approximately 200 °C, with a weight loss rate of 5.2%. This is attributed to calcium chloride’s hygroscopic nature; water adsorbed within the material was released during heating, causing the weight loss. The period from 100 °C to 150 °C represents the stage of fastest weight loss, reflected by the steepest slope on the TG curve. Correspondingly, the DSC curve exhibits a distinct endothermic peak near 144.4 °C, confirming that the water within the material had evaporated, an endothermic process. Subsequently, there was a weight plateau stage from about 200 °C to 650 °C, where the sample weight remained stable. No significant endothermic or exothermic peaks were observed on the DSC curve during this stage, indicating relative stability of the sample. When the temperature continued to rise near 650 °C, the sample weight began to decrease significantly. Continuous weight loss occurred from 650 °C to 1100 °C, with a total weight loss rate of 37.6%. The corresponding DSC curve shows an endothermic peak near 644.1 °C. It is inferred that CaCl2 promotes the decomposition of the cathode materials, lowering its decomposition temperature. Furthermore, the Li2O produced by the cathode materials’ decomposition can react with CaCl2. The consumption of decomposition products further drives the forward progress of the cathode materials’ decomposition reaction. Finally, after reaching 1100 °C, the sample’s weight loss rate decreased, and the TG curve stabilized, indicating that the reaction between the cathode materials and CaCl2 had reached an equilibrium stage.
Figure 12c: TG-DSC curve of cathode materials + C. This figure shows that during the initial heating from 30 °C to 600 °C, the TG curve indicates no significant weight loss, and the DSC curve shows no obvious endothermic or exothermic peaks, suggesting the material was relatively stable in this stage. In the temperature range of 600 °C to 1050 °C, the sample lost 40.4% of its weight. Distinct exothermic peaks appear near 608.9 °C and subsequently near 713.5 °C. While the cathode material itself does not decompose in this temperature range, the addition of C promotes its decomposition due to the progress of carbothermic reduction. The exothermic peak near 608.9 °C results from the superposition of the cathode materials’ decomposition reaction and their reduction by C. During this carbon reduction process, C is converted into CO or CO2, causing substantial weight loss. The exothermic peak near 713.5 °C might correspond to the reaction where some carbon-generated CO2 combines with Li2O (a decomposition product of the cathode materials) to form Li2CO3. However, since this stage still involves the decomposition of the cathode materials and their reduction by carbon, the overall weight trend remains downward. When the temperature exceeded 1050 °C, the sample weight stabilized, indicating that the decomposition and reduction reactions of the cathode materials had reached an equilibrium state.
Figure 12d: TG-DSC curve of cathode materials + CaCl2 + C. This figure shows that the TG curve exhibits a 4.6% weight loss during heating from 30 °C to around 200 °C. Similarly, this is caused by the dehydration of hygroscopic materials like calcium chloride during heating. Again, the period from 100 °C to 150 °C represents the stage of fastest weight loss within this dehydration process. The corresponding DSC curve shows a distinct endothermic peak near 146.9 °C, confirming the evaporation of water within the material. Similarly, during the subsequent heating stage from 200 °C to 600 °C, the sample weight showed no significant change, and the corresponding DSC curve displayed no obvious endothermic or exothermic peaks, indicating sample stability in this stage. When the temperature continued to rise near 600 °C, the sample weight began to decrease significantly. Continuous weight loss occurred from 600 °C to 1150 °C, with a total weight loss rate of 41.6%. The DSC curve shows an exothermic peak near 567.8 °C. It can be inferred that this exothermic peak represents the superposition of the peaks observed near 600 °C in the tests for cathode materials + CaCl2 and cathode materials + C. Since the exothermic peak in Figure 12c occurs slightly earlier than the endothermic peak in Figure 12b, it is deduced that when both carbon powder and calcium chloride are present, the carbon powder first promotes the decomposition of the cathode material. Subsequently, some decomposition products of the cathode materials are reduced by the carbon powder, while others react with CaCl2.
The cathode materials of ternary lithium-ion batteries will decompose into lithium oxides, nickel oxides, cobalt oxides and manganese oxides, etc., at high temperatures [21]. In addition, based on the thermal analysis experiments of the cathode material, the possible reactions of each recovered element during the smelting process are inferred as shown in Table 4.
Under the simultaneous presence of reducing and chlorinating agents, Li and Mn primarily undergo reactions 1–3, generating LiCl and MnCl2 that volatilize into dust. Meanwhile, nickel oxides and cobalt oxides are mainly reduced to elemental forms by reducing agents (reactions 4–7). And it forms an alloy phase together with elemental Cu.

4. Conclusions

In this study, we developed a short-flow process for the simultaneous recovery of Li, Mn, Cu, Co, and Ni from spent LIBs via a hybrid approach of reduction smelting and chloridizing volatilization. While establishing a reducing–chlorinating atmosphere, appropriate oxygen was introduced to utilize excess reductants and heat generated from plastic separator combustion as energy supply for the smelting process. The optimized conditions were determined as: smelting temperature 1450 °C, smelting duration 120 min, calcium chloride addition 2.5 times the theoretical value, and oxygen supply four times the theoretical value. Under these conditions, the comprehensive recovery rates of Li, Mn, Cu, Co and Ni were 94.1%, 93.5%, 97.6%, 94.4% and 96.4%, respectively.
The smelting products consisted of three phases: a Cu-Co-Ni alloy mainly comprising copper-based alloy and nickel-cobalt alloy phases, flue dust primarily containing LiCl and MnCl2, and slag dominated by calcium silicate and gehlenite. This method achieves simultaneous multi-element separation and recovery through a hybrid process, demonstrating particular advantages for large-scale treatment of spent LIBs.

Author Contributions

Conceptualization, W.L.; data curation, H.L.; funding acquisition, W.L.; investigation, C.W.; methodology, H.L.; resources, C.Y.; supervision, C.Y.; visualization, C.W.; writing—original draft, C.W.; writing—review and editing, W.L., C.Y. and H.L. All authors have read and agreed to the published version of the manuscript.

Funding

This work was supported by the Department of Science and Technology of Hunan Province (Grant No. 2024AQ2003) and the Central Guidance Fund for Local Science and Technology Development in Guizhou (Grant No. 2024041).

Data Availability Statement

The original contributions presented in the study are included in the article; further inquiries can be directed to the corresponding author.

Conflicts of Interest

The authors declare no conflicts of interest.

References

  1. Bresolin, B.M.; Zanoletti, A.; Bontempi, E. Recent improvements in salt-sssisted and microwave-assisted recovery methods for sustainable metal extraction from NCM cathodes in spent lithium-ion batteries: A review. Sep. Purif. Technol. 2025, 363, 131918. [Google Scholar] [CrossRef]
  2. Zhang, G.; Yuan, X.; He, Y.; Wang, H.; Zhang, T.; Xie, W. Recent advances in pretreating technology for recycling valuable metals from spent lithium-ion batteries. J. Hazard. Mater. 2020, 406, 124332. [Google Scholar] [CrossRef] [PubMed]
  3. Lan, Y.; Tan, L.; Wu, N.; Wen, J.; Yao, W.; Tang, Y.; Cheng, H.M. Current status and outlook of recycling spent lithium-ion batteries. J. Energy Storage 2025, 110, 115374. [Google Scholar] [CrossRef]
  4. Li, Y.; Lv, W.; Huang, H.; Yan, W.; Li, X.; Ning, P.; Cao, H.; Sun, Z. Recycling of spent lithium-ion batteries in view of green chemistry. Green Chem. 2021, 23, 6139–6171. [Google Scholar] [CrossRef]
  5. Liu, C.; Lin, J.; Cao, H.; Zhang, Y.; Sun, Z. Recycling of spent lithium-ion batteries in view of lithium recovery: A critical review. J. Clean. Prod. 2019, 228, 801–813. [Google Scholar] [CrossRef]
  6. Zhao, S.; Quan, J.; Wang, T.; Song, D.; Huang, J.; He, W.; Li, G. Unveiling the recycling characteristics and trends of spent lithium-ion battery: A scientometric study. Environ. Sci. Pollut. Res. 2021, 29, 9448–9461. [Google Scholar] [CrossRef]
  7. Shi, G.C.; Cheng, J.; Wang, J.; Zhang, S.H.; Shao, X.X.; Chen, X.H.; Li, X.; Xin, B.P. A comprehensive review of full recycling and utilization of cathode and anode as well as electrolyte from spent lithium-ion batteries. J. Energy Storage 2023, 72, 108486. [Google Scholar] [CrossRef]
  8. Shi, H.; Zhang, J.; Ou, L. A comprehensive review on the separation and purification of valuable metals from the leachate of spent lithium-ion batteries. Sep. Purif. Technol. 2025, 360, 130847. [Google Scholar] [CrossRef]
  9. Liu, Y.; Zhang, X.; Ma, W.; Duan, H.; Zhao, Q.; Liang, Z. A comprehensive review of the recovery of spent lithium-ion batteries with molten salt method: Progress, shortcomings and prospects. J. Energy Storage 2024, 99, 113407. [Google Scholar] [CrossRef]
  10. Fei, Z.T.; Su, Y.Y.; Meng, Q.; Dong, P.; Zhang, Y.J. Direct regeneration of spent cathode materials by deep eutectic solvent. Energy Storage Mater. 2023, 60, 102833. [Google Scholar] [CrossRef]
  11. Ma, J.; Wang, J.X.; Jia, K.; Liang, Z.; Ji, G.J.; Zhuang, Z.F.; Zhou, G.M.; Cheng, H.M. Adaptable Eutectic Salt for the Direct Recycling of Highly Degraded Layer Cathodes. J. Am. Chem. Soc. 2022, 144, 20306–20314. [Google Scholar] [CrossRef]
  12. Li, J.; Zhang, H.; Wang, H.; Zhang, B. Research progress on bioleaching recovery technology of spent lithium-ion batteries. Environ. Res. 2023, 238, 117145. [Google Scholar] [CrossRef] [PubMed]
  13. Yun, S.; Hwang, G. Iron removal and valuable metal recovery from spent lithium-ion batteries (LIBs) using solvent extraction after bioleaching. J. Ind. Eng. Chem. 2025, 144, 672–678. [Google Scholar] [CrossRef]
  14. Wang, J.; Wang, H.; Zhang, G.; Ma, X.; Liu, Y.; Hao, J.; Xie, W.; He, Y. A review of research progress on combined pyro-hydrometallurgical technology for spent lithium-ion batteries. Chem. Eng. J. 2025, 505, 159403. [Google Scholar] [CrossRef]
  15. Hu, X.F.; Mousa, E.; Tian, Y.; Ye, G.Z. Recovery of Co, Ni, Mn, and Li from Li-ion batteries by smelting reduction Part I: A laboratory-scale study. J. Power Sources 2021, 483, 228936. [Google Scholar] [CrossRef]
  16. Zhang, X.; Xie, Y.; Lin, X.; Li, H.; Cao, H. An overview on the processes and technologies for recycling cathodic active materials from spent lithium-ion batteries. J. Mater. Cycles Waste Manag. 2013, 15, 420–430. [Google Scholar] [CrossRef]
  17. Rinne, M.; Lappalainen, H.; Lundström, M. Evaluating the possibilities and limitations of the pyrometallurgical recycling of waste Li-ion batteries using simulation and life cycle assessment. Green Chem. 2025, 27, 2522–2537. [Google Scholar] [CrossRef]
  18. Van Hoof, G.; Robertz, B.; Verrecht, B. Towards Sustainable Battery Recycling: A Carbon Footprint Comparison between Pyrometallurgical and Hydrometallurgical Battery Recycling Flowsheets. Metals 2023, 13, 1915. [Google Scholar] [CrossRef]
  19. Rajaeifar, M.A.; Raugei, M.; Steubing, B.; Hartwell, A.; Anderson, P.A.; Heidrich, O. Life cycle assessment of lithium-ion battery recycling using pyrometallurgical technologies. J. Ind. Ecol. 2021, 25, 1560–1571. [Google Scholar] [CrossRef]
  20. Zhou, T.; Lin, K.; Wu, Y.; Qin, B.; Zhu, J.; Huang, Z.; Xu, Z.; Ruan, J. From spent lithium-ion batteries to functional materials: A review. Resour. Conserv. Recycl. 2024, 209, 107772. [Google Scholar] [CrossRef]
  21. Yoon, W.S.; Hanson, J.; McBreen, J.; Yang, X.Q. A study on the newly observed intermediate structures during the thermal decomposition of nickel-based layered cathode materials using time-resolved XRD. Electrochem. Commun. 2006, 8, 859–862. [Google Scholar] [CrossRef]
Figure 1. Schematic diagram of the tube furnace.
Metals 15 00732 g001
Figure 2. Schematic diagram of the induction furnace.
Metals 15 00732 g002
Figure 3. Li-Mn-Cl-O and Cu-Co-Ni-Cl-O reaction dominant phase diagram superposition diagram: (a) 1400 °C; (b) 1500 °C. (the black lines represent Cu-Co-Ni-Cl-O reaction dominant phase diagram; the orange lines represent Li-Mn-Cl-O reaction dominant phase diagram; the green box represents LiCl(g) + MnCl2(g) phase).
Metals 15 00732 g003
Figure 4. Phase diagram of CaO-SiO2-Al2O3 slag system: (a) 1400 °C; (b) 1500 °C; (c) CaO-SiO2-10 wt.% Al2O3 slag phase diagram; (d) change in viscosity of CaO-SiO2-Al2O3 slag system with temperature. (the red dotted lines in figure (a,b) indicates that the content of Al2O3 is 10 wt.%; the orange box represents the liquid phase zone of the slag).
Metals 15 00732 g004
Figure 5. Variation in recovery of valuable elements in smelting products with the dosage of CaCl2 (1500 °C, 120 min): (a) dust from aluminothermic reduction; (b) alloy from aluminothermic reduction; (c) dust from carbon thermal reduction; (d) alloy from carbon thermal reduction.
Metals 15 00732 g005
Figure 6. Variation in recovery of valuable elements in smelting products with the melting temperature (2.5× CaCl2, 120 min): (a) dust from aluminothermic reduction; (b) alloy from aluminothermic reduction; (c) dust from carbon thermal reduction; (d) alloy from carbon thermal reduction.
Metals 15 00732 g006
Figure 7. Variation in recovery of valuable elements in smelting products with the melting time (2.5× CaCl2, 1450 °C): (a) dust from aluminothermic reduction; (b) alloy from aluminothermic reduction; (c) dust from carbon thermal reduction; (d) alloy from carbon thermal reduction.
Metals 15 00732 g007
Figure 8. Variation in recovery of valuable elements in smelting products with the oxygen flux (2.5× CaCl2, 1450 °C, 120 min): (a) dust; (b) alloy.
Metals 15 00732 g008
Figure 9. The macroscopic appearance of the experimental verification samples: (a) the initial states of alloy and slag; (b) the separation of alloy and slag.
Metals 15 00732 g009
Figure 10. (a) Microstructure of molten alloy products; (b) XRD phase analysis of smelting dust; (c) XRD phase analysis of smelting slag.
Metals 15 00732 g010
Figure 11. Mass balance flow chart. (the arrows indicate the direction of materials or processes; the dash lines represent the processing ideas envisioned for the product).
Metals 15 00732 g011
Figure 12. TG-DSC curve (a) cathode materials; (b) cathode materials and chlorinating agents; (c) cathode materials and reducing agents; (d) cathode materials, chlorinating agents and reducing agents. (the black line represents the TG curve and the red line represents the DSC curve).
Metals 15 00732 g012
Table 1. Results of ICP-OES detection of NCM111/wt.%.
NiCoMnLi
20.120.218.77.8
Table 2. Results of ICP-OES detection of metals elements in spent LIBs/wt.%.
NiCuMnCoAlLi
13.88.27.75.45.23.4
Table 3. The material balance of the verification experiment.
SampleElementGrade/%Distribution Rates/%
DustLi3.294.1
Mn6.888.3
Cu0.67.3
Co0.35.6
Ni1.18.0
AlloyLiNDND
Mn1.34.6
Cu27.189.9
Co17.588.1
Ni44.788.1
SlagLi0.25.9
Mn0.56.5
Cu0.22.4
Co0.35.6
Ni0.53.6
Table 4. Reaction and Gibbs free energy.
ReactionGibbs Free Energy (kJ/mol)No.
Li2O + CaCl2 = 2LiCl(g) + CaO Δ G = 366.55 0.32 T 1
MnO2 + CaCl2 + C = MnCl2(g) + CO(g) + CaO Δ G = 308.10 0.36 T 2
3MnO2 + 3CaCl2 + 2Al = 3MnCl2(g) + Al2O3 + 3CaO Δ G = 420.21 0.51 T 3
NiO + C = Ni + CO(g) Δ G = 129.20 0.18 T 4
3NiO + 2Al = 3Ni + Al2O3 Δ G = 956.91 + 0.03 T 5
Co3O4 + 4C = 3Co + 4CO(g) Δ G = 477.12 0.75 T 6
3Co3O4 + 8Al = 9Co + 4Al2O3 Δ G = 3946.70 + 0.08 T 7
Disclaimer/Publisher’s Note: The statements, opinions and data contained in all publications are solely those of the individual author(s) and contributor(s) and not of MDPI and/or the editor(s). MDPI and/or the editor(s) disclaim responsibility for any injury to people or property resulting from any ideas, methods, instructions or products referred to in the content.

