Article

Density Functional Theory-Based Study of UC2 and Cr-Doped UO2

by
Barbara Szpunar
1,*,
Jayangani I. Ranasinghe
1 and
Jerzy A. Szpunar
2
1
Department of Physics and Engineering Physics, University of Saskatchewan, Saskatoon, SK S7N 5E2, Canada
2
Department of Mechanical Engineering, University of Saskatchewan, Saskatoon, SK S7N 5A9, Canada
*
Author to whom correspondence should be addressed.
Metals 2025, 15(7), 727; https://doi.org/10.3390/met15070727
Submission received: 30 May 2025 / Revised: 22 June 2025 / Accepted: 25 June 2025 / Published: 29 June 2025

Abstract

A density functional theory-based study of UC2 and Cr-doped UO2 using the phono3py and VASP computational simulation packages is presented. Furthermore, the temperature-dependent thermal conductivities are compared to the traditional urania fuel. Doping of urania with Cr allows for improved fission gas retention, reducing the fission gas release and lowering the oxidation rate of UO2. The thermal conductivity calculated using the random alloy method with one U atom replaced by Cr in a supercell (CrU31O64) shows a slight decrease; however, this may be compensated for by larger grain sizes in the presence of Cr. The reduction of thermal conductivity for the 0.61 wt.% Cr substation in urania is presented. Investigated here, the UC2 metallic high-temperature fcc phase looks promising due to additional electronic contribution to conductivity. Furthermore, we found that the temperature-dependent phonon-assisted thermal conductivities for UC2 and UO2 are very similar. The elastic properties of UC2 were also evaluated and compared with UO2. The presented analysis provides information for further improvement of the design of nuclear fuels.

1. Introduction

Urania (UO2) has been the dominant nuclear fuel in commercial light water reactors (LWR) over the past 50 years. Despite its success, one limiting factor for improving burn-up is the fission product release during the irradiation [1,2,3]. Especially the gaseous fission products, such as Kr and Xe, with very low solubility, accumulate along the grain boundaries causing fuel swelling. This ultimately stimulates fuel cracking and premature fuel degradation [2,4,5,6]. One of the proposed solutions is doped fuels (e.g., ADOPTTM fuel [7]), which incorporate small amounts of dopants, such as Cr and Cr2O3, during the fabrication [8,9,10,11,12]. It is known that these modified fuels have coarser grains than pure UO2, and this allows for enhancing the fission product retention and suppressing the fuel swelling [9,12,13,14,15].
Most often, Cr-doped UO2 is produced by sintering a mixture of raw Cr2O3 and UO2 powders under a controlled process at elevated temperatures [4,13]. As reported in the literature, depending on the sintering temperature and other fabrication conditions, a couple of options exist. In some cases, the sintered fuel may contain dissolved Cr metallic particles, in another cases it forms a solid solution with UO2. In some other cases, Cr is distributed along the grain boundaries of the fuel [16].
In addition, precipitates of chromium oxides such as Cr2O3 and CrO [17] within the fuel matrix have been observed [12,13,18]. Various studies analyzed properties in Cr-doped UO2 fuels in relation to the preparation methodologies [9,13], microstructural behaviour [13,14], dissolution mechanism [10,11], and oxidation of chromium [18]. There are numerous experimental and computational records on the structural, chemical, electronic, mechanical, and thermal properties of Cr2O3-doped UO2 fuels in the literature [10,11,15]. However, there are inconclusive, conflicting results regarding the thermal conductivity of such Cr-modified fuels, and such information is crucial for the safe operation of the reactor; therefore, any enhancement of such critical property will be required for future reactors.
Alternatively, metallic ceramic fuels are of special interest as their thermal conductivity remains high even at very high temperatures due to significant electronic heat transport. They are important because urania fuel, which is used in conventional nuclear reactors, is not the optimum choice for some designs of new-generation reactors due to its low thermal conductivity [19].
ADOPTTM fuel [7] is considered as an evolutionary solution, while metallic, high-density fuel like UN is a revolutionary future solution due to its much higher thermal conductivity [20]. UC2 metallic fuel is of interest since it has a similar crystal structure as UO2 and a high melting temperature (2720 K), which is attributed to high carbon-metal bonds [21]. Although UC2 has a lower uranium density than UC, it can potentially be considered for advanced fuel fabrication once the stoichiometric instability issue is resolved. Density functional theory (DFT)-based calculations become a more and more common methodology to evaluate the mechanical and thermal conductivity of novel fuel materials. The DFT calculations for bcc UC2 confirmed its metallic character; however, they predicted a slightly lower bulk modulus (180.5 GPa) [22] than the experiment (216 GPa) [23]. It is expected that the high-temperature phase of UC2 is fcc, but it has not been investigated theoretically.
Here, we unveil the impact of Cr on the thermal conductivity of Cr-doped UO2 (i.e., CrU31O64). It is of interest to compare fcc UC2 with UO2 since they have the same (cubic, Fm 3 ¯ m symmetry) structure. The thermal conductivities and mechanical properties will be also investigated.

2. Methodology

The Vienna DFT simulation package VASP was employed in the simulation [24]. We assumed electronic configurations of 5f3, 6d1, 7s2 for U, 2s2, and 2p4 for O and 2s2 and 2p2 for C atoms. The exchange–correlation functionals were selected within the generalized gradient approximations as parameterized by Perdew et al. [25]. It is established that, with the exception of the band gap, DFT describes very well the physical properties of UO2. Optical properties are not investigated here, but for completeness, we used the simplified (rotationally invariant) approach to the DFT + U, introduced by Dudarev et al. [26] and implemented in VASP as option 2. The elastic properties and equilibrium lattice constants are compared with and without HU correction equal to 3.5 eV, since it reproduced the experimental band gap in UO2 [27]. All the presented results for the VASP calculations are obtained using a plane-wave cut-off energy of 500 eV and a supercell of 2 × 2 × 2 with 96 atoms. In the supercells of UO2, there are 32 uranium and 64 oxygen atoms; in the case of CrO2, the doping there is substituted for U atoms.
The norm-conserved pseudopotentials were used for evaluation of electronic thermal conductivity of UC2 a with the functional for solids developed for GGA of the Perdew, Burke, and Ernzerhof functional developed for solids (PBEsol) [28], as implemented in Quantum Espresso code [29] with a kinetic energy cutoff of 120 Ry for wave functions.

2.1. Elastic Constants

The elastic constants were evaluated using the Elastic code [30] (Release v5.1.0-14-g6596fd4) with a command option and adapted for a high-performance batch submission script. This code is generalized to non-cubic systems.

2.2. Lattice Assisted Thermal Conductivity

We used the random alloy method [31,32] to model CrU31O64 by randomly replacing a uranium atom in the UO2 supercell with chromium and then solving the corresponding BTE for that particular system using the phono3py [33] simulation package to evaluate lattice assisted thermal conductivity. In the random alloy method, one of the uranium atoms in the (2 × 2 × 2) supercell was randomly displaced with a Cr atom, and the thermal conductivity was evaluated for the new crystal structure U31CrO64 utilizing the phono3py code [33]. The respective fine meshes with the sizes of [ 20 ,   20 ,   20 ] and [ 5 ,   5 ,   5 ] were used in the calculation of pure UO2 and U31CrO64. We need to note here that the calculation of pure UO2 with phono3py considers the symmetry along the primitive axis (0 1/2 1/2, 1/2 0 1/2, 1/2 1/2 0) to reduce the computational cost. In Figure 1 the results are presented for the grid of meshes from 4 to 20 (red triangles) for pa = half. There is also the option “auto” with smaller primitive cells, but as indicated in Figure 1 by black circles, the results were not very reliable, although they converge to a similar value for [ 20 ,   20 ,   20 ]   m e s h . For the calculations for 96 atoms without symmetry (U31CrO64), we had to use a reduced mesh. To eliminate a systematic error from the usage of reduced mesh to investigate the effect of Cr we performed calculation for a full cell of 96 atoms of UO2 with the mesh [ 5 ,   5 ,   5 ] and compared it with the results for [ 4 ,   4 ,   4 ] mesh in Figure 1 as indicated by the solid dark blue line.

2.3. Electronic Thermal Conductivity

The electronic contribution to the thermal conductivities (κe) of metallic UC2 was calculated using the Wiedemann–Franz law [34] and the electrical conductivities (σ) are evaluated here using the BolzTrap2 code [35]:
κ e = π 3 k B e 2 σ T
Using the EPW code [36,37] we determined that the scattering rate is increasing linearly with temperature (dsR/dT = 1.23373 × 10¹¹ s−1K−1) for the selected 6,7 bands within the kBT energy range for predominantly 5f electrons around Fermi Energy. The absolute value of the electrons’ relaxation time at 850 K temperature (τ850 = 3.734 × 10⁻¹⁵ s) was evaluated using non-magnetic thermal electronic conductivity (κe) calculated at a temperature of 850 K from the BoltzTrap2 code (in relaxation time units: 5.72918 × 10+15 Wm−1K−1 s−1) and obtained (κe) from solving the Boltzmann transport equation (BTE) using the EPW code (21.39 Wm−1K−1) at the same temperature. The derived correlation for the electrons’ relaxation time (τT) as a function of temperature is in the form:
τ T = τ 800 1 + ( T 850 ) d s R / d T 1 = 2.67814 × 10 14 + ( T - 850 ) 1.23373 × 10 11 1
We selected a temperature of 850 K since it was not dependant on the selected fsthick parameter in the present calculations. In contrast to previous EPW calculations [36], we were not able to select a stable range for the fsthick value for all temperatures, therefore we present here only the electronic thermal conductivity calculated using Ziman’s formula for metals (Equation (54) in [37]), which is implemented in the EPW code with a number of carriers evaluated to coincide with the electrical resistivity at 850 K, as evaluated via the EPW BTE solver.
The EPW code was developed as a module using the Quantum Espresso (QE) code [29]. Similarly to previous calculations for UN [36], we used norm-conserving pseudopotentials and generalized gradient approximation (GGA) of the Perdew, Burke, and Ernzerhof functional developed for solids (PBEsol)18 [28], as implemented in QE.

2.4. Total Thermal Conductivity

The total thermal conductivity is calculated as a sum of the electronic thermal conductivity obtained using the BoltzTrap2 code with the relaxation time defined by Equation (2) and extrapolated to higher temperatures lattice conductivity calculated using phono3py [33]. Similarly to the calculation of resistivity using Zimann’s formula, as implemented in the EPW code, phono3py outputs results only up to 1000 K, therefore we used the trend lines to extrapolate values to higher temperatures.

3. Results

3.1. Initial Ground State Structures

Stoichiometric UO2 crystallizes in a cubic structure (space group F m 3 ¯ m ) containing one uranium and two oxygen atoms in the unit cell. We study here fcc UC2 high-temperature phase with the same cubic structure and primitive unit cell (Figure 2a). The optimized lattice parameter using the VASP code of UO2 is 0.537 nm, which is only slightly lower than the reported experimental (see Table 1) and theoretical values [38,39,40]. The larger equilibrium lattice constants were found in the present QE calculations (0.5496 nm) are in good agreement with the experiment. The lattice constants of UC2 (0.538 nm) evaluated here are very close to those reported previously [41], as shown in Table 1.
In Figure 2b, the supercell of Cr-doped UO2 (i.e., CrU31O64) and the optimized cubic lattice constants are slightly smaller, as expected (0.536 nm).
In Table 1, the equilibrium lattice constants, elastic constants, and mechanical moduli of UO2 and UC2 are listed and compared with experimental data, where available. The calculations were performed using a GGA functional, with the exception of those listed in the second column, the respective quantities (shown in the bracket) with a GGA + HU correction of 3.5 eV are included for UO2.
While the C11 and C12 elastic constants are in good agreement with experiment values, C44 is over predicted (82.9 GPa and 82.2 GPa with HU correction versus 59.7 GPa) for UO2. The calculated lattice constants are comparable for UO2 and UC2, but C44 is predicted to be much higher (145.8 GPa versus 82.9 (82.2) GPa) for UC2 than for UO2. This is probably due to the high affinity of 2p2 electrons of the carbon atoms with strong anisotropy, since the polycrystalline aggregate of bulk modulus (B), Young modulus (Y), and shear modulus (G) in the Voigt approach are comparable. As shown in Table 1, UC2 is predicted to be more brittle according to Cottrell’s prediction for cubic metal and alloy crystals that indicates intrinsic brittleness occurs when G/B > 0.5 and ductility when G/B < 0.4. While the lattice constant of UO2 agrees slightly better with the experiment with the HU (3.5 eV) correction included, 0.537 nm (0.5457 nm) versus 0.54582 nm, the bulk modulus is slightly underpredicted for the latest (208.8 GPa (192.6 GPa) versus 208.9 GPa. The effect of HU correction is insignificant; therefore, we omit it in further calculations as it also requires higher computational resources.
The phonon density of states (DOS) is one of the fundamental concepts used to investigate the dynamic stability of a crystalline structure. Hence first, we evaluated the phDOS of UO2 (solid black line) along the high symmetry path of the first Brillouin zone using phono3py code, which is shown in Figure 3. As shown in the figure, all the phonon vibrations have positive frequencies, indicating the dynamical stability of the considered structure. Additionally, the phonon DOS of UO2 is experimentally and theoretically well-established in the literature, and our predicted phonon DOS compares well with the available data [42,43]. Figure 3 also provides the phDOS for the CrU31O64 structure (short-dashed grey line) which was created by replacing one of the uranium atoms with chromium via the random alloy method. The dot-dashed red line in the figure represents the phDOS for pure Cr with the equilibrium lattice constant of 0.283 nm. The addition of Cr is predominantly visible in the PhDOS of CrU31O64 in additional states in the gap with frequencies higher than 200–250 c m 1 .
In Figure 4 the total phDOS is marked for UC2 by the red line. The partial phDOS of U is indicated by a dark blue long-dashed line, while for the C atom it is marked by a short-dashed black line. Since C atoms have a lower mass than U atoms, they mainly contribute to high-frequency optical phonons, while the acoustic phonons’ contribution is predominantly from the U atoms. We confirm the stability of fcc UC2 as there are no negative frequencies observed.

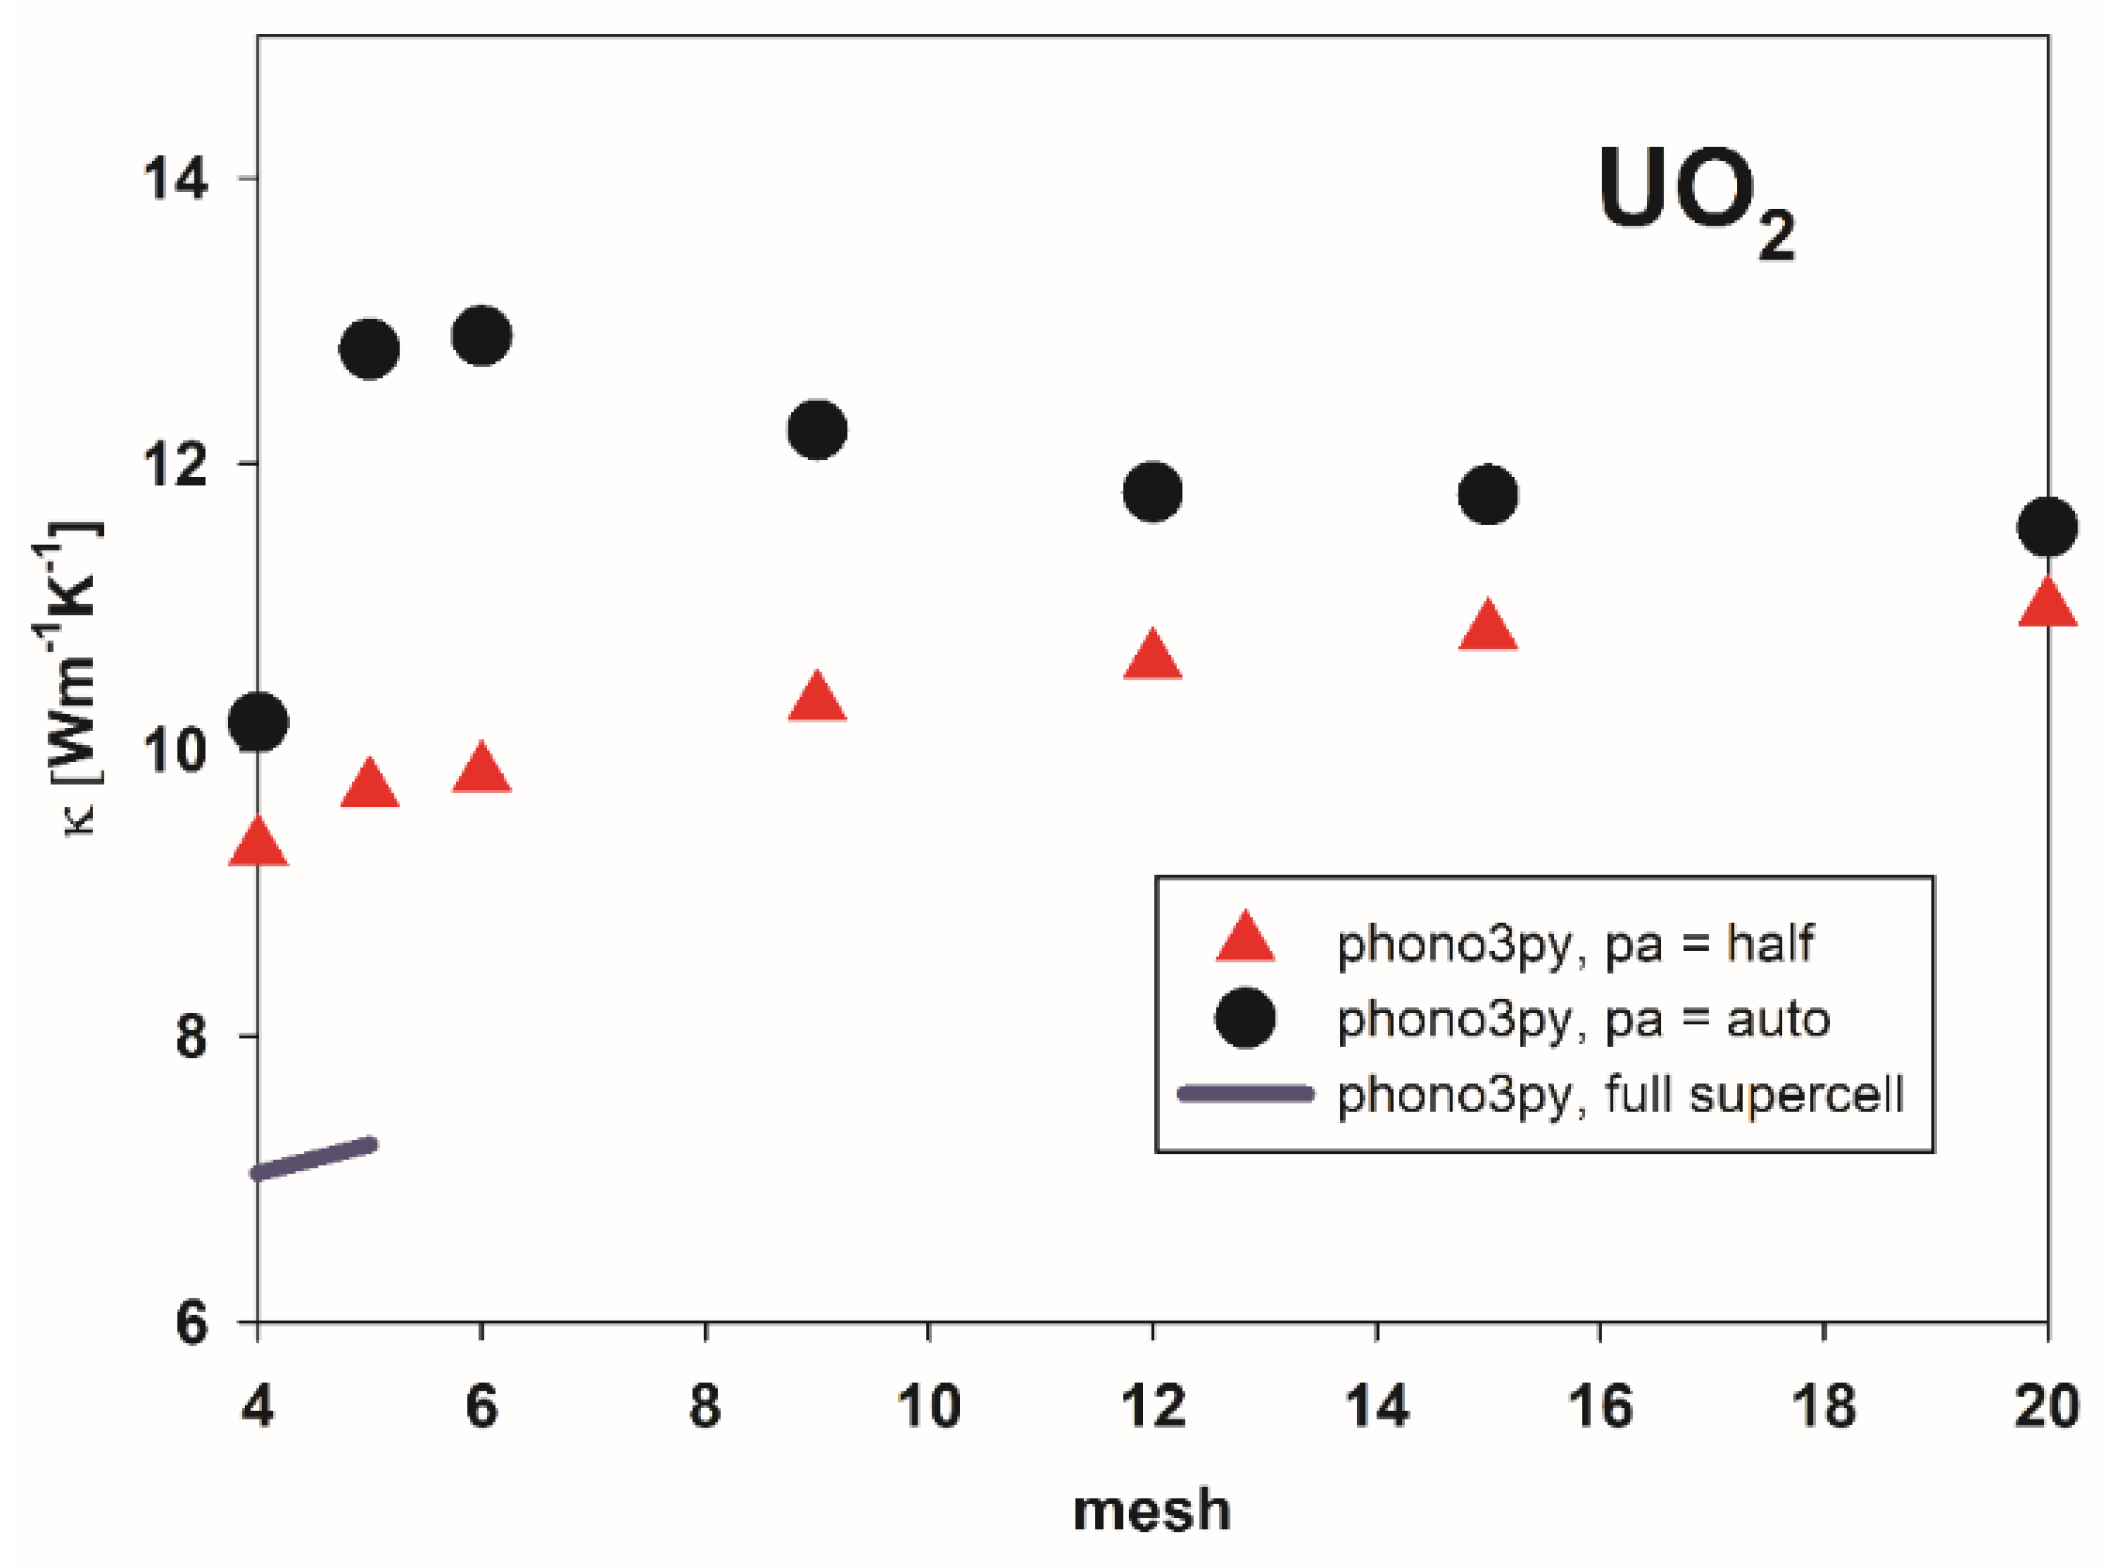
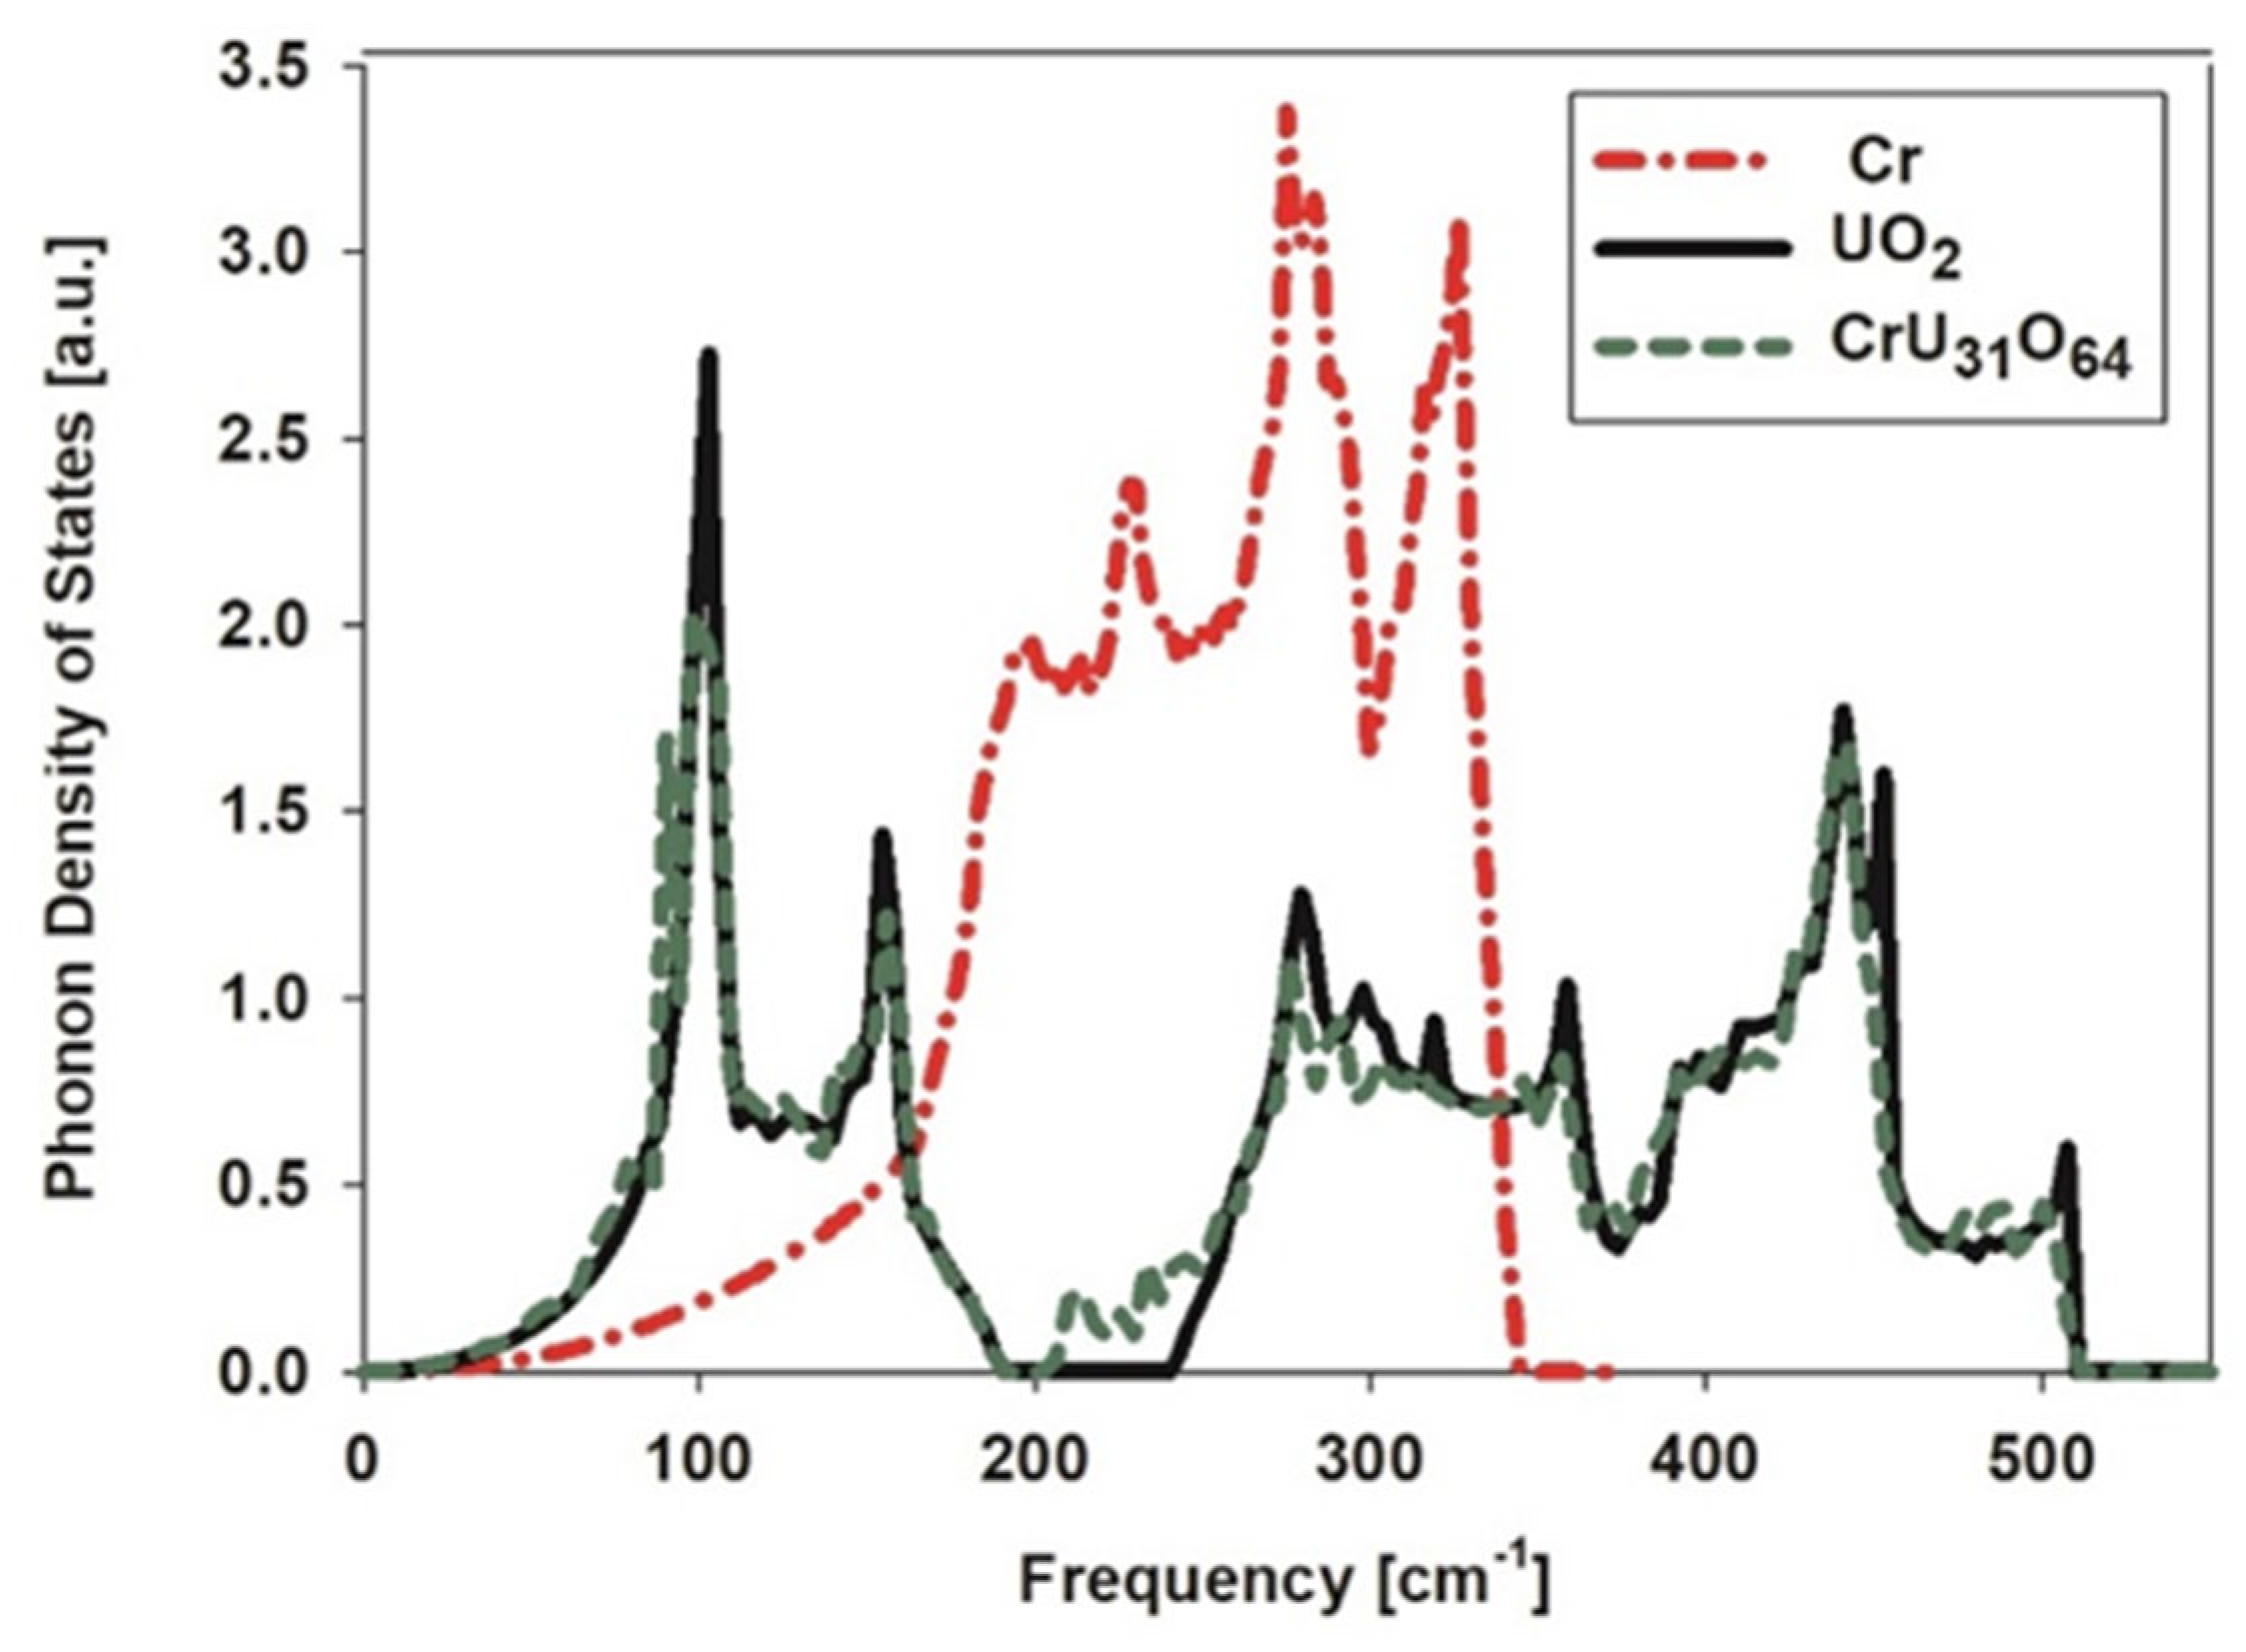
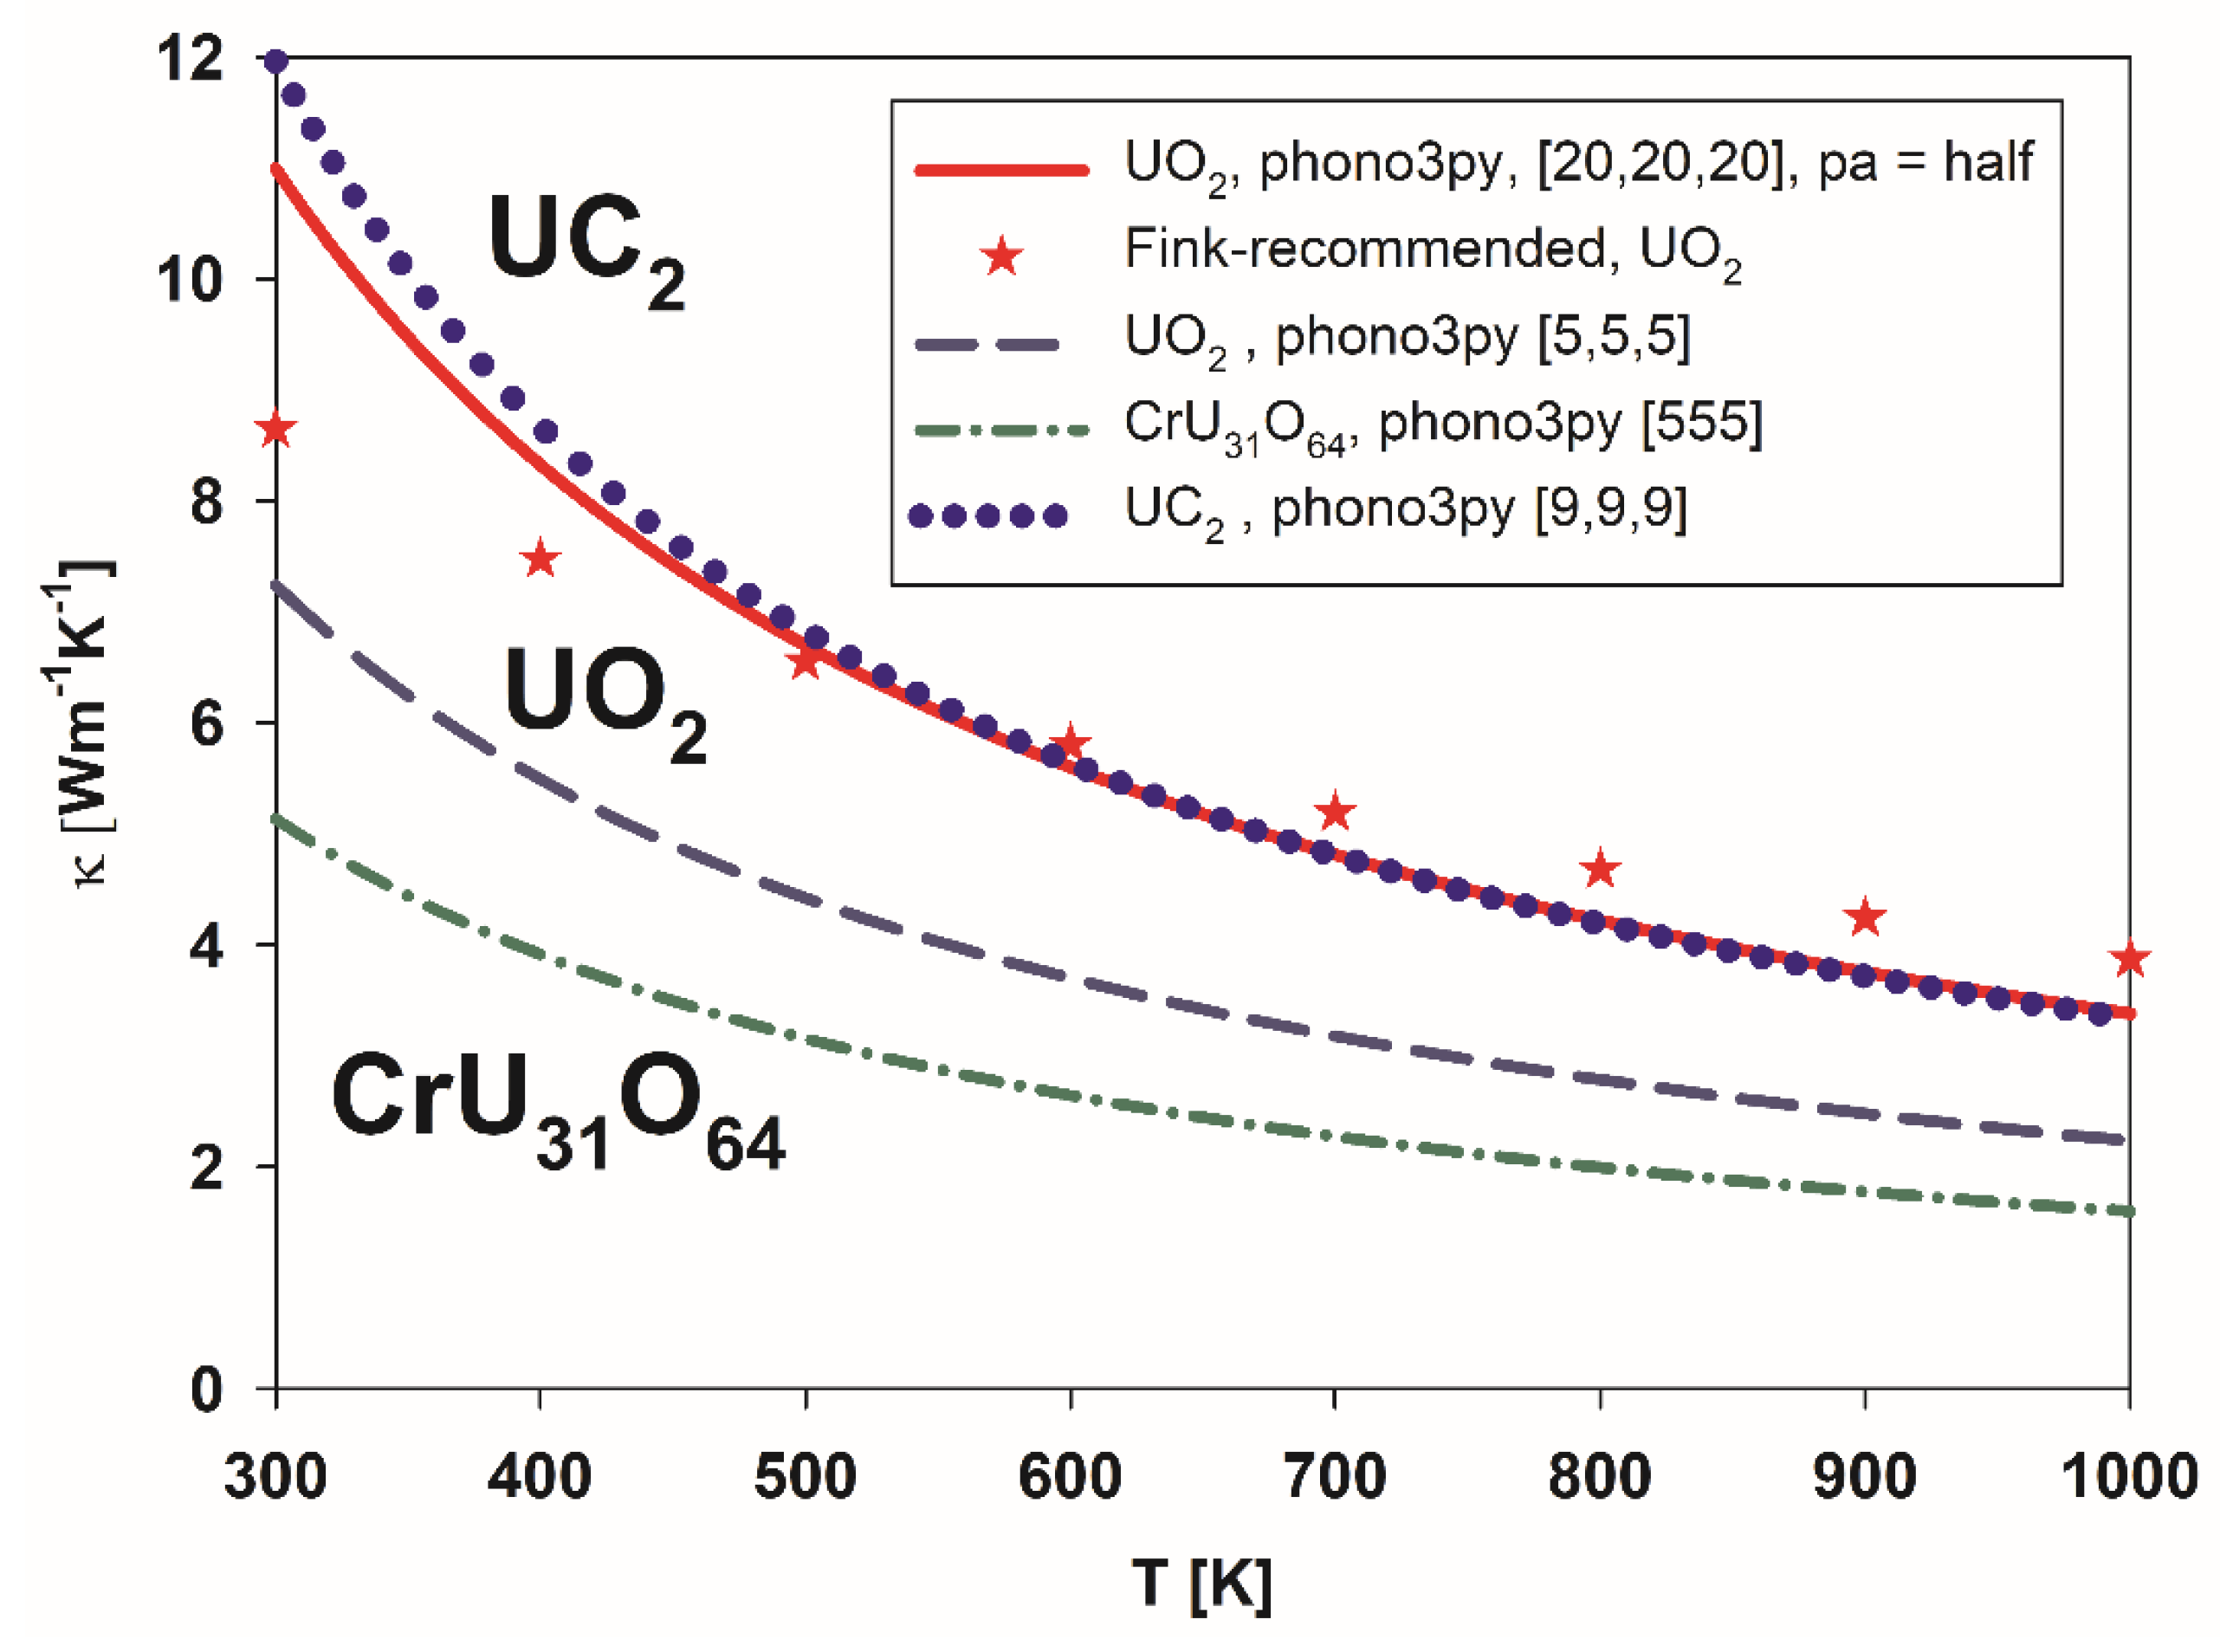
3.2. Thermal Conductivity of Pure UO2 and U1-xCrxO2

First, the temperature dependence of the lattice thermal conductivities of UO2 over temperatures from 300 to 1000 K is evaluated with the highest accuracy [20, 20, 20] mesh; pa = half, as discussed in Section 2.2. The solid red line in Figure 5 represents the temperature-dependent lattice thermal conductivity of UO2 estimated here, employing the phono3py simulation packages versus experiments shown by the red stars and recommended values by Fink et al. [44]. As discussed in Section 2.2 to reduce the systematic error in the evaluation of Cr doping, we performed additional calculations using less dense mesh [5, 5, 5] for the UO2 supercell with 96 atoms. It can be seen from Figure 5 that the thermal conductivity of pure UO2 (indicated by a long-dashed dark blue line) decreases when the Cr atom is added, as shown by the dot-dashed green line for the conductivity of CrU31O64. However, all lines fit the form ( a + b T ) 1 , where a and b are temperature-independent constants.
As shown in Figure 5, the thermal conductivity of Cr-doped UO2 corresponds to the 0.61 wt.%Cr random alloy method calculations using the phono3py simulation package. The weight percentage of chromium ( w t . % C r ) is calculated as the percentage of the ratio of the total weight of Cr atoms to the sum of the total atomic weight of the unit cell, as given by Equation (3).
  w t . % C r = M C r × x M U × ( 1 x ) + M C r × x + 2 M O %    
where M C r = 51.991 , M U = 238.029 , and M O = 31.998 represent the atomic masses of chromium, uranium, and oxygen in atomic mass units, respectively. The drop in thermal conductivity with Cr doping does not support the experimentally observed increase of thermal conductivity by Camarano et al. [45]. The thermal conductivities at 300 K of Cr2O3 doped UO2 from Camarano et al.’s experiments increased from 7.16–7.60 W.m−1K−1 for 1% wt% Cr2O3 doping to from 7.86–8.27 W.m−1K−1 at 2%. This discrepancy may be attributed to the microstructural conditions of the samples, which critically affect the experimentally measured thermal conductivity. We believe the increase may result from an increase in the grain size, as was observed for ADOPTTM fuel, while here our calculations are for the single crystal. Additionally, there is a strong dependence of the κph of UO2 on stoichiometry deviation, which may have been reduced during doping [45]. Our conclusions, however, agree with recent, extensive investigations [46] that we found during the final publication of our work. Additionally, lower thermal conductivity was confirmed for 5000 ppm Cr–UO2 [47] in earlier publications.
The calculated lattice thermal conductivity of UC2 shown by the dotted blue line in Figure 5 resembles that of UO2.

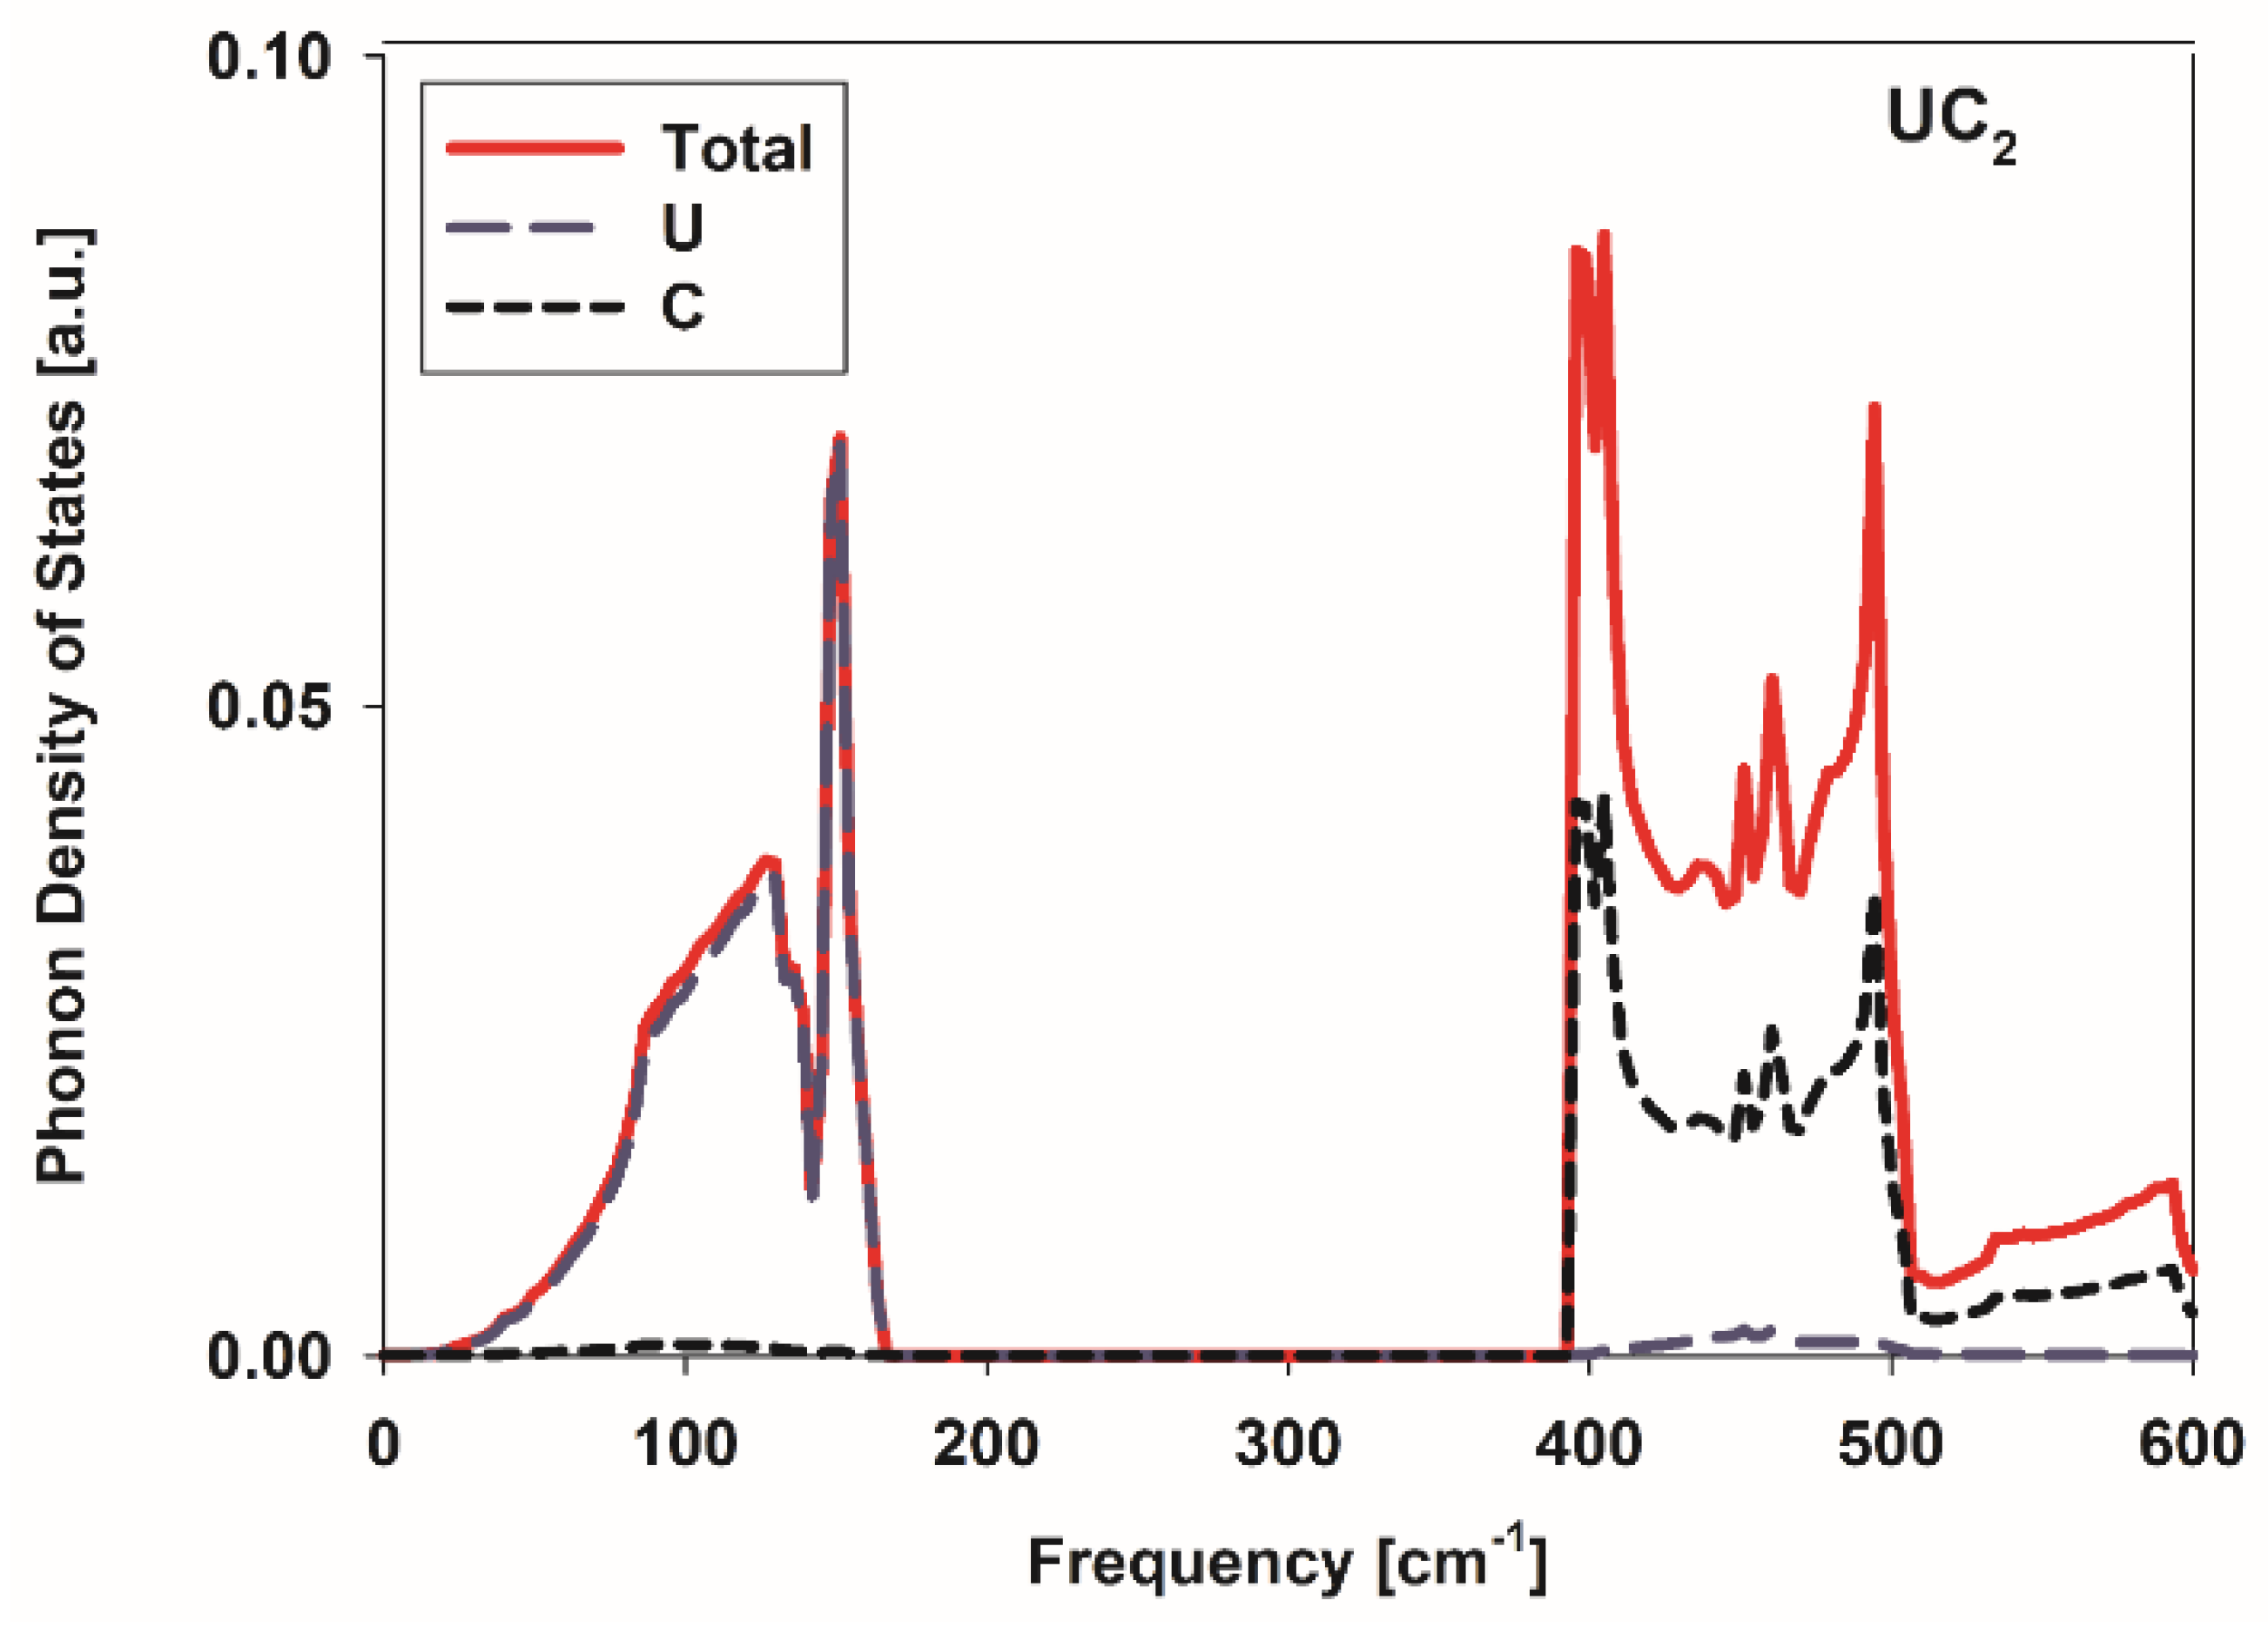
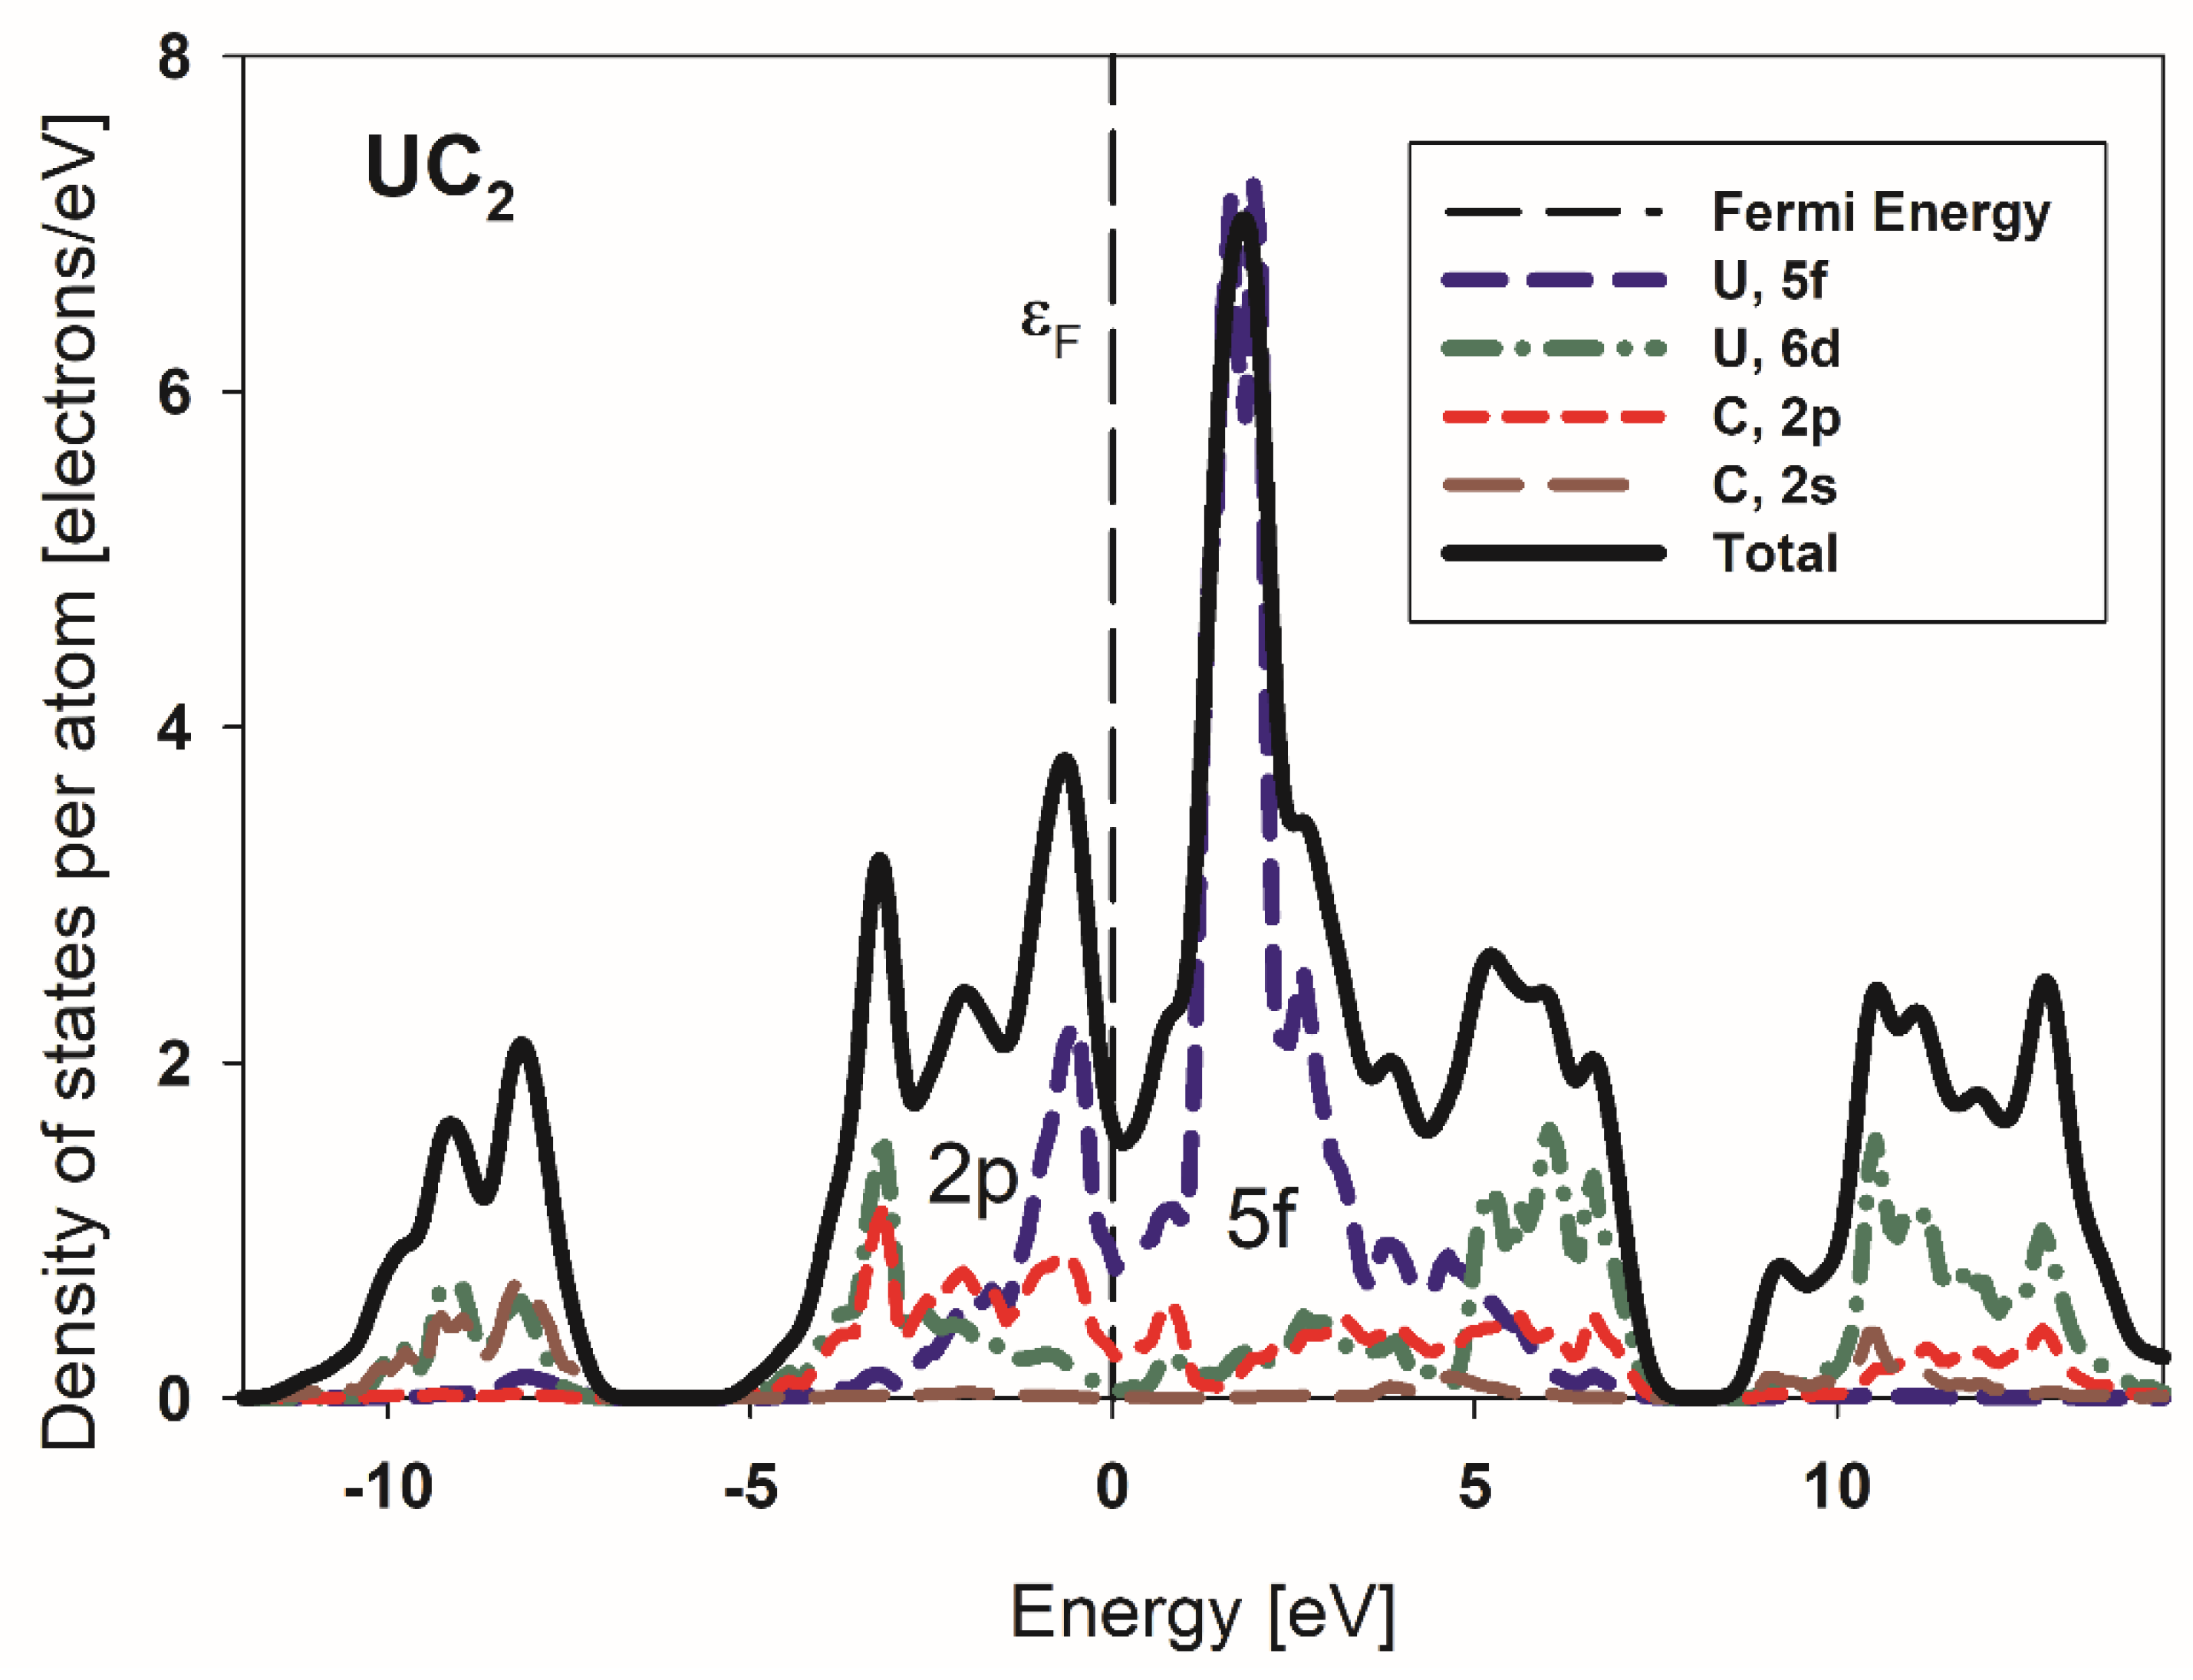
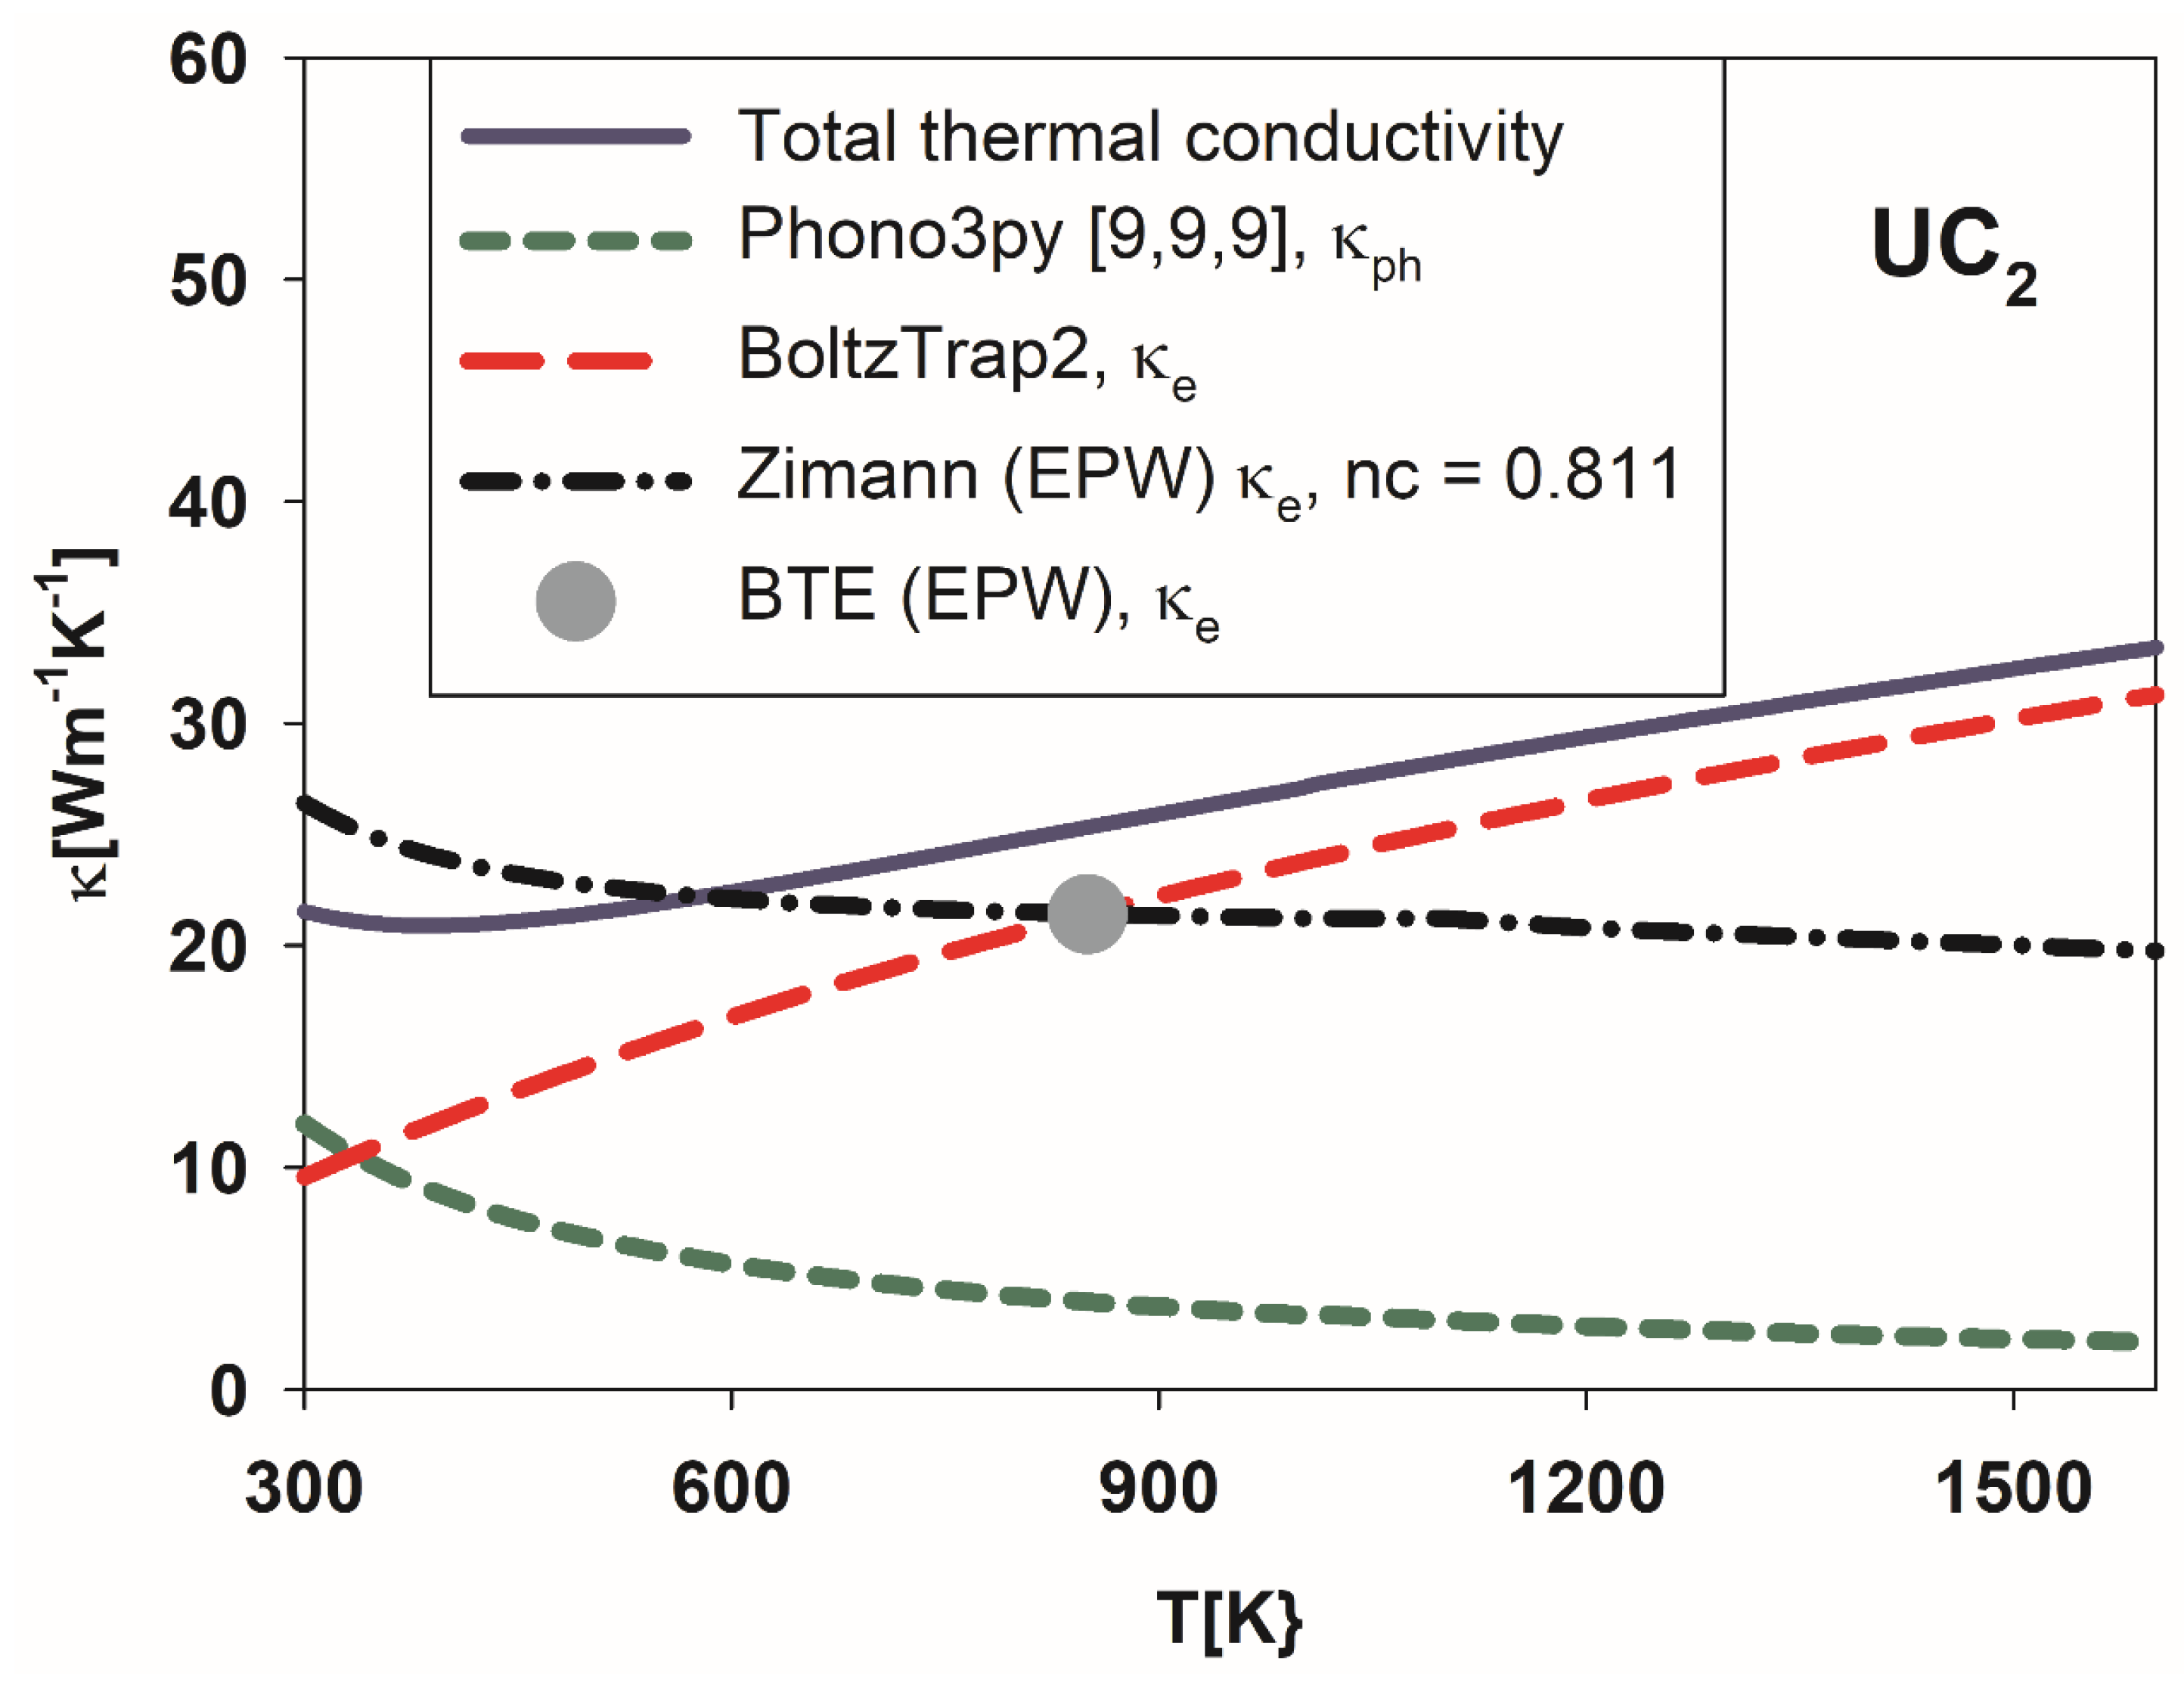
3.3. Conductivity of Metallic UC2

In contrast to UO2, UC2 is metallic as shown in Figure 6. The total density of states per formula unit is indicated by a black solid line. The projected density of states of the 5f electrons (indicated by a dashed blue line) was too low around the Fermi energy to lead to a stable magnetic ordering. There is a significant contribution from the 2p electrons of the C atoms, with high affinity (two 2p electrons in shell) around the Fermi energy, as indicated by the short-dashed line.
Using the EPW code with BTE solver and the Wiedemann–Franz law represented by Equation (1), we evaluated the electronic thermal conductivity of UC2 at 850 K, as indicated by the grey circle in Figure 7. Using this value, we were able to evaluate a number of carriers (nc = 0.811) that can be an input parameter to Ziman’s formula for metals in the EPW code and obtained electronic thermal conductivity, as shown by black dot-dashed line.
Furthermore, as described in Section 2.3 we used the electron’s relaxation time derived here (Equation (2)) to calculate electrical conductivity using the BoltzTrap2 code and xml main output file from VASP. The electronic thermal conductivity of UC2 was obtained next using Equation (1) and is shown in Figure 7 by a long-dashed red line. We do not show the EPW results for the other temperatures, since there was some noise observed that was dependent on the fsthick parameter value. The fsthick parameter used here is equal to 3 eV and also leads to coinciding values calculated by the EPW code and denoted by a dashed red line: κe for 300 K and 500 K. In Figure 7, we reproduced from Figure 5 the lattice-assisted thermal conductivity (short-dashed green line) as calculated using VASP and phono3py and extrapolated from 1000 K to 1600 K. The total thermal conductivity of UC2 is calculated as a sum of κe, marked by a long-dashed red line, and κph (short-dashed green line) and is shown as a solid dark blue line. When comparing the obtained total thermal conductivity of UC2 with the thermal conductivity of UO2 (Figure 5) we note significant enhancement due to the electronic (κe) contribution.

4. Discussion

The thermal conductivity of Cr-doped UO2 was investigated using the random alloy method to check the effect of doping, as described in the methodology section. However, the computational cost for the random alloy method is very demanding because it requires several hundreds of displaced supercells to assess the harmonic and anharmonic scatterings. Therefore, the random alloy method is employed only for 0.61 wt.%Cr (i.e., for CrU31O64) and the results are compared in Figure 5 with pure UO2 for the same mesh [5, 5, 5] to reduce the systematic error due to computational limitations.
The agreement of the phono3py predictions for stoichiometric urania with the values from the literature [44] (red star) is fair. The observed deviation at the high-temperature region could be due to the consideration of the polaron term in Fink’s recommendation.
Interestingly the calculated κph for UC2 is very similar to that of UO2, as shown in Figure 5.
Our calculations predict that doping urania with Cr does not enhance the total thermal conductivity in a single crystal, but the total thermal conductivity in UC2 is significantly enhanced by electronic contribution (κe), evaluated here using various methods in the EPW and BoltzTrap2 codes. However, our calculations may over-predict κe due to the limitation of DFT usage for strongly correlated systems with 5f electrons on U atoms, as was observed for UN previously.

5. Conclusions

The effect of Cr additives on the thermal conductivity of urania was investigated. The results show that, at any temperature, the thermal conductivity decreases with the Cr dopant in the fuel, as modelled for a single crystal. However, this decrease is not that significant at higher temperatures, where κph is already very low.
Interestingly, although we found the κph of UO2 and UC2 to be very similar, the total thermal conductivity of UC2 is much higher due to the electronic contribution, which additionally increases with temperature. Therefore, we conclude that metallic fuel will be much safer and more economical, as higher thermal conductivity also reduces thermal strain and increases the longevity of the fuel.

Author Contributions

Conceptualization, B.S.; methodology, B.S.; software, B.S.; validation, B.S.; formal analysis, B.S.; investigation, B.S.; resources, B.S.; data curation, B.S.; writing—original draft preparation, B.S. and J.I.R.; writing—review and editing, B.S., J.I.R., and J.A.S.; visualization, B.S.; supervision, B.S. and J.A.S.; project administration, B.S. and J.A.S.; and funding acquisition, B.S. and J.A.S. All authors have read and agreed to the published version of the manuscript.

Funding

This work was supported by a Discovery grant from the National Sciences and Engineering Research Council of Canada (B. Szpunar) and by grant FC 2019-9 from the Sylvia Fedoruk Canadian Centre for Nuclear Innovation, Inc. (J.A. Szpunar).

Data Availability Statement

The original contributions presented in this study are included in the article. Further inquiries can be directed to the corresponding author.

Acknowledgments

The authors acknowledge the access to high-performance supercomputers at Alliance Canada (CalculQuebec, WestGrid, and SHARCNET) and the University of Saskatchewan (Plato). Further, their technical support (especially by Ali Kerrache) is acknowledged. Free access to the phonopy, almaBTE, and phono3py codes is highly appreciated. The authors also acknowledge the constructive e-mail discussion with Jesus Carrete and Atsushi Togo.

Conflicts of Interest

The authors declare no conflict of interest.

References

  1. Ray, L.F.; Thiele, H.; Matzke, H. Transmission electron microscopy study of fission product behaviour in high burnup UO2. J. Nucl. Mater. 1992, 188, 90–95. [Google Scholar] [CrossRef]
  2. Tucker, M.O.; White, R.J. The release of unstable fission products from UO2 during irradiation. J. Nucl. Mater. 1979, 87, 1–10. [Google Scholar] [CrossRef]
  3. Sato, I.; Onishi, T.; Tanaka, K.; Iwasaki, M.J. Influence of boron vapor on transport behavior of deposited CsI during heating test simulating a BWR severe accident condition. Nucl. Mater. 2015, 461, 22–28. [Google Scholar] [CrossRef]
  4. Milena-Pérez, A.; Bonales, L.J.; Gómez-Mancebo, M.B.; Galán, H. Oxidation of accident tolerant fuels models based on Cr-doped UO2 for the safety of nuclear storage facilities. Nucl. Mater. 2023, 582, 13–19. [Google Scholar] [CrossRef]
  5. Olander, D.R. Fundamental Aspects of Nuclear Reactor Fuel Elements (TID-26711-P1); California University: Berkeley, CA, USA, 1976. [Google Scholar]
  6. Lyons, M.F.; Boyle, R.F.; Davies, J.H.; Hazel, V.E.; Rowland, T.C. UO2 properties affecting performance. Nucl. Eng. Des. 1972, 21, 167–199. [Google Scholar] [CrossRef]
  7. IAEA. Advanced Fuel Pellet Materials and Designs for Water Cooled Reactors/TECDOC-1416. In Proceedings of the Technical Committee Meeting, Brussels, Belgium, 4 June 2004. [Google Scholar]
  8. Singh, G.P.; Ram, S.; Eckert, J.J. Mechanical behaviour of metallic glasses related to thermal properties. Phys. Conf. Ser. 2009, 144, 012088. [Google Scholar]
  9. Cordara, T.; Cordara, T.; Smith, H.; Mohun, R.; Gardner, L.J.; Stennett, M.C.; Hyatt, N.C.; Corkhill, C.L. Hot Isostatic Pressing (HIP): A novel method to prepare Cr-doped UO2 nuclear fuel. MRS Adv. 2020, 5, 45–53. [Google Scholar] [CrossRef]
  10. Leenaers, A.; De Tollenaere, L.; Van den Berghe, S.J. On the solubility of chromium sesquioxide in uranium dioxide fuel. Nucl. Mater. 2003, 317, 62–68. [Google Scholar] [CrossRef]
  11. Hong, M. Role of electronic effects on the incorporation of Cr at a Σ5 grain boundary in UO2. Comput. Mater. Sci. 2013, 78, 29–33. [Google Scholar]
  12. Peres, V.; Favergeo, L.; Andrieu, M.; Palussière, J.C.; Balland, J.; Delafoy, C.; Pijolat, M. High emperatura chromium volatilization from Cr2O3 powder and Cr2O3-doped UO2 pellets in reducing atmospheres. J. Nucl. Mater. 2012, 423, 93–101. [Google Scholar] [CrossRef]
  13. Kegler, P.; Klinkenberg, M.; Bukaemskiy, A.; Murphy, G.L.; Deissmann, G.; Brandt, F.; Bosbach, D. Chromium Doped UO2-Based Ceramics: Synthesis and Characterization of Model Materials for Modern Nuclear Fuels. Materials 2021, 14, 6160. [Google Scholar] [CrossRef]
  14. Cardinaels, T.; Govers, K.; Vos, B.; Van den Berghe, S.; Verwerft, M.; De Tollenaere, L.; Maier, G.; Delafoy, C. Chromia doped UO2 fuel: Investigation of the lattice parameter. J Nucl Mater. 2012, 424, 252–260. [Google Scholar] [CrossRef]
  15. Killeen, J.C. Fission gas release and swelling in UO2 doped with Cr2O3. J. Nucl. Mater. 1980, 88, 177–184. [Google Scholar] [CrossRef]
  16. Middleburgh, S.C.; Dumbill, S.; Qaisar, A.; Vatter, I.; Owen, M.; Vallely, S.; Goddard, D.; Eaves, D. Enrichment of Chromium at Grain Boundaries in Chromia Doped UO2. J. Nucl. Mater. 2023, 575, 154250. [Google Scholar] [CrossRef]
  17. Riglet-Martial, C.J. Thermodynamics of chromium in UO2 fuel: A solubility model. Nucl. Mater. 2014, 447, 63–72. [Google Scholar] [CrossRef]
  18. Murphy, G.L.; Gericke, R.; Gilson, S.; Bazarkina, E.F.; Rossberg, A.; Kaden, P.; Thümmler, R.; Klinkenberg, M.; Henkes, M.; Kegler, P.; et al. Deconvoluting Cr states in Cr-doped UO2 nuclear fuels via bulk and single crystal spectroscopic studies. Nat. Commun. 2023, 14, 2455. [Google Scholar] [CrossRef]
  19. Pioro, I.L.; Khan, M.; Hopps, V.; Jacobs, C.S.C.W. Pressure-Channel Nuclear Reactor Some Design Features. J. Power Energy Syst. 2008, 2, 874–888. [Google Scholar] [CrossRef]
  20. Nuclear Science. State-of-the Art Report on Light Water Reactor Accident-Tolerant Fuels (OECD 2018); NEA No. 7317; OECD Publishing: Paris, France, 2018; p. 367. [Google Scholar]
  21. Vasudevamurthy, G.; Nelson, A.T. Uranium carbide properties for advanced fuel modeling-A review. J. Nucl. Mater. 2022, 558, 153145. [Google Scholar] [CrossRef]
  22. Shia, H.; Zhang, P.; Lib, S.-S.; Wangd, B.; Suna, B.J. First-principles study of UC2 and U2C3. Nucl. Mater. 2010, 396, 218–222. [Google Scholar] [CrossRef]
  23. Dancausse, J.-P.; Heathman, S.; Benedict, U.; Gerward, L.; Olsen, J.S.; Hulliger, F. Effect of N, C and B interstitial atoms on local bonding structure in mechanically activated TiH2/h-BN, TiH2/C, and TiH2/B mixtures. J. Alloys Compd. 1993, 191, 309–312. [Google Scholar] [CrossRef]
  24. Hafner, J. Ab-initio simulations of materials using VASP: Density-functional theory and beyond. Sol. Stat. Chem. 2008, 29, 2044–2078. [Google Scholar]
  25. Perdew, J.P.; Burke, K.; Ernzerhof, M. Generalized Gradient Approximation Made Simple. Phys. Rev. Lett. 1996, 77, 3865–3868, Erratum in Phys. Rev. Lett. 1997, 78, 1396. [Google Scholar] [CrossRef] [PubMed]
  26. Dudarev, S.L.; Botton, G.A.; Savrasov, S.Y.; Humphreys, C.J.; Sutton, A.P. Electron-energy-loss spectra and the structural stability of nickel oxide: An LSDA+U study. Phys. Rev. B 1998, 57, 1505–1509. [Google Scholar] [CrossRef]
  27. Szpunar, B.; Szpunar, J.A. Application of density functional theory in assessing properties of thoria and recycled fuels. Nucl. Mater. 2013, 439, 243–250. [Google Scholar] [CrossRef]
  28. Perdew, J.P.; Ruzsinszky, A.; Csonka, G.I.; Vydrov, O.A.; Scuseria, G.E.; Constantin, L.A.; Zhou, X.; Burke, K. Restoring the Density-Gradient Expansion for Exchange in Solids and Surfaces. Phys. Rev. Lett. 2008, 100, 136406, Erratum in Phys. Rev. Lett. 2009, 102, 039902. [Google Scholar] [CrossRef]
  29. Giannozzi, P.; Baroni, S.; Bonini, N.; Calandra, M.; Car, R.; Cavazzoni, C.; Ceresoli, D.; Chiarotti, G.L.; Cococcioni, M.; Dabo, I.; et al. QUANTUM ESPRESSO: A modular and open-source software project for quantum simulations of materials. J. Phys. Condens. Matter 2009, 21, 395502–395521. [Google Scholar] [CrossRef] [PubMed]
  30. Jochym, T.; Parlinski, K. Ab Initio Lattice Dynamics and Elastic Constants of ZrC. Europ. Phys. J. B15 2000, 2, 265–268. [Google Scholar] [CrossRef]
  31. Arrigoni, M.; Carrete, J.; Mingo, N.; Madsen, G.K.H. First-principles quantitative prediction of the lattice thermal conductivity in random semiconductor alloys: The role of force-constant disorder. Phys. Rev. B 2018, 98, 115205. [Google Scholar] [CrossRef]
  32. Carruthers, P. Theory of Thermal Conductivity of Solids at Low Temperatures. Rev. Mod. Phys. 1961, 33, 93–138. [Google Scholar] [CrossRef]
  33. Togo, A.; Chaput, L.; Tadano, T.; Tanaka, I.; Conclusion, X.; Introduction, I. Implementation strategies in phonopy and phono3py. J. Phys. Condens. Matter 2023, 35, 353001. [Google Scholar] [CrossRef]
  34. Wiedemann, F.R. Ueber die Wärme-Leitungsfähigkeit der Metalle. Ann. Der Physik. 1853, 165, 497–531. (In German) [Google Scholar]
  35. Madsen, G.K.; Carrete, J.; Verstraete, M.J. BoltzTraP2, a program for interpolating band structures and calculating semi-classical transport coefficients. Comput. Phys. Commun. 2018, 231, 140–145. [Google Scholar] [CrossRef]
  36. Szpunar, B.; Ranasinghe, J.I.; Malakkal, L.; Szpunar, J.A. First principles investigation of thermal transport of uranium mononitride. Phys. Chem. Solids 2020, 146, 109636. [Google Scholar] [CrossRef]
  37. Poncé, S.; Margine, E.R.; Verdi, C.; Giustino, F. EPW: Electron–phonon coupling, transport and superconducting properties using maximally localized Wannier functions. Comput. Phys. Commun. 2016, 209, 116–133. [Google Scholar] [CrossRef]
  38. Wyckoff, R.W.G. (Ed.) Crystal Structures, 2nd ed.; John Wiley & Sons, Inc.: New York, NY, USA, 1963; Volume 2, p. 467. [Google Scholar]
  39. Fritz, I.J. Elastic properties of UO2 at high pressure. J. Appl. Phys. 1976, 47, 4353–4357. [Google Scholar] [CrossRef]
  40. Idiri, M.; Le Bihan, T.; Heathman, S.; Rebizant, J. Behavior of actinide dioxides under pressure: UO2 and ThO2. Phys. Rev. B—Condens. Matter Mater. Phys. 2004, 70, 1–8. [Google Scholar] [CrossRef]
  41. Chang, R. Trans 1829 C, CaF2. A diffusionless UC2 (cubic) to UC2 (tetragonal) transformation. Acta Crystallogr. 1961, 14, 1097. [Google Scholar] [CrossRef]
  42. Pang, J.W.L.; Chernatynskiy, A.; Larson, B.C.; Buyers, W.J.L.; Abernathy, D.L.; McClellan, K.J.; Phillpot, S.R. Phonon density of states and anharmonicity of UO2. Phys. Rev. B-Condens. Matter Mater. Phys. 2014, 89, 1–11. [Google Scholar] [CrossRef]
  43. Dolling, G.; Cowley, R.A.; Woods, A.D.B. The crystal dynamics of uranium dioxide. J. Phys. 1965, 43, 1397–1413. [Google Scholar] [CrossRef]
  44. Fink, J.K. Thermophysical properties of uranium dioxide. J. Nucl. Mater. 2000, 279, 1–18. [Google Scholar] [CrossRef]
  45. Camarano, D.D.M.; Mansur, F.A.; Meas, A.M.M.D.S. Experimental Investigations of Additives on the Thermal Conductivity UO2 Pellets; ABEN: Rio de Janeiro, Brazil, 2021; Volume 18, pp. 1–4. [Google Scholar]
  46. Terricabras, A.J.; Drewry, S.M.; Campbell, K.; Judge, E.J.; Byler, D.D.; Teti, E.S.; van Veelen, A.; Paisner, S.W.; White, J.T. Performance and properties evolution of near-term accident tolerant fuel: Cr-doped UO2. J. Nucl. Mater. 2024, 594, 10. [Google Scholar] [CrossRef]
  47. Zhong, Y.; Gao, R.; Li, B.; Yang, Z.; Huang, Q.; Wang, Z.; Duan, L.; Liu, X.; Chu, M.; Zhang, P.; et al. Preparation and Characterization of Large Grain UO2 for Accident Tolerant Fuel. Front. Mater. 2021, 8, 651074. [Google Scholar] [CrossRef]
Figure 1. The calculated thermal conductivity of a UO2 supercell (96 atoms) as a function of the grid’s number, with various options in the phono3py code implemented as indicated.
Metals 15 00727 g001
Figure 2. (a) Primitive unit cell of fcc UC2 with C atoms indicated by dark red circles and U atoms by grey circles. (b) CrU31O64 supercell with displayed U (grey sphere), O (red spheres), and Cr (dark blue spheres) atoms.
Metals 15 00727 g002
Figure 3. The phonon densities of states per 96 atoms of UO2 (solid black curve), a Cr supercell of 128 atoms (dot-dashed red line), and the total phDOS CrU31O2 (short-dashed grey line).
Metals 15 00727 g003
Figure 4. The total phDOS is shown for UC2 by the red line. The partial phDOS of the U atom is indicated by the dark blue long-dashed line, while for the C atom it is indicated by a short-dashed black line.
Metals 15 00727 g004
Figure 5. The temperature dependence of the lattice thermal conductivity of UO2, as evaluated using the phono3py simulation packages (red solid line and dark blue long-dashed line), and of CrU31O64, indicated by the dot-dashed green line. The red stars represent the recommended values as by Fink et al. (Reprinted from Ref. [44]). The dotted blue line shows the lattice thermal conductivity of UC2.
Metals 15 00727 g005
Figure 6. The calculated total (black, solid line) electron density of states of UC2 using the PBEsol functional and QE code. The projected density of states of the U atoms for the 5f electrons is indicated by a dashed blue line and a dot-dashed green line for the 6d electrons. The red dot-dashed line shows the projected 2p electron density of states of the C atom, while the long-dashed dark pink line indicates the 2s electrons.
Metals 15 00727 g006
Figure 7. The total calculated thermal conductivity of UC2 is indicated by a solid dark blue line. It is evaluated as a sum of κph, calculated here using phono3py and shown as a short-dashed green line, and κe is indicated by a long-dashed red line calculated using the BoltzTrap2 code with the electrons’ relaxation time evaluated using Equation (2). The calculated electronic thermal conductivity (κe) at 850 K using BTE solver as implemented in the EPW code is indicated by grey sphere and is extrapolated to high temperatures, as derived from Zimann’s Equation and indicated by dot-dashed black line.
Metals 15 00727 g007
Table 1. The equilibrium lattice constant and elastic constants of UO2 and UC2 are listed and compared with experimental data, where available. The shown polycrystalline aggregate of the bulk modulus (B), Young modulus (Y), and shear modulus (G) in the Voigt approach for U02 and UC2 are very similar. In the second column the respective quantities are also shown in the brackets, with an HU = 3.5 eV correction for UO2.
CompoundUO2 (HU 2.5 eV)Exp. UO2UC2Exp.: UC2
acalc [nm]0.537 (0.5457)0.54582 [38,39] (0.543 at 0 K)0.538 0.541 [41]
B [GPa]208.8 (192.6)208.9198.7
C11 [GPa]400.9 (369.0)389.3267.5
C12 [GPa]112.7 (104.5)118.7164.3
C44 [GPa]82.9 (82.2)59.7145.8
G [GPa]107.4 (102.2) 108.12
Y [GPa]275.0 (260.5) 274.6
G/B0.51 (0.53) 0.54
Disclaimer/Publisher’s Note: The statements, opinions and data contained in all publications are solely those of the individual author(s) and contributor(s) and not of MDPI and/or the editor(s). MDPI and/or the editor(s) disclaim responsibility for any injury to people or property resulting from any ideas, methods, instructions or products referred to in the content.

