Article

Hot Deformation Behavior, Processing Maps, and Microstructure Evolution of 7E97 Alloy

1
State Key Laboratory of Materials Low-Carbon Recycling, Beijing University of Technology, Beijing 100124, China
2
Weiqiao Lightweight Research Center at Soochow, Suzhou 215001, China
*
Author to whom correspondence should be addressed.
Metals 2025, 15(7), 725; https://doi.org/10.3390/met15070725
Submission received: 5 June 2025 / Revised: 25 June 2025 / Accepted: 27 June 2025 / Published: 28 June 2025

Abstract

A hot compression simulation was conducted on the Al-7.62Zn-2.22Mg-0.90Cu-0.30Mn-0.09Er-0.13Zr alloy (7E97) within the temperature range of 300~460 °C and strain rate range of 0.001~10 s−1 using a Gleeble-3500 hot simulator. A flow-stress constitutive equation and hot processing maps were established for the alloy, and the microstructural evolution of the alloy after hot deformation was investigated. It was found that the dominant dynamic softening mechanism of the alloy was dynamic recovery, accompanied by minor dynamic recrystallization. The optimal hot processing window for the alloy was determined to be in the ranges of 0.001~0.05 s−1 and 350~410 °C.

1. Introduction

The 7000-series (Al-Zn-Mg-Cu) aluminum alloys, as heat-treatable and high-strength materials, have been extensively applied in the aerospace, oil-drilling, and other demanding engineering fields [1,2,3,4,5]. Many studies have demonstrated that the addition of Mn, Er, and Zr elements to Al-Zn-Mg-Cu alloys can form secondary phases (e.g., Al6Mn, Al3Zr, Al3Er) during homogenization heat treatment, which effectively retain the dynamically recovered microstructure and suppress recrystallization [6,7,8]. Flow stress was a critical parameter in thermomechanical processing, significantly influencing the thermomechanical deformation behavior and microstructural evolution of aluminum alloys. It was influenced by the temperature, strain, and strain rate [9,10]. Hot deformation processes can eliminate microstructural defects after homogenization treatment, refine grain size, and break up coarsened primary phases in the microstructure, thereby improving the comprehensive properties of the alloy [11,12]. The design of hot processing schedules, equipment selection, and the determination of hot processing parameters were all critical, with the selection of hot processing parameters being particularly important. Parameter Z has been shown to effectively describe the influence of the deformation temperature and strain rate on the alloy’s microstructure [13,14]. The thermomechanical deformation parameters significantly influences the material’s microstructure and properties [15,16,17]. Unstable microstructures may contain defects such as shear bands and deformation twins that can adversely affect the mechanical properties of the material [18,19]. It is essential to establish the material’s constitutive equations, as controlling the thermomechanical processing parameters can alter the internal microstructure and consequently modify the mechanical properties.
In the hot processing of alloys, dynamic softening and strain hardening play dominant roles [14,20,21]. Constitutive equations effectively described the strain hardening, recovery, and recrystallization processes, as well as the influence of deformation temperatures and strain rates [22,23]. Sellars et al. [24] proposed an Arrhenius-type model that describes the nonlinear relationships between parameters in the thermomechanical deformation process. The Zener–Hollomon parameter Z [10,25] played a significant role in the deformation parameters during thermomechanical deformation of the alloy. Dynamic Material Modeling (DMM)-based processing maps were crucial for optimizing hot deformation process parameters [26]. Wei et al. [27] found that high strain rates and low temperatures hindered the dynamic recovery and dynamic recrystallization during thermomechanical deformation. Chen et al. [28] established a strain compensation model to successfully predict the flow stress of the Al-12Zn-2.4Mg-Cu alloy. Tang et al. [29] demonstrated that other alloying elements (Zn, Cu, Mg, Mn, and Zr) in aluminum alloys significantly influenced the recovery and recrystallization. Yue et al. [30] highlighted that for Al-Zn-Mg-Cu alloys, the deformation temperature, strain rate, and phase transformations collectively determined the final alloy properties.
In order to enhance the process control of the thermomechanical processing of 7E97 aluminum alloy and further improve its quality and mechanical properties. Isothermal hot compression simulation experiments were conducted on the alloy to investigate the effects of deformation conditions on flow stress. A constitutive equation for the hot deformation process was established to describe the alloy’s behavior at high temperatures. Additionally, a processing map was utilized to determine the suitable range for hot processing, providing a basis for the industrial production of 7E97 aluminum alloy.

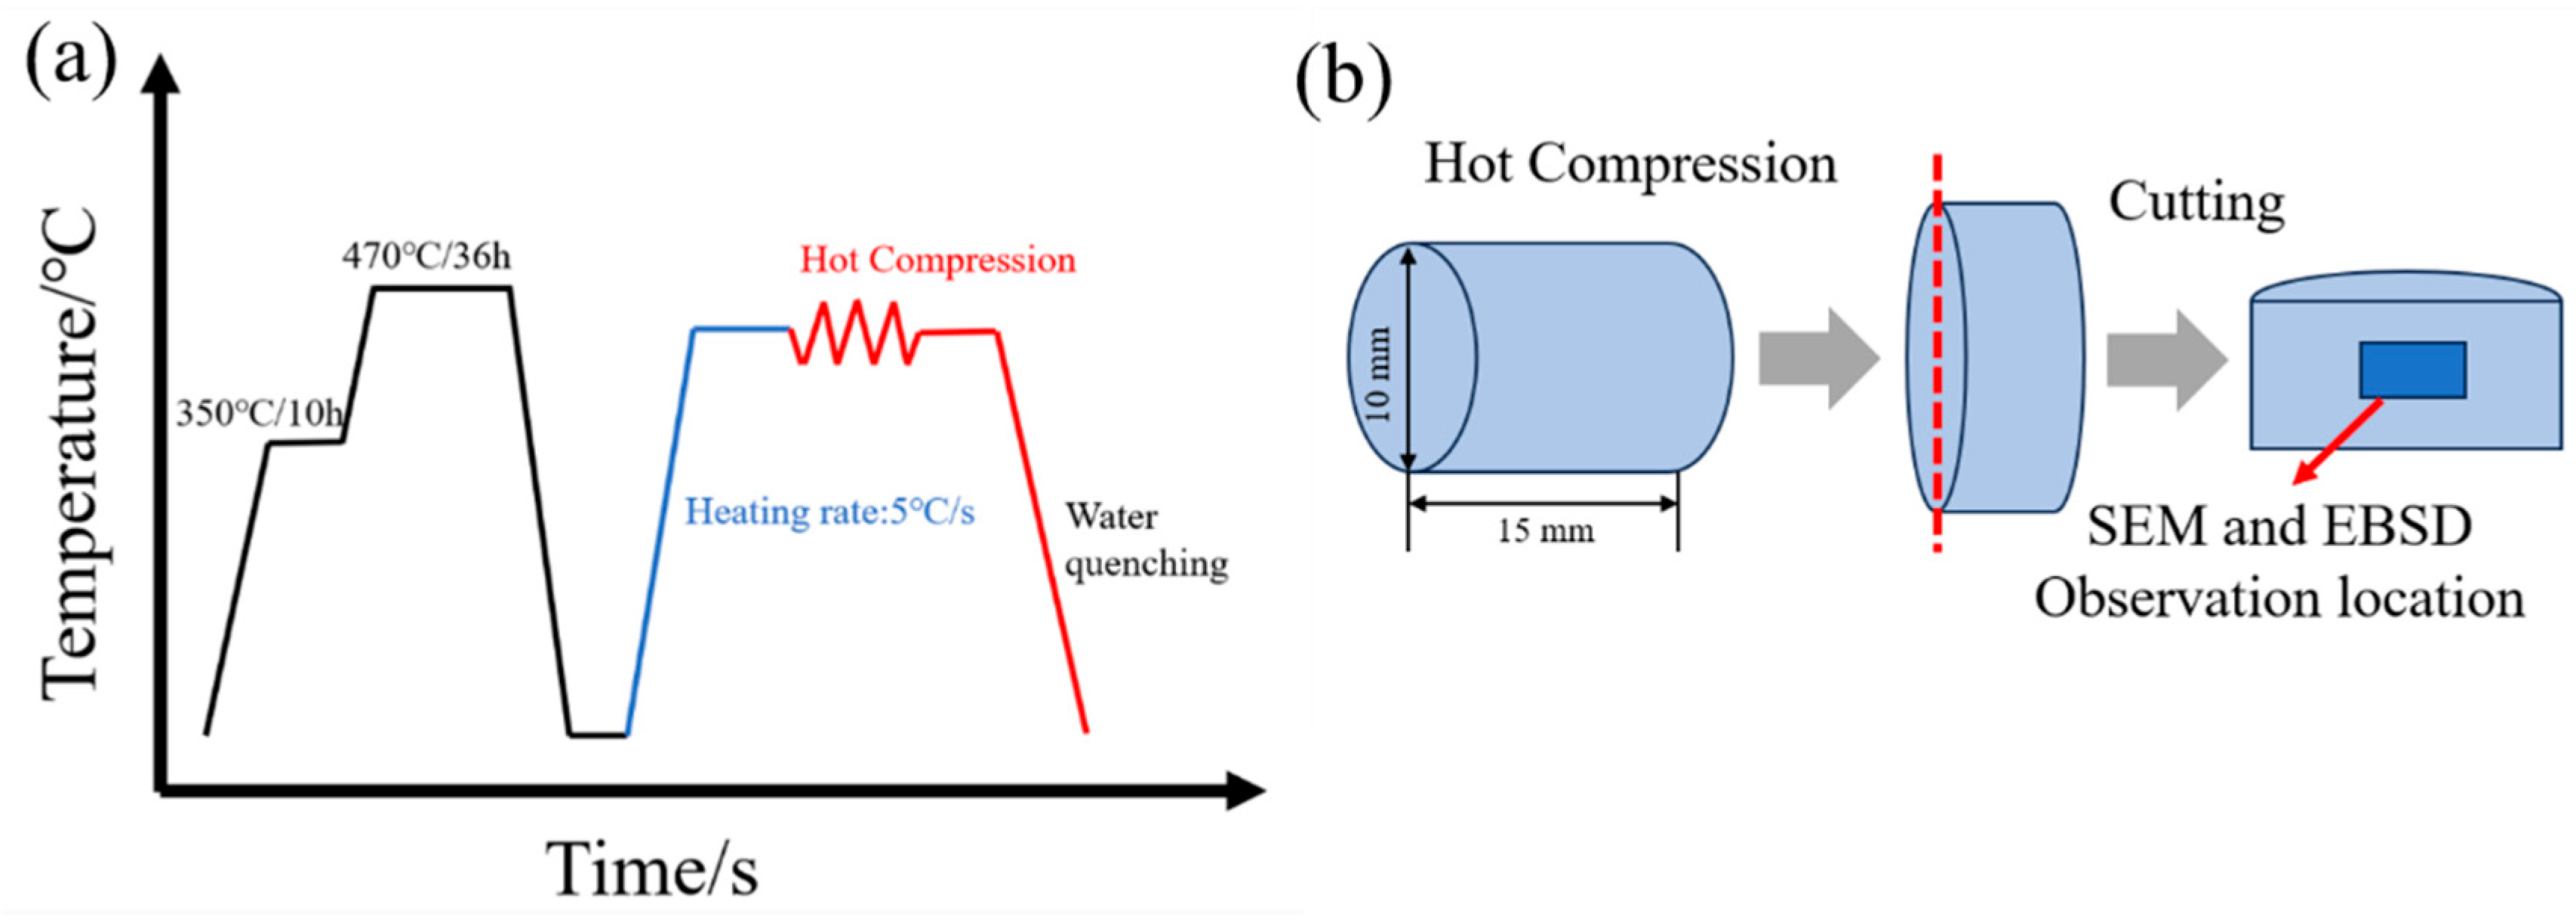
2. Materials and Methods

The chemical composition of laboratory 7E97 aluminum alloy is shown in Table 1. The raw materials used in preparing the alloy were pure aluminum (99.9%), pure zinc (99.9%), pure magnesium (99.9%), and intermediate alloys of Al-50%Cu, Al-10%Mn, Al-5%Er, and Al-10%Zr (in wt.%). The raw materials were melted at 780 °C for 3 h and then cast into a mold. The chemical composition of the alloy was analyzed using an Optima 8000 inductively coupled plasma optical emission spectrometer (ICP-OES). The alloy underwent homogenization heat treatment at 350 °C/10 h + 470 °C/36 h, after which experimental samples with Ø 10 × 15 mm were processed [13]. The isothermal hot compression experiments were conducted on a Gleeble-3500 thermal simulation testing machine under various deformation temperatures (300, 340, 380, 420, and 460 °C) and strain rates (0.001, 0.01, 0.1, 1, and 10 s−1). The deformation amount was set to 45%, corresponding to a maximum true strain of 0.6. The experimental temperature curve, as shown in Figure 1a, involved a heating rate of 5 °C/s followed by maintaining the set temperature for 180 s prior to conducting the isothermal hot compression test. After compression, the samples were water quenched to preserve the high-temperature original microstructure of the alloy. As is shown in Figure 1b, the compressed samples were machined into test specimens along the compression axis direction and subjected to sanding with sandpaper, mechanical polishing, and electrolytic polishing. The electrolytic polishing was performed using a solution of 30% HNO3 and 70% CH3OH, with a voltage of 25 V, a current of 0.8 A, and a polishing time of 20 s. The deformed microstructures were observed using SEM and EBSD techniques on a FEI QUANTA 650 scanning electron microscope (Hillsboro, OR, USA), with EBSD data analysis performed using Channel 5 software. The EBSD parameters used in operation were as follows: scanning voltage at 22.0 kV, current of 11.0 nA, and step size of 1.2 μm.

3. Results and Discussion

3.1. Construct the Stress Constitutive Equation

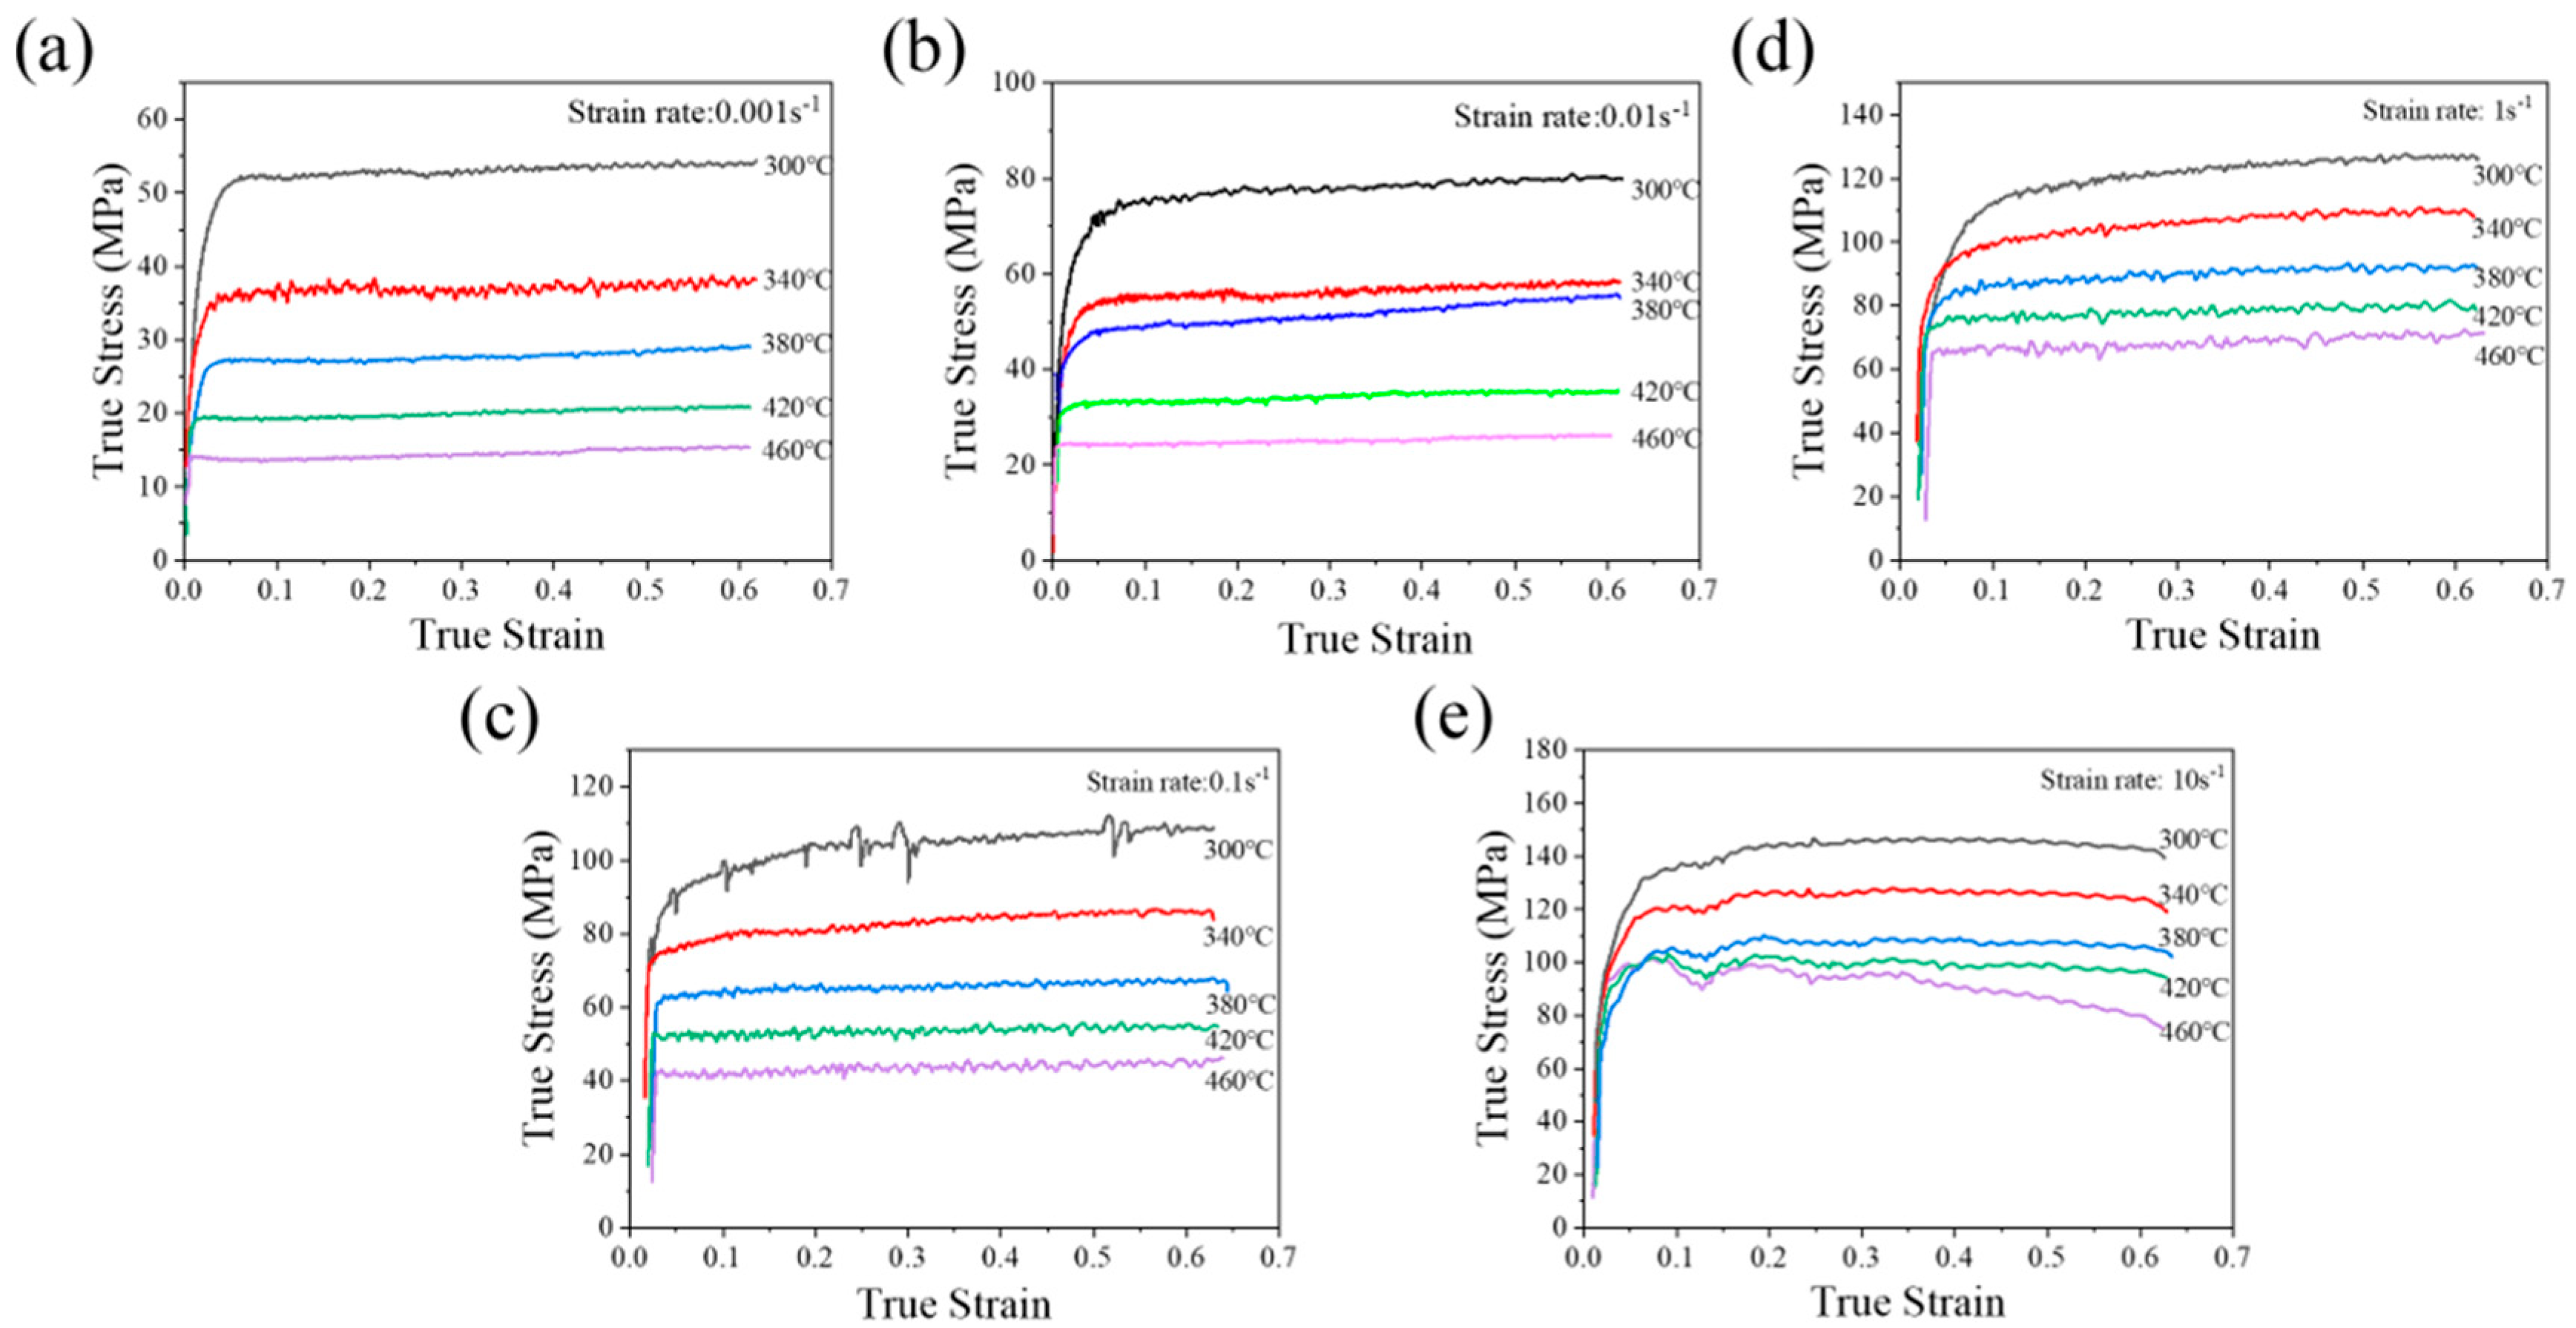
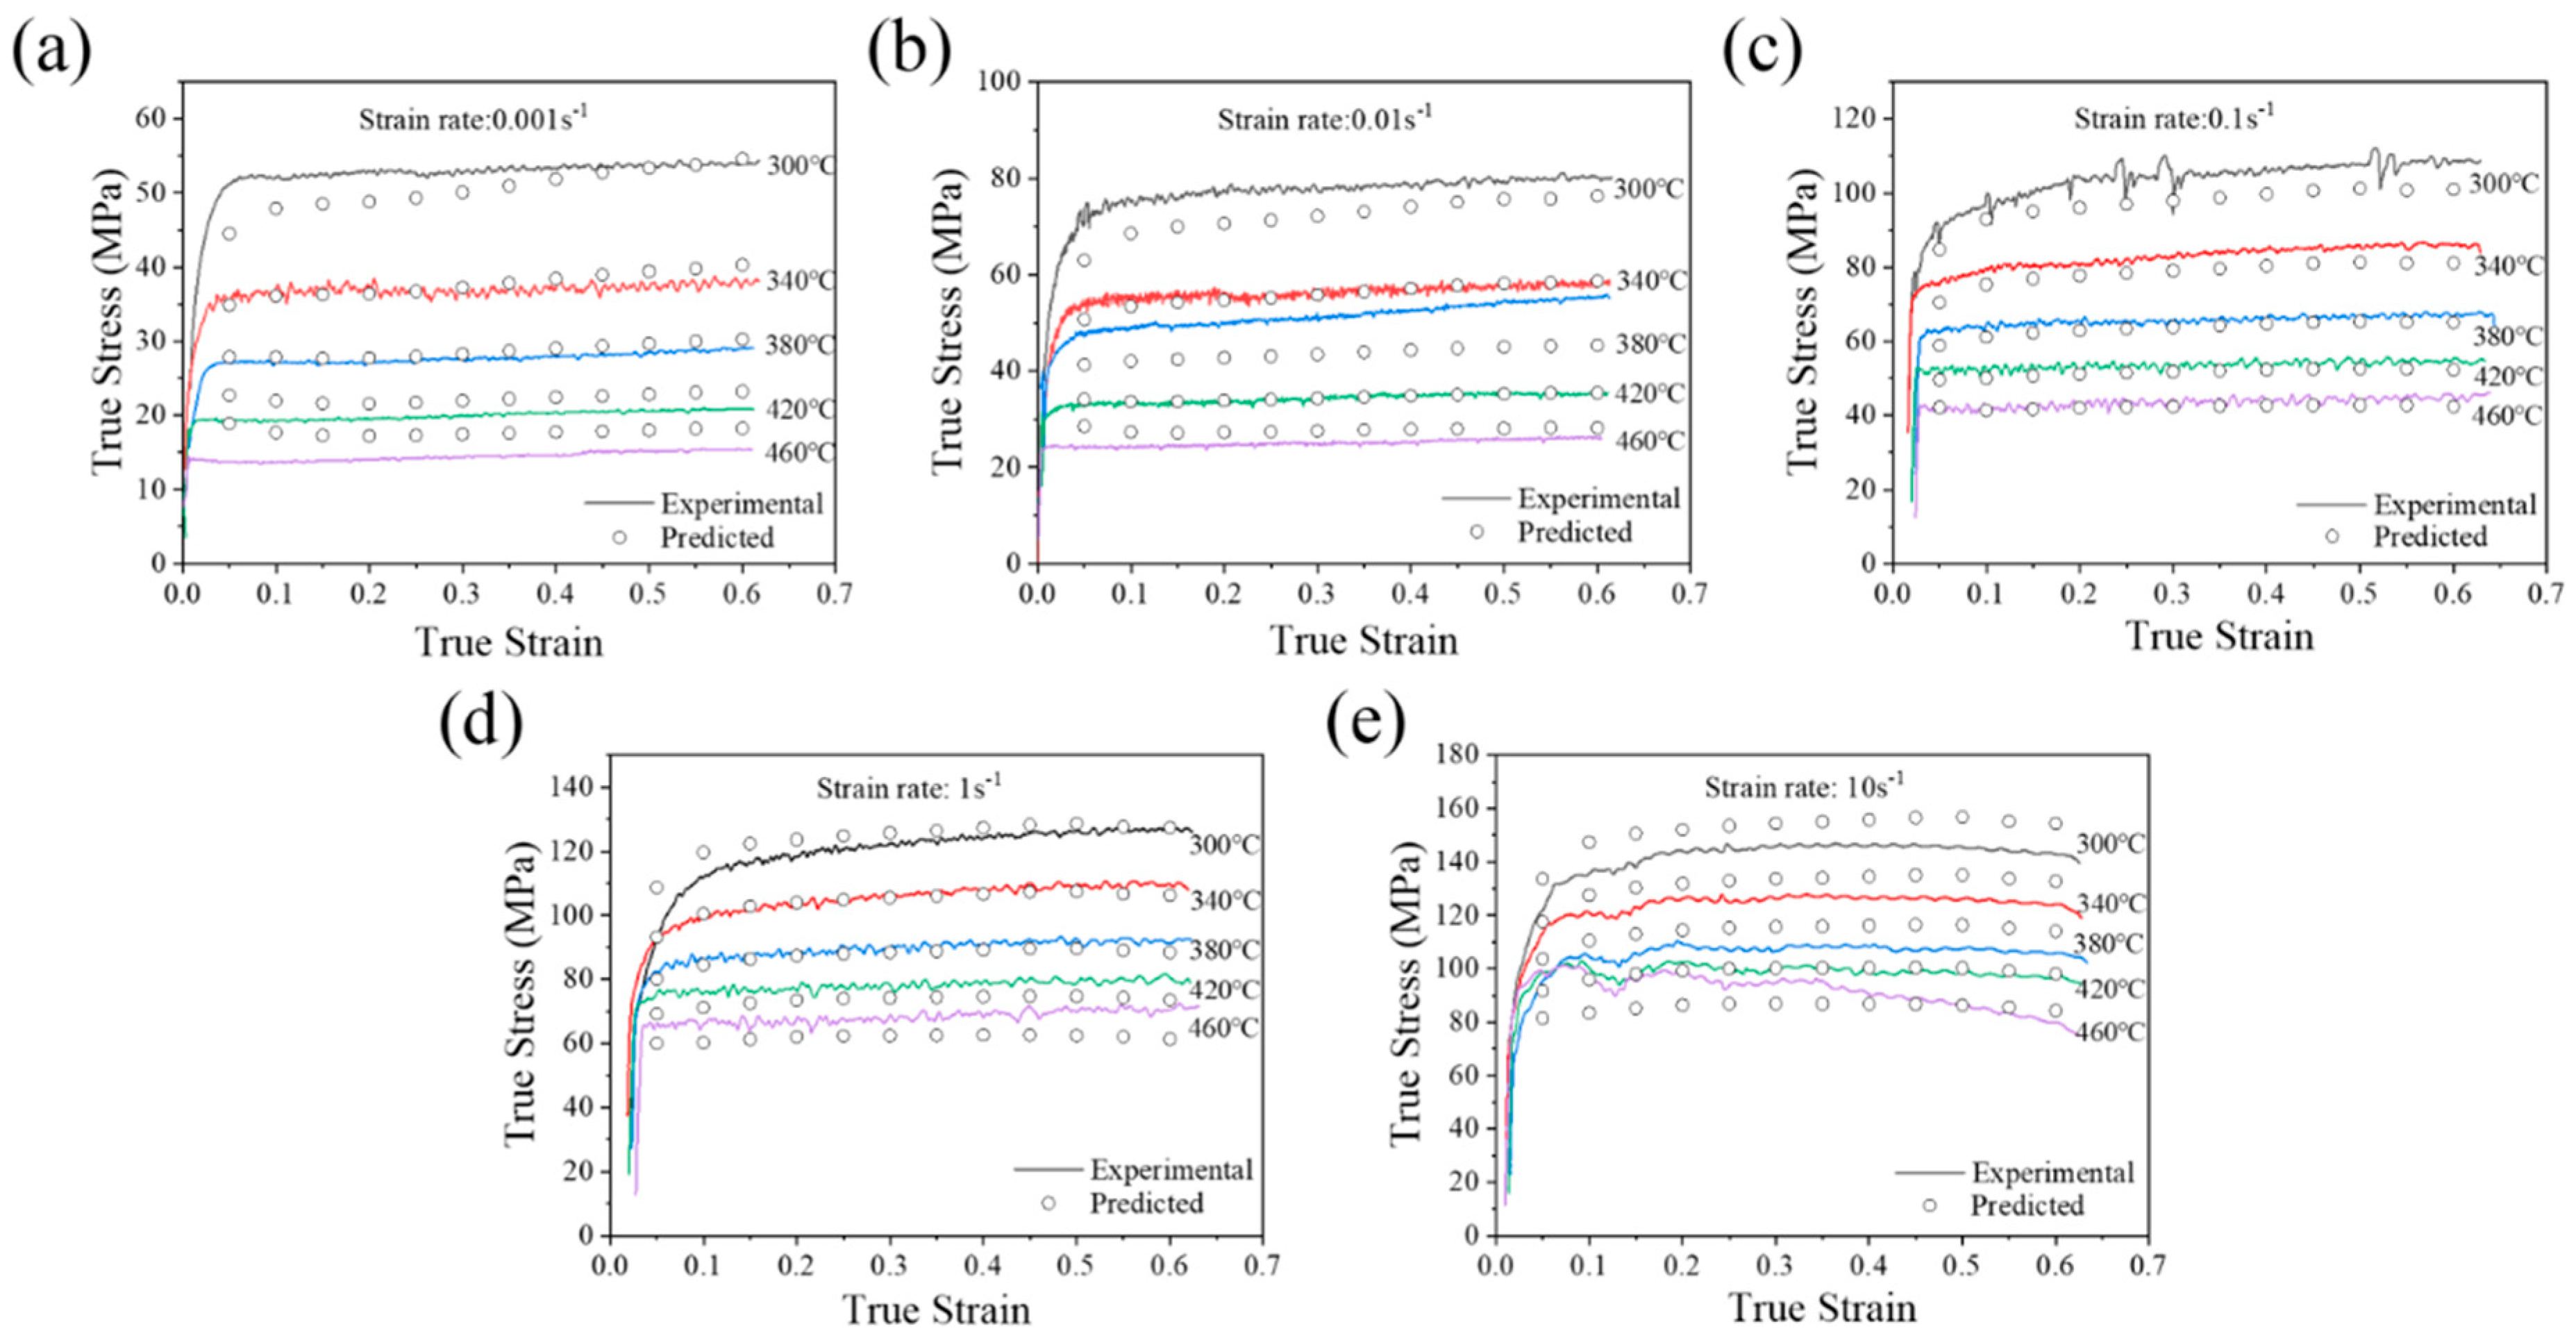
3.1.1. True Stress–True Strain Curve

As is shown in Figure 2, the true stress–true strain curves obtained from the hot simulator were corrected using bulge correction. Graphite foil and a high-temperature lubricant were employed between the specimen ends to minimize friction during hot compression tests. During hot compression, dislocations and other defects increase, leading to thermodynamic instability in the material. This instability results in the sequential effects of dynamic recrystallization and dynamic recovery, which in turn cause the stress–strain curve to exhibit a serrated profile [31]. During hot compression testing, the deformed samples exhibited bulging, introducing experimental error that led to an overestimation of true stress values [32]. The alloy exhibits pronounced steady-state flow characteristics during hot deformation. At a given strain rate, the higher the deformation temperature, the lower the corresponding flow stress. Conversely, at a given deformation temperature, the higher the strain rate, the higher the corresponding flow stress.
The flow stress of the alloy is a function of the deformation temperatures and strain rates. Under the same strain rate, the flow stress decreases with increasing deformation temperature. This is due to the enhanced thermal activation effect at higher deformation temperatures, which increases the dislocation migration rate and strengthens the dynamic recovery effect. During hot deformation, a significant amount of the MgZn2 phase undergoes dynamic coarsening or dissolution within the temperature range of 380~440 °C, thereby reducing the alloy’s strength. At the same deformation temperature, due to the shortened compression time, the flow stress increases with increasing strain rate.

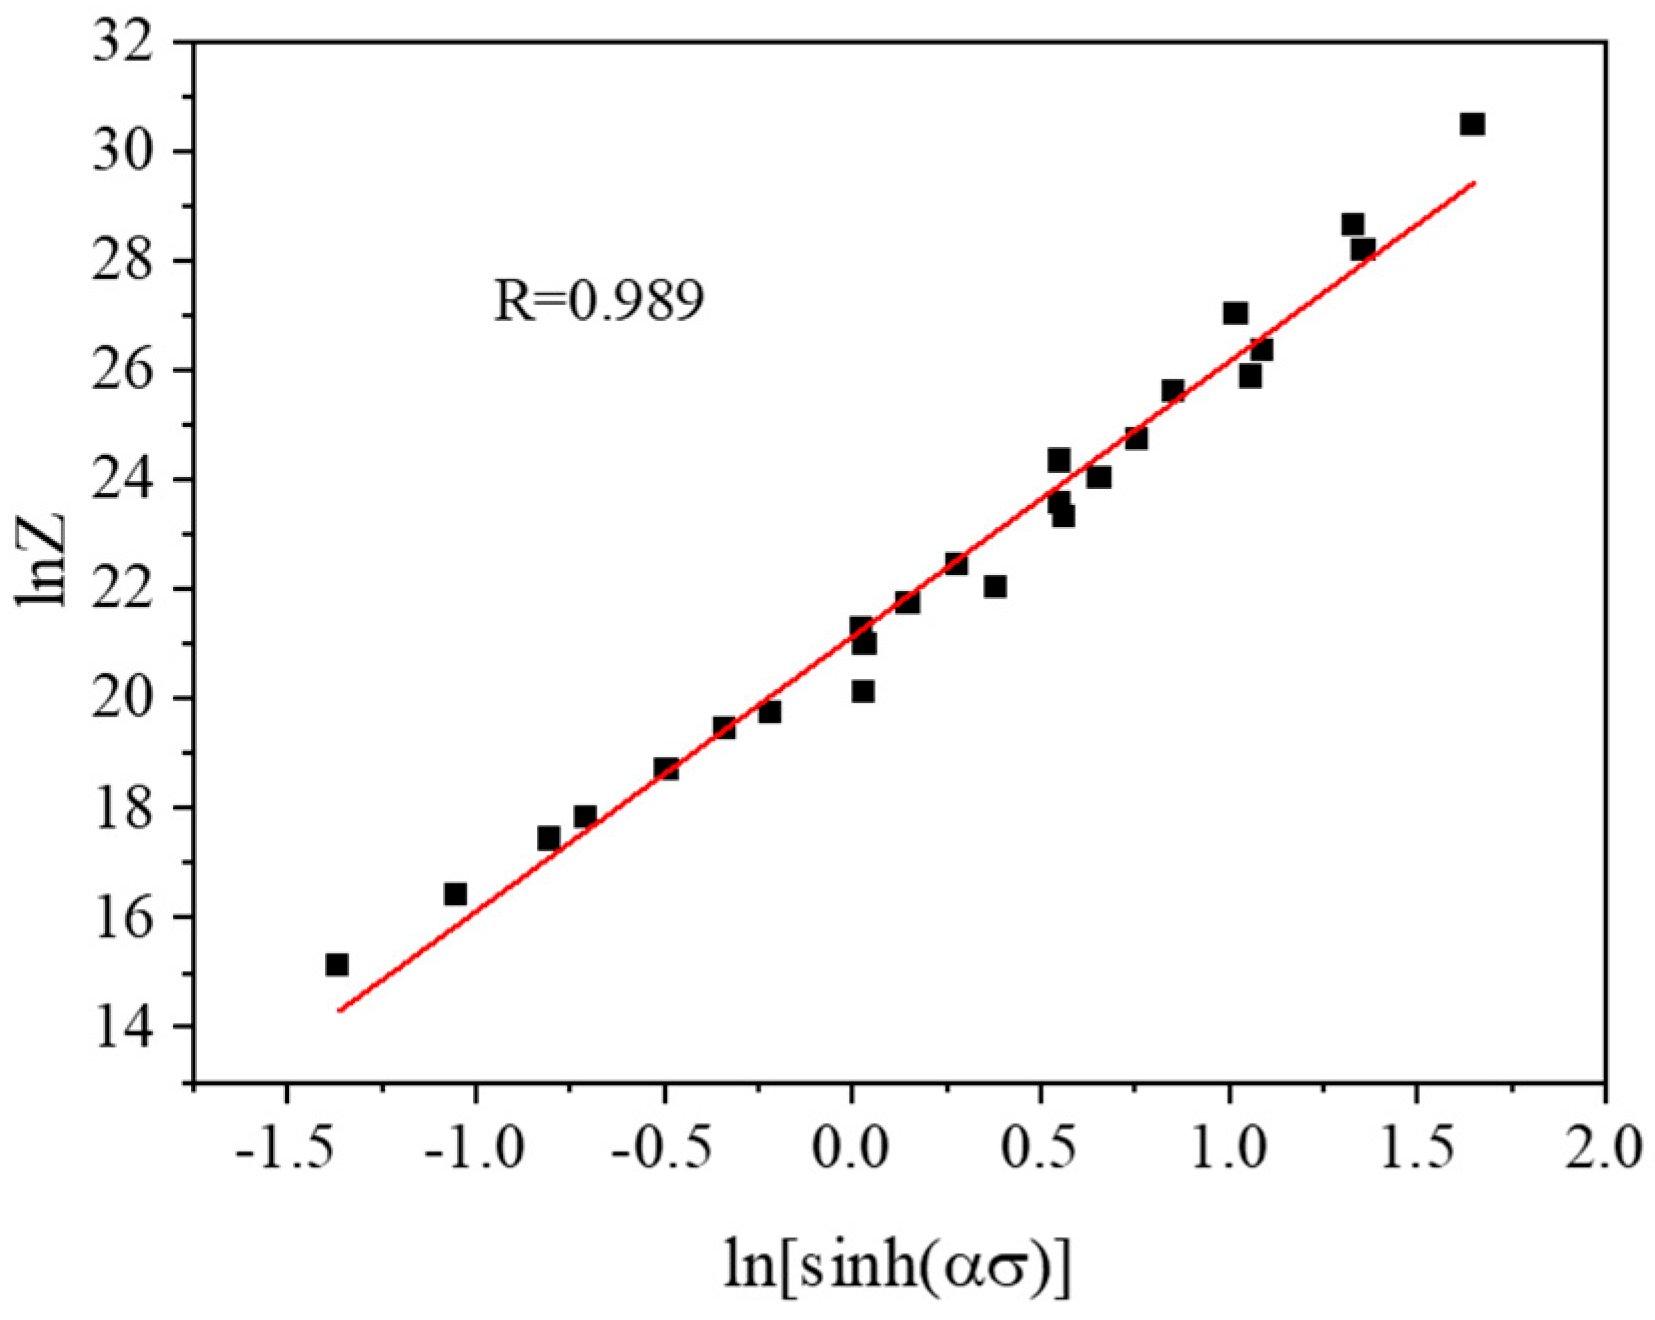
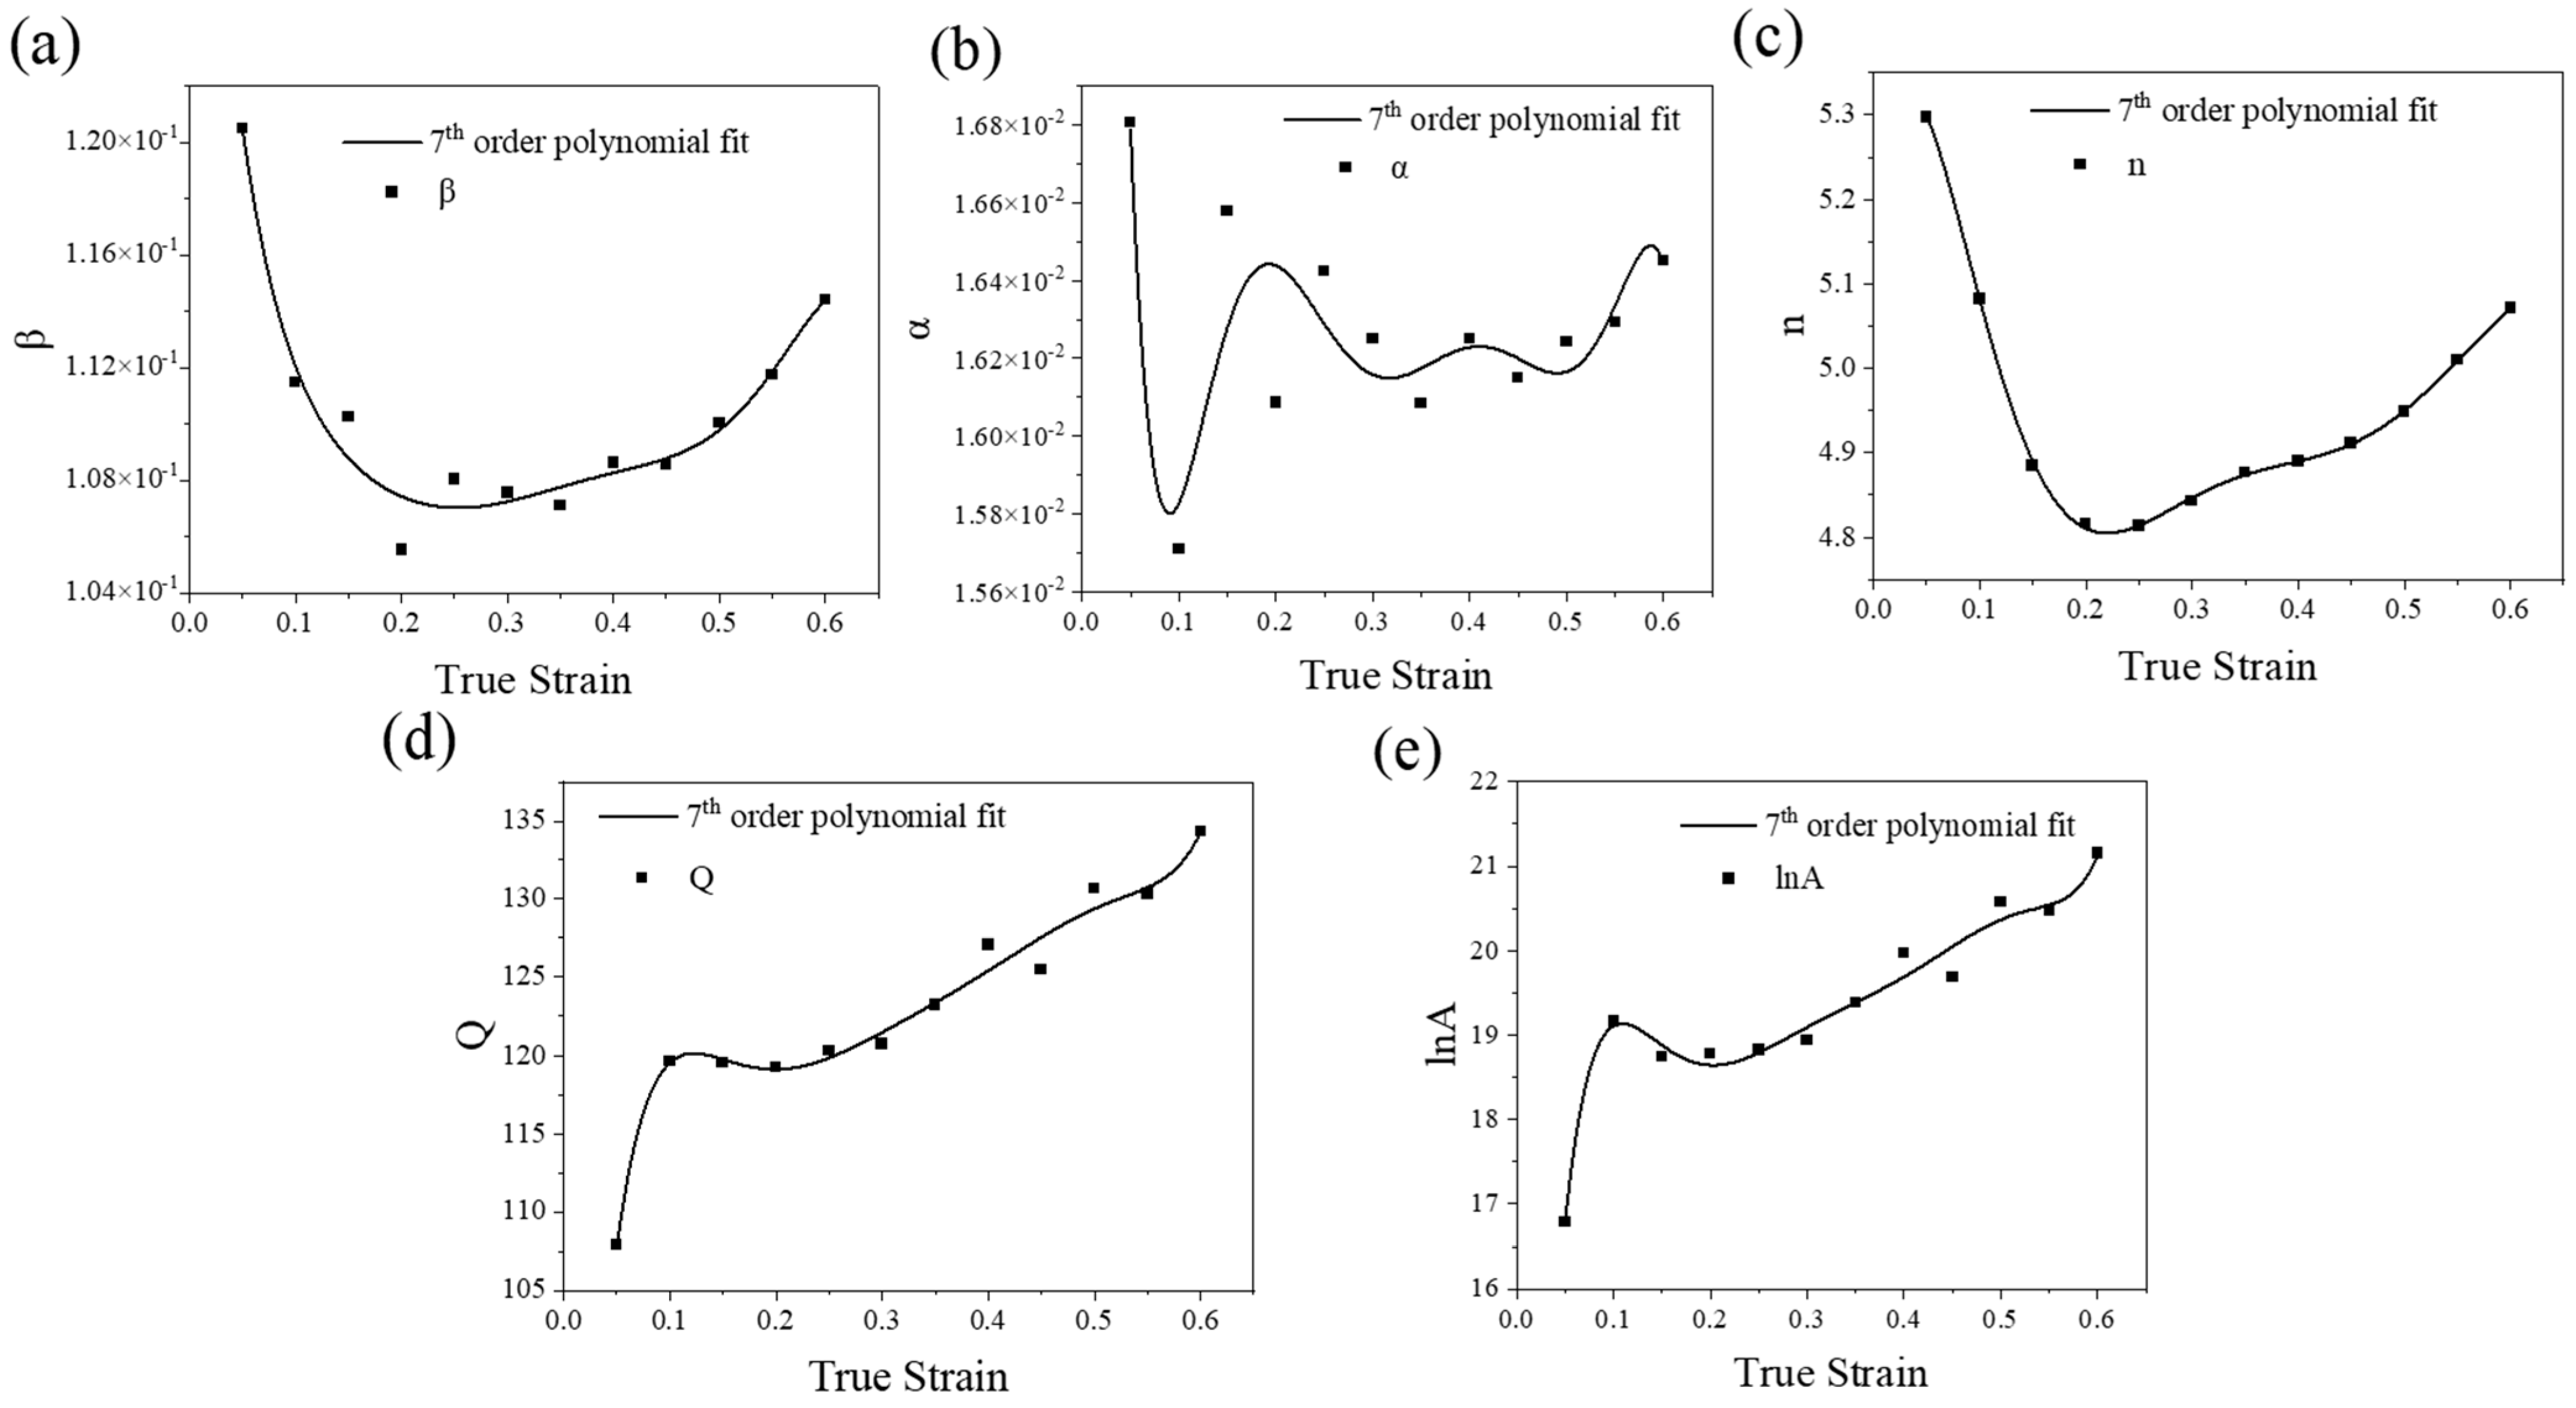
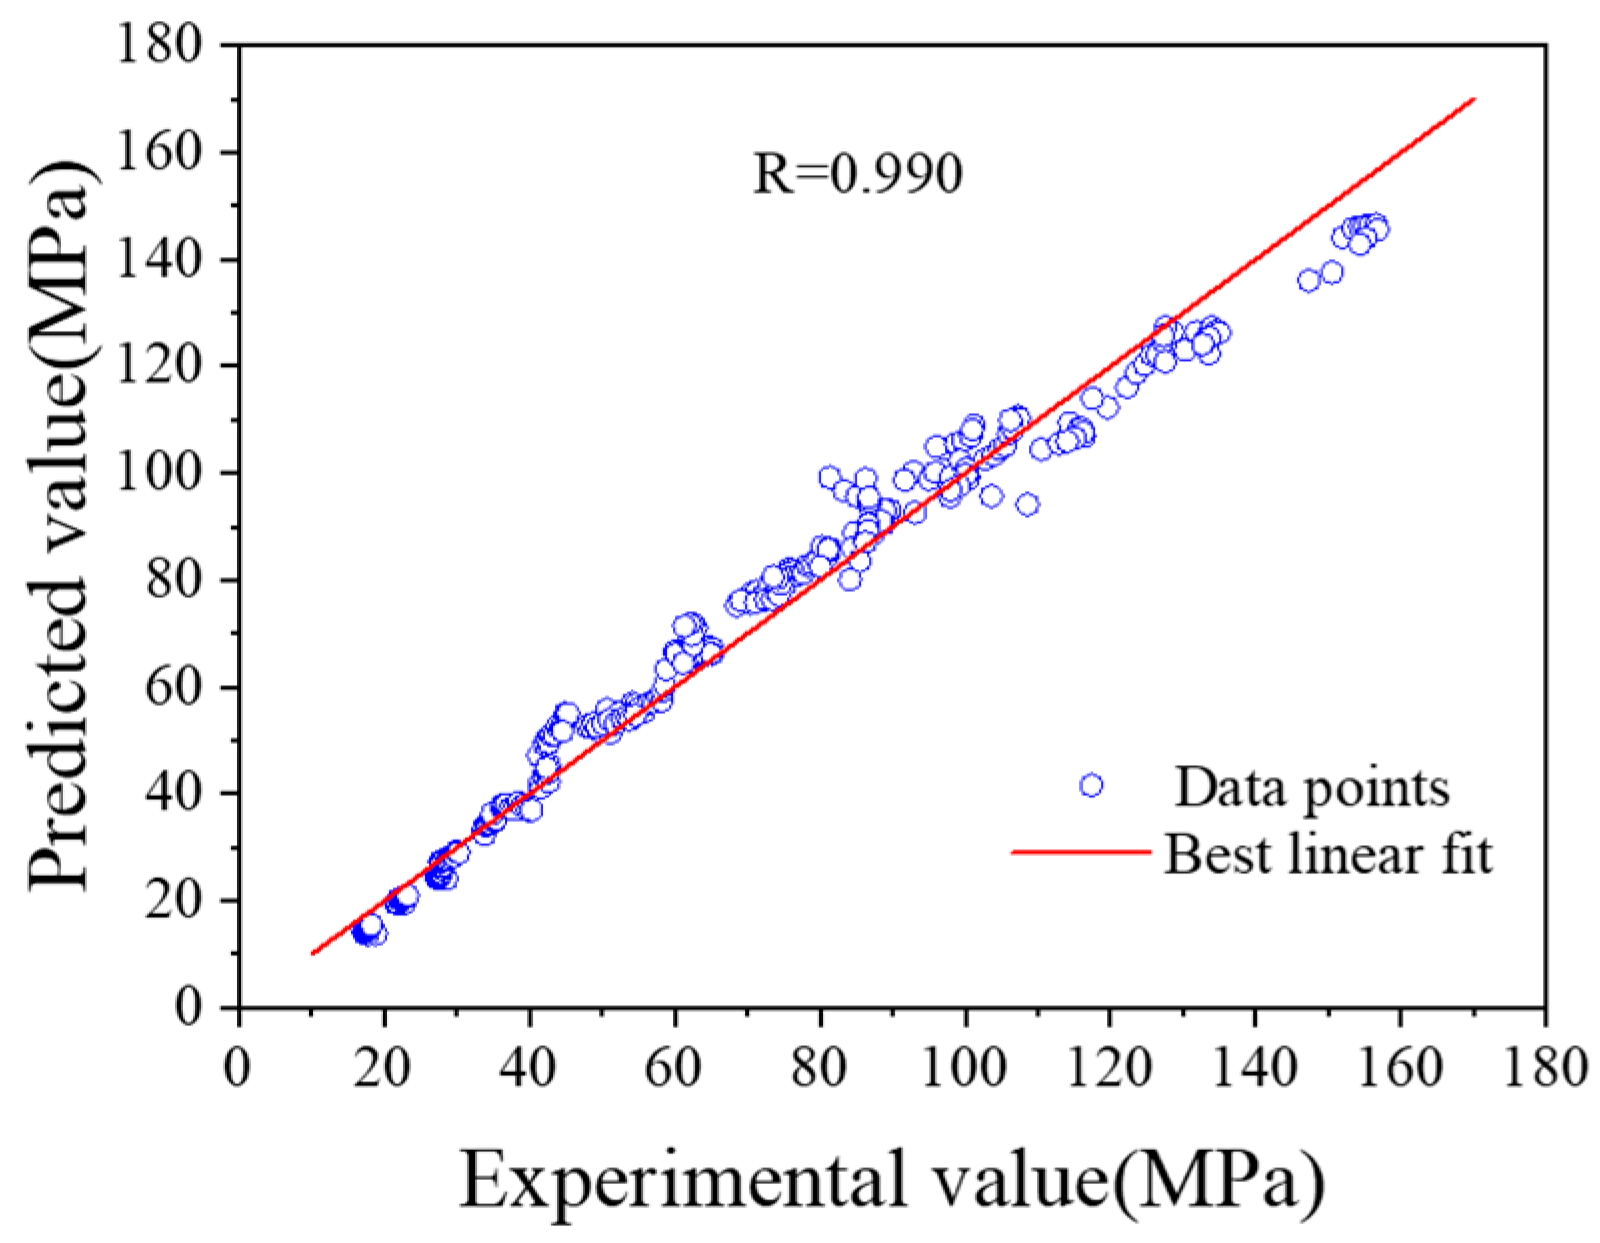
3.1.2. Constitutive Modeling

In this study, data with a true strain of 0.6 were selected to construct the constitutive equation. The flow stress (σ), strain rate ( ε ˙ ), and deformation temperature (T) can be expressed by the following equations [10,13,33]:
ε ˙ = A 1 σ n 1 e x p Q R T , α σ < 0.8
ε ˙ = A 2 e x p β σ e x p Q R T , α σ > 1.2
ε ˙ = A s i n h α σ n e x p Q R T
where A is the structural factor (s−1), α is the stress level parameter (MPa−1), α = β n 1 , n and n 1 are stress exponent [34], Q is the activation energy (kJ/mol), and σ is the flow stress (MPa). The flow stress and peak stress satisfy a linear relationship, which was described by the temperature-compensated strain rate factor (Z) [35]:
Z = A s i n h α σ n = ε ˙ e x p Q R T
σ = 1 α l n Z A 1 n + Z A 2 n + 1 0.5
Taking logarithms of both sides of Equations (1)–(3) the following are obtained:
l n ε ˙ = n 1 l n σ + l n A 1 Q R T
l n ε ˙ = β σ + l n A 2 Q R T
l n ε ˙ = n l n s i n h α σ + l n A Q R T
Figure 3a–c presents the linear-fitting results for n 1 , β, and n across various strain conditions. The α value is then calculated using α = β n 1 . Equation (8) was differentiated to obtain the following:
Q = 1000 R l n s i n h α σ 1 T ε ˙ l n ε ˙ l n s i n h α σ T = R S n
In the equation, n and S represent the average slope values of the linear-fitting lines for ln ε ˙ l n s i n h a σ and ln ε ˙ 1000 / T . The fitting lines are shown in Figure 3d, and the calculated values of n and S are approximately 5.1 and 3.2, respectively. Substituting the values of n and S into Equation (9), the average deformation activation energy Q of the alloy at a true strain of 0.6 was determined to be 134.4 kJ/mol. The deformation activation energy Q reflects the energy barrier for plastic deformation in alloys. It exhibits strong dependencies on the (1) alloy composition (a higher solute content typically increases Q, elevating processing difficulty), (2) initial microstructure (grain size and precipitate distribution), and (3) heat treatment state (artificial aging).
By substituting the Q values under various conditions into Equation (4), the corresponding Z parameters for each state were calculated. Table 2 presents the lnZ values for the 7E97 alloy at different deformation rates and temperatures under a true strain of 0.6. Taking logarithms of both sides of Equation (4) yields the following:
l n Z = l n A + n l n s i n h α σ
A linear fit of lnZ and ln[sinh(ασ)] was performed, as shown in Figure 4. The intercept of the fitted line with the y-axis corresponds to lnA.
The constants were determined as shown in Table 3. Substituting the results into Equation (3) yields the constitutive equation for the thermomechanical deformation of the alloy:
σ ε = 1 0.016452 l n ε ˙ e x p 134.3569 R T 1.538 × 10 9 1 5.071476 + ε ˙ e x p 134.3569 R T 1.538 × 10 9 2 5.071476 + 1 1 2
To obtain a more accurate constitutive equation incorporating strain-dependent factors and to reduce model errors, strain correction of the derived constitutive equation was required to account for the influence of true strain variations on the mechanical parameters during the deformation process. Based on the computed true strain values ranging from 0.05 to 0.6, with 12 strain points corresponding to material parameter values, a 7th-order polynomial fitting was performed for each parameter. The fitting results are shown in Figure 5 and Table 4, and the 7th-order polynomials used for the fitting are as follows:
Y ε = B 0 + B 1 ε + B 2 ε 2 + B 3 ε 3 + B 4 ε 4 + B 5 ε 5 + B 6 ε 6 + B 7 ε 7
As is shown in Figure 5, the fitted curves had high precision and no overfitting. It was evident that the material parameters were significantly influenced by the strain variable changes.
Through 7th-order polynomial fitting, the relationships between strain and various material parameters have been established. Based on this, the predicted flow stress at a given strain can be more accurately calculated. The resulting constitutive equation for thermal deformation of the alloy, based on a hyperbolic sine relationship, can be expressed as a relationship between stress and parameter Z, with the formula provided below:
σ ε = 1 α ε l n Z Q ε A ε 1 n ε + Z Q ε A ε 2 n ε + 1 1 2 .
Z = ε ˙ e x p Q ε R T
The strain-compensated constitutive equation was validated by comparing the predicted values from Equations (13) and (14) with the experimental values. A quantitative evaluation of the results was conducted using the correlation coefficient (R), and the outcomes are presented in Figure 6 and Figure 7. Most data points are located closely around the optimal regression line, indicating strong agreement between predicted and experimental values. This demonstrated that the strain-compensated constitutive equation obtained in this study can effectively predict the hot deformation behavior of the alloy.

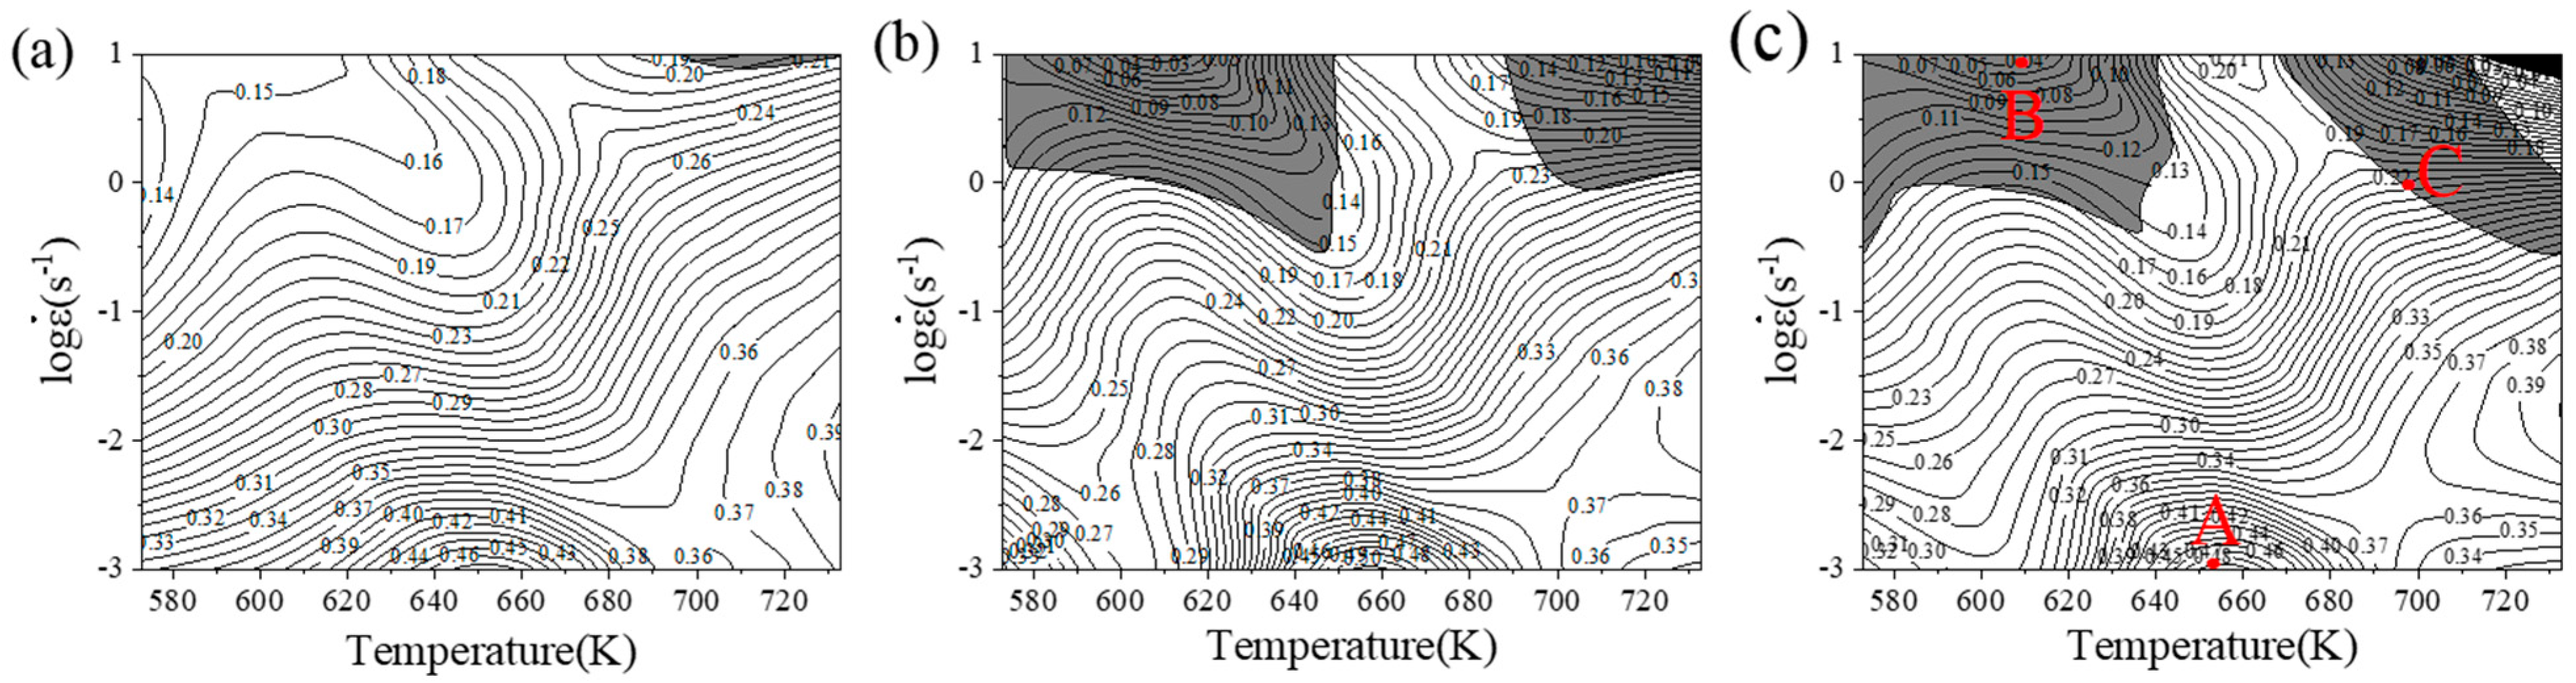
3.2. Hot Processing Maps

By constructing the hot processing maps [26,34], the target hot working window and microstructural characteristics were determined. During hot deformation, the relationship between the absorbed power P and the power consumed by plastic deformation G and microstructural evolution J was expressed as follows:
J P = l g σ l g ε ˙ = m
P = G + J = 0 ε ˙ σ d ε ˙ + 0 σ ε d σ ˙
where m is referred to as sensitivity factor and reflects the alloy’s power dissipation capability during hot processing through the energy dissipation efficiency η:
η = 2 m m + 1
The continuous stability criteria in the deformation process were represented by the dimensionless stability parameter ξ ε ˙ [36]:
ξ ε ˙ = 𝜕 l g m m + 1 𝜕 l g ε ˙ + m < 0
By superimposing the power dissipation maps and the instability maps, the hot processing maps of the alloy was obtained, as shown in Figure 8. The gray regions represent instability zones with poor formability and should be avoided. A higher η value corresponds to a greater amount of energy available for microstructural evolution during hot deformation, resulting in better processability. Since the η value is relatively low at ε ˙ = 10 s−1, the corresponding processing performance is inferior [37]. The instability zones of the alloy are predominantly concentrated in areas where the strain rate exceeds 0.1 s−1. The shaded black area corresponds to the deformation condition at a temperature of 460 °C and a strain rate of 10 s−1. At a specific strain rate, the effect of strain on the power dissipation efficiency (η) is also significant and cannot be neglected. Zones exhibiting higher η-values are typically optimal for selecting hot processing parameters. Under the deformation conditions of 380 °C and a strain rate of 0.001 s−1, the alloy achieves its maximum power dissipation efficiency, with a value of 0.48. The instability zones are represented in gray and black. With the gradual increase in strain, the distribution of the instability zones changes, and their area significantly increases, indicating that strain had a significant effect on the hot processing maps, and consequently, on the hot deformation behavior of the alloy. At strain rates ranging from 0.01 to 0.001 s−1, the material demonstrates a high power dissipation efficiency, with values exceeding 0.3, and operates far from the instability zone. The curvature variation in power dissipation isotherms across the temperature range is attributed to the remelting of MgZn2 precipitates [38].

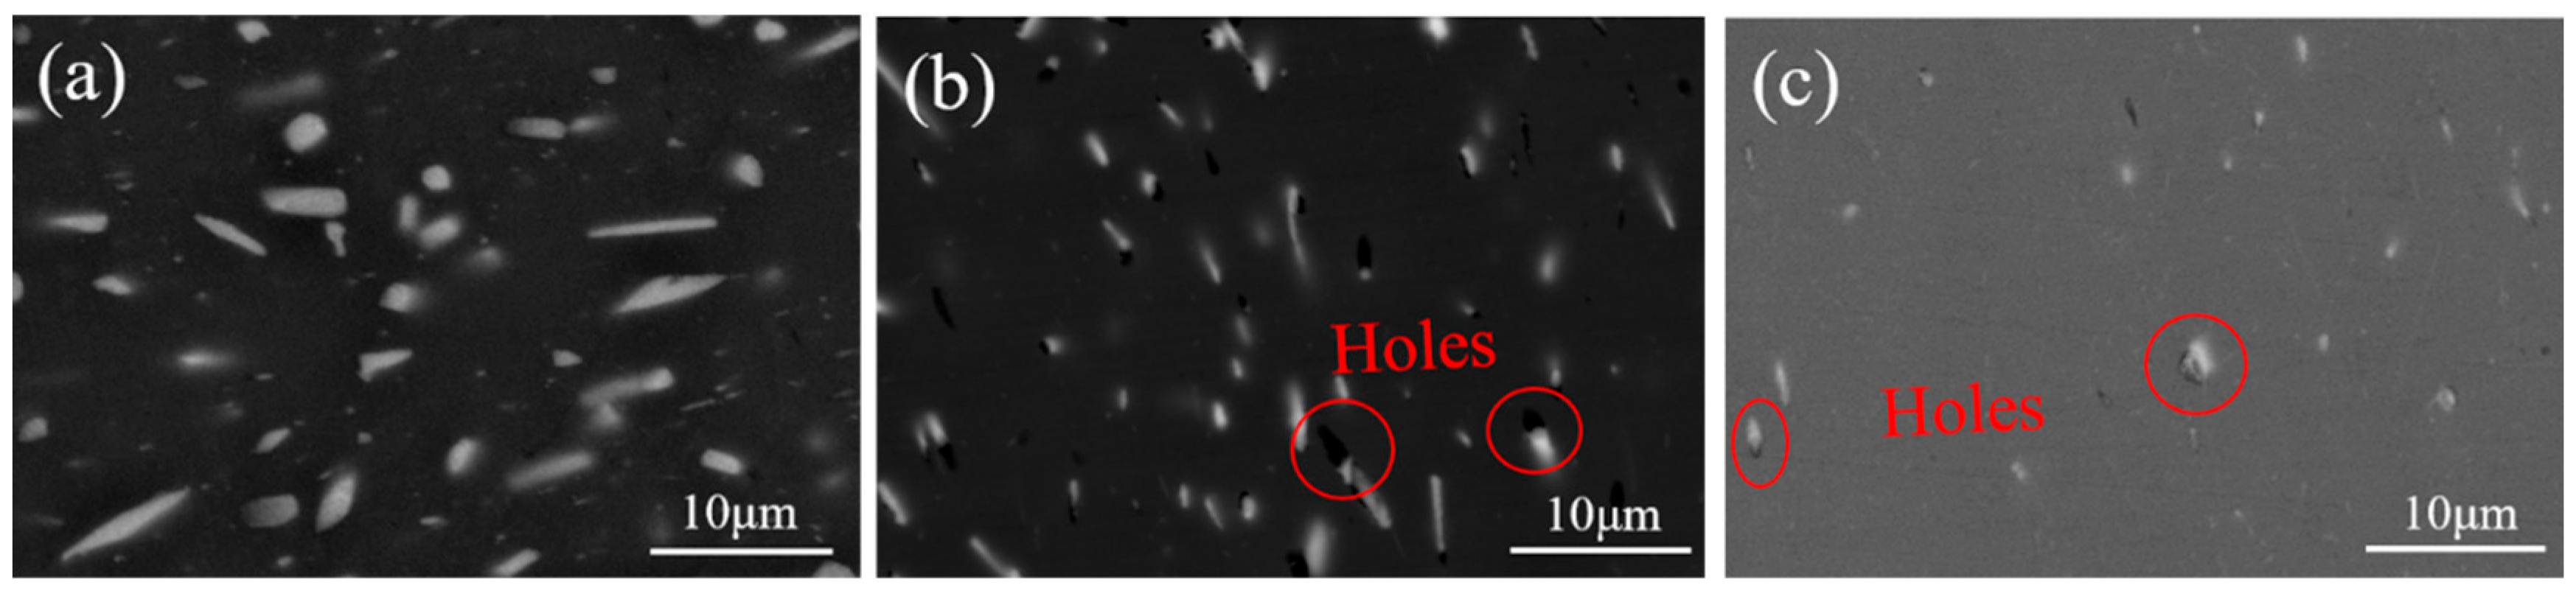
3.3. Microstructural Analysis

As is shown in Figure 9, the SEM images of the microstructures in the safety zone and instability zone of the hot processing maps revealed that compared to points A and B at lower processing temperatures in Figure 8c, point C at a hot deformation temperature of 420 °C exhibited a significant reduction in the number of precipitates. This was attributed to the fact that with increasing deformation temperature, the MgZn2 phase dissolves into the matrix during hot deformation. This observation corresponds to the phenomenon revealed in the alloy’s hot processing maps (Figure 8), where power dissipation isopleths show a pronounced curvature change between 380 and 440 °C due to progressive MgZn2 remelting and dissolution into the matrix [38,39]. Additionally, the remelting of precipitates reduces the strength of the alloy.
Compared to the microstructure at point A in the safe zone, voids appear at the second-phase boundaries in the instability zone microstructures at points B and C. As is shown in Figure 10b,e,h, the fractions of low-angle grain boundaries (LAGBs) for the safe zone (A point), instability zone B (B point), and instability zone C (C point) are 57.2%, 65.9%, and 66.6%, respectively. The instability zone microstructures, subjected to higher strain rates, exhibit a higher fraction of LAGBs. Such characteristic microstructures were associated with a higher dislocation density. When a large number of dislocations reached the edges of hard phases, they were hindered, leading to dislocation pile-ups. This ultimately resulted in void coalescence and growth, forming defects. During further plastic deformation or material service, stress concentrations occurred at the voids, promoting void growth and eventually leading to crack formation [40]. This would degrade the material’s overall performance [41].
From Figure 10a,d,g, it can be seen that the deformation of the microstructures at points B and C in the instability zone is uneven. A small number of grains exhibit significant deformation near grain boundaries, leading to grain fragmentation. Additionally, some small equiaxed grains, which were recrystallized grains, appear. As deformation increases, the strain distribution within the material becomes more uneven, and localized stress concentrations may lead to microstructural instabilities. Such instabilities manifest as the formation of flow instability bands, which are typically accompanied by localized strain concentration and increased energy dissipation. The formation of these flow instability bands significantly affects the material’s microstructure, such as inducing grain refinement, microstructural inhomogeneity, and the formation of pores, thereby reducing the material’s continuity and homogeneity [40,42].
As is shown in Figure 10c,f,i, the microstructure at point A in the safe zone was primarily composed of dynamic recovery structures, accompanied by a small amount of recrystallization. This was due to the fact that, at low strain rates, the alloy has sufficient deformation time to complete dynamic recovery, resulting in a higher efficiency of energy dissipation. In contrast, the microstructures at points B and C in the instability zone were predominantly deformation structures, accompanied by a small amount of recovery structures and recrystallized grains. This is because, at excessively high strain rates, the deformation time of the alloy was too short, and the time for dislocation migration was insufficient, making it difficult for the alloy to undergo dynamic recovery. This results in a very low efficiency of energy dissipation, leading to flow instability in the alloy within this region. Consequently, plasticity and toughness are reduced, and phenomena such as cracking are likely to occur. Therefore, during the selection of hot processing parameters, it was crucial to avoid parameters corresponding to the instability zone, as represented by points B and C.
Based on the hot processing maps and microstructural analysis, the optimal thermomechanical processing window for the alloy was determined to be in the region with strain rates of 0.001~0.05 s−1 and deformation temperatures of 350~410 °C.

4. Conclusions

This study investigated the hot deformation behavior of the 7E97 alloy after homogenization, established the flow-stress constitutive equation and hot processing maps for the alloy, and examined the microstructure of the alloy after thermomechanical deformation. The following results were obtained:
(1) In the hot deformation process of alloys, the flow stress increased with the strain rate and decreased with increasing compression temperature. The flow-stress equation of alloys can be represented by equations involving the Zener–Hollomon parameters:
σ ε = 1 0.016452 l n ε ˙ e x p 134.3569 R T 1.538 × 10 9 1 5.071476 + ε ˙ e x p 134.3569 R T 1.538 × 10 9 2 5.071476 + 1 1 2
The constitutive equation demonstrated excellent fitting accuracy, with a correlation coefficient (R) of 0.990.
(2) The hot processing maps of the 7E97 alloy were established. The microstructure in the safe zone was predominantly characterized by dynamic recovery, with relatively uniform grain deformation. In contrast, the microstructure in the instability zone mainly consisted of deformed grains, and exhibited non-uniform grain deformation accompanied by grain fragmentation and voids near precipitated phases. The 7E97 alloy achieved dynamic softening primarily through dynamic recovery and a small amount of dynamic recrystallization.
(3) Referring to the hot processing maps of the 7E97 alloy, the optimal hot processing window was determined to be the region with a deformation temperature of 350~410 °C and a strain rate of 0.001~0.05 s−1. This region exhibited a high power dissipation efficiency, of consistently greater than 0.3, and was far from the instability zone. No defects were observed in the microstructure within this region.

Author Contributions

Conceptualization, F.H., X.W., S.W., L.H., Z.R., H.C., K.G., W.W., H.H. and Z.N.; Methodology, F.H., L.H., Z.R., H.C. and X.W.; Validation, F.H., L.H., Z.R., H.C., X.W. and S.W.; Formal Analysis, X.W., S.W., K.G., W.W., H.H. and Z.N.; Investigation, F.H., X.W., S.W., L.H., Z.R., H.C., K.G., W.W., H.H. and Z.N.; Resources, X.W.; Data Curation, F.H., X.W. and S.W.; Writing—Original Draft Preparation, F.H.; Writing—Review and Editing, F.H. and X.W.; Visualization, F.H.; Supervision, X.W., S.W., K.G., W.W., H.H. and Z.N.; Project Administration, X.W., S.W., K.G., W.W., H.H. and Z.N.; Funding Acquisition, X.W., S.W., K.G., W.W., H.H. and Z.N. All authors have read and agreed to the published version of the manuscript.

Funding

This work was supported by the National Natural Science Foundation of China (52494943), National Key Research and Development Program of China (2022YFB3705802), Beijing Natural Science Foundation (2202009), Jiangsu Province Program for Commercialization of Scientific and Technological Achievements (BA2022029) and Program on Jiangsu Key Laboratory for Clad Materials (BM2014006).

Data Availability Statement

The original contributions presented in this study are included in the article. Further inquiries can be directed to the corresponding author.

Conflicts of Interest

Author Liang Hong was employed by the company Weiqiao Lightweight Research Center at Soochow. The remaining authors declare that the research was conducted in the absence of any commercial or financial relationships that could be construed as a potential conflict of interest.

References

  1. Dong, P.; Chen, S.; Chen, K. Effects of Cu content on microstructure and properties of super-high-strength Al-9.3Zn-2.4Mg-xCu-Zr alloy. J. Alloy. Compd. 2019, 788, 329–337. [Google Scholar] [CrossRef]
  2. Hua, L.; Zhang, W.; Hu, L.; Zhang, Z.; Hu, Z. Mechanical responses and microstructure evolution of a 7A09 aluminum alloy extrusion profile during novel stretch bending. Mater. Charact. 2024, 212, 113938. [Google Scholar] [CrossRef]
  3. Wang, Z.; Geng, J.; Pu, Q.; Li, K.; Luo, T.; Li, Y.; Xia, P.; Li, X.; Chen, D.; Sha, G.; et al. Achieving high performance by optimized heat treatment in a spray formed Al–Zn–Mg–Cu alloy. Mater. Sci. Eng. A 2024, 893, 146134. [Google Scholar] [CrossRef]
  4. Liang, J.; Sun, J.; Li, X.; Zhang, Y.; Peng, L. Development and application of aluminum alloy drill rod in geologic drilling. Procedia Eng. 2014, 73, 84–90. [Google Scholar]
  5. Zhao, J.; Zhiyi, l.; Bai, S.; Huang, T.; Wang, J.; Xie, H.; Zeng, D.; Luo, L. Effect of various aging treatment on thermal stability of a novel Al-Zn-Mg-Cu alloy for oil drilling. Mater. Sci. Eng. A 2021, 803, 140490. [Google Scholar] [CrossRef]
  6. Wang, Y.-c.; Wu, X.-d.; Yue, L.; Guo, M.-x.; Cao, L.-f. Aging precipitation behavior and properties of Al–Zn–Mg–Cu–Zr–Er alloy at different quenching rates. Trans. Nonferrous Met. Soc. China 2022, 32, 1070–1082. [Google Scholar] [CrossRef]
  7. Martin, J.H.; Yahata, B.D.; Hundley, J.M.; Mayer, J.A.; Schaedler, T.A.; Pollock, T.M. 3D printing of high-strength aluminium alloys. Nature 2017, 549, 365–369. [Google Scholar] [CrossRef]
  8. Li, D.; Zhang, Z.; Li, S.; Yang, J.; Zhang, S.; Bian, X.; Zhang, Y.; Qi, L.; Ojo, O.A. Microstructure, mechanical properties and fatigue crack growth behavior of an Al-Zn-Mg-Cu-Si-Zr-Er alloy fabricated by laser powder bed fusion. Int. J. Fatigue 2023, 172, 107636. [Google Scholar] [CrossRef]
  9. Li, B.; Pan, Q.; Yin, Z. Characterization of hot deformation behavior of as-homogenized Al–Cu–Li–Sc–Zr alloy using processing maps. Mater. Sci. Eng. A 2014, 614, 199–206. [Google Scholar] [CrossRef]
  10. Rong, Z.; Wu, X.; He, F.; Wen, S.; Xiong, X.; Gao, K.; Wei, W.; Huang, H.; Nie, Z. Hot deformation behavior, dynamic recrystallization and precipitation behavior of a novel Er, Zr-microalloyed Al–Cu–Mg alloy. J. Mater. Res. Technol. 2025, 36, 5381–5395. [Google Scholar] [CrossRef]
  11. Jiang, F.; Zhang, H.; Li, L.; Chen, J. The kinetics of dynamic and static softening during multistage hot deformation of 7150 aluminum alloy. Mater. Sci. Eng. A 2012, 552, 269–275. [Google Scholar] [CrossRef]
  12. Tang, J.; Zhang, H.; Teng, J.; Fu, D.; Jiang, F. Effect of Zn content on the static softening behavior and kinetics of Al–Zn–Mg–Cu alloys during double-stage hot deformation. J. Alloy. Compd. 2019, 806, 1081–1096. [Google Scholar] [CrossRef]
  13. Hong, L.; Wu, X.; Xiong, X.; Gao, K.; Wen, S.; Wei, W.; Rong, L.; Huang, H.; Nie, Z.; Dong, Y.; et al. Study of dynamic recrystallization behavior of Al-Zn-Mg-Cu-Er-Zr alloy during isothermal compression. J. Mater. Res. Technol. 2025, 34, 1399–1409. [Google Scholar] [CrossRef]
  14. Cheng, Z.; Zhang, C.; Chu, G.; Liu, Z.; Wang, K.; Meng, Z.; Chen, L.; Sun, L.; Zhao, G. Dynamic precipitation and recrystallization behavior during hot deformation of Al-Zn-Mg-Cu alloy: Experiment and modeling. Int. J. Plast. 2024, 178, 103995. [Google Scholar] [CrossRef]
  15. Wang, H.; Qin, G.; Li, C.; Liang, G. Effect of deformation parameters and Al2Cu evolution on dynamic recrystallization of 2219-O Al alloy during hot compression. J. Mater. Res. Technol. 2023, 26, 4093–4106. [Google Scholar] [CrossRef]
  16. Xu, C.; Huang, J.; Jiang, F.; Jiang, Y. Dynamic recrystallization and precipitation behavior of a novel Sc, Zr alloyed Al-Zn-Mg-Cu alloy during hot deformation. Mater. Charact. 2022, 183, 111629. [Google Scholar] [CrossRef]
  17. Feng, D.; Zhang, X.M.; Liu, S.D.; Deng, Y.L. Constitutive equation and hot deformation behavior of homogenized Al-7.68Zn-2.12Mg-1.98Cu-0.12Zr alloy during compression at elevated temperature. Mater. Sci. Eng. A 2014, 608, 63–72. [Google Scholar] [CrossRef]
  18. Lu, B.; Li, Y.; Yu, W.; Wang, H.; Wang, Y.; Wang, Z.; Xu, G. Strength and ductility enhancement of twin-roll cast Al-Zn-Mg-Cu alloys with high solidification intervals through a synergistic segregation-controlling strategy. J. Mater. Sci. Technol. 2023, 142, 225–239. [Google Scholar] [CrossRef]
  19. Wu, M.; Xiao, D.; Yuan, S.; Li, Z.; Yin, X.; Wang, J.; Huang, L.; Liu, W. Synergy of strength-ductility in a novel Al-Zn-Mg-Cu-Zr-Sc-Hf alloy through optimizing hierarchical microstructures. J. Mater. Sci. Technol. 2025, 212, 105–122. [Google Scholar] [CrossRef]
  20. Zhang, J.; Yi, Y.; Huang, S.; Mao, X.; He, H.; Tang, J.; Guo, W.; Dong, F. Dynamic recrystallization mechanisms of 2195 aluminum alloy during medium/high temperature compression deformation. Mater. Sci. Eng. A 2021, 804, 140650. [Google Scholar] [CrossRef]
  21. Li, J.; Wu, X.; Cao, L.; Liao, B.; Wang, Y.; Liu, Q. Hot deformation and dynamic recrystallization in Al-Mg-Si alloy. Mater. Charact. 2021, 173, 110976. [Google Scholar] [CrossRef]
  22. Anand, L. Constitutive equations for hot-working of metals. Int. J. Plast. 1985, 1, 213–231. [Google Scholar] [CrossRef]
  23. Hou, H.; Zhao, G.; Yu, J.; Wei, D. A unified physically-based model describing complex unloading behavior in cold and hot deformation process of aluminum alloys. Eur. J. Mech. A-Solids 2024, 105, 105266. [Google Scholar] [CrossRef]
  24. Sellars, C.M.; McTegart, W.J. On the mechanism of hot deformation. Acta Metall. 1966, 14, 1136–1138. [Google Scholar] [CrossRef]
  25. Mann, J.B.; Chandrasekar, S.; Compton, W.D.; Trumble, K.P.; Saldana, C.; Swaminathan, S.; John, G.E.; Moscoso, W.; Murthy, T.G. 7—Severe plastic deformation and the production of nanostructured alloys by machining. In Nanostructured Metals and Alloys; Whang, S.H., Ed.; Woodhead Publishing: Cambridge, UK, 2011; pp. 178–210. [Google Scholar]
  26. Prasad, Y.V.R.K.; Gegel, H.L.; Doraivelu, S.M.; Malas, J.C.; Morgan, J.T.; Lark, K.A.; Barker, D.R. Modeling of dynamic material behavior in hot deformation: Forging of Ti-6242. Metall. Trans. A 1984, 15, 1883–1892. [Google Scholar] [CrossRef]
  27. Wei, D.; Han, L.; Lv, Z.; Wang, G.; Zhao, G. Investigation of constitutive models and microstructure evolution during hot deformation and solution treatment of Al–Zn–Mg–Cu alloy. J. Mater. Res. Technol. 2024, 32, 1028–1045. [Google Scholar] [CrossRef]
  28. Chen, G.; Chen, W.; Ma, L.; Guo, A.; Lü, J.; Zhang, Z.; Zheng, S. Strain-Compensated Arrhenius-Type Constitutive Model for Flow Behavior of Al-12Zn-2.4Mg-1.2Cu Alloy. Rare Metal Mat. Eng. 2015, 44, 2120–2125. [Google Scholar]
  29. Tang, J.; Jiang, F.; Luo, C.; Bo, G.; Chen, K.; Teng, J.; Fu, D.; Zhang, H. Integrated physically based modeling for the multiple static softening mechanisms following multi-stage hot deformation in Al-Zn-Mg-Cu alloys. Int. J. Plast. 2020, 134, 102809. [Google Scholar] [CrossRef]
  30. Yue, X.-h.; Liu, C.-f.; Liu, H.-h.; Xiao, S.-f.; Tang, Z.-h.; Tang, T. Effects of hot compression deformation temperature on the microstructure and properties of Al–Zr–La alloys. Int. J. Miner. Metall. Mater. 2018, 25, 236–243. [Google Scholar] [CrossRef]
  31. Huang, K.; Logé, R.E. A review of dynamic recrystallization phenomena in metallic materials. Mater. Des. 2016, 111, 548–574. [Google Scholar] [CrossRef]
  32. Ebrahimi, R.; Najafizadeh, A. A new method for evaluation of friction in bulk metal forming. J. Mater. Process. Technol. 2004, 152, 136–143. [Google Scholar] [CrossRef]
  33. Sellars, C.M.; Tegart, W.J. Hot workability. Int. Metall. Rev. 1972, 17, 1–24. [Google Scholar] [CrossRef]
  34. McQueen, H.J.; Yue, S.; Ryan, N.D.; Fry, E. Hot working characteristics of steels in austenitic state. J. Mater. Process. Technol. 1995, 53, 293–310. [Google Scholar] [CrossRef]
  35. Zener, C.; Hollomon, J.H. Effect of Strain Rate Upon Plastic Flow of Steel. J. Appl. Phys. 1944, 15, 22–32. [Google Scholar] [CrossRef]
  36. Gegel, H.L.; Malas, J.C.; Doraivelu, S.M. Process Modeling of P/M Extrusion. In Innovations in Materials Processing; Bruggeman, G., Weiss, V., Eds.; Springer: Boston, MA, USA, 1985; pp. 137–159. [Google Scholar]
  37. Liu, C.; Liu, Y.; Huang, Y.; Sheng, Z.; Fan, X.; Wu, Z.; Feng, W.; Liu, P. Investigation of hot deformation behavior and optimization of hot workability for a novel Zr, Sc alloyed Al-Mg-Mn alloy. J. Alloy. Compd. 2025, 1017, 178943. [Google Scholar] [CrossRef]
  38. Wu, H.; Wen, S.P.; Huang, H.; Gao, K.Y.; Wu, X.L.; Wang, W.; Nie, Z.R. Hot deformation behavior and processing map of a new type Al-Zn-Mg-Er-Zr alloy. J. Alloy. Compd. 2016, 685, 869–880. [Google Scholar] [CrossRef]
  39. Dai, Y.; Yan, L.; Sun, S.; Zhang, J.; Li, X.; Liu, J.; Liu, X. In-depth investigation of microstructural evolution induced by Sc, V, and Ni microalloying in Al-Zn-Mg-Cu alloy during hot compression. Mater. Des. 2025, 253, 113857. [Google Scholar] [CrossRef]
  40. Jagan Reddy, G.; Srinivasan, N.; Gokhale, A.A.; Kashyap, B.P. Processing map for hot working of spray formed and hot isostatically pressed Al–Li alloy (UL40). J. Mater. Process. Technol. 2009, 209, 5964–5972. [Google Scholar] [CrossRef]
  41. Tang, J.; Yi, Y.; He, H.; Huang, S.; Zhang, J.; Dong, F. Hot deformation behavior and microstructural evolution of the Al-Cu-Li alloy: A study with processing map. J. Alloy. Compd. 2023, 934, 167755. [Google Scholar] [CrossRef]
  42. Kulkarni, S.S.; Starke, E.A.; Kuhlmann-Wilsdorf, D. Some observations on deformation banding and correlated microstructures of two aluminum alloys compressed at different temperatures and strain rates. Acta Mater. 1998, 46, 5283–5301. [Google Scholar] [CrossRef]
Figure 1. (a) Experimental heating curve; (b) sample cutting position.
Metals 15 00725 g001
Figure 2. True stress–true strain curves at different temperatures: (a) ε ˙ = 0.001 s−1, (b) ε ˙ = 0.01 s−1, (c) ε ˙ = 0.1 s−1, (d) ε ˙ = 1 s−1, (e) ε ˙ = 10 s−1.
Metals 15 00725 g002
Figure 3. True strain of 0.6: ( a )   ln ε ˙ ln σ fitting curve, (b) ln ε ˙ σ fitting curve, (c) ln ε ˙ ln sin h a σ fitting curve, (d) ln ε ˙ ln sin h α σ fitting curve.
Metals 15 00725 g003
Figure 4. The linear fitting of lnZ and ln[sinh(ασ)].
Metals 15 00725 g004
Figure 5. The polynomial fitting curves of strain for the parameters: (a) β, (b) α, (c) n, (d) Q, (e) lnA.
Metals 15 00725 g005
Figure 6. Experimental and predicted values: (a) ε ˙ = 0.001 s−1, (b) ε ˙ = 0.01 s−1, (c) ε ˙ = 0.1 s−1, (d) ε ˙ = 1 s−1, (e) ε ˙ = 10 s−1.
Metals 15 00725 g006
Figure 7. The fitting relationship between experimental and predicted values.
Metals 15 00725 g007
Figure 8. Hot processing maps: (a) ε = 0.2, (b) ε = 0.5, (c) ε = 0.6: safe zone A, instability zone B and instability zone C.
Metals 15 00725 g008
Figure 9. SEM image of the alloy at a true strain of 0.6: (a) safe zone A, (b) instability zone B, (c) instability zone C.
Metals 15 00725 g009
Figure 10. Inverse pole figure maps, grain boundaries maps, and grain orientation spread: (ac) safe zone A, (df) instability zone B, (gi) instability zone C.
Metals 15 00725 g010
Table 1. The chemical composition of laboratory 7E97 aluminum alloy (wt.%).
ElementZnMgCuMnErZrFeSiAl
7.622.220.900.300.090.130.090.03Bal.
Table 2. LnZ values of 7E97 alloy under different deformation conditions.
lnZ300 °C340 °C380 °C420 °C460 °C
0.001 s−121.319.417.816.415.1
0.01 s−123.621.820.118.717.4
0.1 s−125.924.122.421.019.7
1 s−128.226.424.723.322.0
10 s−130.528.7 27.025.624.3
Table 3. Material parameters.
Material Parameters β (MPa−1) α (MPa−1)nA (s−1)Q (kJ/mol)
0.1140.0165.07151.538 × 109134.357
Table 4. The polynomial fitting coefficient of strain for the parameters α, β, n, lnA, and Q.
Material Parameters α β nlnAQ
B00.02490.14275.19744.612256.3937
B1−0.3073−0.68309.6117430.66761764.1733
B23.93196.2542−215.2027−4977.5198−19,320.1369
B3−24.7165−34.12831496.447929,133.3694108,846.2525
B484.9971113.6882−5050.3063−95,321.0135−346,403.1307
B5−163.1830−222.48119066.2437177,382.1859633,407.3081
B6164.1890232.9456−8320.1573−175,528.1019−621,247.6001
B7−67.4343−100.03443074.323571,696.2367253,232.2171
Disclaimer/Publisher’s Note: The statements, opinions and data contained in all publications are solely those of the individual author(s) and contributor(s) and not of MDPI and/or the editor(s). MDPI and/or the editor(s) disclaim responsibility for any injury to people or property resulting from any ideas, methods, instructions or products referred to in the content.

