Article

A New Insight into the Electronic Structure Property Relationships in Glassy Ti-Zr-Nb-(Cu,Ni,Co) Alloys

1
Department of Physics, Faculty of Science, University of Zagreb, Bijenička Cesta 32, 10000 Zagreb, Croatia
2
Institute of Physics, Bijenička Cesta 46, 10000 Zagreb, Croatia
3
Instituto de Investigaciones en Materiales, Universidad Nacional Autónoma de México (UNAM), Circuito Exterior s/n, Cd. Universitaria, Ciudad de México 04510, Mexico
*
Author to whom correspondence should be addressed.
Metals 2025, 15(7), 719; https://doi.org/10.3390/met15070719
Submission received: 23 May 2025 / Revised: 24 June 2025 / Accepted: 25 June 2025 / Published: 27 June 2025
(This article belongs to the Special Issue Manufacture, Properties and Applications of Light Alloys)

Abstract

In this work we revisit a vast amount of existing data on physical properties of Ti-Zr-Nb-(Cu,Ni,Co) glassy alloys over a broad range of concentrations (from the high-entropy range to that of conventional Cu-, Ni- or Co-rich alloys). By using our new approach based on the total content of late transition metal(s), we derive a number of physical parameters of a hypothetical amorphous TiZrNb alloy: lattice parameter a = ( 3.42 ± 0.02 ) Å, Sommerfeld coefficient γ = 6.2 mJ/mol K 2 , density of states at N ( E F ) = 2.6 ( at eV ) 1 , magnetic susceptibility ( 2.00 ± 0.05 ) mJ/ T 2 mol, superconducting transition temperature T c = ( 8 ± 1 ) K, upper critical field μ 0 H c 2 ( 0 ) = ( 20 ± 5 ) T, and coherence length ξ ( 0 ) = ( 40 ± 3 ) Å. We show that our extrapolated results for the amorphous TiZrNb alloy would be similar to that of crystalline TiZrNb, except for superconducting properties (most notably the upper critical field H c 2 ( 0 ) ), which might be attributed to the strong topological disorder of the amorphous phase. Also, we offer an explanation of the discrepancy between the variations in T c with the average number of valency electrons in neighboring alloys of 4d transition metals and some high-entropy alloys. Overall, we find that our novel method of systematic analysis of results is rather general, as it can provide reliable estimates of the properties of any alloy which has not been prepared as yet.

1. Introduction

In order to speed up the discovery of metallic alloys with novel advanced properties, a new alloy design based on multi-principal element solid solutions was introduced at the beginning of this century [1]. This alloy design was first applied to approximately equiatomic alloys of early (refractory)-late (TE-TL) transition metal alloys [2,3,4,5] in an attempt to discover new bulk metallic glasses (BMG) with enhanced glass-forming ability (GFA) [6]. A big advantage of this approach to fabrication of alloys, compared to the conventional one (based on one or two principal elements), is that it explores the middle section of the multicomponent phase diagrams, thus allowing for an enormous number of new alloys and compounds available for research and potential applications. Accordingly, this alloy design soon expanded to crystalline approximately equiatomic alloys with five or more principal components [7,8] (so-called high-entropy alloys, HEA [8], which are now a part of a broader family of compositionally complex alloys, CCA [5], which include the non-equiatomic alloys as well as those with fewer—three or more—principal components) and then to intermetallic and ceramic compounds, becoming a forefront of research in material science [1]. However, a huge number of possible CCA compositions makes it very difficult to select the alloys with desirable properties. The solutions of this problem are mainly sought by theoretical simulations and sometimes in high-throughput experimental research such as that using thin films with continuously varying concentrations of the constituent elements [5]. Here, we propose a novel experimental approach to this problem in CCAs which is based on using the extrapolation and/or interpolation of the data for the existing alloys to the composition(s) which have not been studied so far (or cannot be prepared in the desired phase). We illustrate the applicability of this approach by using systematic results for physical properties for quinary TE-TL glassy alloys.
Despite an early start [2,3,4], the research on TE-TL CCAs (so-called non-linear alloys in Ref. [1]), both crystalline and amorphous (a-CCA), has progressed much less than that of CCAs composed mostly from the iron group of 3d elements or refractory metals [1,9,10,11,12,13,14,15,16,17,18]. This is especially true for high-entropy metallic glasses (HEMG) which are still regarded as a new research field [19,20]. Despite modest research, TE-TL HEAs have shown some remarkable functional properties, including shape memory [21,22,23,24,25] and thermoelectric performance [26], hydrogen storage capacity [27,28], catalytic activity [29,30], biomedical applications [31,32,33], electrical and superconducting performance [34,35,36], and some other desirable properties [37], but so far have found no practical applications, unlike those of a similar BMG [38]. In addition to properties relevant to potential applications, both TE-TL CCAs and conventional alloys show some features which are of considerable conceptual importance, as outlined below:
(i)
Several TE-TL CCAs [39,40,41,42,43,44] and many conventional TE-TL alloys (e.g., [45,46,47]) can be prepared in both the amorphous and crystalline states depending on the cooling rate of the molten alloys. Thus, the study of alloys sharing this property could help to disentangle the role of topological and chemical disorder in forming their properties. Moreover, the study of these alloys elucidated the variation in GFA with composition in conventional TE-TL alloys [46,47].
(ii)
All TE-TL alloys show the split-band structure of the electronic density of states (DOS) within the valence band (VB) [39,43,48,49,50,51]. The DOS close to the Fermi level E F is dominated by d-electrons of TEs, whereas d-electrons of TLs are situated at higher binding energies, E B [52]. This results in a simple, often linear, variation in the DOS at E F , N ( E F ) , with TL content over a considerable range of TL concentrations, which is reflected in similarly simple variations in physical properties closely related to N ( E F ) (e.g., [39,52,53]). Furthermore, the position of E B and the width of the TL d-subbands depend on the TL content [52]. This results in band crossing (the transition from TE- to TL-dominated N ( E F ) ), which strongly affects the physical properties of TE-TL alloys [39,52,54,55,56,57]. However, the split-band structure of the DOS makes the average number of valence electrons per atom (VEC) a poor approximation of the electronic structure (ES) of TE-TL alloys [52,58].
(iii)
Many TE-TL alloys can be prepared by simple melt-spinning into a glassy state for TL concentrations 20–70% [53,59]. Such a broad glass-forming range (GFR) facilitates a comparison between the models and experiment in binary alloys [60,61,62,63,64], and in corresponding multiprincipal element alloys it enables the study of the transition from a-HEAs to conventional metallic glasses with the same chemical make up [39,52,54,57,65,66,67,68,69]. Simultaneously, a broad GFR and simple, often linear variations in properties with composition enable a reliable extrapolation of the results for alloys to those of hypothetical pure amorphous TEs and TLs [39,53,63,64,66,67,68,69,70,71,72,73]. This method has been used in order to gain some insight into the properties of a pure amorphous Ti, Zr, Hf, and Cu which have not been obtained in an amorphous state so far [74]. We note that the method of accessing the properties of a pure amorphous element from the extrapolation of the results for its alloys is advantageous even in cases when this element has been obtained in the amorphous phase. Namely, very high cooling rates R c 10 12 K/s required to produce pure amorphous element results in the samples which are too small for measurement of any property other than the atomic structure [74]. Further, such a high R c is likely to have a strong effect on the structure of an amorphous metal, which will differ from that obtained at lower R c .
The same method, studying the class of physical property dependence on conveniently chosen parameters, can also be applied to obtain information about alloys which have not been obtained in an amorphous phase so far. Here, we employ this method in order to obtain the physical properties of a hypothetical amorphous TiZrNb refractory alloy from the novel type of analysis of the results for glassy Ti-Zr-Nb-(Cu,Ni,Co) alloys [39,54,57,66,67,68,69]. Our analysis involves extrapolations of the variations in physical properties with the total content of TLs, denoted by x tot , and the use of nonlinear representations of these variations when appropriate. We compare the properties of the amorphous TiZrNb alloy with those of the same alloy in the crystalline phase with body-centered cubic structure [75]. The TiZrNb alloy is very important since it forms the basis for the majority of refractory HEAs and superalloys [76]. This alloy is also a very promising biomedical material [77]. In biomedical applications, the amorphous phase of this alloy would outperform the crystalline one due to its higher strength and hardness, and lower corrosion and wear. (However, the possible limited glass-forming ability of these alloys may present a problem for some biomedical applications.) Indeed, we will show that while most of the derived properties of the glassy TiZrNb alloy seem to be similar to its crystalline counterpart (which is probably due to similar local atomic arrangements and thus ES in two phases), some of its transport and superconducting properties, important for application, seem probably better [75,78].
We note that the application of the method employed in our study of the properties of the hypothetical TiZrNb glassy alloy is not limited to amorphous systems only, and can be applied equally well to crystalline alloy systems. As an example, we note that the properties of Fe–rich ( CrMnCoNi ) 1 x Fe x alloys with the single face-centered cubic structure, fcc, which cannot be synthesized with standard metallurgical methods for x > 0.5 [79], can be determined from the extrapolation of results for x 0.5 to x > 0.5 .

2. Experimental Details

The materials, methods of preparation, and characterization of the samples and the techniques of the measurements used for Ti-Zr-Nb-(Cu,Ni,Co) glassy alloys were reported earlier [39,52,54,57,66,67,69]. For completeness, we briefly review some of these issues.
The ingots weighing about a gram of seven ( TiZrNbCu ) 1 x Co x alloys ( x = 0 , 0.19, 0.20, 0.25, 0.32, 0.43, and 0.50 [69]), ten ( TiZrNbNi ) 1 x Cu x alloys ( x = 0 , 0.05, 0.12, 0.15, 0.20, 0.25, 0.32, 0.35, 0.43, and 0.50 [67]), and eight ( TiZrNbCu ) 1 x Ni x alloys ( x = 0 , 0.125, 0.15, 0.2, 0.25, 0.35, 0.43, and 0.50 [66]) were prepared from high-purity metals ( 99.8 at.%) by arc melting in high-purity argon and in the presence of a titanium obtainer. From ingots, thin ribbons with a thickness of about 25 μm and a width of 2 mm were prepared by melt spinning molten alloys on the surface of the cooper roller rotating at 25 m/s in a pure helium atmosphere. The X-ray diffraction (XRD) patterns with Cu-K α radiation showed that all samples, except those with x = 0 Co and x = 0.50 Co, were X-ray amorphous [66,67,69]. The amorphous samples were further characterized with differential scanning calorimetry and thermogravimetric analysis which provided the thermal parameters and confirmed the amorphous state of as-cast samples [39,66,67,69]. The chemical characterization (scanning electron microscopy with energy dispersive spectroscopy (SEM/EDS)) confirmed a random distribution of constituent elements down to a micrometer scale, and the calculated average concentrations were within 1 at.% of the nominal ones [66,67,68].
We briefly revisit the measurements of the properties which will be used for the determination of the corresponding properties of the amorphous TiZrNb alloy. The magnetic susceptibility of all alloys was measured with a Quantum Design magnetometer, MPMS 5, in a magnetic field B up to 5 T and the temperature range 2 300 K [66,67,69]. Since the magnetic susceptibility of all alloys, except for that with x = 0.5 Co, showed a weak dependence on temperature (as is usual for nonmagnetic TE-TL alloys, e.g., [53,58,66,67,69]) we use the room temperature values in the following analysis. The measurements of the low-temperature specific heat, LTSH on ( TiZrNbCu ) 1 x Ni x and ( TiZrNbNi ) 1 x Cu x alloys, and TiZrNbCuCo sample were performed in the temperature range 1.8 300 K using a Physical Property Measurement System, PPMS Model 5000 from Quantum Design, as described in more detail elsewhere [65,66,67,69].
The low-temperature resistive superconducting transition measurements down to 300 mK were performed in a He 3 insert (Heliox, Oxford Instruments, United Kingdom) of a 16 / 18 T Oxford superconducting magnet system, in the magnetic fields up to ± 4 T. The electrical resistivity was measured using a low frequency ( 22 Hz) AC method with rms currents in the 20 200 μA range, while voltages were measured with a dual-phase Signal Recovery 5120 Lock-in amplifier. The magnetic field was oriented perpendicular to the broad surface of the ribbon samples and to the current direction. The temperature was measured with a Lake Shore 340 Temperature Controller, Westerville, OH, USA with a calibrated Cernox thermometer situated close to the sample [54,57,73].

3. Results and Discussion

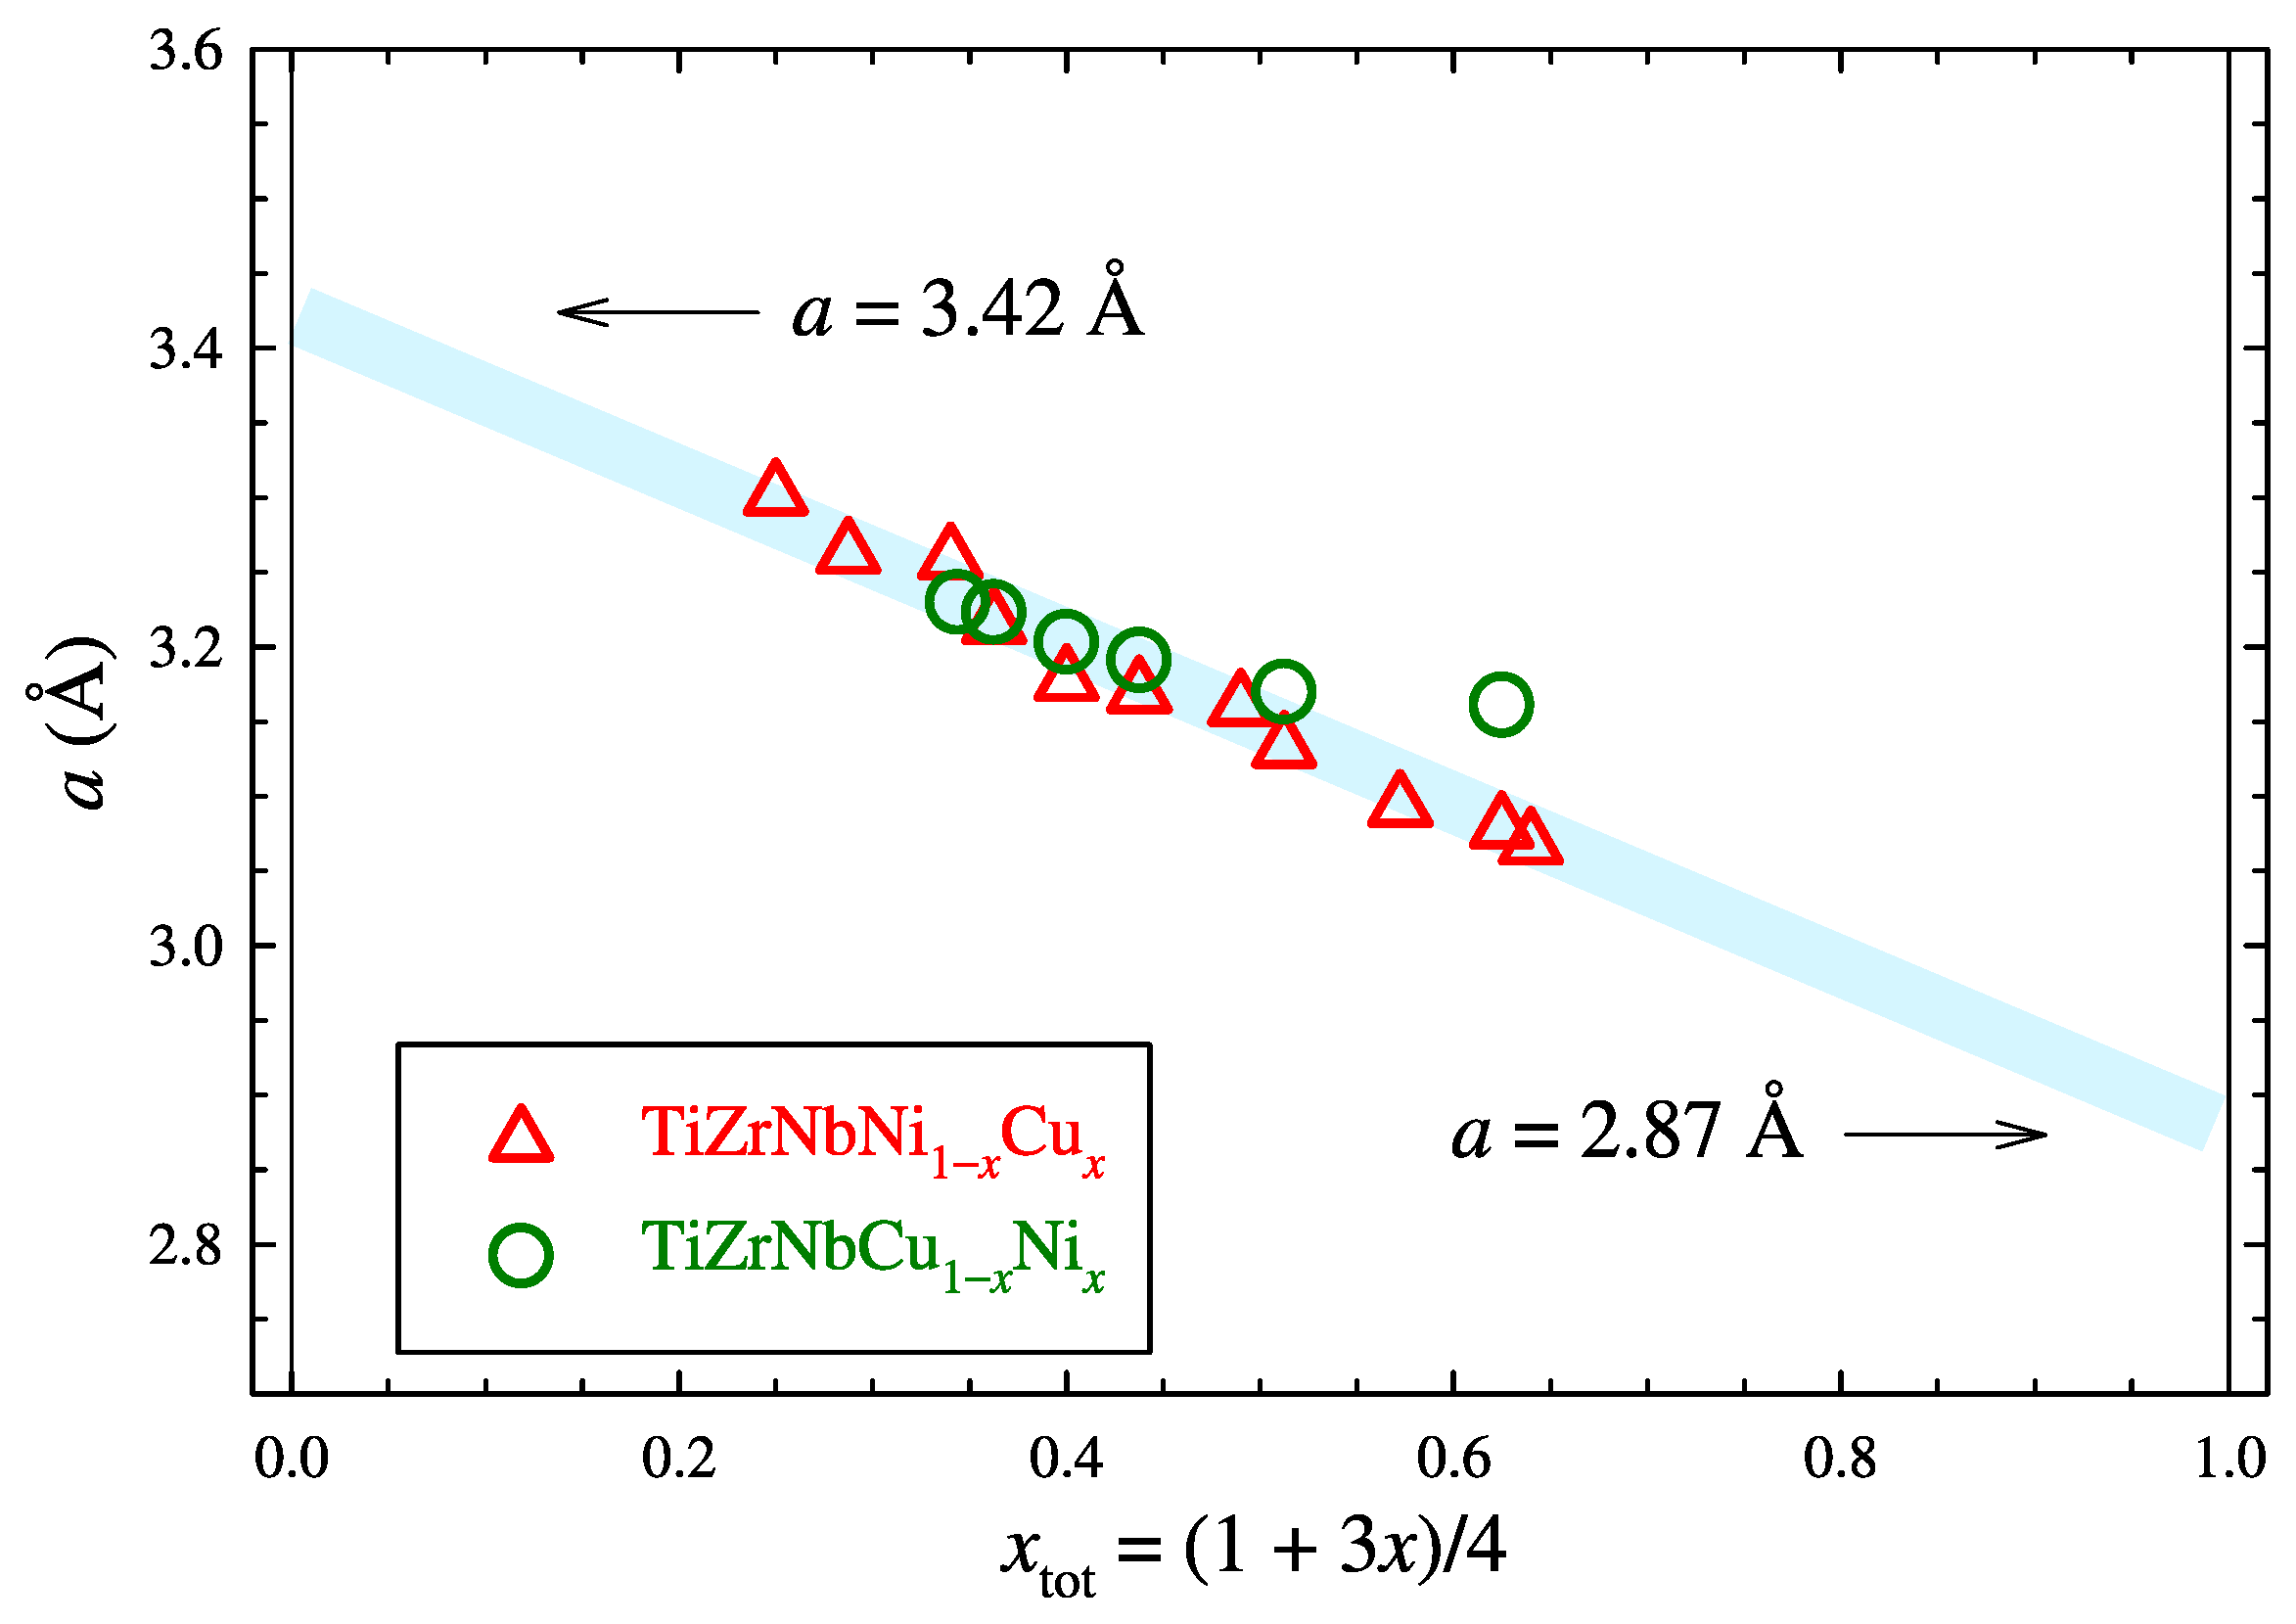
3.1. Lattice Parameters a
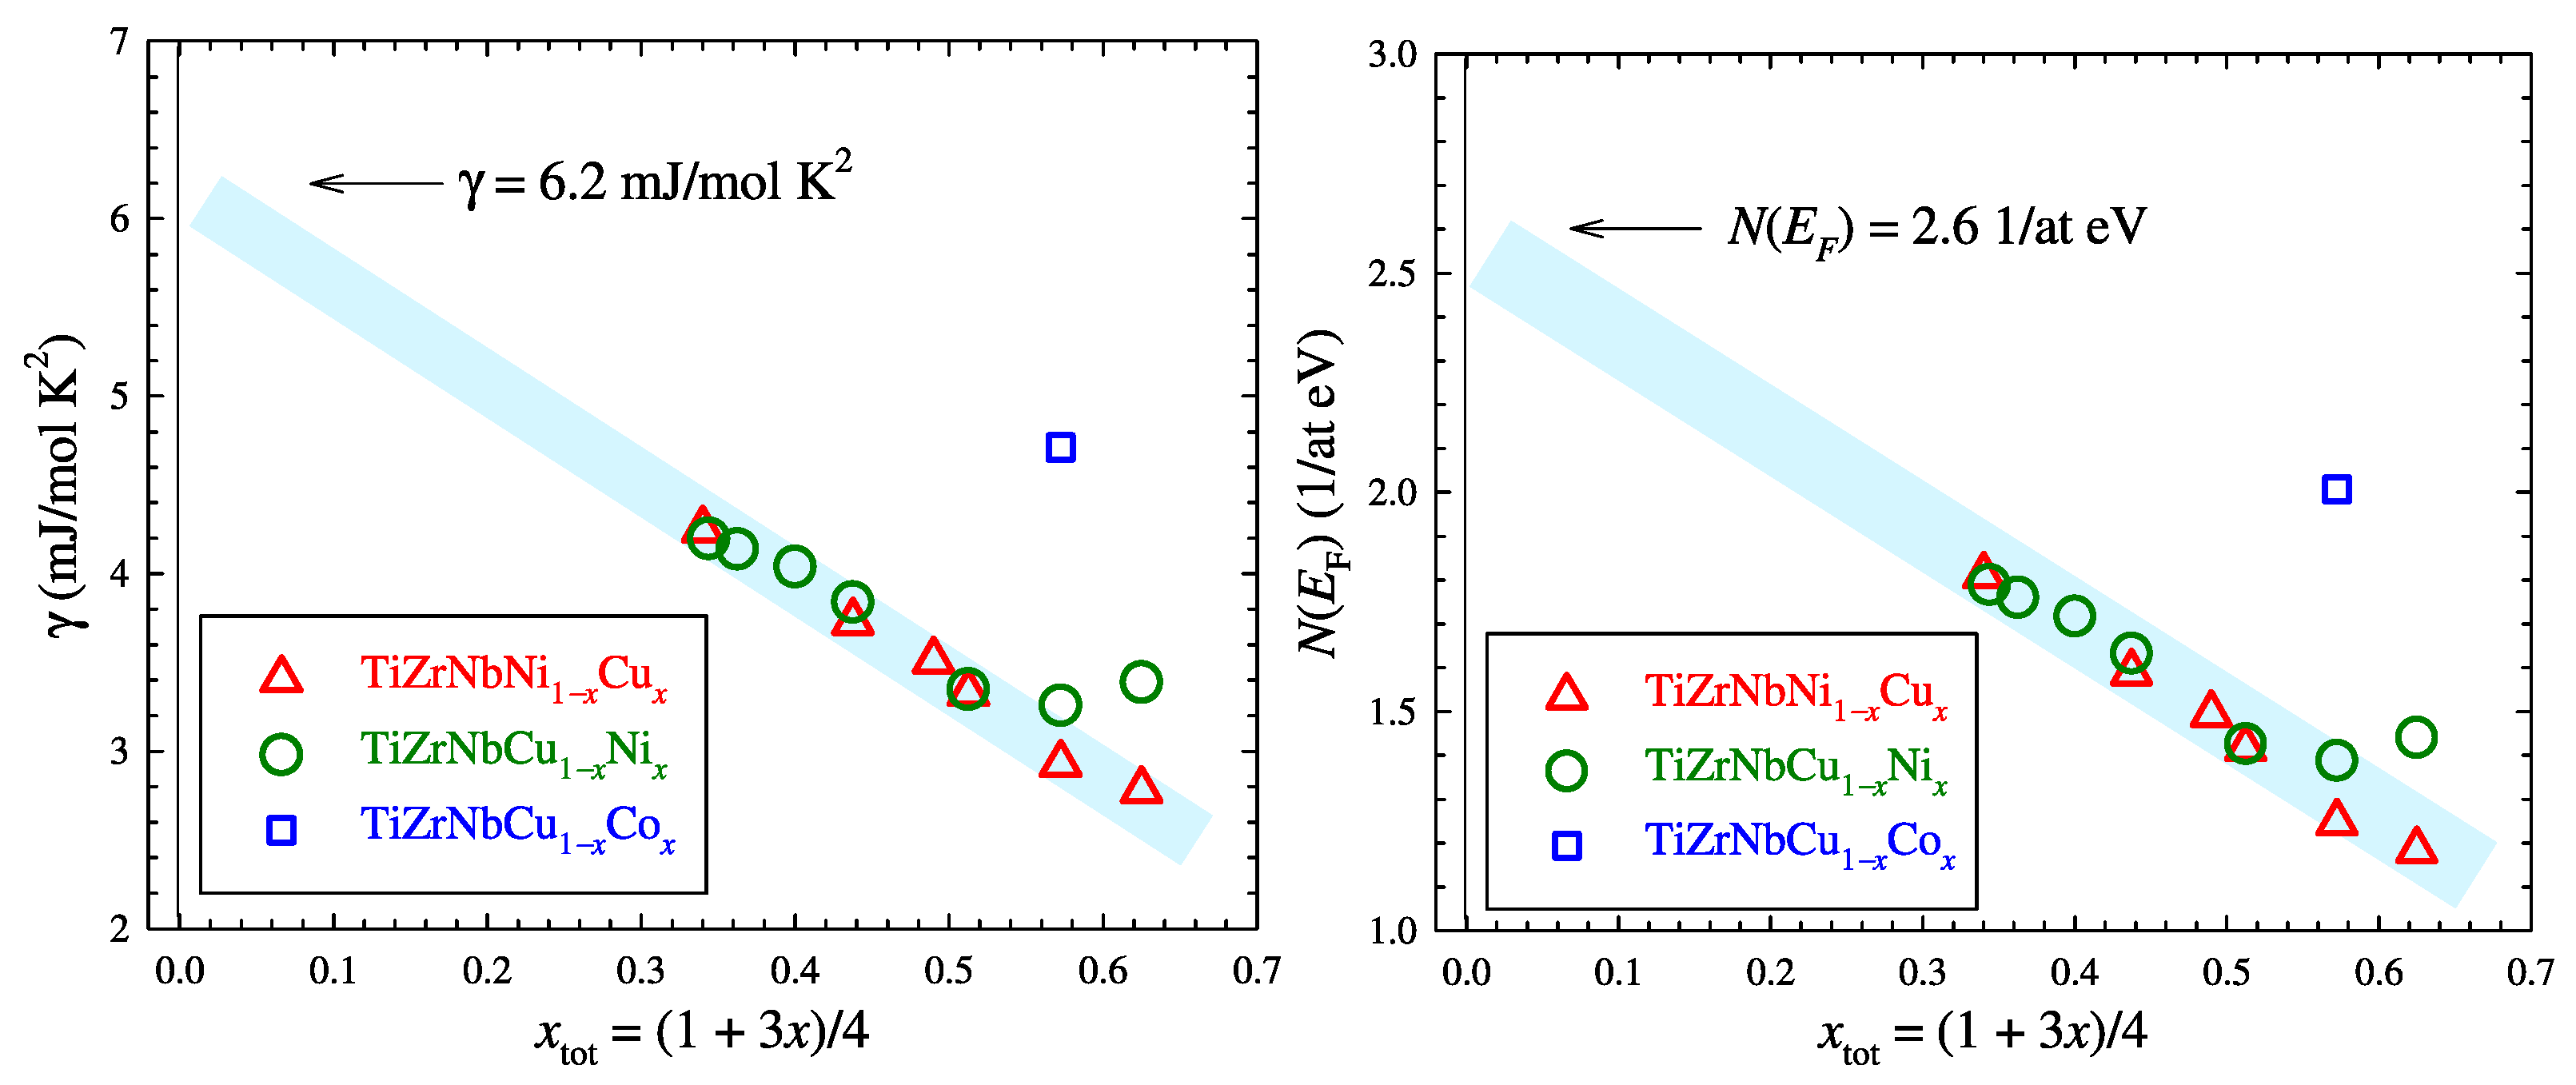
The atomic structure of Ti-Zr-Nb-(Cu,Ni,Co) glassy alloys has been investigated in some detail, both by XRD patterns with a Cu-K α source and the synchrotron based high-energy X-ray diffraction (HEXRD) at the Diamond Light Source with a monochromatic beam of 0.01545 nm wavelength [39,66,67,69]. There is a quite good, quantitative, agreement between the average near neighbor atomic distances, d, determined from the XRD patterns by using the approximate Guinier expression [80]
d = 7.73 k p ,
where k p is the modulus of the scattering vector corresponding to the first maximum in the diffraction pattern, and those from the positions of the first maxima of the radial distribution functions R ( r ) obtained form the HEXRD measurements [39,66,67,69].
A large difference between the atomic radii of the employed TE and TL elements of Ti-Zr-Nb-(Cu,Ni,Co) alloys and their strong interatomic interactions are expected to result in bcc-like local atomic arrangements [39,65,67,69] resembling those in similar crystalline TE-TL HEAs and CCAs [21,25,39,40,41,42,43,44]. (This conjecture is supported with the appearance of a dominant bcc phase in bulk crystalline ( TiZrNbCu ) 1 x Ni x samples with x 0.2 [40] and the observation of a bcc phase upon crystallization of our glassy sample with x = 0.125 [39]). We note that the values of the mixing enthalpy, Δ H mix = 2.35 kJ/mol and atomic size misfit, δ = 6.35 , place the TiZrNb alloy in the single solid solution part (with a bcc crystalline structure) of a plot commonly employed to classify HEAs and CCAs [13]. Thus, the preparation of the glassy TiZrNb alloy may be quite complex. Assuming a bcc-like local atomic structure, we estimated the corresponding lattice parameters a = 2 d / 3 0.5 for all our alloys [39,65,66,67,68,69]. These estimated values of a agreed quite well with those calculated from the lattice parameters for the bcc phases of constituents by assuming the validity of Vegard’s law, except for the alloy with x = 0.5 Ni and some Co-containing alloys [39,66,69]. (The estimated values were, however, a little larger than corresponding values calculated using Vegard’s law probably due to somewhat less dense atomic packaging in the amorphous state [39,65,66,67,68,69]). The observed deviations of a from a linear Vegard’s law-like variation with TL content in 0.5 Ni, and some Co-containing alloys were accompanied with an increase in the average number of the nearest neighbor atoms (calculated from R ( r ) ) and are associated with the band crossing [52] as confirmed by the rapid change in the Hall coefficient in these alloys [54,57]. To our knowledge, this was the first observation of the effect of band crossing on the interatomic distance and the local atomic configuration.
As seen in Figure 1, the values of a of all ( TiZrNbNi ) 1 x Cu x and ( TiZrNbCu ) 1 x Ni x glassy alloys (except for that with x = 0.5 Ni) decrease linearly with total content of Cu and Ni, x tot = ( 1 + 3 x ) / 4 , where x tot is total concentration of late transition metal(s) Cu and Ni. This variation extrapolates to a = ( 3.42 ± 0.02 ) Å for x tot = 0 , i.e., the amorphous TiZrNb alloy. The estimated value of a of the amorphous TiZrNb alloy is about 0.5 % larger than that of the bcc phase of the corresponding crystalline alloy ( a = 3.404 Å in Ref. [75]). As explained above, somewhat larger d (hence also a) in an amorphous alloy is expected due to somewhat less dense atomic packing in the amorphous phase.
The representation of the composition dependence of the structure of an alloy in terms of the average atomic volume, V a , has some advantage compared to that using a [53,63,66,67,68,69]. In the bcc structure, V a = a 3 / 2 , which yields V a = ( 20.00 ± 0.35 ) Å 3 for the average atomic volume in the amorphous TiZrNb alloy. This value is as expected a little larger than that of the crystalline TiZrNb, V a = 19.72 Å 3 . One advantage of using V a instead of a, is that V a can be independently determined from the measured mass density D without any prior assumption about the atomic structure of the alloys [53,63]:
V a = 1.66 M a / D ,
where M a is the composition-averaged molar mass of the alloy. (We note that knowledge of V a is necessary to determine the average local atomic packing fraction in an alloy [53,63,66,67,69]). The expression (2) can also be used in order to determine the D of an alloy from the known V a and M a . From V a = 20.00 Å 3 and M a = 77.33 g/mol, we obtain D = ( 6.42 ± 0.12 ) g/ cm 3 for the amorphous TiZrNb alloy, which is considerably lower than that reported for crystalline TiZrNb ( 6.63 g/ cm 3 , [75]). We note, however, that the TiZrNb alloy studied in Ref. [75] was somewhat non-equiatomic with some excess of Nb and deficiency of Ti. There is also a discrepancy between the value of D reported in [75], and that calculated using Equation (2), D = 6.51 g/ cm 3 , which may indicate some error in the measurement of D in [75]. Since the variation in a in Figure 1 is dominated with the results for ( TiZrNbNi ) 1 x Cu x alloys, which showed the ideal solution behaviour extrapolating to the value for pure Cu for x = 1 , we expect the same result from extrapolation of the variation in a in Figure 1 to x tot = 1 . From the extrapolated a = ( 2.87 ± 0.02 ) Å, we obtain V a = ( 11.82 ± 0.2 ) Å 3 which is practically the same as that determined from the ideal solution behaviours in binary [53] and quinary [67] TE-Cu amorphous alloys. Meaningful values of a, V a , and D obtained by extrapolations of the variations in a with x tot in Figure 1 to both x tot = 0 and x tot = 1 seem to lend some support to this approach in analyzing the physical properties of our alloys.

3.2. Sommerfeld Coefficient γ and Density of States N ( E F )

Since the ES determines all intrinsic properties of alloys and materials [81,82], knowledge of it is especially important for the selection of alloys with desirable properties [16,39]. Moreover, most of the physical properties of the alloys depend on N ( E F ) [39,54,57,81,83]; thus, it is often sufficient to measure LTSH in order to explain these properties. Unfortunately, there is still lack of systematic LTSH measurements in HEAs and CCAs, which is detrimental both for their understanding and practical applications [39,52,65,66,69]. We note, however, that correct determination of N ( E F ) of glassy alloys from LTSH measurements is non-trivial [84] since in addition to the Debye term in the vibrational contributions to LTSH one has also to account for the contribution associated with the so-called boson peak [66,67,68,69]. The electronic contribution to LTSH is contained in the Sommerfeld coefficient γ of a term linear in temperature [81,84]:
γ = π 2 k B 2 N ( E F ) / 3
where k B is the Boltzmann constant and N ( E F ) is the (dressed) DOS at E F which is enhanced with respect to the bare (band) DOS at E F , N ( E F ) = ( 1 + λ ep ) N 0 ( E F ) with λ ep being the electron–phonon coupling constant. Thus, variation in γ directly reflects that of N ( E F ) as can be seen in Figure 2, which shows both γ and N ( E F ) for all Ti-Zr-Nb-(Cu,Ni,Co) glassy alloys for which we measured LTSH [39,66,67,68,69]. Both γ and N ( E F ) for all alloys (except for those with 43%Co and 50%Ni which are above the crossover concentration for the band crossing [52]) follow linear variations with x tot which extrapolate to N ( E F ) = 2.6 ( at eV ) 1 and γ = 6.2 mJ/mol K 2 for the amorphous TiZrNb alloy. To our knowledge, there are no results for γ of the crystalline TiZrNb alloy [75,78], but rather high values of N 0 ( E F ) were predicted for the bcc phase of TEs [85]. These extrapolated values are consistent with high values of γ = ( 6.2 ± 0.2 ) mJ/mol K 2 and ( 7.9 ± 0.3 ) mJ/mol K 2 for amorphous Zr and Ti, respectively, obtained from the extrapolation of results for amorphous Zr(Ti)-Cu alloys to zero Cu content [53]. The value of γ of a pure (bcc) Nb is also high, ( 7.60 ± 0.02 ) mJ/mol K 2 [86], partially due to large λ ep of Nb. A high value of N ( E F ) of the amorphous TiZrNb alloy is expected to result in a rather high superconducting transition temperature T c [72,73,78], an enhanced magnetic susceptibility [53,70,71,72,73], and not that high elastic moduli, strength, and hardness [82,87]. Since the ideal solution behaviour affects all properties of an alloy system, we expect that the results for γ and N ( E F ) of our alloys (Figure 2) extrapolate to those of a pure Cu for x tot = 1 . Indeed, the extrapolation of the data in Figure 2 to x tot = 1 yields γ = ( 0.65 ± 0.2 ) mJ/mol K 2 and N ( E F ) = ( 0.3 ± 0.2 ) ( at eV ) 1 which are—within the error—the same as those obtained from the study of Ti(Zr)-Cu glassy alloys [53], and they agree quite well with those of a pure crystalline Cu.

3.3. Magnetic Susceptibility χ exp

A close relationship between the ES and the magnetic properties of TE-TL alloys is shown clearly by the variations in the room temperature magnetic susceptibility, χ exp , of all Ti-Zr-Nb-(Cu,Ni,Co) glassy alloys with composition. The data in Figure 3 show that similar to γ and N ( E F ) (see Figure 2), most values of χ exp decrease approximately linearly with increasing x tot . (Here, the x tot denotes total concentration of late transition metal(s) Cu, Ni, and Co). The exceptions are the values of χ exp for the alloys with 50%Ni, and 32%, and 43%Co which are influenced by the effects of the band crossing [52,66,69]. The variation in χ exp in Figure 3 extrapolates to ( 2.00 ± 0.05 ) mJ/ T 2 mol and ( 0.07 ± 0.05 ) mJ/ T 2 mol for x tot = 0 and 1, respectively. The latter value of χ exp ( x tot = 1 ) is within the extrapolation error the same as that of a pure (crystalline) Cu [53]. To our knowledge, there is no measurement of χ exp for the TiZrNb alloy ( x tot = 0 ), but our result compares favourably with the corresponding values of its components: χ exp = 2.14 mJ/ T 2 mol for pure Nb [88], and χ exp = 2.33 mJ/ T 2 mol and 1.56 mJ/ T 2 mol which were obtained from extrapolation of the results for glassy Ti,Zr-Cu alloys to pure Ti and Zr, respectively [53]. Moreover, the average of these values, χ av = 2.01 mJ/ T 2 mol is almost the same as our extrapolated value of χ exp for x tot = 0 .
Despite very similar variation with x tot as that of γ and N ( E F ) , χ exp of transition metals and their alloys is quite complex [53,85]:
χ exp = χ P + χ orb + χ dia ,
where χ orb and χ dia are, respectively, the orbital paramagnetic and diamagnetic contributions obtained by adding the corresponding contributions from constituents. The Pauli paramagnetism of the d-band χ P is enhanced over the free electron value χ P 0 = μ B 2 N 0 ( E F ) , where μ B is the Bohr magneton, by the following exchange interaction: χ P = S χ P 0 , where S > 1 is the Stoner enhancement factor [85]. Thus, the direct contribution of N 0 ( E F ) to χ exp in TE-TL alloys is quite moderate and the main contribution in TE-rich alloys is χ orb [53]. Indeed, the composition-averaged χ orb in the TiZrNb alloy is 1.12 mJ/ T 2 mol [89] and thus accounts for 56% of χ exp , and the decrease in χ orb with increasing x tot dominates the variations in χ exp of the majority of alloys in Figure 3.

3.4. Superconducting Transition Temperature
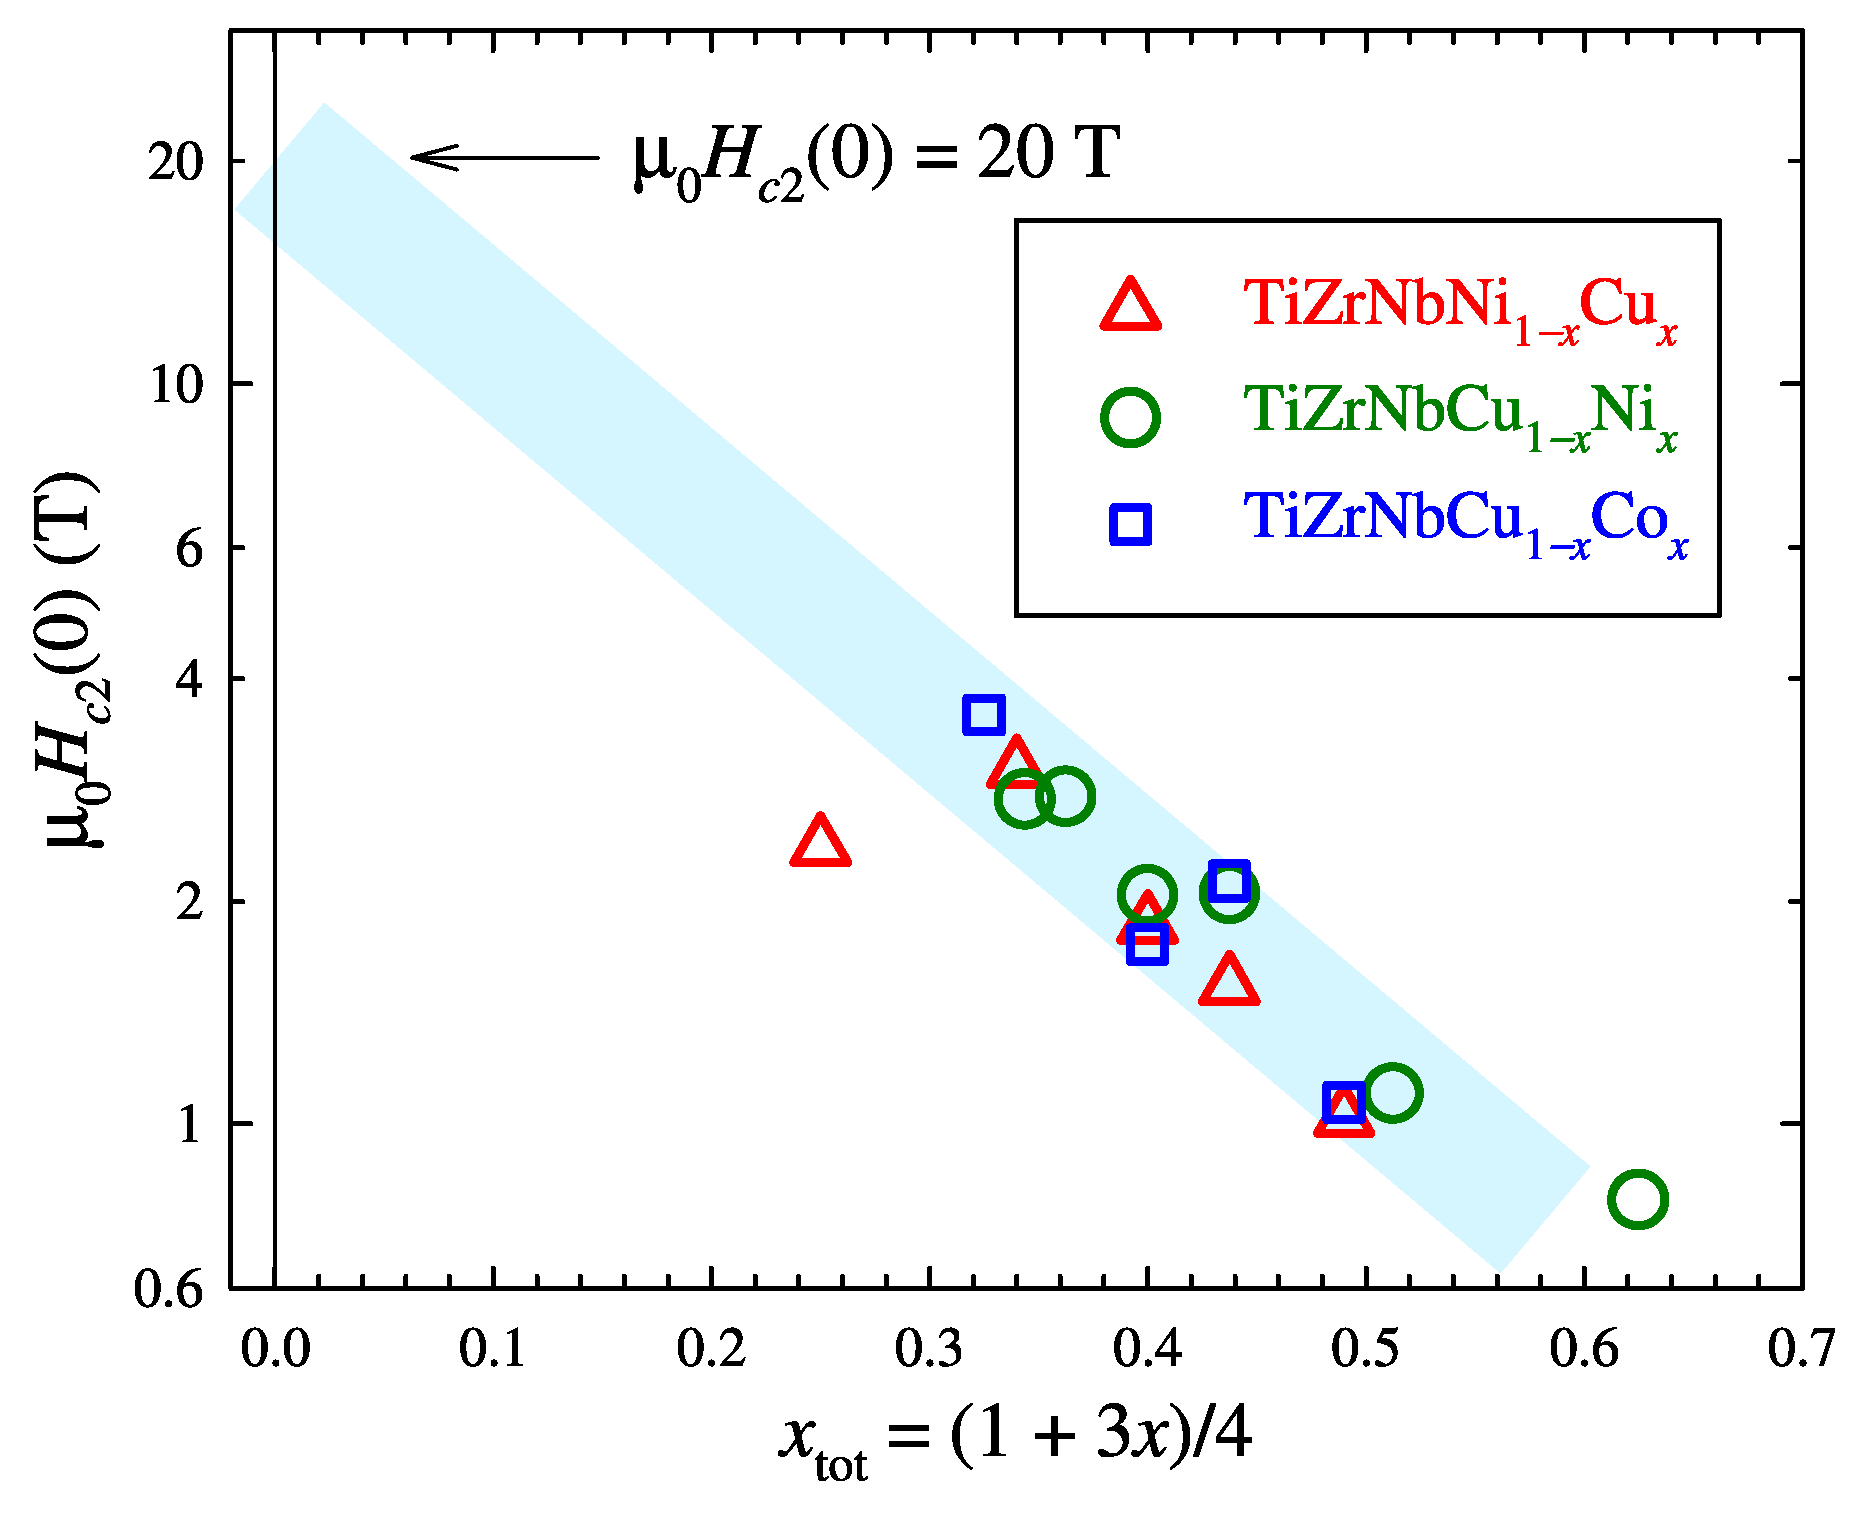
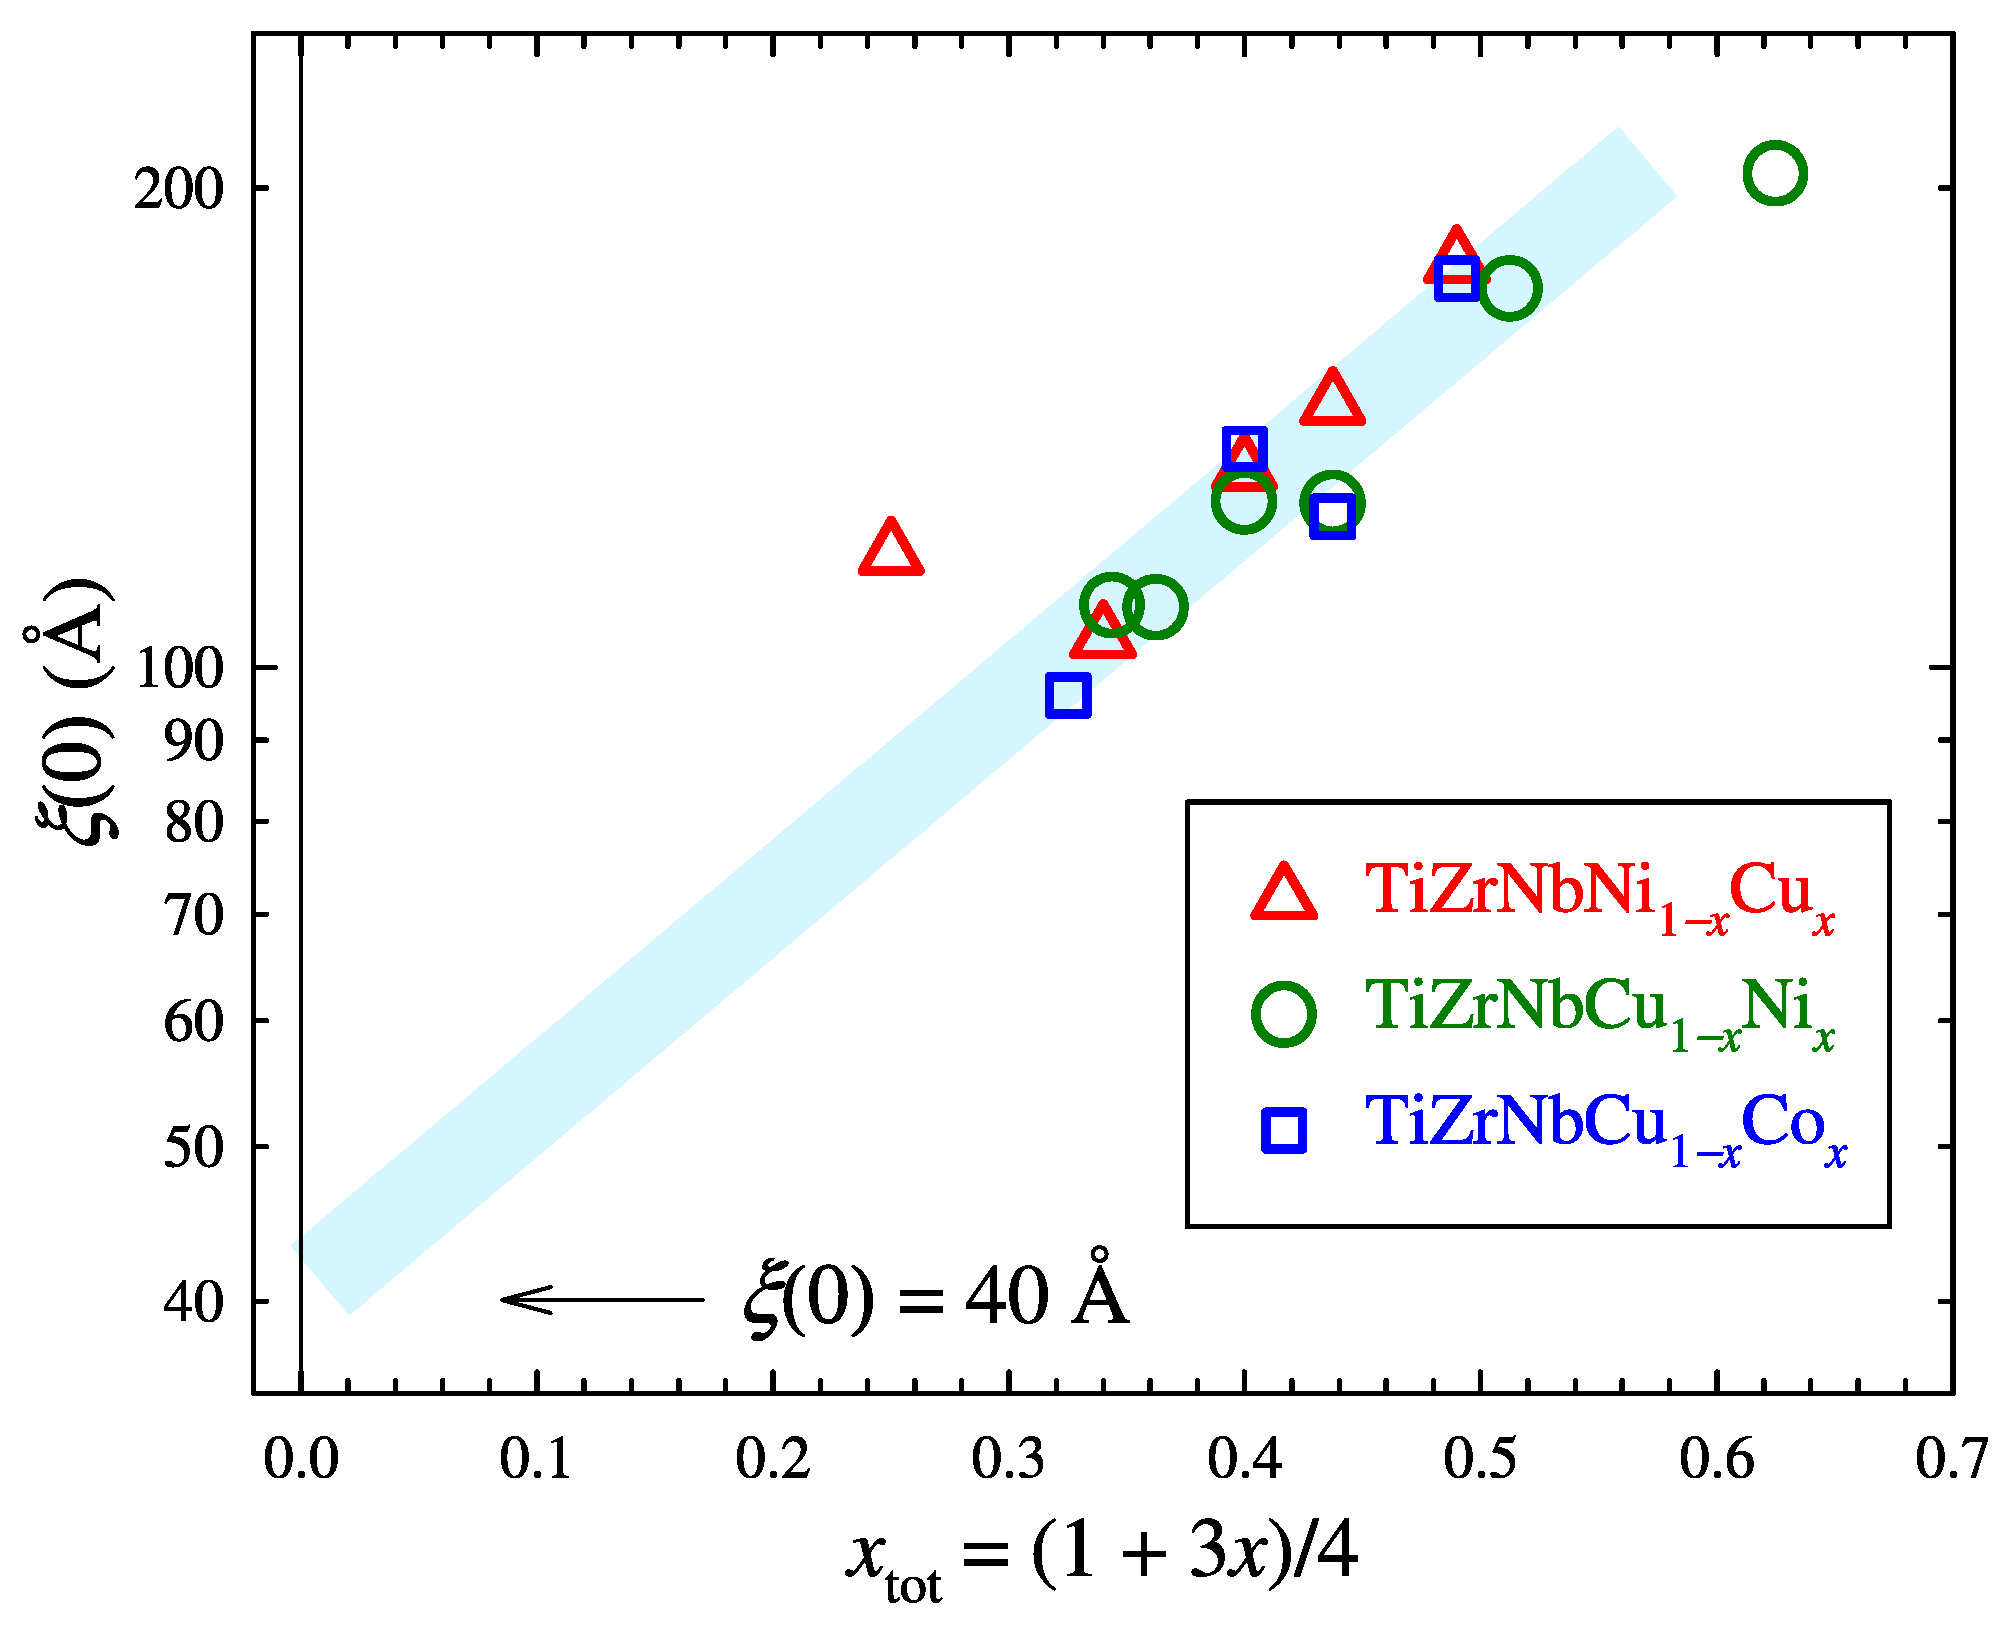
 T c

The research of HEA superconductors (mostly refractory metal-based alloys) has expanded rapidly [35] since the discovery of the Ta-Nb-Hf-Zr-Ti superconductor with the superconducting transition temperature T c = 7.3 K in 2014 [90]. Despite T c s being similar to or lower than those of conventional practical superconductors [35,36,78,90,91], they often show some properties such as strong coupling behaviour [92], high upper critical field H c 2 [78,93], high critical current density J c , irradiation resistance [94], and stability up to very high pressures [91], which are important for practical applications of superconductivity.
The appearance of superconductivity and the value of T c are closely related to the ES of an alloy. Moreover, in disordered transition metals and their alloys [54,73] the superconductivity seems to be governed by N 0 ( E F ) , which results in an approximately linear variation in λ ep with N 0 ( E F ) , with a slope that depends only on the class of transition metals (3d, 4d, or 5d) and the position of E F within a given d-band DOS [83]. In TE-TL alloys, this leads to a decrease in the value of T c on increasing TL content (thus, also increasing the value of average VEC) irrespective of whether these alloys are crystalline or amorphous, binary or HEA [54,57,58,72,73,91,95,96,97,98,99].
In Figure 4, we show the variation in T c s of glassy Ti-Zr-Nb-(Cu,Ni,Co) alloys [54,57] with x tot . Note a logarithmic scale for T c which is suitable for an exponential variation. Such a plot of T c vs. x tot is plausible since in these alloys N ( E F ) varies linearly with x tot (see Figure 2) and the BCS theory of superconductivity [100,101] predicts in both the weak and strong coupling regime approximately exponential variation in T c with N ( E F ) . Indeed, within the experimental scatter, the data for T c of the majority of our alloys follow an approximately exponential variation. The exception are the values of T c for alloys with 43% of Co and 50% of Ni, as well as those for 0% and 50% of Cu, which fall below the (error) band determined by the most data in Figure 4. As already explained for χ exp (Figure 3), a little deviation in T c data for the alloys with 32%Co and 50%Ni from the common trend of the data in Figure 4 is due to band crossing, thus an enhancement of the contribution of d-states of Co and Ni to N ( E F ) at these compositions [52]. A large deviation in T c of the alloy with 0%Cu ( x tot = 0.25 ) from that predicted by the common trend of the data is due to the extraordinary sensitivity of T c s of TE-TL glassy alloys on incipient crystallization [58,73,96]. A small suppression of T c of the alloy with 50%Cu ( x tot = 0.625 ) is probably due to a small local chemical inhomogeneity (such as a small increase in Cu content in a small part of that particular sample). As already noted [54], the values of T c of alloys in Figure 4 are quite low ( T c 1.9 K) compared to these of Zr-Cu,Ni glassy alloys [58,73,96,97]. Somewhat lower N ( E F ) values of our alloys [39,54], together with the adverse influence of Ti [57,73,83] probably explain their low T c s. A recent study on the influence of the increase in Ti, Zr, or Nb content of T c s of Ti-Zr-Nb-Cu-Ni alloys has shown that the Ti 0.3 Zr 0.15 Nb 0.15 Cu 0.2 Ni 0.2 alloy despite higher N ( E F ) has nearly 40% lower T c than those of Zr 0.3 Ti 0.15 Nb 0.15 Cu 0.2 Ni 0.2 and Nb 0.3 Ti 0.15 Zr 0.15 Cu 0.2 Ni 0.2 alloys [57].
The variation in T c s in Figure 4 extrapolates for x tot = 0 to T c = ( 8 ± 1 ) K for the glassy TiZrNb alloy, which agrees very well with that of the crystalline (bcc) TiZrNb alloy, T c = 8.2 K [78]. It should be noted that the main obstacle to a more accurate determination of T c is the lack of alloys with low x tot values (approaching 0) due to the poor glass-forming ability of alloys in this concentration range [54,57]. For better comparison with T c of the crystalline alloy, we extrapolated T c s defined as the midpoints of the resistive transition in the zero applied field. If we used some more rational definition of T c s (free from the effects of flux flow and superconducting fluctuations [54]), our extrapolated value of T c would be a little higher. The value of the superconducting gap determined from the point-contact Andreev reflection measurements indicates weak coupling superconductivity of the bcc TiZrNb alloy [78].
Unfortunately, a scatter in the values of the Debye temperature ( θ D ) of our alloys prevents a reliable extrapolation of these values to x tot = 0 , i.e., θ D of the glassy TiZrNb alloy, and knowledge of θ D is a prerequisite for the determination of the value of λ ep and thus the type of superconductivity of an alloy [54,101]. However, if we assume that an approximately linear variation in λ ep with N 0 ( E F ) observed in ( TiZrNbCu ) 1 x Ni x alloys (see Figure 6 in [54]) extends to higher values of N 0 ( E F ) , we can estimate that λ ep 0.66 corresponds to N ( E F ) (Figure 2) of a glassy TiZrNb alloy. This value of λ ep corresponds to an intermediate coupled BCS superconductor.

3.5. Upper Critical Magnetic Field H c 2 ( 0 ) and Coherence Length ξ ( 0 )

Knowledge of H c 2 is important both for understanding and practical applications of superconductors [35,54,73,100]. In particular, the value of H c 2 ( 0 ) = H c 2 ( T = 0 ) may provide an insight into the mechanism of destruction of superconductivity and can also indicate whether the studied system can be described as a conventional (BCS) superconductor or not. The values of H c 2 ( 0 ) of HEA and CCA superconductors are often very high [35,54,78,91,93], exceeding the Pauli paramagnetic limit μ 0 H P = 1.83 T c [102]. Since the values of H c 2 ( 0 ) of all our Ti-Zr-Nb-(Cu,Ni,Co) glassy alloys were close to H P [54,57], we show the variation in their values with x tot using the same type of plot as that for T c in Figure 4. As seen in Figure 5, the values of H c 2 ( 0 ) of all our alloys (except for the slightly crystalline alloy with 0%Cu [67]) follow the same, approximately linear, variation, which for x tot = 0 extrapolates to that of the glassy TiZrNb alloy, μ 0 H c 2 ( 0 ) = ( 20 ± 5 ) T. This value is somewhat higher than μ 0 H P = ( 15 ± 2 ) T and is a little lower than the highest value of μ 0 H c 2 ( 0 ) reported so far for HEAs [103]. As discussed in Ref. [57], the definition of H c 2 using the midpoint of the resistive transition would, due to broadening of the resistive transition in an applied magnetic field, result in somewhat lower values of H c 2 ( 0 ) in Figure 5, thus a lower value of H c 2 ( 0 ) of the glassy TiZrNb alloy. However, rather sharp resistive transitions observed in all our samples [54,57] would result in an extrapolated value of H c 2 ( 0 ) which is still within the extrapolated errors in Figure 5 and thus still somewhat higher than μ 0 H P corresponding to the T c of the glassy TiZrNb alloy. Considerably lower values of H c 2 ( 0 ) , 12 T [78] or 13 T [104] have been reported for the crystalline TiZrNb alloy. These values were estimated using the WHH approximation in the dirty limit [105]:
μ 0 H c 2 ( 0 ) = 0.69 T c μ 0 d H c 2 d T T c .
Despite some ambiguity associated with the application of WHH approximation to H c 2 results covering a narrow magnetic field, μ 0 H c 2 5 T and temperature range T 0.7 T c , and the absence of data confirming the dirty limit, we expect that the H c 2 ( 0 ) value of the crystalline TiZrNb alloy will be lower than that of the corresponding amorphous alloy. Indeed, a strong topological disorder of the amorphous phase makes the electronic mean free path very short (thus there is high electrical resistivity [57]). This results in a short superconducting coherence length and the associated enhancement of H c 2 [81,100]. Indeed, a large ratio of H c 2 ( 0 ) / T c in V-Nb-Mo-Al-Ga HEAs over an extended composition range was attributed to disorder-induced enhancement of H c 2 [103]. Unfortunately, a rather large scatter of the values of electrical resistivity ρ in our Ti-Zr-Nb-(Cu,Ni,Co) alloys [54,57] prevents sufficiently accurate extrapolation of these results to that of the TiZrNb glassy alloy (thus, an estimate of the amount of disorder in this alloy). However, from the average slopes of the decrease of ρ with decreasing TL contents, we can make a rough estimate of ρ in amorphous phase TiZrNb, ρ a 100 μ Ω cm, which is about two or more times larger than the values of ρ in similar crystalline refractory HEAs and CCAs [91].
Using the Ginzburg–Landau expression [81,100], we calculated the coherence length ξ ( 0 ) of all Ti-Zr-Nb-(Cu,Ni,Co) glassy alloys using the corresponding values of μ 0 H c 2 ( 0 ) from Figure 5:
ξ ( 0 ) = Φ 0 / 2 π μ 0 H c 2 ( 0 ) 0.5 .
Here, Φ 0 is the magnetic flux quantum Φ 0 = h / 2 e , where h is the Planck constant and e is the charge of the electron. (We note that due to simple proportionality between T c and μ 0 H c 2 ( 0 ) in the superconductor with the Pauli paramagnetic limit [102] one can also use T c in order to estimate ξ ( 0 ) .) As seen in Figure 6, ξ ( 0 ) values of our alloys decrease approximately exponentially with decreasing x tot (the exception is a large ξ ( 0 ) of the partially crystalline alloy with zero Cu content), and extrapolate to ξ ( 0 ) = ( 40 ± 3 ) Å for the TiZrNb glassy alloy. This value of ξ ( 0 ) agrees very well with that obtained by the use of μ 0 H c 2 ( 0 ) = ( 20 ± 5 ) T in Equation (6), ξ ( 0 ) = ( 40.6 ± 3.5 ) Å which seems to indicate relatively good accuracy of our extrapolation procedures. The values of ξ ( 0 ) of the best conventional superconductors Nb 3 Sn and NbTi of around 30 Å and 50 Å, respectively [106], are close to that estimated for the glassy TiZrNb superconductor. The coherence length is the fundamental length scale in superconducting state, which affects all thermodynamic and electromagnetic properties of a superconductor [81,100] and thus affects both the understanding and practical applications of superconductivity. As one example, we note that the magnitude of ξ ( 0 ) determines the size of the optimal flux pinning centers and thus also the magnitude of J c in an applied filed (e.g., [107]). Recent findings of the chemical inhomogeneities associated with the affinity between Ti and Zr atoms in the crystalline TiZrNb alloy [108] with the nanometer size may indicate rather strong intrinsic pinning of magnetic vortices at these inhomogeneities and thus rather high values of the in-field J c .

3.6. VEC and T c Relationship in TE-TL Alloys

At the end, we will briefly address the much-debated problem of the relationship between VEC and T c in TE-TL alloys, both HEAs and the conventional one [35,54,57,58,72,73,91,95,96,97,98]. The first systematic study of the superconductivity and magnetism of glassy Zr-TL alloys [58,99] already showed that the variation in T c with VEC does not follow those of either amorphous thin films of neighboring 4d transition metals (light blue band and corresponding gray crosses in Figure 7, [109]) or their crystalline counterparts (gray dashed line in Figure 7, [110]). In Zr-Ni,Cu alloys [58,72,96,97,99] T c , χ exp , and N ( E F ) decrease continuously with increasing Ni,Cu content (thus VEC) instead of increasing towards VEC 6.5 as in amorphous thin films of neighboring 4d metals (Figure 7 and [109]). This ‘anomalous’ variation in T c with VEC in amorphous TE-TL alloys is simply explained by their split-band structure of the DOS within the valence band, observed in photoemission spectra (PES) of both crystalline and amorphous TE-TL alloys (see e.g., [48,49,50]) and confirmed by subsequent calculation of their ES [60,61,62]. PES and theory have shown that within the superconducting range of compositions, N ( E F ) is dominated by the d-states of TEs and the contribution of those of TLs to N ( E F ) is quite small [48,49,50,52]. Accordingly, T c has to decrease with increasing TL content and with conventionally defined VEC ( VEC = i c i VEC i , where c i and VEC i are the molar fraction and VEC of the i-th component, respectively) which overestimates the contribution of d-states of TLs to N ( E F ) . Indeed, by using an effective VEC for TL = Ni and Cu, equal to their valency (thus substantially lower than the total number of their valence electrons), it was possible to reconcile the variation in T c with effective VEC in glassy Zr-Cu(Ni) alloys [52] with that of amorphous alloys of neighboring 4d metals [109]. The discovery of HEA and CCA superconductors led to the (re)discovery of the discrepancy between the variation in T c with VEC predicted in either [109] or [110] and that observed in TE-TL-composed HEAs and CCAs [35,91]. Initially, despite the observed decrease in N ( E F ) with increasing TL content (see e.g., [98]), this discrepancy was not understood and was believed to be specific to the chemical complexity of HEAs. PES studies of TE-TL-based HEAs and CCAs, both glassy and crystalline, have shown qualitatively the same structure of DOS within the valence band as in their binary and ternary counterparts (see Ref. [52] and references therein). Thus, their variations in T c with VEC can also be reconciled with those observed in alloys of neighboring 4d metals [109,110] providing that one uses the effective VEC for TLs (which is physically better justified). This is demonstrated in Figure 7 which shows that the erroneous variation in T c s of our alloys with conventional values of VEC (Figure 7, right side) is corrected with the use of effective VEC = 2 for both Cu and Ni, which correspond to their valency (Figure 7, left side). Since VEC varies linearly with x tot , we do not expect precisely linear variation in T c of our alloys with VEC (see Figure 4); thus, linear extrapolation of our results for T c in Figure 7 to the value of VEC of TiZrNb would be erroneous. Four Ti-Zr-Nb-(Cu,Ni,Co) glassy alloys with somewhat lower values of T c in Figure 7 (lower than those of the majority of these alloys) are those discussed in some detail in the text accompanying Figure 4. In particular, these are the partially crystalline alloy with zero Cu content and three alloys with Ni or Co contents with T c s affected with the band-crossing effects and/or the onset of magnetic correlations (Figure 3). Further, we show that T c of the crystalline TiZrNb alloy [78] obeys the Matthias rule [110] (pink star symbol in Figure 7).

4. Conclusions

We performed a novel analysis of existing results of a comprehensive study of the changes in physical properties of three quinary amorphous alloy systems, ( TiZrNbNi ) 1 x Cu x , ( TiZrNbCu ) 1 x Ni x , and ( TiZrNbCu ) 1 x Co x , on transition from high-entropy alloy to conventional alloy regime. In our opinion, our analysis provided reliable estimates of the physical properties of the amorphous TiZrNb alloy which has not been prepared in the amorphous phase yet. Most of the properties of glassy TiZrNb would be similar to those of the crystalline TiZrNb refractory alloy, except for certain superconducting properties, in particular higher values of the upper critical field, which is probably a consequence of the strong topological disorder of the amorphous phase. This opens up the amorphous TiZrNb as a possible basis for the contemporary refractory alloys and might also be a promising biomedical alloy. Moreover, the glassy form of the TiZrNb alloy could outperform the crystalline one in biomedical applications and in superconducting properties in an applied magnetic field. An explanation of the discrepancy between the variations in T c with the average number of valency electrons across neighboring alloys of 4d transition metals and some high-entropy alloys has been provided.
The presented method of analyzing systematic results is rather general and can provide reliable estimates of the properties of any alloy which has not been prepared as of yet. Moreover, our analysis enables a better description of the properties of the single-element metallic glasses than that based on actual samples.

Author Contributions

Methodology, K.Z., D.S., I.A.F. and M.K.; Investigation, D.S., R.R. and M.K.; Resources, E.T., D.S. and M.B.; Writing—original draft, E.B., M.B. and R.R.; Writing—review & editing, M.B. and E.B. All authors have read and agreed to the published version of the manuscript.

Funding

This work was partially supported by the Croatian Science Foundation Projects No. IP-2022-10-6321 HOI2DEM. We acknowledge the support of project CeNIKS co-financed by the Croatian Government and the European Union through the European Regional Development Fund, Competitiveness and Cohesion Operational Programme (Grant no. KK.01.1.1.02.0013). We also acknowledge the support of the project Cryogenic Centre at the Institute of Physics—KaCIF co-financed by the Croatian Government and the European Union through the European Regional Development Fund-Competitiveness and Cohesion Operational Programme (Grant No. KK.01.1.1.02.0012) and the support of the project Ground states in competition—strong correlations, frustration and disorder—FrustKor financed by the Croatian Government and the European Union—NextGenerationEU through the National plan for recovery and resilience 2021–2026. Financial support from the University of Zagreb through funds for multipurpose institutional financing of scientific research (project 104-F24-00011) is greatly acknowledged.

Data Availability Statement

Theoriginal contributions presented in this study are included in the article. Further inquiries can be directed to the corresponding author.

Conflicts of Interest

The authors declare no conflicts of interest. The funders had no role in the design of the study; in the collection, analyses, or interpretation of data; in the writing of the manuscript; nor in the decision to publish the results.

References

  1. Miracle, D.B. High-entropy alloys as a bold step forward in alloy development. Nat. Commun. 2019, 10, 1805. [Google Scholar] [CrossRef] [PubMed]
  2. Ma, L.; Wang, L.; Zhang, T.; Inoue, A. Bulk Glass Formation of Ti-Zr-Hf-Cu-M (M=Fe, Co, Ni) Alloys. Mater. Trans. 2002, 43, 277–280. [Google Scholar] [CrossRef]
  3. Cantor, B.; Kim, K.; Warren, P.J. Novel Multicomponent Amorphous Alloys. In Metastable, Mechanically Alloyed and Nanocrystalline Materials 2001; Trans Tech Publications Ltd.: Bäch, Switzerland, 2002; Volume 386, pp. 27–32. [Google Scholar] [CrossRef]
  4. Kim, K.; Warren, P.; Cantor, B. Metallic glass formation in multicomponent (Ti, Zr, Hf, Nb)–(Ni, Cu, Ag)–Al alloys. J. -Non-Cryst. Solids 2003, 317, 17–22. [Google Scholar] [CrossRef]
  5. Babić, E.; Bei, H. (Eds.) Compositional Complex Alloys: From Amorphous to High-Entropy (Special Issue of Materials). 2022. Available online: https://www.mdpi.com/journal/materials/special_issues/AHE (accessed on 27 May 2025).
  6. Inoue, A. Stabilization of metallic supercooled liquid and bulk amorphous alloys. Acta Mater. 2000, 48, 279–306. [Google Scholar] [CrossRef]
  7. Cantor, B.; Chang, I.; Knight, P.; Vincent, A. Microstructural development in equiatomic multicomponent alloys. Mater. Sci. Eng. A 2004, 375–377, 213–218. [Google Scholar] [CrossRef]
  8. Yeh, J.W.; Chen, S.K.; Lin, S.J.; Gan, J.Y.; Chin, T.S.; Shun, T.T.; Tsau, C.H.; Chang, S.Y. Nanostructured High-Entropy Alloys with Multiple Principal Elements: Novel Alloy Design Concepts and Outcomes. Adv. Eng. Mater. 2004, 6, 299–303. [Google Scholar] [CrossRef]
  9. Senkov, O.; Miller, J.; Miracle, D.; Woodward, C. Accelerated exploration of multi-principal element alloys with solid solution phases. Nat. Commun. 2015, 6, 6529. [Google Scholar] [CrossRef]
  10. Pickering, E.J.; Jones, N.G. High-entropy alloys: A critical assessment of their founding principles and future prospects. Int. Mater. Rev. 2016, 61, 183–202. [Google Scholar] [CrossRef]
  11. Ye, Y.; Wang, Q.; Lu, J.; Liu, C.; Yang, Y. High-entropy alloy: Challenges and prospects. Mater. Today 2016, 19, 349–362. [Google Scholar] [CrossRef]
  12. Zhang, Y.; Zuo, T.T.; Tang, Z.; Gao, M.C.; Dahmen, K.A.; Liaw, P.K.; Lu, Z.P. Microstructures and properties of high-entropy alloys. Prog. Mater. Sci. 2014, 61, 1–93. [Google Scholar] [CrossRef]
  13. Guo, S. Phase selection rules for cast high-entropy alloys: An overview. Mater. Sci. Technol. 2015, 31, 1223–1230. [Google Scholar] [CrossRef]
  14. Miracle, D.; Senkov, O. A critical review of high-entropy alloys and related concepts. Acta Mater. 2017, 122, 448–511. [Google Scholar] [CrossRef]
  15. George, E.P.; Raabe, D.; Ritchie, R.O. High-entropy alloys. Nat. Rev. Mater. 2019, 4, 515–534. [Google Scholar] [CrossRef]
  16. Ikeda, Y.; Grabowski, B.; Körmann, F. Ab initio phase stabilities and mechanical properties of multicomponent alloys: A comprehensive review for high-entropy alloys and compositionally complex alloys. Mater. Charact. 2019, 147, 464–511. [Google Scholar] [CrossRef]
  17. Gao, M.C.; Yeh, J.W.; Liaw, P.K.; Zhang, Y. (Eds.) High-Entropy Alloys; Springer International Publishing: Cham, Switzerland, 2016. [Google Scholar] [CrossRef]
  18. Cantor, B. Multicomponent high-entropy Cantor alloys. Prog. Mater. Sci. 2021, 120, 100754. [Google Scholar] [CrossRef]
  19. Chen, Y.; Dai, Z.W.; Jiang, J.Z. High entropy metallic glasses: Glass formation, crystallization and properties. J. Alloys Compd. 2021, 866, 158852. [Google Scholar] [CrossRef]
  20. Luan, H.; Li, K.; Shi, L.; Zhao, W.; Bu, H.; Gong, P.; Yao, K.F. Recent progress in high-entropy metallic glasses. J. Mater. Sci. Technol. 2023, 161, 50–62. [Google Scholar] [CrossRef]
  21. Firstov, G.; Kosorukova, T.; Koval, Y.; Odnosum, V. High Entropy Shape Memory Alloys. Mater. Today Proc. 2015, 2, S499–S503. [Google Scholar] [CrossRef]
  22. Firstov, G.S.; Kosorukova, T.A.; Koval, Y.N.; Verhovlyuk, P.A. Directions for High-Temperature Shape Memory Alloys’ Improvement: Straight Way to High-Entropy Materials? Shape Mem. Superelasticity 2015, 1, 400–407. [Google Scholar] [CrossRef]
  23. Kosorukova, T.A.; Gerstein, G.; Odnosum, V.V.; Koval, Y.N.; Maier, H.J.; Firstov, G.S. Microstructure Formation in Cast TiZrHfCoNiCu and CoNiCuAlGaIn High Entropy Shape Memory Alloys: A Comparison. Materials 2019, 12, 4227. [Google Scholar] [CrossRef]
  24. Piorunek, D.; Oluwabi, O.; Frenzel, J.; Kostka, A.; Maier, H.; Somsen, C.; Eggeler, G. Effect of off-stoichiometric compositions on microstructures and phase transformation behavior in Ni-Cu-Pd-Ti-Zr-Hf high entropy shape memory alloys. J. Alloys Compd. 2021, 857, 157467. [Google Scholar] [CrossRef]
  25. Kuo, S.Y.; Kao, W.P.; Chang, S.H.; Shen, T.E.; Yeh, J.W.; Tsai, C.W. Effect of Homogenization on the Transformation Temperatures and Mechanical Properties of Cu15Ni35Hf12.5Ti25Zr12.5 and Cu15Ni35Hf15Ti20Zr15 High-Entropy Shape Memory Alloys. Materials 2023, 16, 3212. [Google Scholar] [CrossRef] [PubMed]
  26. Adamo, C.G.; Srivastava, A.; Kumar, D.; Legese, S.S.; Sreeram, P.R.; Mangalassery, N.M.; Kawamura, Y.; Olu, F.E.; Tiwary, C.S.; Singh, A.K.; et al. Tailoring Ni/Fe Doping for Superior Thermoelectric Performance of Zr2Ni2-xFexSnSb (x = 0.30, 0.35, 0.40) High-Entropy Alloys. Energy Technol. 2024, 13, 2401718. [Google Scholar] [CrossRef]
  27. Edalati, P.; Floriano, R.; Mohammadi, A.; Li, Y.; Zepon, G.; Li, H.W.; Edalati, K. Reversible room temperature hydrogen storage in high-entropy alloy TiZrCrMnFeNi. Scr. Mater. 2020, 178, 387–390. [Google Scholar] [CrossRef]
  28. Andrade, G.; Zepon, G.; Edalati, K.; Mohammadi, A.; Ma, Z.; Li, H.W.; Floriano, R. Crystal structure and hydrogen storage properties of AB-type TiZrNbCrFeNi high-entropy alloy. Int. J. Hydrogen Energy 2023, 48, 13555–13565. [Google Scholar] [CrossRef]
  29. Qiu, H.J.; Fang, G.; Gao, J.; Wen, Y.; Lv, J.; Li, H.; Xie, G.; Liu, X.; Sun, S. Noble Metal-Free Nanoporous High-Entropy Alloys as Highly Efficient Electrocatalysts for Oxygen Evolution Reaction. ACS Mater. Lett. 2019, 1, 526–533. [Google Scholar] [CrossRef]
  30. Glasscott, M.W.; Pendergast, A.D.; Goines, S.; Bishop, A.R.; Hoang, A.T.; Renault, C.; Dick, J.E. Electrosynthesis of high-entropy metallic glass nanoparticles for designer, multi-functional electrocatalysis. Nat. Commun. 2019, 10, 2650. [Google Scholar] [CrossRef]
  31. Popescu, G.; Ghiban, B.; Popescu, C.A.; Rosu, L.; Truscă, R.; Carcea, I.; Soare, V.; Dumitrescu, D.; Constantin, I.; Olaru, M.T.; et al. New TiZrNbTaFe high-entropy alloy used for medical applications. Iop Conf. Ser. Mater. Sci. Eng. 2018, 400, 022049. [Google Scholar] [CrossRef]
  32. Takahashi, M.; Sato, K.; Togawa, G.; Takada, Y. Mechanical Properties of Ti-Nb-Cu Alloys for Dental Machining Applications. J. Funct. Biomater. 2022, 13, 263. [Google Scholar] [CrossRef]
  33. de Oliveira, T.G.; Fagundes, D.V.; Capellato, P.; Sachs, D.; da Silva, A.A.A.P. A Review of Biomaterials Based on High-Entropy Alloys. Metals 2022, 12, 1940. [Google Scholar] [CrossRef]
  34. Zhu, S.; Yang, Q.; Gan, K.; Yan, D.; Zhang, Y.; Liu, C.; Li, Z. A strong ferritic high-resistivity multicomponent alloy with tunable ordered coherent multicomponent nanoprecipitates. Acta Mater. 2022, 238, 118209. [Google Scholar] [CrossRef]
  35. Kitagawa, J.; Hamamoto, S.; Ishizu, N. Cutting Edge of High-Entropy Alloy Superconductors from the Perspective of Materials Research. Metals 2020, 10, 1078. [Google Scholar] [CrossRef]
  36. Yoshikazu Mizuguchi, M.R.K.; Matsuda, T.D. Superconductivity in CuAl2-type Co0.2Ni0.1Cu0.1Rh0.3Ir0.3Zr2 with a high-entropy-alloy transition metal site. Mater. Res. Lett. 2021, 9, 141–147. [Google Scholar] [CrossRef]
  37. Han, L.; Zhu, S.; Rao, Z.; Scheu, C.; Ponge, D.; Ludwig, A.; Zhang, H.; Gutfleisch, O.; Hahn, H.; Li, Z.; et al. Multifunctional high-entropy materials. Nat. Rev. Mater. 2024, 9, 846–865. [Google Scholar] [CrossRef]
  38. Inoue, A.; Kong, F.; Zhu, X.; Chen, J.; Men, H.; Botta, W.J. Development and industrialization of Zr- and Fe-based bulk metallic glasses and light metal-based metastable alloys. J. Alloys Compd. 2024, 979, 173546. [Google Scholar] [CrossRef]
  39. Babić, E.; Drobac, Đ.; Figueroa, I.A.; Laurent-Brocq, M.; Marohnić, Ž.; Mikšić Trontl, V.; Pajić, D.; Perrière, L.; Pervan, P.; Remenyi, G.; et al. Transition from High-Entropy to Conventional Alloys: Which Are Better? Materials 2021, 14, 5824. [Google Scholar] [CrossRef]
  40. Cunliffe, A.; Plummer, J.; Figueroa, I.; Todd, I. Glass formation in a high-entropy alloy system by design. Intermetallics 2012, 23, 204–207. [Google Scholar] [CrossRef]
  41. Meng, Y.; Duan, F.; Pan, J.; Li, Y. Phase stability of B2-ordered ZrTiHfCuNiFe high-entropy alloy. Intermetallics 2019, 111, 106515. [Google Scholar] [CrossRef]
  42. Nagase, T.; Takeuchi, A.; Amiya, K.; Egami, T. Solid state amorphization of metastable Al0.5TiZrPdCuNi high entropy alloy investigated by high voltage electron microscopy. Mater. Chem. Phys. 2018, 210, 291–300. [Google Scholar] [CrossRef]
  43. Babić, E.; Figueroa, I.A.; Mikšić Trontl, V.; Pervan, P.; Pletikosić, I.; Ristić, R.; Salčinović Fetić, A.; Skoko, Ž.; Starešinić, D.; Valla, T.; et al. Electronic structure–property relationship in an Al0.5TiZrPdCuNi high-entropy alloy. Appl. Phys. Lett. 2024, 124, 221903. [Google Scholar] [CrossRef]
  44. Park, H.J.; Na, Y.S.; Hong, S.H.; Kim, J.T.; Kim, Y.S.; Lim, K.R.; Park, J.M.; Kim, K.B. Phase evolution, microstructure and mechanical properties of equi-atomic substituted TiZrHfNiCu and TiZrHfNiCuM (M = Co, Nb) high-entropy alloys. Met. Mater. Int. 2016, 22, 551–556. [Google Scholar] [CrossRef]
  45. Köster, U.; Herold, U. Crystallization of metallic glasses. In Glassy Metals I; Güntherodt, H.J., Beck, H., Eds.; Springer: Berlin/Heidelberg, Germany, 1981; Volume 46, pp. 225–259. [Google Scholar] [CrossRef]
  46. Ristić, R.; Zadro, K.; Pajić, D.; Figueroa, I.A.; Babić, E. On the origin of bulk glass forming ability in Cu-Hf, Zr alloys. Europhys. Lett. 2016, 114, 17006. [Google Scholar] [CrossRef]
  47. Babić, E.; Ristić, R.; Figueroa, I.A.; Pajić, D.; Skoko, Ž.; Zadro, K. Electronic structure and glass forming ability in early and late transition metal alloys. Philos. Mag. 2018, 98, 693–709. [Google Scholar] [CrossRef]
  48. Amamou, A. d Band structure and alloying effects in crystalline and amorphous Zr2Co and Zr2Ni. Solid State Commun. 1980, 33, 1029–1034. [Google Scholar] [CrossRef]
  49. Oelhafen, P.; Hauser, E.; Güntherodt, H.J. Varying d-band splitting in glassy transition metal alloys. Solid State Commun. 1980, 35, 1017–1019. [Google Scholar] [CrossRef]
  50. Zehringer, R.; Oelhafen, P.; Güntherodt, H.J.; Yamada, Y.; Mizutani, U. Electronic structure of (Ni33Zr67)85X15 (X=Ti, V, Cr, Mn, Fe, Co and Cu) Metallic glasses studied by photoelectron spectroscopy. Mater. Sci. Eng. 1988, 99, 317–320. [Google Scholar] [CrossRef]
  51. Babić, E.; Biljaković, K.; Figueroa, A.I.; Kuršumović, A.; Mikšić Trontl, V.; Pajić, D.; Pervan, P.; Ristić, R.; Starešinić, D. High-entropy alloys: New challenge in materials science. In Proceedings of the Solid-State Science & Research Meeting 2017, Zagreb, Croatia, 28–30 June 2017; Institut Ruđer Bošković: Zagreb, Croatia, 2017; p. 25. [Google Scholar]
  52. Pervan, P.; Mikšić Trontl, V.; Figueroa, I.A.; Valla, T.; Pletikosić, I.; Babić, E. Compositionally Complex Alloys: Some Insights from Photoemission Spectroscopy. Materials 2023, 16, 1486. [Google Scholar] [CrossRef]
  53. Ristić, R.; Cooper, J.; Zadro, K.; Pajić, D.; Ivkov, J.; Babić, E. Ideal solution behaviour of glassy Cu–Ti,Zr,Hf alloys and properties of amorphous copper. J. Alloys Compd. 2015, 621, 136–145. [Google Scholar] [CrossRef]
  54. Kuveždić, M.; Tafra, E.; Basletić, M.; Ristić, R.; Pervan, P.; Mikšić Trontl, V.; Figueroa, I.A.; Babić, E. Change of electronic properties on transition from high-entropy to Ni-rich (TiZrNbCu)1-xNix alloys. J. -Non-Cryst. Solids 2020, 531, 119865. [Google Scholar] [CrossRef]
  55. Ivkov, J.; Babic, E.; Jacobs, R.L. Hall effect and electronic structure of glassy Zr 3d alloys. J. Phys. Met. Phys. 1984, 14, L53. [Google Scholar] [CrossRef]
  56. From, M.; Muir, W.B. Thermoelectric power of Fe-Zr and Co-Zr metallic glasses. Phys. Rev. B 1986, 33, 3736–3739. [Google Scholar] [CrossRef] [PubMed]
  57. Kuveždić, M.; Tafra, E.; Figueroa, I.A.; Basletić, M. (Magneto)Transport Properties of (TiZrNbNi)1-xCux and (TiZrNbCu)1-xCox Complex Amorphous Alloys. Materials 2023, 16, 1711. [Google Scholar] [CrossRef] [PubMed]
  58. Babić, E.; Ristić, R.; Miljak, M.; Scott, M.; Gregan, G. Superconductivity in zirconium-nickel glasses. Solid State Commun. 1981, 39, 139–141. [Google Scholar] [CrossRef]
  59. Cheng, Y.; Ma, E. Atomic-level structure and structure–property relationship in metallic glasses. Prog. Mater. Sci. 2011, 56, 379–473. [Google Scholar] [CrossRef]
  60. Moruzzi, V.L.; Oelhafen, P.; Williams, A.R.; Lapka, R.; Güntherodt, H.J.; Kübler, J. Theoretical and experimental electronic structure of Zr-based transition-metal glasses containing Fe, Co, Ni, Cu, Rh, and Pd. Phys. Rev. B 1983, 27, 2049–2054. [Google Scholar] [CrossRef]
  61. Jank, W.; Hausleitner, C.; Hafner, J. Self-Consistent Electronic Structure of NixZr1-x Glasses. Europhys. Lett. 1991, 16, 473. [Google Scholar] [CrossRef]
  62. Hafner, J.; Hausleitner, C.; Jank, W.; Turek, I. First-principles calculations of the structural, electronic, and magnetic properties of transition-metal glasses. J. Non-Cryst. Solids 1992, 150, 307–313. [Google Scholar] [CrossRef]
  63. Bakonyi, I. Atomic volumes and local structure of metallic glasses. Acta Mater. 2005, 53, 2509–2520. [Google Scholar] [CrossRef]
  64. Bakonyi, I. Electronic properties and atomic structure of (Ti, Zr, Hf)-(Ni, Cu) metallic glasses. J. -Non-Cryst. Solids 1995, 180, 131–150. [Google Scholar] [CrossRef]
  65. Biljaković, K.; Remenyi, G.; Figueroa, I.A.; Ristić, R.; Pajić, D.; Kuršumović, A.; Starešinić, D.; Zadro, K.; Babić, E. Electronic structure and properties of (TiZrNbCu)1-xNix high entropy amorphous alloys. J. Alloys Compd. 2017, 695, 2661–2668. [Google Scholar] [CrossRef]
  66. Babić, E.; Pajić, D.; Zadro, K.; Biljaković, K.; Trontl, V.M.; Pervan, P.; Starešinić, D.; Figueroa, I.A.; Kuršumović, A.; Michalik, Š.; et al. Structure property relationship in (TiZrNbCu)1-x Nix metallic glasses. J. Mater. Res. 2018, 33, 3170–3183. [Google Scholar] [CrossRef]
  67. Ristić, R.; Figueroa, I.A.; Lachová, A.; Michalik, Š.; Mikšić Trontl, V.; Pervan, P.; Zadro, K.; Pajić, D.; Babić, E. Transition from high-entropy to Cu-based (TiZrNbNi)1-xCux metallic glasses. J. Appl. Phys. 2019, 126, 154105. [Google Scholar] [CrossRef]
  68. Figueroa, I.A.; Ristić, R.; Kuršumović, A.; Biljaković, K.; Starešinić, D.; Pajić, D.; Remenyi, G.; Babić, E. Properties of (TiZrNbCu)1-xNix metallic glasses. J. Alloys Compd. 2018, 745, 455–459. [Google Scholar] [CrossRef]
  69. Ristić, R.; Figueroa, I.A.; Salčinović Fetić, A.; Zadro, K.; Mikšić Trontl, V.; Pervan, P.; Babić, E. Transition from high-entropy to conventional (TiZrNbCu)1-xCox metallic glasses. J. Appl. Phys. 2021, 130, 195102. [Google Scholar] [CrossRef]
  70. Ristić, R.; Babić, E. Properties and atomic structure of amorphous zirconioum. Fiz. A 2005, 14, 97–106. [Google Scholar]
  71. Ristić, R.; Babić, E. Thermodynamic properties and atomic structure of amorphous zirconium. Mater. Sci. Eng. A 2007, 449–451, 569–572. [Google Scholar] [CrossRef]
  72. Ristić, R.; Babić, E.; Pajić, D.; Zadro, K.; Kuršumović, A.; Figueroa, I.; Davies, H.; Todd, I.; Varga, L.; Bakonyi, I. Properties and atomic structure of amorphous early transition metals. J. Alloys Compd. 2010, 504, S194–S197. [Google Scholar] [CrossRef]
  73. Tafra, E.; Basletić, M.; Ristić, R.; Babić, E.; Hamzić, A. Enhanced superconductivity in Hf-base metallic glasses. J. Phys. Condens. Matter 2008, 20, 425215. [Google Scholar] [CrossRef]
  74. Han, X.; Wu, G.; He, D.S.; Hong, X. Single-element amorphous metals. Interdiscip. Mater. 2024, 3, 480–491. [Google Scholar] [CrossRef]
  75. Senkov, O.N.; Gorsse, S.; Wheeler, R.; Payton, E.J.; Miracle, D.B. Effect of Re on the Microstructure and Mechanical Properties of NbTiZr and TaTiZr Equiatomic Alloys. Metals 2021, 11, 1819. [Google Scholar] [CrossRef]
  76. Senkov, O.; Rao, S.; Chaput, K.; Woodward, C. Compositional effect on microstructure and properties of NbTiZr-based complex concentrated alloys. Acta Mater. 2018, 151, 201–215. [Google Scholar] [CrossRef]
  77. Hu, S.; Li, T.; Li, Q.; Liu, D. Microstructure evolution, deformation mechanism, and mechanical properties of biomedical TiZrNb medium entropy alloy processed using equal channel angular pressing. Intermetallics 2022, 151, 107725. [Google Scholar] [CrossRef]
  78. Košuth, F.; Cedervall, J.; Ek, G.; Gabáni, S.; Pristáš, G.; Orendáč, M.; Bačkai, J.; Onufriienko, O.; Szabó, P.; Flachbart, K. Superconductivity in TiZrNb and TiZrNbHf bulk equimolar alloys. Low Temp. Phys. 2024, 50, 663–667. [Google Scholar] [CrossRef]
  79. Bracq, G.; Laurent-Brocq, M.; Perrière, L.; Pirès, R.; Joubert, J.M.; Guillot, I. The fcc solid solution stability in the Co-Cr-Fe-Mn-Ni multi-component system. Acta Mater. 2017, 128, 327–336. [Google Scholar] [CrossRef]
  80. Calvayrac, Y.; Chevalier, J.P.; Harmelin, M.; Quivy, A.; Bigot, J. On the stability and structure of Cu-Zr based glasses. Philos. Mag. B 1983, 48, 323–332. [Google Scholar] [CrossRef]
  81. Kittel, C. Introduction to Solid State Physics, 8th ed.; Wiley: Hoboken, NJ, USA, 2005. [Google Scholar]
  82. Qi, L. Effects of electronic structures on mechanical properties of transition metals and alloys. Comput. Mater. Sci. 2019, 163, 11–16. [Google Scholar] [CrossRef]
  83. Dynes, R.C.; Varma, C.M. Superconductivity and electronic density of states. J. Phys. F Met. Phys. 1976, 6, L215. [Google Scholar] [CrossRef]
  84. Remenyi, G.; Biljaković, K.; Starešinić, D.; Dominko, D.; Ristić, R.; Babić, E.; Figueroa, I.A.; Davies, H.A. Looking for footprint of bulk metallic glass in electronic and phonon heat capacities of Cu55Hf45-xTix alloys. Appl. Phys. Lett. 2014, 104, 171906. [Google Scholar] [CrossRef]
  85. Bakonyi, I.; Ebert, H.; Liechtenstein, A.I. Electronic structure and magnetic susceptibility of the different structural modifications of Ti, Zr, and Hf metals. Phys. Rev. B 1993, 48, 7841–7849. [Google Scholar] [CrossRef]
  86. Sonier, J.E.; Hundley, M.F.; Thompson, J.D. Effect of delocalized vortex core states on the specific heat of Nb. Phys. Rev. B 2006, 73, 132504. [Google Scholar] [CrossRef]
  87. R. Ristić, M.S.; Babić, E. Correlation between mechanical, thermal and electronic properties in Zr–Ni, Cu amorphous alloys. Philos. Mag. 2007, 87, 5629–5637. [Google Scholar] [CrossRef]
  88. Collings, E.; Smith, R. The magnetic susceptibility of niobium. J. Less Common Met. 1972, 27, 389–401. [Google Scholar] [CrossRef]
  89. Place, C.M.; Rhodes, P. Paramagnetic orbital susceptibilities of transition metals. Phys. Status Solidi (b) 1971, 47, 475–486. [Google Scholar] [CrossRef]
  90. Koželj, P.; Vrtnik, S.; Jelen, A.; Jazbec, S.; Jagličić, Z.; Maiti, S.; Feuerbacher, M.; Steurer, W.; Dolinšek, J. Discovery of a Superconducting High-Entropy Alloy. Phys. Rev. Lett. 2014, 113, 107001. [Google Scholar] [CrossRef]
  91. Sun, L.; Cava, R.J. High-entropy alloy superconductors: Status, opportunities, and challenges. Phys. Rev. Mater. 2019, 3, 090301. [Google Scholar] [CrossRef]
  92. Kim, G.; Lee, M.H.; Yun, J.H.; Rawat, P.; Jung, S.G.; Choi, W.; You, T.S.; Kim, S.J.; Rhyee, J.S. Strongly correlated and strongly coupled s-wave superconductivity of the high-entropy alloy Ta1/6Nb2/6Hf1/6Zr1/6Ti1/6 compound. Acta Mater. 2020, 186, 250–256. [Google Scholar] [CrossRef]
  93. Li, L.; Tian, H.; Hu, X.; Zeng, L.; Li, K.; Yu, P.; Wang, K.; Chen, R.; Xiang, Z.; Yao, D.X.; et al. Large upper critical fields and strong coupling superconductivity in the medium-entropy alloy (Ti1/3Hf1/3Ta1/3)1-xNbx. Supercond. Sci. Technol. 2024, 38, 015025. [Google Scholar] [CrossRef]
  94. Jung, S.G.; Han, Y.; Kim, J.H.; Hidayati, R.; Rhyee, J.S.; Lee, J.M.; Kang, W.N.; Choi, W.S.; Jeon, H.R.; Suk, J.; et al. High critical current density and high-tolerance superconductivity in high-entropy alloy thin films. Nat. Commun. 2022, 13, 3373. [Google Scholar] [CrossRef]
  95. Xu, X.; Yang, W.; Song, H.; Wang, J.; Yu, L.; Ren, Z.; Liu, B. Structural sequence and superconductivity in high-entropy Mo-W-Re-Ru-Pd alloys. Scr. Mater. 2024, 243, 115986. [Google Scholar] [CrossRef]
  96. Altounian, Z.; Strom-Olsen, J.O. Superconductivity and spin fluctuations in M-Zr metallic glasses (M = Cu,Ni,Co,and Fe). Phys. Rev. B 1983, 27, 4149–4156. [Google Scholar] [CrossRef]
  97. Karkut, M.G.; Hake, R.R. Upper critical fields and superconducting transition temperatures of some zirconium-base amorphous transition-metal alloys. Phys. Rev. B 1983, 28, 1396–1418. [Google Scholar] [CrossRef]
  98. Stolze, K.; Tao, J.; von Rohr, F.O.; Kong, T.; Cava, R.J. Sc–Zr–Nb–Rh–Pd and Sc–Zr–Nb–Ta–Rh–Pd High-Entropy Alloy Superconductors on a CsCl-Type Lattice. Chem. Mater. 2018, 30, 906–914. [Google Scholar] [CrossRef]
  99. Babić, E.; Ristić, R.; Miljak, M.; Scott, M.G. Electronic and magnetic properties of Zr-3d glasses. In Proceedings of the 4th International Conference on Rapidly Quenched Metals, Sendai, Japan, 24–28 August 1981; The Japan Institute of Metals: Sendai, Japan, 1982; pp. 1079–1082. [Google Scholar]
  100. Tinkham, M. Introduction to Superconductivity, 2nd ed.; Dover Publications: Mineola, NY, USA, 2004. [Google Scholar]
  101. McMillan, W.L. Transition Temperature of Strong-Coupled Superconductors. Phys. Rev. 1968, 167, 331–344. [Google Scholar] [CrossRef]
  102. Clogston, A.M. Upper Limit for the Critical Field in Hard Superconductors. Phys. Rev. Lett. 1962, 9, 266–267. [Google Scholar] [CrossRef]
  103. Wu, J.; Liu, B.; Cui, Y.; Zhu, Q.; Xiao, G.; Wang, H.; Wu, S.; Cao, G.; Ren, Z. Polymorphism and superconductivity in the V-Nb-Mo-Al-Ga high-entropy alloys. Sci. China Mater. 2020, 63, 823–831. [Google Scholar] [CrossRef]
  104. Gabáni, S.; Cedervall, J.; Ek, G.; Pristáš, G.; Orendáč, M.; Bačkai, J.; Onufriienko, O.; Gažo, E.; Flachbart, K. Search for superconductivity in hydrides of TiZrNb, TiZrNbHf and TiZrNbHfTa equimolar alloys. Phys. B Condens. Matter 2023, 648, 414414. [Google Scholar] [CrossRef]
  105. Werthamer, N.R.; Helfand, E.; Hohenberg, P.C. Temperature and Purity Dependence of the Superconducting Critical Field, Hc2. III. Electron Spin and Spin-Orbit Effects. Phys. Rev. 1966, 147, 295–302. [Google Scholar] [CrossRef]
  106. Banno, N. Low-temperature superconductors: Nb3Sn, Nb3Al, and NbTi. Superconductivity 2023, 6, 100047. [Google Scholar] [CrossRef]
  107. Novosel, N.; Galić, S.; Pajić, D.; Skoko, Ž.; Lončarek, I.; Mustapić, M.; Zadro, K.; Babić, E. Enhancement of the critical current density in MgB2 wires doped with Ni nanoparticles. Supercond. Sci. Technol. 2012, 25, 095018. [Google Scholar] [CrossRef]
  108. Xun, K.; Zhang, B.; Wang, Q.; Zhang, Z.; Ding, J.; Ma, E. Local chemical inhomogeneities in TiZrNb-based refractory high-entropy alloys. J. Mater. Sci. Technol. 2023, 135, 221–230. [Google Scholar] [CrossRef]
  109. Collver, M.M.; Hammond, R.H. Superconductivity in “Amorphous” Transition-Metal Alloy Films. Phys. Rev. Lett. 1973, 30, 92–95. [Google Scholar] [CrossRef]
  110. Matthias, B.T. Empirical Relation between Superconductivity and the Number of Valence Electrons per Atom. Phys. Rev. 1955, 97, 74–76. [Google Scholar] [CrossRef]
Figure 1. The lattice parameter a of ( TiZrNbNi ) 1 x Cu x and ( TiZrNbCu ) 1 x Ni x glassy alloys (red triangles and green circles, respectively) for various x. The thick light blue line denotes linear extrapolation to x tot 0 , and x tot 1 , i.e., to glassy TiZrNb alloy and amorphous Cu, respectively. Data are adapted from Refs. [39,67,68,69]. Arrows denote extrapolated values of lattice parameter a = 3.42 Å and a = 2.87 Å, for x tot = 0 and x tot = 1 , respectively.
Metals 15 00719 g001
Figure 2. The Sommerfeld coefficient γ (left panel) and dressed density of states N ( E F ) at E F (right panel) of ( TiZrNbNi ) 1 x Cu x , ( TiZrNbCu ) 1 x Ni x , and ( TiZrNbCu ) 1 x Co x glassy alloys (red triangles, green circles, and blue squares, respectively) for various x. Data are adapted from Refs. [39,65,66,68,69]. Left and right panel: the thick light blue line denotes linear extrapolation to x tot 0 , i.e., extrapolation to the glassy TiZrNb alloy. Arrows denote extrapolated values for γ = 6.2 mJ/mol K 2 , and N ( E F ) = 2.6 ( at eV ) 1 .
Metals 15 00719 g002
Figure 3. The magnetic susceptibility χ exp of ( TiZrNbNi ) 1 x Cu x , ( TiZrNbCu ) 1 x Ni x , and ( TiZrNbCu ) 1 x Co x glassy alloys (red triangles, green circles, and blue squares, respectively) for various x. Data are adapted from Refs. [39,65,66,67,68,69]. The thick light blue line denotes linear extrapolation to x tot 0 , i.e., to the glassy TiZrNb alloy. Arrows denote extrapolated values of magnetic susceptibility χ exp = 2.0 mJ/ T 2 mol.
Metals 15 00719 g003
Figure 4. The superconductivity transition temperature T c of ( TiZrNbNi ) 1 x Cu x , ( TiZrNbCu ) 1 x Ni x , and ( TiZrNbCu ) 1 x Co x glassy alloys (red triangles, green circles, and blue squares, respectively) for various x. Data are adapted from Refs. [54,57]. The thick light blue line denotes linear extrapolation to x tot 0 , i.e., to the glassy TiZrNb alloy. Arrows denote extrapolated values of transition temperature T c = 8.0 K.
Metals 15 00719 g004
Figure 5. The upper critical field H c 2 ( 0 ) of ( TiZrNbNi ) 1 x Cu x , ( TiZrNbCu ) 1 x Ni x , and ( TiZrNbCu ) 1 x Co x glassy alloys (red triangles, green circles, and blue squares, respectively) for various x. Data are adapted from Refs. [54,57]. The thick light blue line denotes linear extrapolation to x tot 0 , i.e., to the glassy TiZrNb alloy. Arrows denote extrapolated value of upper critical field H c 2 ( 0 ) = 20 T.
Metals 15 00719 g005
Figure 6. The coherence length ξ ( 0 ) of ( TiZrNbNi ) 1 x Cu x , ( TiZrNbCu ) 1 x Ni x , and ( TiZrNbCu ) 1 x Co x glassy alloys (red triangles, green circles, and blue squares, respectively) for various x. The thick light blue line denotes linear extrapolation to x tot 0 , i.e., to the glassy TiZrNb alloy. Arrows denote extrapolated value of coherence length ξ ( 0 ) = 40 Å.
Metals 15 00719 g006
Figure 7. The superconductivity transition temperature T c dependence on VEC for ( TiZrNbNi ) 1 x Cu x , ( TiZrNbCu ) 1 x Ni x , and ( TiZrNbCu ) 1 x Co x glassy alloys, and other TE-TL alloys (both HEAs and the conventional one). Gray crosses correspond to data for amorphous alloys, the gray dashed line corresponds to data for classic crystalline alloys (data are adapted from Refs. [109,110]). The light blue band is a guide to the eye for amorphous alloy data. The pink star symbol denotes the (single) value of T c (Reprinted from Ref. [78]) for the crystalline TiZrNb. Red triangles, green circles, and blue squares correspond to ( TiZrNbNi ) 1 x Cu x , ( TiZrNbCu ) 1 x Ni x , and ( TiZrNbCu ) 1 x Co x , respectively (data are adapted from Refs. [54,57]); on the right side of the plot is their dependence on VEC; on left side of the plot is their dependence on effective VEC (see text).
Metals 15 00719 g007
Disclaimer/Publisher’s Note: The statements, opinions and data contained in all publications are solely those of the individual author(s) and contributor(s) and not of MDPI and/or the editor(s). MDPI and/or the editor(s) disclaim responsibility for any injury to people or property resulting from any ideas, methods, instructions or products referred to in the content.

