Article

Characterization of Thermophysical Properties and Crystallization Behavior of Industrial Mold Fluxes

1
Institute of Iron and Steel Technology, Technische Universität Bergakademie Freiberg, Leipziger Straße 34, 09599 Freiberg, Germany
2
ArcelorMittal Eisenhüttenstadt GmbH, Werkstraße 1, 15890 Eisenhüttenstadt, Germany
3
Department of Iron and Steel Metallurgy, Ukrainian State University of Science and Technologies, Lazaryana Street 2, 49010 Dnipro, Ukraine
*
Author to whom correspondence should be addressed.
Metals 2025, 15(7), 715; https://doi.org/10.3390/met15070715
Submission received: 13 May 2025 / Revised: 10 June 2025 / Accepted: 24 June 2025 / Published: 26 June 2025
(This article belongs to the Special Issue Secondary Refining)

Abstract

This study explores the thermophysical properties and crystallization behavior of two industrial Mold Fluxes (MF1 and MF2) used in continuous steel casting. Viscosity, density, and surface tension were measured using the Rotating Bob Viscometry (RBV) and the Maximum Bubble Pressure (MBP) method, while crystallization dynamics were assessed via the Single Hot Thermocouple Technique (SHTT). Both fluxes showed temperature-dependent viscosity with distinct break temperatures influenced by chemical composition. MF1 had higher viscosity and activation energy (127.72 kJ mol−1) than MF2 (112.11 kJ mol−1) due to its higher Al2O3 content. Density and surface tension decreased linearly from 1523 to 1623 K, with values of 2642–2618 kg m−3 and 299–291 mN m−1 for MF1, and 2708–2656 kg m−3 and 348–305 mN m−1 for MF2. Crystallization analysis showed that MF1 required higher cooling rates (critical cooling rates: 21 K s−1 vs. 18 K s−1 for MF2) for glass formation, highlighting its greater glass-former content.

1. Introduction

Continuous Casting (CC) is a critical process in steel production, where molten steel is transformed into semi-finished shapes such as slabs, rounds, blooms, or billets. In this process, molten steel from the ladle is transferred to the tundish through a ladle shroud, ensuring a controlled flow and minimizing contamination. From the tundish, the liquid steel is directed into an oscillating, water-cooled copper mold via a Submerged Entry Nozzle (SEN). Within the mold, the steel undergoes initial solidification, marking the primary cooling stage and forming the outer shell of the desired shape. Mold Fluxes (MFs) are added to the molten steel surface as it enters the mold to form a protective layer and enhance the casting process [1]. MFs play several crucial roles, including providing thermal insulation, protecting molten steel from oxidation, absorbing Non-Metallic Inclusions (NMIs), lubricating the strand, and controlling heat transfer between the mold and steel shell [2,3,4]. Despite its essential functions, several challenges persist in the continuous casting of steel, particularly regarding surface quality and defect formation [2]. The MF additions form various layers on the free liquid steel surface, each providing specific functions. These functions can be grouped based on their contact zone [5]:
-
Group 1: contact with liquid steel (thermal insulation, prevention of reoxidation, inclusion entrapment).
-
Group 2: contact with solidified steel (lubrication between the solidified steel shell and the mold, heat transfer control).
The thermophysical properties of the liquid MF significantly influence the functions in Group 1. Previous research indicates that mold flux entrainment primarily depends on the thermophysical properties of the materials involved, such as density, viscosity, and surface tension of the steel and slag [6].
Emulsification or entrainment of liquid mold flux in the steel melt is a significant issue in producing clean products and is schematized in the work of Thomas [7]. This phenomenon, characterized by droplets of molten mold powder being drawn into the molten steel pool inside a continuous casting mold, can cause surface and internal defects if the entrained particles become trapped in the solidifying steel [8]. At the steel–slag interface, slag entrainment occurs due to two types of flow: a large-scale shear flow and a small-scale interfacial flow, known as Marangoni flow. The Marangoni flow is driven by variations in interfacial tension, which can result from chemical reactions or other local changes. In the continuous-casting process, the interface between steel and slag should be stable to avoid the entrainment of slag droplets forming NMIs [9]. Figure 1 illustrates the molten flux entrainment into steel during continuous casting in the mold.
Nine mechanisms of mold flux entrainment, all related to the thermophysical properties of the mold flux, have been identified: meniscus level fluctuations, meniscus freezing and hook formation, argon bubble interactions, liquid mold slag crawling, von Kármán vortex formation, meniscus standing wave instability, shear layer instability, upward flow impinging on the meniscus, and meniscus balding [6].
MFs are synthetic slags comprising a complex mix of oxides, minerals, and carbonaceous materials. The main oxides include silica (SiO2), calcium oxide (CaO), sodium oxide (Na2O), aluminum oxide (Al2O3), and magnesium oxide (MgO). The CaO/SiO2 ratios range from 0.7 to 1.3, with additions of calcium fluoride (CaF2) and carbonaceous materials. The oxides used in mold fluxes can be categorized based on their effects on the liquid flux structure (Table 1): glass formers (acidic oxides), modifiers (basic oxides), alkali oxides, fluidizing oxides, and melting control (carbon in graphite form) [5].
In summary, modifications in the chemical composition of MF affect its liquid structure, altering its thermophysical properties. These changes influence crystallization behavior, impact heat flow, and affect the slab solidification process, ultimately affecting the surface quality of the steel slab and mold powder consumption. Chebykin et al. investigated the influence of the CaO/SiO2 ratio and temperature on some thermophysical properties of MF. They found that the higher CaO/SiO2 ratio decreases the viscosity and activation energy (Ea) and increases the break temperature (Tbr). It was also found that the decrease in CaF2 leads to an increase in viscosity and a decrease in Tbr [1].
Li et al. reported that the crystallinity of mold fluxes increases with MnO content up to 4 wt.% but decreases when the MnO content exceeds this threshold [10]. The addition of MnO reduces the crystallization fraction and the melting temperature of the MF [11]. Furthermore, MnO addition is also effective in lowering the Tbr, viscosity, and liquidus temperature (Tliq) of the MF [12]. The increase in Al2O3 content up to 20 wt.% leads to a rise in the Critical Cooling Rate (CCR) and an increase in crystallization temperature (Tcrys). Additionally, higher Al2O3 content shortens the incubation time of MF [13]. According to Wang et al., Al2O3 is also attributed to an increase in viscosity and can inhibit phase crystallization [14]. The addition of Na2O to CaO-Al2O3 mold fluxes resulted in a reduction in viscosity (1423–1573 K), a decrease in activation energy (Ea), and a lower break temperature (Tbr) [15].
This study investigates the thermophysical properties of two industrial mold fluxes, selected based on their industrial significance in the production of low-alloyed flat products and, more importantly, their distinct chemical compositions—particularly variations in Al2O3, MnO, Na2O, CaF2, and C content. These compositional differences significantly influence key properties such as viscosity, surface tension, density, and crystallization behavior. Viscosity measurements are conducted using the Rotating Bob Viscometer (RBV), while density and surface tension are determined through the Maximum Bubble Pressure (MBP) method. Crystallization behavior is analyzed via the Single Hot Thermocouple Technique (SHTT). Additionally, mathematical models are employed to validate experimental results and facilitate discussions. This comprehensive approach allows for a detailed characterization of mold flux behavior in both the liquid state and during solidification, enabling a better understanding of their performance in molten flux emulsification. By comparing these two fluxes, this study aims to provide valuable insights that contribute to optimizing mold flux selection for enhanced casting efficiency and product quality.

2. Experimental

2.1. Materials

Two industrial mold fluxes in granulate form were selected to perform the investigations of this work. Both granulates were firstly ground and powder samples were sent for chemical analysis. The mold fluxes in powder form were then pre-melted within a Pt crucible in a High Temperature-Controlled Atmosphere Furnace (HT-1400-G, 9 kW, Linn High Temp GmbH, Hirschbach, Bavaria, Germany) at a temperature of 1573 K for 10 min, and then cast in a copper plate. The melting was performed rapidly to minimize CaF2 loss. Their chemical compositions, in the form of as-received and after pre-melting, were measured with an XRF (X-ray Fluorescent) spectrometer S8 Tiger (Bruker AXS GmbH, Karlsruhe, Baden-Württemberg, Germany) and are presented in Table 2.
The as-received MF1 and MF2 samples contained a high carbon content of 8.59 and 14.34 wt.%, respectively. During the pre-melting process, the carbon was nearly fully oxidized (reduced to 0.03 and 0.14 wt.% post-melting), leading to significant mass loss. Because XRF normalizes the oxide composition based on the total remaining oxides after ignition, any mass loss from non-oxide species, particularly carbon, artificially increases the reported relative concentration of remaining oxides, such as Na2O.
Hence, the observed increase in Na2O from 5.54 to 7.81 wt.% in MF1 and from 3.76 wt.% to 8.53 wt.% in MF2 does not necessarily indicate a net gain of sodium oxide but is rather a reflection of the change in total oxide mass after the volatile species were removed. This effect is particularly pronounced in MF2 due to its initially higher carbon content. The same trend was not observed in MF1 to the same extent because it began with a lower carbon concentration (8.59 wt.%) and thus experienced a smaller relative mass loss during pre-melting.
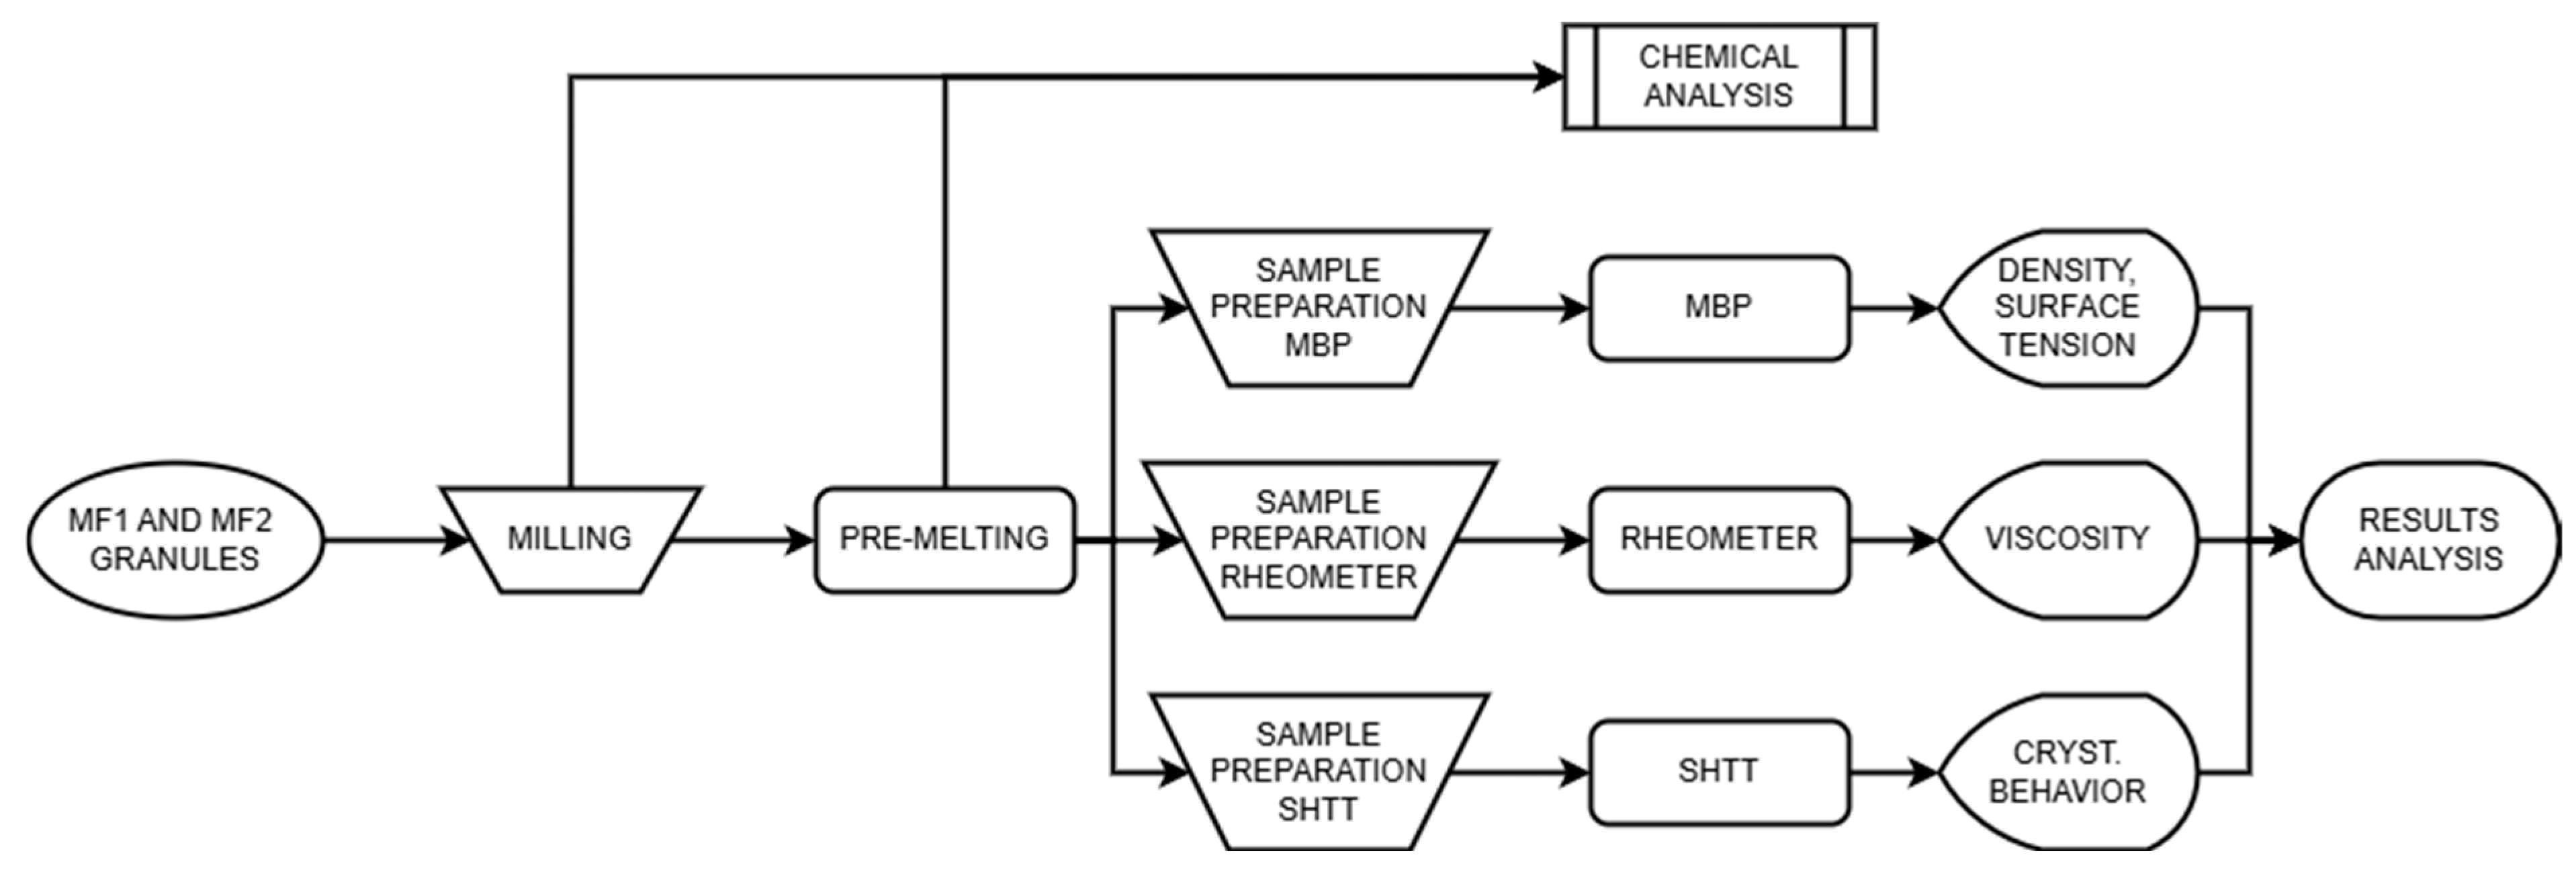
Figure 2 presents a flowchart outlining the experimental procedure for this study. The pre-melted samples were crushed and subsequently remelted in molybdenum (Mo) crucibles for investigation using the RBV and the MBP method. For this purpose, a medium-frequency (22–40 kHz, 40 kW) coreless electric induction melting furnace, model MFG-40 (Linn High Temp GmbH, Hirschbach, Bavaria, Germany), was used. This furnace incorporates a graphite susceptor surrounding the Mo crucible to allow resistive heating of the sample through induced currents. Approximately 30–35 g of the crushed pre-molten flux was placed into the Mo crucible, which was then heated within the furnace at a rate of 15 K min−1 until reaching 1673 K. A holding time of 15 min was applied for homogenization before cooling at a rate of 20 K min−1. The furnace atmosphere consisted of high-purity argon gas (99.9998 wt.%, with approximately 2 ppm O2), and the temperature was monitored by a type-B thermocouple controlled via a Eurotherm controller (Eurotherm Germany GmbH, Limburg an der Lahn, Hessen, Germany). An exhaust system was positioned adjacent to the furnace for gas removal.
All thermophysical property measurements (viscosity, density and surface tension) and crystallization behavior analysis were conducted on pre-melted, i.e., chemically homogenized, samples. The changes observed in the chemical composition are consistent with expectations after carbon burnout and are accounted for in the interpretation of the results. Discussion and conclusions are based on the actual measurement conditions post carbon removal.

2.2. Rotating Bob Viscometry (RBV)

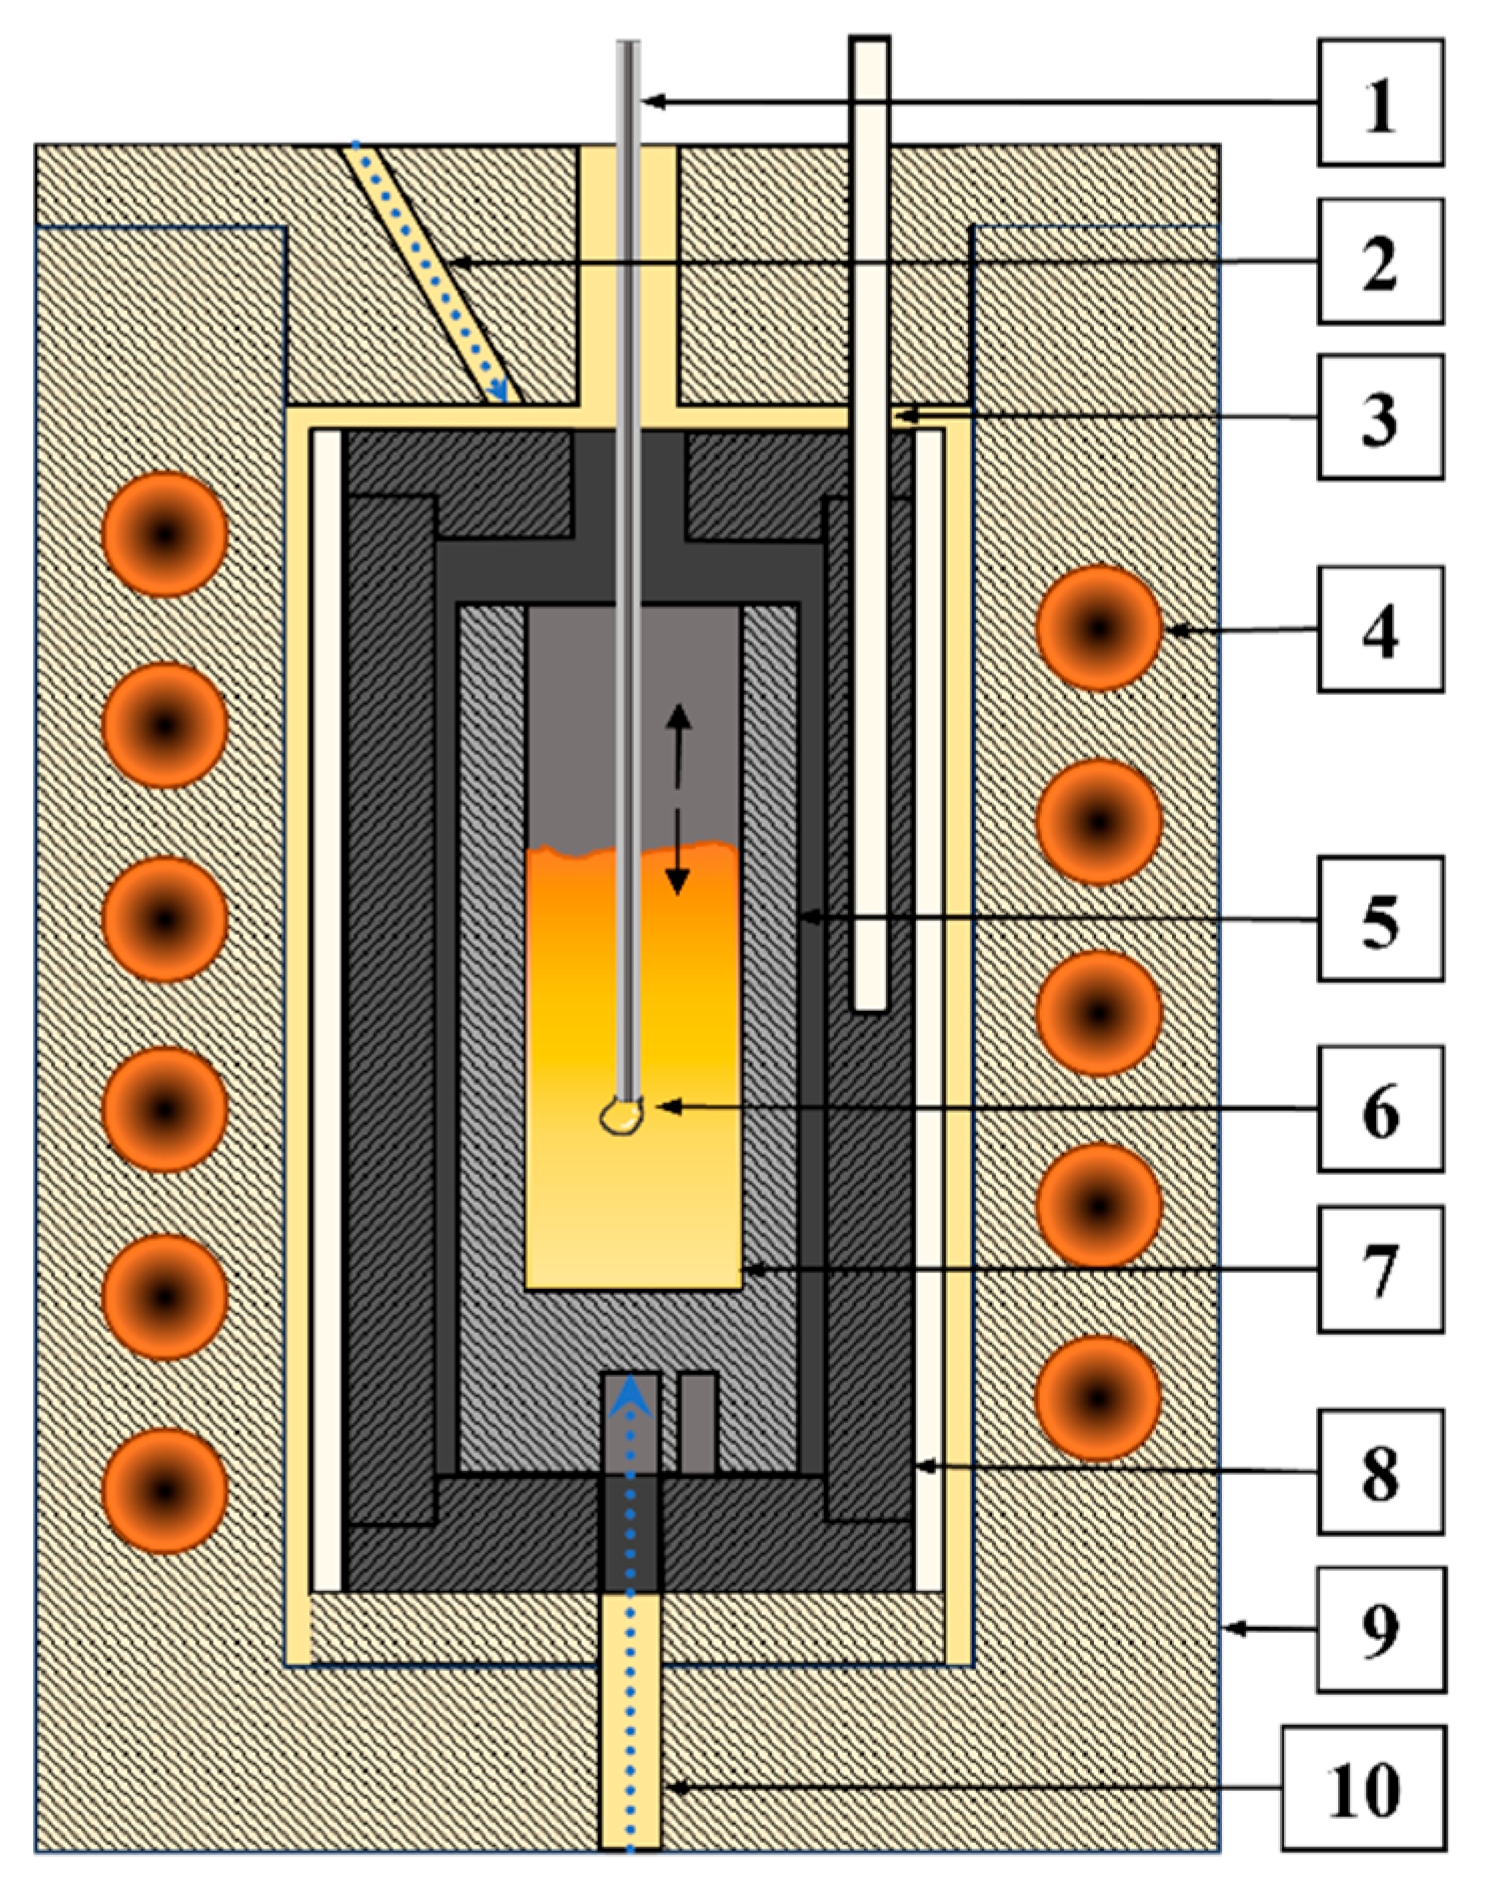
The RBV setup consists of a rheometer (Physica MCR 301, Anton Paar GmbH, Ostfildern, Baden-Württemberg, Germany), a high-frequency coreless induction furnace (10 kW, 100 kHz, manufactured by Linn High Temp GmbH, Hirschbach, Bavaria, Germany), an argon gas injection system, an exhaust system, a type-B thermocouple, and a data processing center. Several authors have employed this method [1,16,17,18,19]. Before initiating the experiments, the proper positioning and alignment of the Mo rotating bob and the Mo crucible containing the sample must be completed. Positioning of the rotating bob was facilitated by a CDC-type camera (The Imaging Source Europe GmbH, Bremen, Bremen, Germany) and a standard light source, before placing the graphite susceptor and positioning the coreless induction furnace around the Mo crucible. Once the system was positioned, the Anton Paar software (v2.62, 2004) verified the freedom of movement of the Mo rotating bob, ensuring that it did not contact the Mo crucible wall, which would otherwise introduce measurement errors. The furnace chamber was sealed, with argon gas injected at 60 L h−1 through the top inlet and 120 L h−1 through the bottom inlet. A schematic illustration of the RBV method during measurement is presented in Figure 3.
The rheometer controls the Mo rotating bob at the end of a Mo rod, with the rotation set to a fixed rpm. Consequently, the difference in torque is measured, and the dynamic viscosity is calculated according to Equation (1). The rheometer and thermocouple are connected to a data processing center, where data are monitored and processed via the Anton Paar software. Heating was conducted at a rate of 20 K min−1 up to 1603 K, followed by a 15 min holding period for homogenization. Data acquisition and measurements began simultaneously with cooling at a rate of 10 K min−1. The calculated dynamic viscosity values derived from the measured torque were recorded in a diagram as a function of temperature. The experiment was halted as soon as the motion of the rotating bob was interrupted due to sample solidification, occurring at temperatures between 1413 and 1383 K for MF1 and MF2, respectively. The system was then reheated to 1603 K to restart a new measurement. The viscosity measurement was only carried out twice, as the line of the viscosity plot as a function of temperature for the second measurement overlapped the first, indicating the stability of the experiment.
η = M 8 · π 2 · n · H b · 1 R b 2 1 R m c 2
Here, [η] = Pa s is the dynamic viscosity, [M] = N m is the torque, [n] = rpm is the number of revolutions per minute, [Hb] = m is the height of the bob, [Rb] = m is the radius of the bob and [Rmc] = m is the radius of the Mo crucible. The measuring depth was found according to Equation (2) in the work of Chebykin et al. [17]. Errors attached to this experiment are found in the work of Heller et al. [16]. The primary sources of error in the temperature-dependent measurements of thermophysical properties arise from the use of type-B thermocouples, which have a typical accuracy of ±5 K. In the RBV method, additional uncertainties stem from the alignment of the Mo crucible and the rotating bob—specifically obliquity and eccentricity—which can introduce slight deviations in torque measurements and thus affect viscosity calculations.

2.3. Maximum Bubble Pressure (MBP) Method

The MBP setup includes a coreless electric induction furnace (HFG10, 10 kW, 350 kHz, provided by ITG Induktionsanlagen GmbH, Hirschhorn, Hessen, Germany), an argon gas injection system (for maintaining an inert atmosphere and for bubble injection), an exhaust system, an electric motor to control capillary movement, a type-B thermocouple, and a data processing center. A few authors have employed this technique in their work [1,18,20]. A schematic illustration of the MBP method employed at IEST is shown in Figure 4. In this configuration, the argon flow rate is set to 120 L h−1, with heating conducted at 15 K min−1, followed by a 15 min holding period. From the top, a Mo capillary measuring 400 mm in length, with an outer diameter of 3.2 mm and an inner diameter of approximately 2.5 mm, is centered and immersed in the molten mold flux to produce argon bubbles at a specified rate. To ensure clean bubble detachment during the experiments, the capillary tip was carefully sharpened using SiC sandpaper (600 mesh) on a Metasinex wet grinding machine. Argon gas injection is managed with a pressure transmitter (Flow-bus, Bronkhorst Deutschland Nord GmbH, Kamen, Nordrhein-Westphalen, Germany), set at 0.3 mL min−1. The z-axis position (indicated by up and down arrows in the Mo-crucible) of the Mo capillary is adjusted by an electric driving motor, providing a precision of 0.01 mm.
To obtain density values, the dependence of the MBP as a function of immersion depth must be determined. The capillary is initially immersed in the molten slag to establish a reference “zero” touch point, after which it is lowered to a depth of 4 mm. Data recording then begins as the capillary is immersed to a maximum depth of 20 mm and ends when the capillary is subsequently returned to 4 mm. This procedure was repeated at least three times per temperature for each sample to ensure reproducibility. The density of the liquid mold flux is calculated using Equation (2):
ρ = Δ p m a x . Δ h c o r r . × g
Here, [ρ] = kg m−3 is the density, [Δpmax.] = bar is the maximum bubble pressure, [Δhcorr.] = m is the corrected immersion depth and [g] = m s−2 is the gravitational acceleration.
From the obtained values of density and using the corrected version of the Young–Laplace equation, the surface tension of the liquid mold flux can be determined (Equation (3)):
σ = r p 2 × 1 2 3 r ρ g p 1 6 r ρ g p 2
where [σ] = N m−1 is the surface tension, [r] = m is the capillary tip radius, and [p] = bar represents the pressure inside the bubble, which is the maximum bubble pressure subtracted by the hydrostatic pressure of the molten flux. Complete information about the theoretical background, apparatus, and measurement procedure with the MBP method can be found in Bellé et al. [21]. The depth correction of the melt was brought by Dubberstein and Heller (2013) [22]. For the MBP method, aside from thermocouple accuracy, the formation of solid phases during cooling can interfere with bubble formation and detachment at the capillary tip, leading to deviations in pressure readings and thus in calculated density and surface tension.

2.4. Single Hot Thermocouple Technique (SHTT)

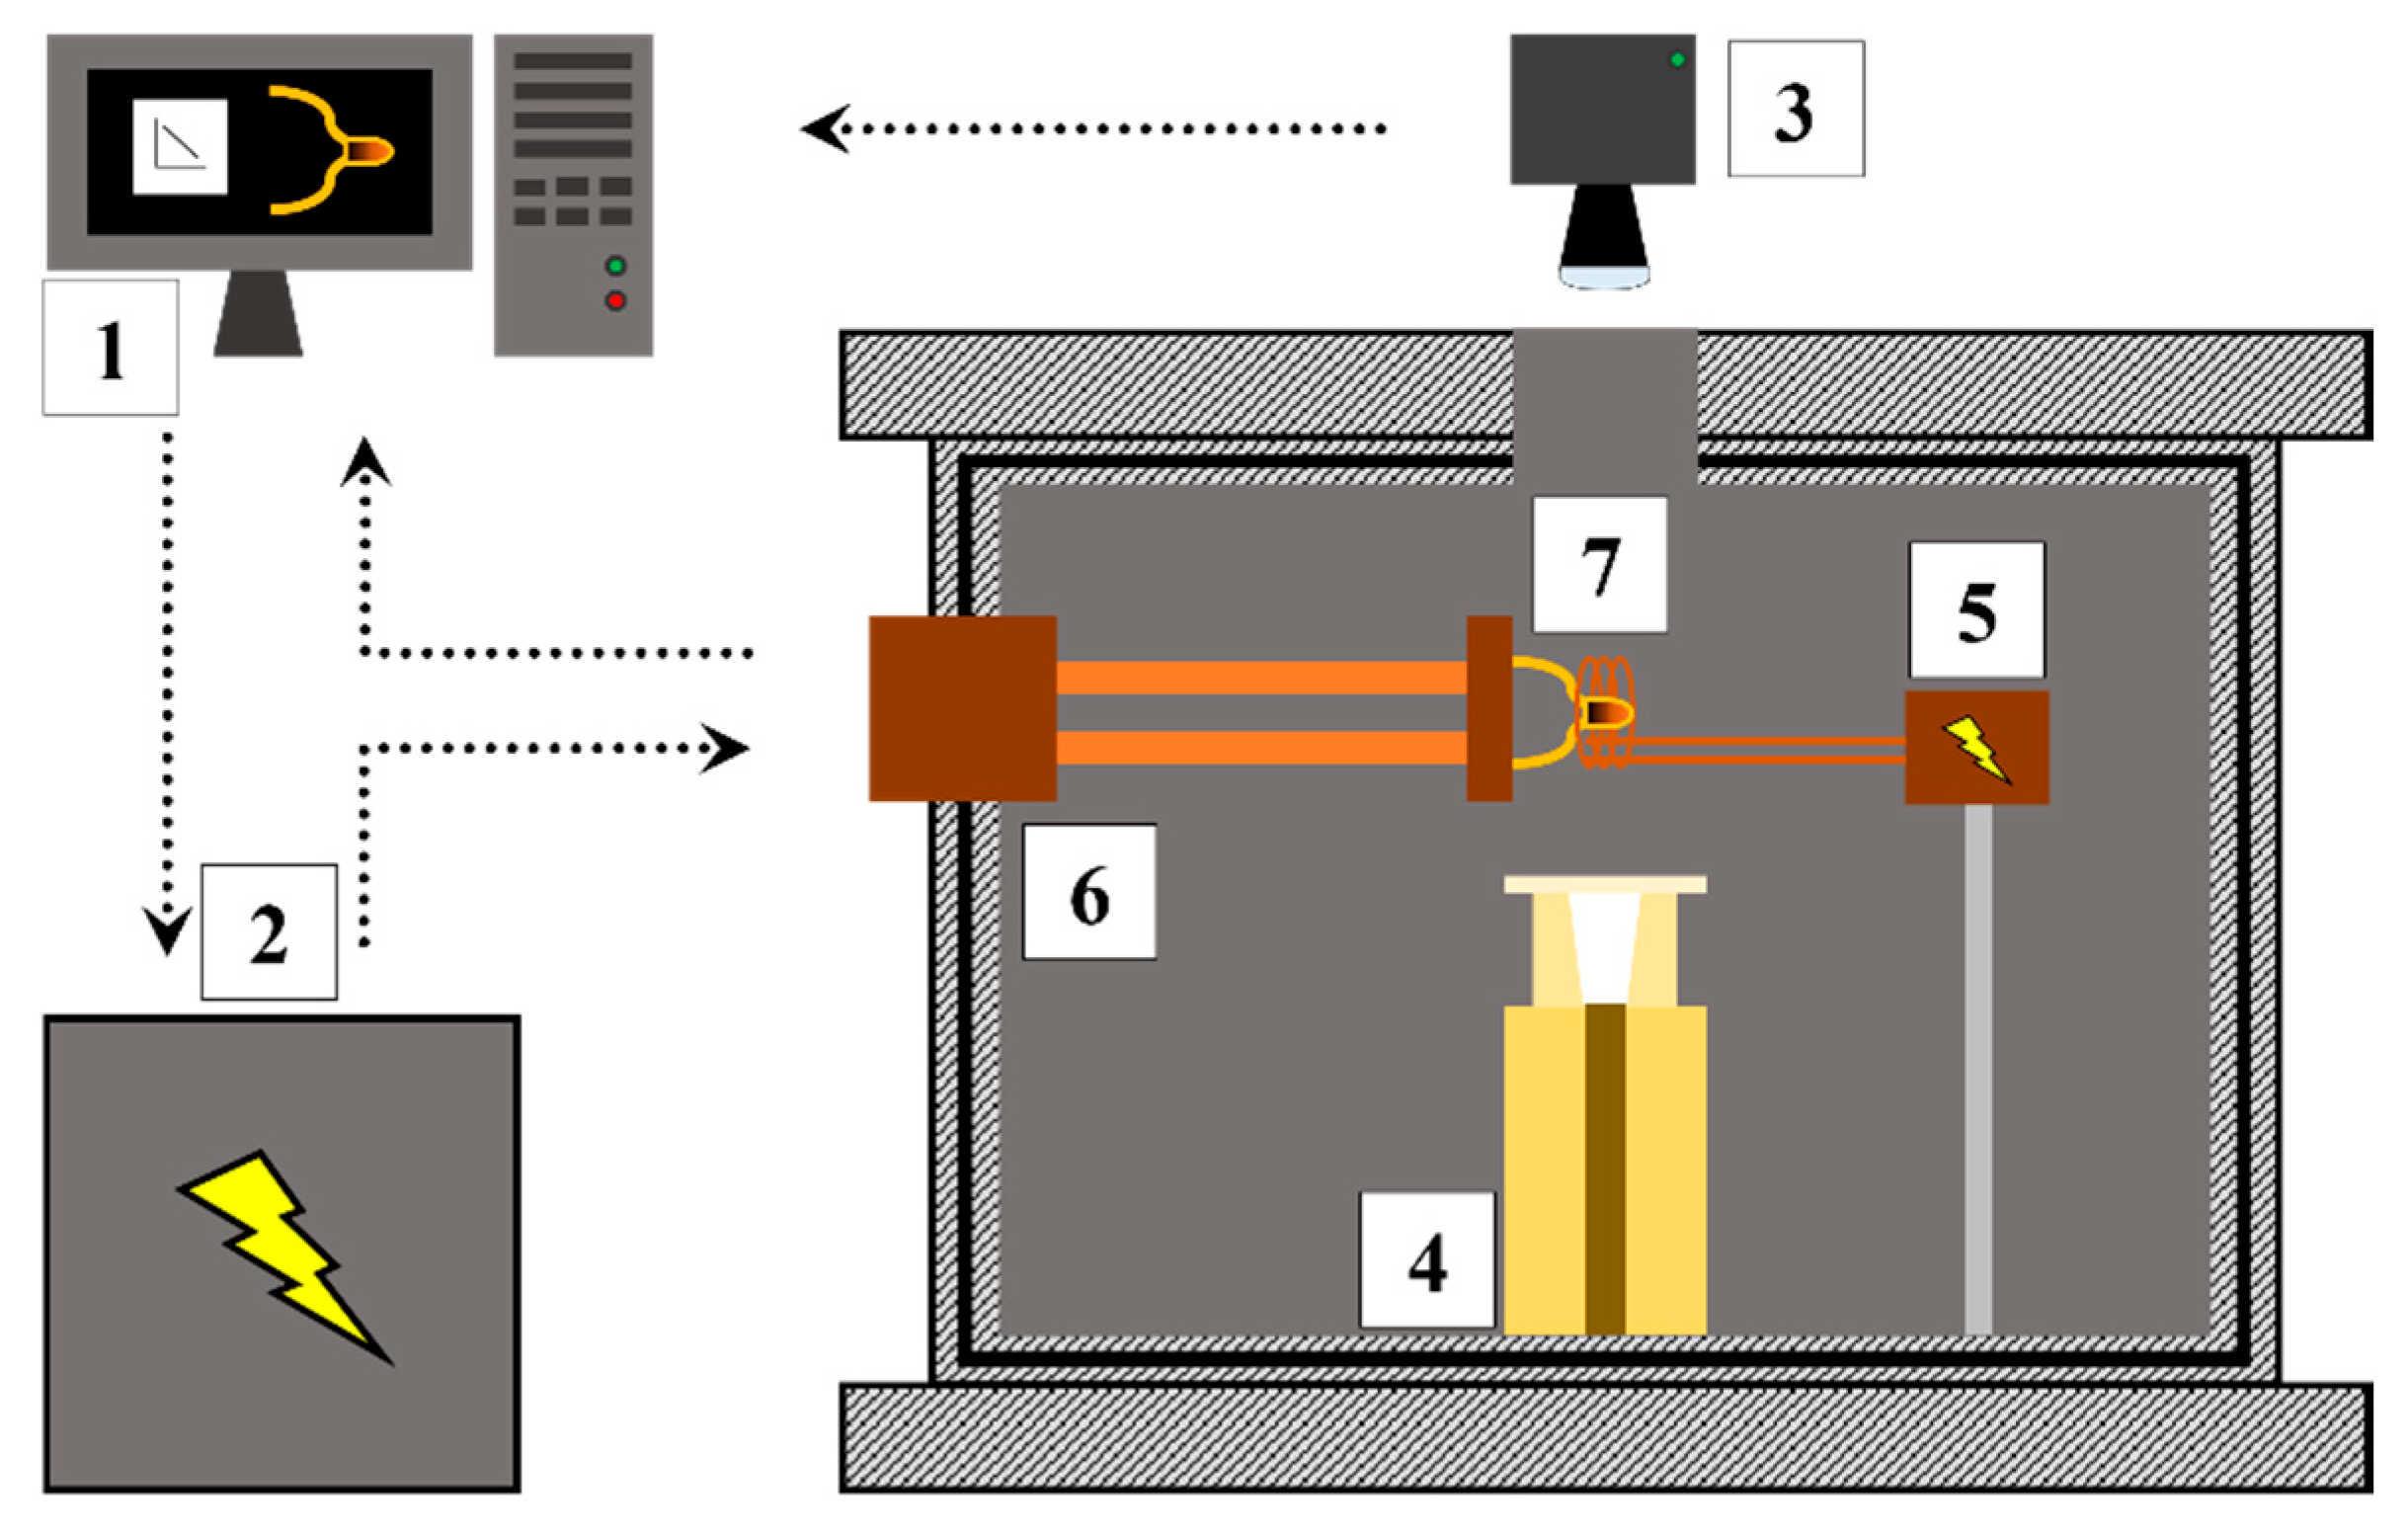
The crystallization behavior of the MF samples was evaluated using the Single Hot Thermocouple Technique (SHTT), and a schematic illustration of the apparatus at IEST is shown in Figure 5, as previously described by Klug et al. [23]. Developed alongside the Double Hot Thermocouple Technique (DHTT), SHTT enables in situ observation and measurement of crystallization, overcoming limitations of Differential Thermal Analysis (DTA), such as baseline drift and overlapping signals, which complicate interpretation. SHTT allows for very high heating and cooling rates (>3000 K min−1) and is commonly used with flux powders that are optically transparent or translucent at high temperatures typical of metallurgical process conditions [24]. This technique facilitates analysis of solidification conditions, crystal morphology, growth rate, and the solid fraction percentage throughout the experiment. The apparatus includes a system capable of simultaneous temperature measurement and heating of the thermocouple, which is constructed from two welded platinum-rhodium wires: Pt-30 Rh (positive) and Pt-6 Rh (negative). The small sample size, positioned at the center of the thermocouple, allows for the application of high heating and cooling rates. This capability supports the generation of TTT (Time–Temperature–Transformation) and CCT (Continuous Cooling Transformation) diagrams and the determination of the CCR, which requires rapid thermal changes. The CCR represents the cooling rate above which the slag is unable to form crystals, resulting solely in a glassy structure. A detailed description of the SHTT apparatus at IEST can be found in Klug et al. [23]
The measurement procedure is similar to the ones from Klug et al. and Silva et al. [19,23,24,25]. The experiments were conducted under atmospheric conditions, using various thermal cycles to construct the TTT and CCT diagrams. Mold powder samples were pre-weighed and standardized to a mass of 5–10 mg for all measurements. Following preparation, the samples were subjected to thermal cycling, involving direct heating and melting within the thermocouple. For TTT diagram construction, each temperature measurement was repeated at least three times. Samples were first heated at 2000 K min−1 to 1673 K and held for 60 s for homogenization, followed by rapid cooling to the target temperature, allowing crystallization to occur over the incubation period. Crystal morphology was observed via a CCD (charged-couple device) camera positioned at the top of the equipment, providing a direct view through the observation window. For CCT diagram construction, after initial heating, cooling rates of 10 K min−1, 15 K min−1, 30 K min−1, 90 K min−1, 120 K min−1, 240 K min−1, and 480 K min−1 were applied until reaching 1273 K. The incubation time for TTT and the crystallization temperature for CCT were identified at approximately 5% crystallization. The percentage of the crystalline phase in the molten sample was determined by processing the video recorded with the CCD camera as the ratio of freely floating crystals throughout the sample to the visible area of the molten sample.
In the SHTT experiments, error may also arise from the subjective identification of crystallization onset based on visual observation through the CCD camera, which introduces slight operator-dependent variation in determining crystallization temperatures. These sources of uncertainty were minimized through repeated measurements and procedural consistency and are in line with standard experimental tolerances reported in similar studies.

3. Results and Discussion

3.1. Viscosity, Structure, and Transition Temperatures

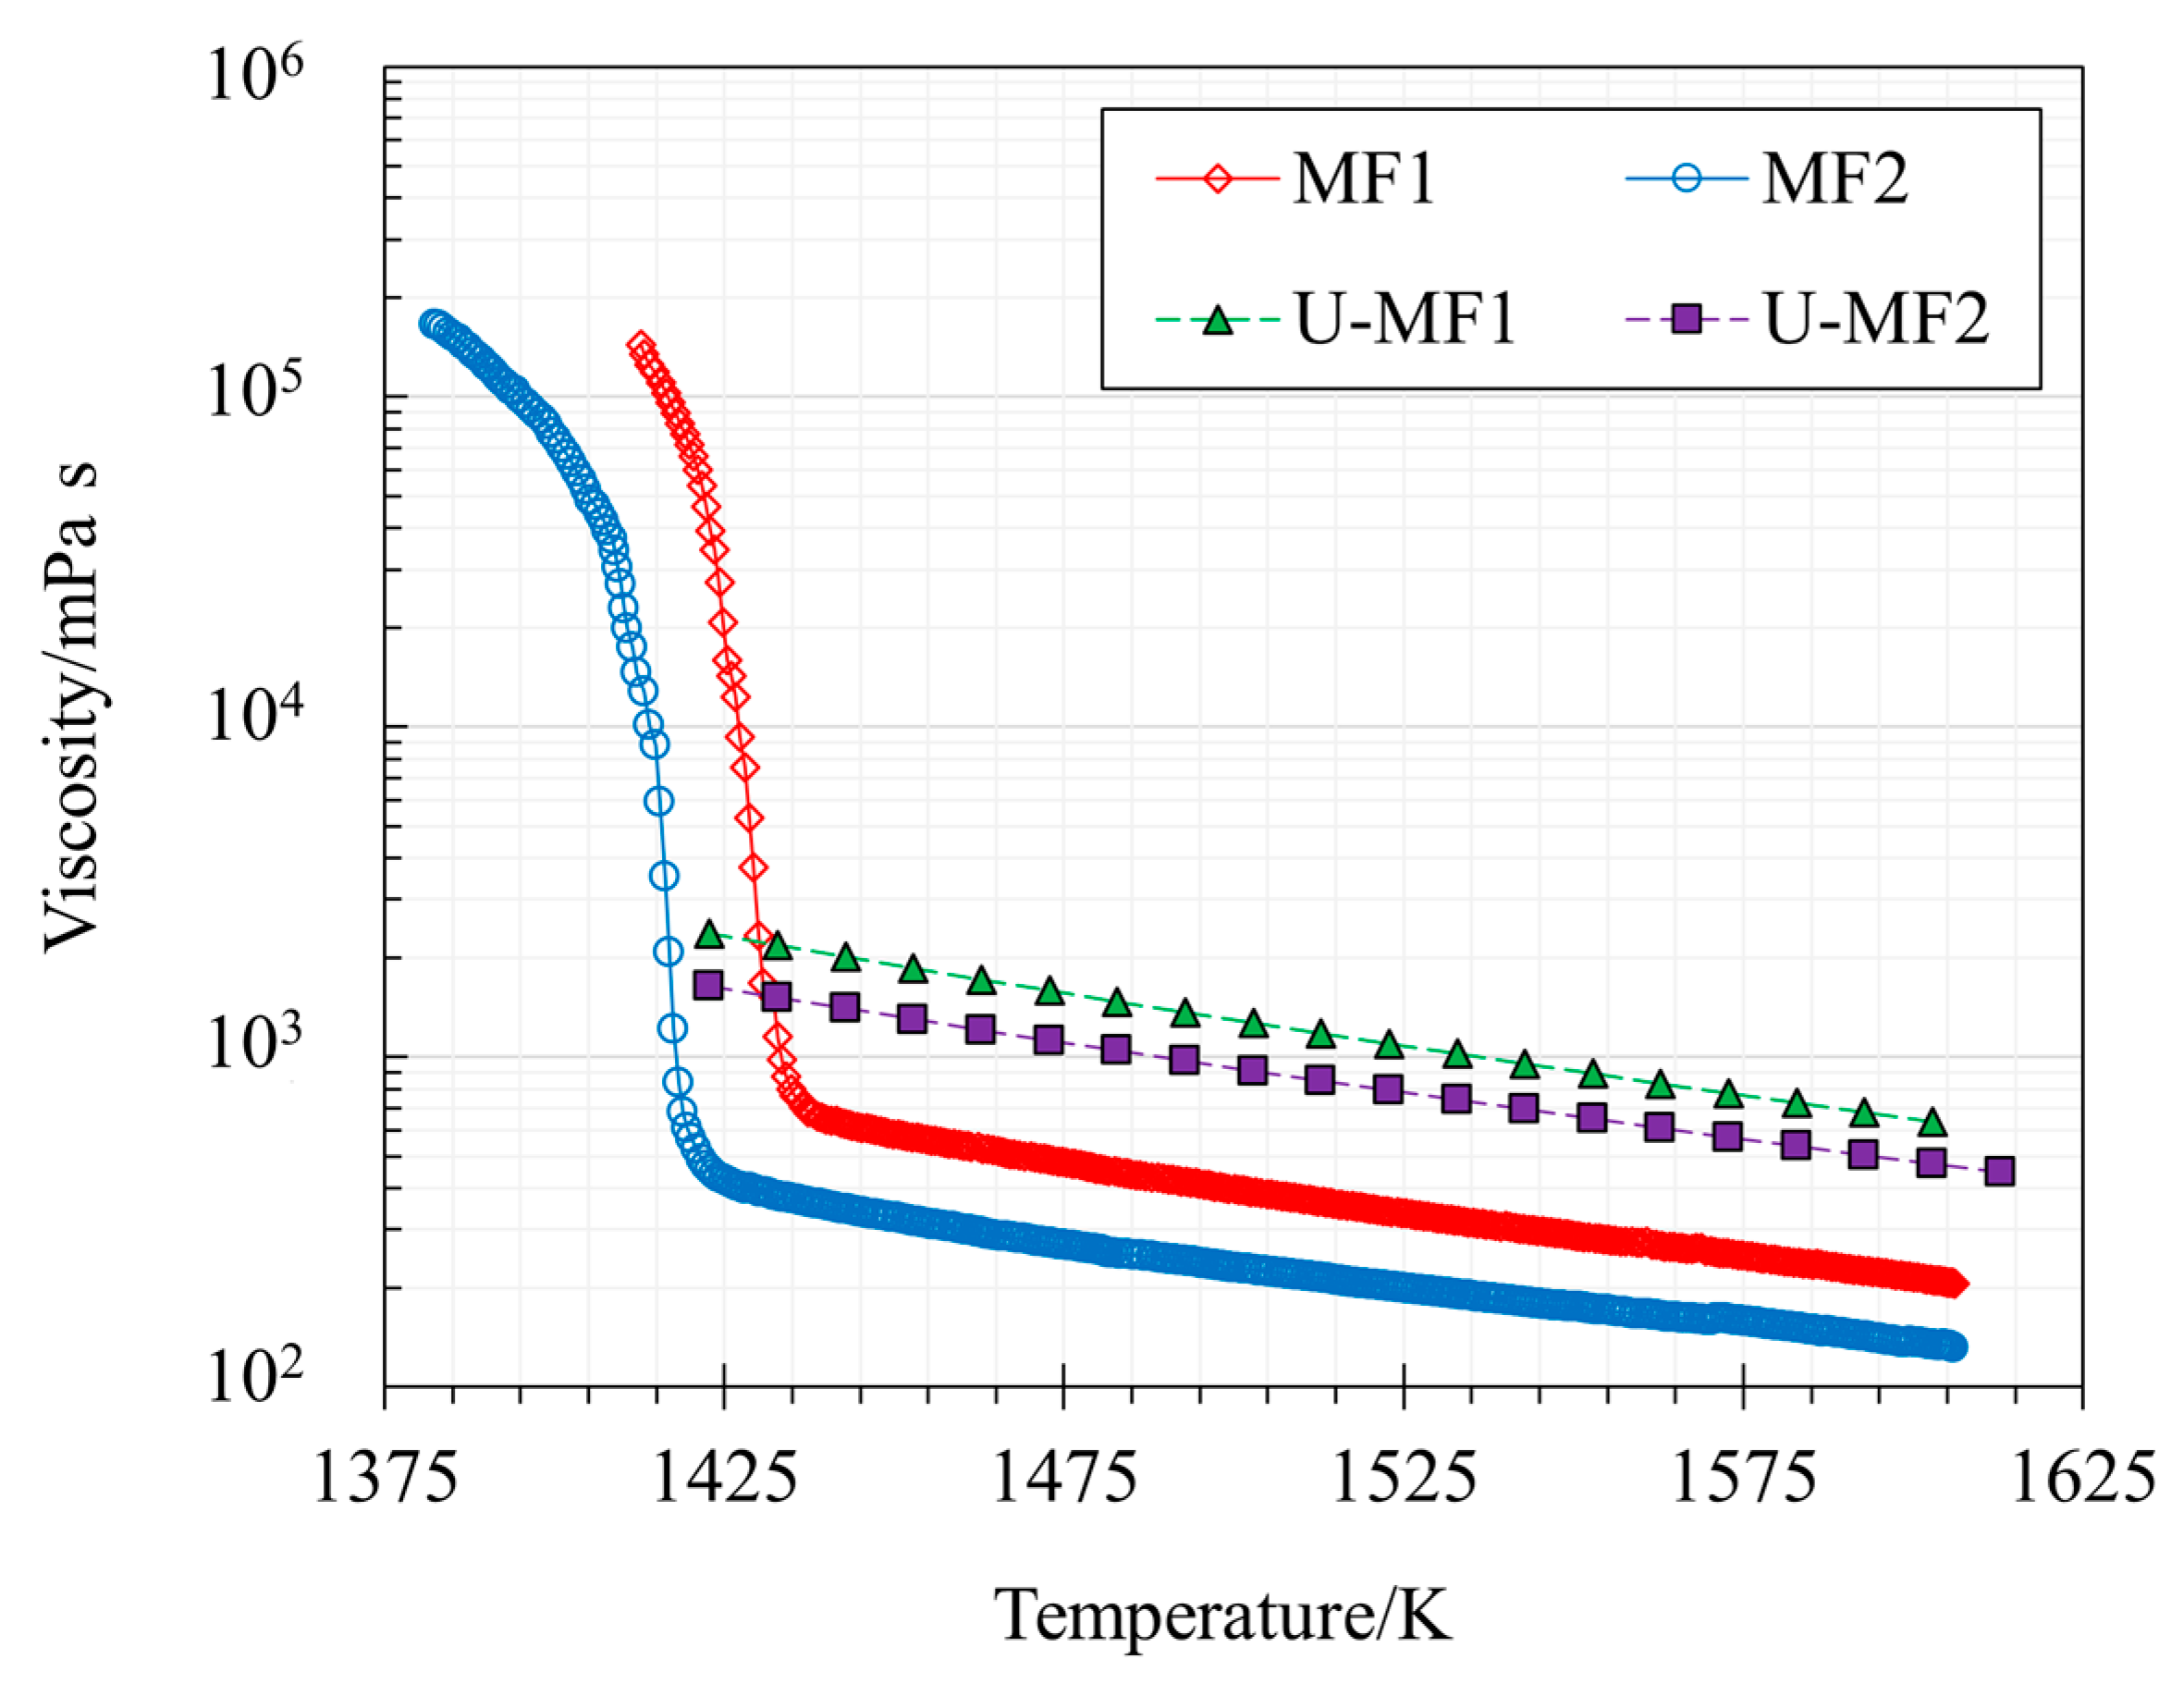
Figure 6 presents the average dynamic viscosity values as a function of temperature obtained from trials with the RBV method. This figure also presents the estimated viscosity values in a similar temperature range according to the Urbain model (U-MF1 and U-MF2) [26]. This model is based on experimental parameters and the equilibrium of the polyanion entities in the slag. In both cases, MF1 and MF2 presented an increasing viscosity with temperature decrease. This behavior of oxide systems with the RBV method has been widely seen in the literature [1,16,17,18,20]. MF1 presented higher viscosity values across the entire temperature range than MF2. This can be attributed to the fact that MF1 possesses more Al2O3 and less CaF2 than MF2 in its composition (Table 2), components responsible for network forming and breaking of the liquid mold flux, respectively [27]. The results obtained from the Urbain Model show the same trend, however, with MF1 and MF2 viscosity values above the ones obtained experimentally via the RBV method. This is due to the fact that the Riboud method is based solely on the compositional balance between acidic, basic, and amphoteric oxides, without accounting for structural modifications in the liquid slag induced by specific oxides, such as charge compensation effects.
In crystalline slags, Tbr corresponds to the onset of the first solid phase crystallization (non-Newtonian transition of slag flow), causing a sharp increase in viscosity during a cooling cycle and often referred to as the liquidus or solidification temperature [28]. In contrast, glassy slags, commonly used in billet casting, lack a defined break temperature and instead exhibit a gradual transition from liquid to supercooled liquid until reaching the glass transition temperature (Tg), resulting in a smooth viscosity curve [3]. Viscosity measurements indicate that MF1 and MF2 belong to the group of crystalline slags, due to the appearance of heterogeneous inclusions (e.g., crystals, gas bubbles) in the liquid flux, caused by phase transformation [29]. The break temperature (Tbr) for MF1 is higher than for MF2, with values of 1439 K and 1425 K, respectively. This is because MF2 contains more SiO2 and MgO than MF1, two compounds that decrease the Tbr [28].
Table 3 shows the dynamic viscosity values at 1573 K for mold powders with different CaO/SiO2 ratios from the literature [1,30,31,32,33] compared to the values obtained for MF1. All values are in wt.%. CaF2 contents are either directly reported or calculated from elemental fluorine (F) as specified. Fluxes from Kromhout et al. [31] refer to as-received (non-pre-melted) samples, while values from Liu et al. [33] represent CaF2 as reported in the original source. The dynamic viscosity ranges from 71 to 770 mPa s, sometimes exhibiting values similar to those of the mold fluxes investigated in this work. The values in Table 3 indicate that the dynamic viscosity is strongly dependent on the CaO/SiO2 ratio. Furthermore, for similar CaO/SiO2 ratios, the content of fluxing agents and networking-modifying oxides in the mold powder is responsible for the changes in the dynamic viscosity values. While the CaO/SiO2 ratio has historically been considered a primary parameter influencing viscosity due to its impact on silicate network depolymerization, other components, particularly fluxing agents such as Na2O and CaF2, play significant roles by acting as network modifiers and disrupting the silicate structure, thus reducing viscosity.
Specifically, higher viscosity, as seen in MF1, can reduce mold slag infiltration into the steel shell, potentially leading to insufficient lubrication and increased risk of surface defects such as oscillation marks or sticker breakouts. In contrast, lower viscosity, as in MF2, promotes better fluidity and slag infiltration, which enhances lubrication but also increases the risk of slag entrainment being excessively low.
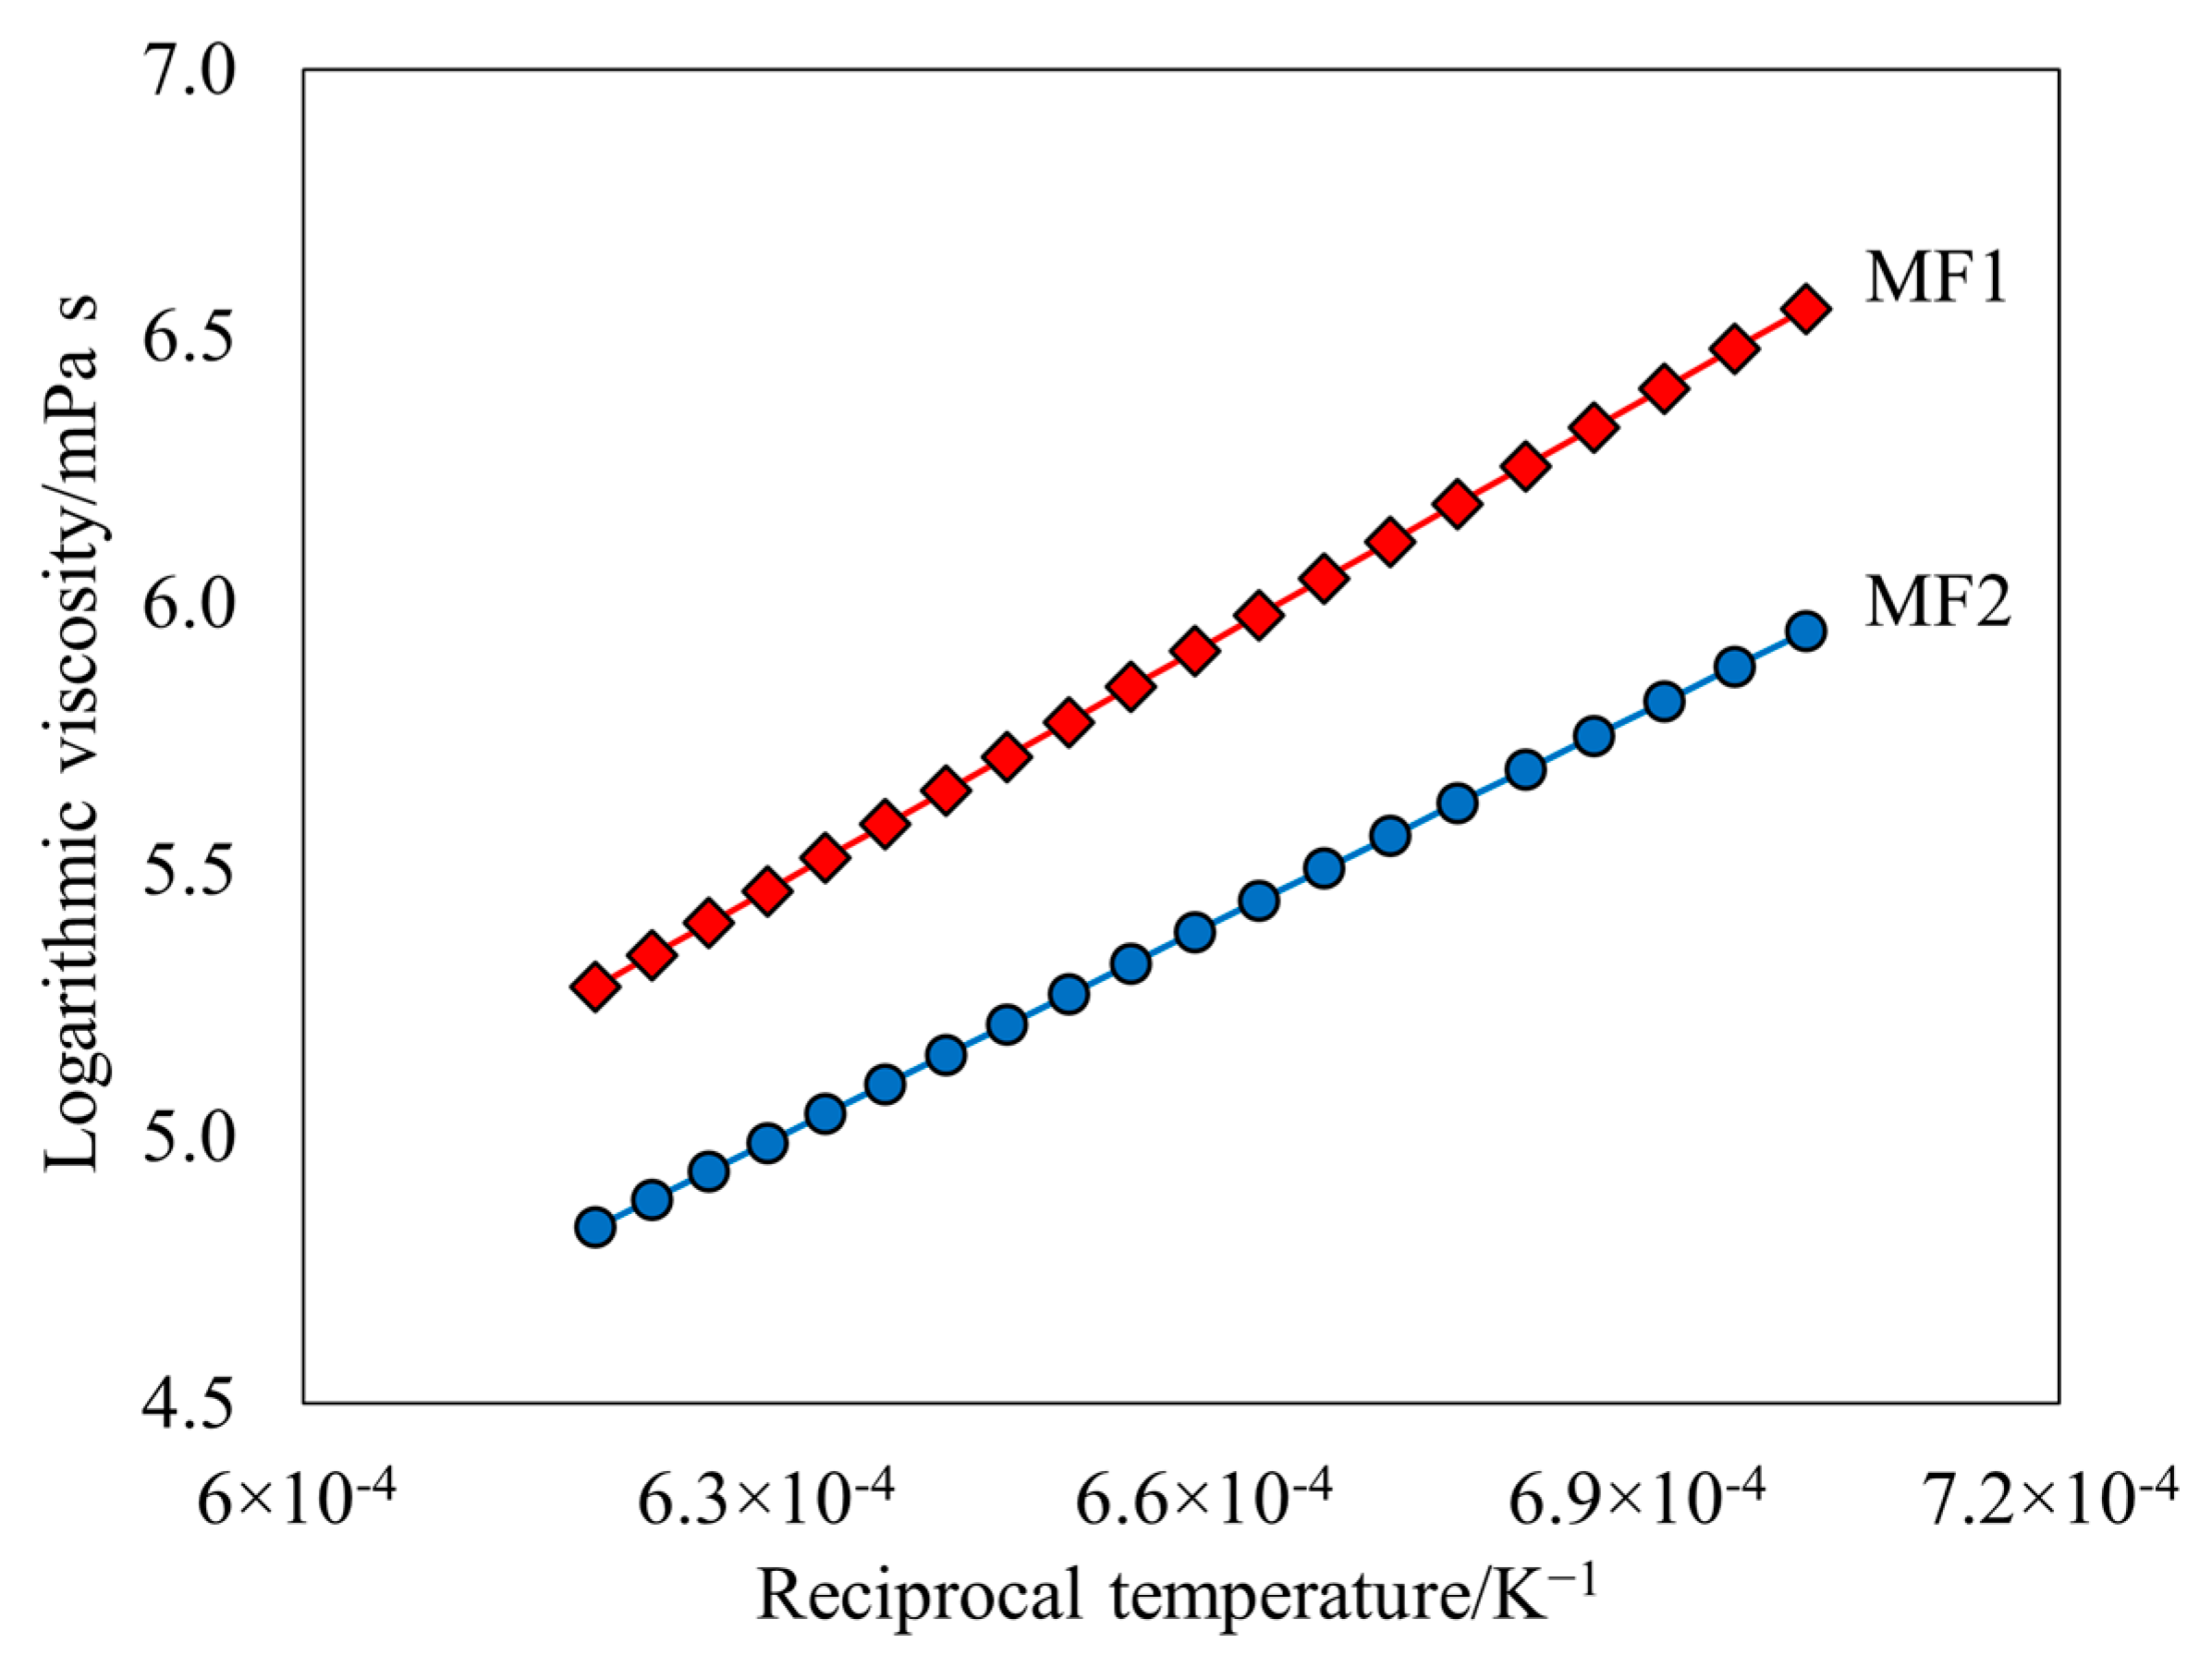
Figure 7 presents the Arrhenius plot, i.e., the logarithmic values of the viscosity in mPa s as a function of the reciprocal temperature (K) for MF1 and MF2 in the temperature range above the Tbr at a 10-degree step. Both liquid mold fluxes demonstrated a close-to-linear dependence with the inverse of temperature, with the correlation coefficient (R2) for MF1 being 0.9983 and for MF2, 0.9943. The dynamic viscosity of molten slags depends on temperature, pressure, and chemical composition. Since the pressure was constant and the mold fluxes were investigated in the same temperature range, the difference in the obtained values is related to the chemical composition of MF1 and MF2.
To assess the temperature dependency of the dynamic viscosity mathematically, the Arrhenius evaluation was employed as follows [34]:
η = A × e x p   ( E a / R · T )
where [η] = mPa s is the dynamic viscosity, [A] = mPa s is the pre-exponential factor, [Ea] = kJ mol−1 is the activation energy for viscous flow, [R] = J mol−1 K−1 is the universal gas constant, and [T] = K is the absolute temperature. The activation energy for viscous flow represents the energy needed to break bonds that enable viscous movement. Therefore, Ea can also serve as an indicator of the structural impact on physical properties [34].
Table 4 presents the Arrhenius equations, activation energies, and parameter A for MF1 and MF2, obtained from the arrhenian assessment of viscous flow. The Arrhenius equations indicate that MF1 is more responsive to temperature variations than MF2. Furthermore, MF1 has a higher Ea, 127.72 kJ mol−1 in comparison to 112.11 kJ mol−1 for MF2. This indicates a higher resistance to flow movement between two molten flux layers. This effect can be attributed to the fact that MF1 contains in its composition a higher amount of Al2O3. When aluminum (III) oxide is added to a basic slag, it acts as an acidic oxide, absorbing O2− ions and reducing the non-bridging oxygen in the molten slag. This process increases the degree of polymerization of the silicate network by forming [AlO4]5− units, similar to the [SiO4]4− tetrahedral units. This increases the energy necessary to go into viscous flow [13].
The structure of slags or mold fluxes has a direct impact on their physicochemical properties and can be assessed through various approaches, including the basicity ratio between basic and acidic oxides, the reciprocal ratio of non-bridging to tetrahedrally coordinated oxygen atoms (NBO/T), degree of polymerization (Q) and the concentration of network-forming and network-breaking oxides, with fluxes and impurities also playing a crucial role [4]. A limitation of both NBO/T and Q (Equations (5) [10] and (6)) lies in their inability to distinguish the specific effects of different cations on the silicate structure. In contrast, optical basicity (Λ) has been employed as a structural metric because it provides a degree of differentiation between various cations. To account for the charge balancing required when Al2O3 integrates into the silicate network, the optical basicity was adjusted (Equation (7)), resulting in a corrected value (Λcorr) [34].
N B O T = 2 X C a O + 2 X C a F 2 + 2 X N a 2 O + 2 X K 2 O 2 X A l 2 O 3 + 6 X F e 2 O 3 + 2 X M g O + 2 X M n O X S i O 2 + 2 X A l 2 O 3 + X T i O 2
Q = 4 N B O / T
Λ c o r r = X i n i Λ i X i Λ i
Notably, the NBO/T and Λcorr models do not take into consideration every available oxide, nor do they account for carbon or sulfur. For the calculation of those parameters, the chemical compositions throughout the experiments of MF1 and MF2 were simplified and normalized into the compositions present in Table 5.
The value of NBO/T is also employed to estimate the amount of crystalline phase (%) in mold fluxes according to Equation (8) [10]:
% c r y s t a l l i n i t y = 141.1 N B O / T 284.0
The critical threshold is identified at NBO/T = 2.0. When the value is below this threshold, the slag samples exhibit a fully glassy structure with minimal crystallinity. Conversely, above this point, the crystalline percentage increases linearly as the modified NBO/T rises [10].
The liquidus temperature (Tliq) is the temperature where the slag is 100% liquid. A numerical analysis of Tliq values obtained via DSC experiments combined with composition data resulted in Equation (9) [35]. The calculated values are subject to uncertainties of ±30 K. The solidification temperature (Tsol) is the temperature where the first solids are precipitated during cooling. It is usually represented by Tbr, which is the temperature below which the viscosity shows a sharp increase in viscosity with temperature decrease. Tbr decreases with increasing cooling rate, and often Tbr is assumed for a cooling rate of 10 K min−1. The thickness of the solid slag layer in the mold is partially determined by the Tbr. Equation (10) was obtained from numerical analysis of Tbr and chemical composition data, and these values are also subject to uncertainties of ±30 K [35]. The values of Tliq and Tbr are present in Table 6.
T l i q = 1473 1.518 % S i O 2 + 2.59 % C a O + 1.56 % A l 2 O 3 17.1 % M g O 9.06 % N a 2 O 6.0 % K 2 O + 4.8 % F 9.87 % F e O 2.12 % M n O
T b r = 1393 3.3 % S i O 2 + 8.65 % C a O 8.45 % A l 2 O 3 17.1 % M g O 3.2 % N a 2 O 2.2 % K 2 O 6.47 % F 18.4 % F e O 3.2 % M n O
Table 6 presents an overall analysis of the structure and transition temperatures of the mold fluxes as a function of the chemical composition throughout the experiments. With the heating cycles, the basicity and Λcorr of both mold fluxes slightly increased. The NBO/T ratios and, consequently, the Q parameters demonstrated a considerable change within the heating cycles. Additionally, MF2 should present some crystallinity during cooling, differently from MF1. The estimated values Tliq and Tbr are present in Table 6. Tbr results show a good agreement with the values observed experimentally through the RBV method, namely, 1425 K for MF1 and 1439 K for MF2. These estimated parameters are also helpful when discussing the crystallization behavior of both mold fluxes.

3.2. Density

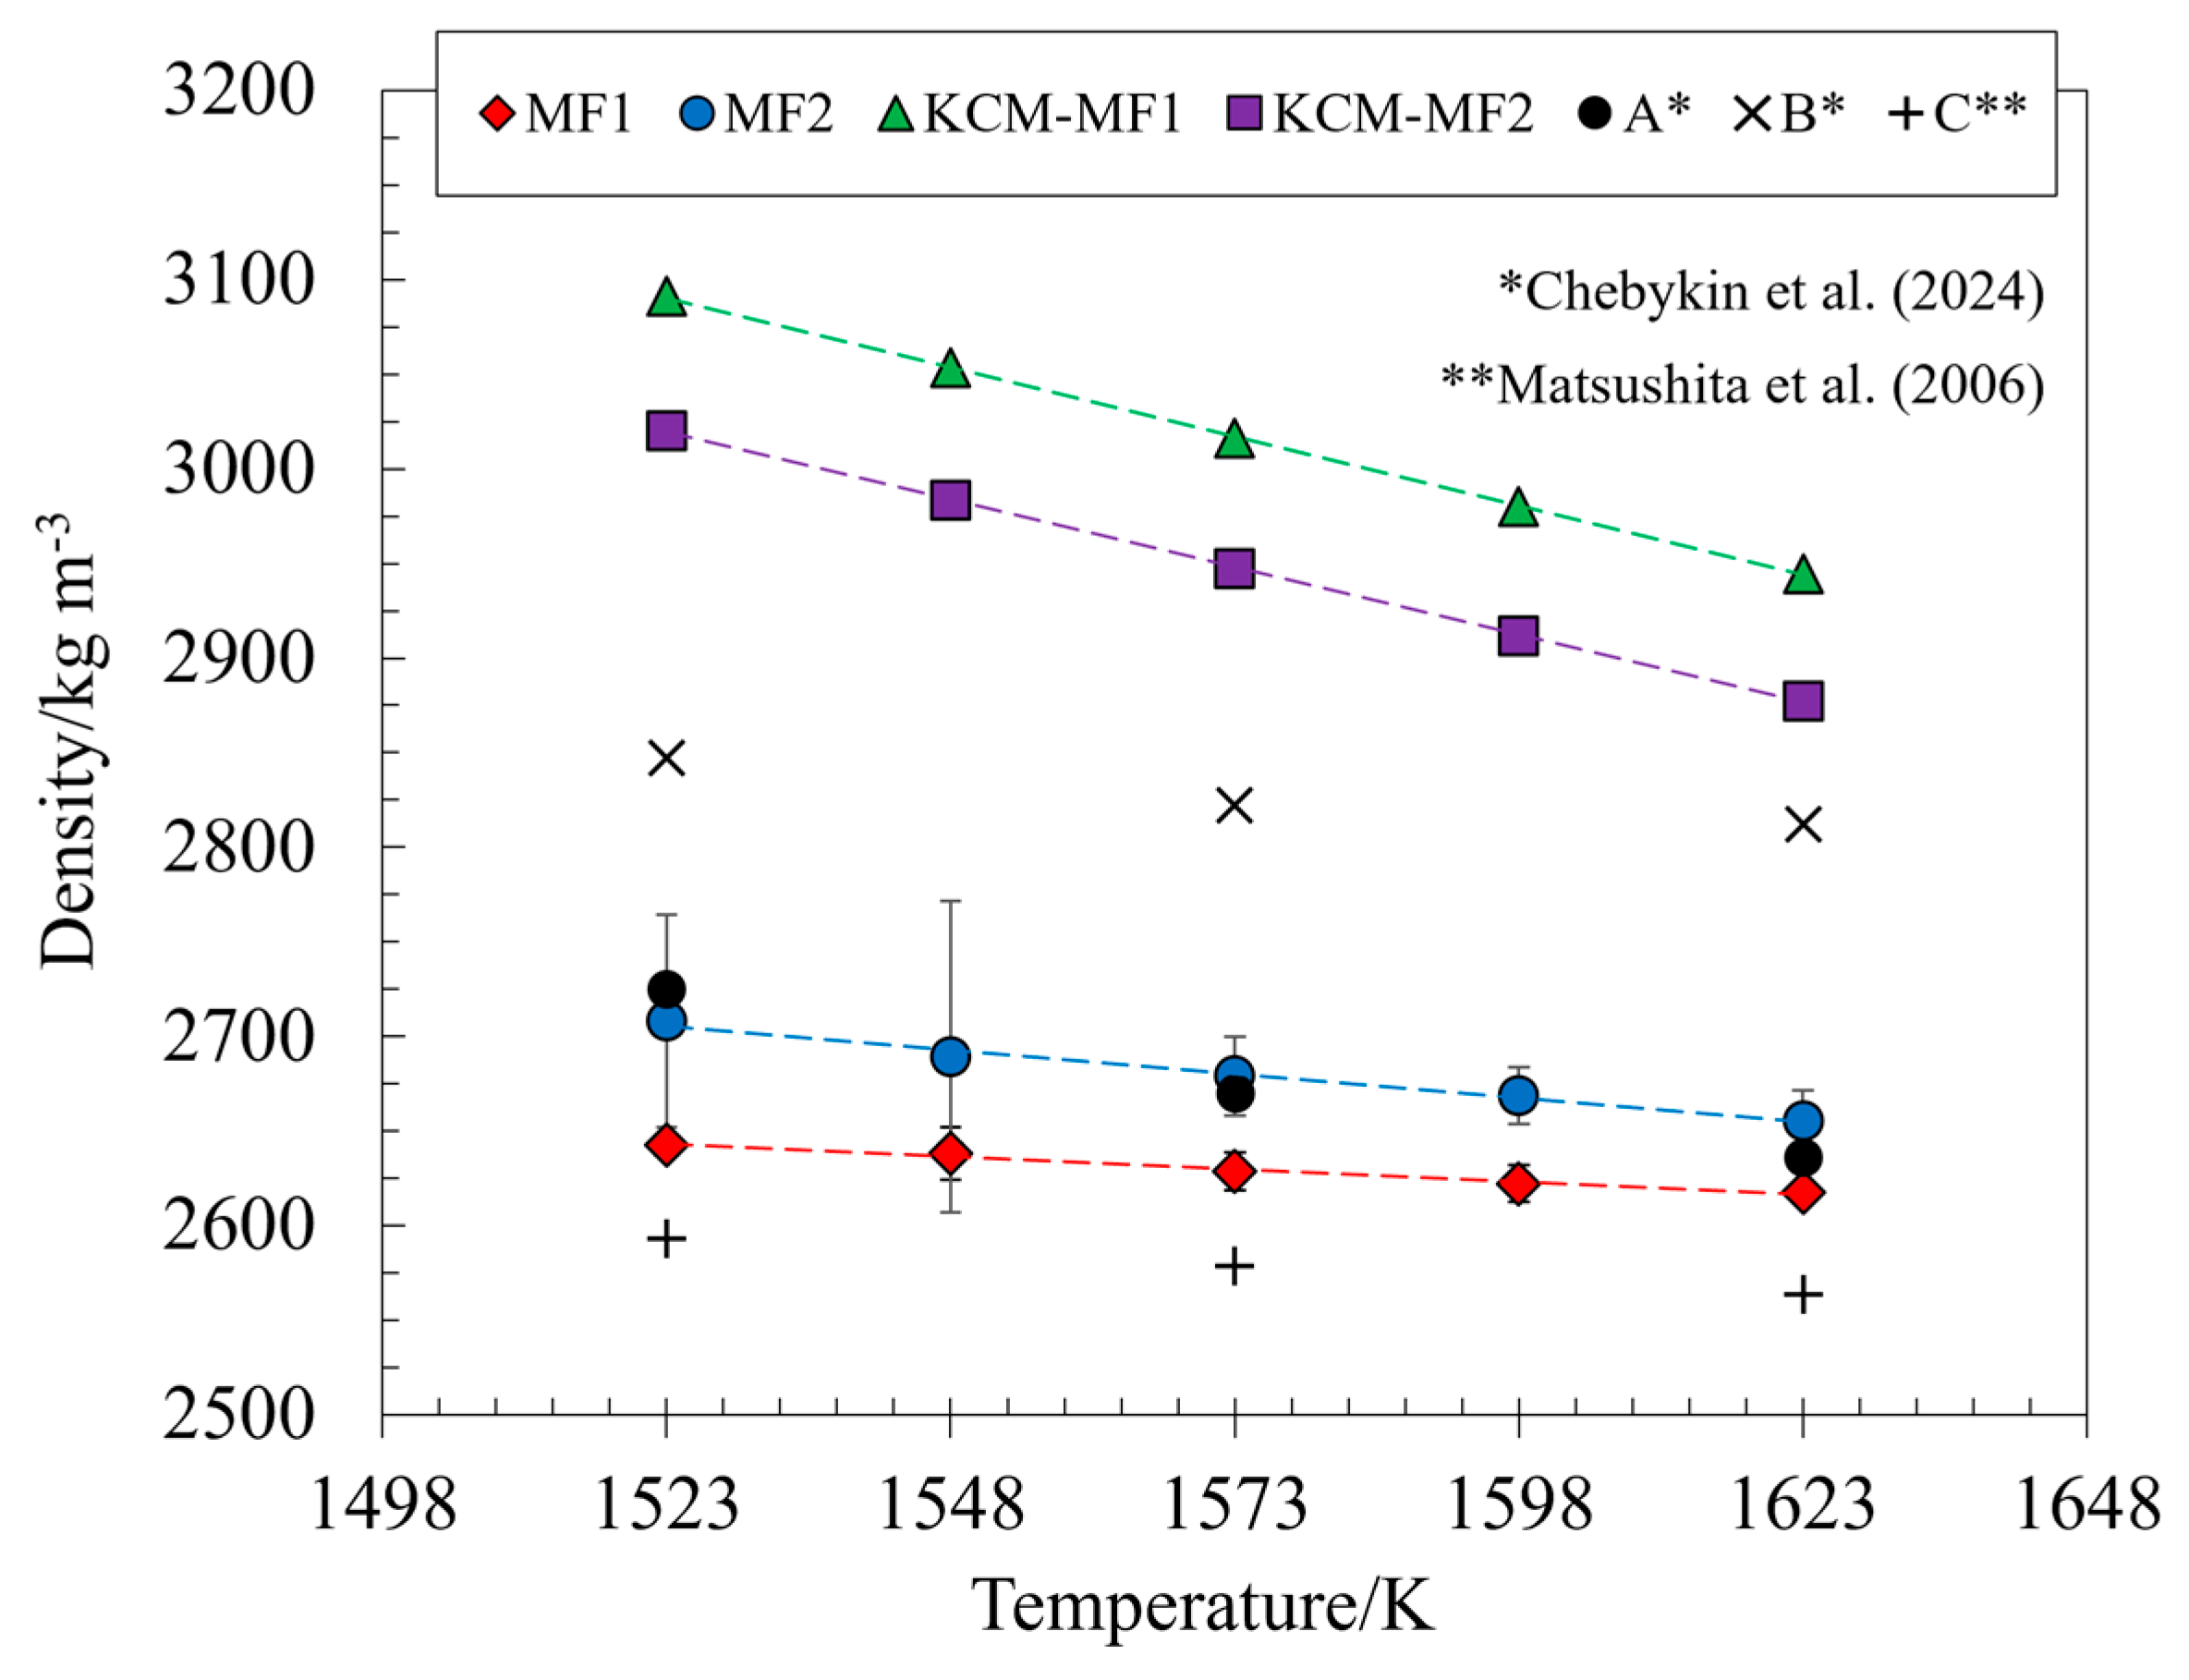
Figure 8 shows the average density values within the temperature range of 1523–1623 K for MF1 and MF2 obtained via the MBP method. The correlation coefficients of MBP measures were higher than 0.98. The measured values from three trials were compared with MBP results from Chebykin et al. [1], the electrostatic Levitation Method (ELM) from Matsushita et al. [36] and a mathematical model developed by Mills and Keene [37]. The chemical composition of the mold fluxes investigated by Chebykin et al. can be found in Table 3 (A and B), and the mold flux C in the work of Matsushita is composed (in wt.%) of 25.5% SiO2, 22.7% CaO, 0.97% MgO, 12% Al2O3, 0.4% TiO2, 2.86% Fe2O3, 0.04% MnO, 2.62% Na2O, 1.43 K2O, and 4.42% F. The model (KCM model) is based on thermodynamic calculations, which take into consideration partial molar volumes, enthalpy of mixing and interaction effects of the species, and presents an uncertainty of ±5%.
The inverse proportionality between density and temperature in slag systems and fluxes is well documented [1,20]. Density is a key variable for interpreting the structure of molten oxides. The density of molten mold fluxes MF1 and MF2 decreased as the temperature increased, primarily due to the thermal expansion of oxides, which is highly influenced by the degree of polymerization, with pure SiO2 showing minimal expansion due to its three-dimensional network. The slope of the density-temperature relationship shifts positively with network-formers and negatively with network-breakers [20]. Additionally, density is inversely proportional to molar volume, so as slag molar volume increases with temperature, its density decreases according to Equation (11) [38]:
ρ = i M i X i / i V ¯ i
where [ρ] = density in kg m−3, [Mi] = molar mass of the slag component in kg mol−1, [Xi] = molar fraction of the slag component and [Vi] = partial molar volume of the slag component in m3 mol−1.
Despite the fact that the model from Mills and Keene produced satisfactory results, those exhibit a considerable discrepancy from the experimental results obtained with the MBP method by showing higher values of density as well as a steeper slope. Additionally, the density values for MF1 are lower than MF2 in the entire temperature range. However, the calculated values show the exact opposite, with MF1 density values being higher than MF2 values. This behavior can be related to the loss of some components (COx, CaF2, and P2O5) at high temperatures during MBP experiments, which affect the composition and, therefore, the density of the molten fluxes. The results show good agreement with the results obtained by Chebykin et al. [1] and Matsushita et al. [36], who investigated mold fluxes with comparable chemical compositions.
Table 7 presents the average density values obtained experimentally via the MBP method at five different temperatures in the range of 1523–1623 K and the calculated values obtained from the KCM model. The density values for MF1 varied from 2642.35 ± 4.98 kg m−3 to 2617.56 ± 3.50 kg m−3, while for MF2 they varied from 2708.30 ± 56.06 kg m−3 to 2655.58 ± 16.07 kg m−3, in the investigated temperature range. Throughout the experiments, the density values for MF1 were lower than MF2. This can be explained by the difference in the chemical composition of the samples. As received, MF2 contained approximately 6 wt.% more carbon than MF1 in its granulated form. However, after pre-melting, both fluxes exhibited low carbon contents, measuring 0.03 wt.% for MF1 and 0.14 wt.% for MF2. This indicates that MF2 underwent greater carbon loss due to oxidation at high temperatures, which contributed to an increased densification of the liquid mold flux. The development of the normalized chemical compositions in the course of the high-temperature experiments is present in Table 2.
The density exhibited a linear relationship with temperature, consistent with the findings of Matsushita et al., who observed a similar trend in four different mold fluxes using Electrostatic Levitation (ESL) and Sessile Drop methods [36]. Such relationship can be expressed by the temperature coefficient of density [ρT] = kg m−3 K−1 as outlined in Equation (12):
ρ ( T ) = ρ r e f . + ρ T · T T r e f .
where [ρref.] = kg m−3 is the density at reference temperature [Tref] = K. The resulting parameters ρref. and ρT were calculated from experimental values, and the resulting equations for MF1 and MF2 are listed below:
ρ T M F 1 = 0.2479 · T T r e f . + 2642.35
ρ T M F 2 = 0.5271 · T T r e f . + 2708.30
The coefficients of both mold fluxes are negative, confirming the inverse proportionality between density and temperature. Furthermore, the equations indicate that the density of MF2 exhibits greater sensitivity to temperature fluctuations compared to MF1, as indicated by its higher temperature coefficient of density; that is, its density undergoes more pronounced changes in response to temperature variations. The density of the mold flux affects the metallurgical phenomena that depend on transport, since it is related to the mobility of the molten system. A higher slag density, like in MF2, reduces the risk of slag entrapment but also decreases the rate of film formation, i.e., reduced lubrication. A lower slag density (MF1) results in a more mobile molten flux, which increases the chances of slag emulsification and, therefore, the size of the NMI population.

3.3. Surface Tension

Figure 9 shows the average surface tension values within the temperature range of 1523–1623 K for MF1 and MF2 obtained via the MBP method. The average values measured across three repetitions were compared with a mathematical model developed by Mills and with literature results from Chebykin et al. and Gao et al. [1,39,40]. Chebykin et al. investigated the surface tension by means of the MBP method and Gao et al. via the maximum-pull method. The model (KCM model) is based on the partial molar contribution of flux pure components obtained from experiments and the classification of components into bulk and surfactants (for example P2O5). The standard deviation of the calculated surface tensions obtained through this method lies at ±10%.
The results indicate an inverse relationship between surface tension and temperature for the experimental results and for the calculated values. This behavior has been reported in the literature using both modeling and experimental methods to assess the surface tension of oxide systems [18,20,39,41]. According to Gao et al. [40], the increase in temperature reduces both the degree of polymerization in the melt and the average radius of silicon-oxygen anionic structures. This promotes greater molecular thermal motion and weakens intermolecular interactions, ultimately leading to a decrease in the surface tension of the mold fluxes.
The values obtained with the MBP method lie above the values from the employed model and below the values from literature [1,40]. The mold fluxes investigated by Chebykin et al. present higher surface tension values because they possess fewer fluxing agents in their composition than the MF1 and MF2 of this study. Gao et al. investigated mold fluxes within the CaO-SiO2-CaF2-Na2O system, with samples 1 and 2 presenting a lower CaO/SiO2 ratio but higher CaF2 and Na2O contents. This not only increases the surface tension but also causes a more rapid increase in the surface tension values as a function of temperature. This behavior can be observed in MF2 of this study, which contains more surface-active oxides (Na2O and CaF2) in its composition in comparison to MF1.
The experimental results also show that MF1 has lower surface tension values than MF2 in the investigated temperature range, while the calculated results present lower values for MF2 when compared to MF1. A plausible assumption is that the chemical composition of the mold fluxes investigated experimentally with the MBP method changes as a function of time and temperature cycles (loss of volatile components), while the composition of the fluxes used in the model (Table 5) remains constant.
Table 8 presents the average surface tension values for MF1 and MF2, with its corresponding standard deviation in the temperature range between 1523 and 1623 K. The table also presents the values resulting from the model calculations, which lie at lower values, since no dynamic effects and vaporization of elements from the molten flux arising from the experiment are considered in the model. MF1 suffered a decrease in the surface tension from 299.40 ± 3.11 mN m−1 to 290.76 ± 2.11 mN m−1. As for MF2, its surface tension decreased from 347.97 ± 3.37 mN m−1 to 304.81 ± 32.57 mN m−1. Furthermore, MF2 presented more instability during experiments, as can be seen by the higher values of standard deviation. Surface tension is strongly affected by surface-active compounds, such as B2O3, Na2O, and CaF2 [41]. The sum of surface-active components (Na2O + CaF2) in the chemical composition after MBP measurements for MF1 is equal to 12.81 wt.% and for MF2 is equal to 14.73 wt.%, which does explain the dissimilar surface tension behavior of MF2.
Concomitant to density, the surface tension in a specific temperature range can be expressed through the temperature coefficient of surface tension [σT] = mN m−1 K−1 according to Equation (15):
σ T = σ r e f . + σ T · T T r e f .
where [σref.] = kg m−3 is the surface tension at reference temperature [Tref] = K. The resulting parameters σref. and σT were calculated from the current experimental values and the resulting equations for MF1 and MF2 are listed below:
σ T M F 1 = 0.0864 · T T r e f . + 299.40
σ T M F 2 = 0.4316 · T T r e f . + 347.97
The coefficients of both mold fluxes are negative, confirming the inverse proportionality between surface tension and temperature. The equations indicate that, due to its higher temperature coefficient of surface tension, MF2 exhibits more pronounced surface tension variations with temperature than MF1. Surface tension influences the stability of the steel–slag interface and the behavior of the mold flux during casting. Higher surface tension, as in MF2, can suppress slag film spreading and increase the surface tension gradient at the slag–steel interface, which improves phase separation. Lower surface tension as seen in MF1 enhances lubrication but results in higher spreading and wetting of the slag at the interface with molten steel, increasing the emulsification effect in turbulent flow conditions.

3.4. Crystallization Behavior

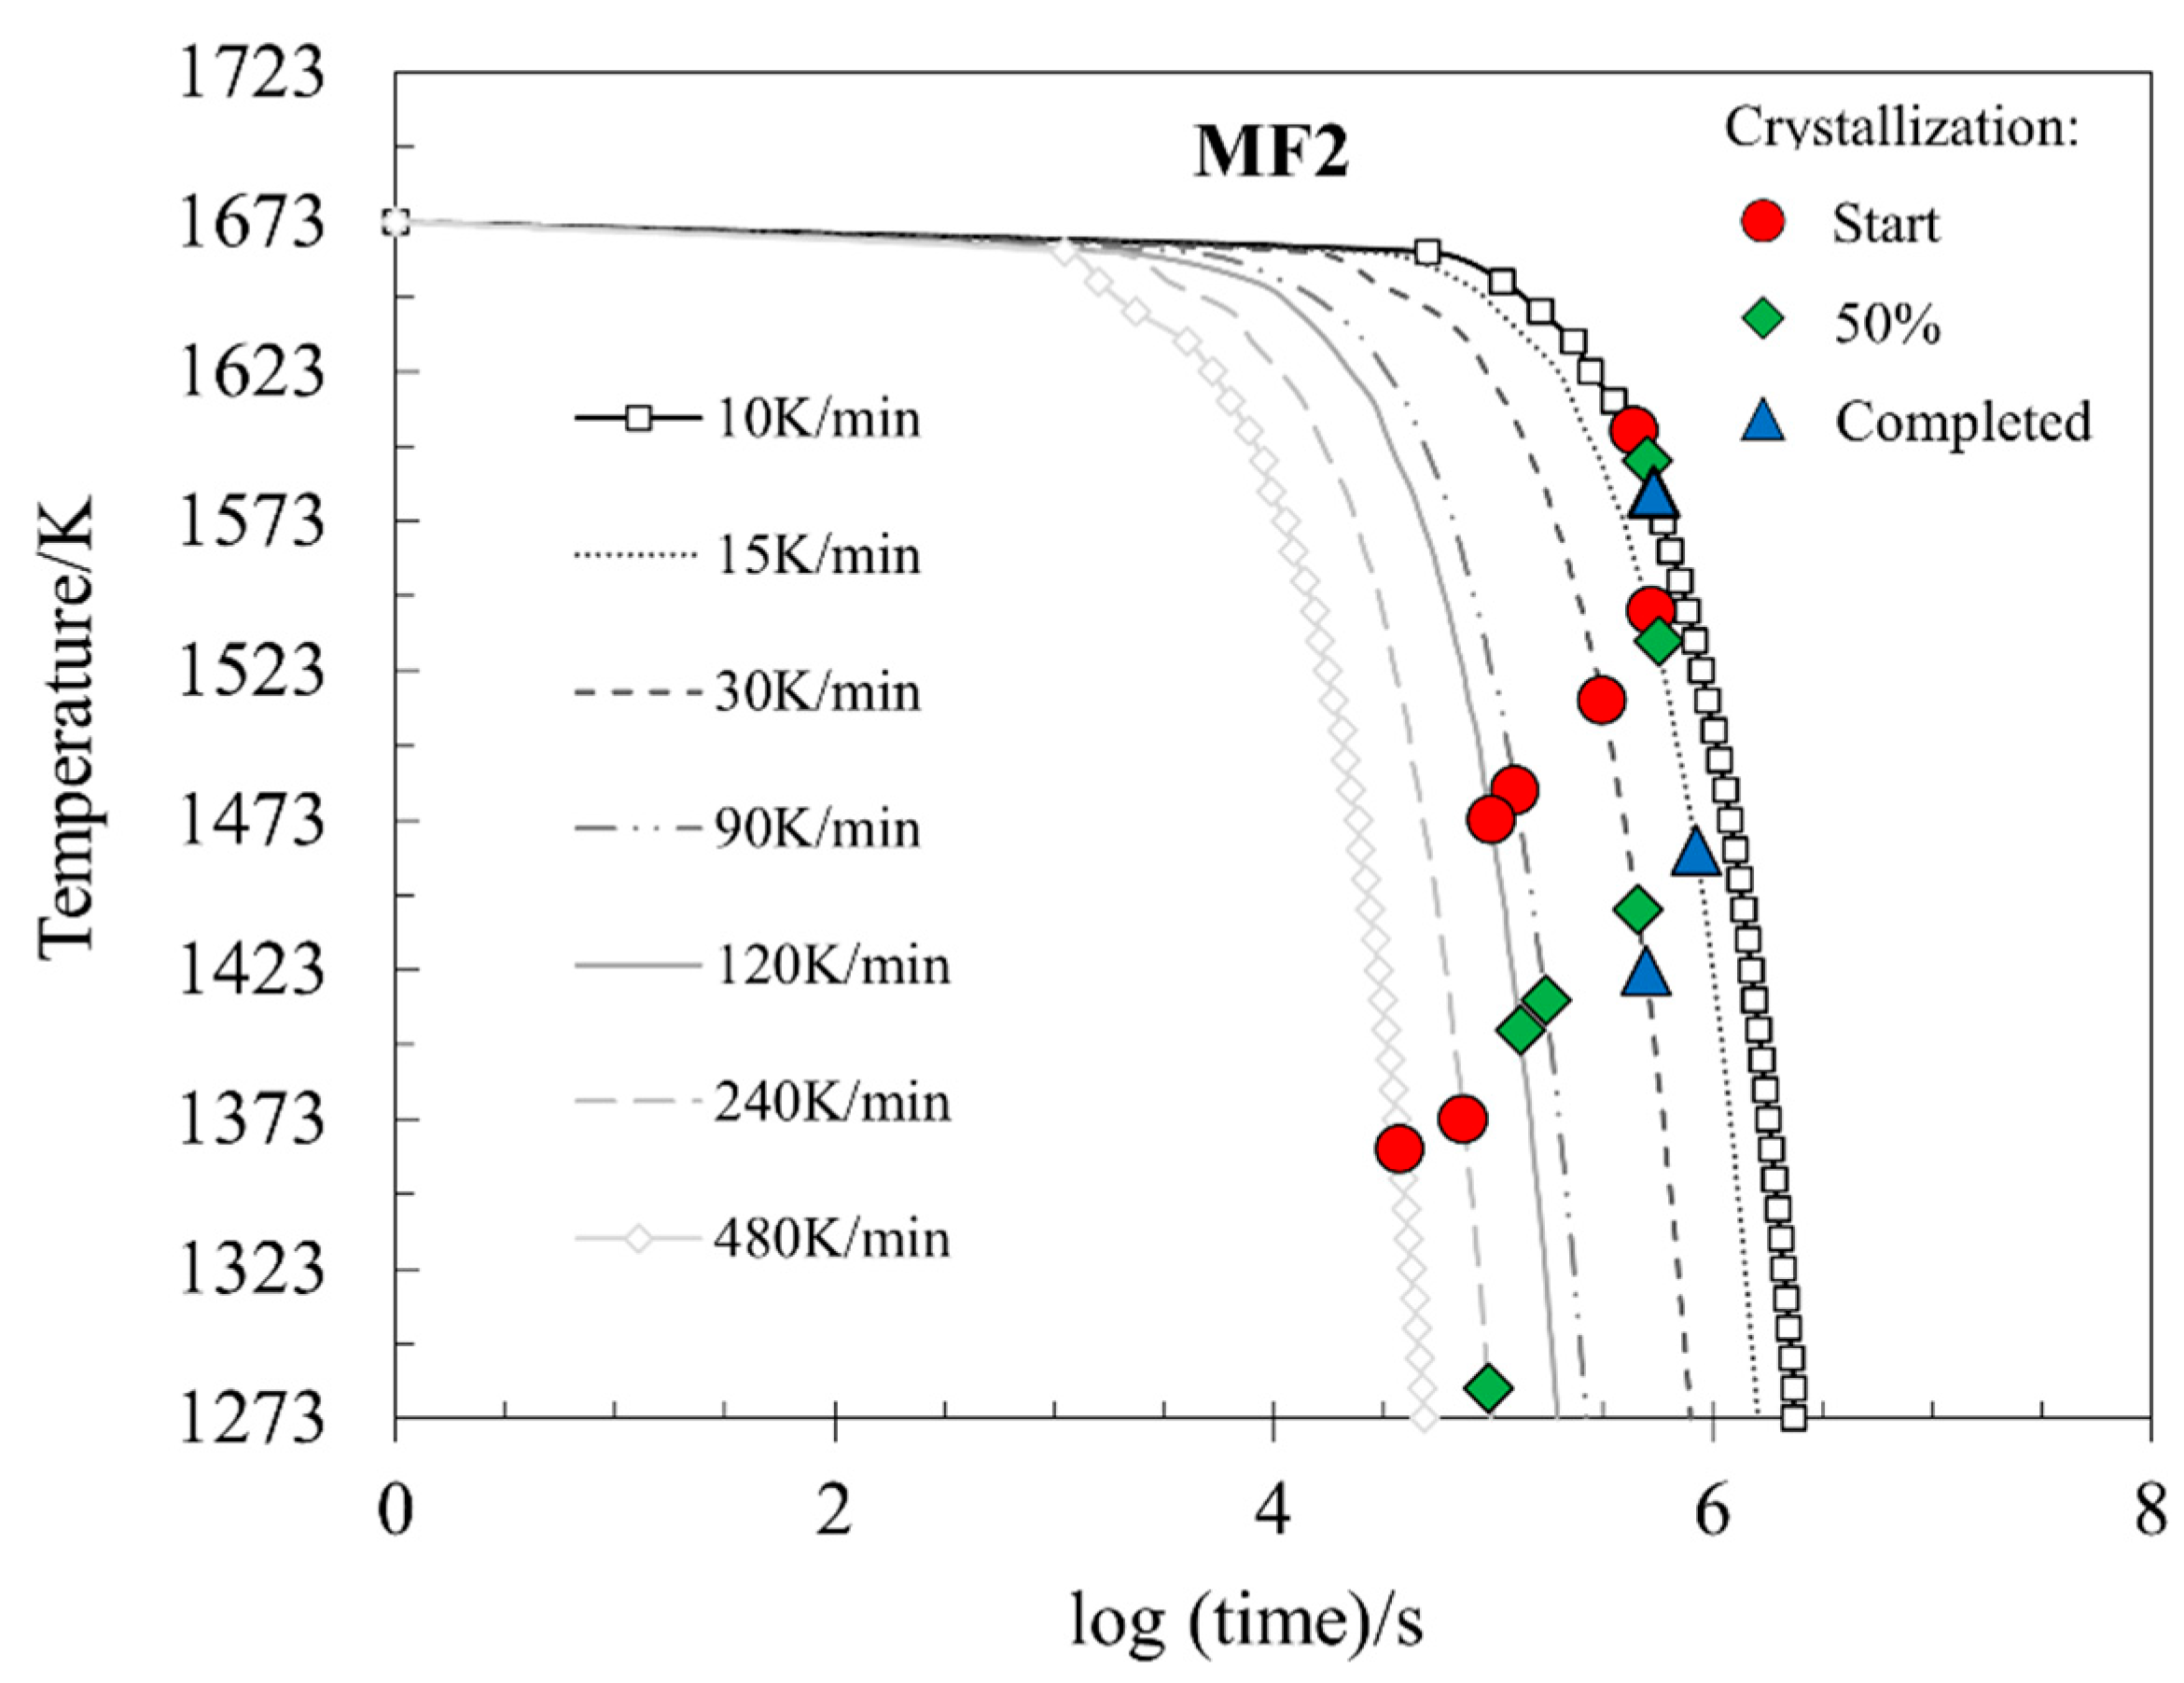
From in situ observations enabled by the SHTT method, the CCT diagrams present in Figure 10 and Figure 11 could be constructed. The crystallization process was divided into Start (red dot), 50% (green diamond), and Completed (blue triangle). The increase in the cooling rate was responsible for the decrease in the crystallization temperatures for all stages and in both samples. Crystal phase precipitation was observed for MF1 and MF2 for every cooling rate applied, however, sometimes not completely. Crystallization is intimately affected by the molten flux structure. Silva et al. suggested that a higher cooling rate at a given temperature leads to increased melt viscosity, which requires a greater degree of undercooling to initiate crystallization, indicating a relationship between viscosity and cooling rate. This effect occurs because atomic mobility drives crystal growth; thus, higher viscosity creates a barrier to atomic diffusion and molecular rearrangement. As a result, the onset of crystallization is delayed, meaning that crystallization temperature decreases with an increasing cooling rate [19]. MF1 presented higher dynamic viscosity values in the investigated temperature range (Figure 6), corresponding to crystallization at lower temperatures in comparison to MF2. This effect was also observed by Chebykin et al., Klug et al., and Silva et al. [1,23,25].
In Table 9, the temperatures of each crystallization stage (Start, 50% and Completed) are exhibited as a function of the cooling rate for MF1 and MF2. The results show that MF1 presented lower crystallization temperatures (Start, 50%, and Completed) than MF2 for every cooling rate applied. For cooling rates above 90 K min−1, no complete crystallization of the SHTT sample was observed in sample MF2. However, in sample MF1, complete crystallization of the sample was firstly not observed at a cooling rate of 240 K min−1.
The chemical composition of the mold flux directly affects the crystallization. Klug et al. found that Na2O is responsible for an increase in the crystallization rate of fluorine-free mold powders [24]. Additionally, SiO2, Fe2O3, Al2O3, MnO, and P2O5 induce glass formation, CaO, K2O, MgO, Na2O, and CaF2 are related to a crystalline structure and TiO2 is a nucleating agent [1]. Table 10 presents the classification of oxides in glass formers, crystalline forms and nucleating agents, as brought by Chebykin [1]. The values were calculated for MF1 and MF2 in the form of as-received and after pre-melting.
The structural role of individual oxides within the molten slag has a direct influence on the crystallization behavior of mold fluxes. In particular, SiO2, Al2O3, FeO and P2O5 act as network-formers by participating in tetrahedral units [SiO4]4−, [AlO4]5−, [FeO4]4−, and [PO4]3−, respectively. These complex anionic groups enhance the formation of the silicate network, thereby increasing viscosity and inhibiting nucleation and crystal growth. To maintain charge neutrality in the presence of these negatively charged tetrahedral units, network modifiers Ca2+, Mg2+, K+ and Na+ depolymerize the network by breaking bridging oxygen bonds, which facilitates atomic mobility and promotes crystallization. Additionally, an increase in CaF2 content can lead to a moderate rise in free oxygen availability within the melt. This phenomenon raises the concentration of Ca2+ in the melt and promotes the formation of simpler coordination units, such as Al-F bonds, which disrupt the polymerized network and lower the energy barrier for crystallization [4].
Considering this approach, MF1 contains more glass-forming and fewer crystal-forming oxides compared to MF2, which is consistent with its higher viscosity in Figure 6. The elevated viscosity of MF1 increases the incubation time required for crystallization to initiate. Higher molten flux viscosity hinders elemental diffusion, thereby prolonging the incubation period before crystallization begins [1]. The difference in the content of nucleating agents between MF1 and MF2 is not substantial, and their concentrations remained unchanged after the melting cycles. Therefore, they are not responsible for the observed differences in crystallization behavior between the investigated mold fluxes. Another indication of the longer incubation time for MF1 is its lower NBO/T value, indicating a more polymerized molten structure, which is further confirmed by its higher viscosity.
A lower NBO/T value corresponds to a more polymerized melt structure, which is typically associated with reduced crystallinity due to restricted atomic mobility. For MF1, the NBO/T value after pre-melting is 2, precisely at the critical threshold between glassy and crystalline behavior. In addition, the calculated crystallinity is 0% (Table 6), consistent with its delayed and incomplete crystallization at higher cooling rates (Figure 10). In contrast, MF2 exhibits a higher NBO/T (2.4), an estimated crystallinity of 55% and more nucleating agents, reflecting a more depolymerized structure that facilitates crystal nucleation and growth.
The Λcorr also supports these findings. MF2 shows a higher Λcorr (0.6976) compared to MF1 (0.6727), indicating a more basic oxide environment, leading to network breakdown and crystallization. This structural depolymerization aligns with the shorter incubation time and higher crystallization temperatures observed for MF2 during SHTT experiments. Thus, both NBO/T and Λcorr parameters correlate well with the measured crystallization behavior and reinforce the fact that MF2 is structurally predisposed to higher crystallinity than MF1.
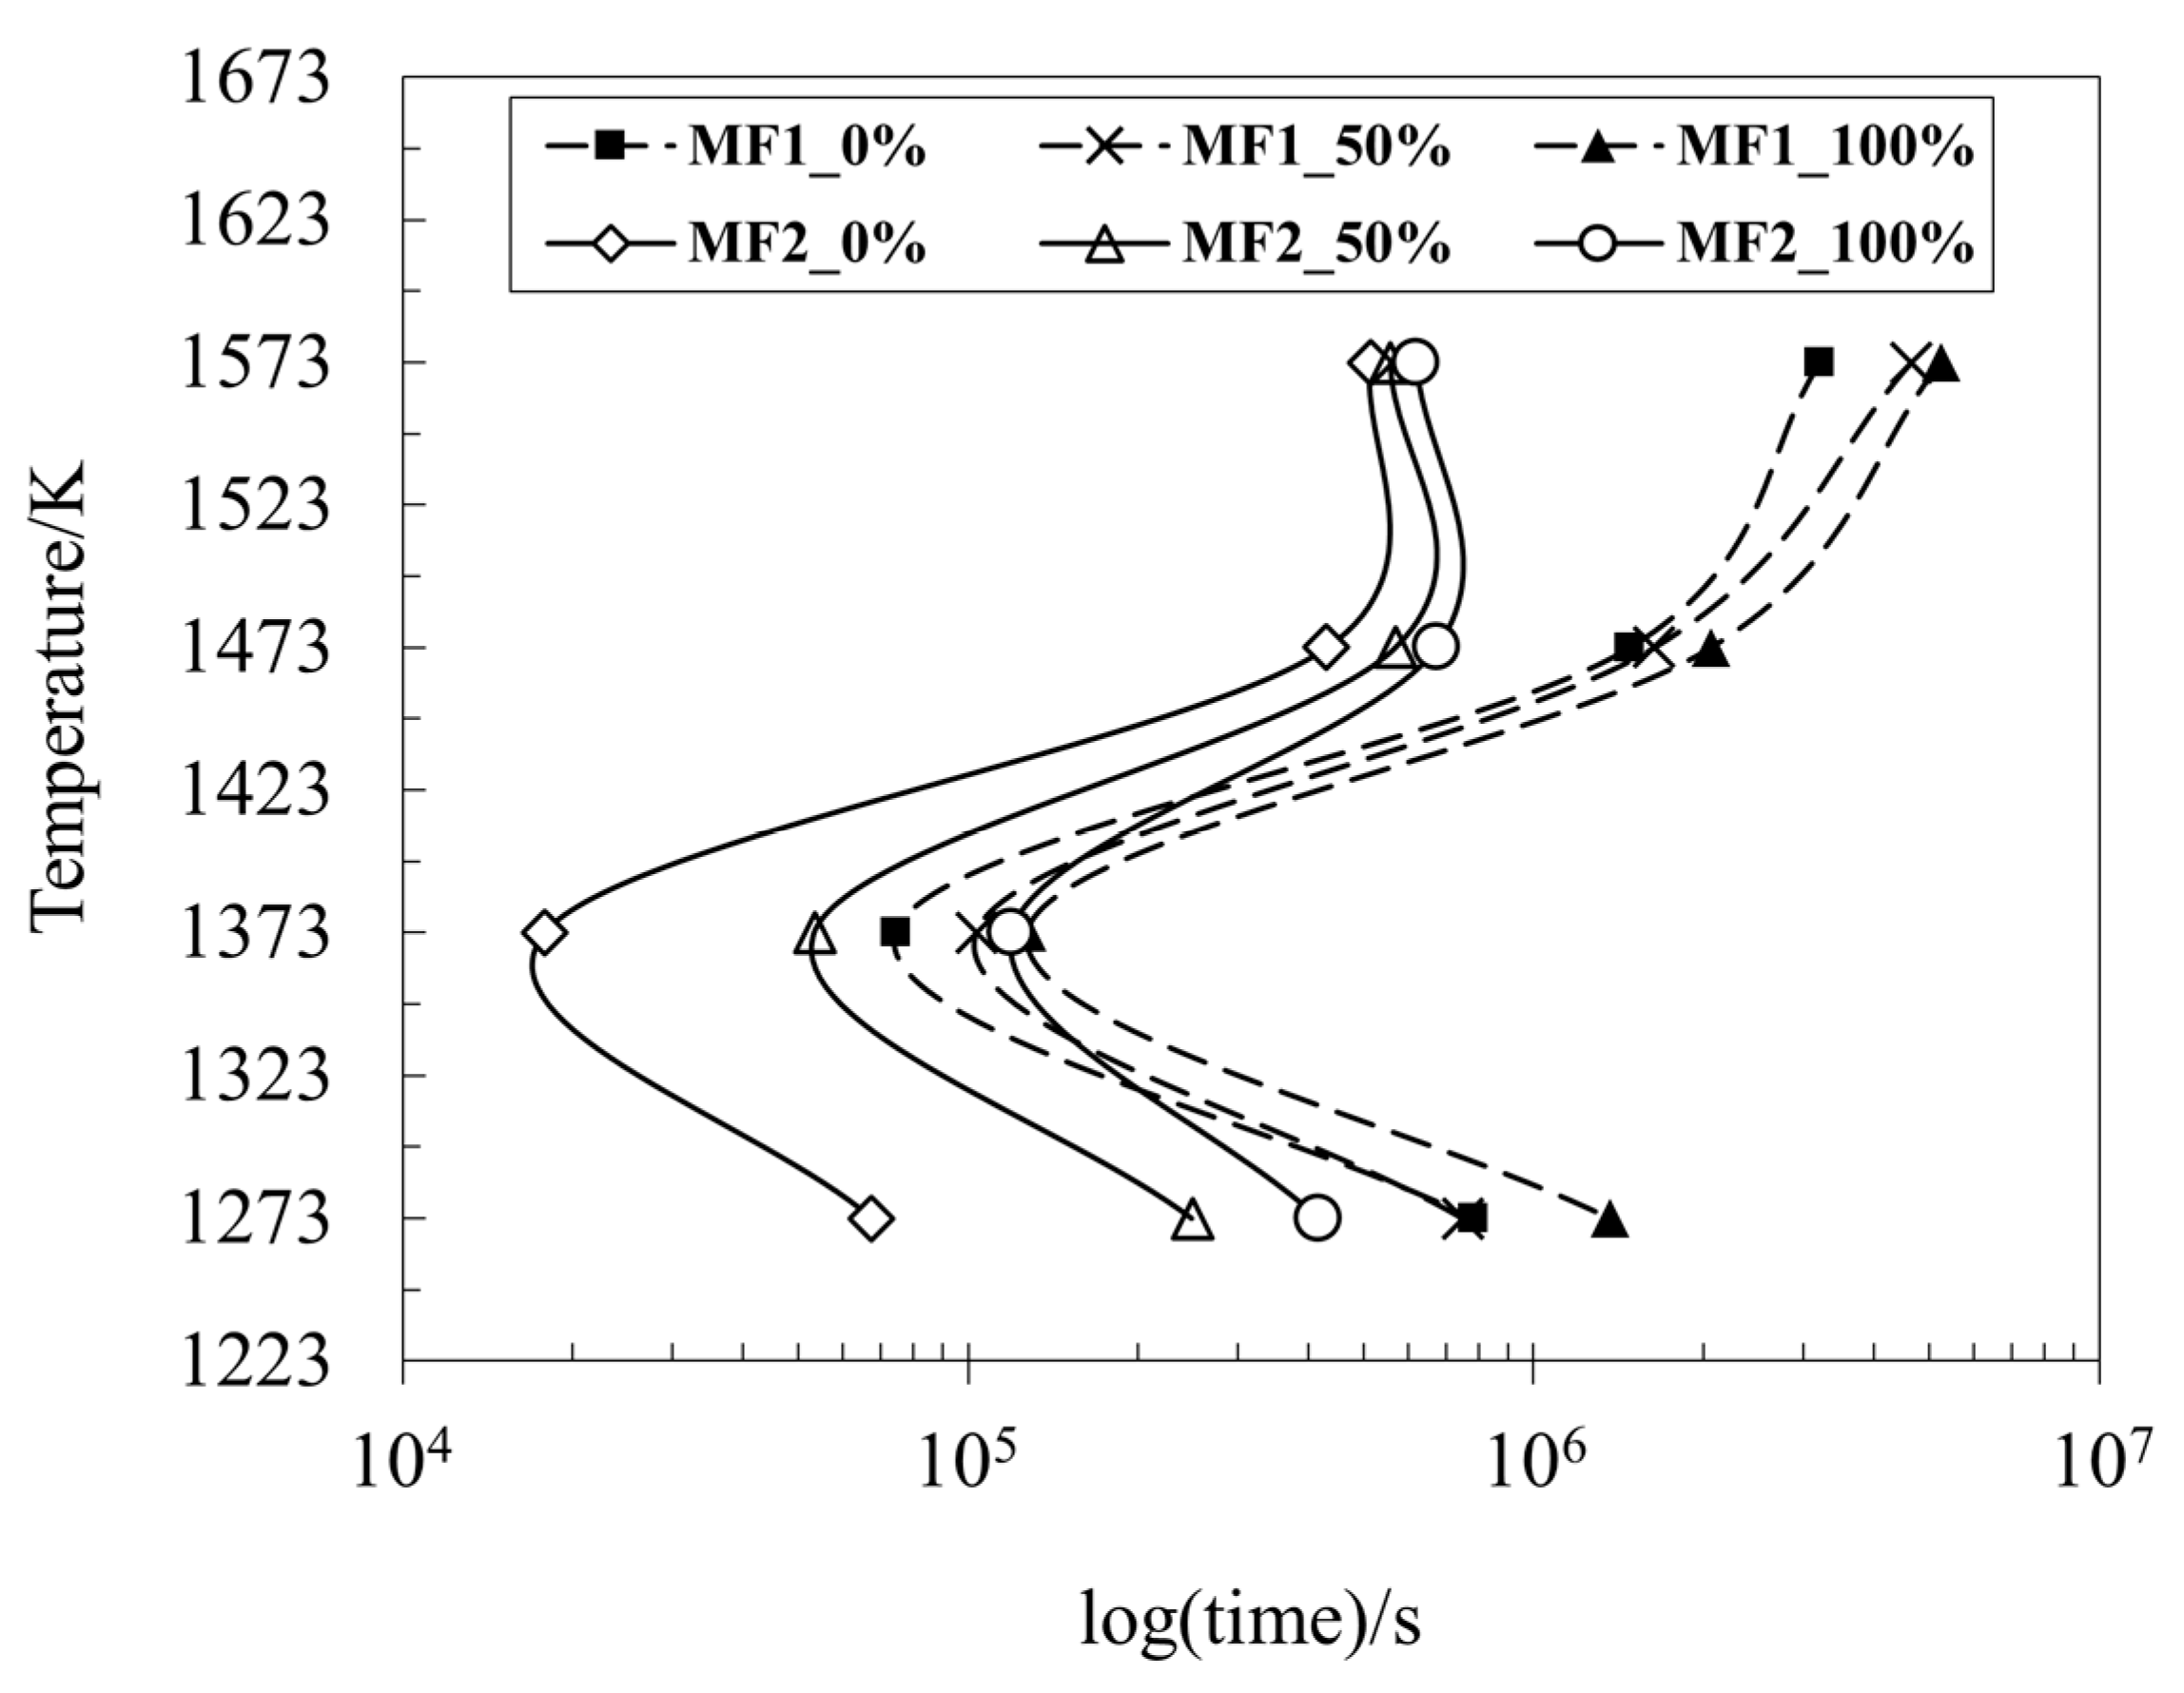
The SHTT experiments also allowed for the construction of a TTT diagram of the investigated mold powders (Figure 12). The incubation time was determined in situ via the SHTT method, considering the first appearance of crystals in the samples. The observation of crystals was observed in both cases in the temperature range of 1273–1573 K. Crystals were first observed for MF2, meaning it presented a shorter incubation time than MF1. This behavior agrees with the findings of Chebykin et al. and Silva et al., where mold fluxes with lower viscosities exhibited shorter incubation times [1,25].
The CCR of the investigated mold powders was determined via the following equation [42]:
C C R = T l i q . T n o s e / t n o s e
where CCR = critical cooling rate [K s−1], Tliq = liquidus temperature [K], Tnose = nose temperature obtained from the TTT diagram [K], and tnose = time at the nose temperature [s]. As mentioned before, the CCR is the minimum cooling rate necessary to achieve complete glass formation while preventing crystallization [24]. The CCR for MF1 was found to be 21 K s−1; it was 18 K s−1 for MF2.

4. Conclusions

This study examined the viscosity, density, surface tension and crystallization behavior of two commercial mold fluxes within the temperature range of 1373–1673 K. Experimental investigations were conducted using the RBV, MBP, and SHTT. After the experimental investigations, the following can be concluded:
  • The dynamic viscosity was successfully measured and showed that both samples present a breaking temperature. Tbr MF1 is higher than MF2, with values of 1439 K and 1425 K, respectively.
  • Arrhenius equations for MF1 and MF2 are as follows:
    ln η M F 1 = 4.2428 + 15,362 / T
    ln η M F 2 = 3.5284 + 13,484 / T
  • Arrhenius analysis indicated that MF1 has a higher Ea, 127.64 kJ mol−1 in comparison to 112.11 kJ mol−1 for MF2.
  • The average density values for MF1 varied from 2642.35 ± 4.98 kg m−3 to 2617.56 ± 3.50 kg m−3, while for MF2 it varied from 2708.30 ± 56.06 kg m−3 to 2655.58 ± 16.07 kg m−3, between 1523 and 1623 K.
  • The dependence of the density on temperature for the mold fluxes is as follows:
    ρ T M F 1 = 0.2479 · T T r e f . + 2642.35
    ρ T M F 2 = 0.5271 · T T r e f . + 2708.30
  • The surface tension of the MF1 sample decreased from 299.40 ± 3.11 mN m−1 to 290.76 ± 2.11 mN m−1. Similarly, the surface tension of MF2 declined from 347.97 ± 3.37 mN m−1 to 304.81 ± 91.72 mN m−1.
  • The dependence of the surface tension on temperature is:
    σ T M F 1 = 0.0864 · T T r e f . + 299.40
    σ T M F 2 = 0.4316 · T T r e f . + 347.97
  • The SHTT results showed that the increase in the cooling rate was responsible for the decrease in the crystallization temperatures for all stages and in both samples.
  • Both samples presented crystals; MF1 presented a longer incubation time than MF2 due to its higher content of glass-forming oxides, which resist crystallization.
  • Complete glass formation is possible in the system MF1 at cooling rates above 21 K s−1 and in MF2 above 18 K s−1.
The findings provide essential input parameters for modeling the continuous casting process of flat steel products, aiding process optimization and improving mold flux selection for enhanced casting performance. Additionally, the obtained data serve as valuable insights into the thermophysical properties and crystallization behavior of mold fluxes, contributing to a deeper understanding of emulsification phenomena at the steel–slag interface during continuous casting. Microstructure analysis could be performed by Scanning Electron Microscopy analysis of quenched samples to improve the understanding of mold flux crystallization.

Author Contributions

Conceptualization, A.Y., D.C., D.Z. and O.V.; Methodology, M.R.B., A.Y., D.C. and O.V.; Software, A.Y.; Validation, M.R.B., A.Y., D.C. and D.Z.; Formal analysis, M.R.B., A.Y., D.C., D.Z. and O.V.; Investigation, M.R.B. and A.Y.; Resources, A.Y., D.Z. and O.V.; Data curation, A.Y. and O.V.; Writing—original draft, M.R.B.; Writing—review & editing, M.R.B., A.Y., D.C., D.Z. and O.V.; Visualization, M.R.B.; Supervision, A.Y. and O.V.; Project administration, O.V.; Funding acquisition, O.V. All authors have read and agreed to the published version of the manuscript.

Funding

This work was financially supported by the Deutsche Forschungsgemeinschaft (DFG)—German Research Foundation under grant No. 461482547, within the scope of the Research Training Group GRK 2802 (Refractory Recycling: A contribution for raw material, energy, and climate efficiency in high-temperature processes), subprojects P4 and P5 at the Institute of Iron and Steel Technology, Technische Universität Bergakademie Freiberg.

Data Availability Statement

The data presented in this study are available on request from the corresponding author due to legal reasons.

Conflicts of Interest

Author Dmitry Chebykin was employed by the company ArcelorMittal Eisenhüttenstadt GmbH. The remaining authors declare that the research was conducted in the absence of any commercial or financial relationships that could be construed as a potential conflict of interest.

References

  1. Chebykin, D.; Heller, H.P.; Schulz, K.; Endo, R.; Volkova, O. Viscosity, Density, Surface Tension, and Crystallization Behavior of Commercial Mold Fluxes. Steel Res. Int. 2024, 96, 2400103. [Google Scholar] [CrossRef]
  2. Wang, W.; Lu, B.; Xiao, D. A Review of Mold Flux Development for the Casting of High-Al Steels. Metall. Mater. Trans. B Process Metall. Mater. Process. Sci. 2016, 47, 384–389. [Google Scholar] [CrossRef]
  3. Mills, K.C.; Fox, A.B.; Li, Z.; Thackray, R.P. Performance and Properties of Mould Fluxes. Ironmak. Steelmak. 2005, 32, 26–34. [Google Scholar] [CrossRef]
  4. Mills, K.C. Structure and Properties of Slags Used in the Continuous Casting of Steel: Part 1 Conventional Mould Powders. ISIJ Int. 2016, 56, 1–13. [Google Scholar] [CrossRef]
  5. Brandaleze, E.; Di Gresia, G.; Santini, L.; Martín, A.; Benavidez, E. Mould Fluxes in the Steel Continuous Casting Process. In Science and Technology of Casting Processes; Srinivasan, M., Ed.; InTechOpen: London, UK, 2012; pp. 205–233. [Google Scholar]
  6. Hibbeler, L.C.; Thomas, B.G. Investigation of Mold Flux Entrainment in CC Molds due to Shear Layer Instability; Association for Iron & Steel Technology: Pittsburgh, PA, USA, 2010. [Google Scholar]
  7. Thomas, B.G. Modeling of the Continuous Casting of Steel-Past, Present, and Future. Metall. Mater. Trans. B 2002, 33B, 795–812. [Google Scholar] [CrossRef]
  8. Hagemann, R.; Heller, H.P.; Lachmann, S.; Seetharaman, S.; Scheller, P.R. Slag Entrainment in Continuous Casting and Effect of Interfacial Tension. Ironmak. Steelmak. 2012, 39, 508–513. [Google Scholar] [CrossRef]
  9. Hagemann, R.; Schwarze, R.; Heller, H.P.; Scheller, P.R. Model Investigations on the Stability of the Steel-Slag Interface in Continuous-Casting Process. Metall. Mater. Trans. B Process Metall. Mater. Process. Sci. 2013, 44, 80–90. [Google Scholar] [CrossRef]
  10. Li, C.; Thackray, R.; Mills, K.C. A Test to Determine Crystallinity of Mould Fluxes. In Proceedings of the VII International Conference on Molten Slags, Fluxes and Salt, Cape Town, South Africa, 25–28 January 2004; The South African Institute of Mining and Metallurgy: Johannesburg, South Africa, 2004; pp. 813–820. [Google Scholar]
  11. Zhao, H.; Wang, W.; Zhou, L.; Lu, B.; Kang, Y.B. Effects of MnO on Crystallization, Melting, and Heat Transfer of CaO-Al2O3-Based Mold Flux Used for High Al-TRIP Steel Casting. Metall. Mater. Trans. B Process Metall. Mater. Process. Sci. 2014, 45, 1510–1519. [Google Scholar] [CrossRef]
  12. Ou, G.L.; Liu, Y.C.; Yen, S.Y.; Wang, H.Y.; Su, Y.H.; Lu, M.J.; Lin, S.K. Reactivity and Thermo-Physical Properties of MnO-Modified CaO-Al2O3-Based Mold Fluxes for Advanced High-Strength Steels. J. Mater. Res. Technol. 2020, 9, 12091–12101. [Google Scholar] [CrossRef]
  13. Zhou, L.; Wang, W.; Zhou, K. Effect of Al2O3 on the Crystallization of Mold Flux for Casting High Al Steel. Metall. Mater. Trans. E 2015, 2, 99–108. [Google Scholar] [CrossRef]
  14. Wang, H.C.; Bao, G.D.; Sadaf, S.; Mao, S.S.; Wu, T. Combing Role of MgO and Al2O3 on Viscosity and Its Correlation to Structure of Fluorine-Free Mold Fluxes. J. Min. Metall. Sect. B Metall. 2023, 59, 507–514. [Google Scholar] [CrossRef]
  15. Wang, W.; Shao, H.; Zhou, L.; Luo, H.; Wu, H. Rheological Behavior of the CaO-Al2O3-Based Mold Fluxes with Different Na2O Contents. Ceram. Int. 2020, 46, 26880–26887. [Google Scholar] [CrossRef]
  16. Heller, H.P.; Schürmann, M.; Scholl, K.; Haustein, N.; Lychatz, B.; Falkus, J. Calibration Problems with the Viscosity Measurement of Liquid Metallurgical Slags. J. Phys. Conf. Ser. 2017, 790, 012010. [Google Scholar] [CrossRef]
  17. Chebykin, D.; Heller, H.P.; Dubberstein, T.; Korobeinikov, I.; Volkova, O. Viscosity Measurement of Slags Using Rotating Bob and Vibrating Finger Viscometer. ISIJ Int. 2017, 57, 1319–1326. [Google Scholar] [CrossRef]
  18. Yehorov, A.; Wei, X.; Bellé, M.R.; Volkova, O. Influence of SiO2-Adding on the Thermophysical Properties and Crystallization Behavior of Ladle Slags. Steel Res. Int. 2023, 95, 2300173. [Google Scholar] [CrossRef]
  19. Silva, D.d.R.; Vilela, A.C.F.; Heck, N.C.; Heller, H.P.; Volkova, O. Solidification Behavior of CaO–SiO2–Al2O3 Mold Fluxes Containing MgO and Low TiO2 Content Using Single Hot Thermocouple Technique (SHTT): Continuous-Cooling-Transformation (CCT) and Viscosity Analysis. Steel Res. Int. 2018, 89, 1700246. [Google Scholar] [CrossRef]
  20. Levchenko, M.; Kovtun, O.; Angelini, A.; Markus, H.P.; Sosin, D.; Endo, R.; Volkova, O. Effect of SiO2 and Al2O3 on the Thermophysical Properties and the Foaming Index of Electric Arc Interface Slag from the Production of Construction Steel. Steel Res. Int. 2024, 96, 2400476. [Google Scholar] [CrossRef]
  21. Bellé, M.R.; Neubert, L.; Sherstneva, A.; Yamamoto, T.; Nishi, T.; Yamano, H.; Weinberg, M.; Volkova, O. Density, Surface Tension, and Viscosity of Liquid Low-Sulfur Manganese–Boron Steel via Maximum Bubble Pressure and Oscillating Crucible Methods. Steel Res. Int. 2024, 96, 2400252. [Google Scholar] [CrossRef]
  22. Dubberstein, T.; Heller, H.P. The Thermophysical Properties of Liquid TRIP/TWIP-Steel Alloys Using the Maximum Bubble Pressure Method. Adv. Eng. Mater. 2013, 15, 583–589. [Google Scholar] [CrossRef]
  23. Klug, J.L.; Hagemann, R.; Heck, N.C.; Vilela, A.C.F.; Heller, H.P.; Scheller, P.R. Solidification Behaviour of Slags: The Single Hot Thermocouple Technique. J. Manuf. Sci. Prod. 2014, 13, 91–102. [Google Scholar] [CrossRef]
  24. Klug, J.L.; Hagemann, R.; Heck, N.C.; Vilela, A.C.F.; Heller, H.P.; Scheller, P.R. Fluorine-Free Mould Powders for Slab Casting: Crystallization Control in the CaO-SiO2-TiO2-Na2O-Al2O 3 System. Steel Res. Int. 2012, 83, 1186–1193. [Google Scholar] [CrossRef]
  25. Silva, D.d.R.; Heck, N.C.; Vilela, A.C.F.; Heller, H.P.; Volkova, O. Water-CaO-Al2O3 Join Interaction: Crystallization Behavior Investigation Using the Single Hot Thermocouple Technique (SHTT). Cryst. Res. Technol. 2022, 57, 2100003. [Google Scholar] [CrossRef]
  26. Urbain, G. Viscosity Estimation of Slags. Steel Res. 1987, 58, 111–116. [Google Scholar] [CrossRef]
  27. Persson, M.; Görnerup, M.; Seetharaman, S. Viscosity Measurements of Some Mould Flux Slags. ISIJ Int. 2007, 47, 1533–1540. [Google Scholar] [CrossRef]
  28. Sridhar, S.; Mills, K.C.; Afrange, O.D.C.; Lörz, H.P.; Carli, R. Break Temperatures of Mould Fluxes and Their Relevance to Continuous Casting When Viscosity Measurements Are Carried out During. Ironmak. Steelmak. 2000, 27, 238–242. [Google Scholar] [CrossRef]
  29. Kondratiev, A.; Ilyushechkin, A. Flow Behaviour of Crystallising Coal Ash Slags: Shear Viscosity, Non-Newtonian Flow and Temperature of Critical Viscosity. Fuel 2018, 224, 783–800. [Google Scholar] [CrossRef]
  30. Sadaf, S.; Wu, T.; Zhong, L.; Liao, Z.Y.; Wang, H.C. Effect of Basicity on the Structure, Viscosity and Crystallization of CaO-SiO2-B2O3 Based Mold Fluxes. Metals 2020, 10, 1240. [Google Scholar] [CrossRef]
  31. Kromhout, J.A.; Schimmel, R.C. Understanding Mould Powders for High-Speed Casting. Ironmak. Steelmak. 2018, 45, 249–256. [Google Scholar] [CrossRef]
  32. Yeo, T.M.; Cho, J.W.; Alloni, M.; Casagrande, S.; Carli, R. Structure and Its Effect on Viscosity of Fluorine-Free Mold Flux: Substituting CaF2 with B2O3 and Na2O. J. Non-Cryst. Solids 2020, 529, 119756. [Google Scholar] [CrossRef]
  33. Liu, Q.; Wang, W.; Gao, M.; Du, S.; Yin, Y.; Zhang, J. Effect of CaO/SiO2 and Al2O3/SiO2 Mass Ratios on Structure and Viscosity of Mold Flux for Continuous Casting High-Mn High-Al Steel. Steel Res. Int. 2024, 96, 2400740. [Google Scholar] [CrossRef]
  34. Mills, K.C. The Influence Slags of Structure on the Physico-Chemical Properties of. ISIJ Int. 1993, 33, 148–155. [Google Scholar] [CrossRef]
  35. Mills, K.C.; Karagadde, S.; Lee, P.D.; Yuan, L.; Shahbazian, F. Calculation of Physical Properties for Use in Models of Continuous Casting Process-Part 1: Mould Slags. ISIJ Int. 2016, 56, 264–273. [Google Scholar] [CrossRef]
  36. Matsushita, T.; Ishikawa, T.; Paradis, P.-F.; Mukai, K.; Seetharaman, S. Density Measurements of Mould Flux Slags by Electrostatic Levitation Method. ISIJ 2006, 46, 606–610. [Google Scholar] [CrossRef]
  37. Mills, K.C.; Keene, B.J. Physical Properties of BOS Slags. Int. Mater. Rev. 1987, 32, 1–120. [Google Scholar] [CrossRef]
  38. Shu, Q. A Density Estimation Model for Molten Silicate Slags. High Temp. Mater. Process. 2007, 26, 341–348. [Google Scholar] [CrossRef]
  39. Mills, K.C. Estimation of Physicochemical Properties of Coal Slags and Ashes. In ACS Symposium Series: Mineral Matter and Ash in Coal; Vorres, K.S., Ed.; American Chemical Society: Washington, DC, USA, 1986; pp. 195–214. [Google Scholar]
  40. Gao, Q.; Min, Y.; Jiang, M. The Temperature and Structure Dependence of Surface Tension of CaO-SiO2-Na2O-CaF2 Mold Fluxes. Metall. Mater. Trans. B Process Metall. Mater. Process. Sci. 2018, 49, 1302–1310. [Google Scholar] [CrossRef]
  41. Nakamoto, M.; Tanaka, T.; Holappa, L.; Hämäläinen, M. Surface Tension Evaluation of Molten Silicates Containing Surface-Active Components (B2O3, CaF2 or Na2O). ISIJ Int. 2007, 47, 211–216. [Google Scholar] [CrossRef]
  42. Mutale, C.T.; Claudon, T.; Cramb, A.W. Observation of the Crystallization Behavior of a Slag Containing 46 Wt Pct CaO, 46 Wt Pct SiO2, 6 Wt Pct Al2O3, and 2 Wt Pct Na2O Using the Double Hot Thermocouple Technique. Metall. Mater. Trans. B 2005, 36, 417–418. [Google Scholar] [CrossRef]
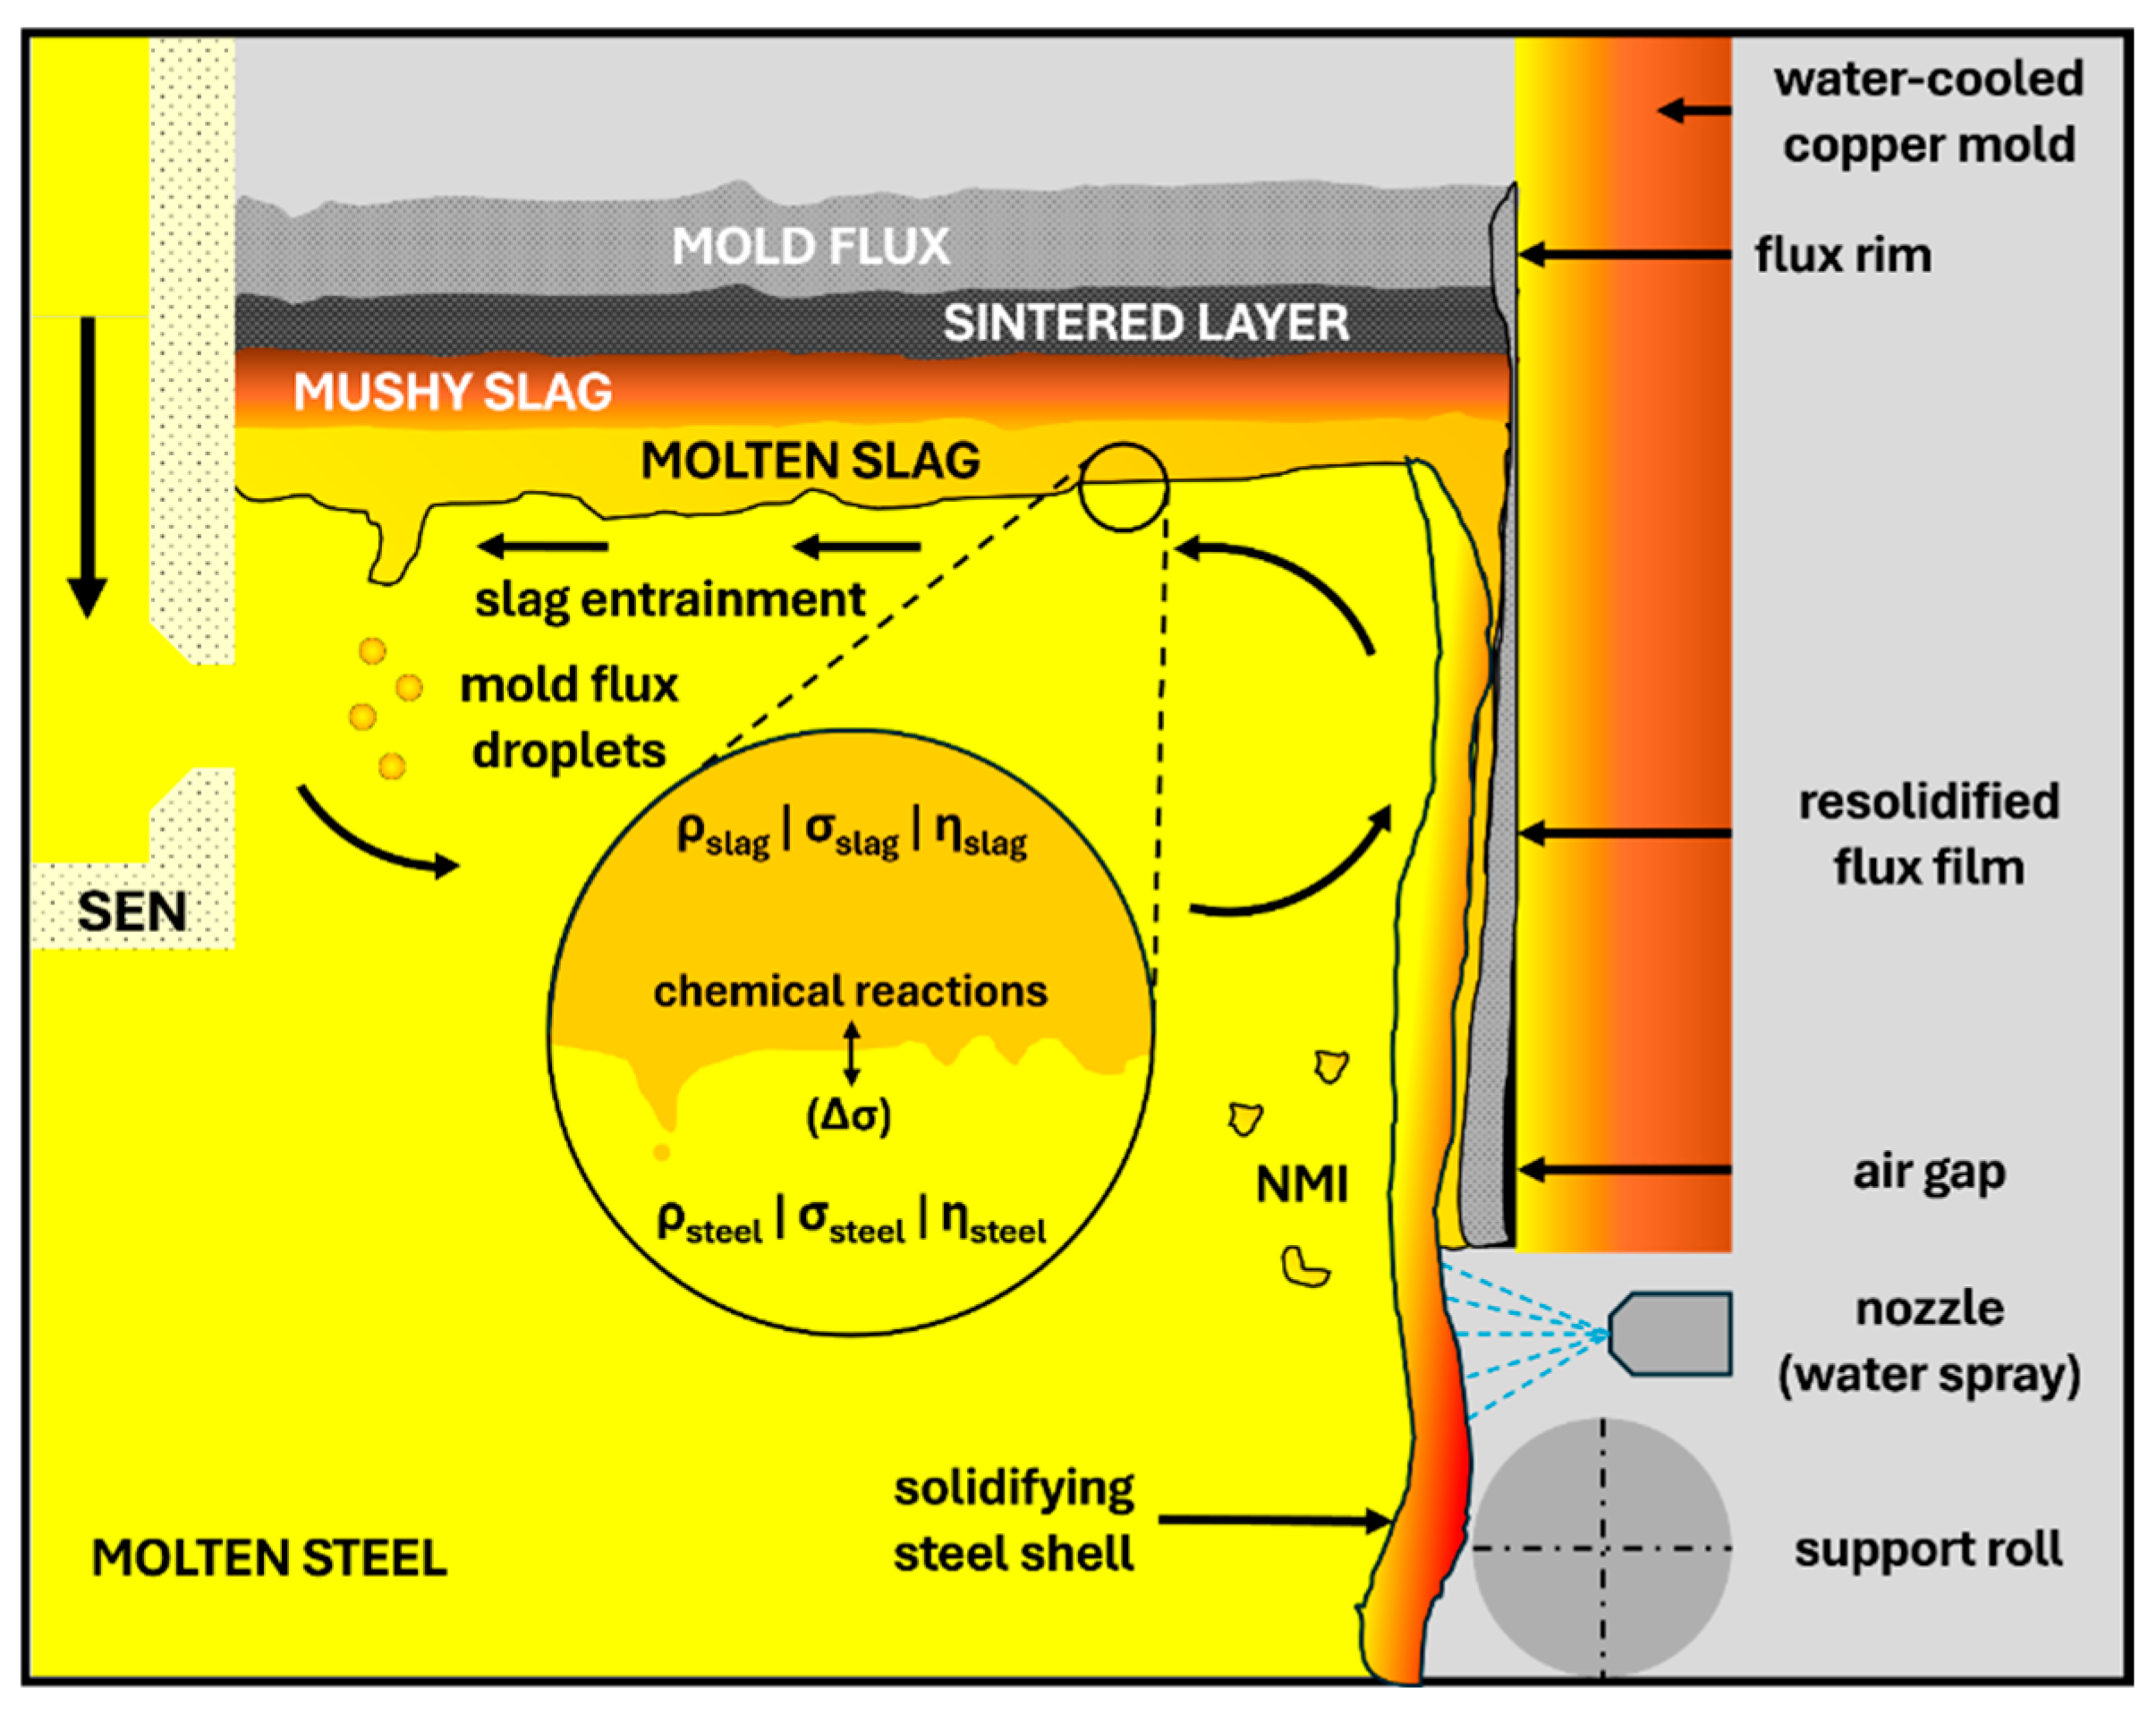
Figure 1. Illustration of molten flux entrainment into steel during continuous casting in the mold. Adapted from Thomas [7] and Hagemann [9].
Metals 15 00715 g001
Figure 2. Flowchart illustrating the experimental sequence of this work.
Metals 15 00715 g002
Figure 3. Scheme of RBV apparatus during a measurement for estimation of dynamic viscosity. (1) Mo rod; (2) Top Ar inlet; (3) Refractory lining; (4) Graphite susceptor; (5) Mo crucible; (6) Liquid mold flux; (7) Mo bob; (8) Induction coil; (9) Type B thermocouple; (10) Bottom Ar inlet.
Metals 15 00715 g003
Figure 4. Scheme of MBP apparatus during a measurement for estimation of density and surface tension. (1) Mo capillary; (2) Top Ar inlet; (3) Type B thermocouple; (4) Induction coil; (5) Mo crucible; (6) Ar bubble; (7) Liquid mold flux; (8) Graphite susceptor; (9) Refractory lining; (10) Bottom Ar inlet.
Metals 15 00715 g004
Figure 5. Scheme of SHTT apparatus during a measurement for analysis of the crystallization behavior of the mold fluxes. (1) Data acquisition center; (2) Electronic circuit; (3) CCD camera; (4) Light source; (5) Additional inductive heater; (6) Heating element; (7) Pt-Rh thermocouple with slag sample atop.
Metals 15 00715 g005
Figure 6. Average viscosity values as a function of temperature for MF1 and MF2, compared with the Urbain model. Adapted from Ref. [26].
Metals 15 00715 g006
Figure 7. Logarithmic values of dynamic viscosity as a function of the reciprocal temperature in K of the liquid-governed state of mold fluxes.
Metals 15 00715 g007
Figure 8. Density as a function of temperature of mold powders MF1 and MF2 in comparison to Chebykin et al. (Adapted from Ref. [1]), Matsushita et al. (Adapted from Ref. [36]) and their estimation with KCM model (Adapted from Ref. [37]).
Metals 15 00715 g008
Figure 9. Surface tension as a function of temperature of mold powders MF1 and MF2, their calculated values from KCM model (Adapted from Ref. [39]) and the experimental values of Chebykin et al. (Adapted from Ref. [1]) and Gao et al. (Adapted from Ref. [40]).
Metals 15 00715 g009
Figure 10. CCT diagram for MF1 obtained from SHTT experiments with different cooling rates and indication of crystallization level.
Metals 15 00715 g010
Figure 11. CCT diagram for MF2 obtained from SHTT experiments with different cooling rates and indication of crystallization level.
Metals 15 00715 g011
Figure 12. TTT diagram for MF1 and MF2 obtained via SHTT.
Metals 15 00715 g012
Table 1. Classification of oxides by function in MF compositions in wt.%. Adapted from Ref. [5].
Network FormersSiO217–56AlkalisNa2O0–25
Al2O30–13Li2O0–5
B2O30–19K2O0–2
Fe2O30–6FluidizingF
MnO
2–15
0–5
Network ModifiersCaO22–45
MgO0–10
BaO0–10Melting controlC2–20
SrO0–5
Table 2. Normalized chemical composition (wt.%) of mold fluxes MF1 and MF2 at different stages and CaO/SiO2 ratio development.
Flux
Components
As-Received Granules (~1 mm)After Pre-Melting
MF1MF2MF1MF2
CaO32.9131.7438.7740.89
SiO232.3432.6834.7236.30
Fe2O31.810.991.610.93
MgO1.471.881.532.07
Al2O36.793.767.074.33
MnO2.710.162.380.09
TiO20.160.250.120.19
K2O0.180.190.130.16
Na2O5.543.767.818.53
P2O50.440.480.070.05
CaF26.798.935.646.11
C8.5914.340.030.14
S0.160.710.140.19
Zn0.110.12--
CaO/SiO21.020.971.121.13
Table 3. Chemical composition (wt.%), CaO/SiO2 ratio, and viscosity at 1573 K of mold fluxes from literature compared with pre-melted samples of this work. Adapted from Refs. [1,30,31,32,33].
SampleSiO2CaOMgOAl2O3Na2OFLiO2B2O3Bal.CaO/SiO2η1573 K/mPa s
A [1]33.7642.182.23.439.099.110.33-0.61.25123
B [1]41.0336.945.634.574.885.71--2.710.90500
F1 [30]36.7442.26248-16-1.15171
F3 [30]33.6245.38248-16-1.35280
I [31]---------0.80160
II [31]---------0.85140
A [32]34.9331.82.533.58-15.74--11.421.23620
B [32]31.4930.682.573.31.6710.77-4.4915.031.22490
C [32]26.9930.322.263.463.44.71-9.0219.841.25770
D [32]22.9729.032.133.484.79--13.5424.061.26770
Vr-1 [33]49.2225.811.352.478.338.244.58--0.52227
Vr-2 [33]46.2928.451.262.469.257.934.36--0.61169
Vr-3 [33]42.5430.331.542.429.548.964.67--0.71125
Vr-4 [33]40.4933.451.142.289.398.354.90--0.8381
Vr-5 [33]35.8536.691.422.539.938.654.98--1.0271
AS-1 [33]49.2225.811.352.478.338.244.58--0.52227
AS-2 [33]40.9524.351.3210.029.658.495.22--0.5998
AS-3 [33]33.9523.891.5816.569.959.254.82--0.70132
AS-4 [33]29.1324.581.1822.329.558.654.59--0.84177
AS-5 [33]26.1123.671.1926.319.348.614.77--0.91229
MF134.7238.771.537.077.815.64--4.241.12251
MF236.3040.892.074.338.536.11--1.751.13159
Table 4. Arrhenius equation, activation energy (Ea), and parameter A of investigated mold fluxes.
SampleArrhenius EquationEa/kJ mol−1A/mPa s
MF1 ln η = 4.2428 + 15,362 / T 127.720.0144
MF2 ln η = 3.5284 + 13,484 / T 112.110.0294
Table 5. Chemical composition for the NBO/T and Λcorr calculations. (*) refers to chemical composition based on samples after pre-melting.
SampleCaOSiO2Fe2O3MgOAl2O3MnOP2O5TiO2K2ONa2OCaF2
MF136.1135.491.991.617.452.980.480.170.206.087.45
MF237.4238.531.162.224.430.190.570.290.224.4310.53
MF1 *38.7734.771.611.537.082.380.070.120.137.825.65
MF2 *41.0336.430.932.084.350.090.050.190.168.566.13
Table 6. Values corresponding to mold flux structure and calculated specific temperatures (K) of MF1 and MF2.
SampleBasicity
(CaO/SiO2)
(Λcorr)NBO/TQ(%cryst.)TliqTbr
as-received granulesMF11.020.67591.752.25014501384
MF20.970.66642.051.954.714771409
after pre-meltingMF11.120.672722014401428
MF21.130.69762.41.65514361470
Table 7. Average density values (kg m−3) and standard deviations of mold powders MF1 and MF2 measured via the MBP method and values calculated with the KCM model.
T/KMF1MF2KCM-MF1 [37]KCM-MF2 [37]A [1]B [1]C [36]
15232642.35 ± 4.982708.30 ± 56.063091.353020.19272528472593
15482638.26 ± 13.952689.25 ± 82.423053.342983.18---
15732628.61 ± 9.892679.03 ± 20.653016.252947.08267028222578
15982622.18 ± 9.902668.62 ± 15.142980.052911.83---
16232617.56 ± 3.502655.58 ± 16.072944.702877.42263628122563
Table 8. Average surface tension values (mN m−1) and standard deviations of mold powders MF1 and MF2 measured via MBP method and values calculated with the KCM model and the experimental values of Chebykin et al. (Adapted from Ref. [1]) and Gao et al. (Adapted from Ref. [40]).
T/KMF1MF2KCM-MF1KCM-MF2A [1]B [1]1 [40]2 [40]
1523299.40 ± 3.11347.97 ± 3.37288.68277.90445.6524.7--
1548297.29 ± 1.17329.80 ± 20.12287.37276.72----
1573295.16 ± 1.48320.43 ± 10.23286.07275.55434.8549--
1598293.32 ± 2.18319.24 ± 21.41284.76274.37----
1623290.76 ± 2.11304.81 ± 32.57283.45273.20437.9522.4417448
Table 9. Temperatures of crystallization (Start, 50%, and Completed) at different cooling rates for MF1 and MF2.
Cooling Rates (K min−1)10153090120240480
Crystallization Temperatures (K)MF1Start1240120011001090106010501030
50%110010901050104010201010-
Completed10701040103010301010--
MF2Start1330127012401210120011001090
50%132012601170114011301010-
Completed131011901150----
Table 10. Basicity, NBO/T ratio and nature of the oxides towards solidification structure (wt.%) of samples at different stages of the experiments.
SampleBasicity (CaO/SiO2)NBO/TGlass FormersCrystalline FormersNucleating Agents
as-received granulesMF11.021.7548.3851.450.17
MF20.972.0544.8954.820.29
after pre-meltingMF11.12245.9153.960.12
MF21.132.441.8557.960.19
Disclaimer/Publisher’s Note: The statements, opinions and data contained in all publications are solely those of the individual author(s) and contributor(s) and not of MDPI and/or the editor(s). MDPI and/or the editor(s) disclaim responsibility for any injury to people or property resulting from any ideas, methods, instructions or products referred to in the content.