Article

Influence of Cu(II) Ion Concentration on Copper Electrodeposition from Deep Eutectic Solvent on Inert Substrate

by
Vesna S. Cvetković
,
Nataša M. Petrović
,
Nebojša D. Nikolić
* and
Jovan N. Jovićević
Department of Electrochemistry, Institute of Chemistry, Technology and Metallurgy, University of Belgrade, Njegoševa 12, 11000 Belgrade, Serbia
*
Author to whom correspondence should be addressed.
Metals 2025, 15(7), 716; https://doi.org/10.3390/met15070716
Submission received: 13 May 2025 / Revised: 20 June 2025 / Accepted: 25 June 2025 / Published: 26 June 2025

Abstract

The electrochemical behavior of copper (II) on glassy carbon from an eutectic mixture of choline chloride (ChCl) and ethylene glycol (EG) was investigated using cyclic voltammetry (CV). The redox and deposition processes were studied for electrolyte concentrations of 0.01 M and 0.5 M Cu(II), with particular attention paid to the effects of different Cu(II) concentrations on the copper deposition potential and morphology of the copper deposits. The CV results showed that the Cu(II) species are reduced to Cu(0) via two separate steps. Higher Cu(II) concentrations in the electrolyte triggered the formation of differently coordinated Cun+ complexes next to the electrode, which shifted the electrodeposition potential of Cu(I)/Cu(0) couples towards more positive values. The Cu deposits were obtained potentiostatically from 0.01 M and 0.5 M Cu(II)-ChCl:EG electrolyte and analyzed using scanning electron microscopy, energy-dispersive X-ray spectroscopy, and X-ray diffraction. The different copper concentrations in electrolytes induced different morphologies of electrodeposited copper, where the mixture of irregular grains and carrot or needle-like dendrites was obtained from 0.01 M, and rose-like forms were obtained from 0.5 M electrolytes. This study is the first to identify these rose-like forms and the mechanism of their formation, which is discussed in detail.

1. Introduction

Deep eutectic solvents (DESs) have emerged as an alternative class of green solvents to classical room-temperature ionic liquids (ILs) [1]. Since their emergence, DESs have met the standards of green chemistry, as they manifest low toxicity, non-flammability, cost effectiveness, and have a wide electrochemical window [2,3]. Among these solvents, one of the most studied is the combination of choline chloride with hydrogen donor compounds, known as ethaline, which can form low-melting eutectic mixtures [4]. In electrochemistry and materials science, this class of ILs has received considerable attention due to the potential for better control of deposition parameters and specific influences on morphology [5]. The importance of DESs as environmentally friendly solvents is now widely recognized, as they are considered cost-effective “designer” solvents [1]. The term “designer solvents” is justified by their ability to change tunable thermophysical properties by altering the constituent ions in media [6]. This makes DESs a powerful tool for the electrodeposition of metals, and they can be used on an industrial scale as an alternative to aqueous plating solutions [7,8]. A wide range of IL electrolytes have been considered safe electrolytes that can be used in batteries, solar cells, supercapacitors, electrodeposition of reactive metals, fuel cells, nanomaterial synthesis, biofuel production, etc. [3,9]. Another advantage of DESs is their higher metal dissolving capacity, which makes them suitable for the electrodeposition of a wide range of metals [10,11,12]. This includes copper, as the electrodeposition of copper plays an essential role in printed circuits and can replace aluminum in circuit connections [8,10].
Copper electrodeposition has been extensively studied in both aqueous and ionic liquids, aiming to deposit thin and thick coatings [7,13]. Experimental challenges related to the determination of the exact cathodic charge transfer coefficient and the kinetics of the redox transitions of copper in ethaline, a eutectic mixture of choline chloride (ChCl) and ethylene glycol (EG), have been highlighted [8,10,14]. All studies have shown that the kinetics of the Cu2+/Cu+ redox transition in ethaline is slower than in aqueous electrolytes [10,14]. Our earlier study [15] and those of others [8,10,13,16,17] investigated copper electrodeposition from choline chloride:ethylene glycol (ChCl:EG) on various substrates such as palladium (Pd) [15], glassy carbon (GC) [8,10], brass [16], gold (Au) [13], platinum (Pt) [7,10,14], low-carbon steel discs [17], etc. The chosen substrates are chemically and crystallographically different, and they enable the systematic investigation of the feasibility of copper electrodeposition and the formation of copper alloys. The experimental results determined the Cun+ speciation in the ChCl:EG electrolytes and the influence of thermodynamic parameters on the formation and stabilization of Cun+ complexes in the solvent [14]. Various morphological forms, such as star-like, octahedral with dendritic branches, cube-like, spherical, cauliflower-like, and dendritic particles, are produced by Cu electrodeposition processes [18,19,20,21,22,23]. They are usually formed through electrodeposition from aqueous electrolytes [18,19,22,23], but ionic liquids (ILs) and deep eutectic solvents (DESs) are also used for producing morphologically different Cu shapes [20]. Depending on the composition of the electrolyte and the electrodeposition potentials, a structure of these surface morphologies consists of Cu, Cu2O, or a mixture of Cu/Cu2O. Furthermore, when comparing Cu electrodeposition from chloride aqueous electrolytes and ChCl:EG containing CuCl2, the systems behave in the same way, with the exception that a higher working temperature and a higher concentration of the electroactive species (Cun+) is required to achieve a current density comparable to that of aqueous electrolytes [8].
Considering the fact that Cu electrodeposition processes from DESs have been insufficiently explored, the aim of this study was to examine the effects of different Cu(II) ion concentrations on the electrochemical behavior of Cu in ChCl:EG on an inert glassy carbon (GC) electrode, with special focus on the morphological aspects of the electrodeposition process.

2. Materials and Methods

2.1. Preparation of Cu(II)-Ethaline Electrolyte

Deep eutectic solvent (DES) precursors, choline chloride (ChCl, ≥98%) and ethylene glycol (EG, 99.8%) were purchased from Sigma Aldrich (Burlington, MA, USA). The DES was prepared by stirring the two components in a 1:2 ChCl and EG molar ratio at 50 °C until the mixture was completely dissolved and formed a clear solution [7,14,15,24]. The Cu(II)-ethaline electrolyte for electrochemical investigation and electrodeposition was prepared by dissolving CuCl2·2H2O (99.0%, Merck, Burlington, MA, USA) in the as-prepared ethaline [14,15]. Stirring was resumed at 50 °C throughout the chloride salt dissolution process under an argon atmosphere. The Cu(II) concentration in the DES was maintained at either 0.01 M or 0.5 M, chosen as an example of two extreme cases of Cu(II) concentration in order to determine the effects of metal ion concentration on deposit morphology. The chemicals were used as received. Subsequently, the electrolyte was transferred to a conventional electrochemical cell, held under an argon atmosphere before and during the experiments.

2.2. Electrode and Instrumentation

The electrochemical experiments were carried out in a Pyrex glass cell to enable visual insight of the electrode positioning during the experiments. The cell had a lid with five openings for electrodes, a thermocouple (secured in a glass tube), and gas [24]. A three-electrode setup consisting of a copper counter electrode (Cu CE, 99.99%, Thermo Fisher Scientific, Oxford, UK, diameter d = 6 mm, active surface area in the electrolyte: 1.5 cm2), Cu quasi-reference electrode (Cu, RE, d = 4 mm, 99.99%), and glassy carbon (GC, >99.99% HTW SIGRADUR®, Thierhaupten, Germany) working electrode (WE) was used. The Cu counter electrode was used to maintain a constant Cu concentration in the bulk electrolyte during the electrochemical measurements and deposition. The quasi-reference electrode was placed in a Luggin capillary approximately 2 mm from the WE, with the Cu(II) ions present in the electrolyte having a stable potential. All potentials mentioned in the text refer to the Cu(II)/Cu(0) quasi-reference electrode. The GC electrode was polished with a polishing cloth containing 0.05 μm aqueous Al2O3 suspension to obtain a mirror-like surface. The electrode was then rinsed with Milli-Q water and sonicated in a water–ethanol mixture for 3 min at several intervals to remove impurities and air-dried before measurements [15,25]. The Cu electrodes were polished and etched as previously described [15]. A Gamry potentiostat/galvanostat Interface model 1010E (Gamry Instruments Inc., Warminster, PA, USA) controlled by Echem Analyst software (Version 7.8.4.8183) was used to perform and analyze electrochemical experiments, cyclic voltammetry (CV), and electrodeposition. The electrodeposition potentials were determined from the CV results in both electrolytes, containing different concentrations of Cu(II) ions, 0.01 M and 0.5 M.

2.3. Deposit Characterization

The surface morphology was analyzed using a JEOL JSM-IT300LV (Tokyo, Japan), scanning electron microscope (SEM) equipped with energy-dispersive X-ray spectroscopy (EDS, Oxford Instruments X-MAXN, Abingdon, UK) with an accelerating voltage of 20 keV, spot size of 60, probe current of 2 nA, and WD of 10 mm in high-vacuum mode. The crystalline structure of the deposit was identified using the X-ray diffraction (XRD) method. After electrodeposition was carried out in the constant potential mode, the cathode was lifted from the electrolytes and thoroughly washed with absolute ethanol (Zorka-Pharma, Šabac, Serbia) to remove any electrolyte residue, then the deposit was collected from the GC electrode and dried in a vacuum desiccator. XRD measurements were performed using a SmartLab® X-ray diffractometer (Rigaku Co., Tokyo, Japan), with Cu Kα radiation in the continuous scan mode (40 kV, 30 mA, and λ = 1.542 Å) with a scan rate of 0.5°/min.

3. Results

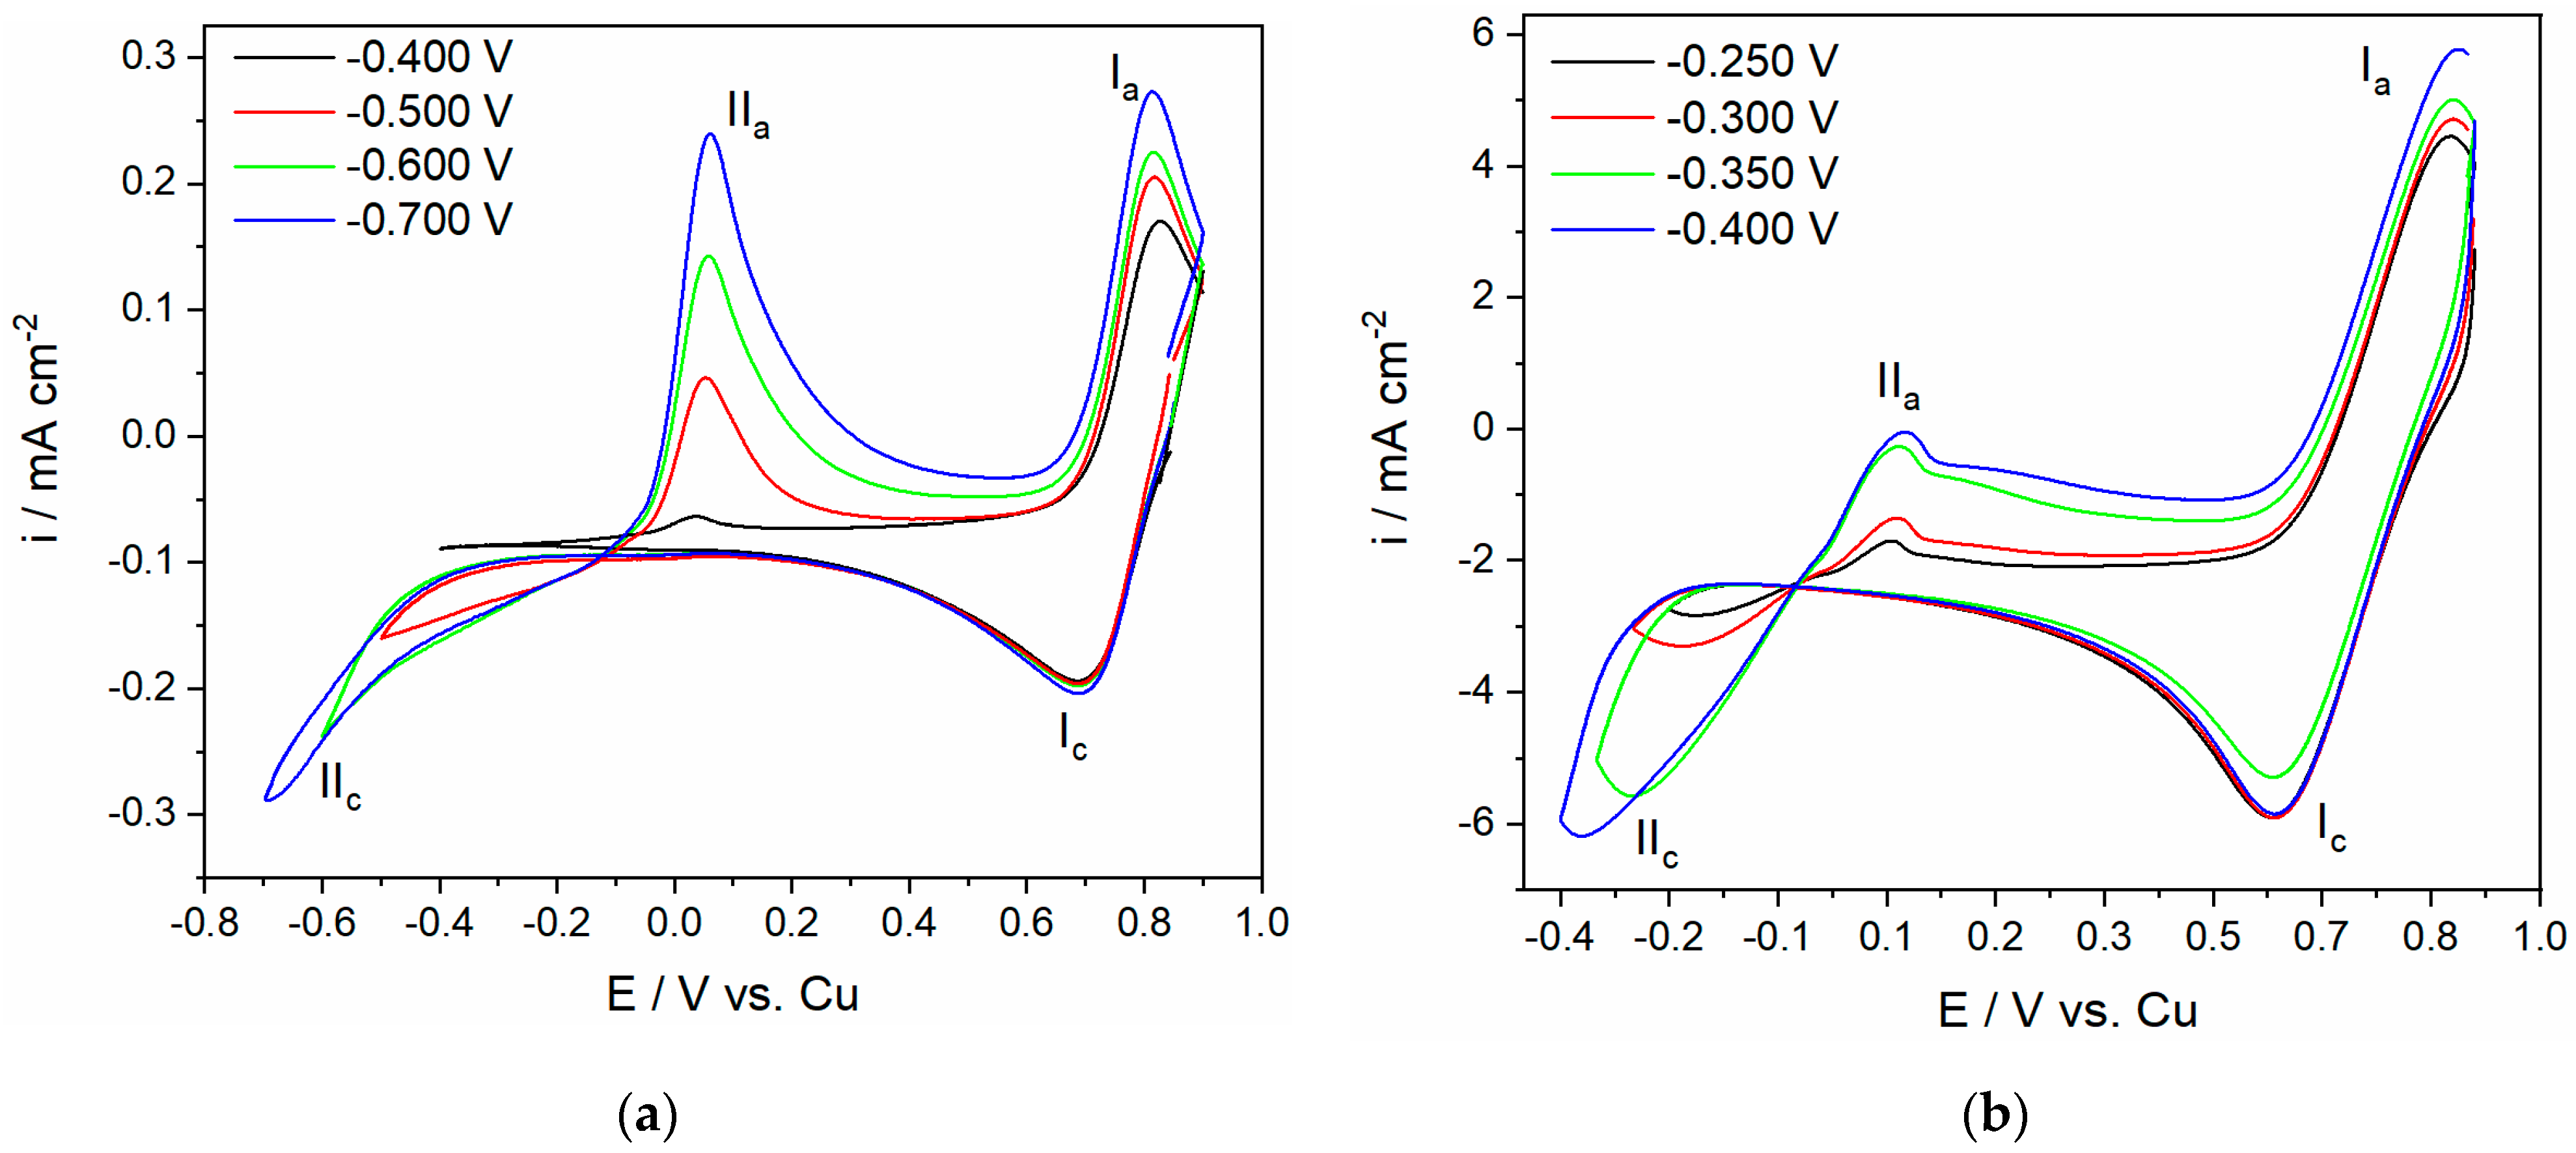
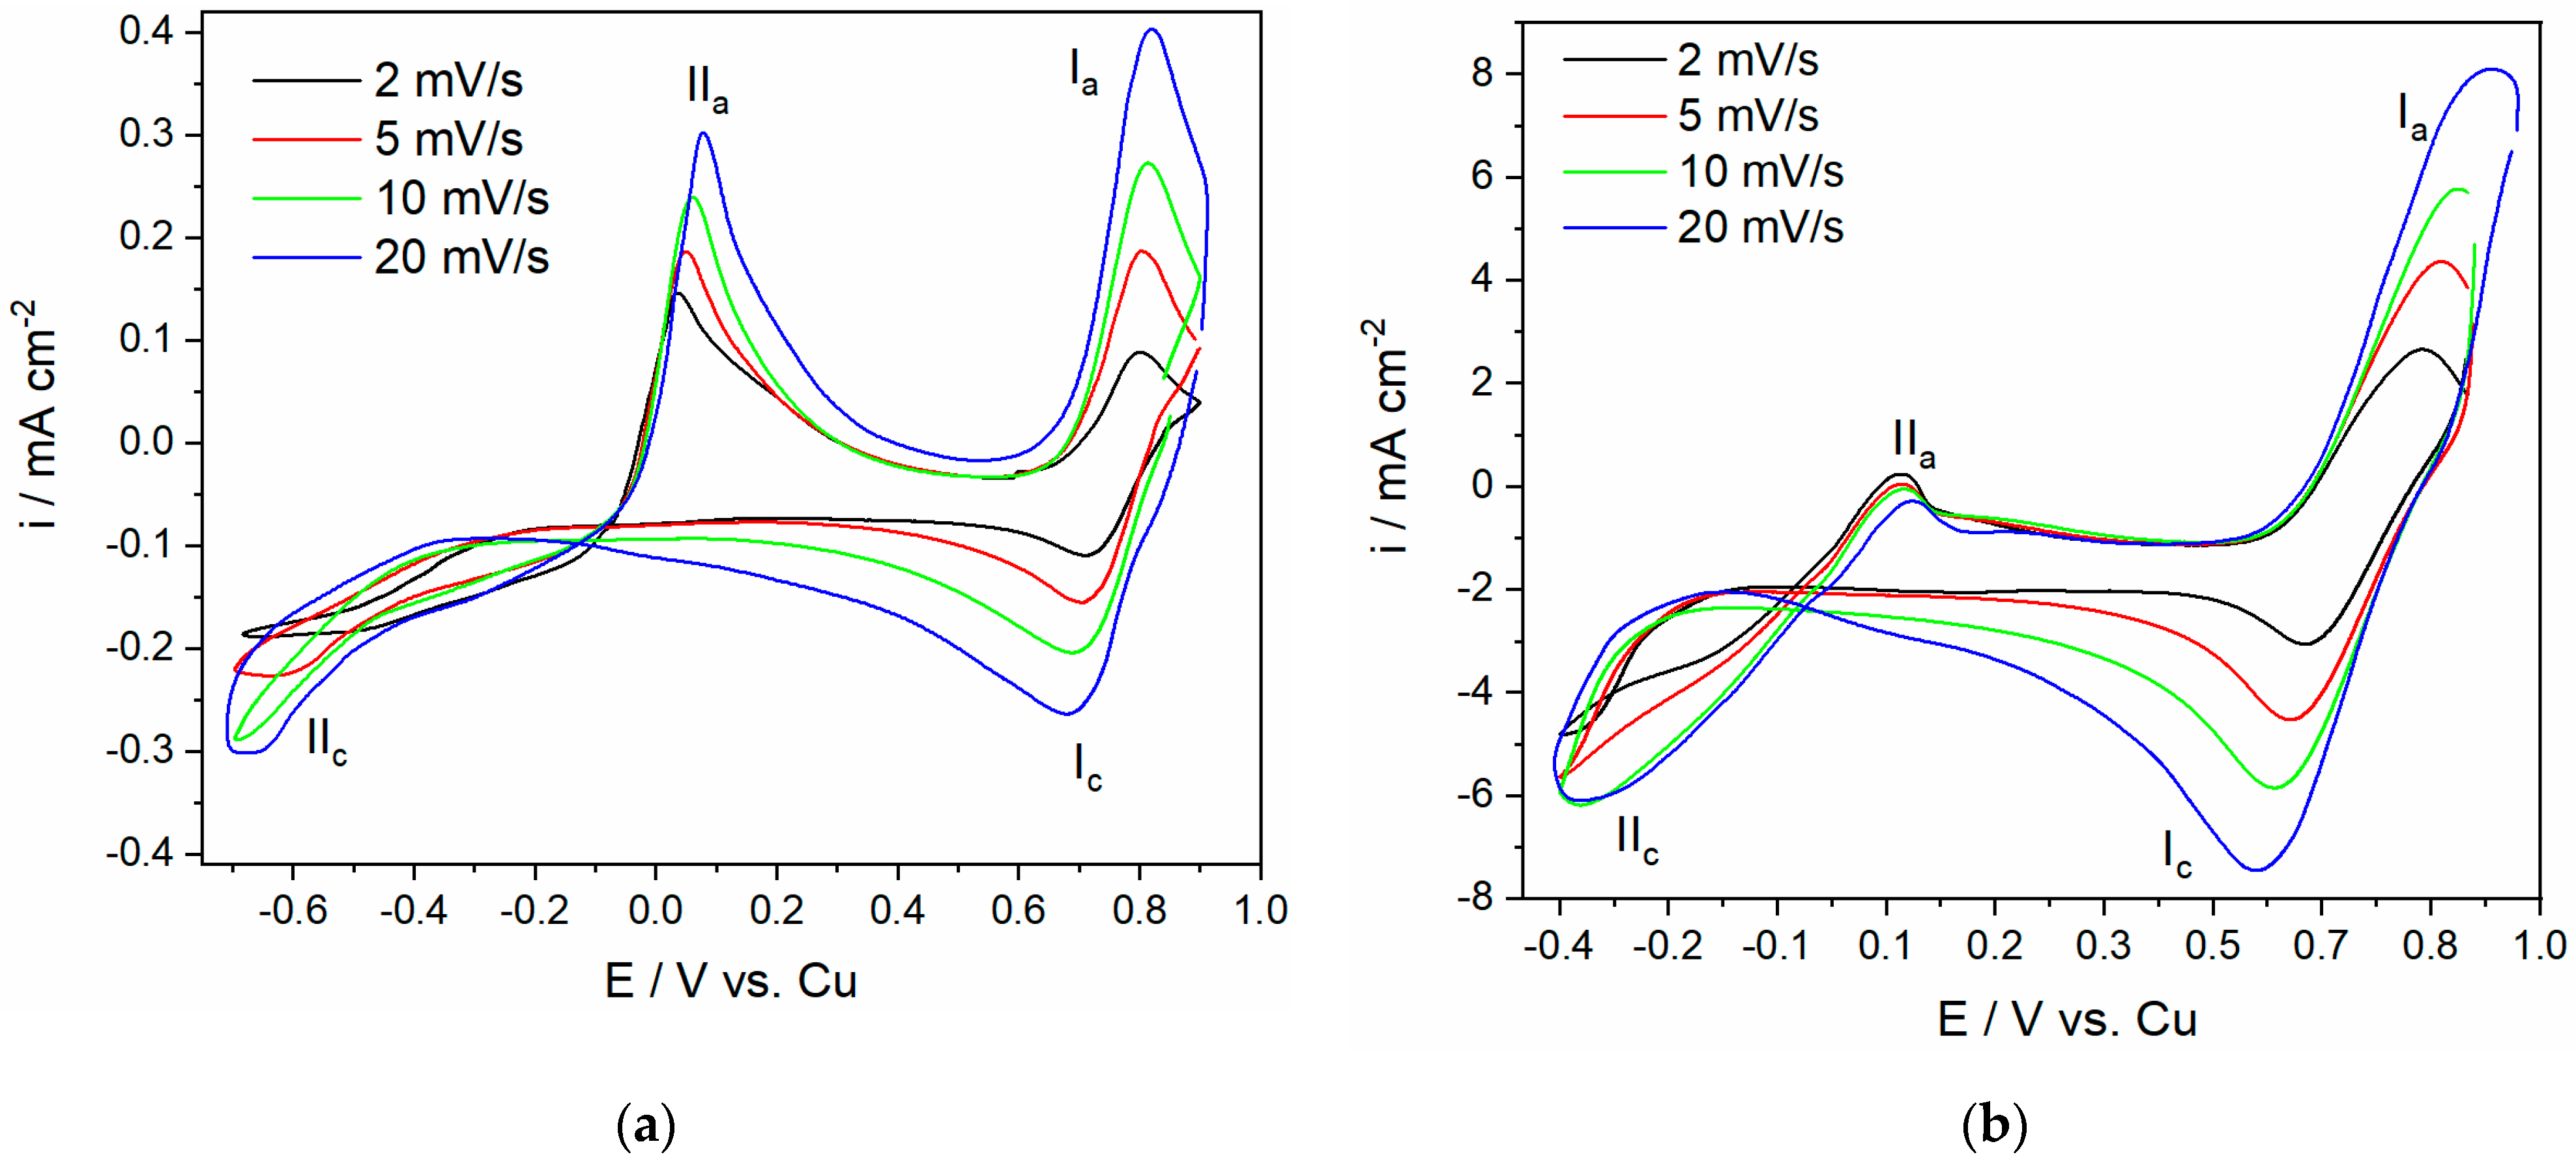
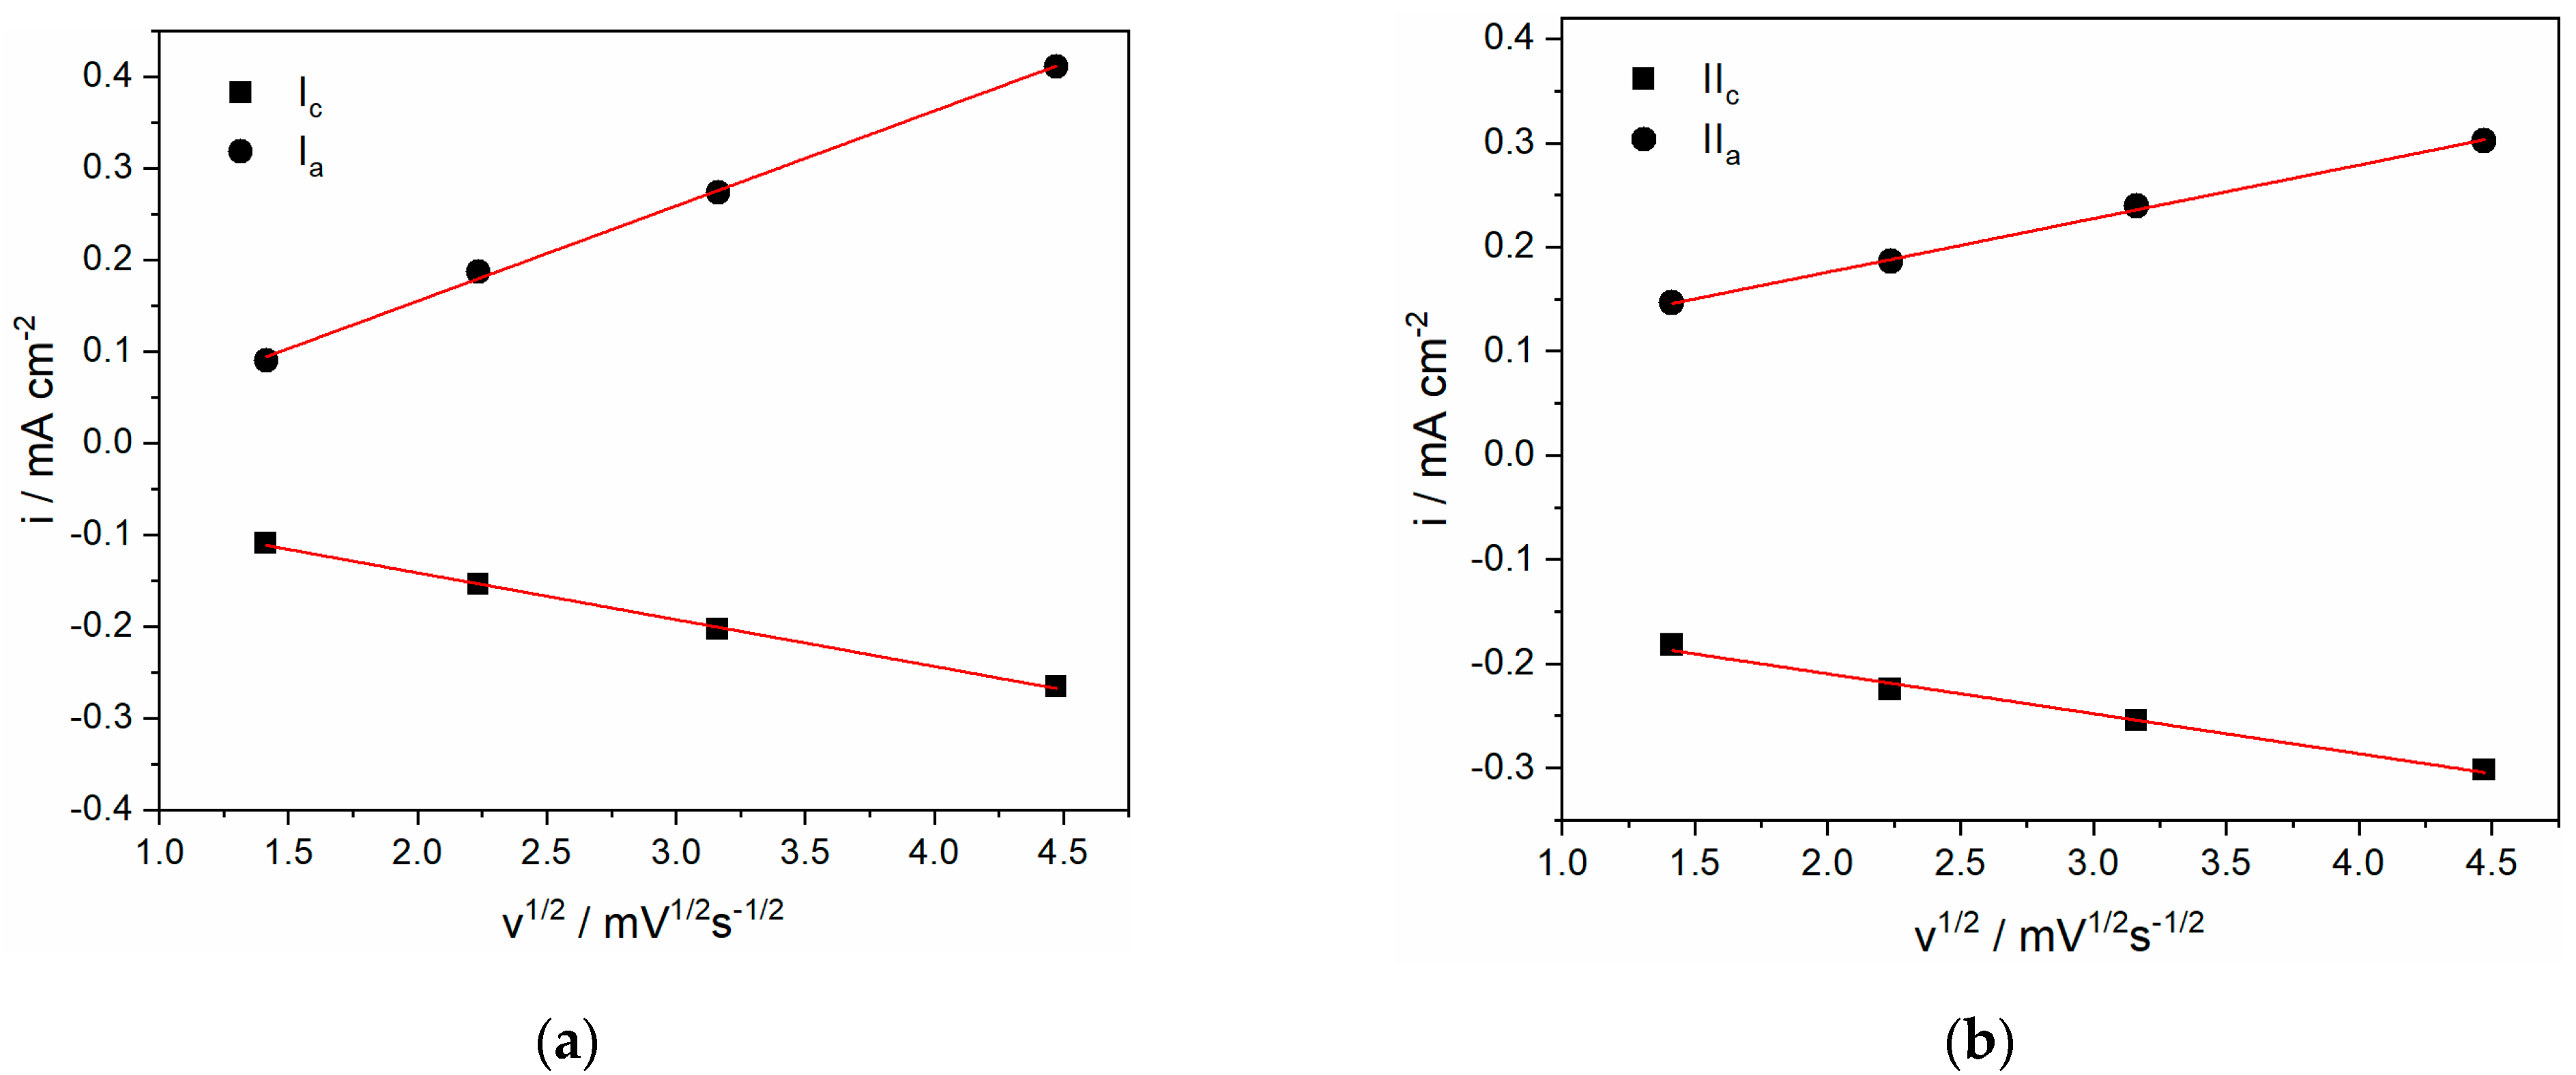
3.1. Investigation of Cu2+ Redox Processes in 0.01 M and 0.5 M Cu(II)-Ethaline Using Voltammetry Analysis

Figure 1 shows the cyclic voltammogram responses of the GC electrode in the ChCl:EG electrolyte (ethaline) with different concentrations of Cu(II) at 50 °C. The scan in the Cu(II)-ethaline electrolytes was started at potentials slightly more negative than the open circuit potential and was run to the cathodic end potential Ec and back to the starting potential. The cathodic limit of the cyclic voltammograms was gradually increased from (a) −400 mV to −700 mV vs. Cu in 0.01 M Cu(II)-ethaline and (b) –250 mV to −400 mV vs. Cu in 0.5 M Cu(II)-ethaline. The cathodic reaction at potentials of around 700 mV and 600 mV vs. Cu in 0.01 M and in 0.5 M Cu(II)-ethaline electrolyte, respectively, should be assigned to the Cu2+ → Cu+, current wave (Ic). The second redox reaction, the cathodic current wave (IIc), which was observed at more negative potentials, started at a potential of −450 mV in 0.01 M and at a potential of approximately −150 mV vs. Cu in 0.5 M Cu(II)-ethaline, which can be attributed to Cu+ → Cu(0). This indicates that electrochemical behavior of Cu(II) in Cu(II)-ethaline is characterized by the two redox couples, which is in good agreement with previously published findings [10,15,26]. During the reverse scan, the CV showed a decreasing reduction current at the beginning of the scan, which was due to the continuation of the metal overpotential deposition reaction involving nucleation, along with the growth of the copper layer. The scan continued to approximately −90 mV vs. Cu in both electrolytes. Shifting to a more positivepotential, Cu deposit dissolution immediately began, and a well-defined stripping wave was seen. Afterwards, when moving to more positive potentials during the anodic sweep, the second current wave was seen, which was assigned to the Cu+ oxidation. After determining the charge passed within the current waves representing copper deposition and copper dissolution, it was confirmed that there was a good balance between the two. The fact that a charge equilibrium exists indicates that copper deposition/dissolution are the only processes in the observed potential range, which means that the reduction current wave in the anodic sweep corresponds to copper deposition.
This behavior results from the tendency of choline (Ch+) or ethylene glycol to adsorb on the deposit during the cathodic run, thus preventing further electrodeposition of copper from the reduced Cu+. After the reversal of the sweep direction, the layer of the electrolyte components at the electrode surface is relaxed, the deposition of copper from reduced Cu+ species takes place, and cathodic peak currents are observed [15,27].
The voltammetry responses revealed that the increase in the Cu2+ concentration in the electrolyte led to a shift in the reduction potentials of the copper deposition to less negative electrode potentials. As a result, the onset of the Cu+ to Cu(0) reduction started at −450 mV vs. Cu when a concentration of 0.01 Cu(II)-ethaline was used, and at −150 mV vs. Cu when 0.5 M Cu(II)-ethaline was used. In related studies on the deposition and growth of Cu from ethaline, researchers have observed similar behavior, which is due to the different Cu+ concentration profiles near the electrode in these two solutions [14,15]. Figure 2 shows a set of experiments in which the impact of the potential scanning rate on the redox transition of copper was investigated. The CVs were recorded with scan rates gradually increasing from 2 to 20 mV/s on the GC electrode in an ethaline electrolyte with 0.01 M (Figure 2a) and 0.5 M (Figure 2b) Cu(II) concentrations at 50 °C. The scan was started at potentials slightly negative to the open circuit potential and swept to (a) –700 mV and (b) −400 mV vs. Cu for the 0.01 M and 0.5 M Cu(II)-ethaline, respectively. As seen in Figure 2, the reverse scan again shows considerable copper deposition over the potential range where copper dissolution is expected, continuing to around −90 mV vs. Cu in both electrolytes. Previous comparable experiments have investigated electrodeposition of Cu on a microdisk Pt electrode from aqueous perchloride solutions, 5 mM CuSO4 + 0.6 M HClO4 [26], and Cu electrodeposition from Cu(II)-ethaline [10,15]. A comparison of the results shown in Figure 1 and Figure 2 with similar results obtained in previous studies reveals the same electrochemical behavior of copper in this electrolyte [10,15].
The well-defined stripping peak for copper dissolution Cu(0) → Cu+ starting at a more positive potential than the potential of −90 mV vs. Cu enables investigation of the electrochemical behavior of Cu2+ and Cu+ ions in 0.01 M and 0.5 M electrolytes. The maximum current densities of the cathodic and anodic peaks, which are characterized by Cu2+/Cu+ and Cu+/Cu(0) redox pairs, increased with an increase in the scan rate. In addition, the differences between the cathodic (Ec) and anodic (Ea) peak potentials |Ec − Ea| in these systems increased significantly with increasing scan rate, indicating quasi-reversibility. Even at the lowest scan rate of 2 mV/s, the values of |Ec − Ea| (values of 89 mV in 0.01 M and 163 mV in 0.5 M Cu(II)-ethaline) for Cu2+/Cu+ were still higher than the typical values for reversible reactions [28,29].
In addition, good linear relationships between the cathodic/anodic peak current densities (Ic/Ia and IIc/IIa) and the square root of the scan rate (ν1/2), as shown in Figure 3a,b respectively, were observed, where one exemplar measurement in 0.01 M electrolyte is presented for clarity. These results suggest that the reduction processes of Cu2+ and Cu+ in ethaline electrolytes are predominantly diffusion-controlled in the 0.01 M electrolyte. However, it should be noted that the plots of Ic versus ν1/2 in the 0.01 M electrolyte do not pass through the origin, indicating that the decomplexation of the copper ions has to occur during Cu2+ → Cu+, and the Cu+ → Cu(0) reduction and cannot be neglected [13,15]. The non-zero intercept in the linear plot could be assigned partially to the significant effect of uncompensated electrolyte resistance and/or adsorption phenomena, which are often a feature of choline chloride-based electrolytes [8,15,16]. To some extent, different behavior was observed for the 0.5 M electrolyte. In this case, good linear relationships between the cathodic peak current densities (Ic/IIc) and the square root of the scan rate (ν1/2) applied were also observed, but the deviation from zero intercept was higher than for 0.01 M Cu(II)-ethaline.

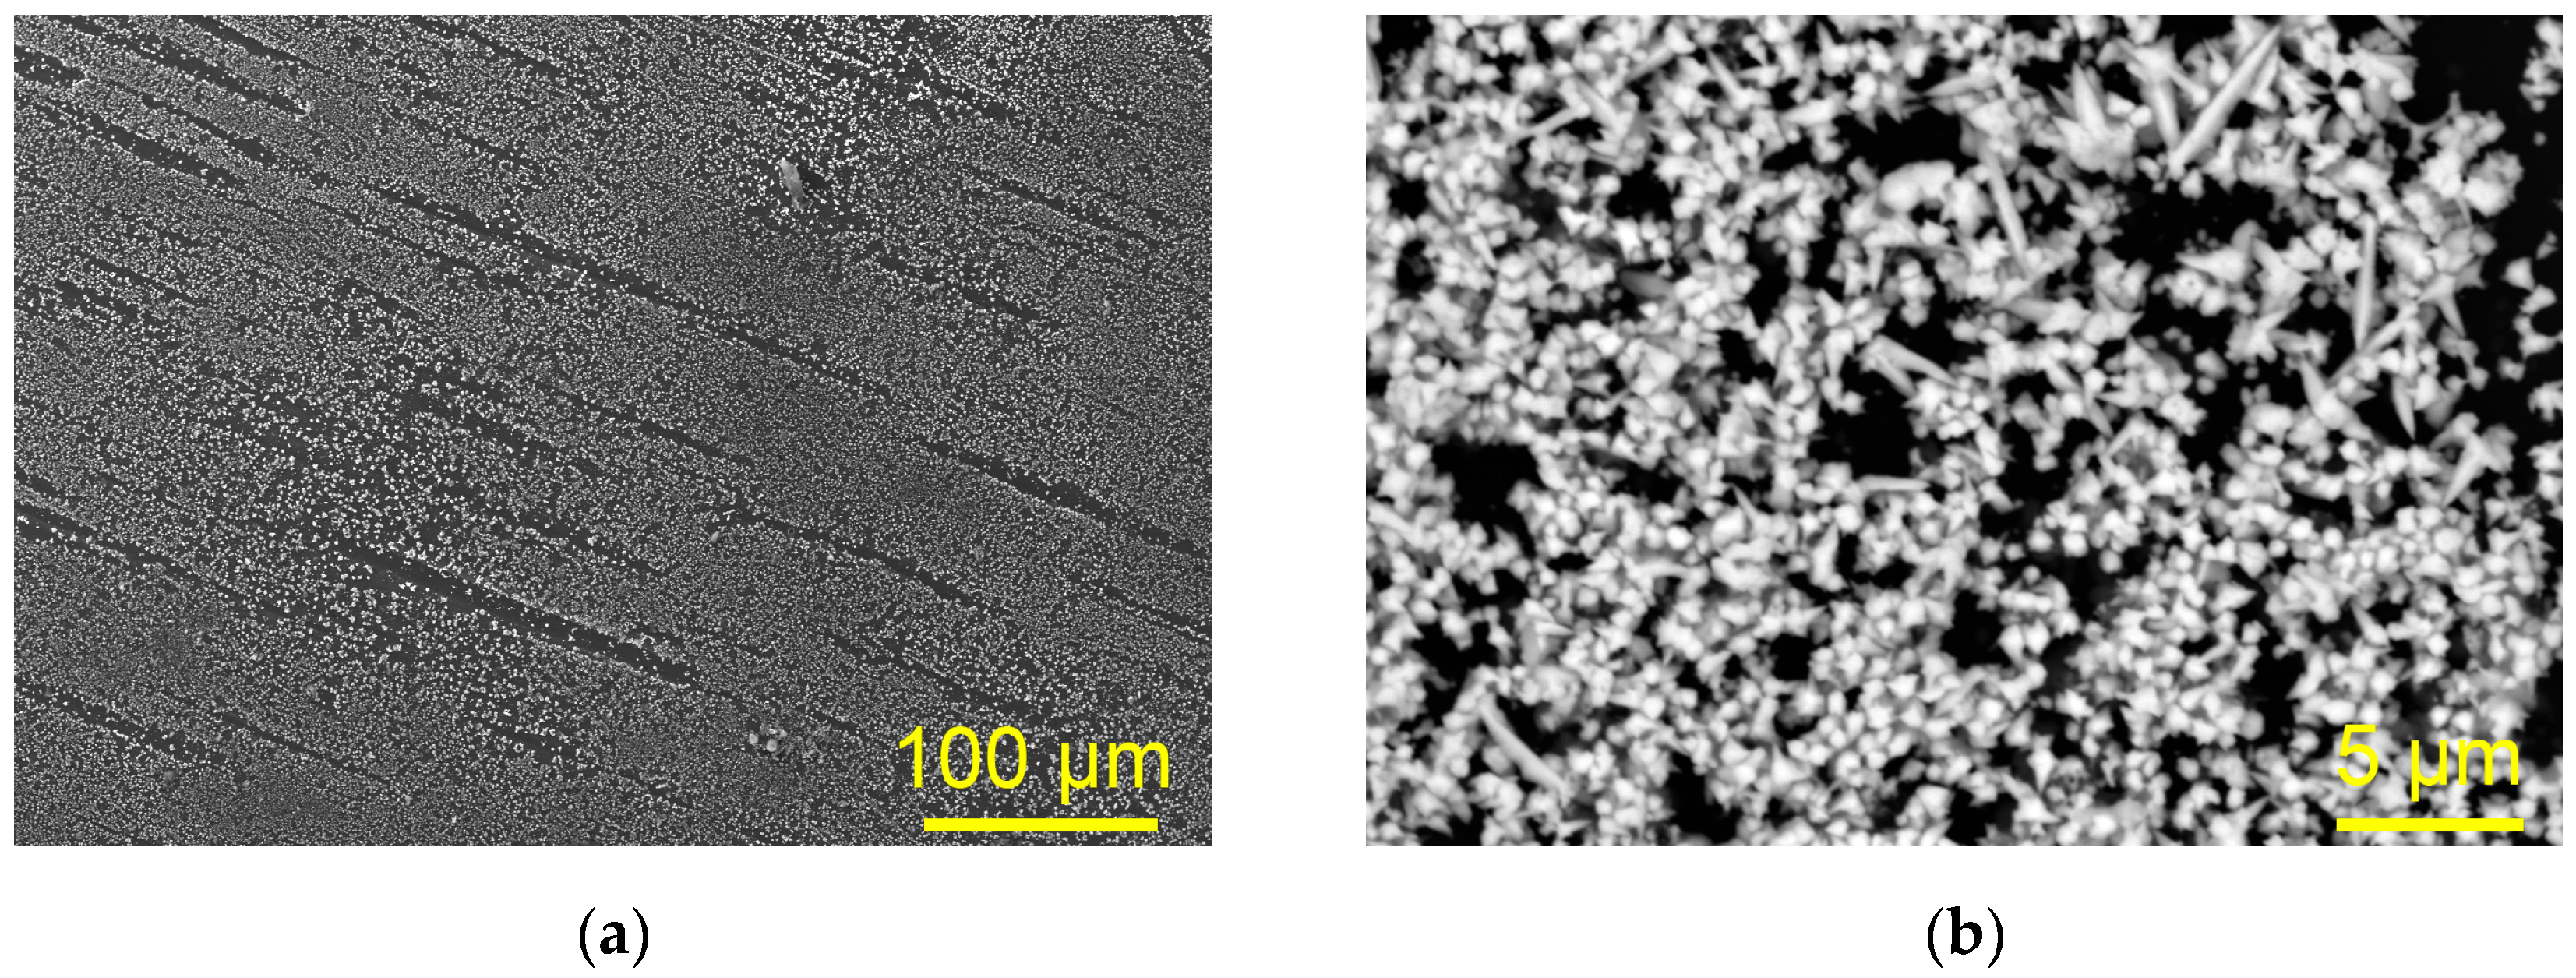
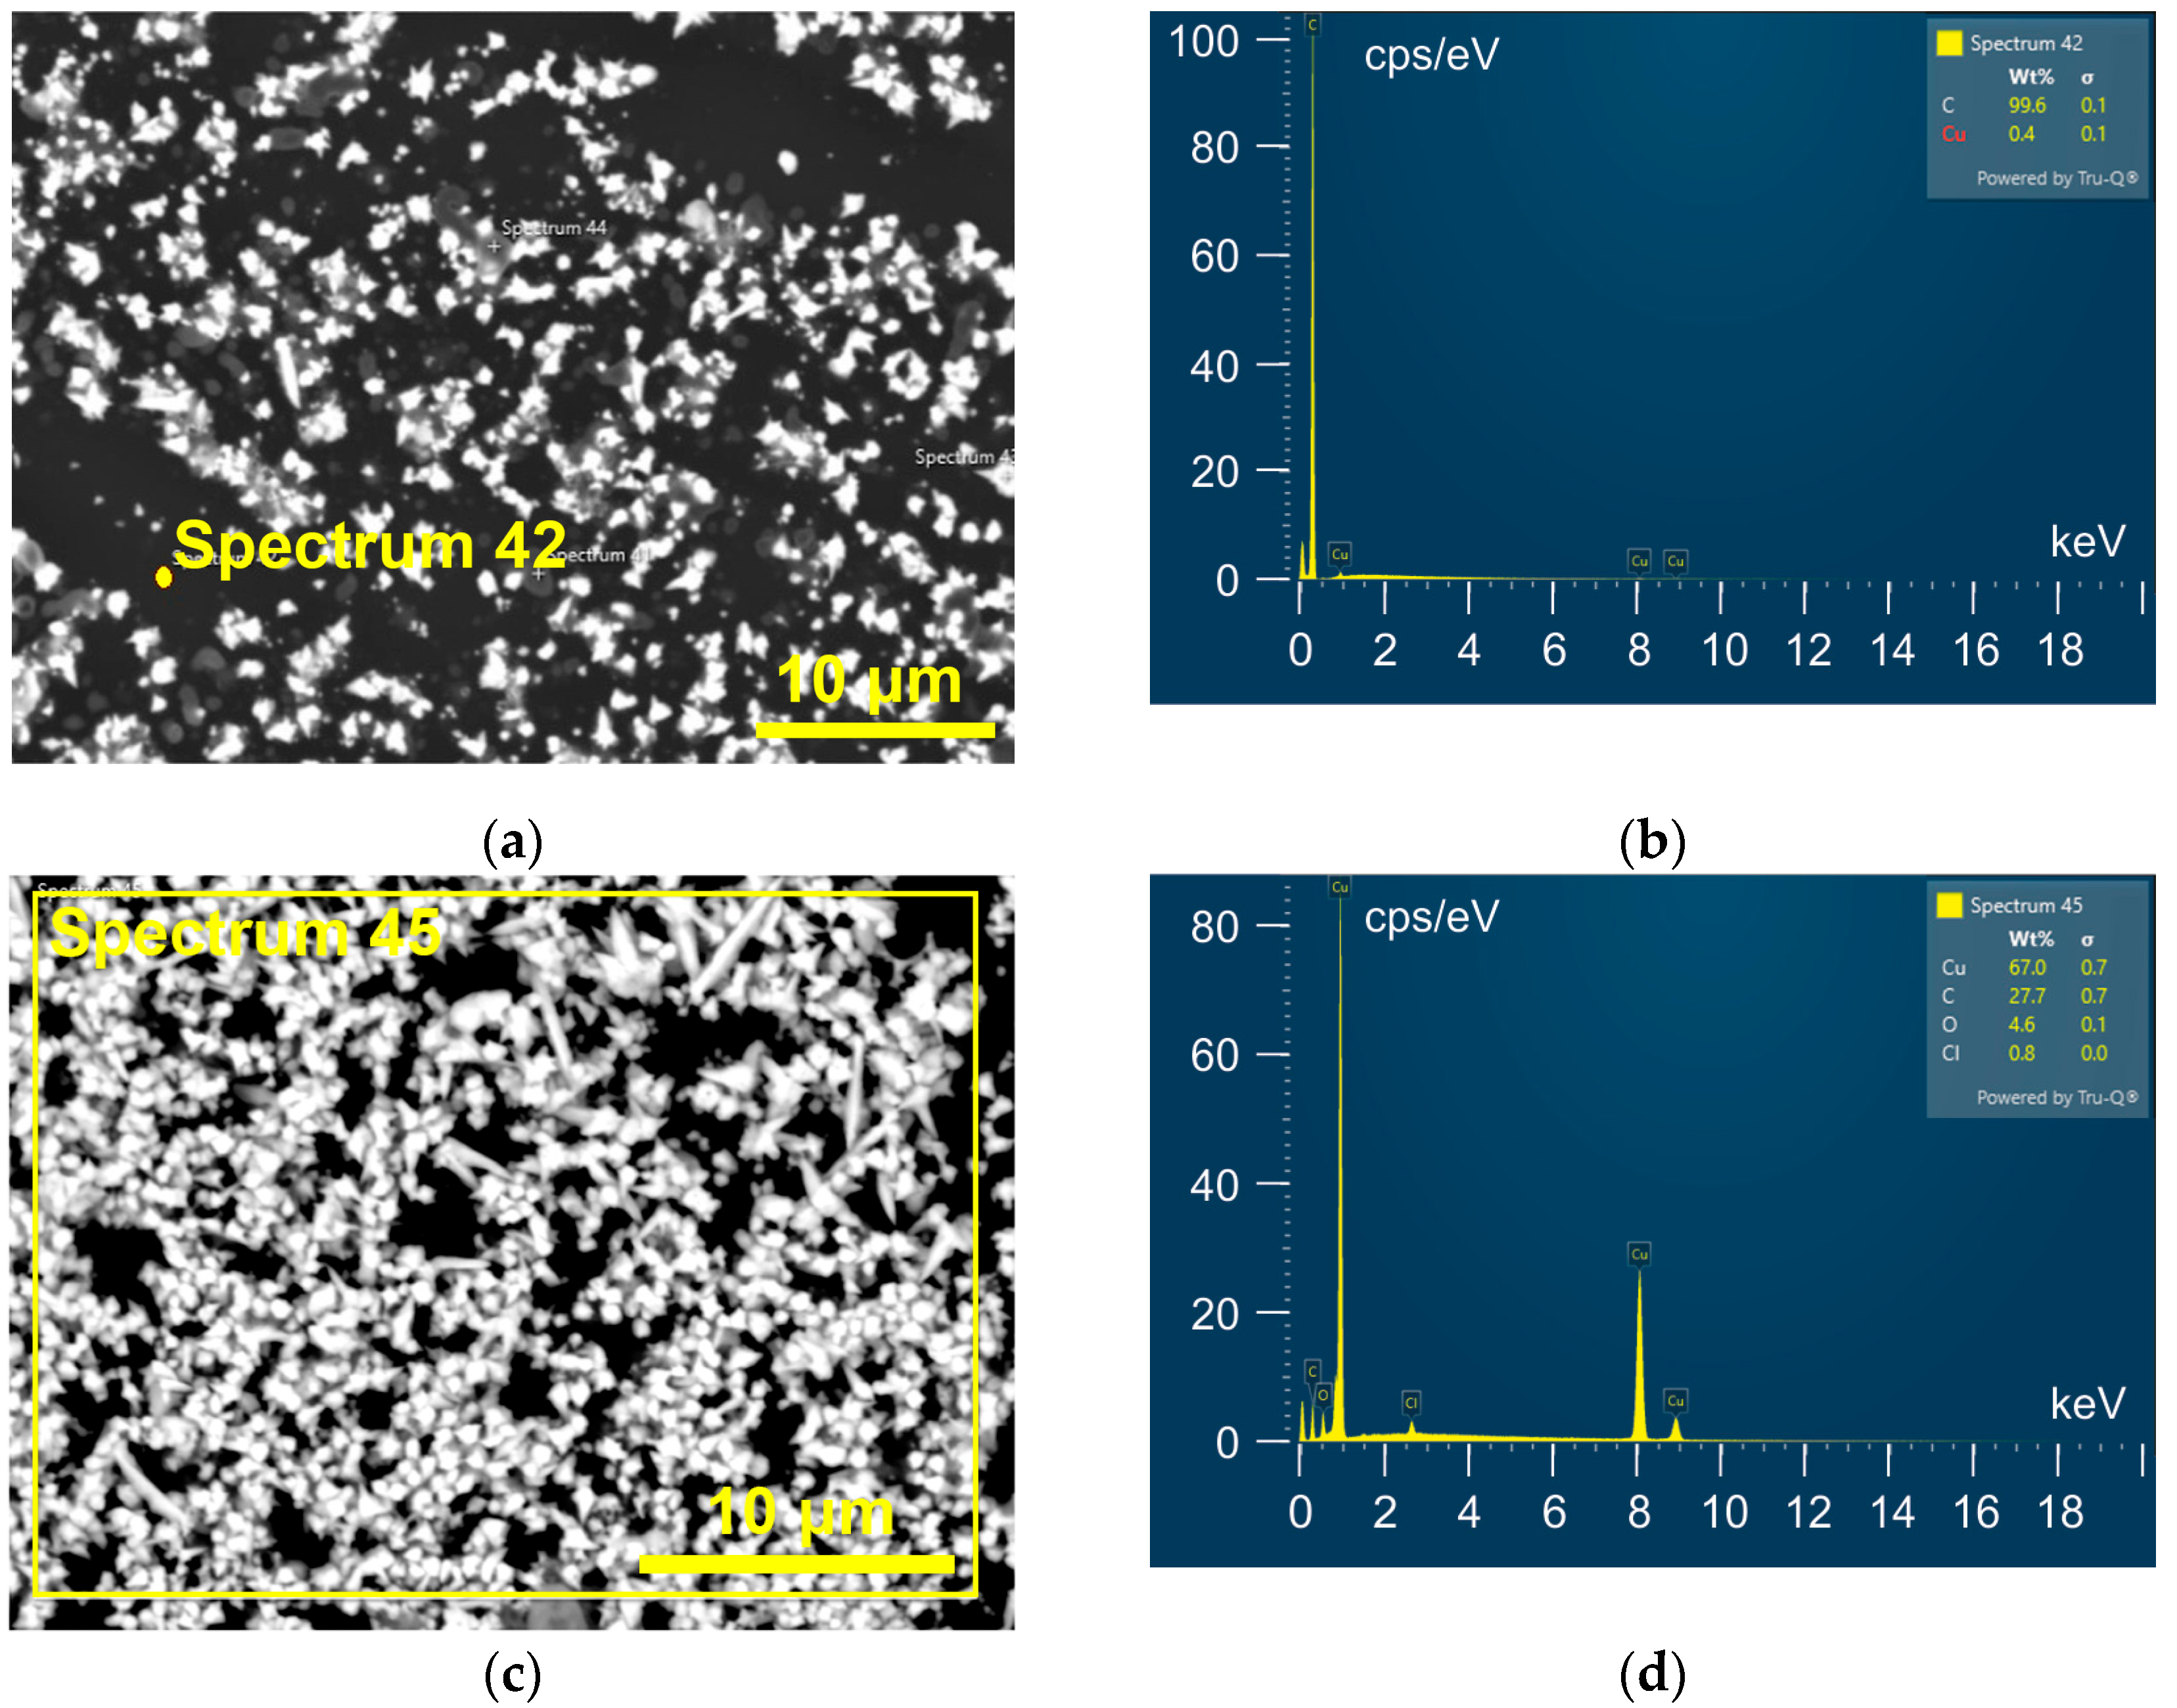
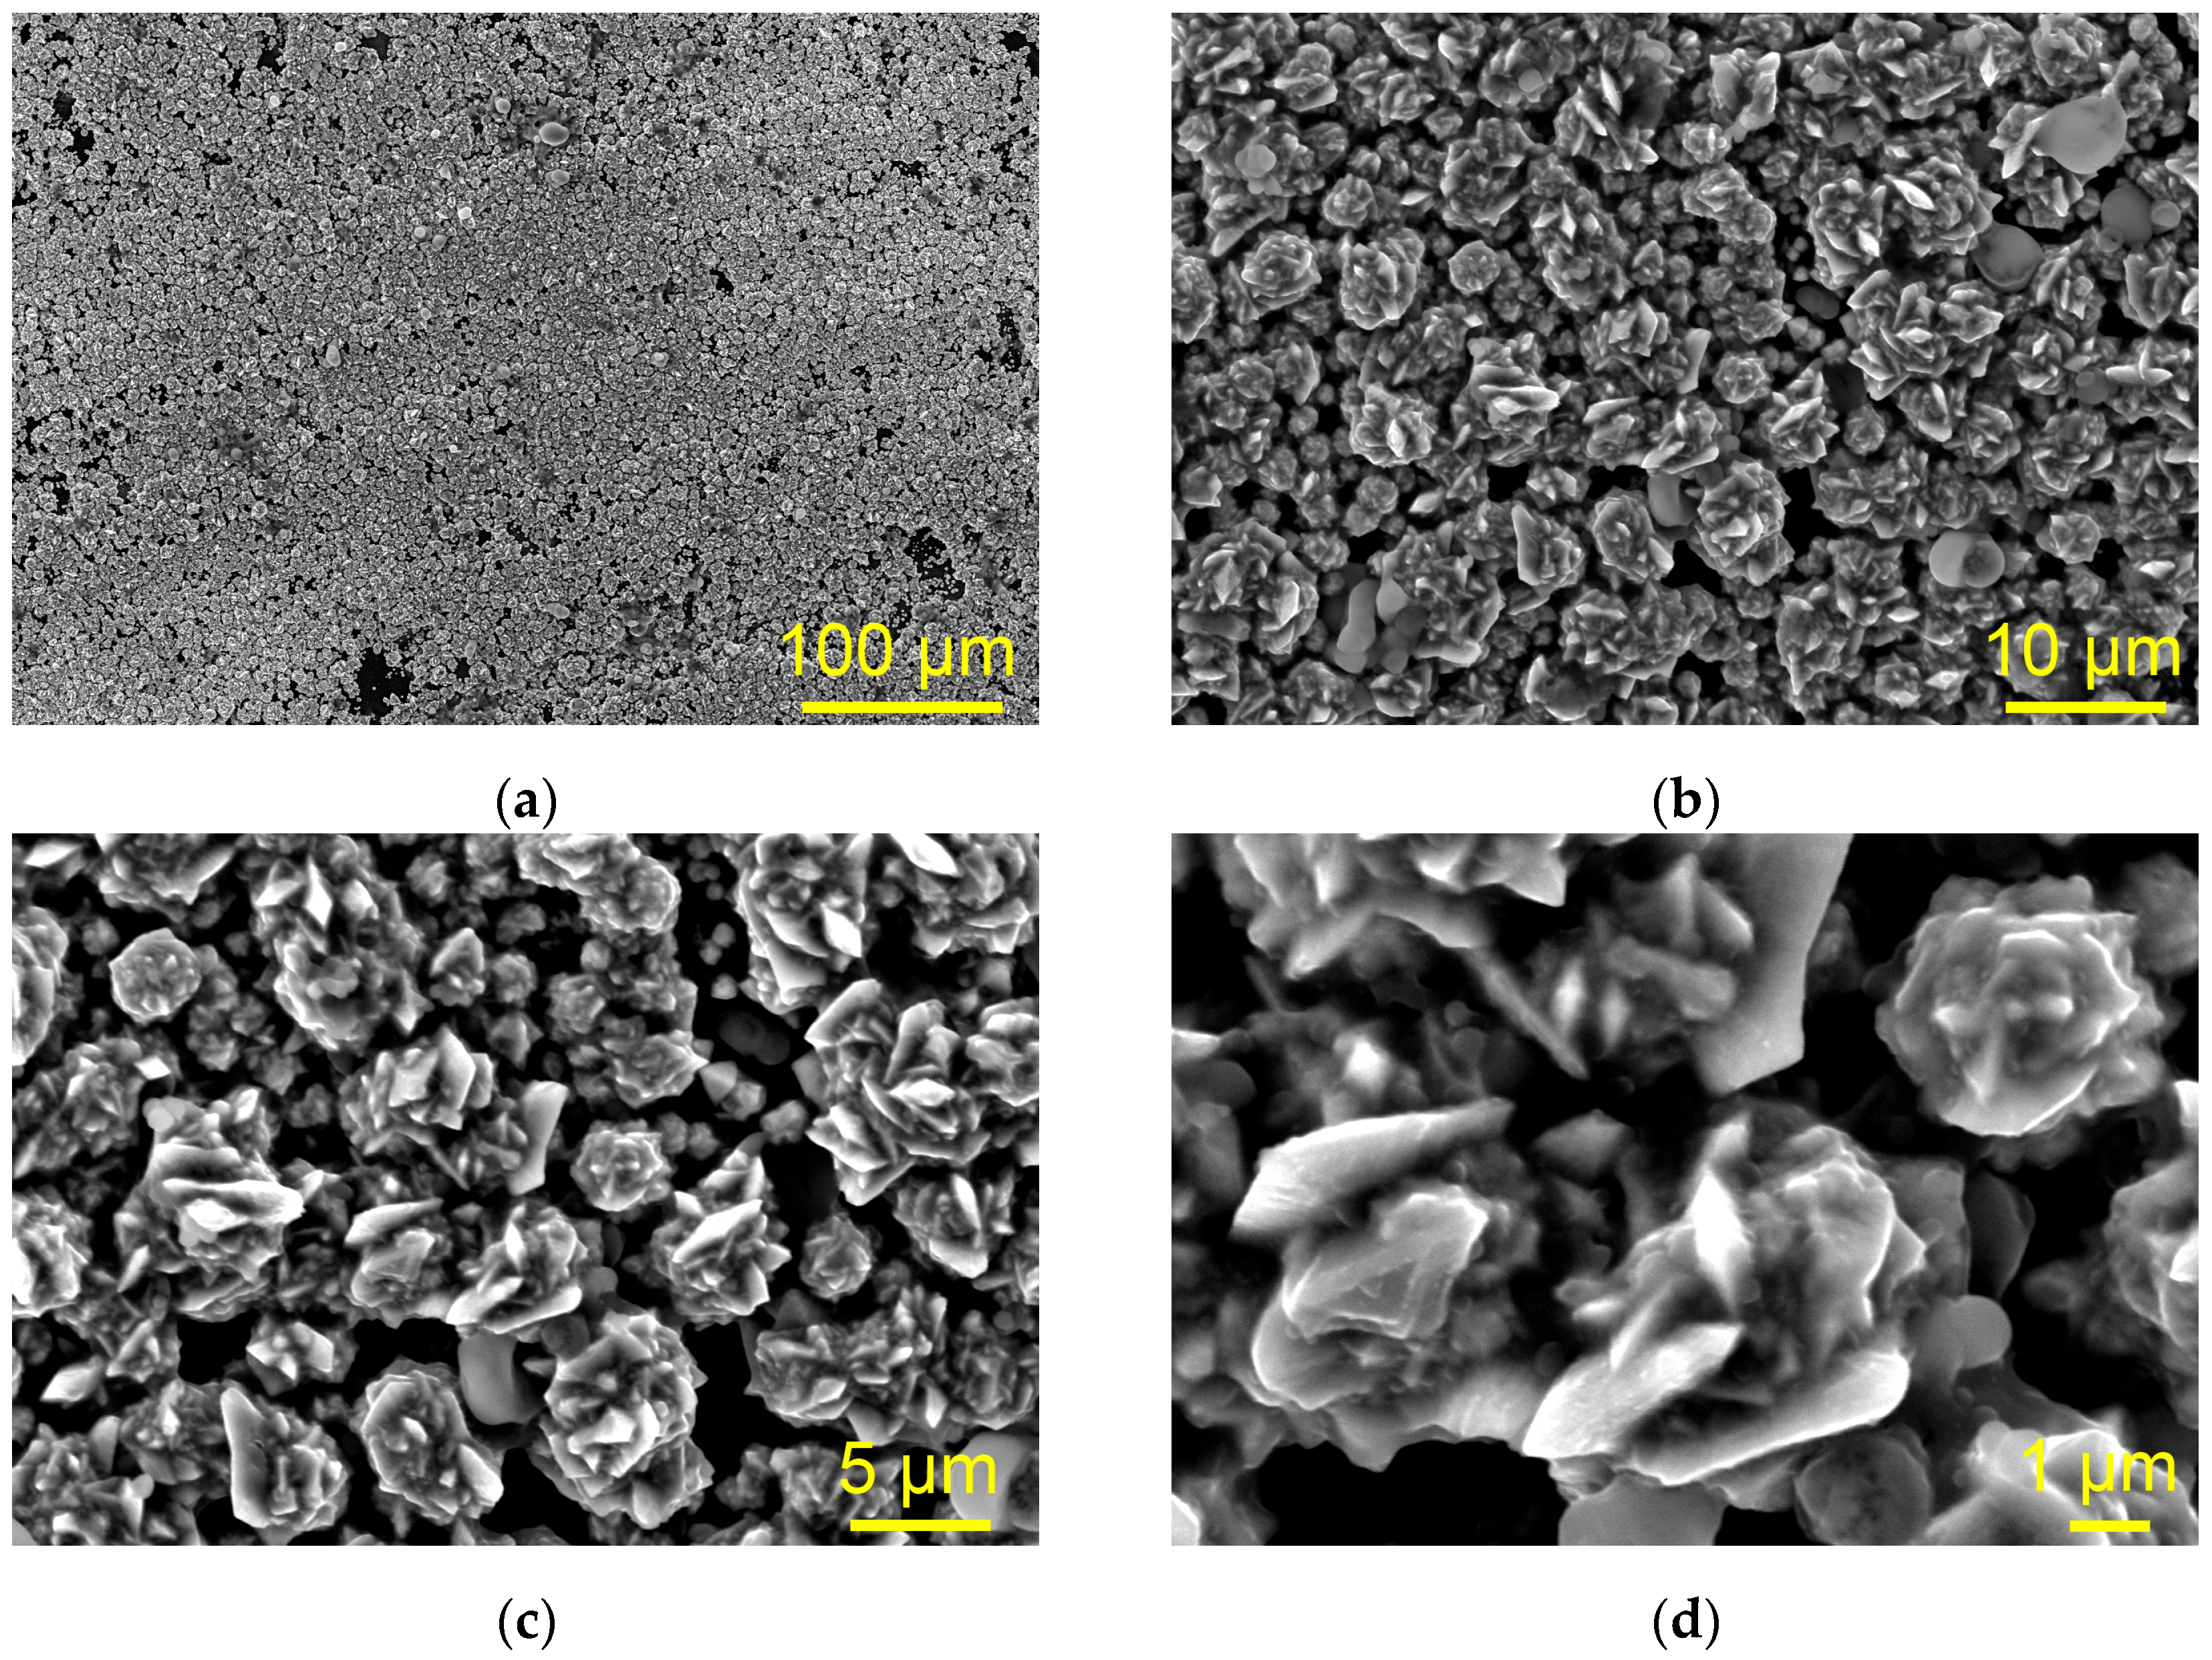
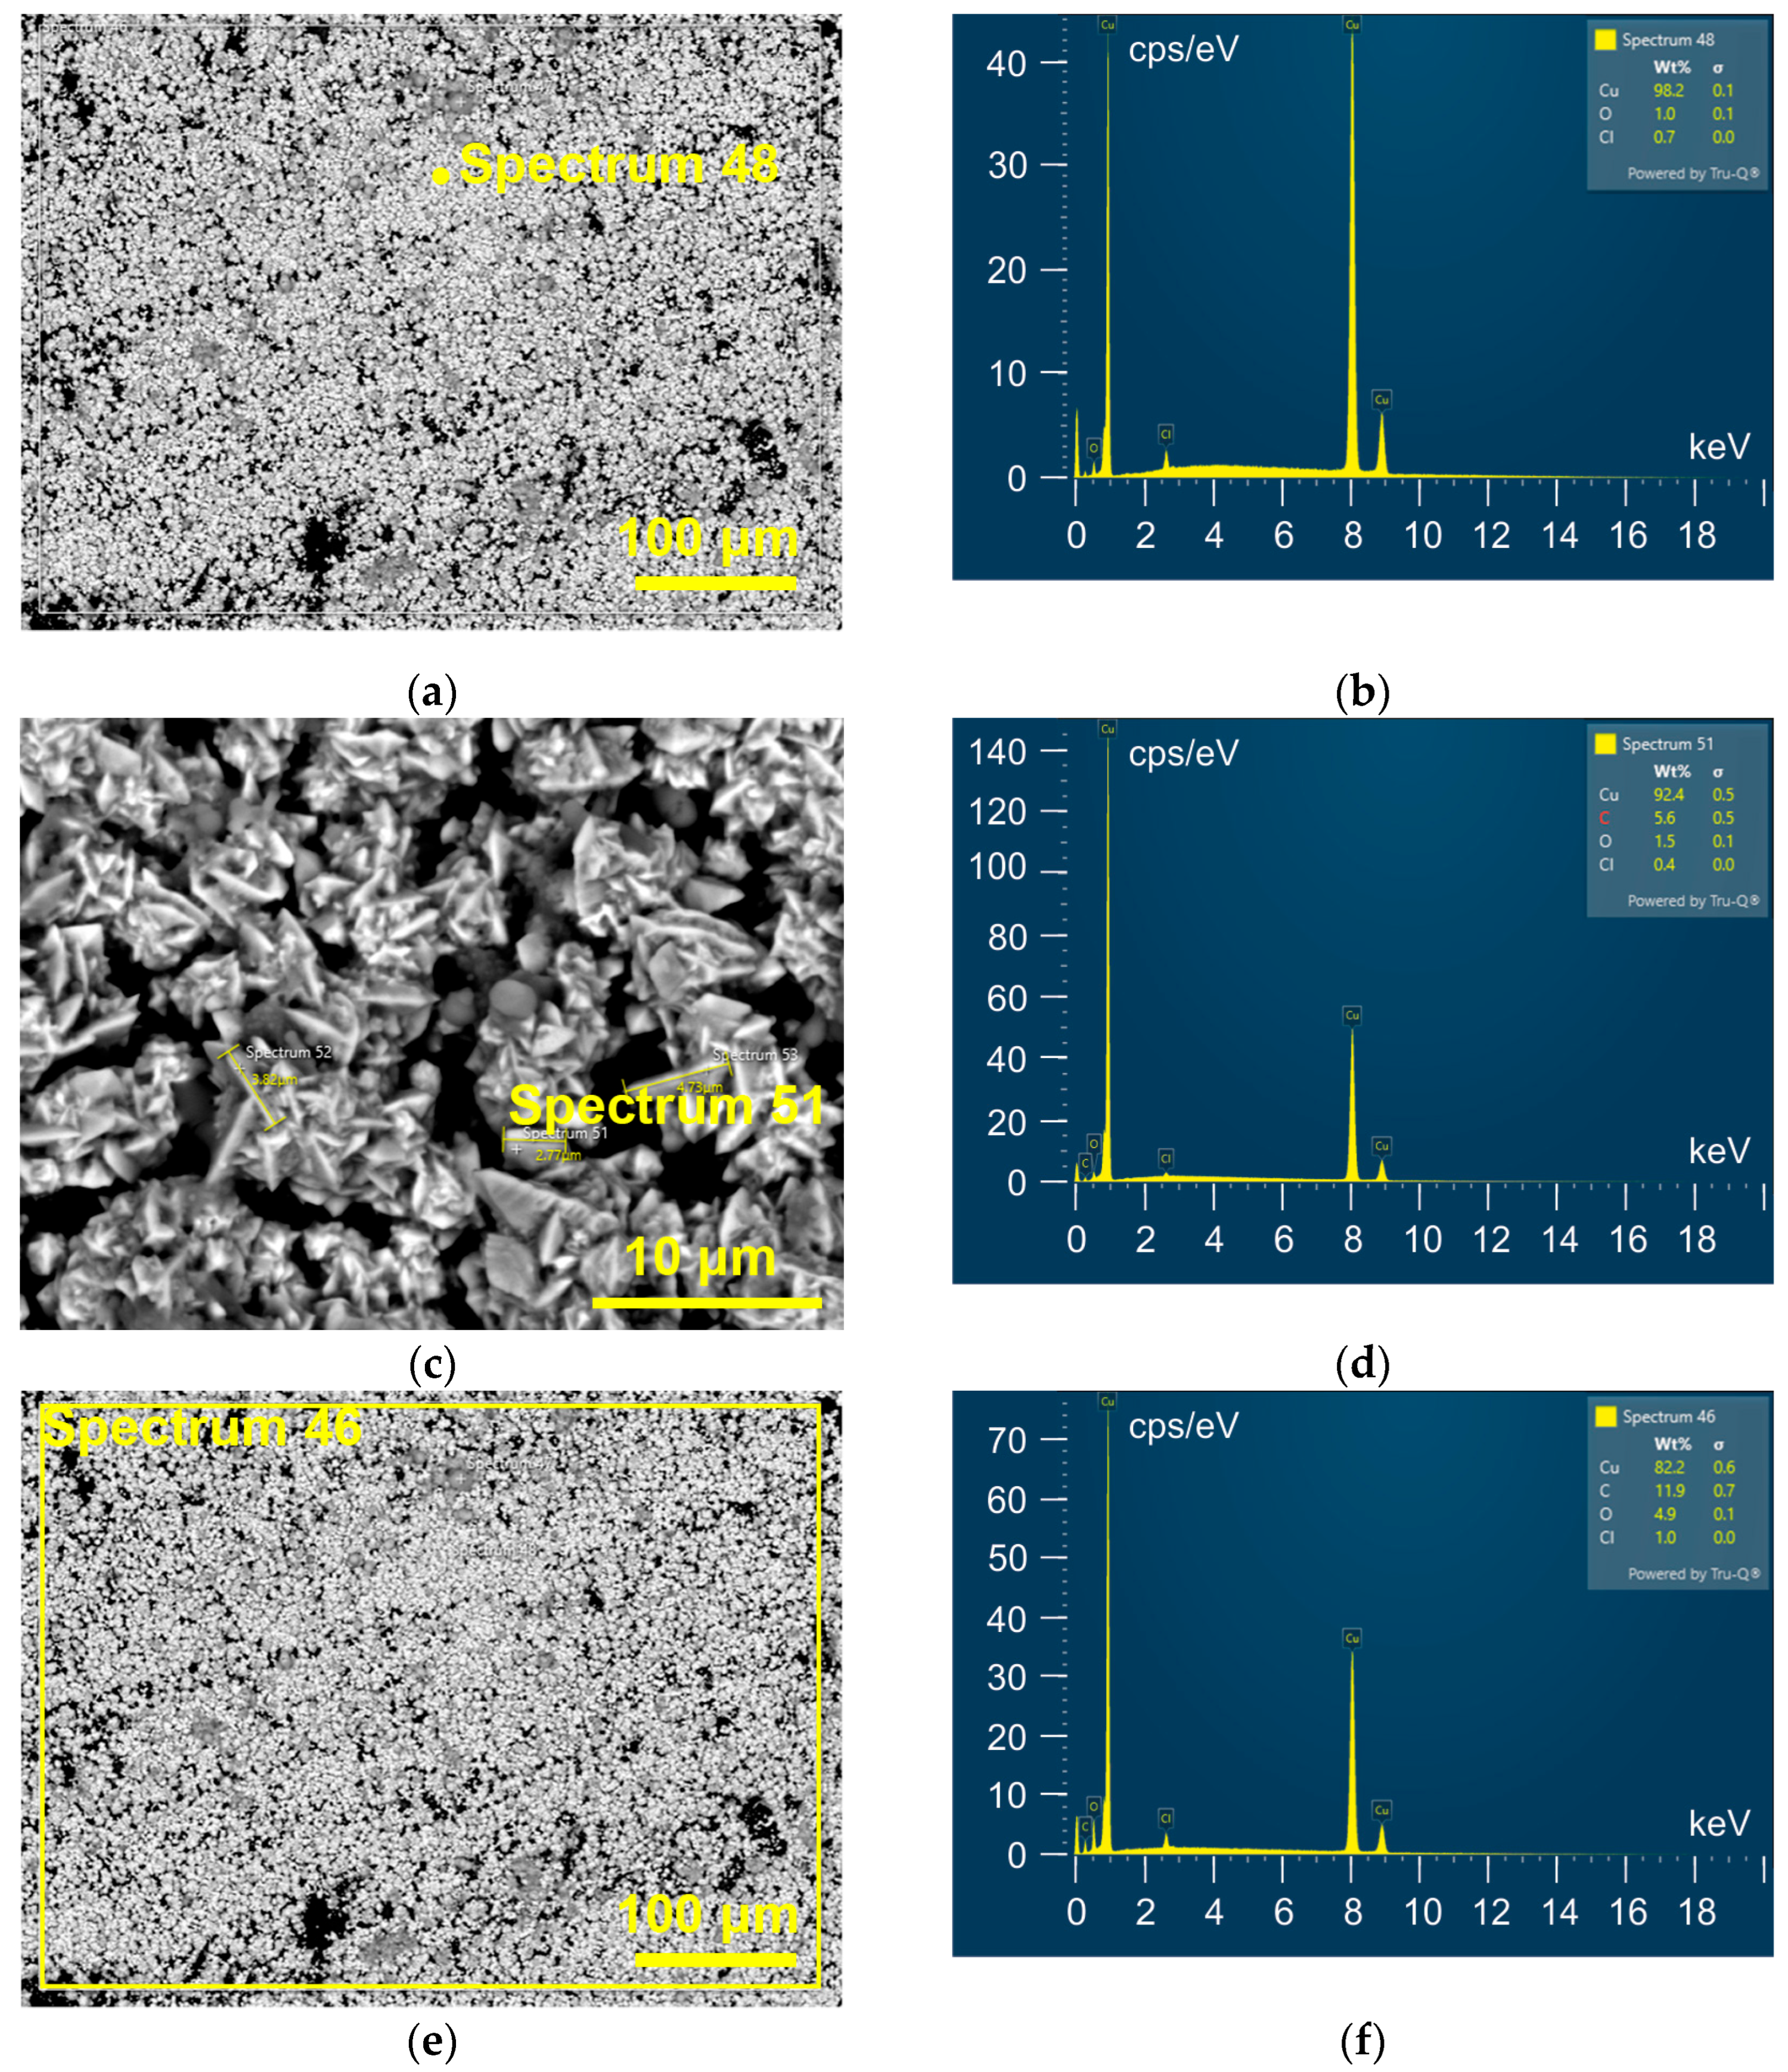
3.2. Morphological Analysis of Cu Deposits Electrodeposited from Ethaline Electrolytes

The influence of Cu(II) ion concentration in ethaline on the morphology of electrodeposited Cu was studied via SEM/EDS analysis of Cu electrodeposits obtained at cathodic potentials chosen from CVs.
Figure 4 shows SEM micrographs of the Cu deposit obtained via electrodeposition at a cathodic potential of −700 mV vs. Cu on the GC cathode from ethaline with 0.01 M Cu(II)-ethaline.
It can be seen from Figure 4a that a uniform Cu film was not formed through electrodeposition at the given potential. Analysis of the electrodeposit at higher magnification (Figure 4b) showed that relatively irregular Cu grains, sized up to 1 μm, were dominantly formed by the electrodeposition from this electrolyte. Carrot-like or the needle-like dendrites with lengths of up to 5 μm were also formed, but to a lesser extent than the grains.
EDS analysis of this Cu electrodeposit (Figure 5a,b) confirmed that a uniform thin film of Cu was not formed since the black parts belonged to the GC substrate. Elemental mapping of the whole surface (Figure 5c,d) showed the dominant presence of copper, but in addition to carbon, oxygen was also detected.
The morphology of the Cu deposit obtained at a cathodic potential of −400 mV vs. Cu on the GC electrode from ethaline with a high concentration of Cu(II) ions of 0.5 M is shown in Figure 6.
At first glance, it is noted that similar to the electrodeposit obtained from 0.01 M Cu(II)-ethaline, the uniform Cu film was also not formed on the GC electrode through the electrodeposition from 0.5 M Cu(II)-ethaline (Figure 6a). However, analysis of this surface morphology at higher magnifications showed that it differed significantly from that obtained from 0.01 M Cu(II)-ethaline. Rose-shaped morphologies (Figure 6b–d) constructed from various irregular elements were formed from this electrolyte. The size of the rose-like forms was up to 5 μm, as estimated from the presented SEM micrographs. It is interesting to note that the nucleation exclusion zones are formed around the rose-like forms, confirming that the GC electrode is an inert substrate relative to Cu electrodeposition. Formation of these zones will be explained later in the Discussion section.
These rose-shaped morphologies were mainly composed of Cu, as indicated by EDS analysis of the Cu electrodeposit (Figure 7a,b). The presence of other elements, such as O and Cl, was insufficient to be a significant contributor to the composition of the rose-like forms. This was confirmed by analysis of a rose-shaped particle itself (Figure 7c,d). Elemental mapping of the whole surface (Figure 7e,f) identified the presence of Cu, O, C, and a small amount of Cl. It is necessary to note that Cu was dominant relative to the other elements.

3.3. Structural Analysis of Cu Deposit Electrodeposited from Ethaline
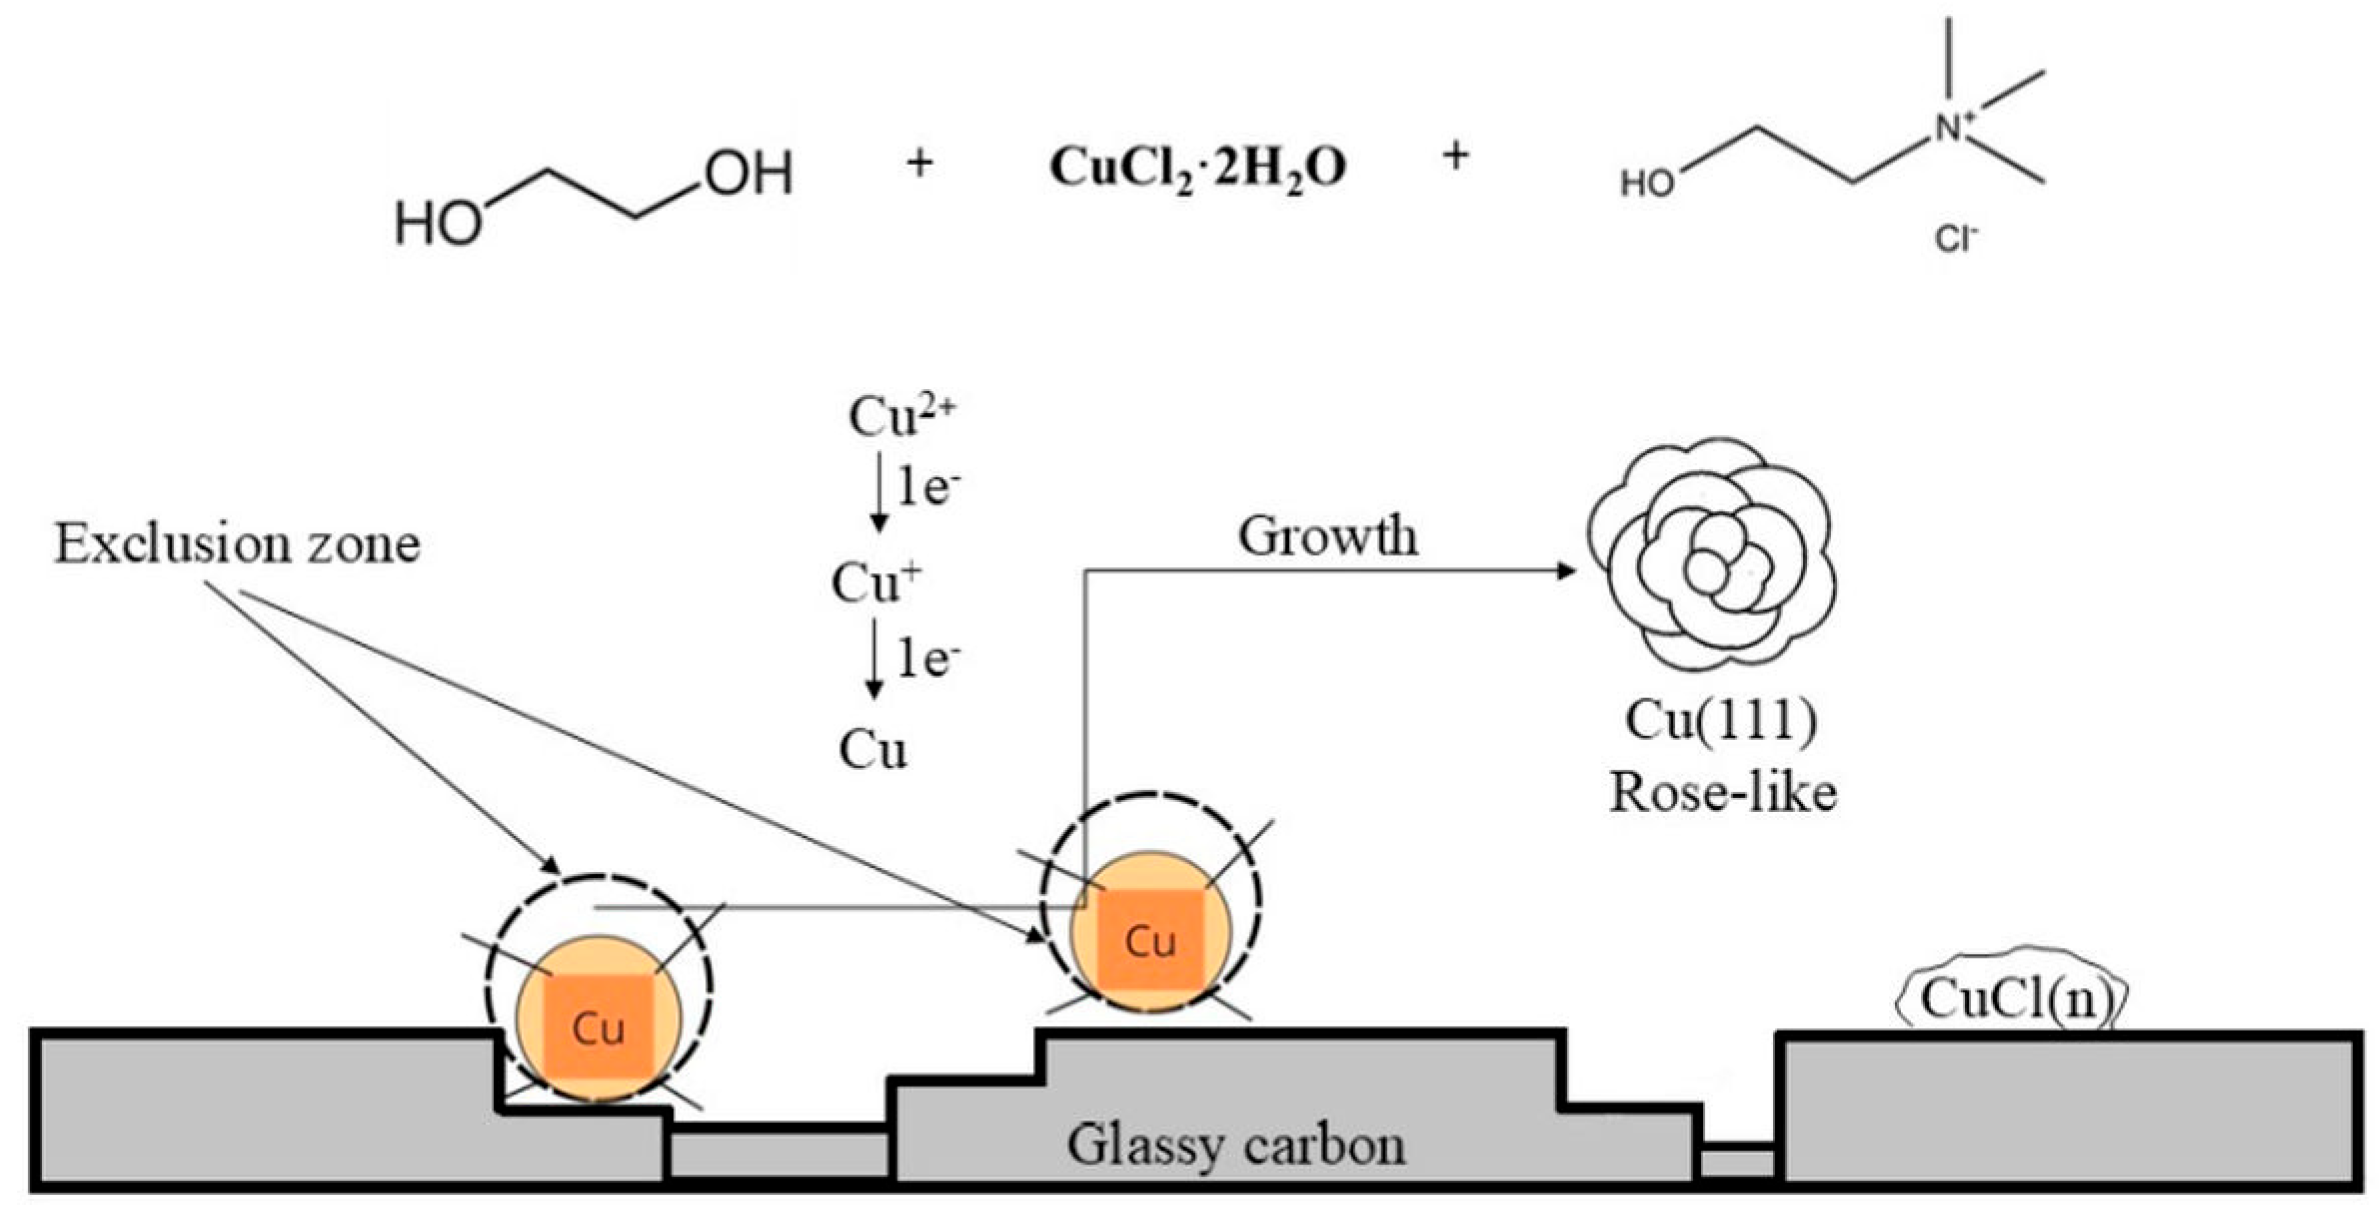
Further insight into the structure of the electrolytically produced Cu was obtained via XRD analysis of the rose-like forms removed from the GC electrode after the completed electrodeposition process. Figure 8 shows the diffractogram of the rose-shaped particles obtained via the electrodeposition at a cathodic potential of −400 mV vs. Cu from 0.5 M Cu(II)-ethaline.
Diffraction peaks of different intensities were obtained at 2θ angles of 43.3°, 50.4°, and 74.1° and belonged to the face-centered cubic (FCC) lattice of Cu and the (111), (200), and (220) crystal planes, respectively. It can be clearly seen from the presented diffractogram that the Cu crystallites were predominately oriented in the (111) crystal plane. The rose-like forms can be classified into a group of irregular (or disperse) forms, and as such, they have a predisposition to develop a preferred orientation. In order to identify it, a semi-quantitative methodology based on the determination of “Texture Coefficients”, TC(hkl), and “Relative Texture Coefficients”, RTC(hkl), was applied [22,30]. The calculation of these coefficients and the methodology of their determination is given in the Supplementary Materials. TC(hkl) values larger than 1 reflect the existence of the preferred orientation, while the RTC(hkl) values are dependent on the number of recorded diffraction peaks [22]. In this study, the (111), (200), and (220) diffraction peaks are situated in the examined 2θ range between 30° and 80°; hence, RTC(hkl) values larger than 33.33% reflect the existence of the preferred orientation.
Applying this procedure, TC(hkl) values of 1.1, 0.83, and 0.79 were obtained for the (111), (200), and (220) crystal planes, respectively. Simultaneously, calculation of RTC(hkl) coefficients gave values of 40.4%, 30.5%, and 29.9% for the (111), (200), and (220) crystal planes, respectively. Hence, based on the performed analysis, it follows that the rose-shaped particles showed a weak (111) preferred orientation.
The preferred orientation of the rose-shaped morphologies was also determined by applying an alternative method based on a comparison of the peak intensity ratios, where the peak intensity ratios are made determined to the peak with the maximum intensity [31]. Thus, the obtained peak intensity ratios are compared with those for the standard, and a deviation of the obtained values from those predicting the standard indicates the existence of a preferred orientation in the determined crystal plane. If the peak intensity ratios are larger than those predicting the standard, then there is a preferred orientation in the crystal plane with the maximum intensity. On the contrary, if the peak intensity ratios are smaller than those for the standard, then there is a preferred orientation in the crystal plane with a smaller intensity of the diffraction peak. Finally, if the peak intensity ratios are mutually comparable, then the deposit (or particles) is randomly oriented.
The values of the peak intensity ratios for the rose-shaped particles and Cu standard (JCPDS No. 04-0836) calculated in this way are given in Table 1.
It can be seen from Table 1 that the values of the ratios obtained for the rose-shaped particles were 35% and 42% larger than those predicting the Cu standard (04-0836); therefore, the (111) preferred orientation of this particle type was confirmed. Certainly, good agreement between these two methods should provide a solid basis for the determination of the preferred orientation of the rose-shaped particles. It is necessary to note that the small peak was also observed at a 2θ angle of 36.4° (Figure 8). This reflection belonged to the (111) crystal plane of Cu2O (JCPDS No. 65-3288) [19,21], and the other reflections of this oxide were not detected in this particle type.

4. Discussion

Voltammetric studies on the GC electrode from Cu(II)-ethaline have revealed that the electrochemical deposition of Cu occurs via two reduction steps, in which Cu2+ ions are first reduced to an intermediate Cu+ species, followed by the reduction of Cu+ to Cu metal. The CV shows that a reduction current peak can be observed at the beginning of the reverse scan. This is the result of the continuation of the metal overpotential deposition reaction, which involves nucleation along with the growth of the copper layer, and continues in both electrolytes, 0.01 M and 0.5 M, to about −90 mV vs. Cu. The comparison between CVs obtained from Cu(II)-ethaline containing different Cu(II) concentrations (Figure 1a,b) shows that the reduction potential of the copper deposition in 0.5 M Cu(II)-ethaline exhibits a shift toward less negative electrode potentials. This is attributed to the fact that Cu+ and Cu2+ form a complex with Cl in ethaline (1:2 molar ratio), with the tetrahedral tetrachlorocuprate-(II) [CuCl4]2− complex predominating for Cu2+ ions, while [CuCl2] is the predominant form of Cu(I) [4,14,32]. With increasing concentrations of Cu2+ in the electrolyte, the copper ions form higher coordinated CuCln complexes [7,14]. The electroactive species are carried out via diffusion; the depletion of the Cun+ complexes in electrolytes with a lower copper (II) concentration (0.01 M) near the electrode surface is likely due to the choline cation adsorbed on the surface [14]. Consequently, more energy is required for the blocking layers to be relaxed from the electrode surface [14]. The net result is that the presence of CuCln complexes in the electrolyte with a higher Cu(II) concentration shifts the onset potential for Cu+ → Cu(0) electroreduction toward more positive potentials.
According to the CV results, the potential peak difference |Ec − Ea| in these systems increases significantly with increasing scan rate. This indicates Cu redox processes; Cu2+ → Cu+ and Cu+ → Cu(0) are quasi-reversibile in Cu(II)-ethaline. For the quasi-reversible redox reaction under consideration, the shift in cathodic peak potential (Ep) depends on the applied scan rate (ν). With a 10-fold increase in the applied scan rate, the cathodic peak potential shift is smaller than the value predicted by Equation (1) [33]:
(Ep) < 1.15RT/αnF (mV)
where R is the ideal gas constant (J mol−1 K−1), T is the reaction temperature (K), α is the charge transfer coefficient, n is the number of electrons involved in the charge transfer reaction, and F is the Faraday constant (C mol−1) [33]. The number of exchange electrons in both redox transitions is one [15], and the value of the charge transfer coefficient α of ~0.5 is relatively unchanged in ethaline-containing Cu(II) ions. Substituting n = 1 and α = 0.5 into Equation (1), the values of Ep for both redox transitions should be smaller than 64 mV. In our case, this shift (Ep) is around 20 mV, confirming a quasi-reversible system.
Depending on the concentration of Cu(II) ions, the following types of irregular shapes were produced via electrodeposition from ethaline electrolytes: (I) relatively irregular grains, needle-like or carrot-like dendrites from the diluted electrolyte (0.01 M Cu(II) ions), and (II) rose-shaped forms from the concentrated electrolyte (0.5 M Cu(II) ions). Although the appearance of needle-like or carrot-like forms, referred to as dendrites, has been already reported in the literature [8,28], to the best of our knowledge, this is the first report of this rose-shaped morphology.
The XRD analysis confirmed that the rose-like structures belong to a group of irregular (disperse) forms, as shown in Figure 8. The rose-shaped particles developed a weak (111) preferred orientation; this is understandable because elements of this particles type were compact without the identification of individual grains within them. It is well known that XRD standards are established for randomly distributed grains; therefore, the particles constructed from the individual grains are randomly oriented [31]. The random orientation of particles of Cu in cauliflower-like and pine-like shapes electrolytically grown from aqueous electrolytes was recently confirmed [22]. The approximately spherical grains were the basic constitutive element upon which these particles were constructed. On the other hand, compact disperse forms, such as needle-like and fern-like dendrites constructed from a trunk and branches, develop the preferred orientation in the (111) crystal plane, which is the crystal plane with the lowest surface energy for the FCC-type crystal lattice [22].
The formation of the nucleation exclusion zones around the rose-shaped structures can be explained byphenomena of metal electrocrystallization on an inert substrate, as follows [23]: the process of electrodeposition on an inert substrate commences with the formation of individual nuclei or growth centers on the electrode surface, and depending on the electrodeposition conditions, the final surface morphology is formed from them in the growth process. The formation of nuclei occurs on the energetically most favorable places on an inert substrate, such as irregularities formed during the preparation of the substrate for electrodeposition. Every formed nucleus causes local deformation of an electric field around its surface, causing an ohmic potential drop along the direction of the nucleus–counter electrode (anode). Due to a deviation in the current lines around the initially formed nucleus, i.e., accumulation of current lines on the surface of a growing nucleus, new nucleation is possible only outside a spatial zone formed around the nucleus. As such, nucleation exclusion zones are formed around the nucleus.
The overpotential of nucleation represents a sum of crystallization, ηcr and charge transfer, ηct overpotentials. The relationship between crystallization overpotential and radius of zone of nucleation exclusion, rnez is defined by Equation (2) [23]:
r n e z = r n 2 η c r r n ρ i + 1 1
where rn is the radius of the nucleus, ρ is the specific ohmic resistivity of the electrolyte, and i is the current density. The crystallization overpotential depends on the exchange current density, i0, and it decreases quickly with a rising i/i0 values [23]. Hence, when i0 → 0, it follows that rnez → 0. Considering the typical i0 values for copper in the range (0.011–0.032) A dm−2 [22], it can be said that i0 → 0, and hence, rnez → 0. This was confirmed through the morphological analysis of the Cu electrodeposit obtained with 0.5 M Cu(II) ions shown in Figure 6, which illustrates that the nucleation exclusion zones formed around the rose-shaped structures are relatively small.
The electrodeposition process consists of nucleation and growth. The final morphology of the electrodeposited metal is determined in a growth process, and it is dependent of the type of electrodeposition control. It is clear that the morphologies of the Cu deposits obtained with concentrations of Cu(II) ions of 0.01 M and 0.5 M more likely indicate the influence of diffusion control on their formation. Nuclei formed in the initial stage of electrodeposition represent microelectrodes situated deep inside the diffusion layer of the macroelectrode. The spherical diffusion fields are formed around initially formed nuclei, causing faster growth of their tips than other parts of the surface [23]. As a final result of the growth process, different disperse (irregular) forms, such as the needle-like or the carrot-like dendrites (Figure 4) and the rose-like forms (Figure 6), are formed as the final surface morphologies. The electrochemical reduction of Cu(II) ions in ethaline and the morphology of the Cu deposit considered in this study are summarized in Figure 9.
Similar, but not identical, morphological forms to the rose-shaped structures have been reported in the literature [19,20]. These were obtained via electrodeposition from DESs based on N-methylacetamide(NMA) and lithium salt LiX imide (X = bis [(trifluoromethyl) sulphonyl] imide (TFSI) and nitrate (NO3)), denoted as (LiNO3/NMA) on Al substrate [20], and from aqueous acetate electrolyte on Ti substrate [19]. The dominant presence of Cu with a small peak belonging to O (very similar to our case) was found in the forms electrodeposited from the (LiNO3/NMA) DES. The XRD analysis of this electrodeposit detected only peaks of Cu, and no oxides. On the other hand, the XRD analysis of the similar rose shapes obtained from the acetate electrolyte showed a mixture of peaks belonging to both Cu and Cu2O, indicating that there is co-deposition between Cu and Cu2O [19]. In this case, Cu spheres similar to the rose-shaped forms were randomly distributed on the top of the Cu2O film.
Irrespective of the physical similarities of the rose-shaped particles obtained in this study with those found in the literature, this particle form was produced for the first time from ChCl:EG DES, and the mechanism of its formation was explained in detail.

5. Conclusions

The electrochemical reduction of Cu(II) to Cu(0) from ethaline takes place in two consecutive steps, where Cu(II) is first reduced to Cu(I). The experimental results revealed a reduction peak at the beginning of the reverse scan. This implies that the choline (Ch+) cation or ethylene glycol tends to adsorb on the deposit during the cathodic run. The onset potential of Cu deposition on GC from 0.5 M Cu(II)-ethaline is shifted toward more positive values compared to the 0.01 M Cu(II)-ethaline. As expected, this difference in behavior is due to the formation of differently coordinated Cun+ complexes since the Cu+ concentration is higher in the vicinity of the electrode.
The surface morphology of the Cu deposits depended on the Cu(II) ion concentration in the electrolyte. Approximately irregular grains, including carrot-like or needle-like dendrites, were electrochemically grown from the 0.01 M Cu(II)-ethaline, and rose-shaped morphologies were grown from 0.5 M Cu(II)-ethaline. The formation of the rose-shaped structures in this investigation, obtained for the first time from this type of DES as a morphological shape, was explained by the phenomenon of electrocrystallization on the inert substrate and by the formation of nucleation exclusion zones around them.

Supplementary Materials

The following supporting information can be downloaded at: https://www.mdpi.com/article/10.3390/met15070716/s1.

Author Contributions

Conceptualization, V.S.C.; methodology, V.S.C. and N.M.P.; validation, N.D.N. and J.N.J.; formal analysis, V.S.C. and N.M.P.; investigation, V.S.C. and N.M.P.; morphology analysis, N.D.N.; writing—original draft preparation, V.S.C., N.M.P., N.D.N. and J.N.J.; writing—review and editing, V.S.C., N.D.N. and J.N.J.; supervision, N.D.N., V.S.C. and J.N.J. All authors have read and agreed to the published version of the manuscript.

Funding

This research was funded by the Ministry of Science, Technological Development and Innovation of the Republic of Serbia (Contract No: 451-03-136/2025-03/200026).

Data Availability Statement

The original contributions presented in this study are included in the article/Supplementary Materials. Further inquiries can be directed to the corresponding author.

Acknowledgments

This work was completed in accordance with the United Nations Sustainable Development Goal (SDGs) No.12 “Responsible consumption and Production”.

Conflicts of Interest

The authors declare that they have no known competing financial interests or personal relationships that could have appeared to influence the work reported in this paper.

Abbreviations

The following abbreviations are used in this manuscript:
ChClCholine chloride
EGEthylene glycol
Ethaline ChCl:EG (1:2) electrolyte
CVCyclic voltammetry
DESDeep eutectic solvents
ILsIonic liquids
PdPalladium
GCGlassy carbon
AuGold
PtPlatinum
CuCopper
CECounter electrode
WEWorking electrode
REQuasi-reference electrode
SEMScanning electron microscope
EDSEnergy-dispersive X-ray spectroscopy
XRDX-ray diffraction
EcCathodic end potential
EiInitial potential
EpShift in cathodic peak potential
FCCFace-centered cubic lattice
TC(hkl)Texture coefficients
RTC(hkl)Relative texture coefficients

References

  1. Hansen, B.B.; Spittle, S.; Chen, B.; Poe, D.; Zhang, Y.; Klein, J.M.; Horton, A.; Adhikari, L.; Zelovich, T.; Doherty, B.W.; et al. Deep Eutectic Solvents: A Review of Fundamentals and Applications. Chem. Rev. 2021, 121, 1232–1285. [Google Scholar] [CrossRef] [PubMed]
  2. Yu, D.; Xue, Z.; Mu, T. Deep Eutectic Solvents as a Green Toolbox for Synthesis. Cell Rep. Phys. Sci. 2022, 3, 100809. [Google Scholar] [CrossRef]
  3. Kaur, G.; Kumar, H.; Singla, M. Diverse Applications of Ionic Liquids: A Comprehensive Review. J. Mol. Liq. 2022, 351, 118556. [Google Scholar] [CrossRef]
  4. De Vreese, P.; Brooks, N.R.; Van Hecke, K.; Van Meervelt, L.; Matthijs, E.; Binnemans, K.; Van Deun, R. Speciation of Copper(II) Complexes in an Ionic Liquid Based on Choline Chloride and in Choline Chloride/Water Mixtures. Inorg. Chem. 2012, 51, 4972–4981. [Google Scholar] [CrossRef]
  5. Kityk, A.; Pavlik, V.; Hnatko, M. Exploring Deep Eutectic Solvents for the Electrochemical and Chemical Synthesis of Photo- and Electrocatalysts for Hydrogen Evolution. Int. J. Hydrogen Energy 2023, 48, 39823–39853. [Google Scholar] [CrossRef]
  6. Zhou, T.; Gui, C.; Sun, L.; Hu, Y.; Lyu, H.; Wang, Z.; Song, Z.; Yu, G. Energy Applications of Ionic Liquids: Recent Developments and Future Prospects. Chem. Rev. 2023, 123, 12170–12253. [Google Scholar] [CrossRef]
  7. Abbott, A.P.; El Ttaib, K.; Frisch, G.; McKenzie, K.J.; Ryder, K.S. Electrodeposition of Copper Composites from Deep Eutectic Solvents Based on Choline Chloride. Phys. Chem. Chem. Phys. 2009, 11, 4269–4277. [Google Scholar] [CrossRef]
  8. Sebastián, P.; Vallés, E.; Gómez, E. Copper Electrodeposition in a Deep Eutectic Solvent. First Stages Analysis Considering Cu(I) Stabilization in Chloride Media. Electrochim. Acta 2014, 123, 285–295. [Google Scholar] [CrossRef]
  9. Haerens, K.; Matthijs, E.; Binnemans, K.; Van der Bruggen, B. Electrochemical Decomposition of Choline Chloride Based Ionic Liquid Analogues. Green Chem. 2009, 11, 1357. [Google Scholar] [CrossRef]
  10. Vukmirovic, M.B.; Adzic, R.R.; Akolkar, R. Copper Electrodeposition from Deep Eutectic Solvents—Voltammetric Studies Providing Insights into the Role of Substrate: Platinum vs Glassy Carbon. J. Phys. Chem. B 2020, 124, 5465–5475. [Google Scholar] [CrossRef]
  11. Yue, D.; Jia, Y.; Yao, Y.; Sun, J.; Jing, Y. Structure and Electrochemical Behavior of Ionic Liquid Analogue Based on Choline Chloride and Urea. Electrochim. Acta 2012, 65, 30–36. [Google Scholar] [CrossRef]
  12. Kityk, A.; Pavlik, V.; Hnatko, M. Breaking Barriers in Electrodeposition: Novel Eco-Friendly Approach Based on Utilization of Deep Eutectic Solvents. Adv. Colloid Interface Sci. 2024, 334, 103310. [Google Scholar] [CrossRef]
  13. Geng, T.; Zeller, S.J.; Kibler, L.A.; Ceblin, M.U.; Jacob, T. Electrodeposition of Cu onto Au(111) from Deep Eutectic Solvents: Molar Ratio of Salt and Hydrogen Bond Donor. ChemElectroChem 2022, 9, e202101283. [Google Scholar] [CrossRef]
  14. Shen, D.; Vukmirovic, M.B.; Akolkar, R. Understanding the Role of Complexation in the Charge-Transfer Kinetics of the Cu2+ + e ↔ Cu1+ Redox Reaction in Ethaline Deep Eutectic Solvent. J. Electrochem. Soc. 2019, 166, E526–E532. [Google Scholar] [CrossRef]
  15. Cvetković, V.S.; Jović, V.D.; Nikolić, N.D.; Barudžija, T.S.; Dimitrijević, S.; Jovićević, J.N. Electrodeposition of Copper on Glassy Carbon and Palladium from Choline Chloride—Ethylene Glycol Deep Eutectic Solvent. J. Electroanal. Chem. 2024, 958, 118161. [Google Scholar] [CrossRef]
  16. Xing, S.; Zanella, C.; Deflorian, F. Effect of Pulse Current on the Electrodeposition of Copper from Choline Chloride-Ethylene Glycol. J. Solid State Electrochem. 2014, 18, 1657–1663. [Google Scholar] [CrossRef]
  17. Ghosh, S.; Roy, S. Electrochemical Copper Deposition from an Ethaline-CuCl2·2H2O DES. Surf. Coat. Technol. 2014, 238, 165–173. [Google Scholar] [CrossRef]
  18. Zhao, W.; Fu, W.; Yang, H.; Tian, C.; Li, M.; Li, Y.; Zhang, L.; Sui, Y.; Zhou, X.; Chen, H.; et al. Electrodeposition of Cu2O Films and Their Photoelectrochemical Properties. CrystEngComm 2011, 13, 2871–2877. [Google Scholar] [CrossRef]
  19. Wijesundera, R.P.; Hidaka, M.; Koga, K.; Sakai, M.; Siripala, W. Growth and Characterisation of Potentiostatically Electrodeposited Cu2O and Cu Thin Films. Thin Solid Films 2006, 500, 241–246. [Google Scholar] [CrossRef]
  20. Zaidi, N.; Makhloufi, L.; Mandin, P.; Touazi, S.; Hammache, H. Copper Oxide Electrodeposition onto Aluminium Substrate Exploration: New Insights in the Copper Oxide Electrodeposition from Ionic Liquids and Deep Eutectic Solvents. Bull. Mater. Sci. 2021, 44, 1–11. [Google Scholar] [CrossRef]
  21. Hu, Y.; Chen, P.S.; Ko, Y.C.; Tsai, C.H. Electrochemical Deposition and Characterization of Cuprous Oxide Crystallites on Stainless Substrates: Growth Mechanism and Morphological Analysis. Int. J. Electrochem. Sci. 2024, 19, 100688. [Google Scholar] [CrossRef]
  22. Nikolić, N.D.; Maksimović, V.M.; Avramović, L. Correlation of Morphology and Crystal Structure of Metal Powders Produced by Electrolysis Processes. Metals 2021, 11, 859. [Google Scholar] [CrossRef]
  23. Popov, K.I.; Djokić, S.S.; Nikolić, N.D.; Jović, V.D. Morphology of Electrochemically and Chemically Deposited Metals; Springer International Publishing: New York, NY, USA, 2016; ISBN 978-3-319-26071-6. [Google Scholar]
  24. Cvetković, V.S.; Nikolić, N.D.; Barudžija, T.S.; Dimitrijević, S.B.; Jovićević, J.N. Electrodeposition of Dendrite-Free Zn on Au from Deep Eutectic System Based on Choline Chloride. Trans. Nonferrous Met. Soc. China 2024, 34, 2367–2380. [Google Scholar] [CrossRef]
  25. Cvetković, V.S.; Vukićević, N.M.; Jovićević, N.; Stevanović, J.S.; Jovićević, J.N. Aluminium Electrodeposition under Novel Conditions from AlCl3–Urea Deep Eutectic Solvent at Room Temperature. Trans. Nonferrous Met. Soc. China 2020, 30, 823–834. [Google Scholar] [CrossRef]
  26. Milhano, C.; Pletcher, D. The Electrodeposition and Electrocatalytic Properties of Copper-Palladium Alloys. J. Electroanal. Chem. 2008, 614, 24–30. [Google Scholar] [CrossRef]
  27. Vieira, L.; Schennach, R.; Gollas, B. The Effect of the Electrode Material on the Electrodeposition of Zinc from Deep Eutectic Solvents. Electrochim. Acta 2016, 197, 344–352. [Google Scholar] [CrossRef]
  28. Greef, R.; Peat, R.; Peter, L.M.; Pletcher, D.; Robinson, J. Instrumental Methods in Electrochemistry, 1st ed.; Kemp, T.J., Ed.; Ellis Horwood Limited: Chichester, UK, 1985; ISBN 0-85312-875-8. [Google Scholar]
  29. Espinoza, E.M.; Clark, J.A.; Soliman, J.; Derr, J.B.; Morales, M.; Vullev, V.I. Practical Aspects of Cyclic Voltammetry: How to Estimate Reduction Potentials When Irreversibility Prevails. J. Electrochem. Soc. 2019, 166, H3175–H3187. [Google Scholar] [CrossRef]
  30. Bérubé, L.P.; L’Espérance, G. A Quantitative Method of Determining the Degree of Texture of Zinc Electrodeposits. J. Electrochem. Soc. 1989, 136, 2314–2315. [Google Scholar] [CrossRef]
  31. Mandke, M.V.; Han, S.-H.; Pathan, H.M. Growth of Silver Dendritic Nanostructuresvia Electrochemical Route. CrystEngComm 2012, 14, 86–89. [Google Scholar] [CrossRef]
  32. Hartley, J.M.; Ip, C.M.; Forrest, G.C.H.; Singh, K.; Gurman, S.J.; Ryder, K.S.; Abbott, A.P.; Frisch, G. EXAFS Study into the Speciation of Metal Salts Dissolved in Ionic Liquids and Deep Eutectic Solvents. Inorg. Chem. 2014, 53, 6280–6288. [Google Scholar] [CrossRef]
  33. Bontempelli, G.; Dossi, N.; Toniolo, R. Linear Sweep and Cyclic. In Reference Module in Chemistry, Molecular Sciences and Chemical Engineering; G. Bontempelli, R.T., Ed.; Elsevier: New York, NY, USA, 2016; pp. 188–197. [Google Scholar]
Figure 1. CVs on GC electrode starting from an initial Ei potential of 900 mV vs. Cu to different cathodic end potentials Ec in the ethaline (ChCl:EG (1:2) electrolyte): (a) 0.01 M Cu(II) and (b) 0.5 M Cu(II); T = 50 °C; scan rate 10 mV/s. Ec potentials are marked.
Metals 15 00716 g001
Figure 2. CVs on GC electrode starting from an initial Ei potential of 900 mV vs. Cu to cathodic end potentials in the ethaline: (a) Ec = −700 mV vs. Cu; 0.01M Cu(II); (b) Ec = −450 mV vs. Cu; 0.5 M Cu(II); T = 50 °C. Scan rates are marked.
Metals 15 00716 g002
Figure 3. Cathodic and anodic peak currents density ((a) Ic/Ia and (b) IIc/IIa, respectively) vs. the square root of the scan rates obtained from 0.01 M Cu(II)-ethaline; T = 50 °C.
Metals 15 00716 g003
Figure 4. The morphology of the Cu deposit obtained via electrodeposition from 0.01 M Cu(II)-ethaline electrolyte at a cathodic potential of −700 mV vs. Cu on the GC cathode. Magnification: (a) ×250, (b) ×4000.
Metals 15 00716 g004
Figure 5. EDS analysis of Cu deposit obtained via electrodeposition from 0.01 M Cu(II)-ethaline electrolyte at a cathodic potential of −700 mV vs. Cu on the GC cathode. (a,b) The point analysis, (c,d) the whole surface analysis.
Metals 15 00716 g005
Figure 6. The morphology of Cu deposit obtained via electrodeposition from 0.5 M Cu(II)-ethaline electrolyte at a cathodic potential of −400 mV vs. Cu on the GC cathode. Magnification: (a) ×250, (b) ×2000, (c) ×3500, (d) ×10,000.
Metals 15 00716 g006
Figure 7. EDS analysis of Cu deposit obtained via electrodeposition from 0.5 M Cu(II)-ethaline at a cathodic potential of −400 mV vs. Cu on the GC cathode. (ad) The point analysis, (e,f) the whole surface analysis.
Metals 15 00716 g007
Figure 8. The X-ray diffraction (XRD) pattern of the rose-shaped particles obtained via the electrodeposition from 0.5 M Cu(II)-ethaline at a cathodic potential of −400 mV vs. Cu on the GC cathode.
Metals 15 00716 g008
Figure 9. Scheme of rose-shaped structure formation from 0.5 M Cu(II)-ethaline.
Metals 15 00716 g009
Table 1. The values of the peak intensity ratios for the rose-shaped particles and Cu standard (04-0836).
Peak Intensity Ratios
(111)/(200)(111)/(220)
Rose-shaped particles2.927.09
Cu standard (04-0836)2.175.0
Disclaimer/Publisher’s Note: The statements, opinions and data contained in all publications are solely those of the individual author(s) and contributor(s) and not of MDPI and/or the editor(s). MDPI and/or the editor(s) disclaim responsibility for any injury to people or property resulting from any ideas, methods, instructions or products referred to in the content.

