
The Evolutionary Behavior of Shear Strength and Microscopic Mechanisms of Ionic Rare Earths Under Varying Leaching Conditions


Abstract
1. Introduction
2. Experimental Materials and Methods
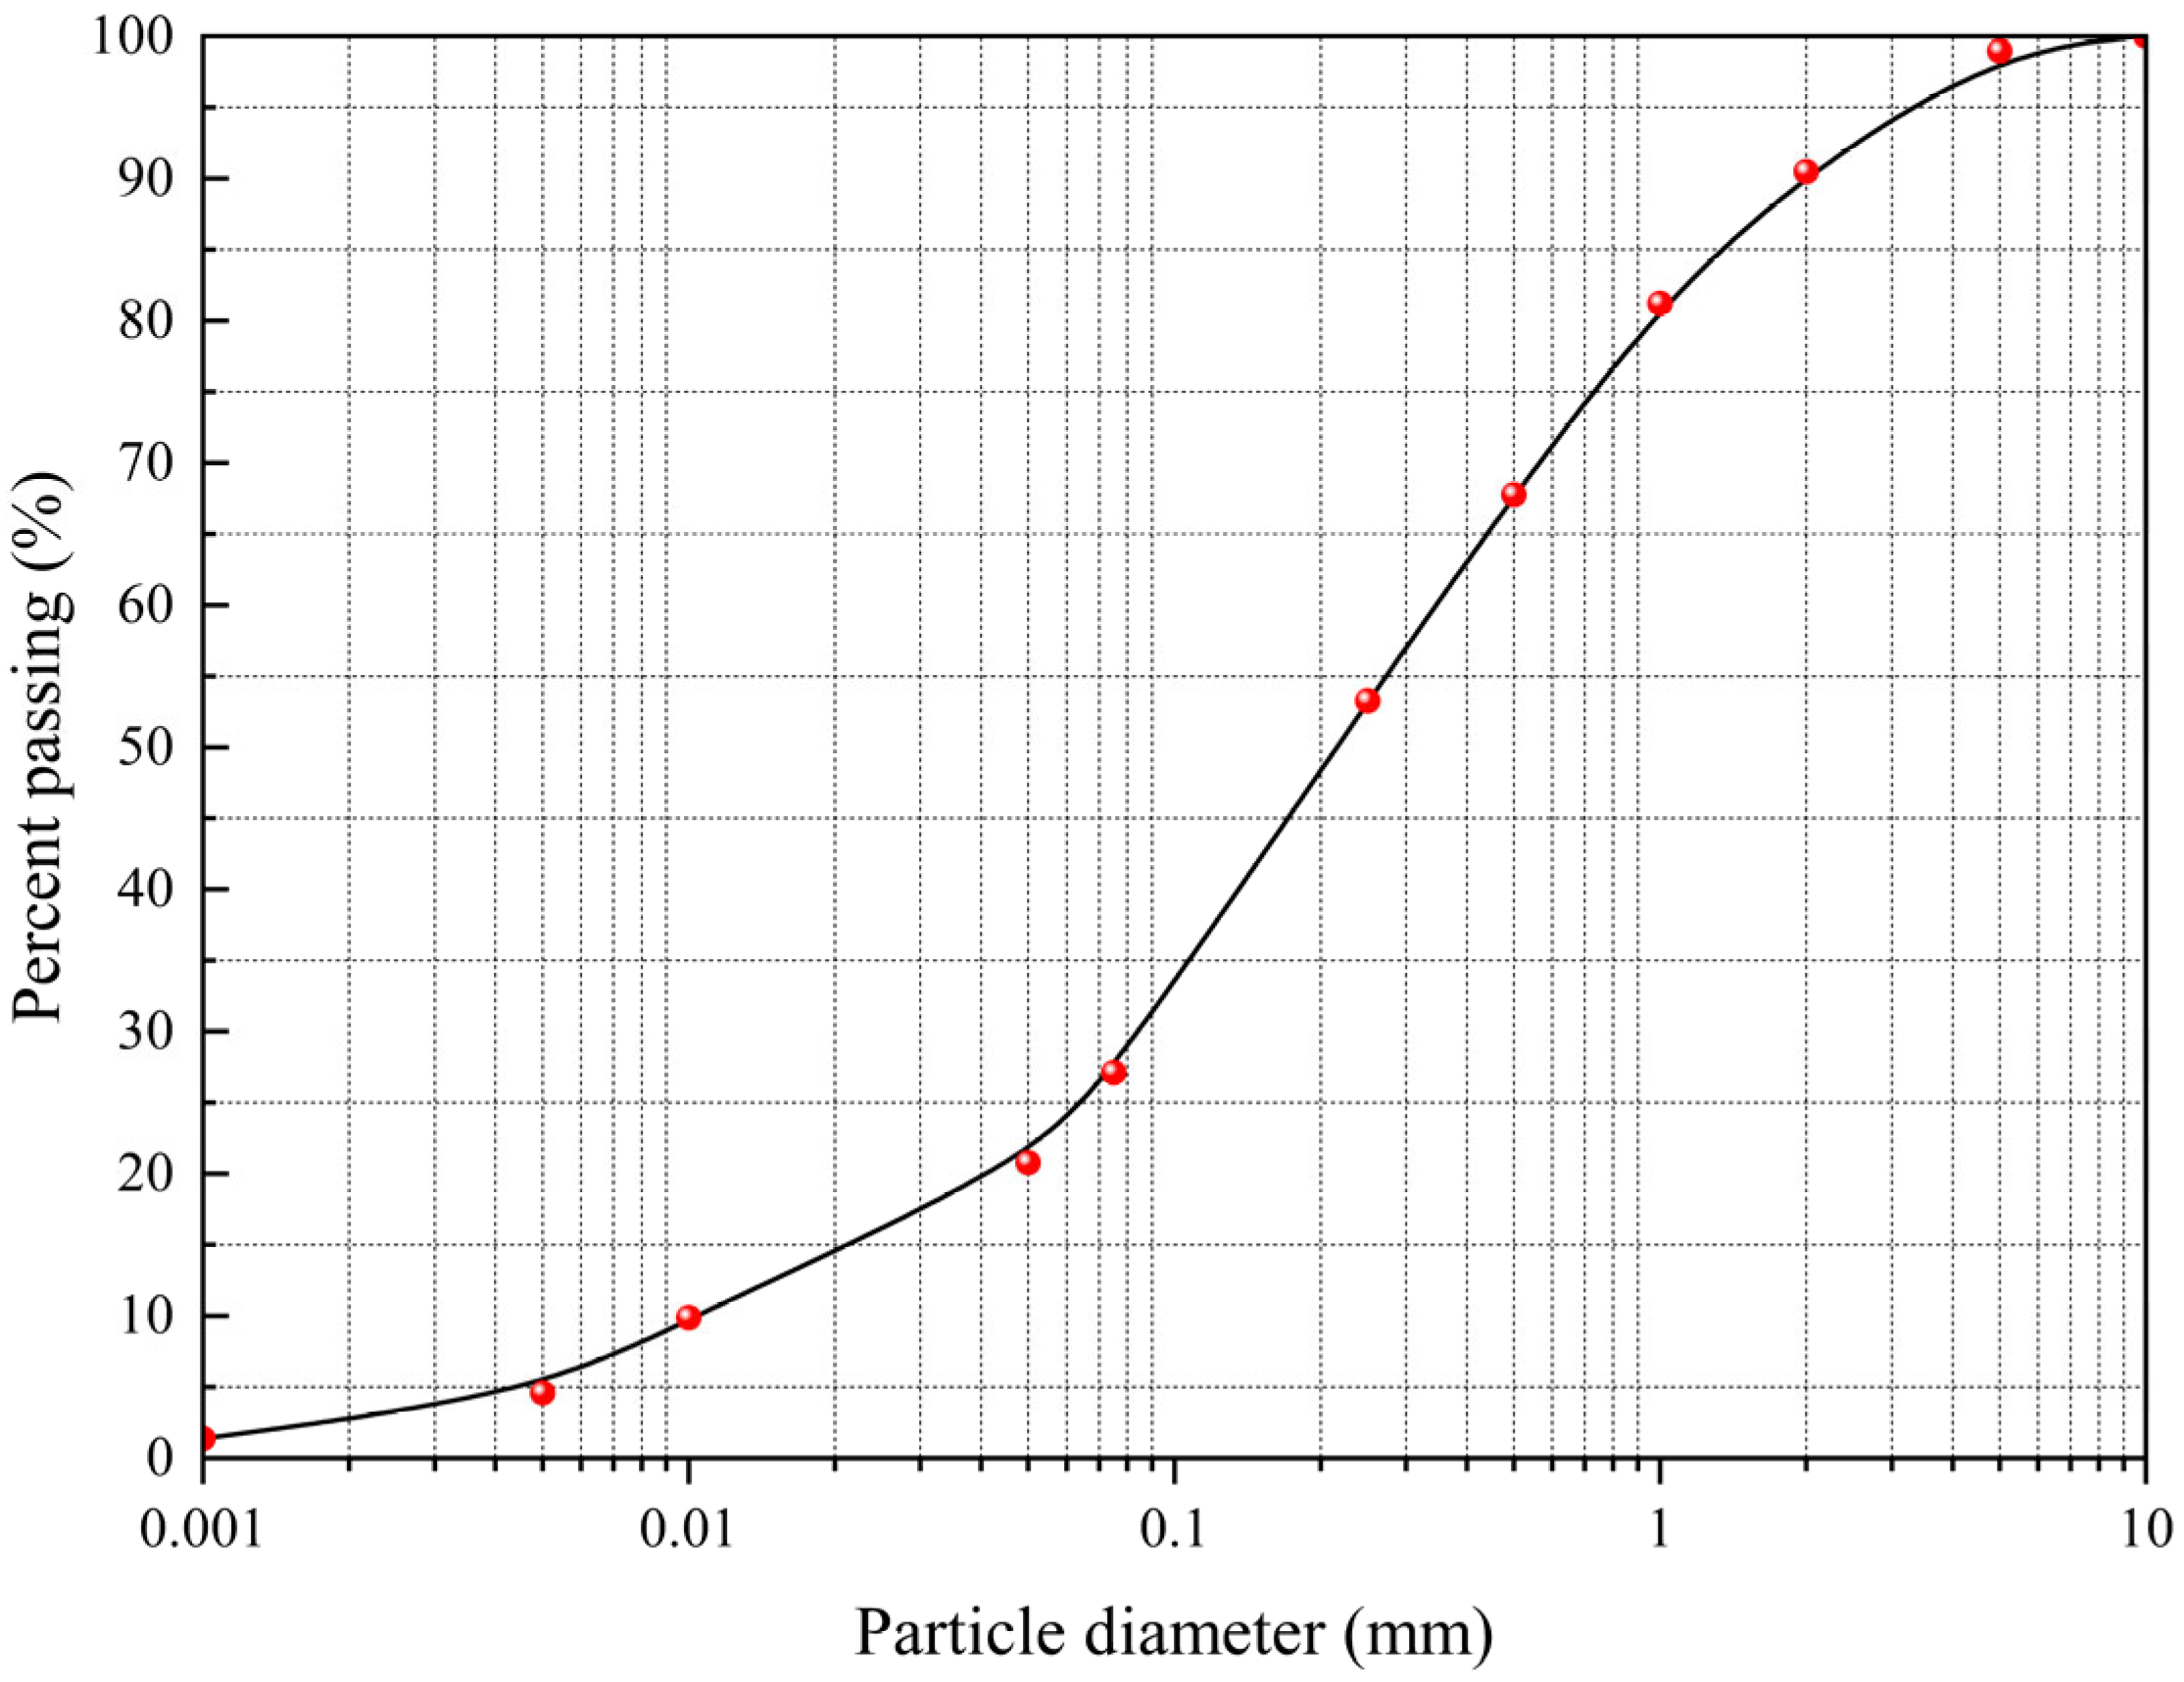
2.1. Test Samples
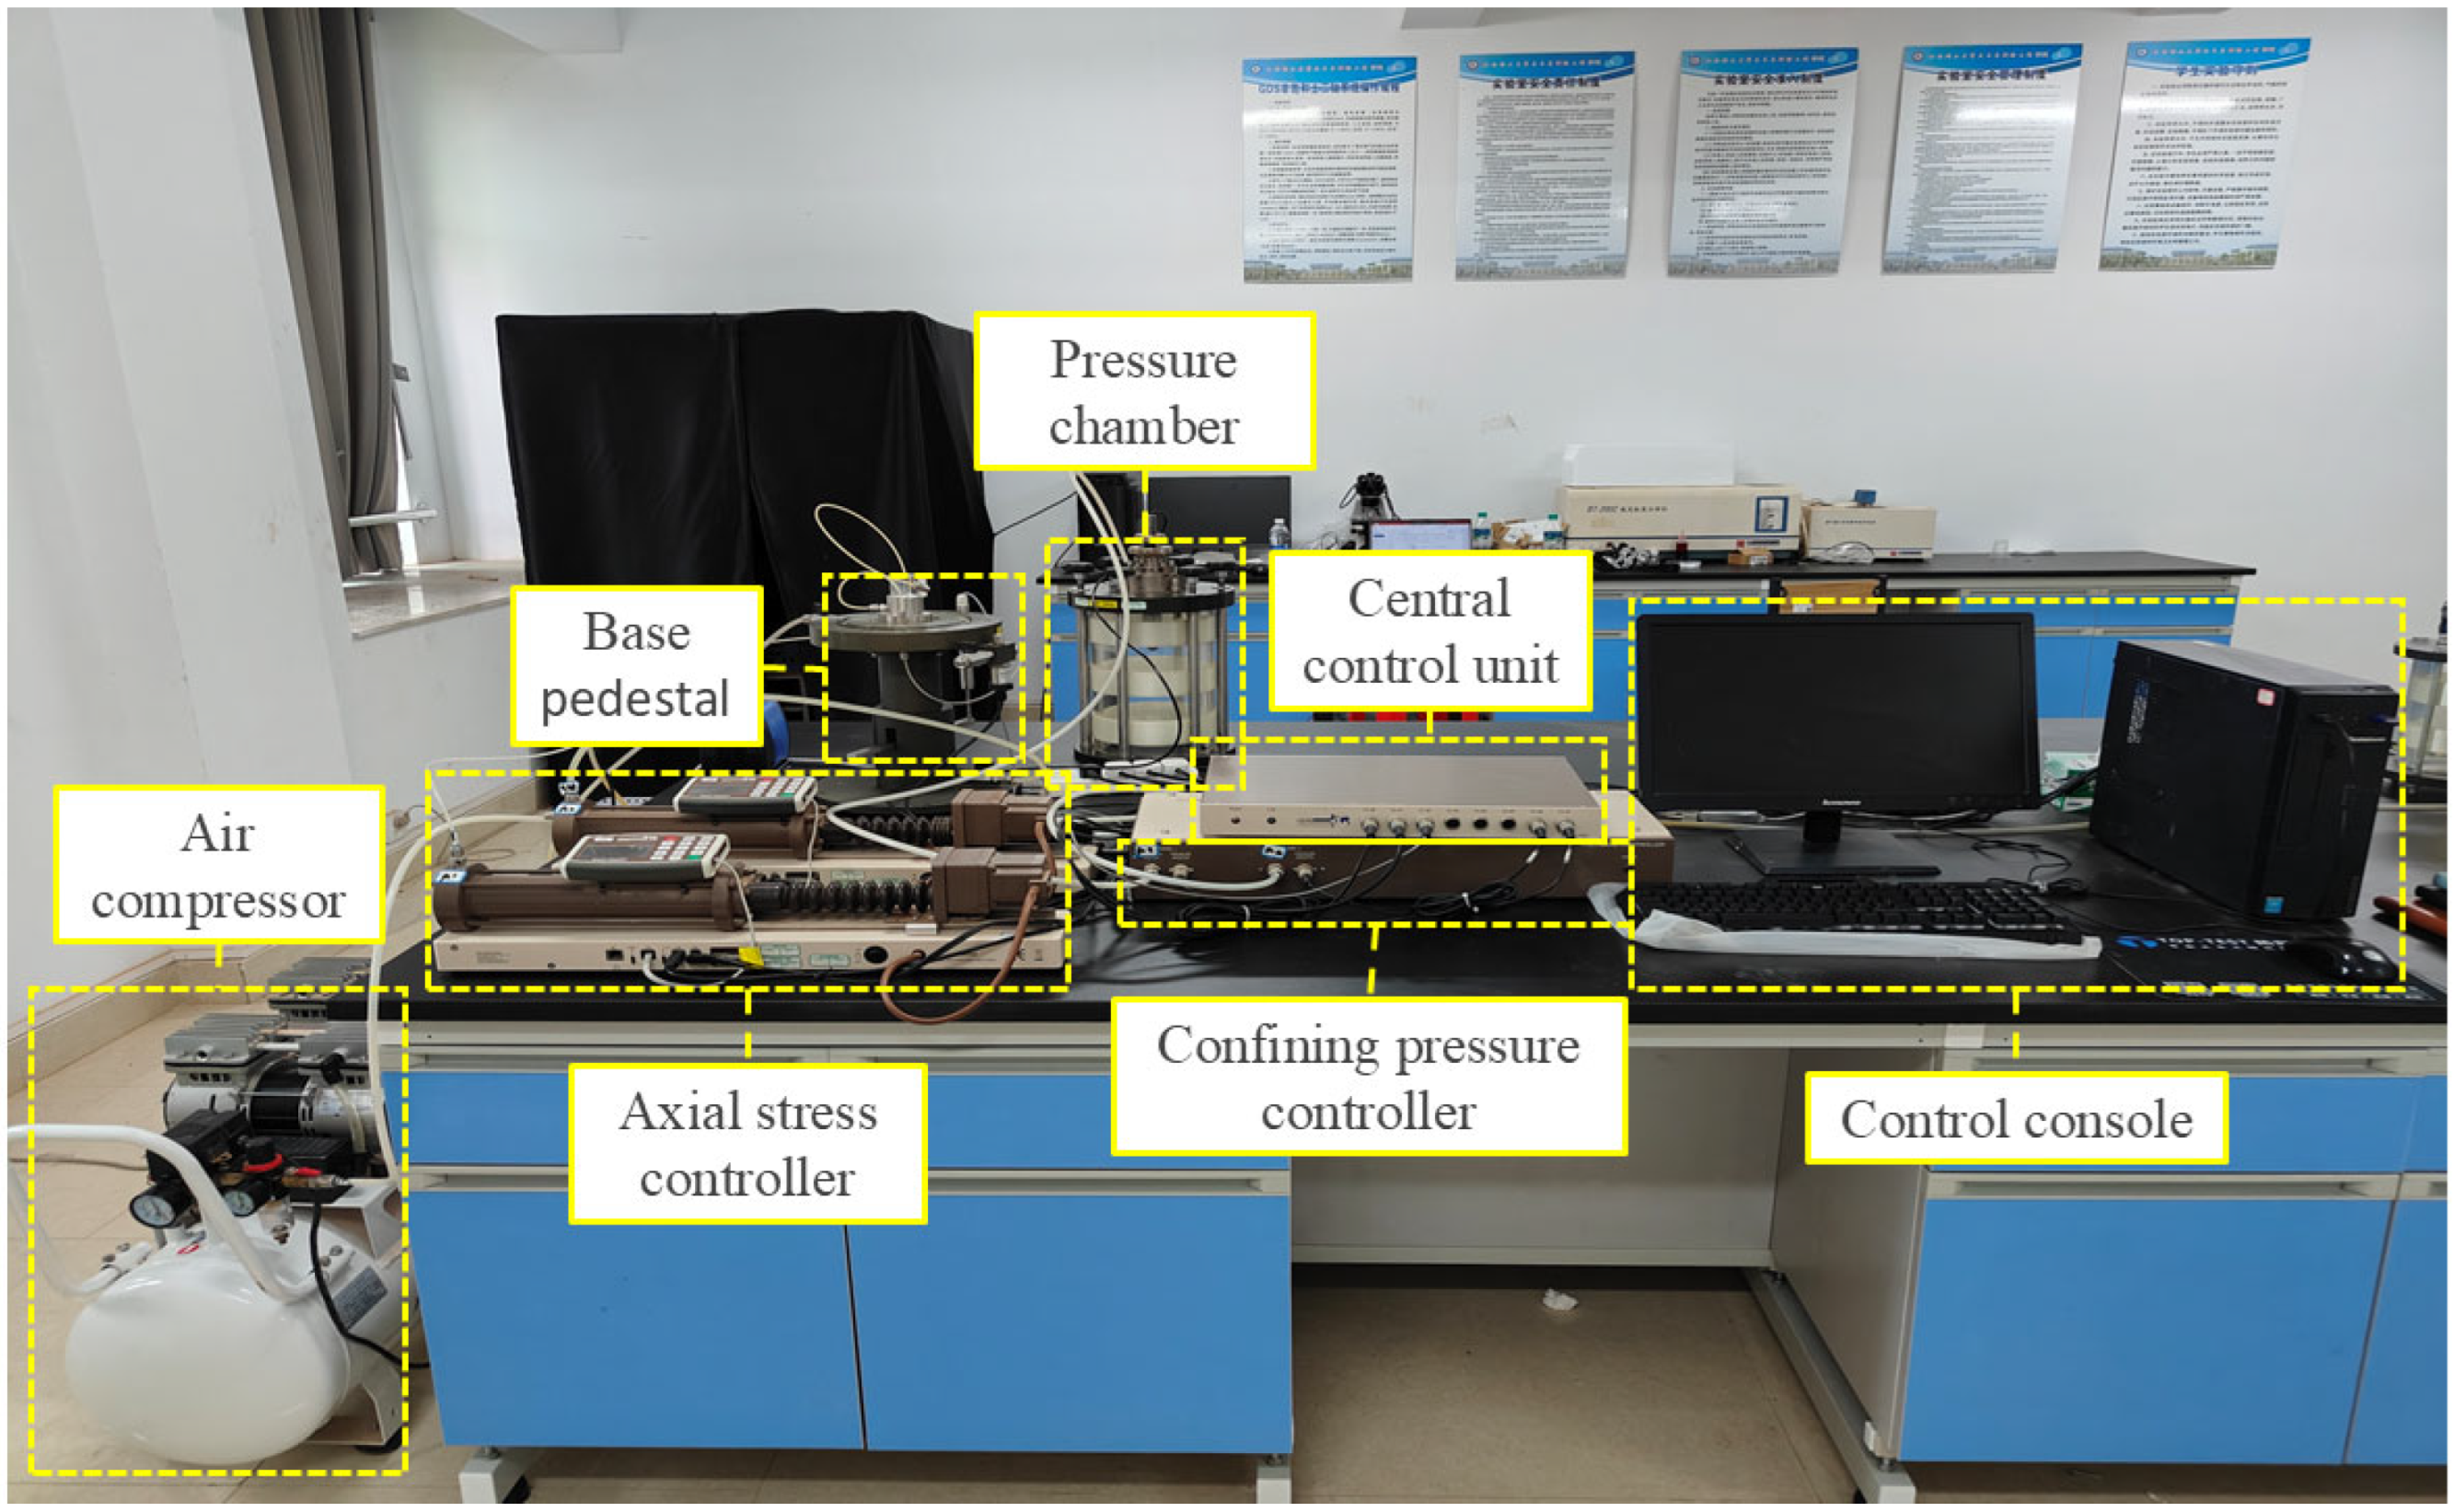
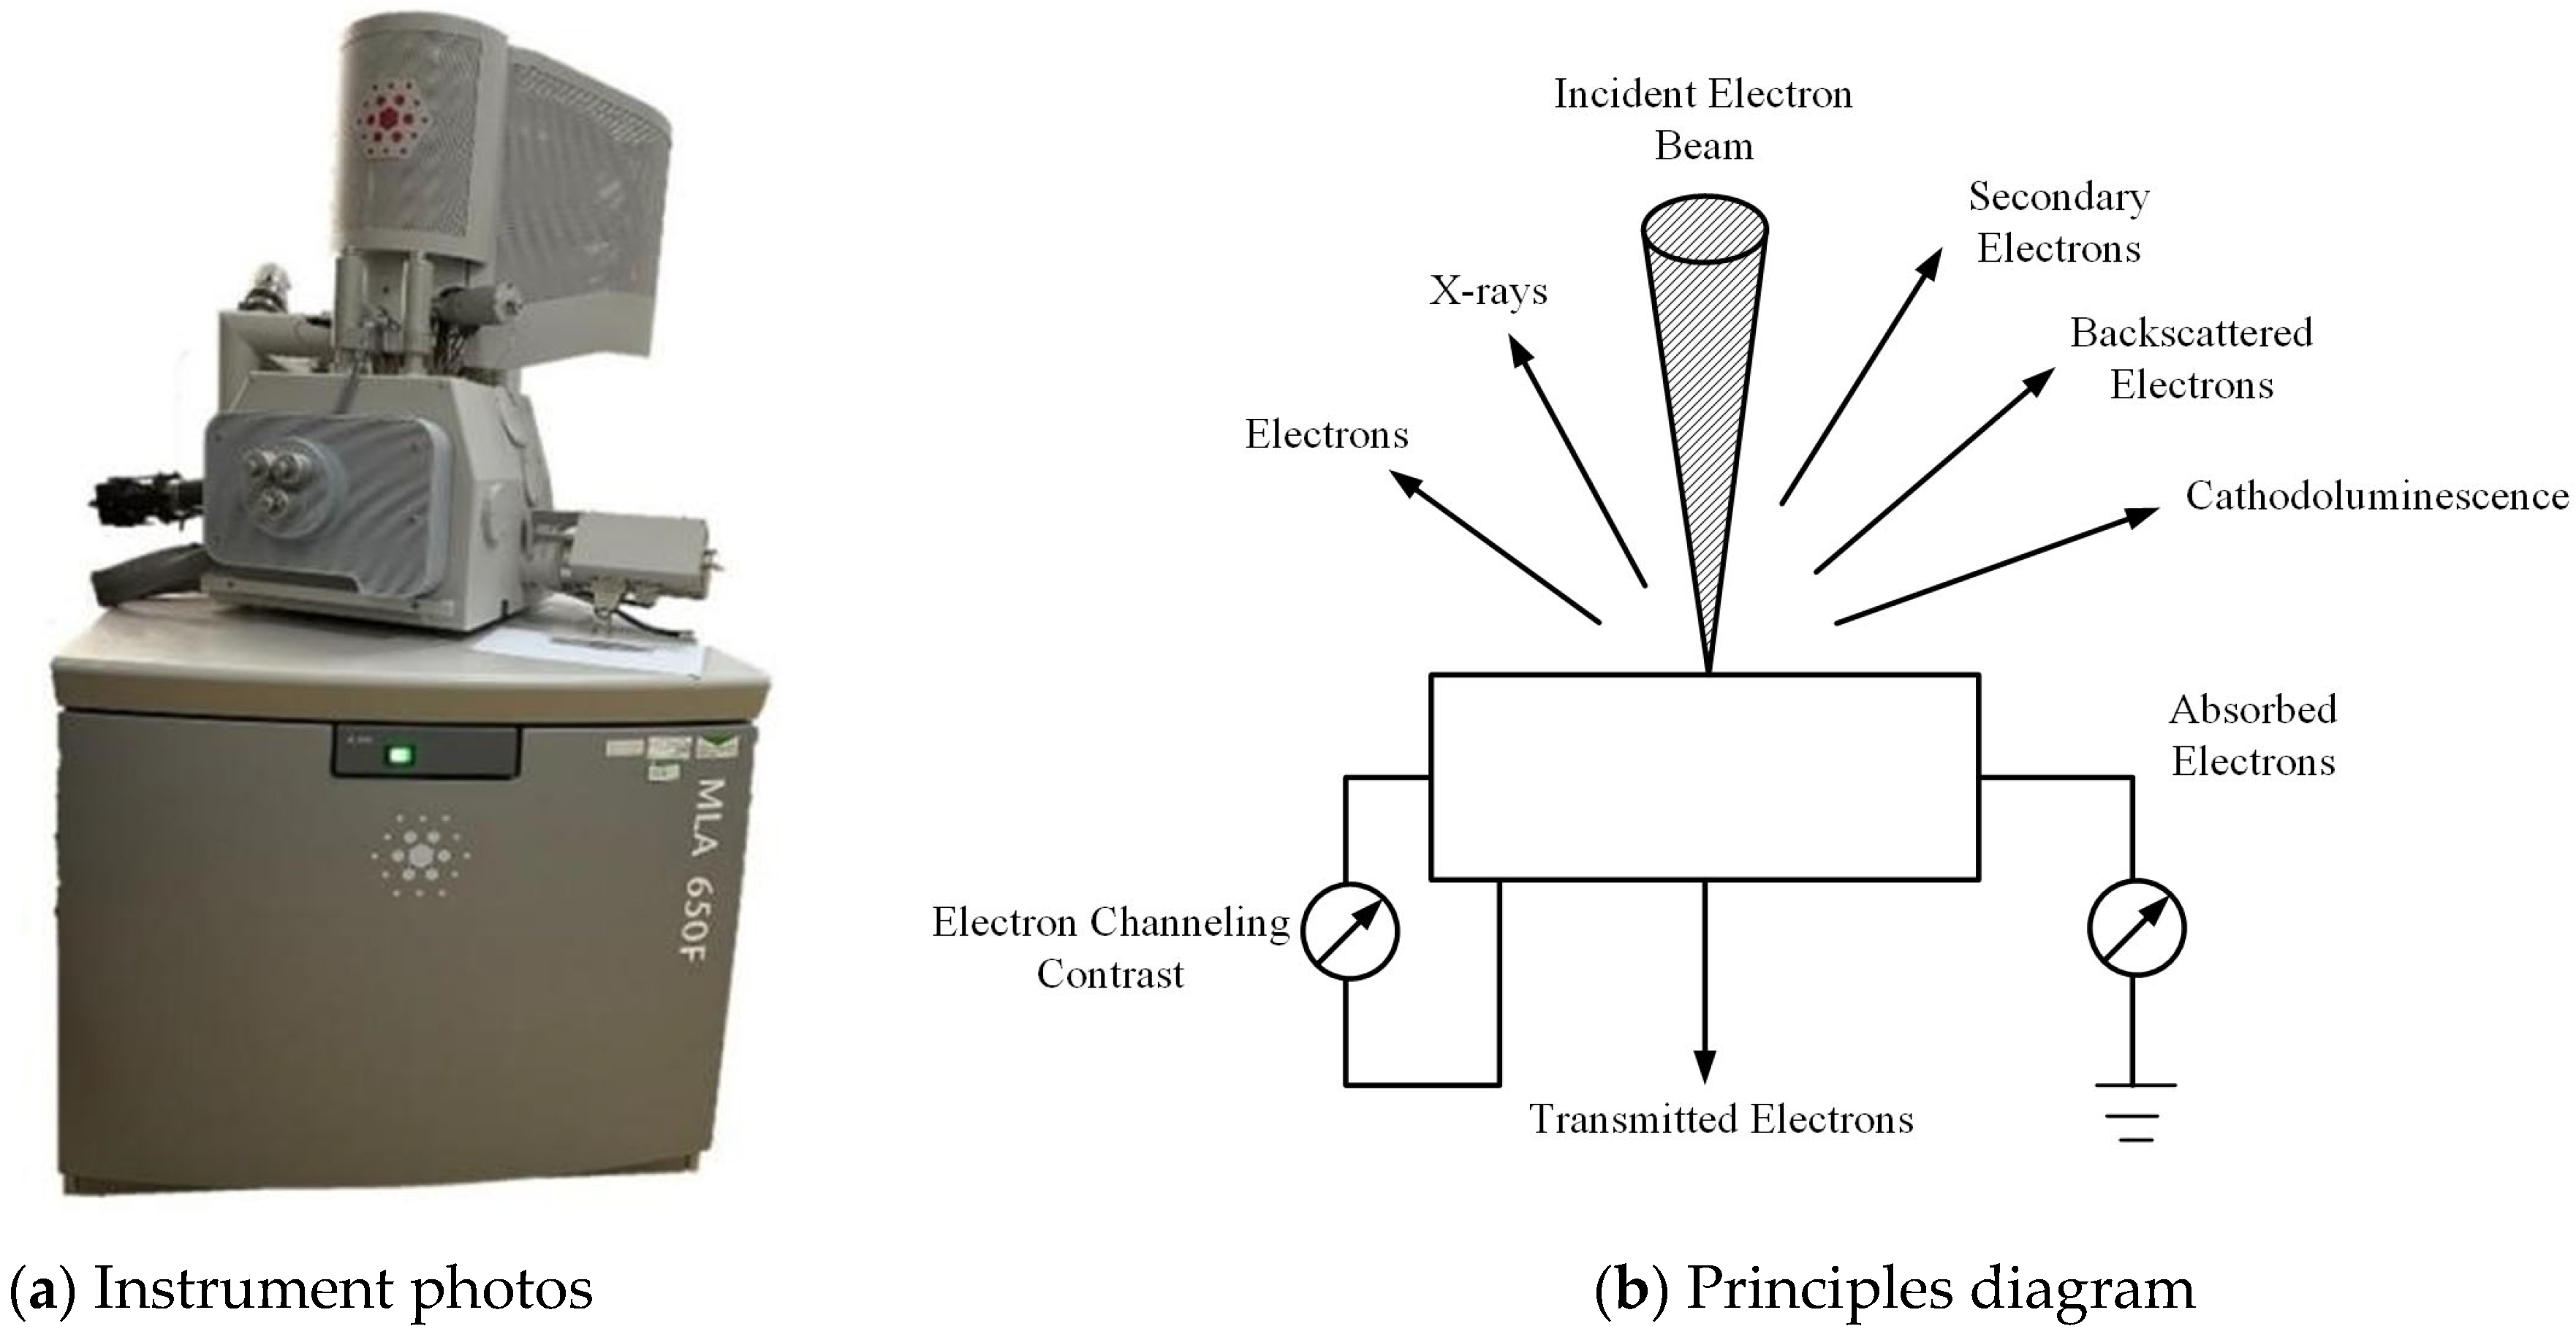
2.2. Experimental Equipment
2.3. Experimental Design
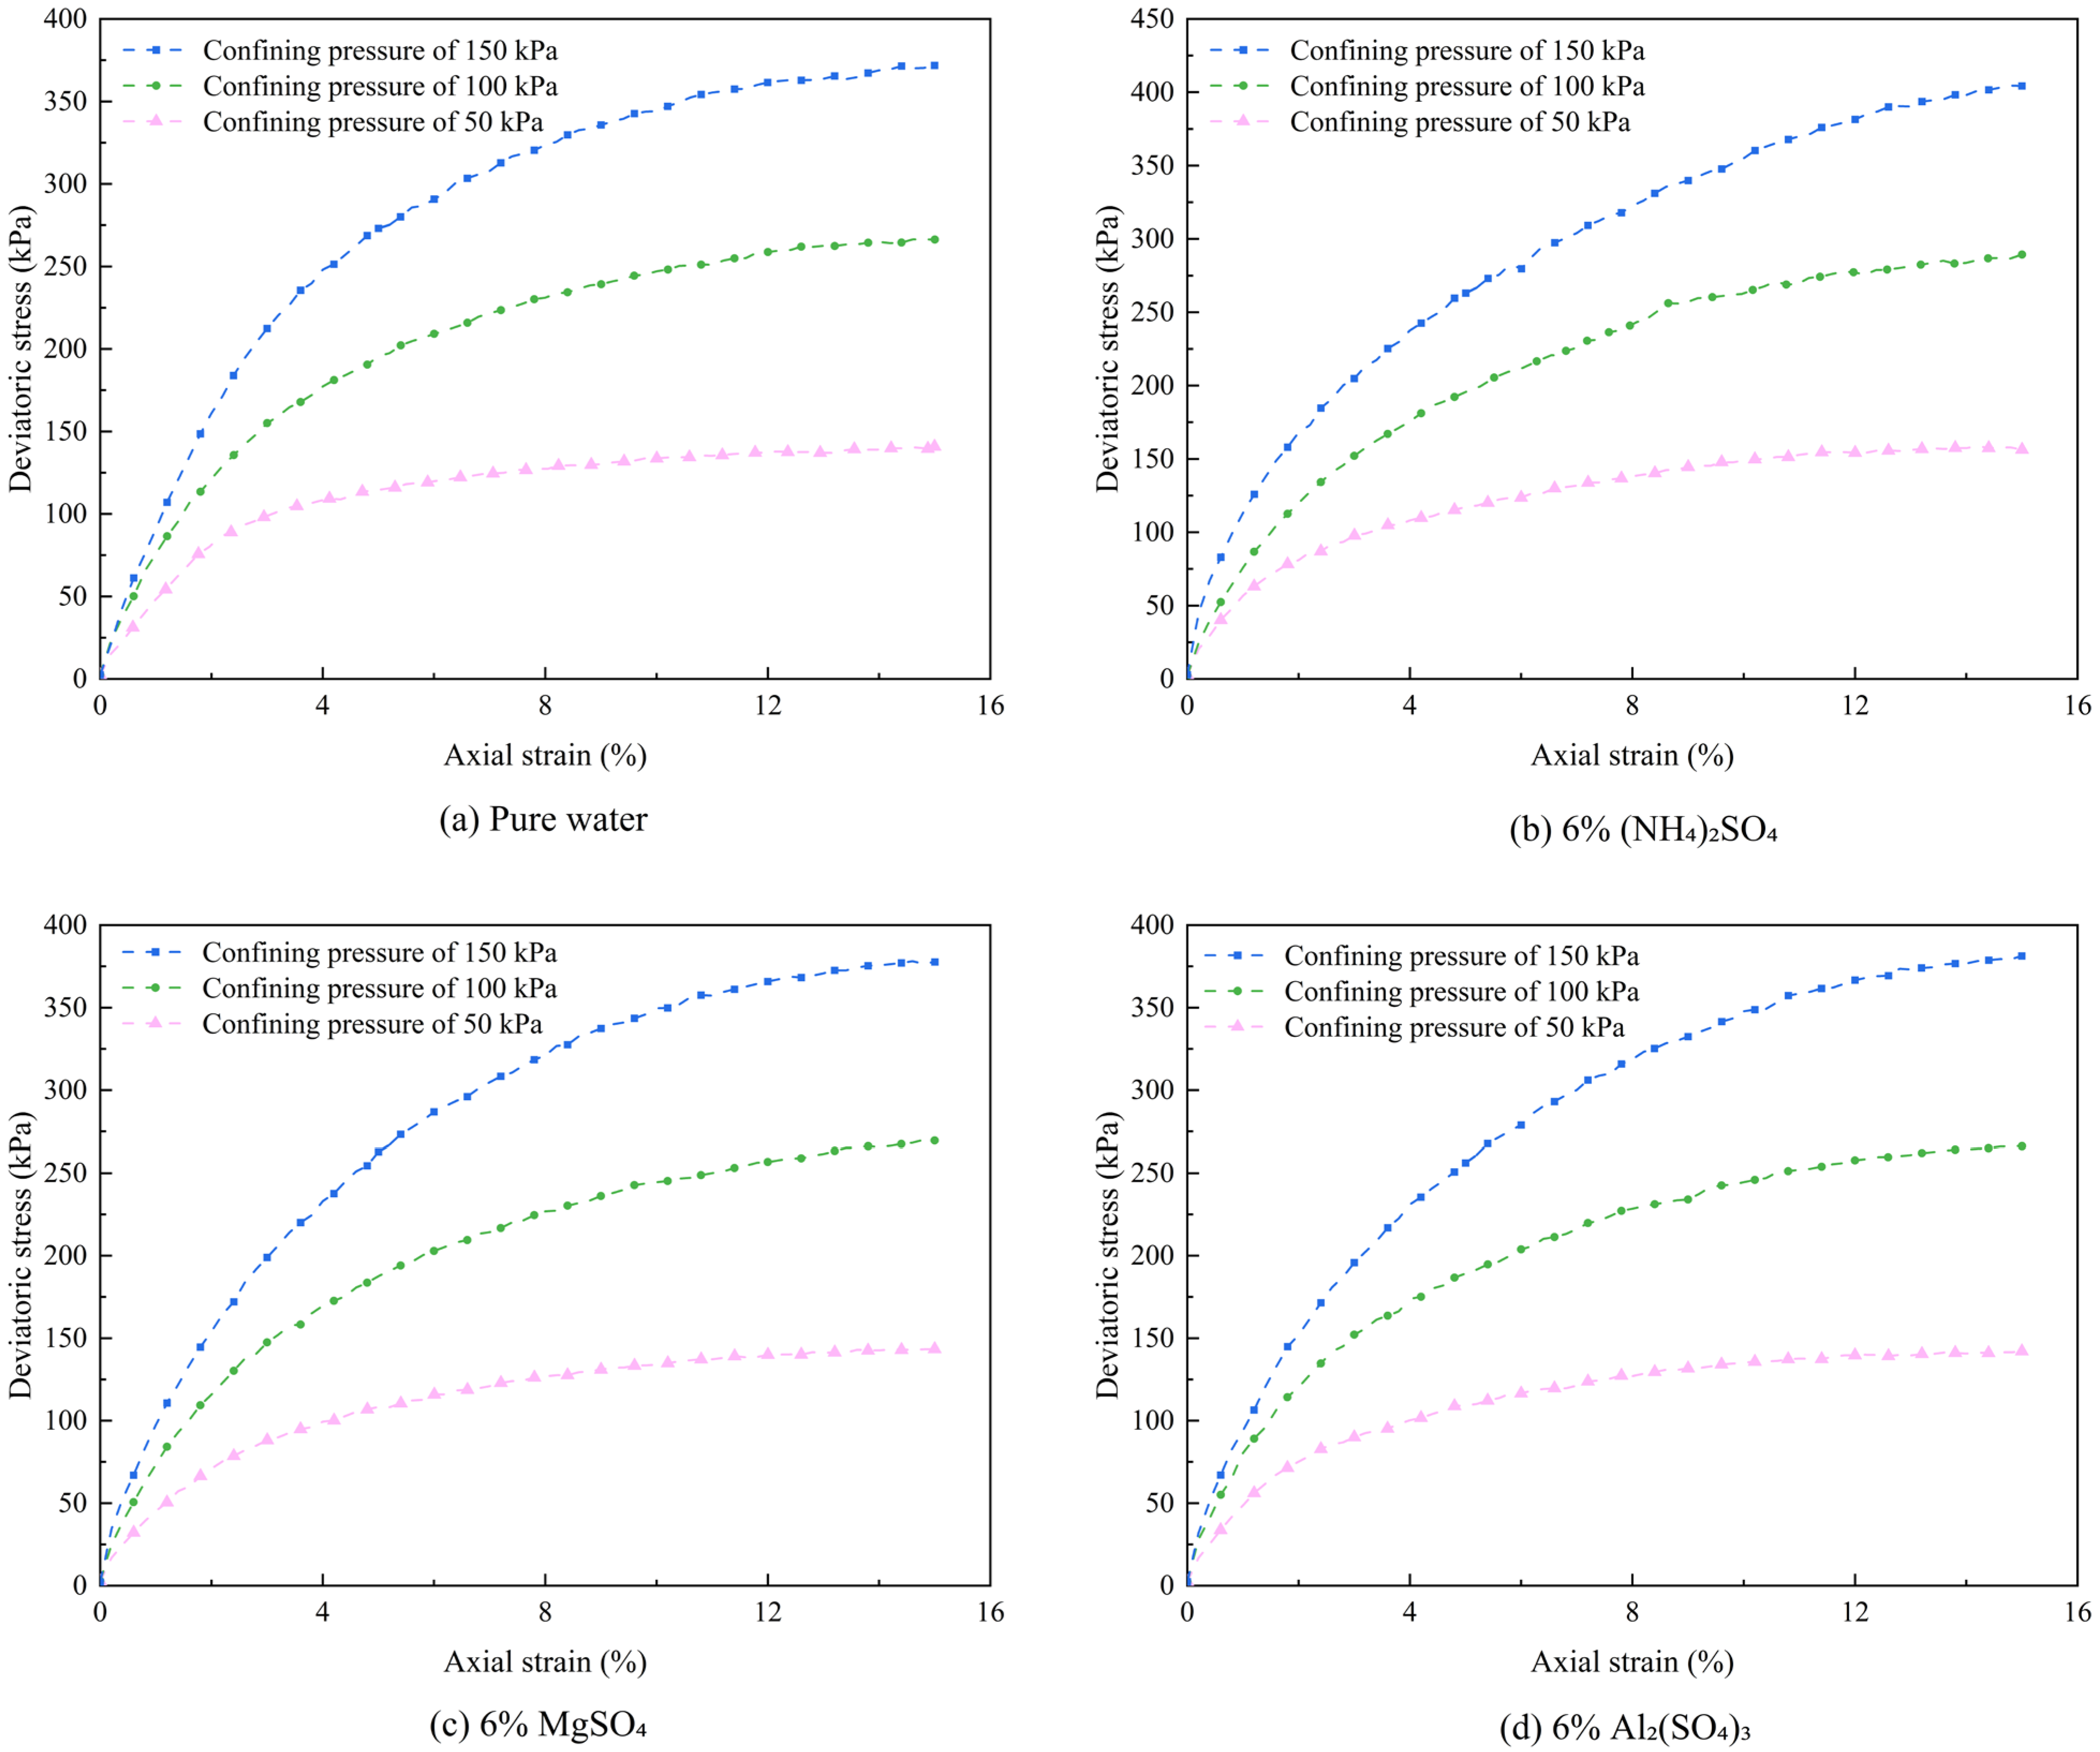
- Leaching agent types: Pure water, 6% (NH4)2SO4, 6% MgSO4, and 6% Al2(SO4)3 solutions were selected as leaching agents, with a leaching duration of 48 h.
- Leaching agent concentrations: MgSO4 solutions with concentrations of 3%, 6%, and 9% were used, also with a leaching duration of 48 h.
3. Shear Strength Test Analysis
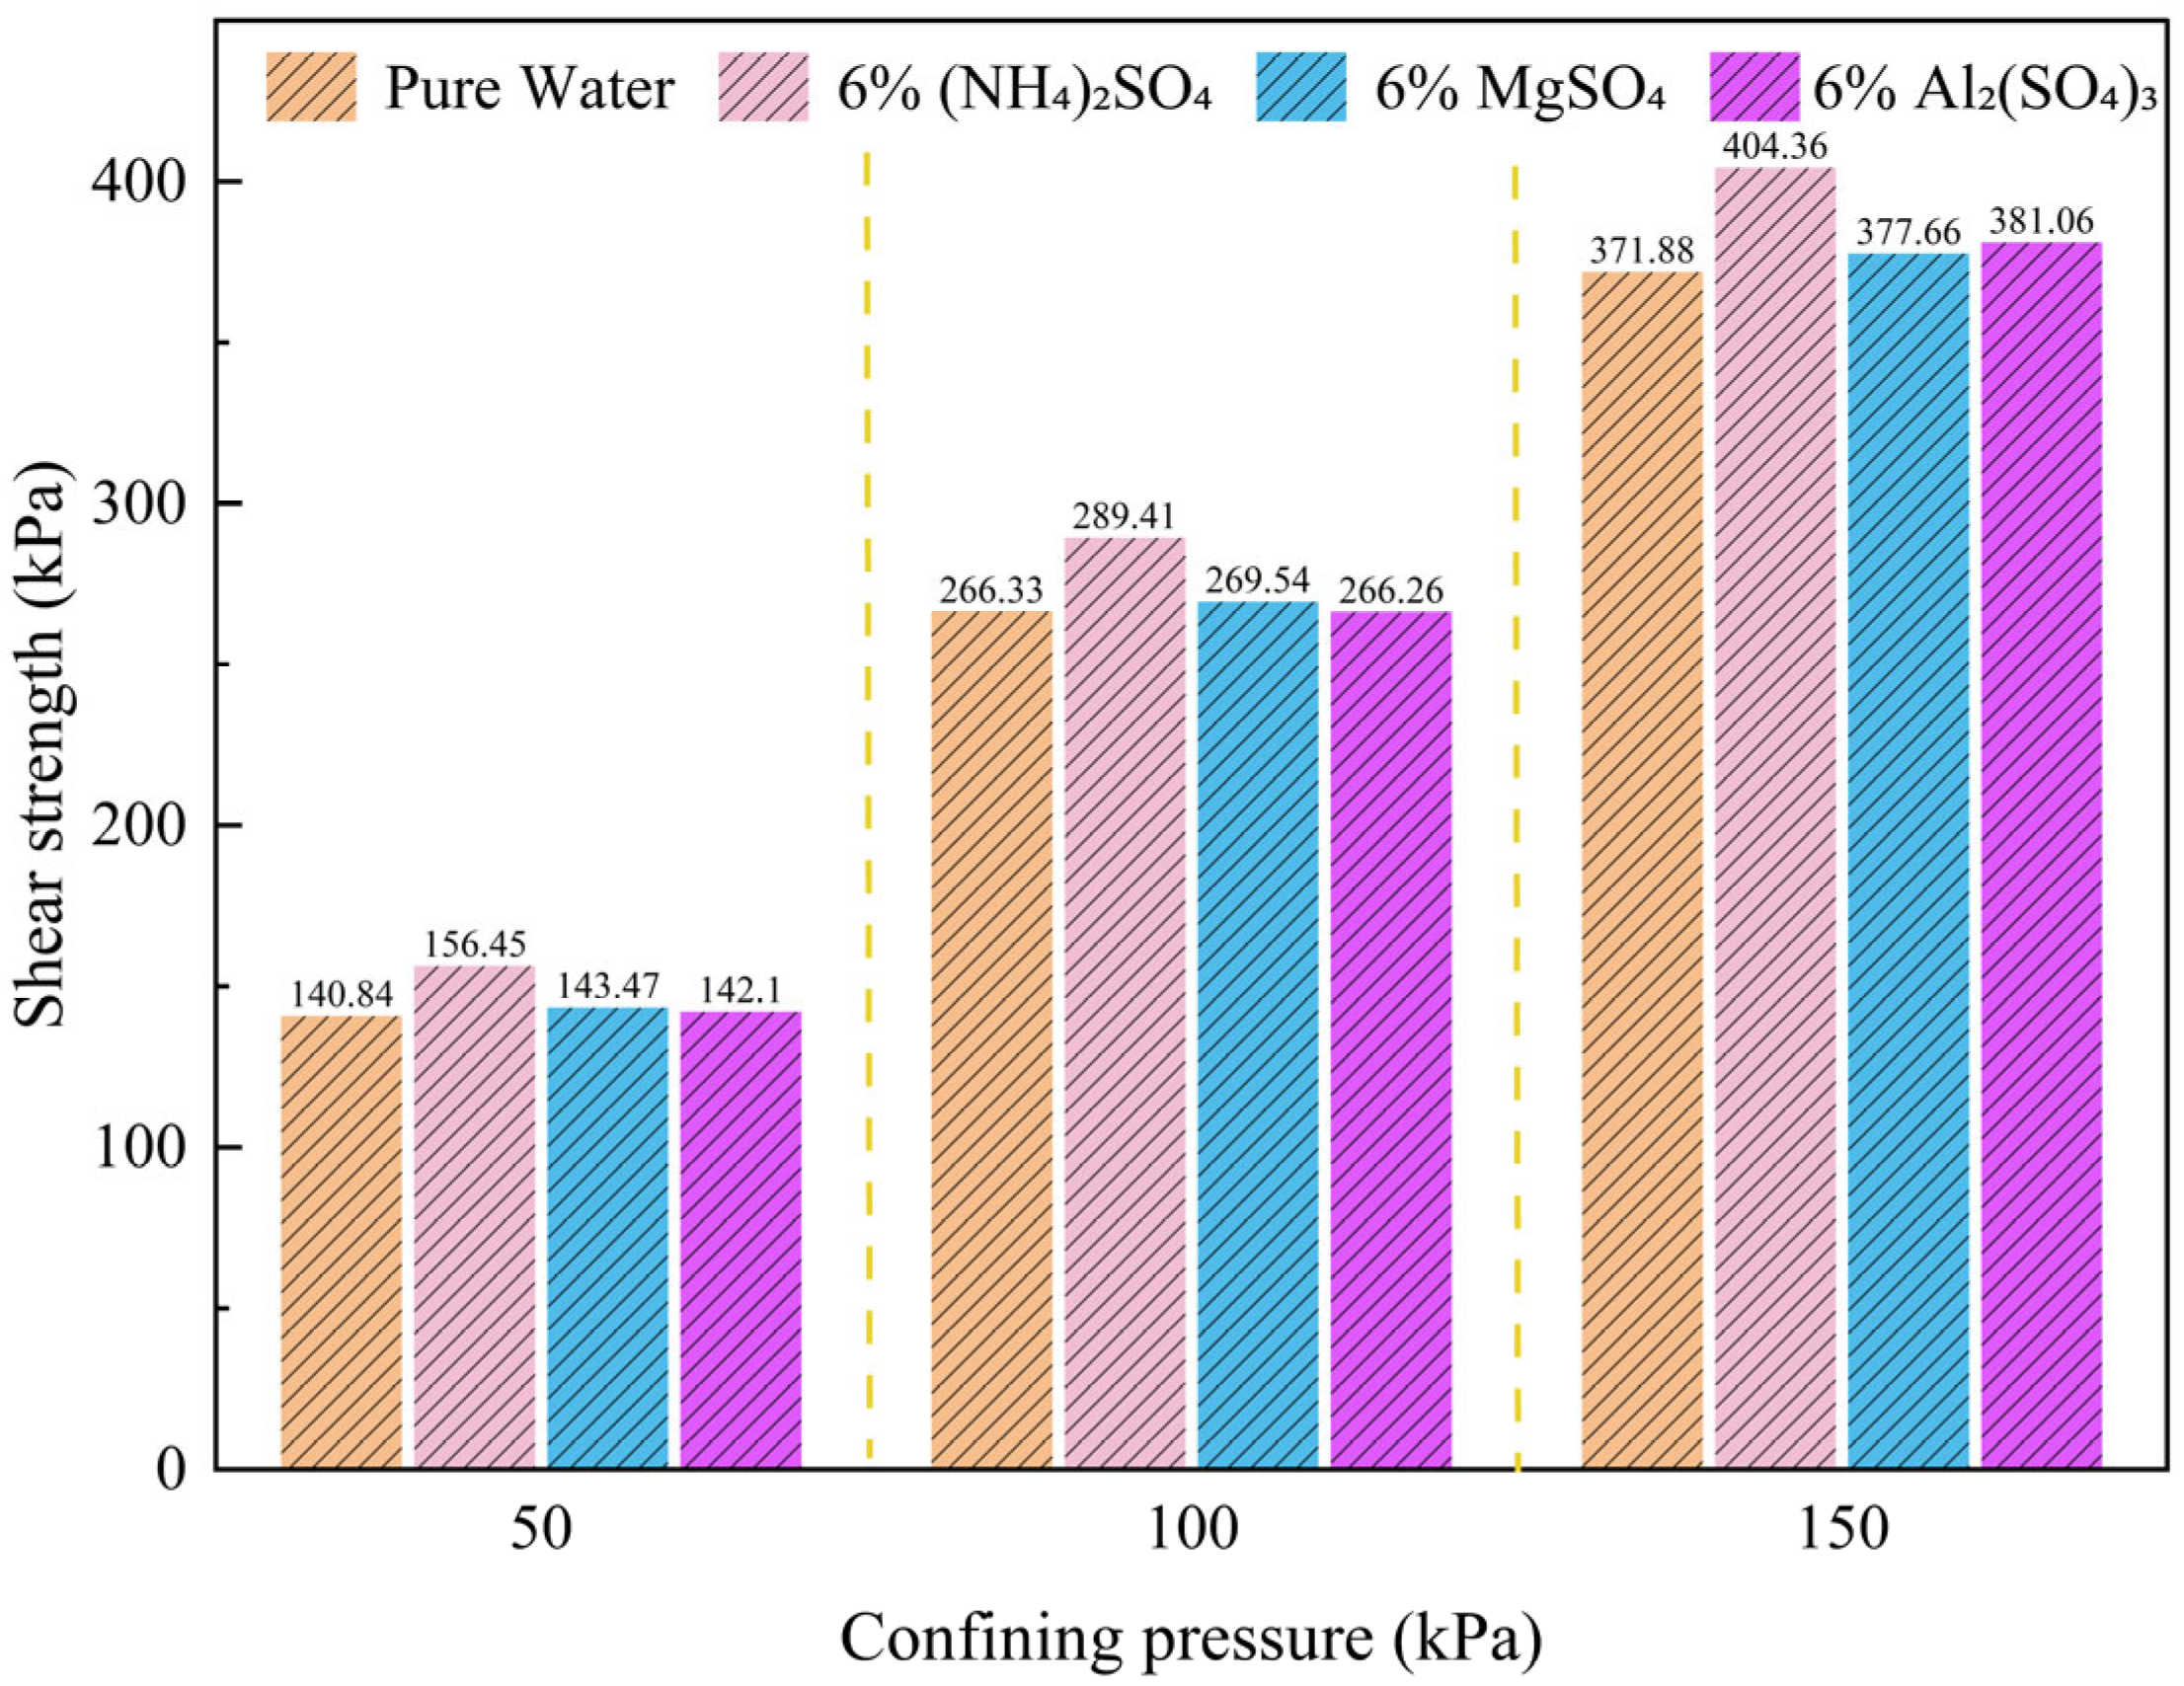
3.1. Effect of Leaching Agent Type on the Shear Strength of Ionic Rare Earths
- Shear Strength Variations under Different Leaching Conditions
- 2.
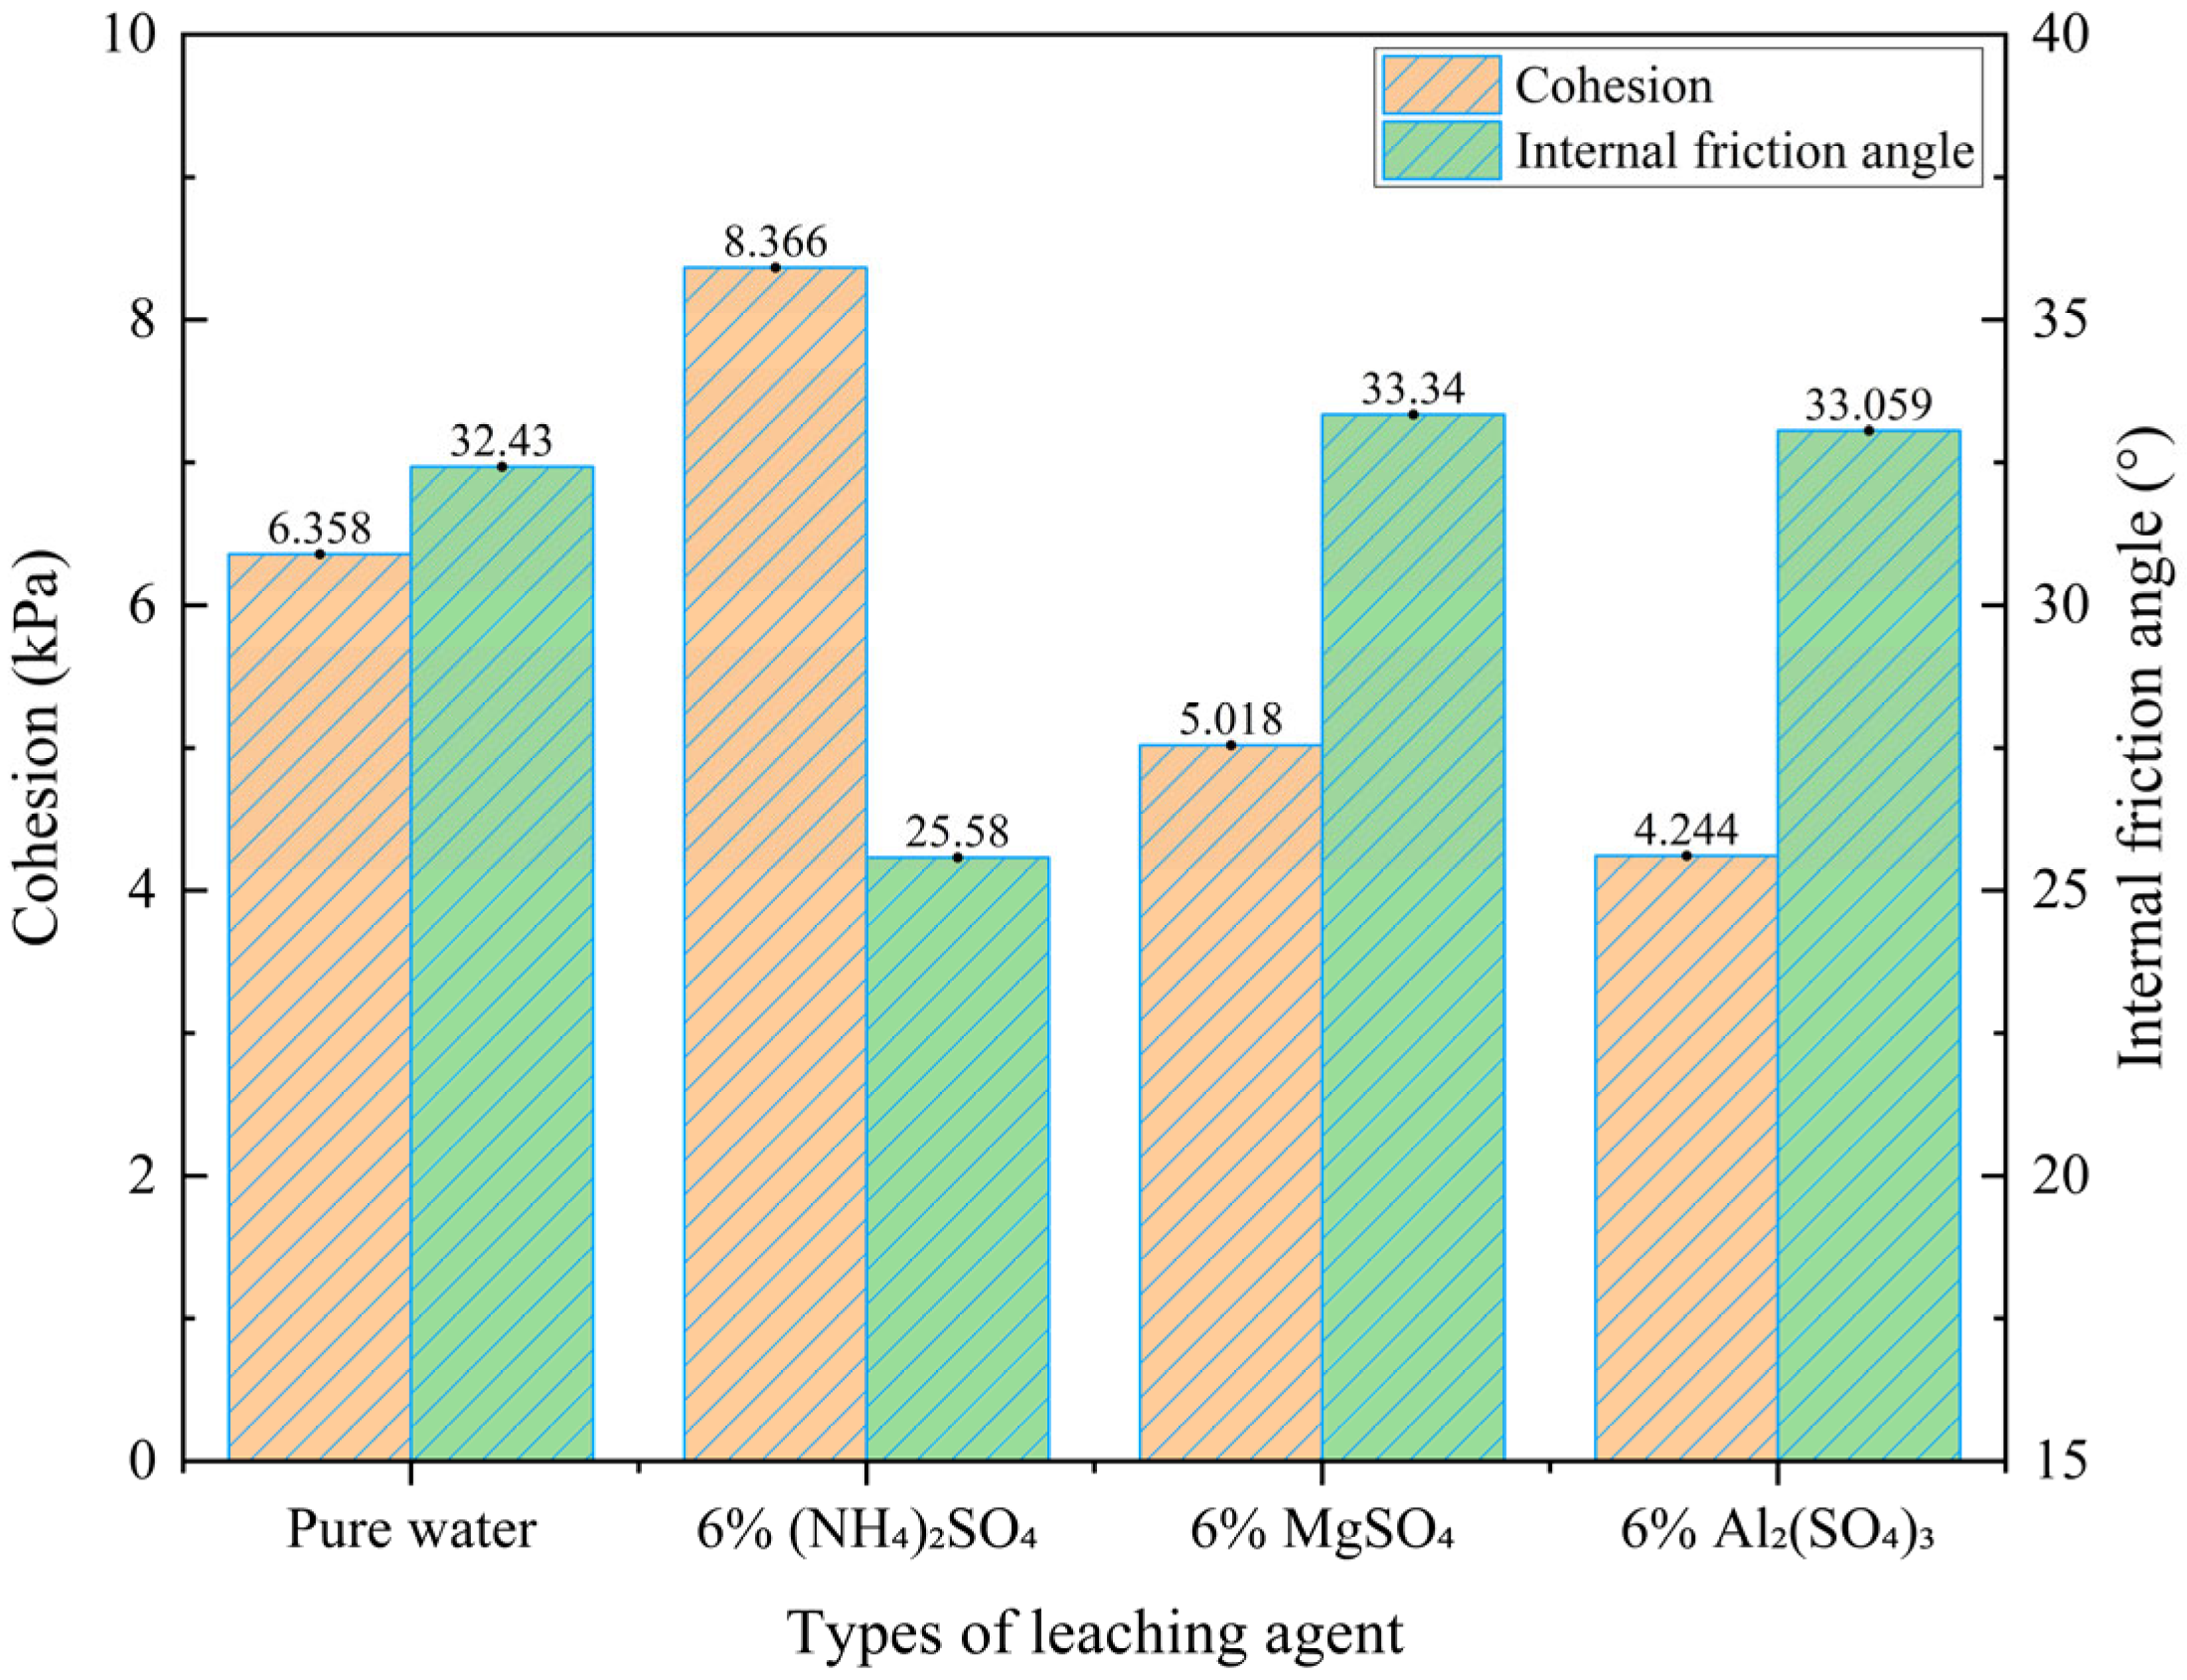
- Analysis of Shear Strength Parameters under Different Leaching Agent Conditions
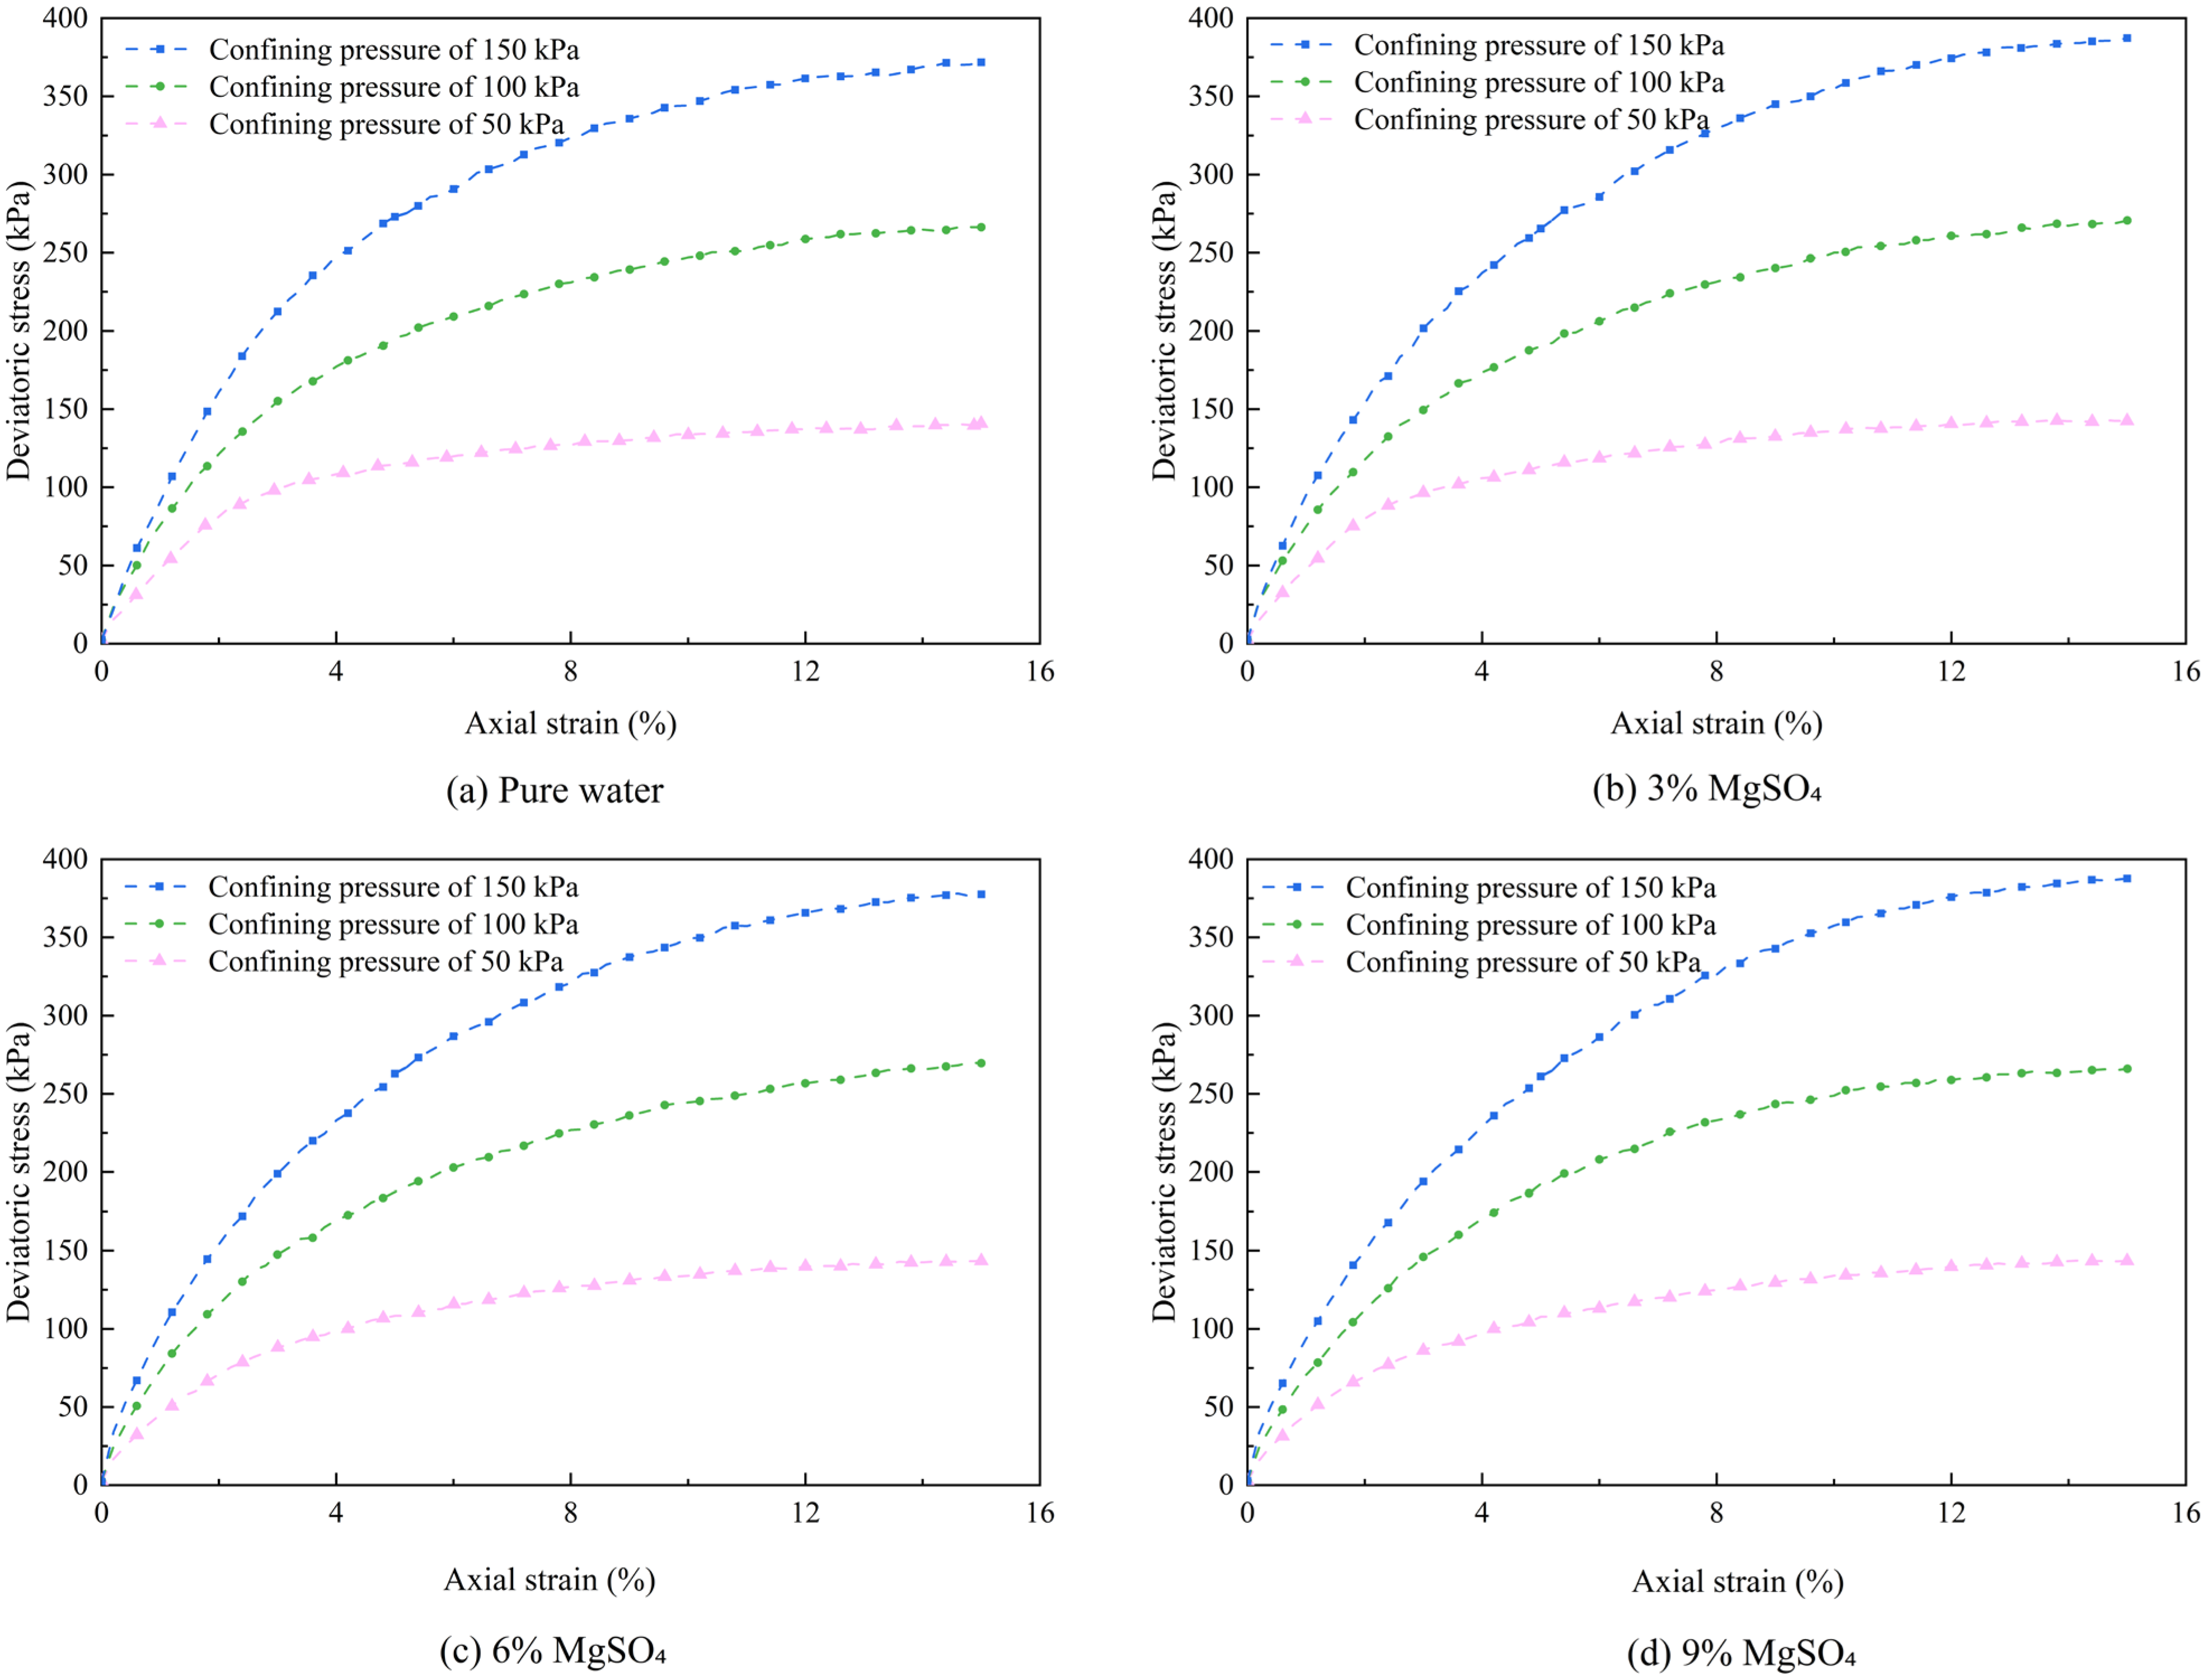
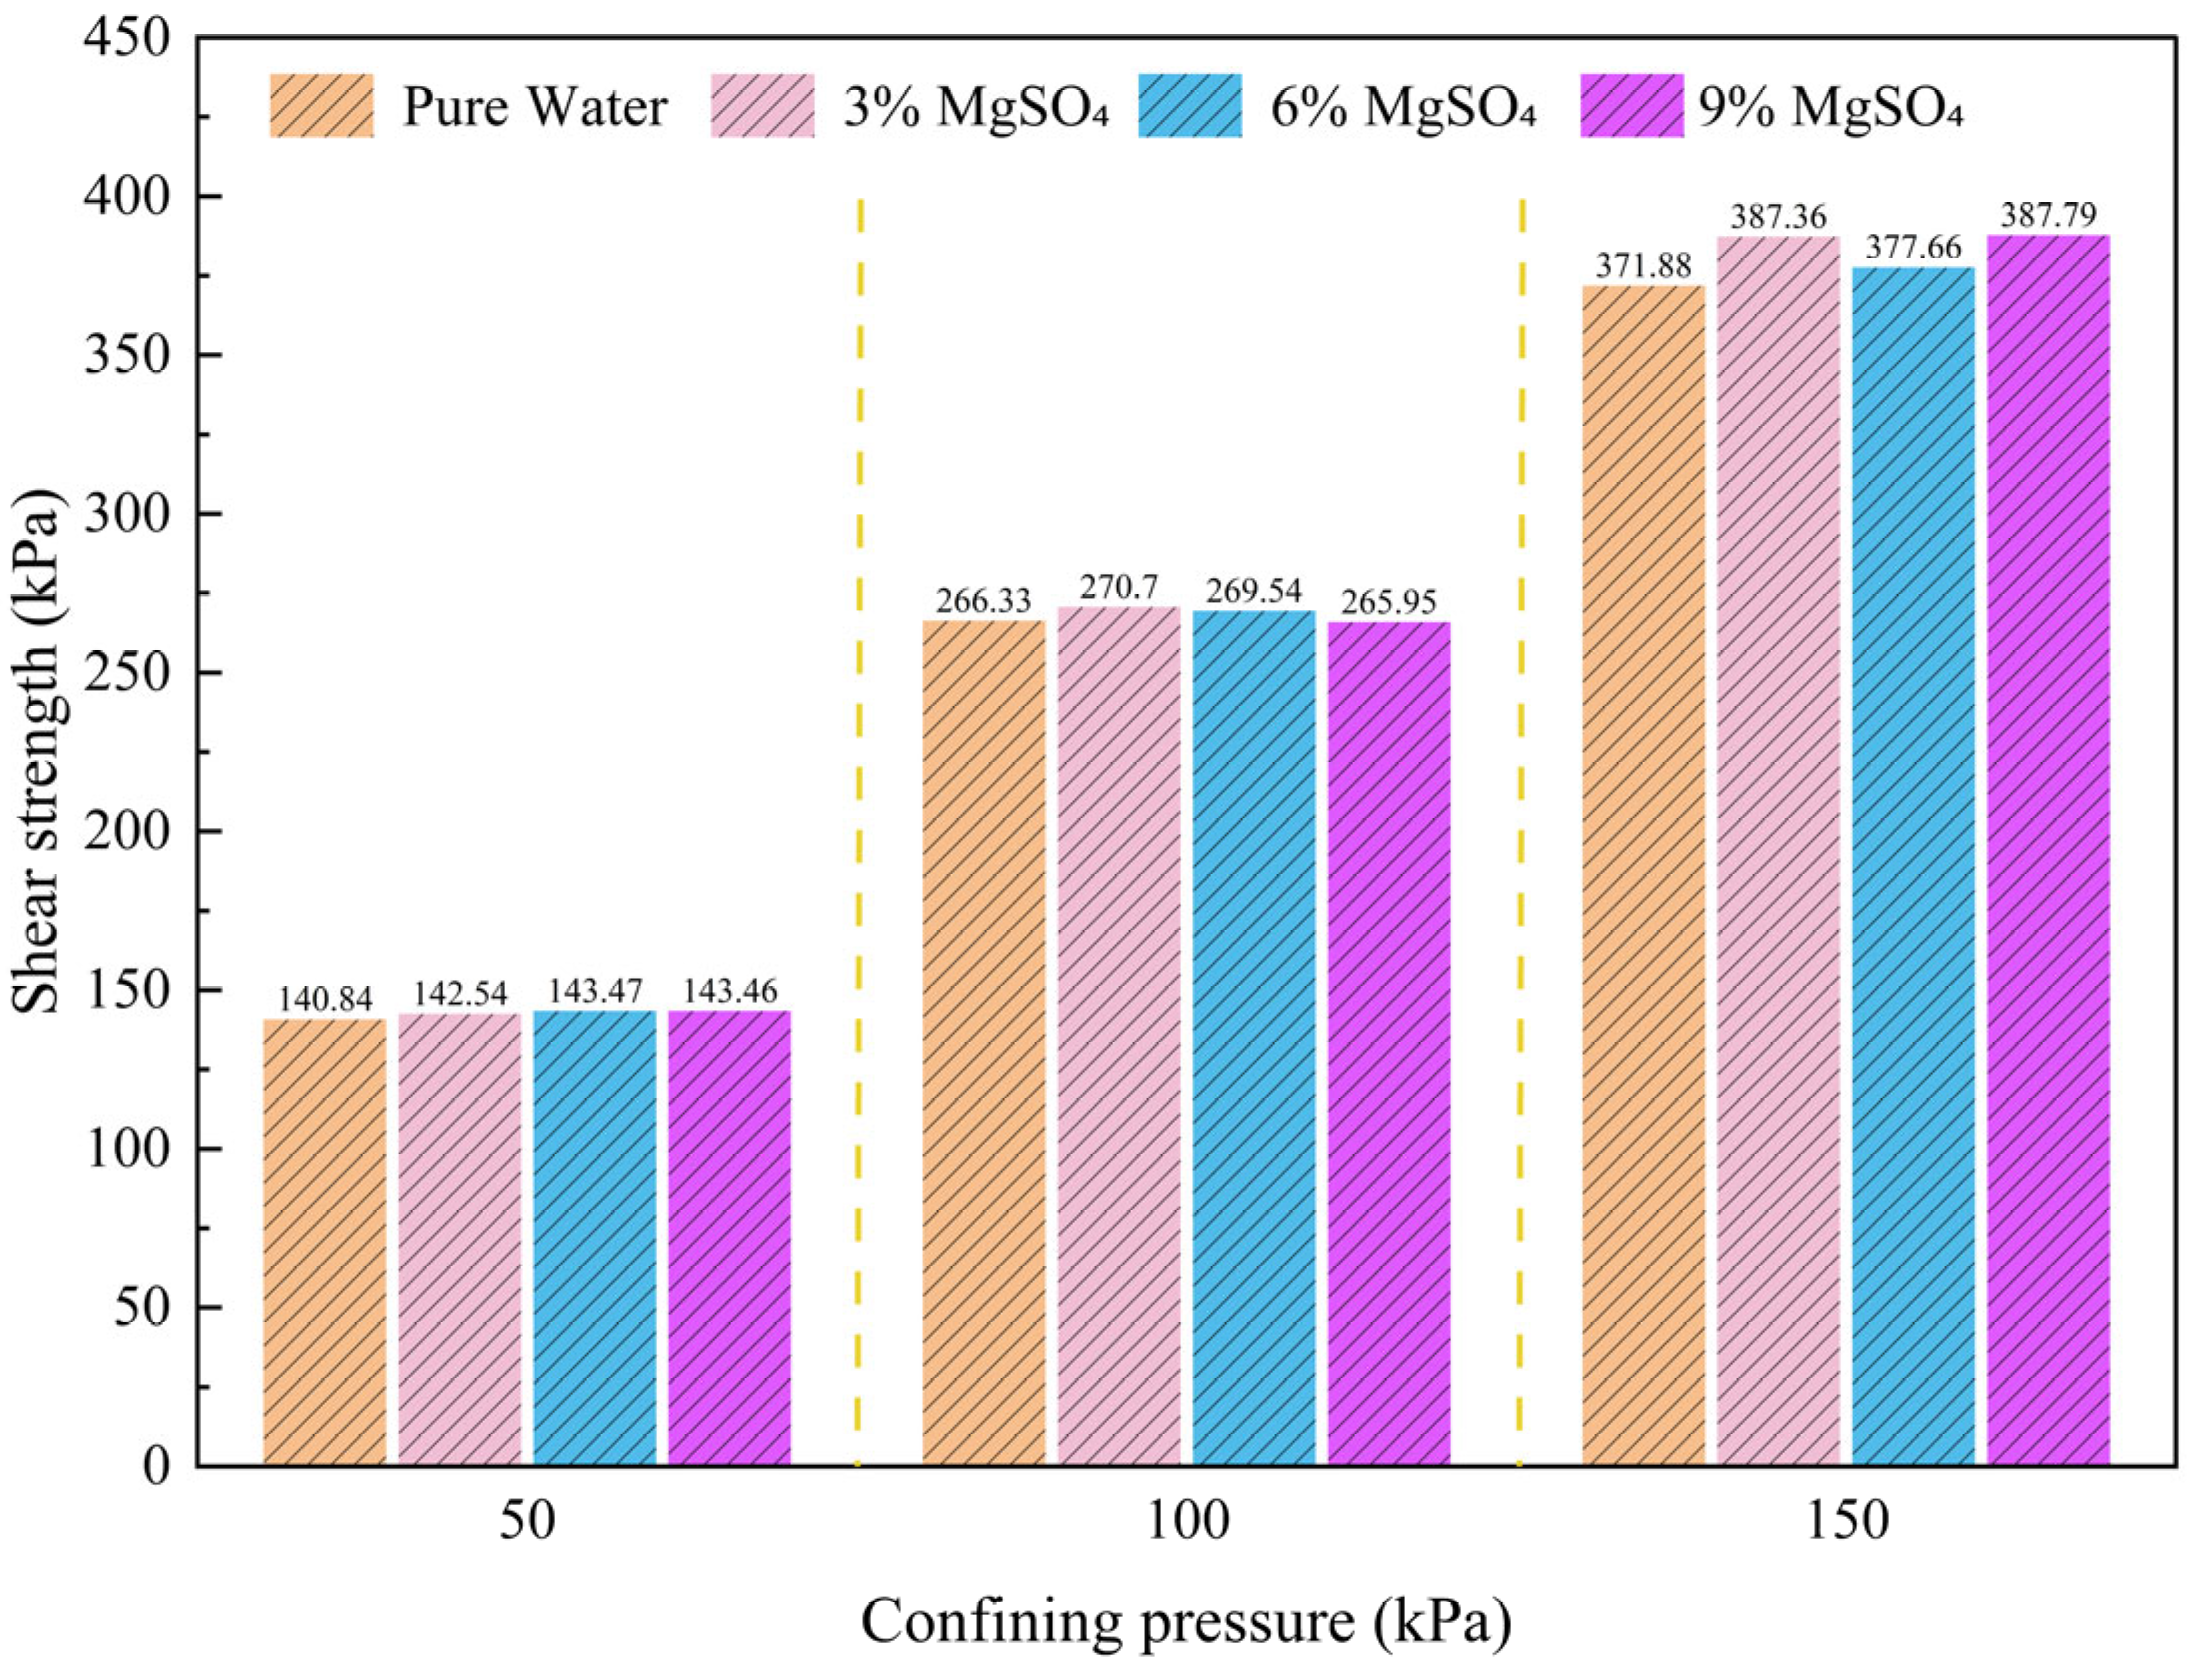
3.2. Effect of Different MgSO4 Concentrations on the Shear Strength of Ionic Rare Earth Ores
- Shear Strength Variations under Different MgSO4 Concentrations
- 2.
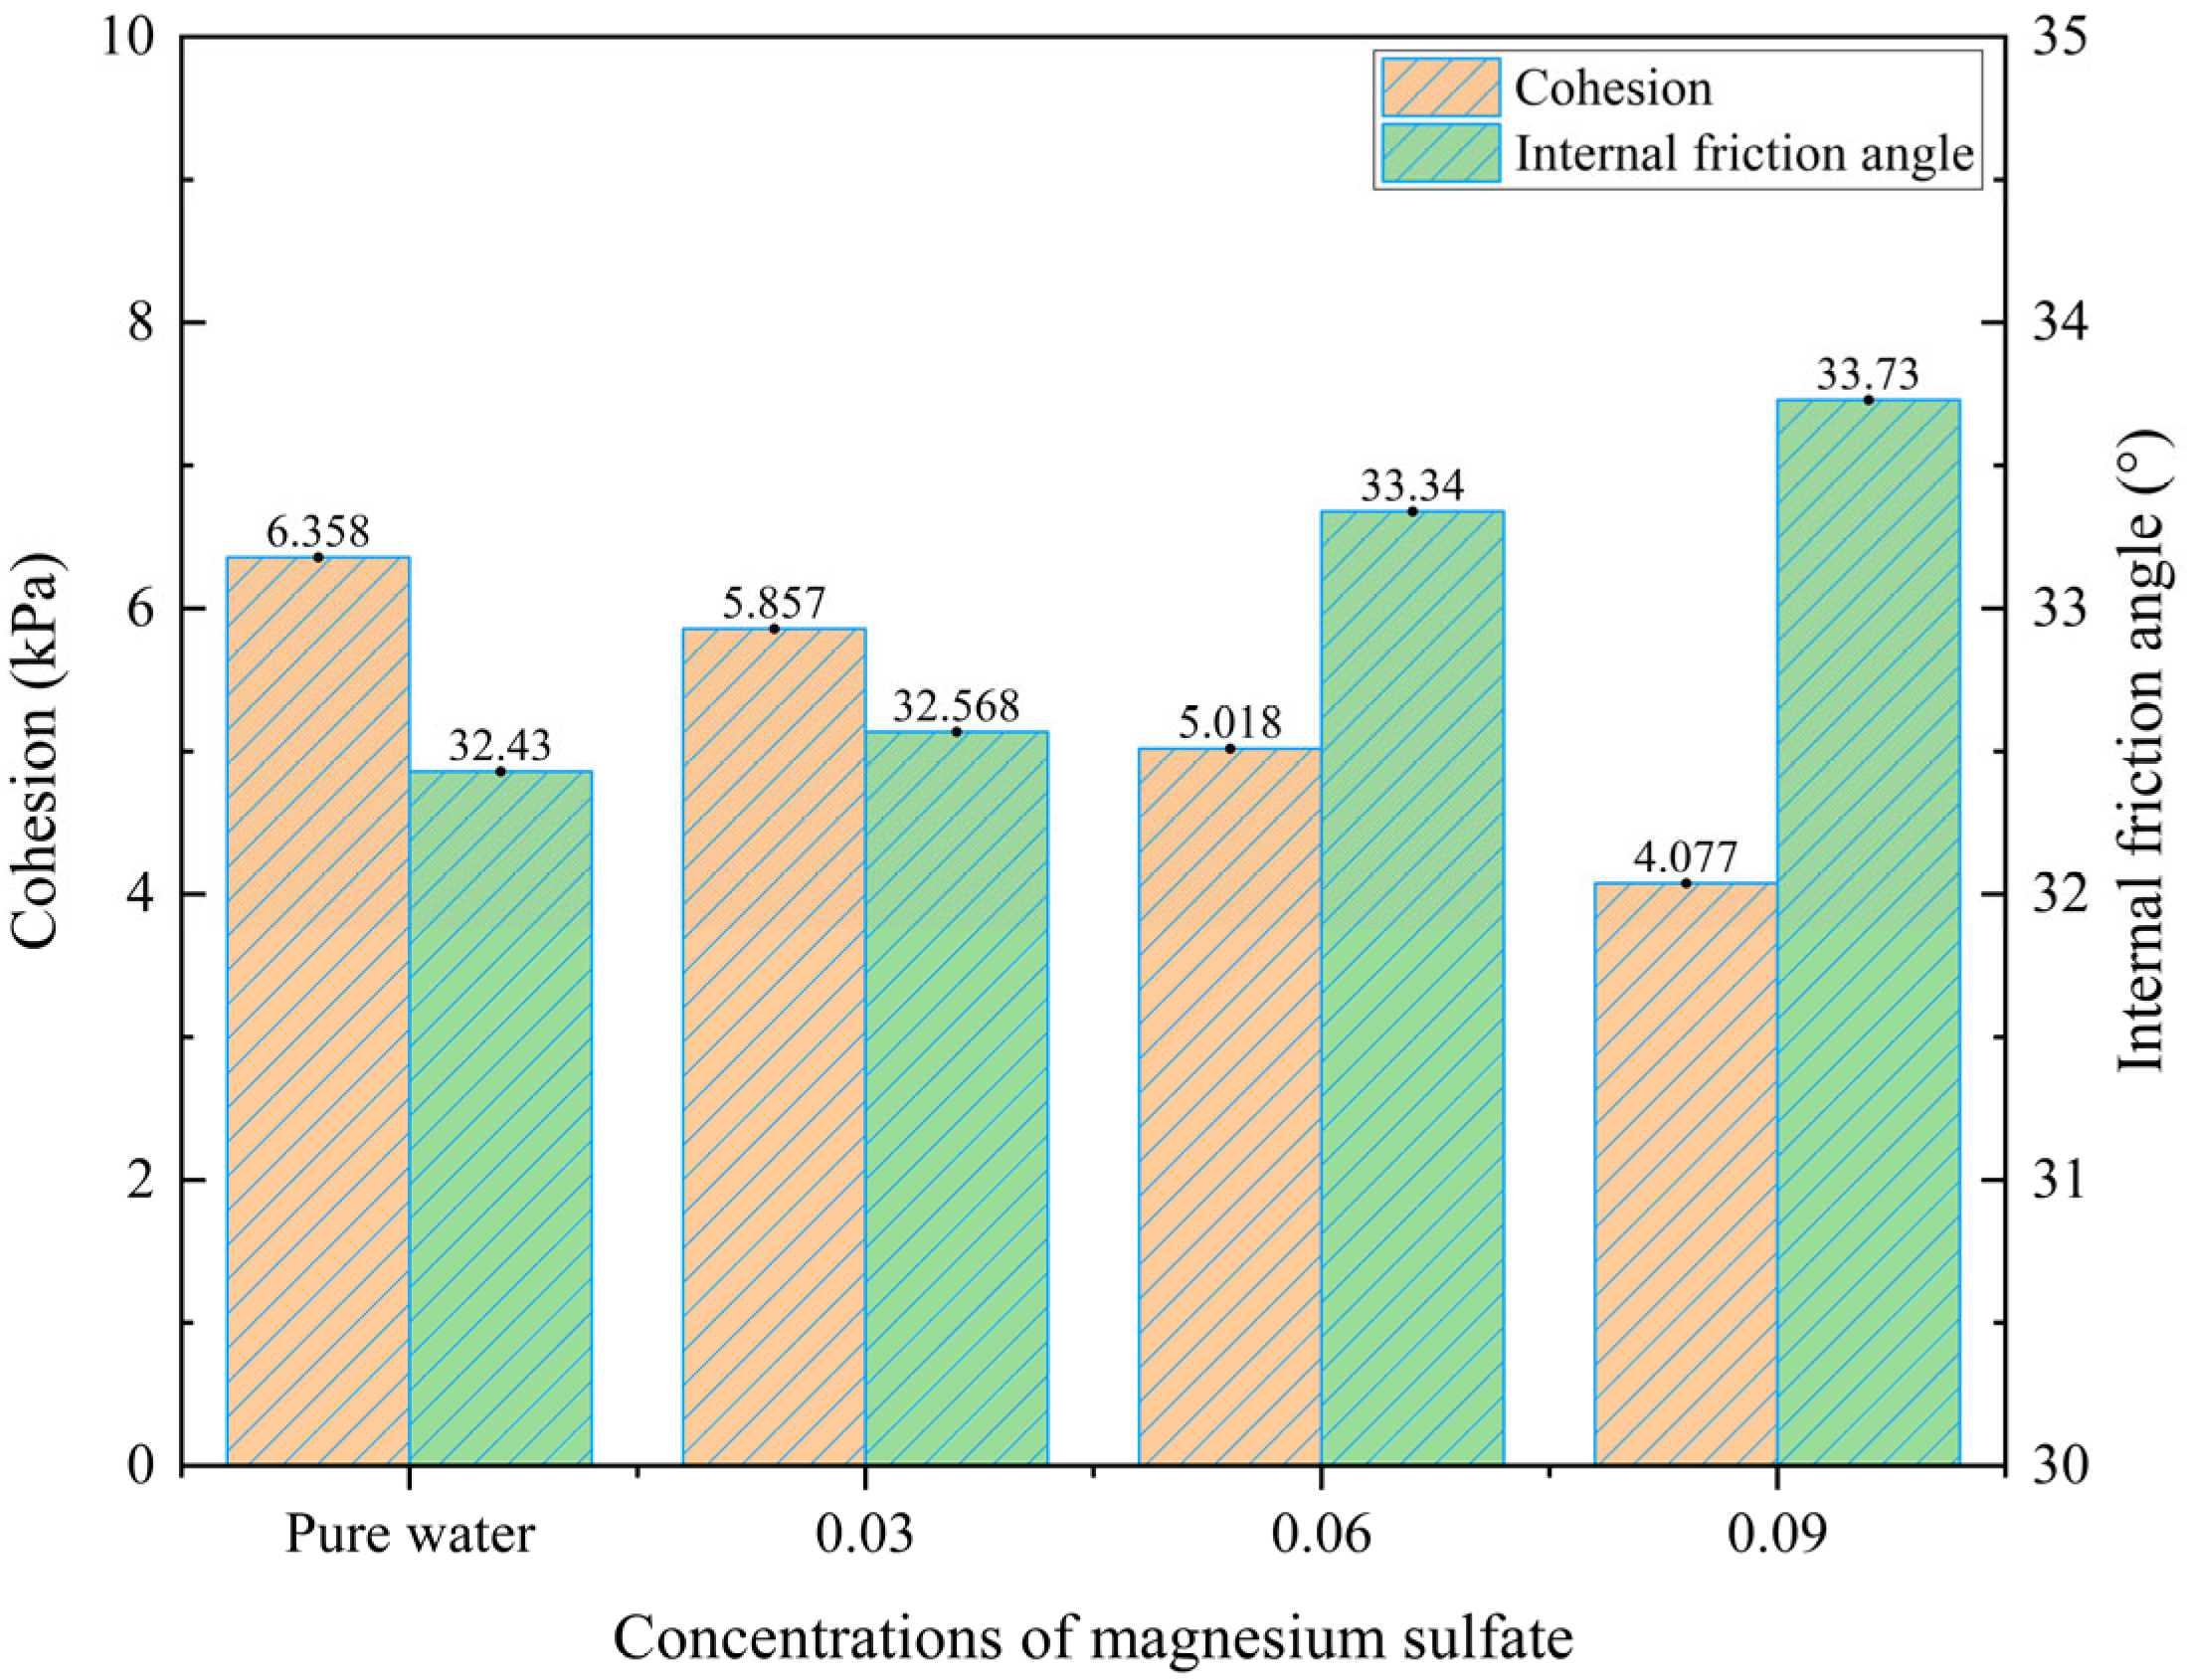
- Analysis of Shear Strength Parameters under Different MgSO4 Concentrations
4. Microscopic Mechanism Analysis
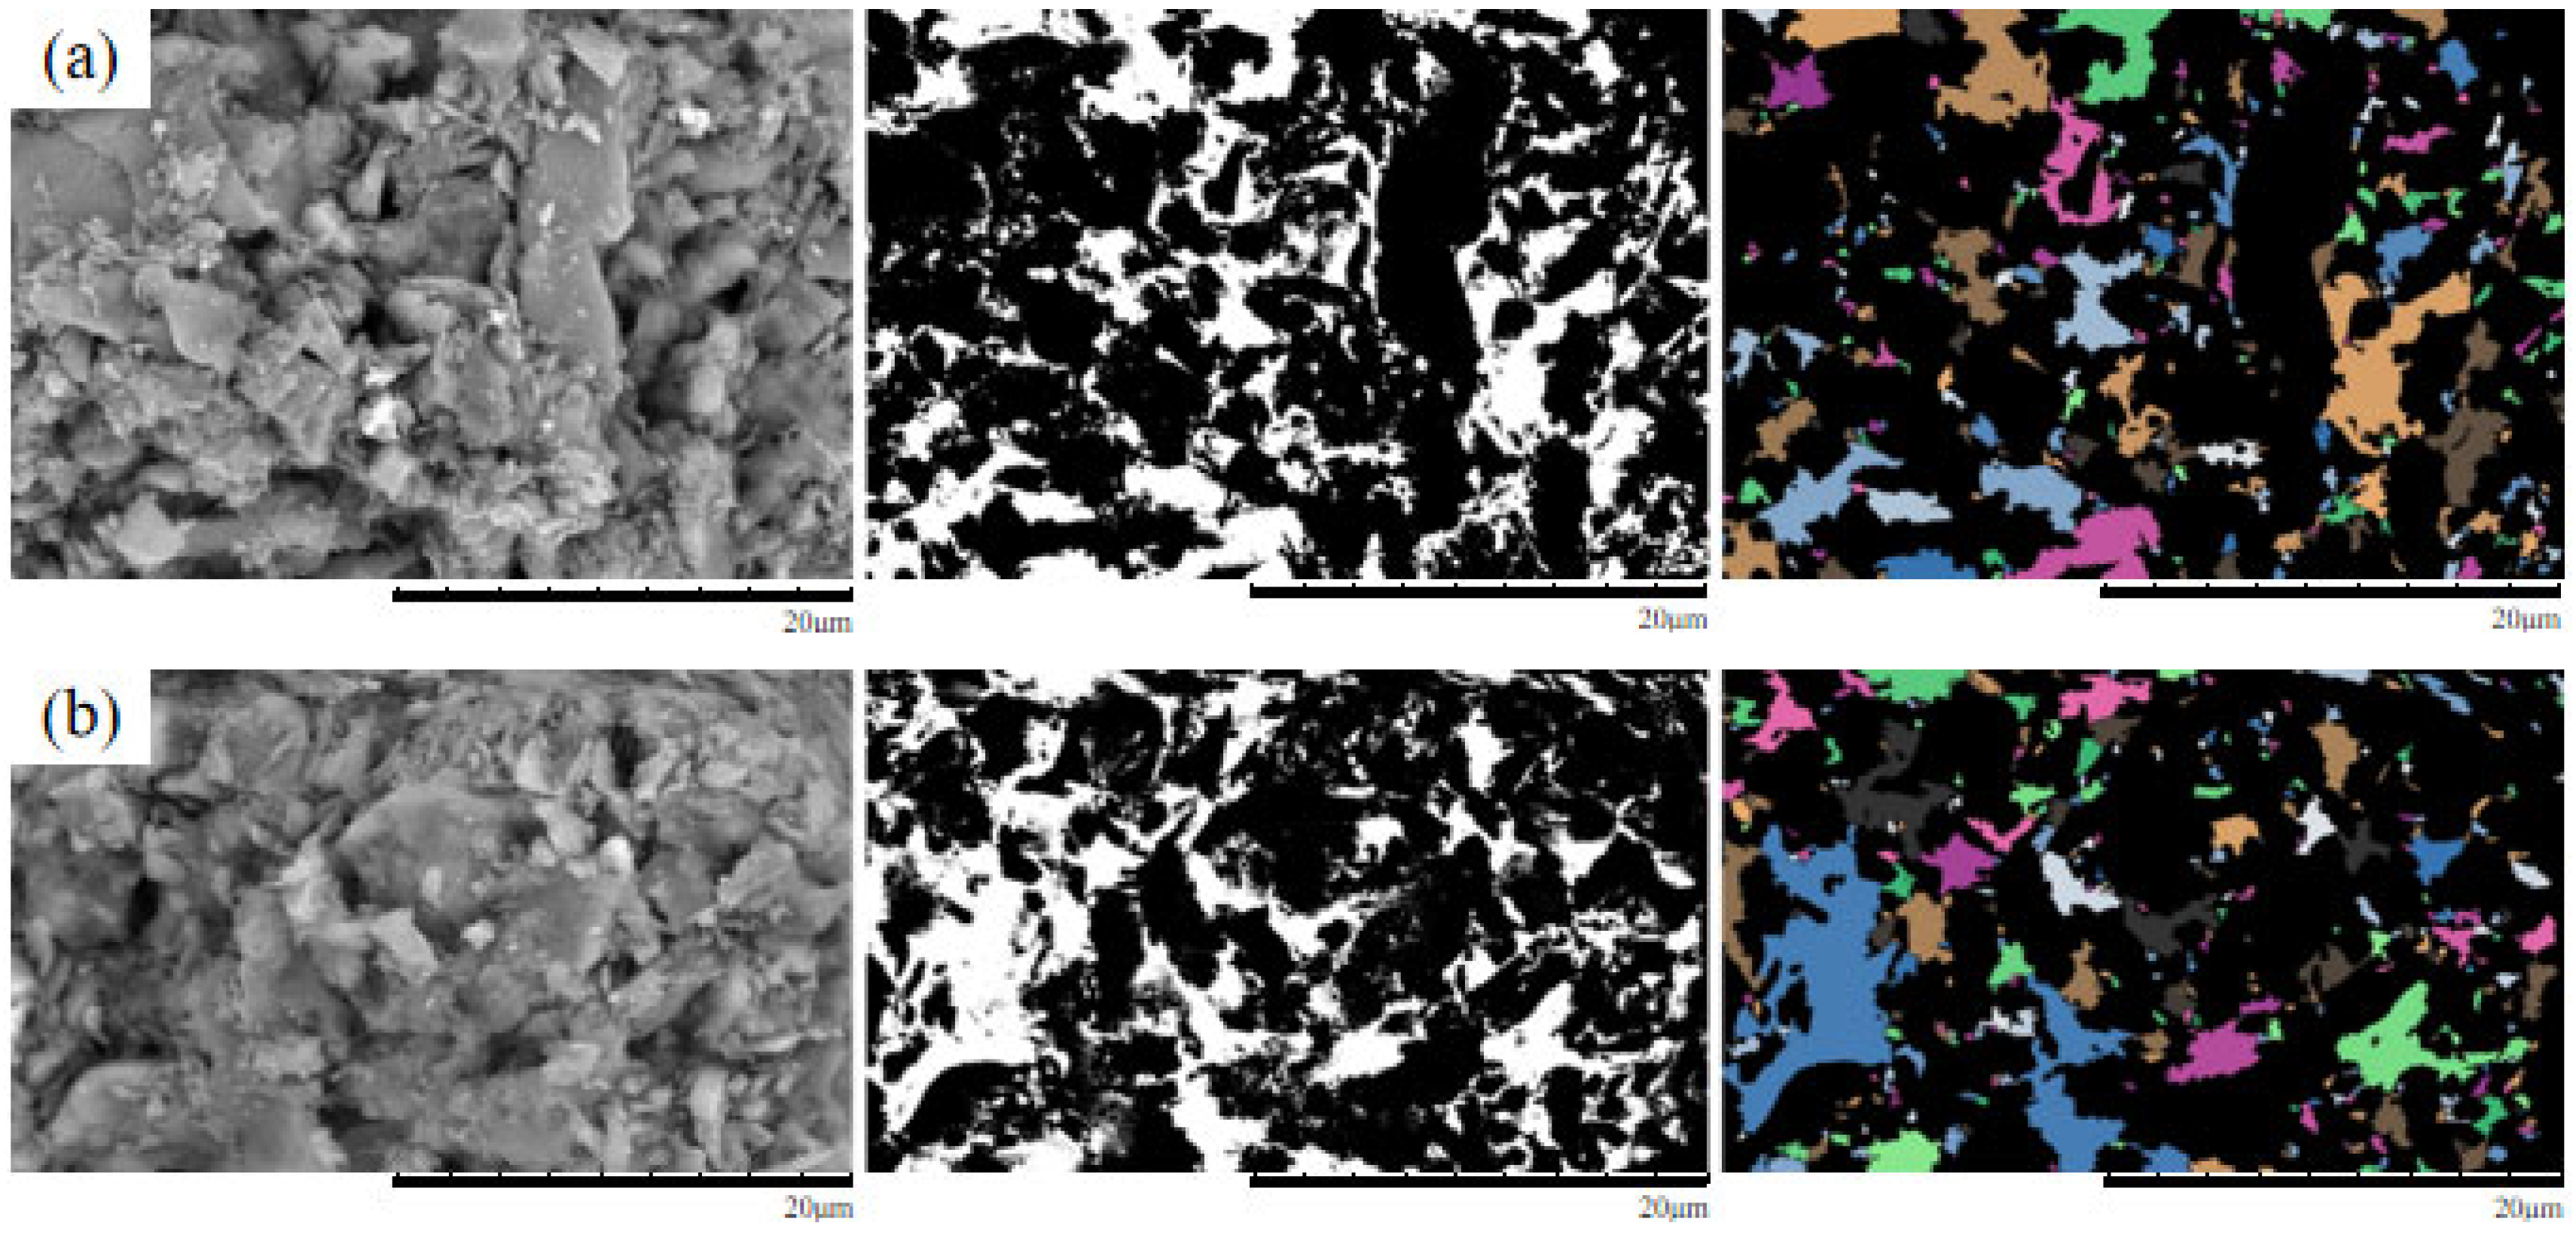
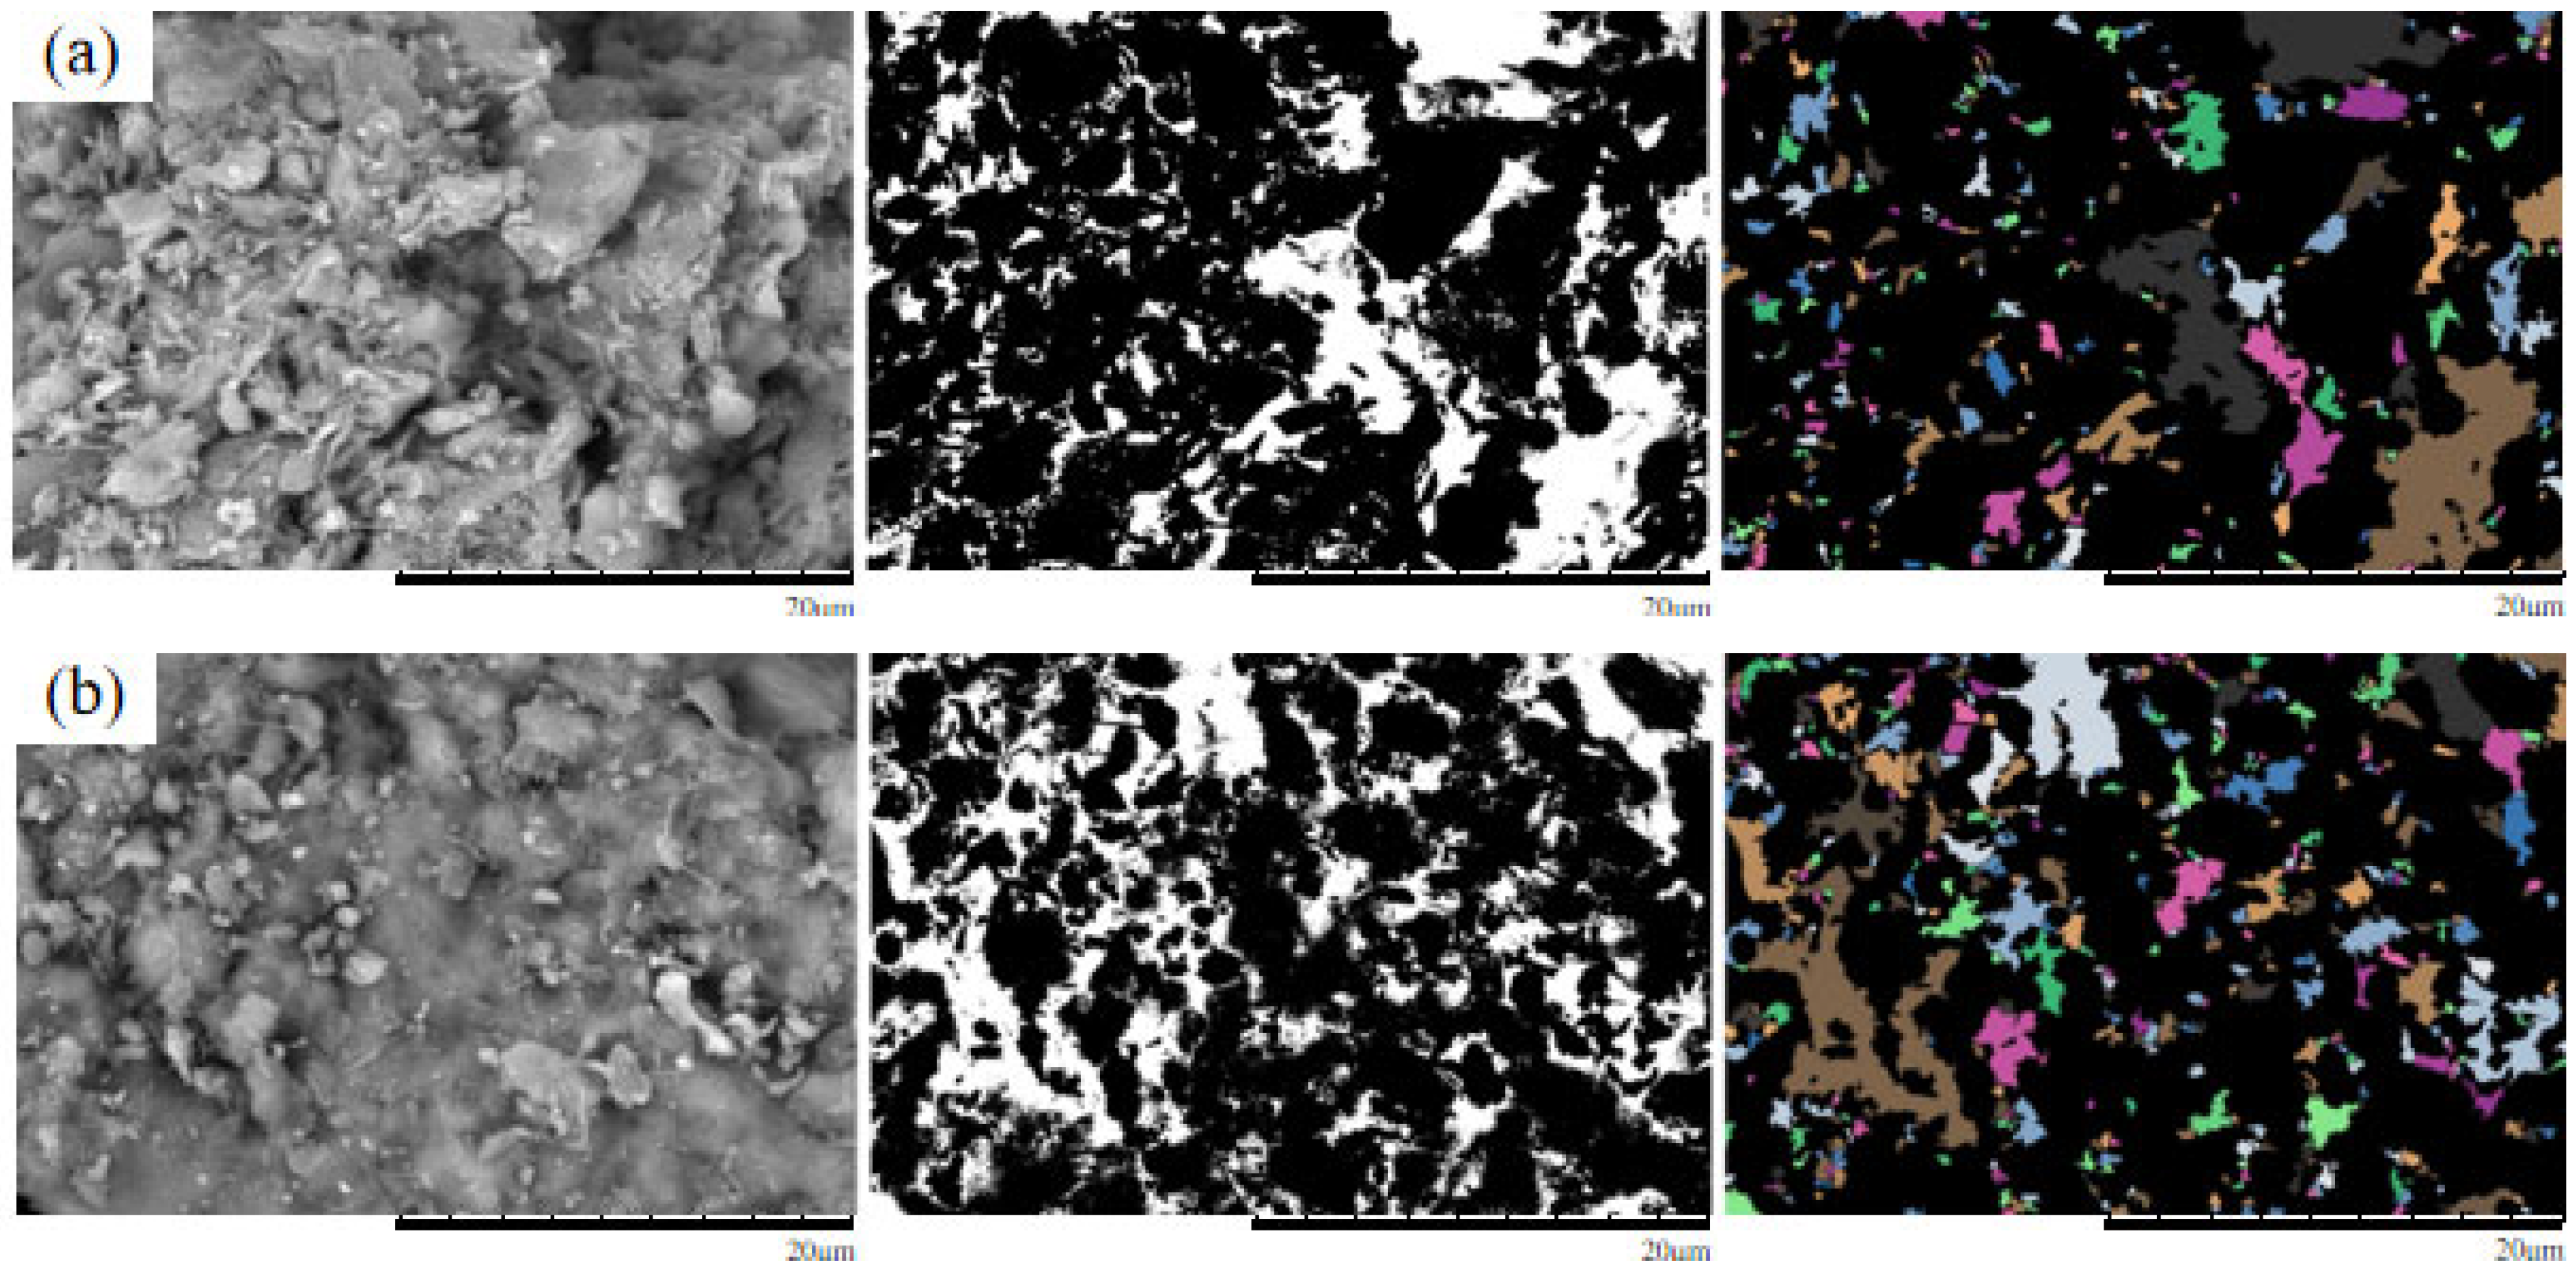
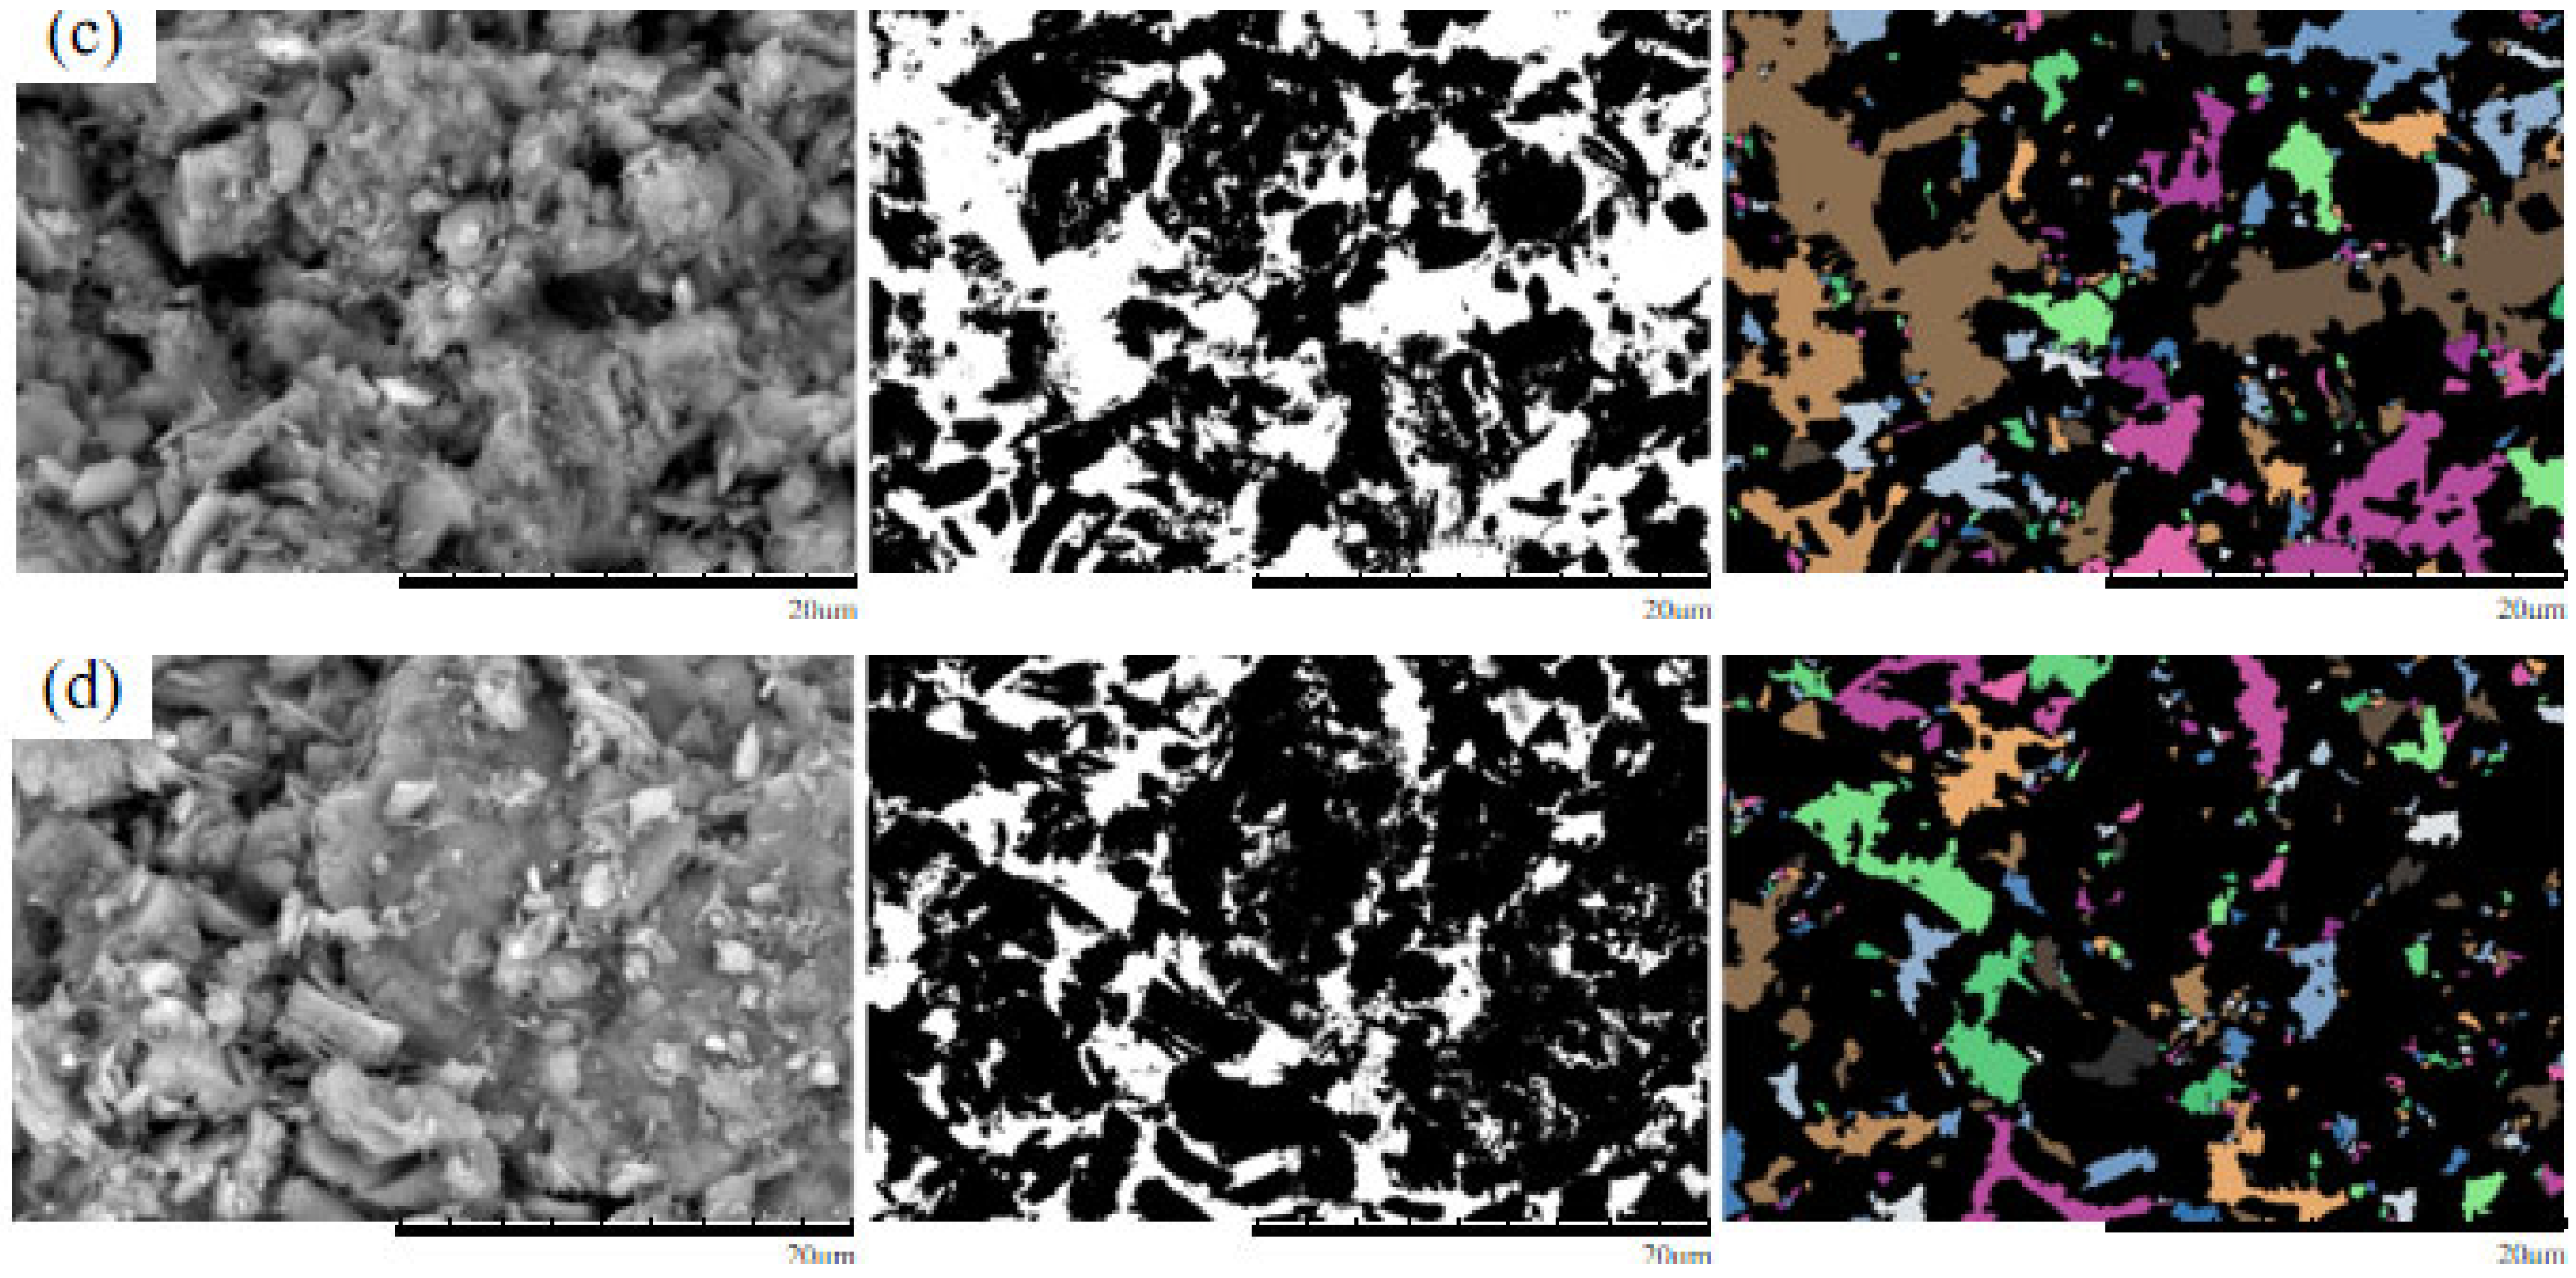
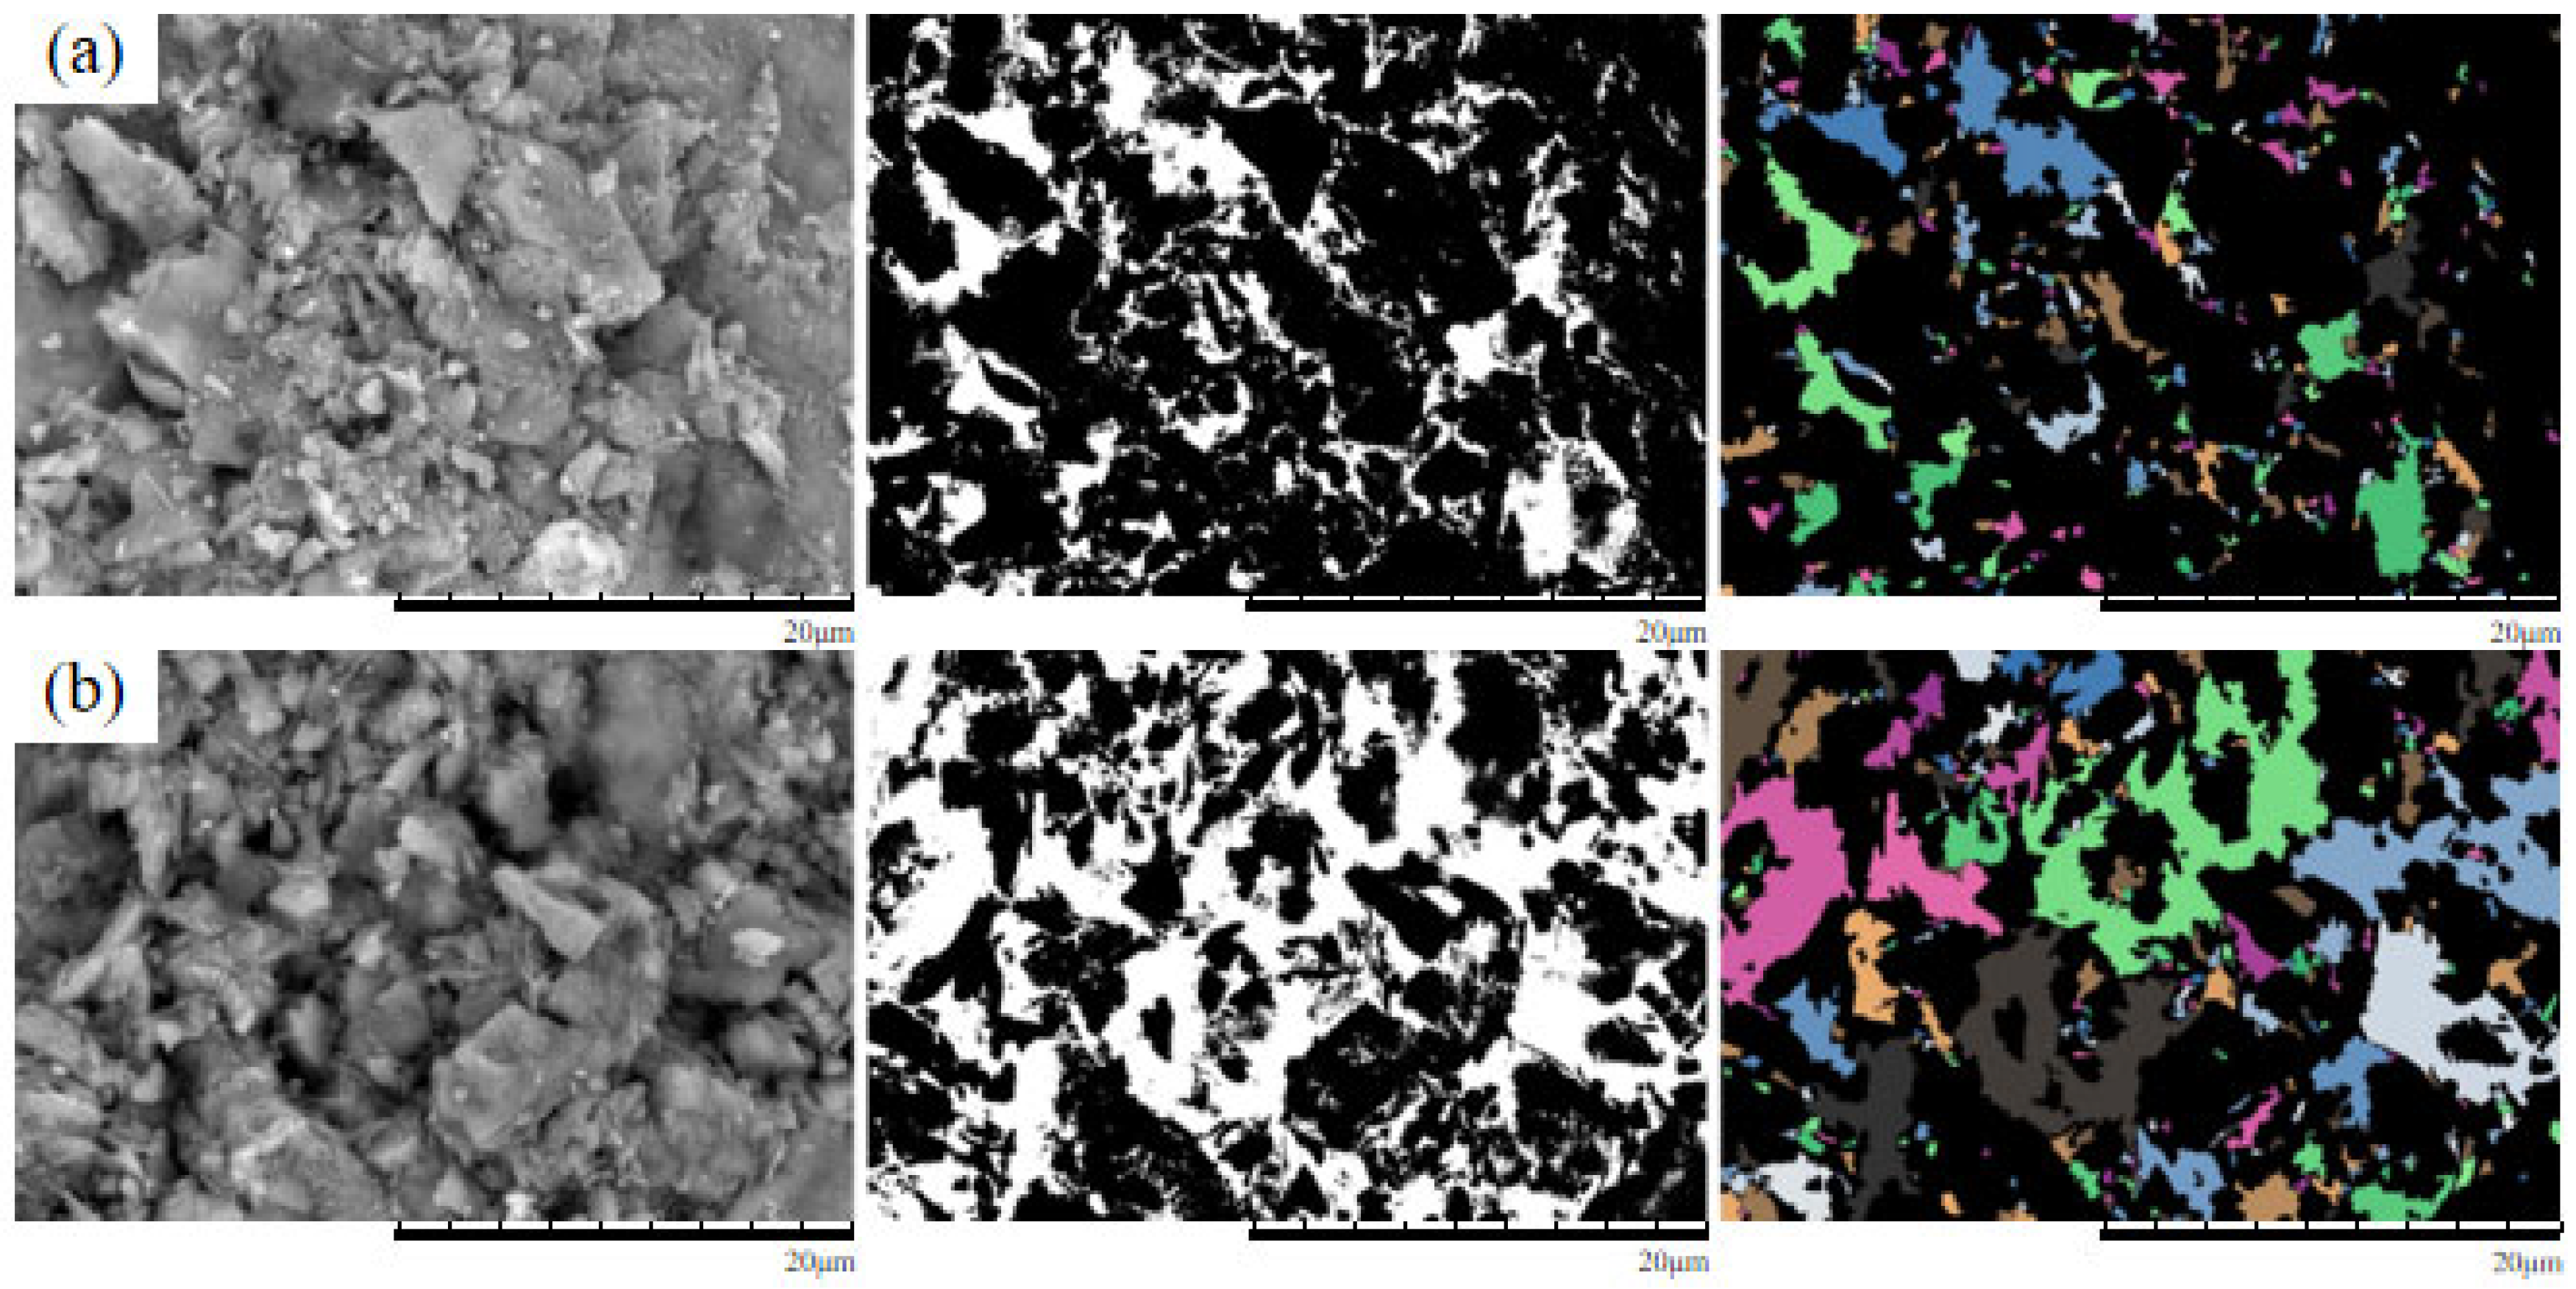
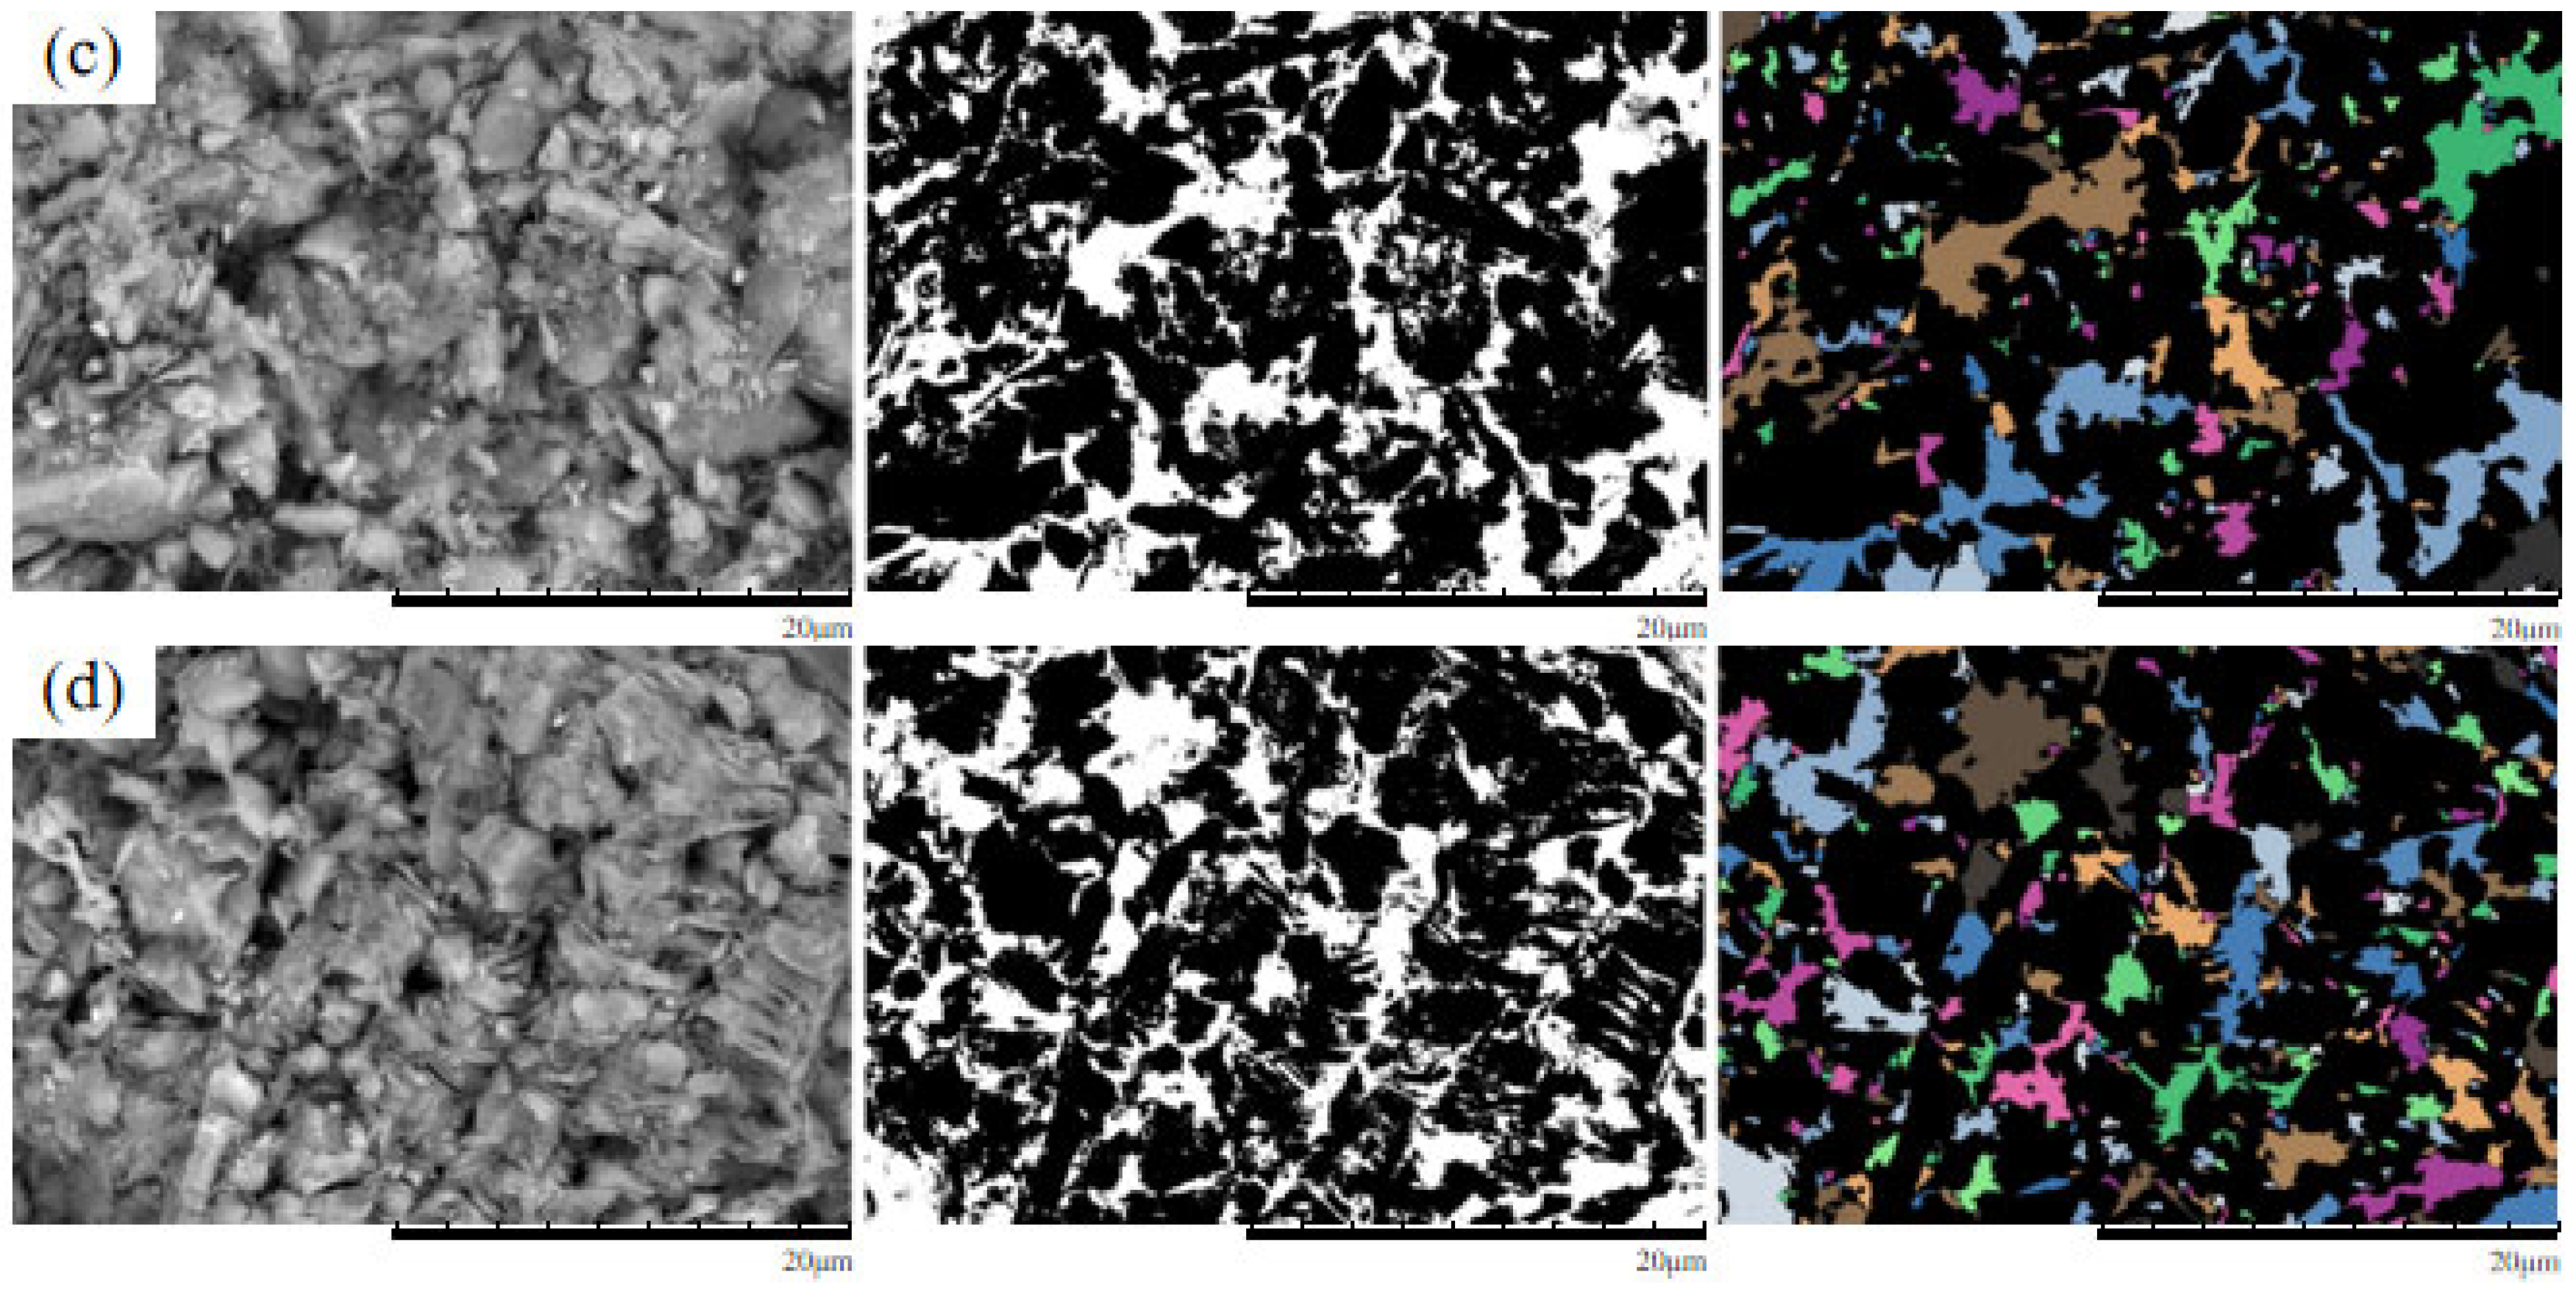
4.1. SEM Morphological Analysis Under Different MgSO4 Concentrations
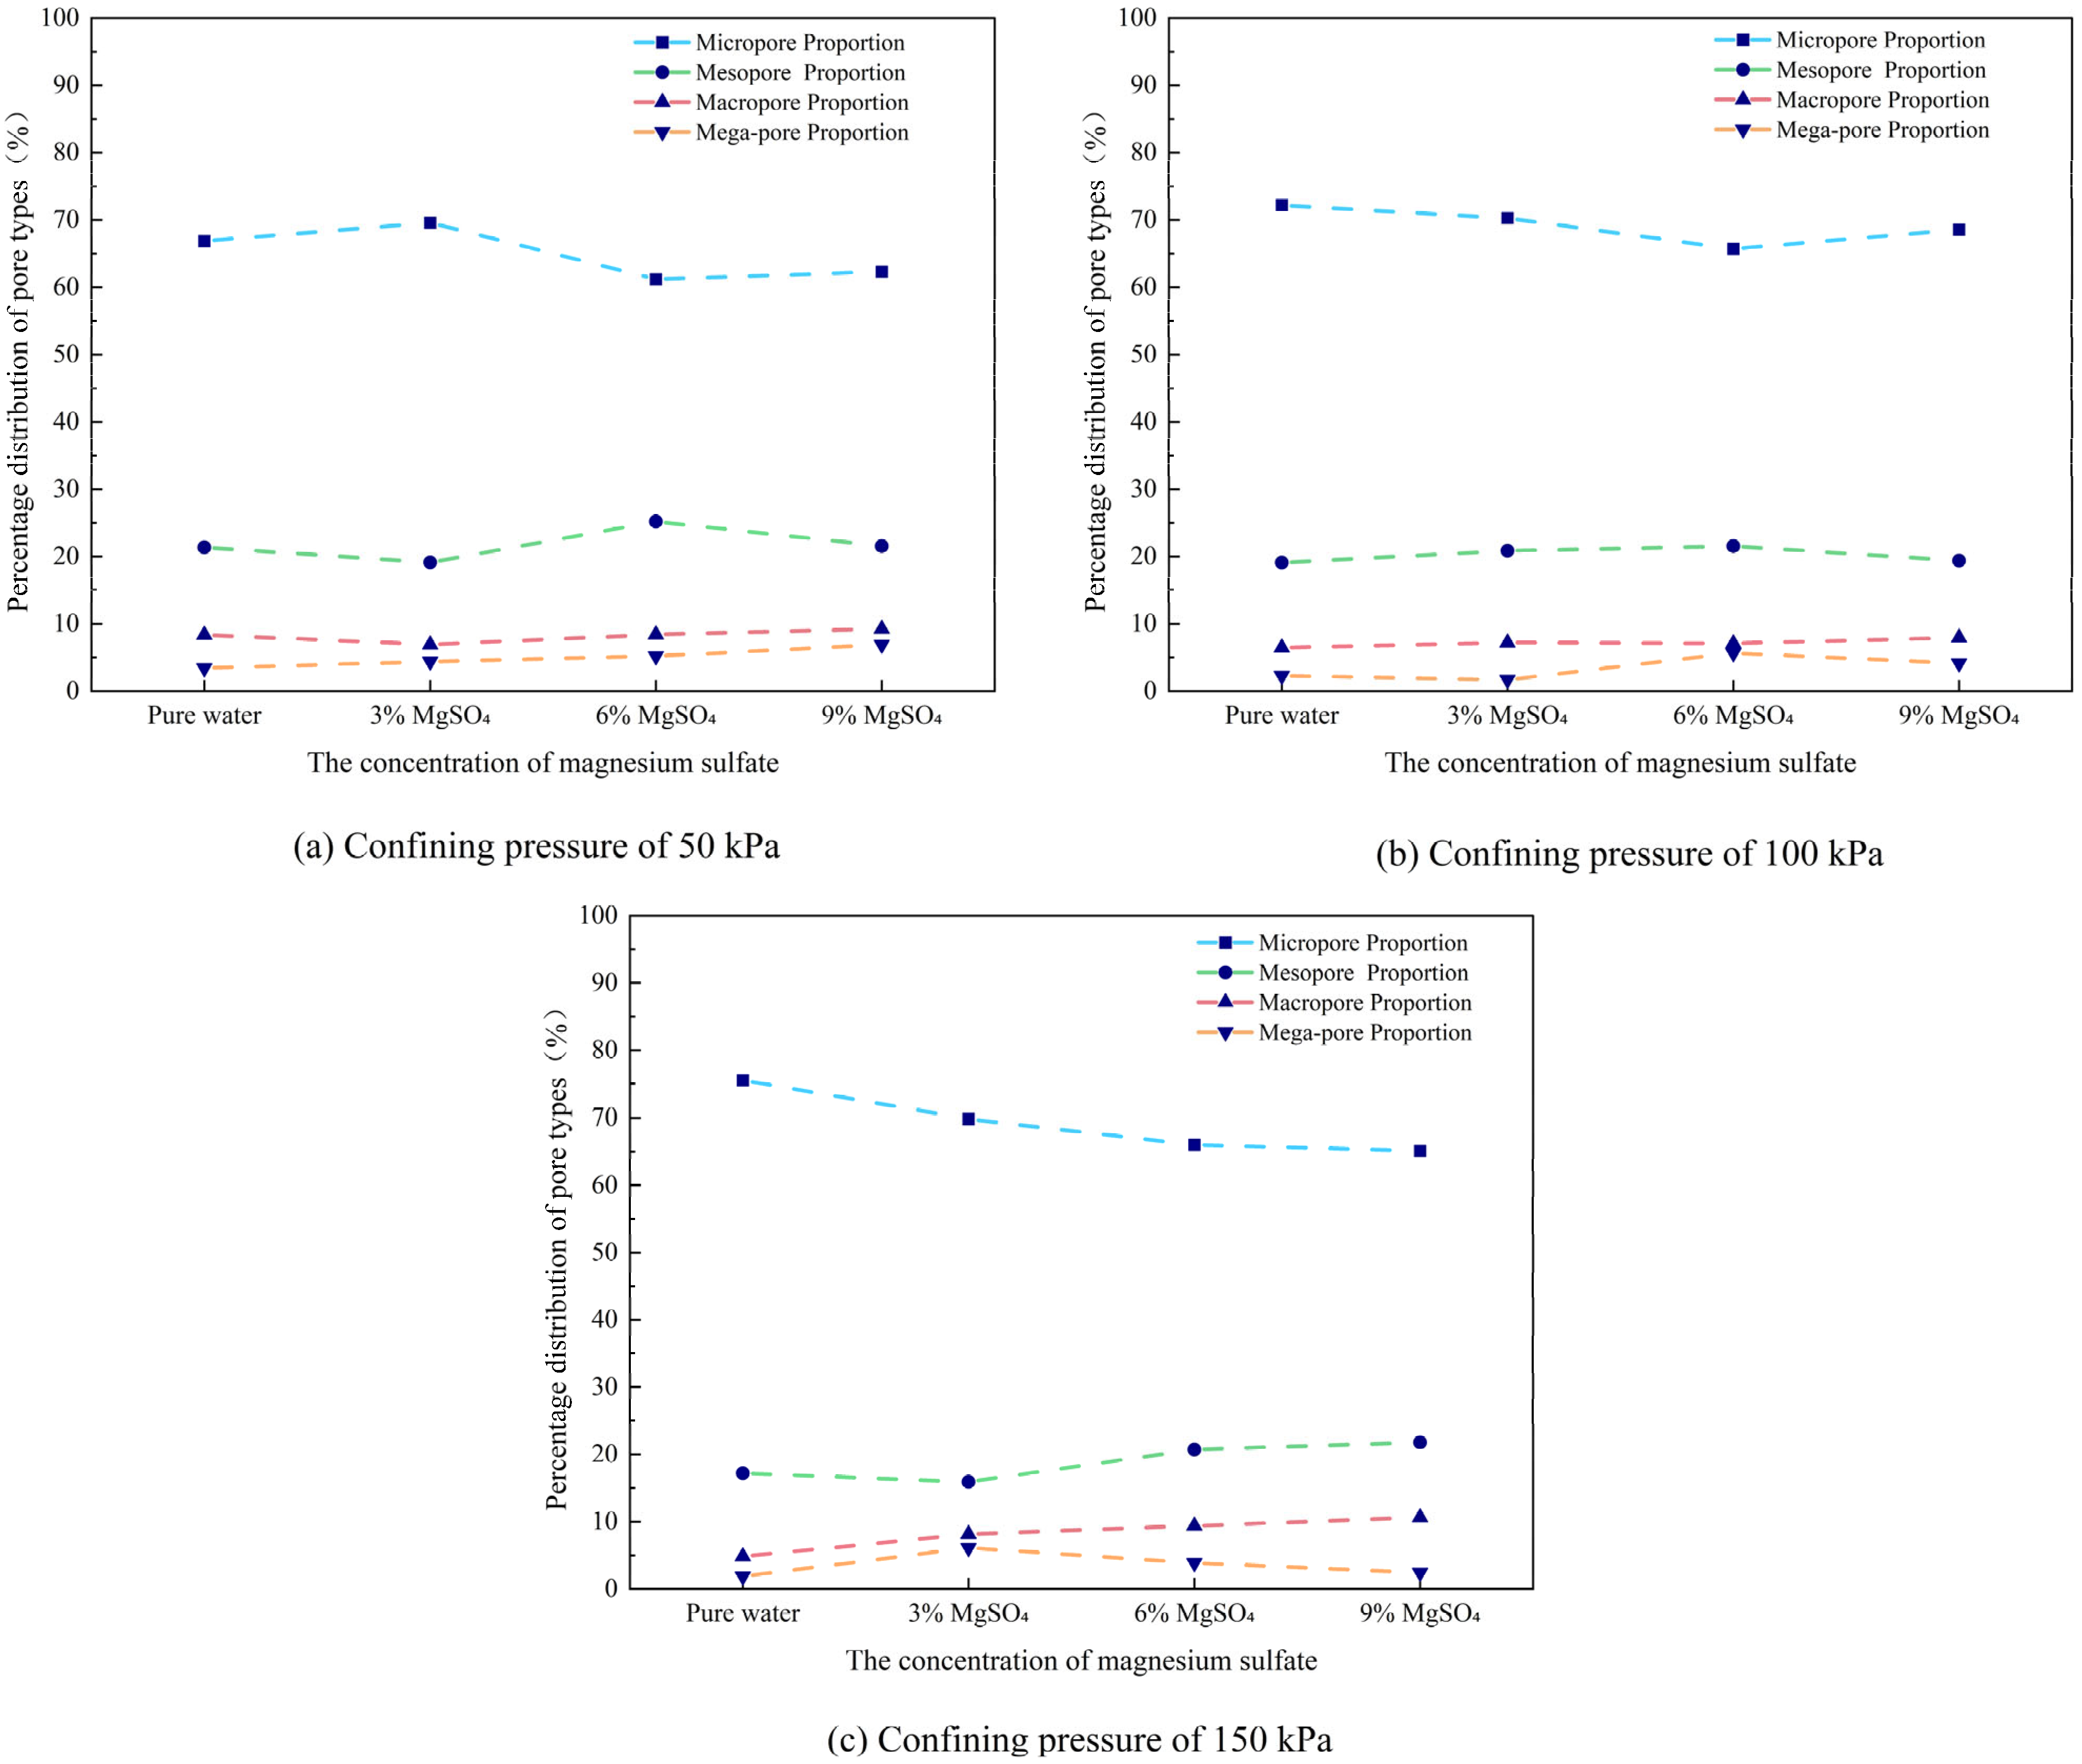
4.2. Quantitative Analysis of Microscopic Pore Structure
- Pore proportion
- 2.
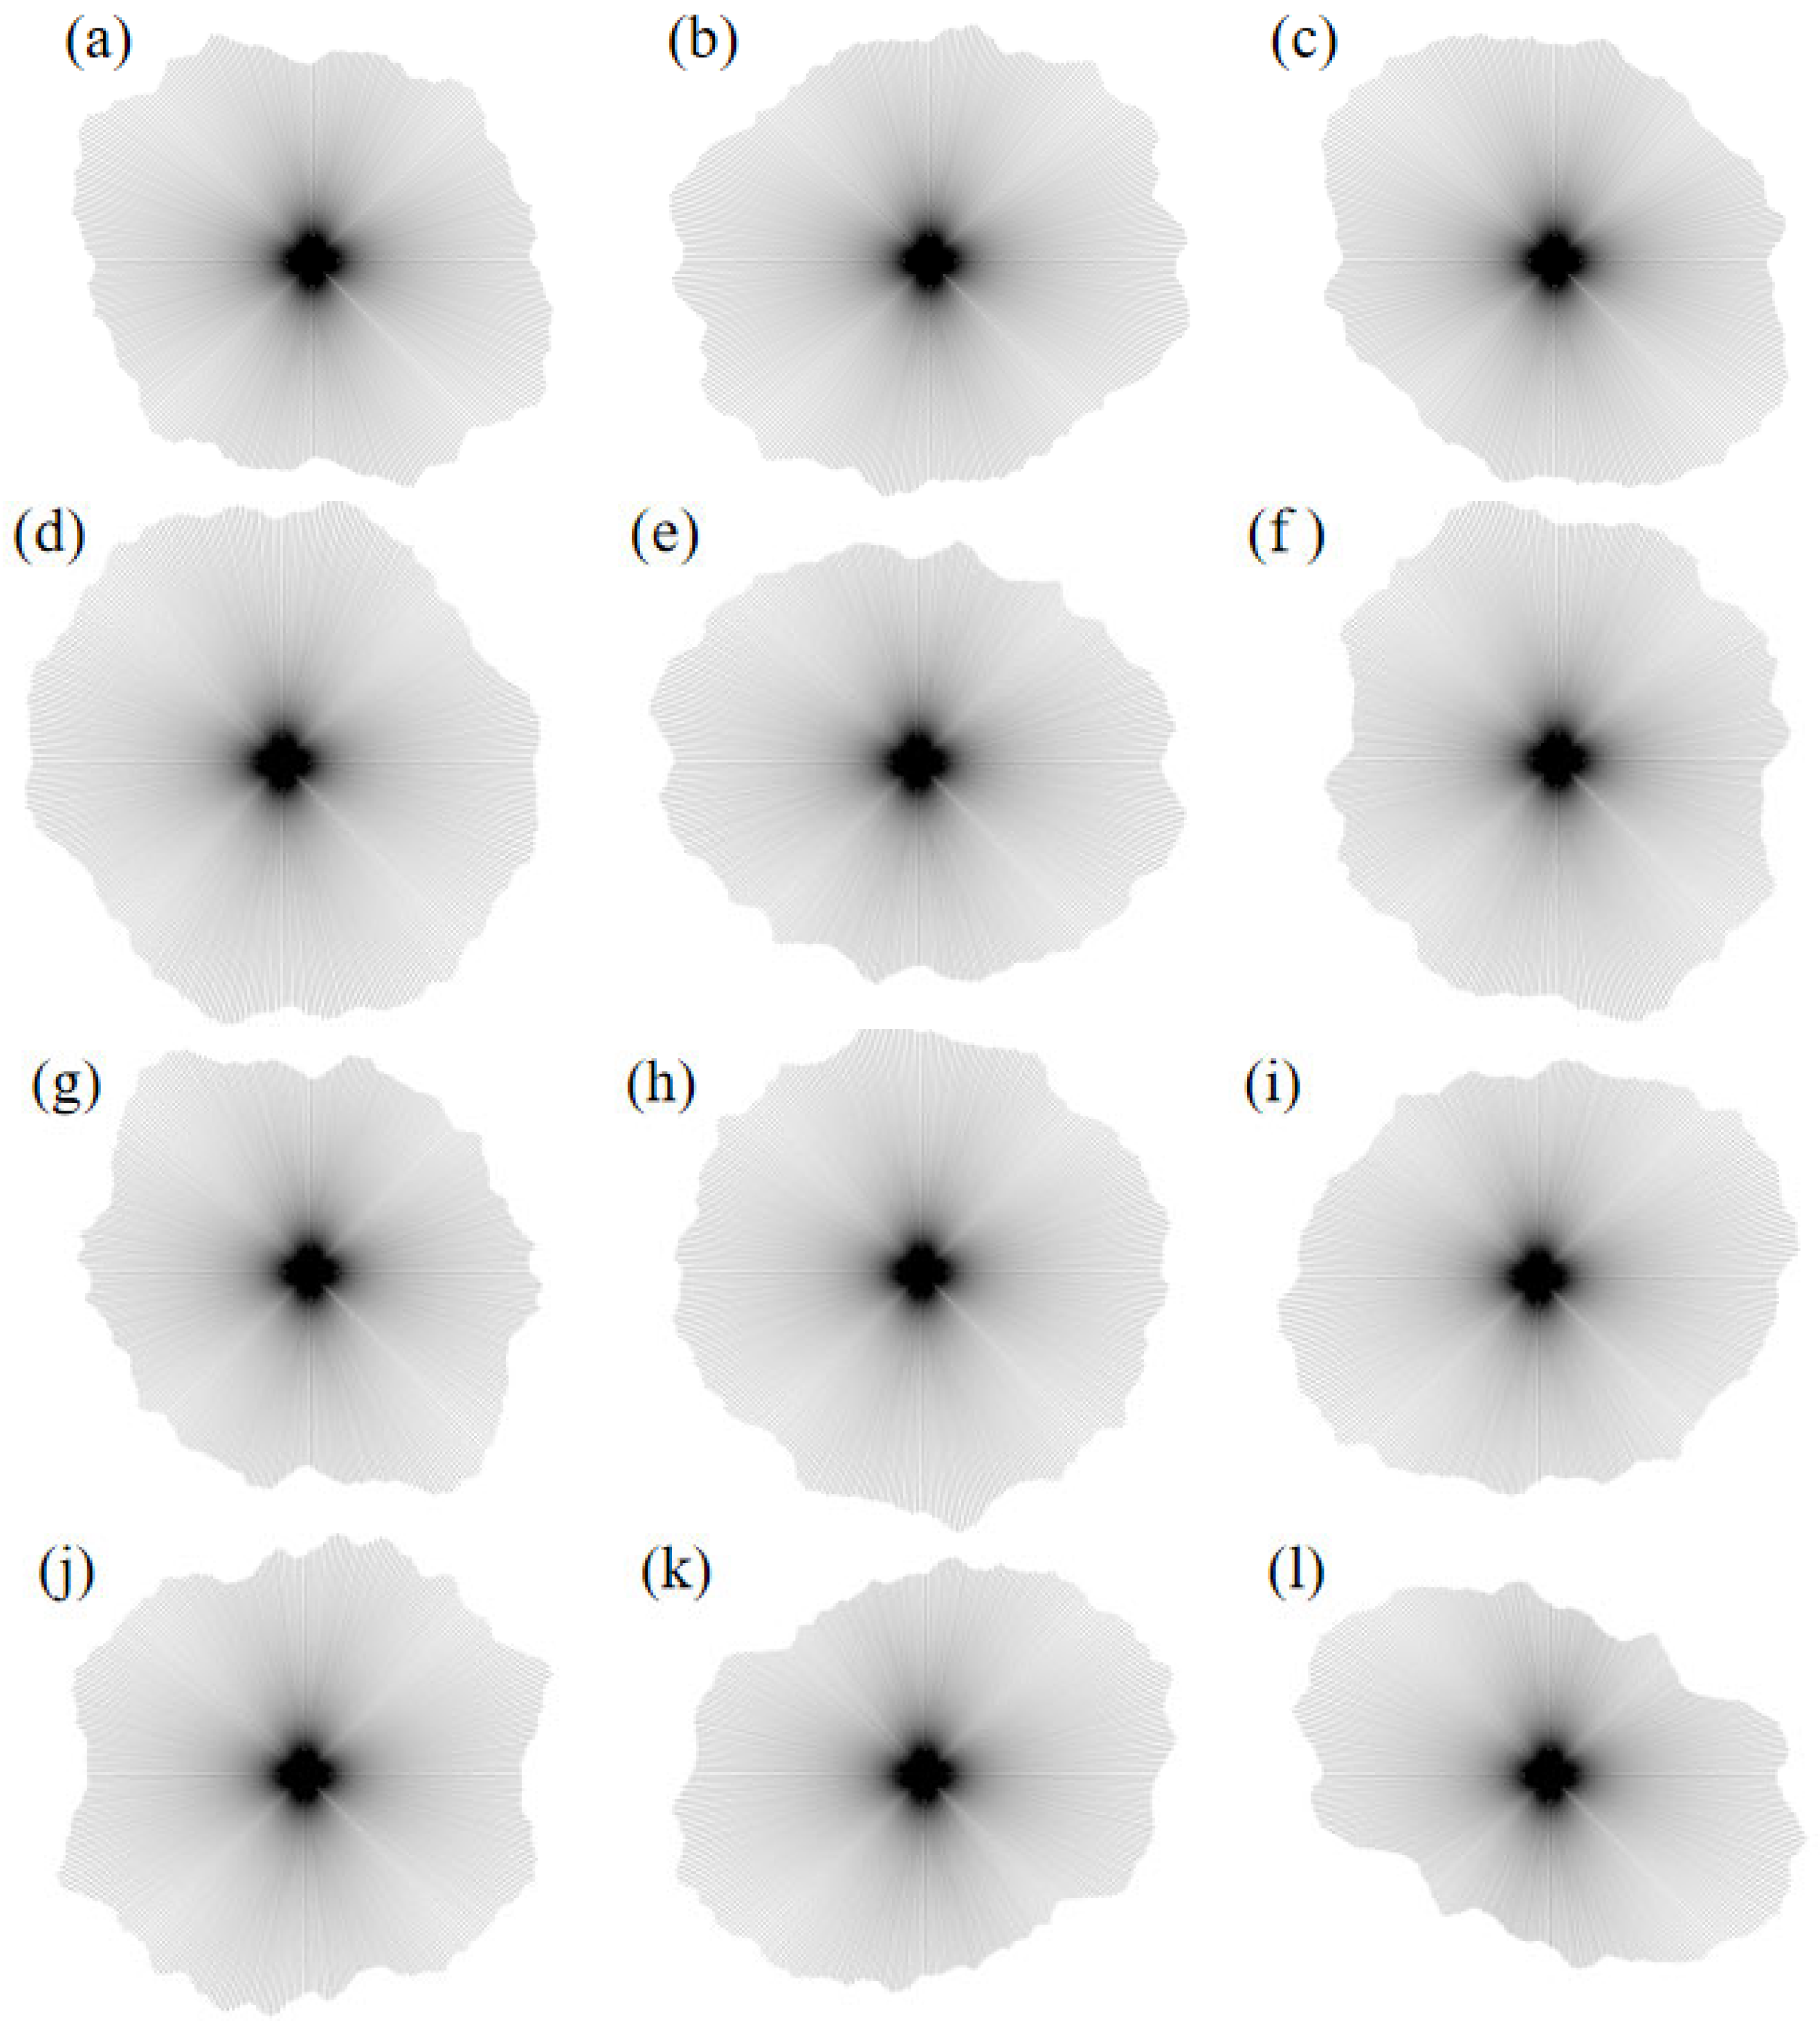
- Pore distribution rose diagram
- 3.
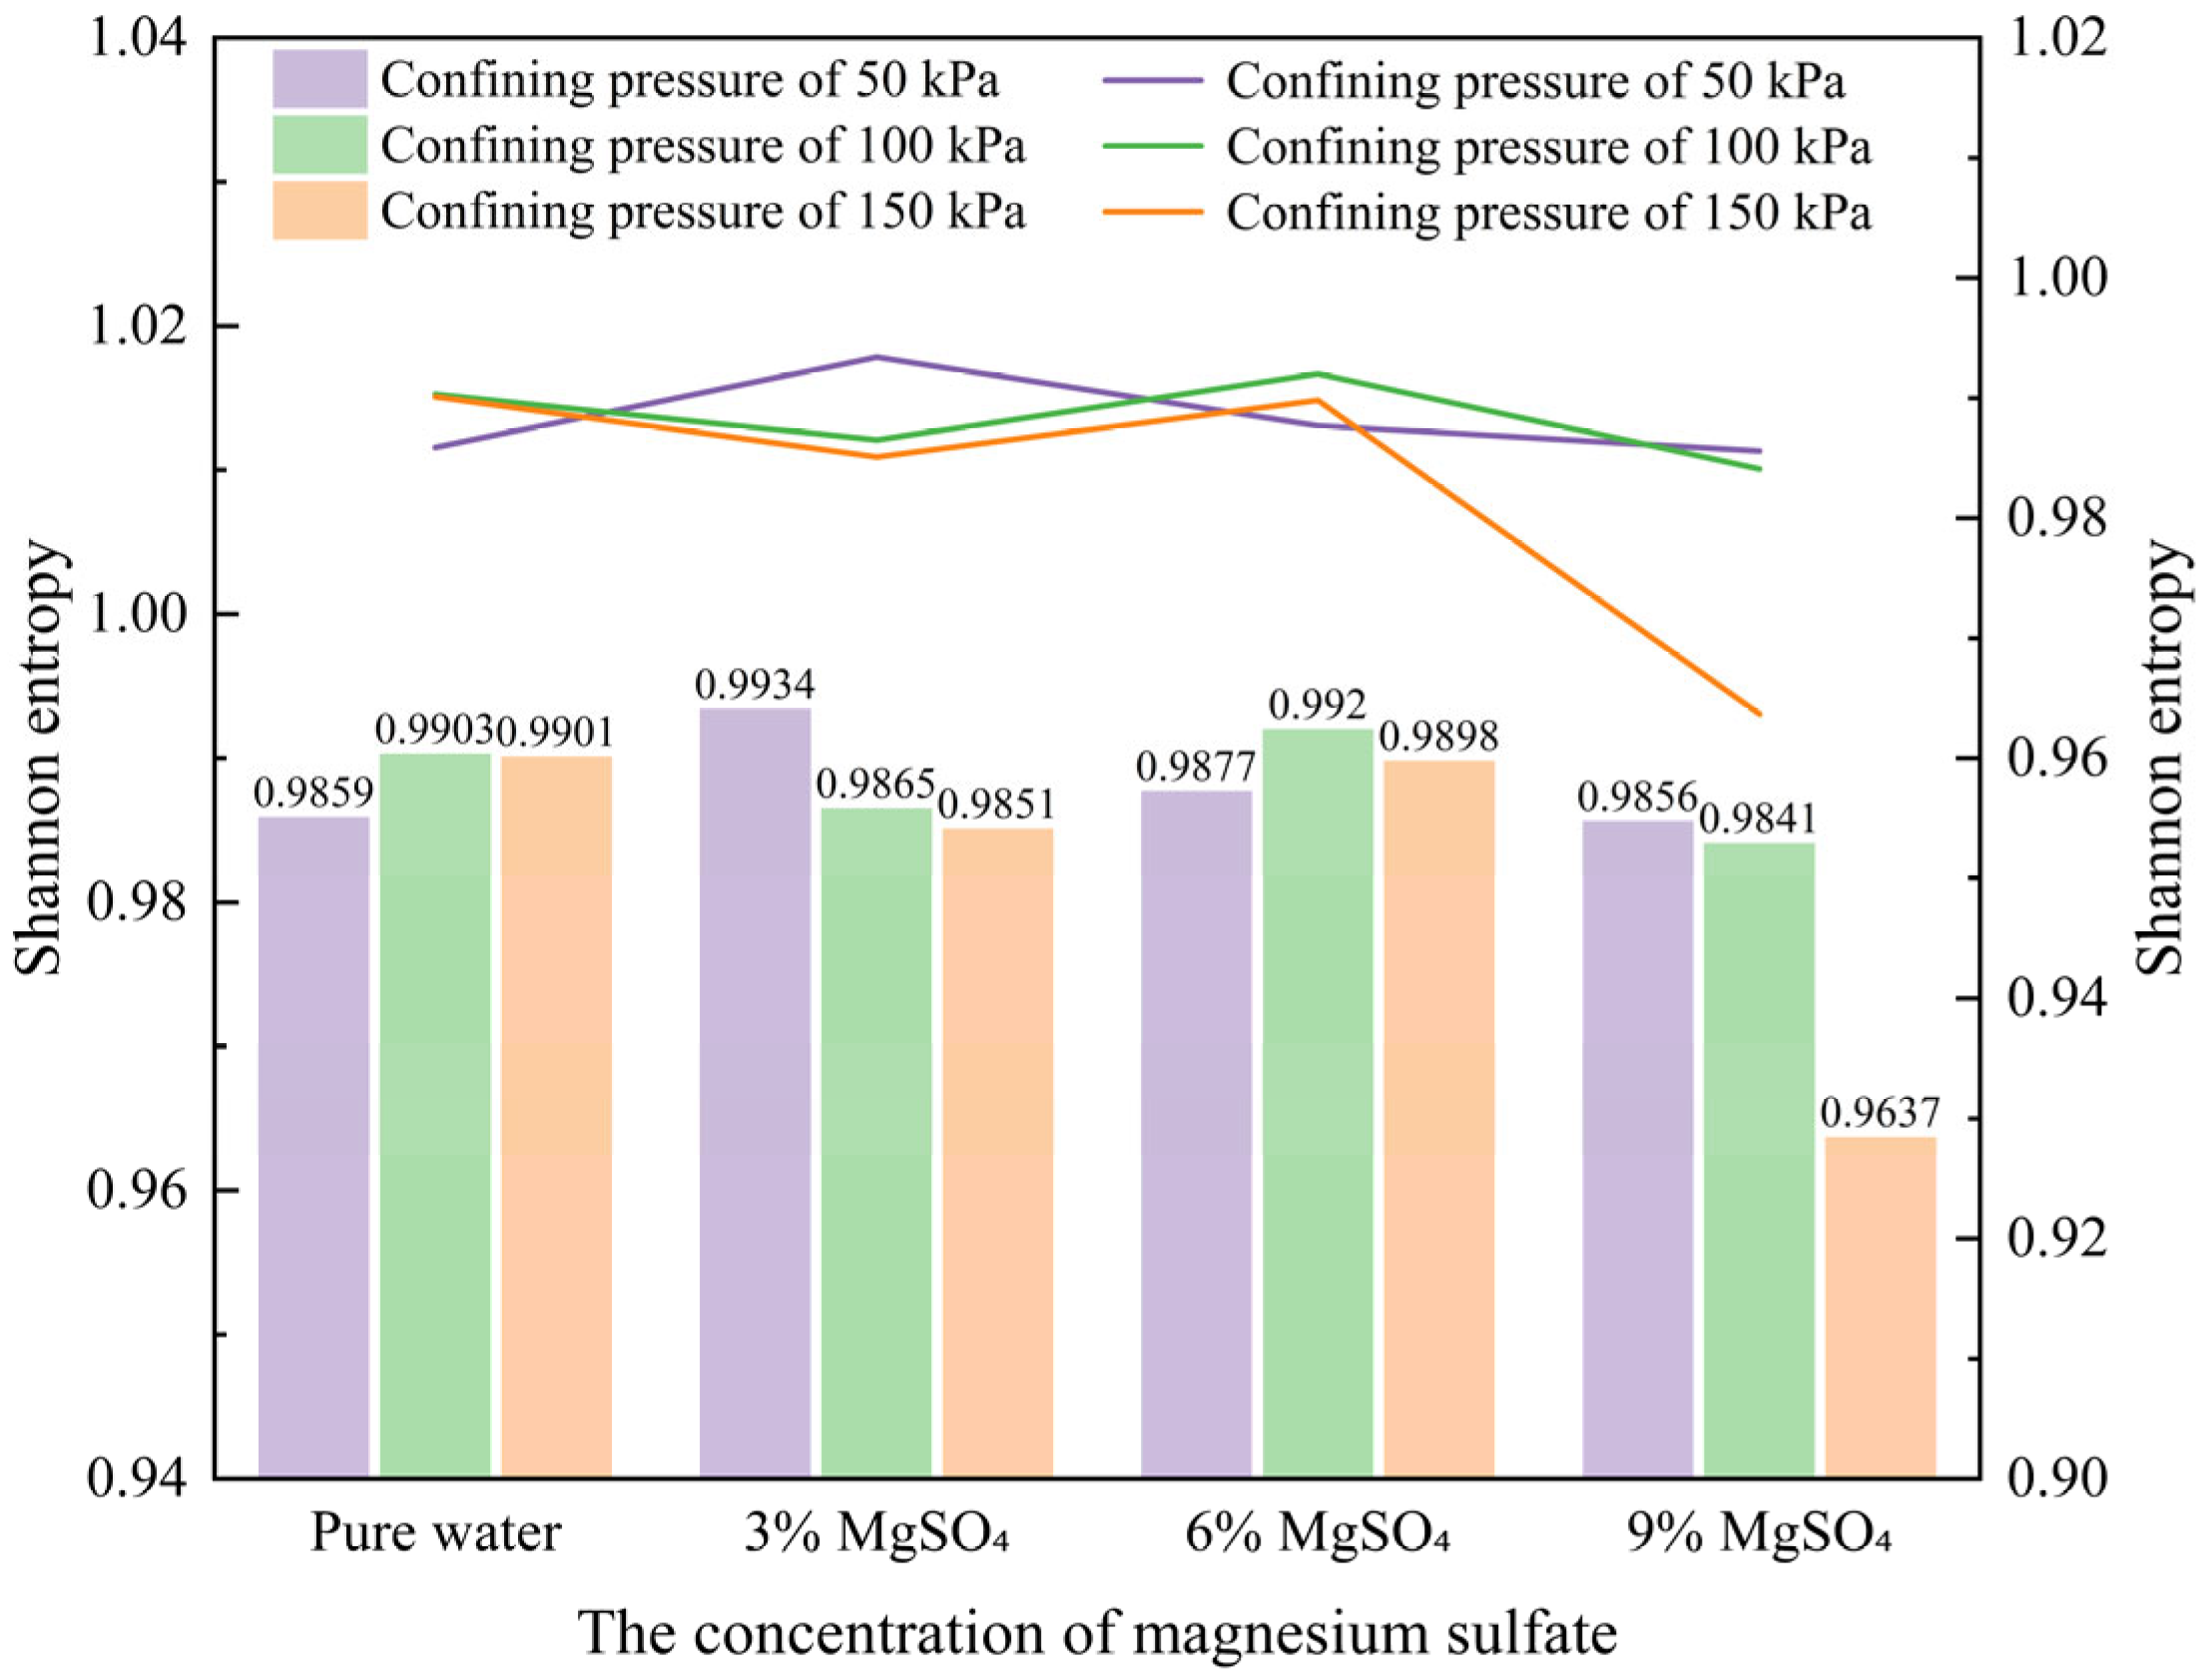
- Probability entropy
- 4.
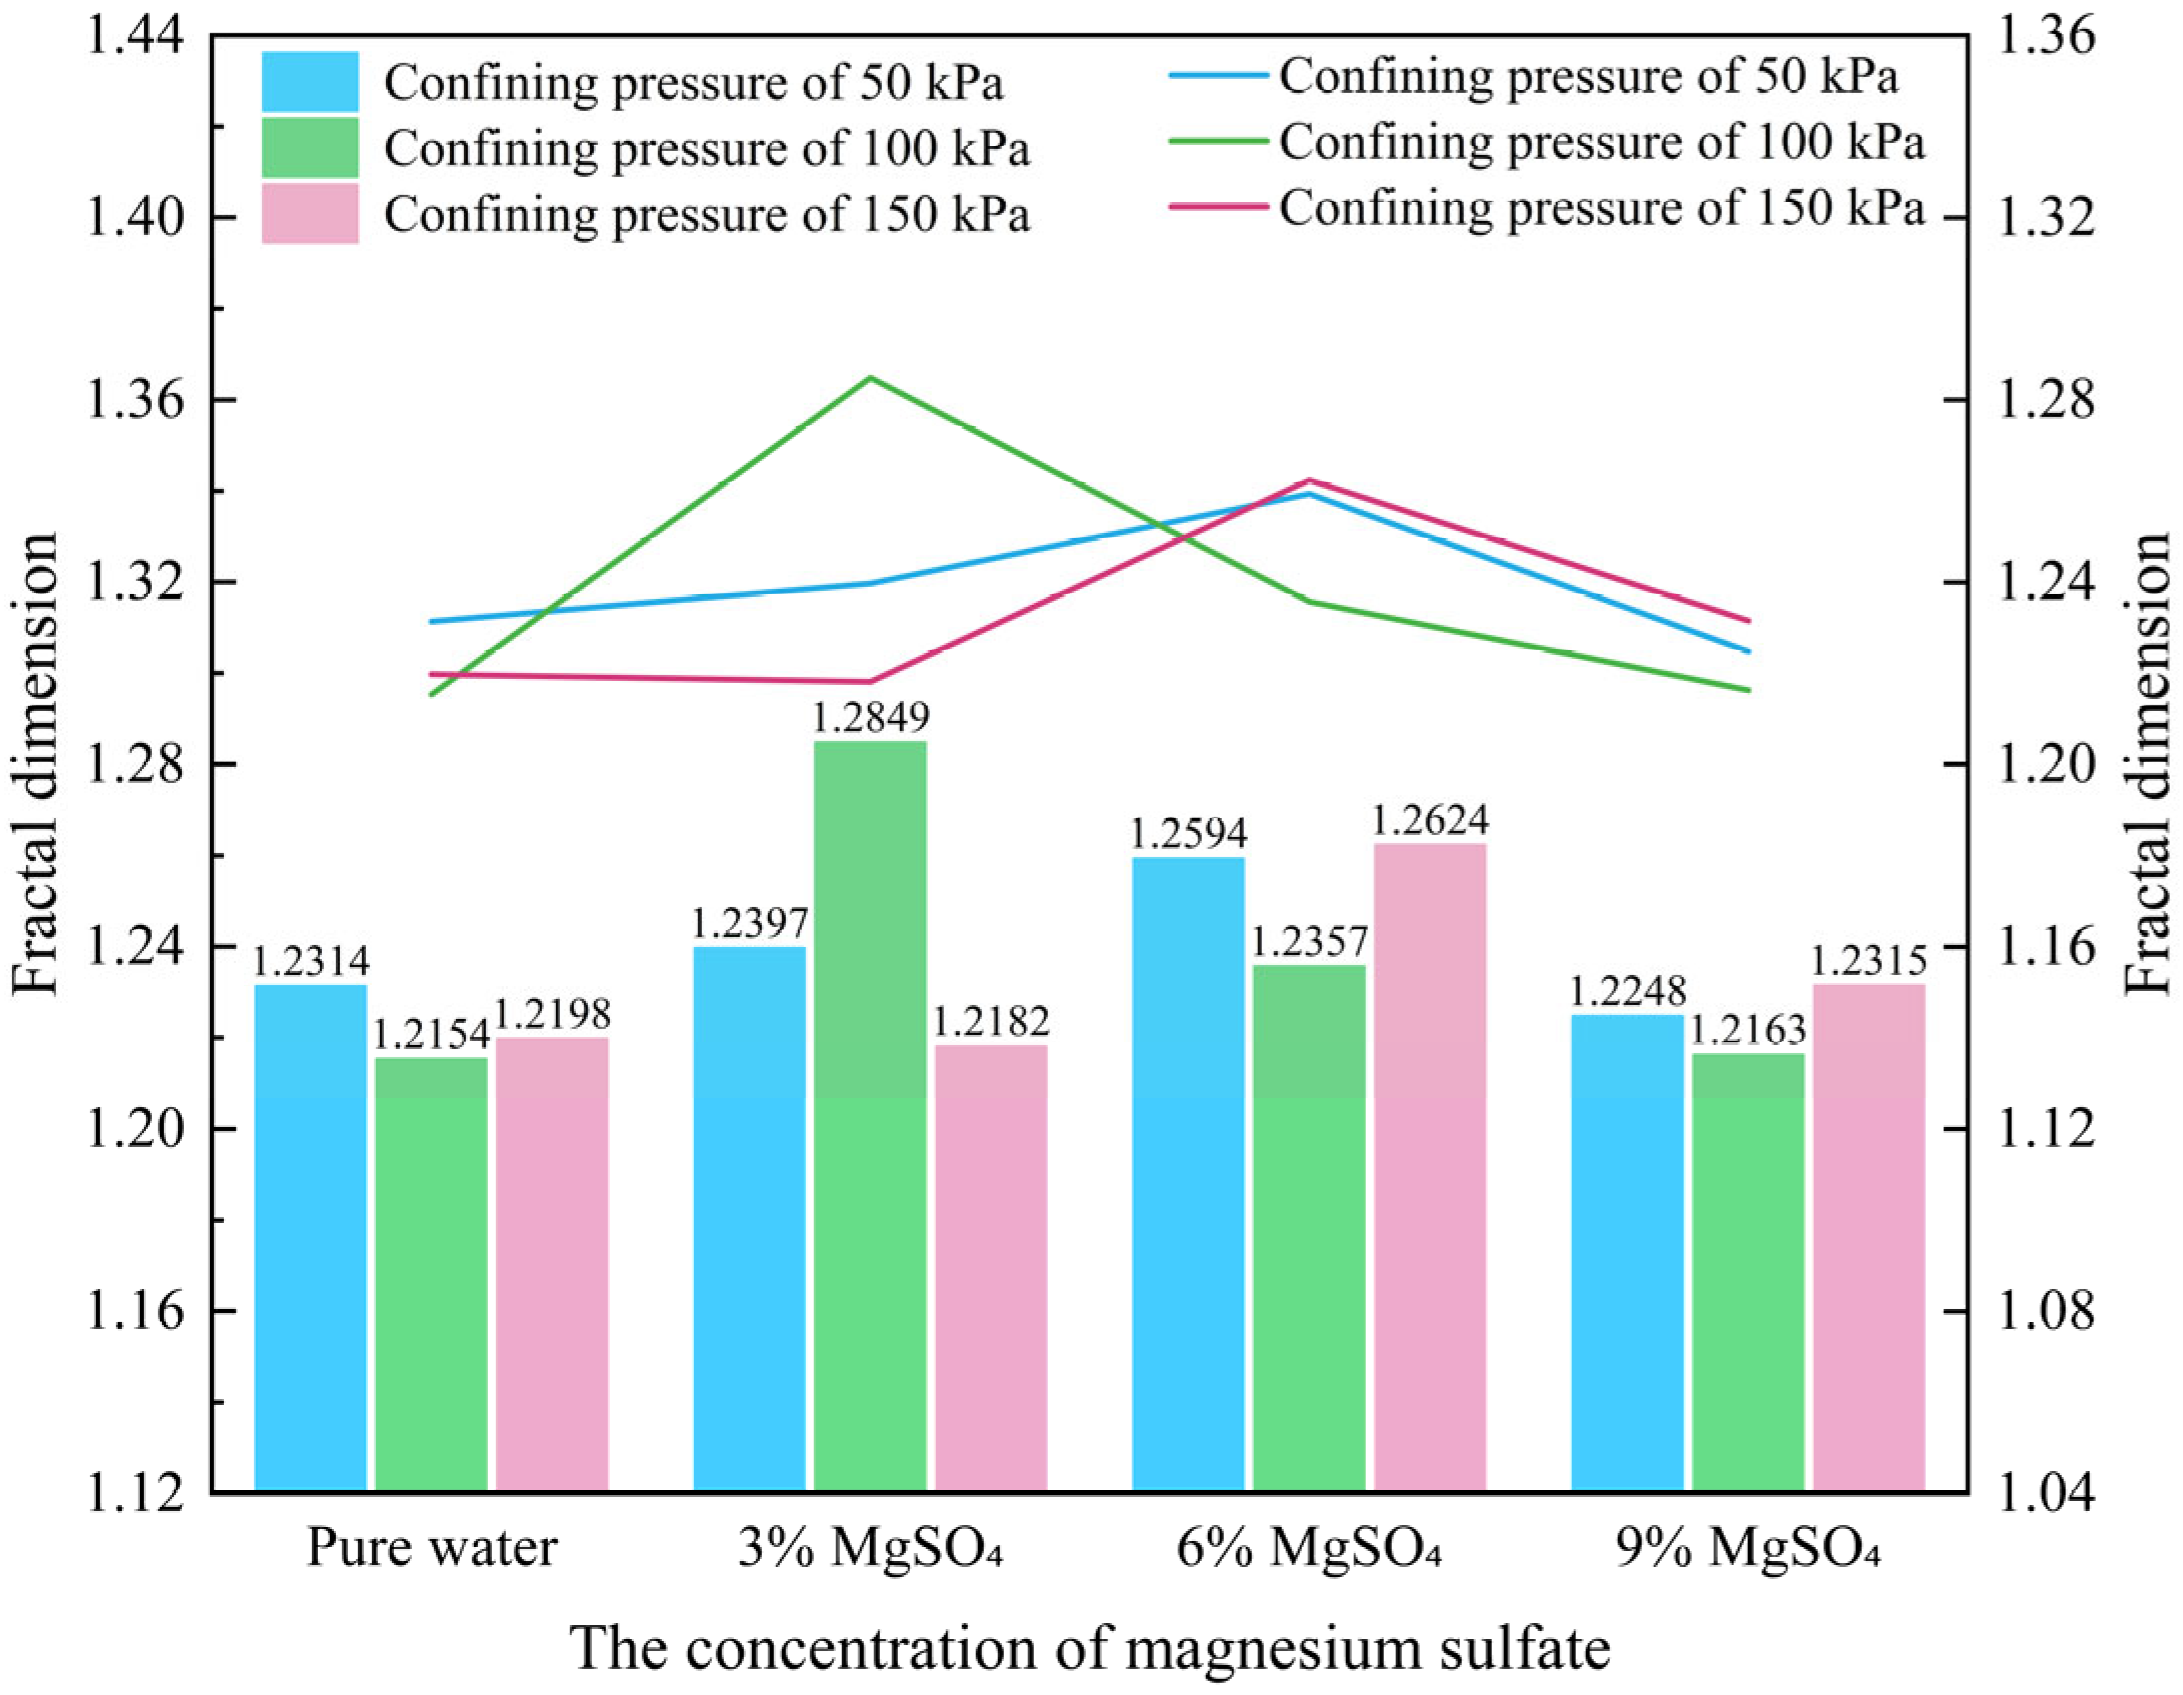
- Fractal dimension
5. Conclusions
- Under the influence of different leaching agents, the particle arrangement and compositional structure of ionic rare earth ores undergo redistribution, leading to distinct trends in shear strength behavior. Following leaching, the shear strength of the ore body ranks in descending order as follows: (NH4)2SO4 > MgSO4 > Al2(SO4)3 > pure water. Compared with the pure water group, leaching with (NH4)2SO4 significantly enhances the cohesion of the rare earth ore samples while markedly reducing the internal friction angle. In contrast, treatment with MgSO4 and Al2(SO4)3 results in decreased cohesion and an increased internal friction angle.
- Under varying MgSO4 concentrations, an increasing concentration leads to a reduction in cohesion and an increase in the internal friction angle. At 3% MgSO4, the leaching agent exerts a relatively mild effect, resulting in minimal changes in the shear strength. At 6%, the agent begins to significantly interact with the chemical structure of the ore or soil, contributing to a gradual increase in the shear strength. However, at 9% concentration, the intensified chemical reaction induces substantial mineral structural degradation, ultimately reducing the shear strength. Under high confining pressure, the chemical interaction between MgSO4 and the ionic rare earth ore becomes more pronounced, influencing the reorganization and rearrangement of soil particles. Compared with the pure water condition, the enhancement in shear strength is markedly more evident.
- The microscopic pore characteristics of the ore samples vary significantly under different confining pressures. As the confining pressure increases, the pore morphology evolves from angular to more uniform forms, and the pore structure exhibits a trend of increasing complexity followed by simplification. Pore areas gradually decrease, while the number of pores increases. The proportion of large pores rises, whereas that of super-large pores decreases. The total pore count shows an increasing trend, accompanied by a rise in structural disorder and a corresponding decline in overall pore organization.
- As the MgSO4 concentration increases, the pore distribution in the ore samples transitions from a concentrated to a more dispersed pattern, while pore morphology evolves from angular to elongated forms. At lower concentrations, the pores are more numerous and structurally complex; however, with an increasing concentration, the pore size decreases progressively. The pore distribution becomes increasingly uniform and ordered, and the fractal dimension exhibits a greater sensitivity to variation at lower concentrations, indicating a trend toward simpler pore structures.
Author Contributions
Funding
Data Availability Statement
Conflicts of Interest
References
- Huang, X.W.; Long, Z.Q.; Wang, L.S.; Feng, Z.Y. Technology development for rare earth cleaner hydrometallurgy in China. Rare Met. 2015, 34, 215–222. [Google Scholar] [CrossRef]
- Wang, G.F.; Xu, J.; Ran, L.Y.; Zhu, R.L.; Ling, B.W.; Liang, X.L.; Kang, S.C.; Wang, Y.Y.; Wei, J.M.; Ma, L.Y.; et al. A green and efficient technology to recover rare earth elements from weathering crusts. Nat. Sustain. 2023, 6, 81–92. [Google Scholar] [CrossRef]
- Xie, D.Y.; Li, J.; Huang, Z.H.; Zhu, Y.Y.; Shi, W.H.; Xie, Y.Y.; Zhang, X.X.; Zhang, H.; Qi, T. One-step enrichment of rare earth elements from ionic rare earth leachate by electrochemical precipitation. Sep. Purif. Technol. 2025, 357, 129912. [Google Scholar] [CrossRef]
- Zhang, Z.Y.; Sun, N.J.; He, Z.Y.; Chi, R.A. Local concentration of middle and heavy rare earth elements in the col on the weathered crust elution-deposited rare earth ores. J. Rare Earths 2018, 36, 552–558. [Google Scholar] [CrossRef]
- Lan, Q.F.; Zhang, X.L.; Niu, F.; Liu, D.H.; Shen, L.T.; Yang, Y.M. Recovery of rare earth elements and thorium from acid leaching residue of ionic rare earth concentrates. J. Rare Earths 2025, 43, 794–804. [Google Scholar] [CrossRef]
- Guo, Z.Q.; Liu, L.F.; Tang, T.; Zhou, K.F.; Wang, X.J. Influence of Leaching Solution on the Soil-Water Characteristics of Ion-Absorbed Rare Earth Minerals and Its Hysteresis Effect. Minerals 2023, 13, 637. [Google Scholar] [CrossRef]
- Chen, Z.; Zhang, Z.Y.; He, Z.Y.; Chi, R.A. Mass transfer process of leaching weathered crust elution-deposited rare earth ore with magnesium salts. Physicochem. Probl. Miner. Process. 2018, 54, 1004–1013. [Google Scholar]
- Chi, R.A.; Liu, X.M. Prospect and Development of Weathered Crust Elution-Deposited Rare Earth Ore. J. Chin. Rare Earth Soc. 2019, 37, 129–140. [Google Scholar]
- Zhong, Z.G.; Zhou, H.P.; Hu, J.; Zhang, Y.B.; Luo, X.P.; Feng, B. Research Progress of Green Extraction Technology for Ion-adsorption Type Rare Earths Ore in Southern China. Met. Mine 2017, 12, 76–81. [Google Scholar]
- Guo, Z.Q.; Liu, L.F.; Zhou, J.R.; Tang, T.; Zhou, K.F.; Wang, X.J. The Effect of Different Leaching on the Water Retention Characteristics of Ion-absorption Type Rare Earth. Chin. Rare Earths 2024, 45, 107–119. [Google Scholar]
- Wang, J.; Wang, G.S.; Luo, S.H.; Liang, Y.H.; Sun, Z.; Hu, S.L.; Yang, Y.L. The influence of low-permeability geological inclusions on the seepage behavior of ionic rare earth leaching mining: A study using visual microfluidic technology. Miner. Eng. 2023, 204, 108440. [Google Scholar] [CrossRef]
- Li, Y.X.; Zhou, X.M.; Liu, Y.Z.; Li, D.P.; Li, J.; Tang, Q. Development of High Efficiency Extraction and Separation Technologies of Rare Earths from Ion-Adsorbed Type Deposit. J. Chin. Rare Earth Soc. 2012, 30, 257–264. [Google Scholar]
- Zhao, L.S.; Huang, X.W.; Feng, Z.Y.; Liu, D.P.; Zheng, X.D.; Yin, W.Q. Research Progresses and Development Tendency of Pollution Prevention and Control Technologies for Mining of Weathered Crust Elution-deposited Rare Earth Ore. J. Chin. Rare Earth Soc. 2022, 40, 988–997. [Google Scholar]
- Balaram, V. Rare earth elements: A review of applications, occurrence, exploration, analysis, recycling, and environmental impact. Geosci. Front. 2019, 10, 1285–1303. [Google Scholar] [CrossRef]
- Rao, R.; Li, M.C.; Zhang, S.B.; Rao, Y.Z.; Zhong, J.M. Experimental Study on Landslide Features and Countermeasures of In-situ Leaching Stope of Ion-type Rare Earth Mines. Chin. Rare Earths 2016, 37, 26–31. [Google Scholar]
- Guo, Z.Q.; Lai, Y.M.; Jin, J.F.; Zhou, J.R.; Sun, Z.; Zhao, K. Effect of Particle Size and Solution Leaching on Water Retention Behavior of Ion-Absorbed Rare Earth. Geofluids 2020, 2020, 1–14. [Google Scholar] [CrossRef]
- Feng, X.J.; Wang, X.Q.; Zhang, S.R.; Dong, C.L. Research status and prospect of particle migration, pore structure evolution and model construction of ionic rare earth in-situ leaching. Chin. Rare Earths 2025, 46, 114–127. [Google Scholar] [CrossRef]
- Chen, Z.J. Study on the Change Rule of Shear Strength Parameters of Ionic Rare Earth Ore after Ore Leaching. Min. Res. Dev. 2020, 40, 71–74. [Google Scholar]
- Chen, X.; Qi, Y.; Yin, S.H.; Li, X.W.; Xie, F.F.; Liu, J.W.; Chen, W.; Yan, R.F. Law of weakening mechanical properties of rare earth ore with leaching. J. Cent. South Univ. Sci. Technol. 2019, 50, 939–945. [Google Scholar]
- Huang, G.L.; Zhuo, Y.L.; Wang, X.J.; Li, Y.X.; Deng, S.Q.; Nie, Y.L. Effects of Different Concentration in Leaching Liquid on Rare Earth Ore’s Strength. Chin. Rare Earths 2018, 39, 47–54. [Google Scholar]
- Peng, H.; Hu, S.L.; Wang, G.S.; Hong, B.G.; Wang, Y.L. The Influence of Leaching Agent Concentration on the Shear Strength Parameters of Ion-adsorption Rare Earth Ore. Chin. Rare Earths 2022, 43, 58–64. [Google Scholar]
- Wang, H.; Wang, X.J.; Wang, Y.; Wang, D.H.; Hu, K.J.; Zhong, W.; Guo, Z.Q. Influence of ammonium sulfate leaching agent on engineering properties of weathered crust elution-deposited rare earth ore. Acta Geotech. 2024, 19, 1–22. [Google Scholar] [CrossRef]
- Zhou, L.B.; Wang, X.J.; Zhuo, Y.L.; Hu, K.J.; Zhong, W.; Huang, G.L. Dynamic pore structure evolution of the ion adsorbed rare earth ore during the ion exchange process. R. Soc. Open Sci. 2019, 6, 191107. [Google Scholar] [CrossRef] [PubMed]
- Yin, S.H.; Qi, Y.; Xie, F.F.; Chen, X.; Wang, L.M. Strength characteristics of weathered crust elution-deposited rare earthores with different porosity ratios. J. Univ. Sci. Technol. Beijing 2018, 40, 159–166. [Google Scholar]
- Yin, S.H.; Qi, Y.; Xie, F.F.; Chen, X.; Wang, L.M.; Shao, Y.J. Porosity characteristic of leaching weathered crust elution-deposited rare earth before and after leaching. Chin. J. Nonferrous Met. 2018, 28, 2112–2119. [Google Scholar]
- Guo, Z.Q.; Wang, H.X.; Liu, Q.Q.; Luo, F.Y.; Liu, Y.S. Microstructure Evolution Law of Ionic Rare Earth at Different Depths in In Situ Leaching Mine Site. Minerals 2024, 14, 570. [Google Scholar] [CrossRef]
- Liu, D.F.; Zhang, Z.Y.; Chi, R.A.; Xi, Y.L.; Yan, S. Experimental Study on the Influence of Particle Size on the Strength Characteristics of Weathered Crust Elution-deposited Rare Earth Ores. Nonferrous Met. Eng. 2020, 10, 97–103. [Google Scholar]
- Zhang, X.M.; Gao, Z.Q.; Rao, Y.Z.; Shi, L.; Xu, W. Evolutionary Law of Pore Structure of Ion-Adsorbed Rare Earth Ore Leaching Process. Minerals 2023, 13, 322. [Google Scholar] [CrossRef]
- Cai, W.Q.; Zhou, D.; Qin, L.; Zhao, Y.H. Study on the adsorption law and morphology distribution of magnesium sulfate in ionic rare earths. Nonferrous Met. Sci. Eng. 2024, 15, 941–951. [Google Scholar]
- Bielicka, M.; Lubecka, M.; Wasilewska, A.; Klekotka, U.; Kalska-Szostko, B. Optimization of measurement conditions in SEM microscopy—a case study. Measurement 2025, 253, 117513. [Google Scholar] [CrossRef]
- Wang, Y.L.; Han, D.L.; Lin, W.; Jia, Y.Q.; Zhang, J.Z.; Wang, C.C.; Ma, B.Y. Factors Controlling Differences in Morphology and Fractal Characteristics of Organic Pores of Longmaxi Shale in Southern Sichuan Basin, China. Fractal Fract. 2024, 8, 555. [Google Scholar] [CrossRef]


| Physical Indexes | Water Content/% | Density (g/cm3) | Dry Density (g/cm3) | Liquid Limit (WP)/% | Plastic Limit (WL)/% | Plastic Index (IP) |
|---|---|---|---|---|---|---|
| Original rare earth | 18.03 | 1.77 | 1.49 | 41.83 | 29.23 | 12.6 |
| Element | SiO2 | Al2O3 | Fe2O3 | K2O | MnO | MgO |
| Content (%) | 70.201 | 18.069 | 3.916 | 1.453 | 0.046 | 0.161 |
| Element | PbO | Rb2O | CaO | ZnO | Y2O3 | |
| Content (%) | 0.015 | 0.014 | 0.009 | 0.007 | 0.001 |
| Soil Number | Leaching Conditions | Confining Pressure |
|---|---|---|
| A1 | Pure water | 50 kPa, 100 kPa, 150 kPa |
| B1 | 6% (NH4)2SO4 | |
| B2 | 6% MgSO4 | |
| B3 | 6% Al2(SO4)3 | |
| C1 | 3% MgSO4 | |
| C2 | 6% MgSO4 | |
| C3 | 9% MgSO4 |
| Testing Condition | Confining Pressure | Micropore Proportion | Mesopore Proportion | Macropore Proportion | Mega-Pore Proportion | Total Porosity |
|---|---|---|---|---|---|---|
| Pure water | 50 kPa | 66.87% | 21.36% | 8.36% | 3.41% | 323 |
| 100 kPa | 72.17% | 19.1% | 6.47% | 2.27% | 309 | |
| 150 kPa | 75.54% | 17.2% | 4.84% | 1.88% | 372 | |
| 3% MgSO4 | 50 kPa | 69.59% | 19.12% | 6.9% | 4.39% | 319 |
| 100 kPa | 70.26% | 20.86% | 7.19% | 1.68% | 417 | |
| 150 kPa | 69.83% | 15.93% | 8.14% | 6.1% | 295 | |
| 6% MgSO4 | 50 kPa | 61.2% | 25.2% | 8.4% | 5.2% | 250 |
| 100 kPa | 65.72% | 21.55% | 7.07% | 5.65% | 283 | |
| 150 kPa | 66.02% | 20.71% | 9.39% | 3.88% | 309 | |
| 9%MgSO4 | 50 kPa | 62.31% | 21.54% | 9.23% | 6.92% | 260 |
| 100 kPa | 68.57% | 19.37% | 7.94% | 4.13% | 315 | |
| 150 kPa | 65.13% | 21.79% | 10.65% | 2.42% | 413 |
Disclaimer/Publisher’s Note: The statements, opinions and data contained in all publications are solely those of the individual author(s) and contributor(s) and not of MDPI and/or the editor(s). MDPI and/or the editor(s) disclaim responsibility for any injury to people or property resulting from any ideas, methods, instructions or products referred to in the content. |
© 2025 by the authors. Licensee MDPI, Basel, Switzerland. This article is an open access article distributed under the terms and conditions of the Creative Commons Attribution (CC BY) license (https://creativecommons.org/licenses/by/4.0/).
Share and Cite
Guo, Z.; Huang, Z.; Liu, Q.; Wang, H.; Lin, X. The Evolutionary Behavior of Shear Strength and Microscopic Mechanisms of Ionic Rare Earths Under Varying Leaching Conditions. Metals 2025, 15, 712. https://doi.org/10.3390/met15070712
Guo Z, Huang Z, Liu Q, Wang H, Lin X. The Evolutionary Behavior of Shear Strength and Microscopic Mechanisms of Ionic Rare Earths Under Varying Leaching Conditions. Metals. 2025; 15(7):712. https://doi.org/10.3390/met15070712
Chicago/Turabian StyleGuo, Zhongqun, Zhaoming Huang, Qiqi Liu, Haoxuan Wang, and Xiaoming Lin. 2025. "The Evolutionary Behavior of Shear Strength and Microscopic Mechanisms of Ionic Rare Earths Under Varying Leaching Conditions" Metals 15, no. 7: 712. https://doi.org/10.3390/met15070712
APA StyleGuo, Z., Huang, Z., Liu, Q., Wang, H., & Lin, X. (2025). The Evolutionary Behavior of Shear Strength and Microscopic Mechanisms of Ionic Rare Earths Under Varying Leaching Conditions. Metals, 15(7), 712. https://doi.org/10.3390/met15070712