Article

DFT Study of Hydrostatic Pressure Effects up to 1.0 GPa on the Electronic and Magnetic Properties of Laves Phases ErAl2 and ErNi2

by
Tomás López-Solenzal
1,
José Luis Sánchez Llamazares
2,
José Luis Enríquez-Carrejo
1 and
César Fidel Sánchez-Valdés
1,*
1
Departamento de Física y Matemáticas, Extensión Multidisciplinaria en Ciudad Universitaria, Instituto de Ingeniería y Tecnología, Universidad Autónoma de Ciudad Juárez, Ciudad Juárez 32310, Chihuahua, Mexico
2
Instituto Potosino de Investigación Científica y Tecnológica A.C., Camino a la Presa San José 2055, Col. Lomas 4a Sección, San Luis Potosí 78216, San Luis Potosí, Mexico
*
Author to whom correspondence should be addressed.
Metals 2025, 15(6), 680; https://doi.org/10.3390/met15060680
Submission received: 8 May 2025 / Revised: 9 June 2025 / Accepted: 17 June 2025 / Published: 19 June 2025
(This article belongs to the Special Issue Study on the Preparation and Properties of Metal Functional Materials)

Abstract

This study employs DFT+U calculations to investigate the ferromagnetic properties of ErAl2 and ErNi2 Laves phases under an external hydrostatic pressure P (0 GPa ≤ P ≤ 1.0 GPa). The calculated magnetic moments per formula unit for both crystalline structures align with experimentally reported values: 4.40 μB/f.u. in the hard magnetization <001> axis for ErAl2 and 5.56 μB/f.u. in the easy magnetization <001> axis for ErNi2. The DFT results indicate that the magnetic moment remains unchanged up to 1 GPa of hydrostatic pressure, with no structural instabilities observed, as evidenced by a nearly constant formation energy for ErAl2 and ErNi2 alloys. The simulations confirm that the magnetic behavior of ErAl2 is primarily driven by the electrons localized in the f orbitals. In contrast, for ErNi2, both d and f orbitals significantly contribute to the total magnetic moment. Finally, the electronic specific heat coefficient was calculated and reported as a function of hydrostatic pressure up to P = 1.0 GPa for each Laves phase.

Graphical Abstract

1. Introduction

A renewed interest has recently emerged in studying rare-earth-based Laves phases due to their excellent magnetocaloric properties, which make them suitable as magnetic refrigerants for hydrogen magnetocaloric liquefaction [1,2,3,4,5,6,7,8,9]. This solid-state cooling technology is environmentally friendly and more energy-efficient than conventional refrigeration methods that rely on the Joule–Thomson effect [1,3,6,7,8,9].
In stoichiometric AB2-type rare-earth-based Laves phases, A represents the rare earth element, while B denotes a transition or post-transition metal. The relative ratio of elements A and B, rA/rB, ranges from 1.05 to 1.68, with a higher packing density achieved at an ideal atomic radius ratio of 1.225, which corresponds to a space-filling of 71% in the crystal structure [10,11]. Rare-earth-based Laves phases exhibit three typical crystal structures known as C15 (cubic), C14 (hexagonal), and C36 (hexagonal).
The present work examines the effect of hydrostatic pressure on the electronic structure and magnetic properties of the ferromagnetic ErM2 compounds, where M is either Al or Ni. These compounds crystallize into a MgCu2-type cubic structure (C15) [12,13,14], with lattice parameters a = b = c of 7.770 Å and 7.113 Å, respectively [15,16]. The MgCu2-type crystal structure exhibits a valence electron concentration per atom (e/a) of less than 1.8 (i.e., e/a < 1.8), which contributes to the stability of the C15-type Laves phases. ErAl2 and ErNi2 display ferromagnetic order, with Curie temperatures (TC) of 12.5 K and 6.8 K, respectively [15,16]. They have rA/rB ratios of rEr/rAl = 1.245 and rEr/rNi = 1.162. The total magnetic moment per formula unit in both compounds originates from the rare earth element (Er), which possesses unpaired electrons [10,11,17].
Ab initio calculations employing density-functional theory (DFT) are essential tools for investigating the relationship between electronic structure and the physicochemical properties of materials [18]. In this study, these calculations have been utilized to examine the correlation between electronic structures and the magnetic properties of the two previously mentioned ferromagnetically ordered compounds [17,19,20,21,22,23,24]. The application of first-principles methods for computing electronic structures and performing energy calculations to address the inherent challenges of Laves phase investigations is an emerging field [25].
In this work, we examine the effect of hydrostatic pressure on the electronic structure and magnetic properties of the ferromagnetically ordered ErAl2 and ErNi2 Laves phases along the <001> direction using the spin-polarized DFT+U method with Hubbard U potential. We highlight the role of the Al and Ni orbitals in the electronic structure. To our knowledge, no in-depth investigations have used DFT methods to analyze the magnetic properties along the <001> axis in these two Laves phases. We underline that the magnetic moment strongly depends on the crystal direction in which the calculations are performed (i.e., easy, intermediate, and hard magnetization axes).

2. Computational Method

For the spin-polarized first-principles electronic structure calculations at T = 0 K, we used the experimental lattice parameters reported for the ErAl2 and ErNi2 Laves phases [15,16]. The MgCu2-type cubic structure (space group Fd-3m (227)) was constructed for both compounds, and the electron configurations of Al, Ni, and Er were defined as [Ne] 3s2 3p1, [Ne] 3s2 3p6 3d8 4s2, and [Ne] 3s2 3p6 3d10 4s2 4p6 4d10 5s2 5p6 4f12 6s2, respectively. The selected lattice parameters for constructing the crystalline structures were a = b = c = 7.770 Å for ErAl2 [15] and a = b = c = 7.113 Å for ErNi2 [16]. The A and B atoms in the AB2 structure occupy the 8a and 16d Wyckoff positions (i.e., at (0 0 0) and (5/8 5/8 5/8)). The ferromagnetic order for both compounds was simulated under the assumption that only the rare earth element (i.e., Er), located at the 8a site, possesses the magnetic moment, which is oriented along the <001> direction. Al and Ni, occupying the 16d Wyckoff position, were presumed to have zero magnetic moments [11,12]. The Erbium spin magnetic moment value was set to +3 μB, while the spin magnetic moment values for Al or Ni were assigned as 0. The spin quantization axis is <001>. During energy calculations, there were neither any constraints on crystal (volume is fully relaxed) nor on magnetic structures considering. Figure 1a illustrates the crystal structure exhibiting ferromagnetic order used for collinear spin-polarized quantum simulations. The easy magnetization direction corresponds to the crystalline direction in the <111>-axis for ErAl2 [26] and in the <001>-axis for ErNi2 [16,27,28]. For ErAl2, our calculations were performed along the hard magnetization axis (i.e., the c-axis) [27].
The geometric optimization of the crystalline structures of ErAl2 and ErNi2 Laves phases was performed using the Broyden–Fletcher–Goldfarb–Shanno (BFGS) algorithm [29,30]. The primitive cell (i.e., rhombohedral trigonal with lattice parameters a = b = c and angles α = β = γ = 60°) of the ErM2 (M = Al, Ni) crystal structure, depicted in Figure 1b, was used for energy calculations. During the geometric optimization process, external compressive stress was applied along the a, b, and c axes, which are perpendicular to the yz, xz, and xy atomic planes, respectively. This external stress is equivalent to applying hydrostatic pressure P. The diagonal components of the stress tensor are σij = −P δij, where P is the hydrostatic pressure, and δij is the Kronecker delta. The bulk modulus B and its derivative were obtained by fitting the calculated third-order Birch–Murnaghan equation of state.
Spin-polarized calculations were done using the revised Perdew–Burke–Ernzerhof (RPBE) exchange–correlation functional within a Generalized Gradient Approximation (GGA) framework. To determine the electronic density of states (DOS), the Brillouin zone was integrated using a k-mesh of 13 × 13 × 13. A cutoff energy of 500 eV was applied for plane-wave propagation through the crystal structure [31,32,33,34]. The charge convergence for self-consistent field cycles was set at 1 × 10⁻⁶ eV. The GGA method alone is inadequate for describing the localized 4f and itinerant 3d electrons; thus, the Hubbard parameter U was introduced to model the ferromagnetic ordering of these 4f and 3d electrons [18,35,36]. The U values for localized electrons were 2.50 eV for Ni atoms and 6.0 eV for Er atoms. The U value due to the lack of localized electrons was set to 0 eV for Al atoms. It is crucial to emphasize that U corrections within the GGA framework have shown better accuracy than other LDA or hybrid functionals for investigating the magnetic behavior and electronic structure of 4f and 3d compounds [18,35,36,37,38]. All calculations were performed along the <001> axis using density functional theory with U corrections (DFT+U) implemented in the Cambridge Serial Total Energy Package (CASTEP) code [32].

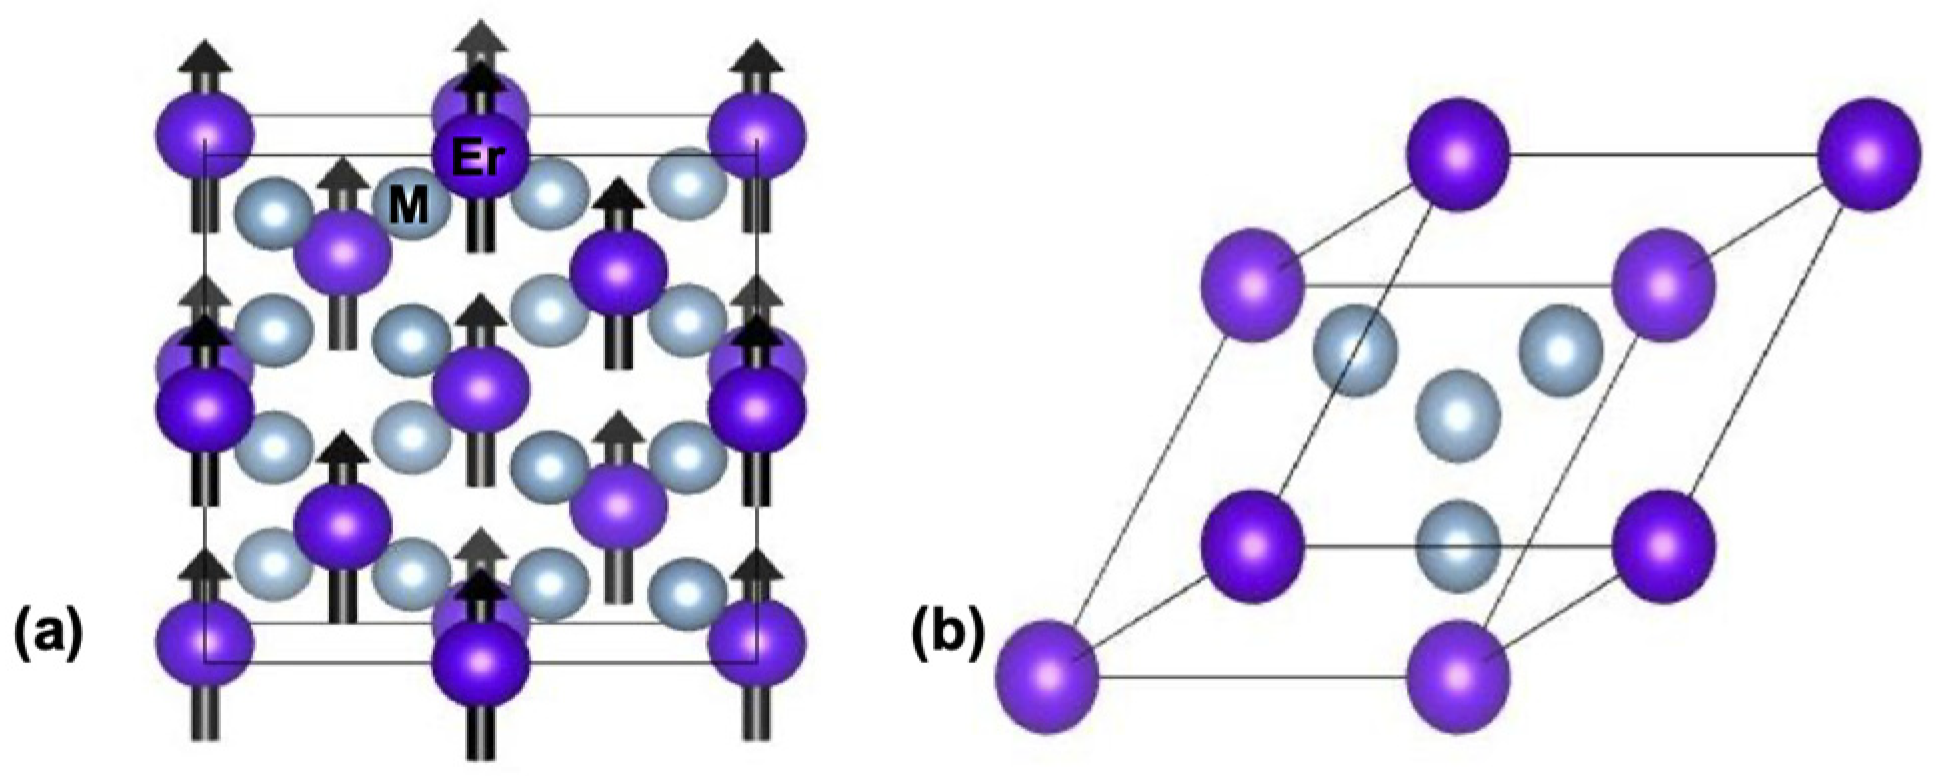
3. Results and Discussion

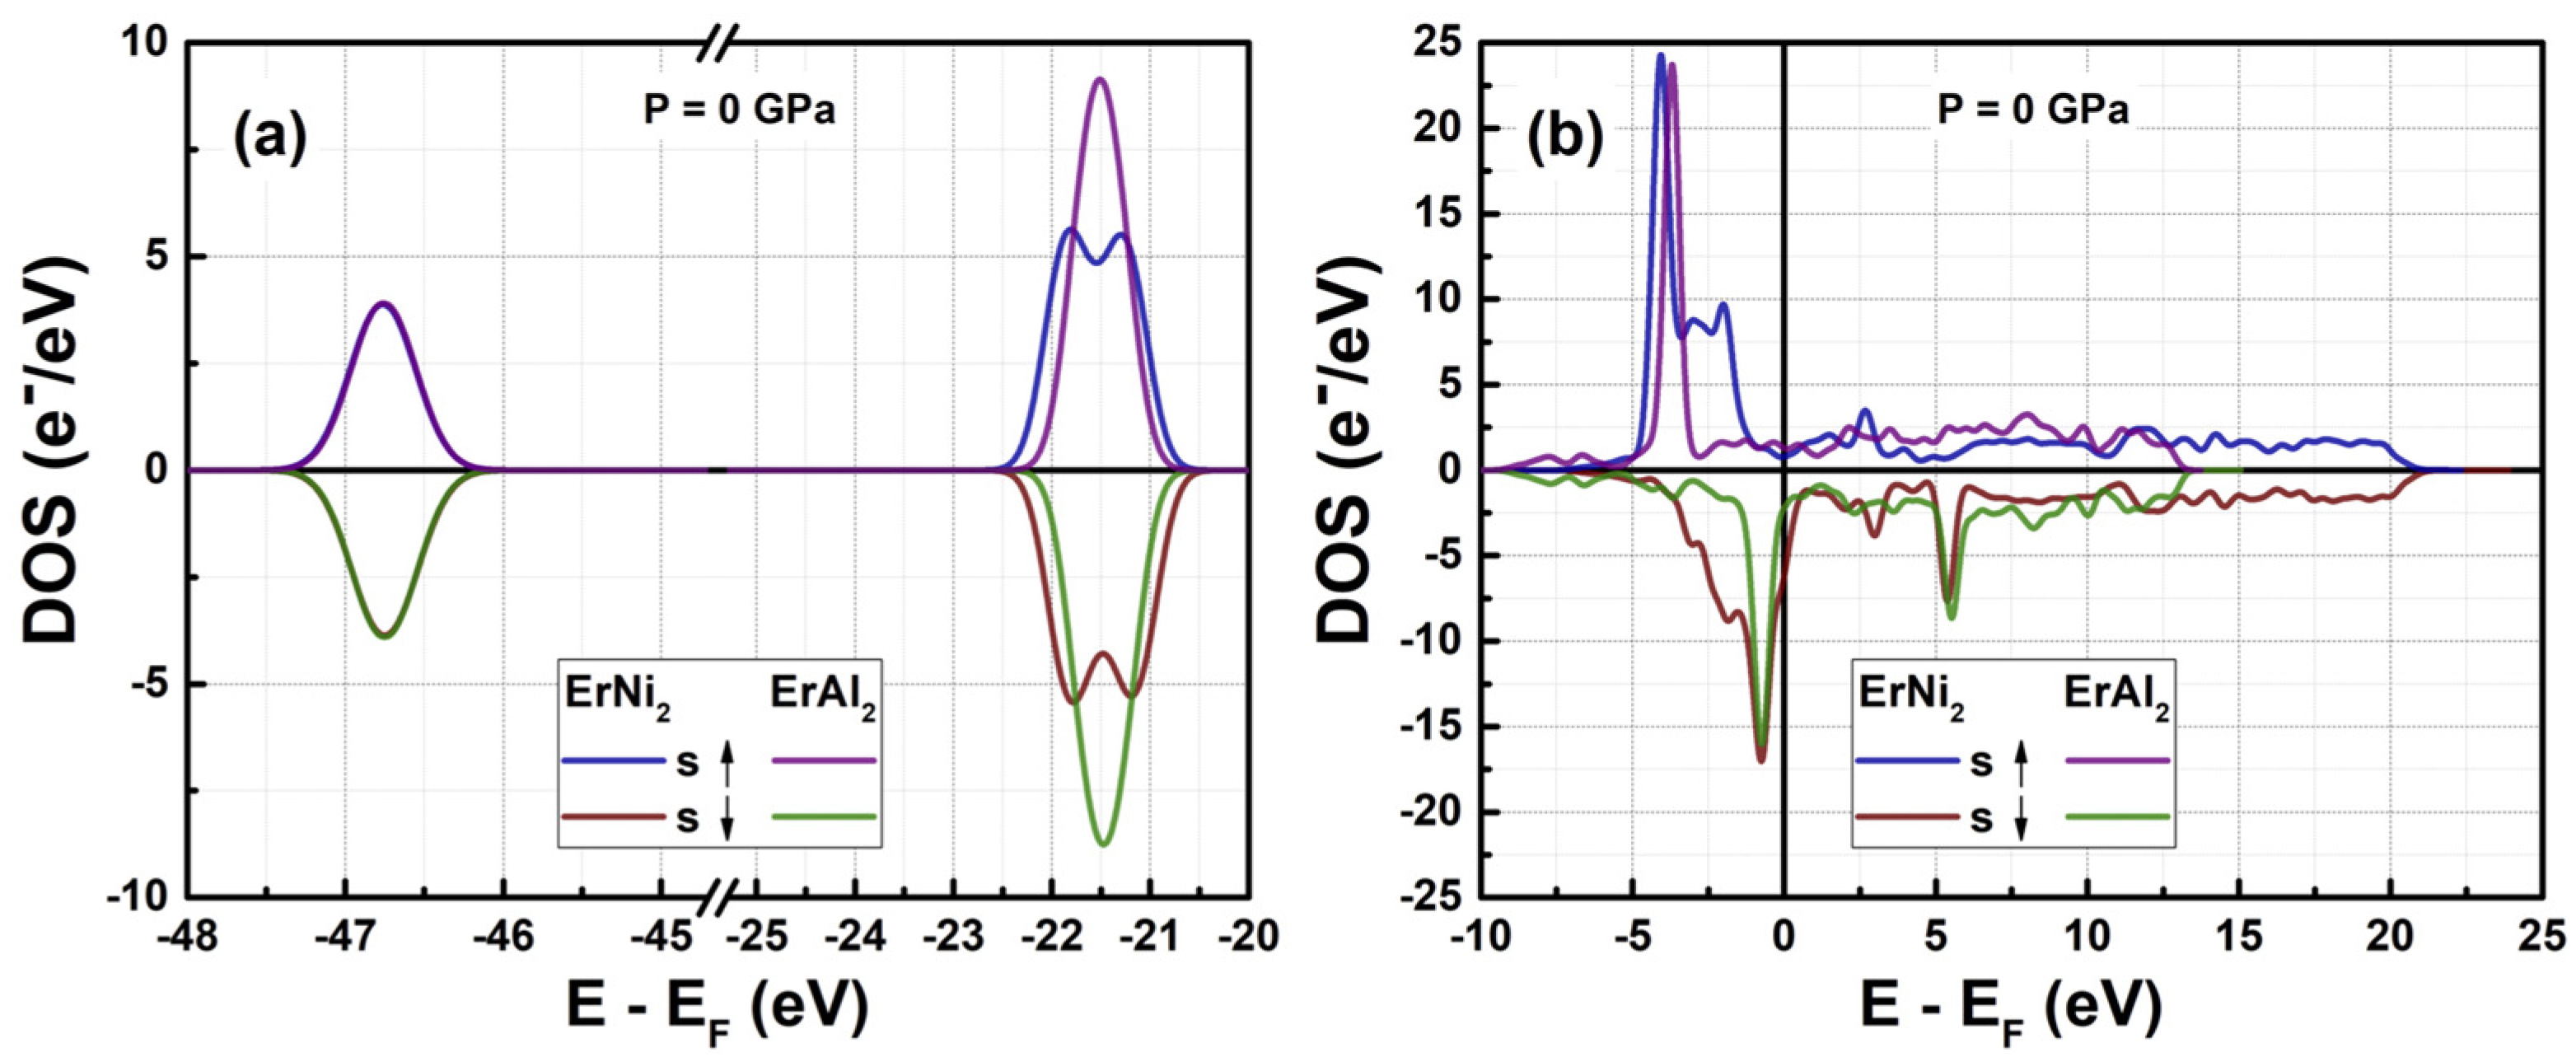
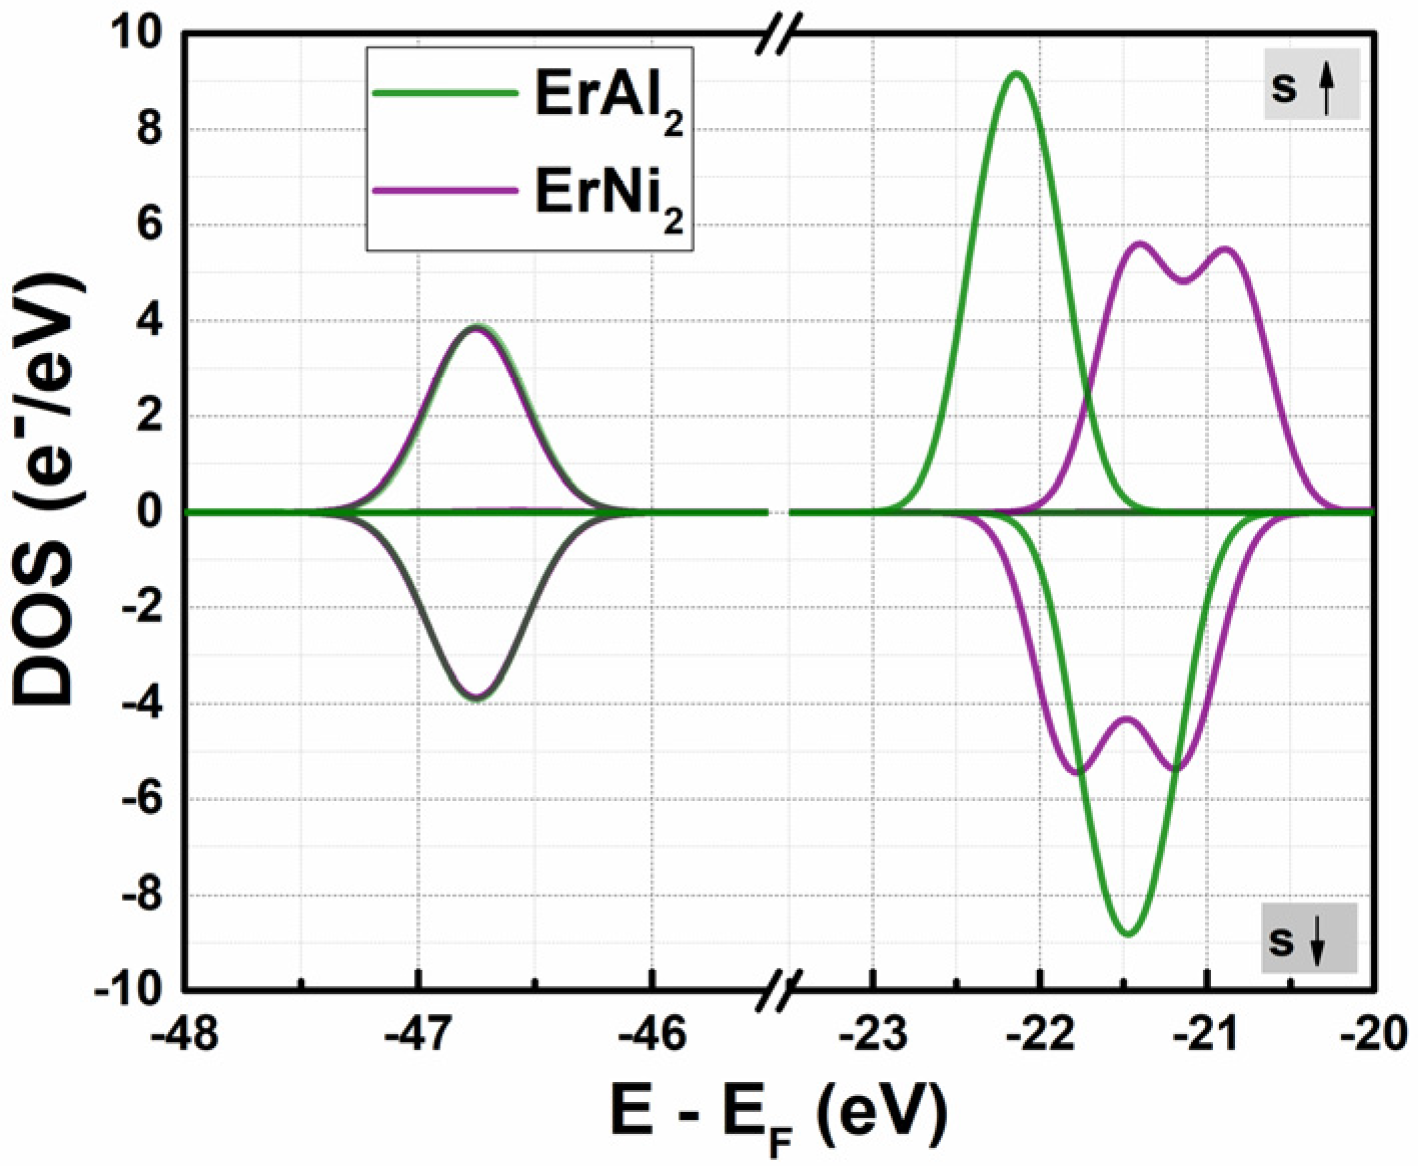
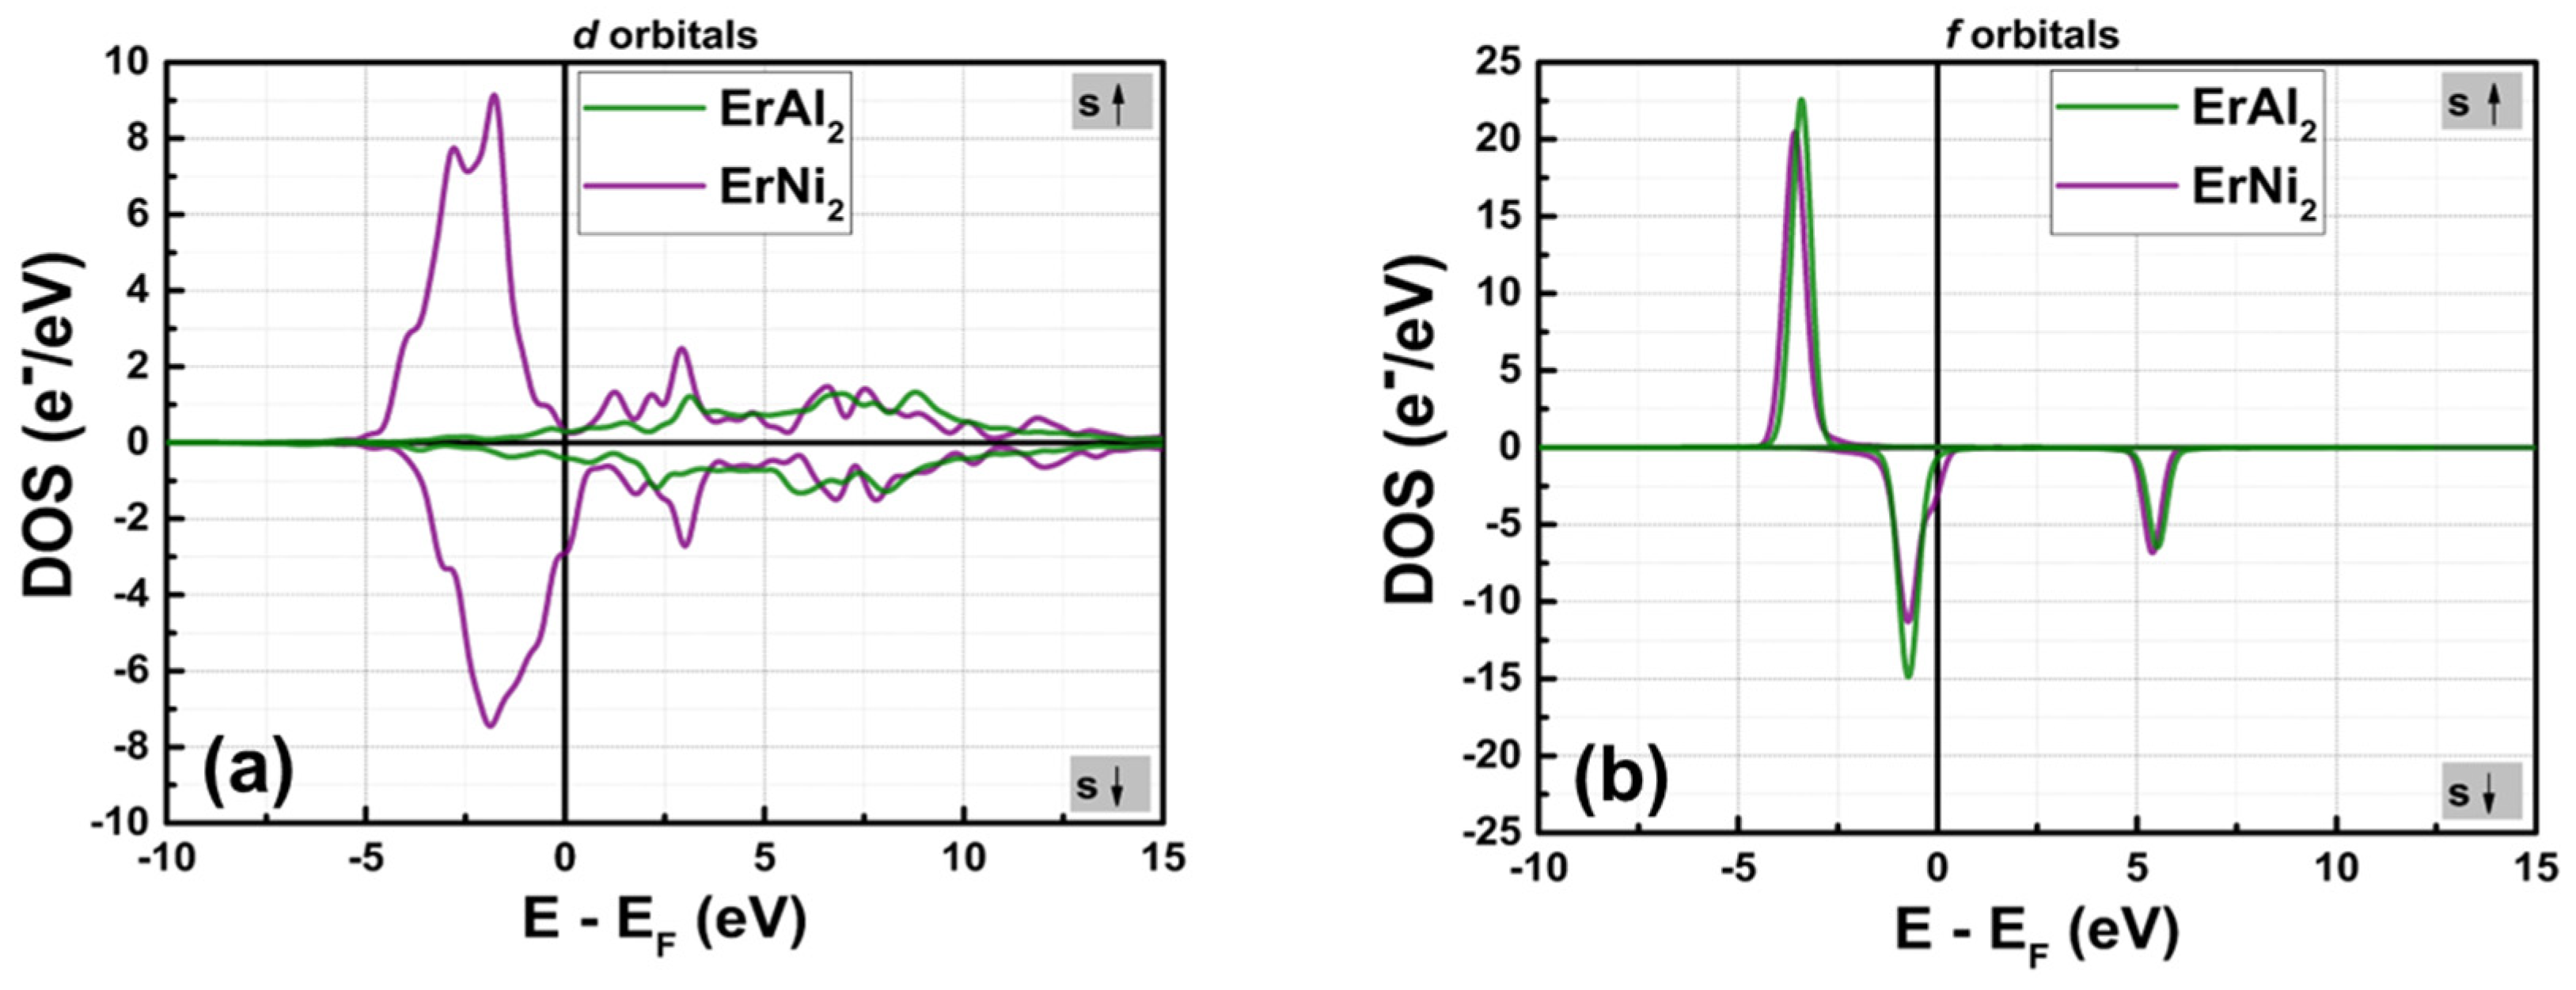
3.1. Electronic Structure at Normal Pressure

Figure 2a,b illustrates the calculated density of states (DOS) for ErAl2 and ErNi2 without hydrostatic pressure. In both cases, the s and p orbitals are localized in deeper energy zones (with peak energy values of around −47 and −22 eV, respectively), and their DOS is almost symmetric in shape (as shown in more detail in Figure 3). Notice in Figure 3 the unfolding of the asymmetric p orbitals when Ni replaces Al in the C15-type crystal structure, which evidences the effect of substituting the post-transition metal (Al) with the transition metal (Ni). The electronic states corresponding to the electrons in s orbitals lie at (E − EF) energies between −48 and −46 eV, while those in p orbitals are at −23 < E − EF < −20 eV, see Figure 2a. The latter indicates that in the ferromagnetically ordered ErAl2 and ErNi2 Laves phases, the p electrons contribute minimally to the net magnetic moment. In contrast, the d and f orbitals are localized around the Fermi energy level (EEF = 0 eV). For ErAl2, 4d and 3d orbitals are a broad band with few electronic states; meanwhile, the Er 4f orbitals are a well-defined peak band. Conversely, for ErNi2 the Ni 3d electronic band is remarkable (compared with Er 4d and 3d states, see Figure 2b) making it difficult to disjoin from Er 4f states.
For ErAl2, the spin-up and spin-down total DOS profiles of d orbitals show remarkable symmetry, like that of the s and p orbitals. This symmetry explains their minimal contribution to the total magnetic moment, as Figure 2b illustrates. Conversely, Figure 2b shows that in ErNi2, the spin-polarized total DOS profiles of d and f orbitals are highly asymmetric, highlighting their significant role in the material’s magnetic behavior. This also indicates that the hybridization between electrons in these two orbitals is more substantial for this compound than for ErAl2, which has fewer unpaired d electrons than ErNi2. The hybridization of d and f orbitals occurs at energies near the Fermi level (i.e., in the −10 < E − EF < 0 eV range). The partial DOS is obtained from total DOS by decomposing into spin-up and spin-down angular momentum channels. The spin-up p-band is shifted compared to spin-down p-band in partial DOS; see Figure 3. In ErAl2, the spin-up p-band has lower energies, and the spin-down p-band is in slightly higher energies. In contrast, the opposite occurs in energies for ErNi2.
Table 1 shows the total magnetic moment value obtained through DOS for the ErAl2 and ErNi2 Laves phases. To determine the net magnetic moment, we used the following expression:
μ T = E 1 E F n S E d E E 2 E F n S E d E
where E1 and E2 denote the initial energies of the electronic states with up and down spins, respectively [39]. The saturated magnetic moment obtained was 4.40 μB/f.u. for ErAl2 and 5.56 μB/f.u. for ErNi2. From these magnetic moment values, the estimated saturation magnetization is approximately 111 Am2/kg for ErAl2 and 109 Am2/kg for ErNi2, both of which align with the experimental values at T = 2 K and μ0H = 5 T reported in the scientific literature for polycrystalline samples [15,16].
For ErAl2, the DFT values correspond to a spontaneous magnetic moment of zero internal magnetic field (4.20 µB/f.u.) along the <001> hard magnetization direction in single crystals [26,40]. The obtained value (4.40 µB/f.u. at T = 0 K) is consistent with the reported spontaneous magnetic moment (4.20 µB/f.u. at T = 4.2 K) by Purwins et al. [26,40], extrapolated from an intermediate magnetic field to the zero internal magnetic field (from 0 T to 8 T). At high magnetic fields (from 10 T to 14 T), the saturation magnetic moment rises to 5.3 µB/f.u. in a single crystal [26,40].
Detailed experimental magnetic measurements by Gignoux and Givord [27] for the ErNi2 single crystal at T = 1.5 K reported a spontaneous magnetic moment of 5.0 µB/f.u. at μ0H = 0 T along the <001> easy magnetization axis. The extrapolated magnetic moment is 5.3 µB/f.u. at zero internal magnetic field. Consequently, when the magnetic field increases to 13 T, the saturation magnetic moment rises slowly and nearly linearly to 5.9 µB/f.u. Our spontaneous magnetic moment calculated through DFT+U is 5.56 µB/f.u. at T = 0 K and agrees with the magnetic experiments along the <001> easy magnetization axis in ErNi2.
Figure 4a,b illustrates the partial density of states (PDOS) for the d and f orbitals of both compounds, calculated without considering hybridization. Figure 4a shows that the shape of the d orbitals changes from almost symmetrical to slightly asymmetrical in their spin-polarized DOS profile, when the post-transition metal (Al) is replaced by the transition metal (Ni). There is a remarkable increase in electron populations per state that indicates how electrons at d orbitals became more important in magnetic behavior as the Al is substituted by the Ni element. The maximum n(EF) value for the d orbitals increases from 0.38 e/eV in ErAl2 to 9.13 e/eV in ErNi2. Consequently, hybridization between the d and f orbitals occurs in the crystal structure of ErNi2. In contrast, in ErAl2 the Al atoms lack unpaired electrons in the d orbitals; therefore, the d and f orbitals are distinguished in the electronic structure, as depicted in Figure 2b and Figure 4b. This behavior results in a reduced contribution of electrons localized in the d orbitals of Al atoms to the net magnetic moment in the electronic structure of ErAl2 compared to that of ErNi2, as shown in Table 2. It is remarkable to note that for both alloys in the spin-up channels, the 4f electrons of rare earth elements are far from the Fermi level, located at −3.41 eV (ErAl2) and −3.57 eV (ErNi2). In contrast, the spin-down channels of the 4f bands are close to the Fermi level, and for both compounds they are located at −0.74 eV; see Figure 4b for more details. Figure 4a illustrates the 4d and 3d bands (with green lines) of Er atoms in ErAl2, which are localized from −1.8 eV to the Fermi level, and the electronic configuration of Al atoms has no d-electrons, while the 3d bands (large peaks in purple lines) corresponding Ni atoms are the majority electronic states compared the states of 4d and 3d bands of Er atoms in ErNi2, as illustrated in the Figure 4a. They are localized between −5 eV and 0 eV for both spin-up and spin-down branches in ErNi2. The hybridization in ErNi2 basically comes from 3d and 4f states. The contribution of d electrons is nearly negligible for ErAl2, while 32% of the net magnetic moment in ErNi2 arises from d electrons, as illustrated in Figure 2b and Figure 4a. For the ErAl2 and ErNi2 compounds, the f orbitals are the most populated, providing the most significant contribution to the net magnetic moment.
Table 2 illustrates the contribution of various orbitals to the net magnetic moment per formula unit (f.u.) derived from partial electronic density of states (PDOS) calculations. The magnetic moment value is negative for electrons localized in the s, p, and d orbitals in ErAl2, indicating that the magnetic moment is oriented opposite to the applied field (which aligns with the spin-up band orientation). A similar situation occurs for ErNi2, where the magnetic moments of the s and p electrons are also oriented against the applied field. On one hand, the high symmetry of the electronic structure of the s and p electrons results in a minimal contribution to the net magnetic moment. On the other hand, the asymmetry in the spin-polarized partial DOS of f-electrons in ErAl2 is responsible for the elevated magnetic moment. The asymmetry in the partial DOS for ErNi2, observed in both the d and f electrons, contributes to a substantial magnetic moment. For ErAl2 the magnetic contribution of electrons at f orbitals in PDOS represent almost the 99.8% of total magnetic moment in TDOS. On the contrary, for ErNi2 the contribution of electrons at d and f orbitals are approximately 25.8% and 69.7%, respectively, due to the rise of electronic population at d orbitals when the post-transition metal (Al) is changed by a transition one (Ni). The contribution of electrons at s and p orbitals is negligible (i.e., 0.8% and 3.7%, respectively) and opposite to the applied field. In RM2 Laves phases when M is a transition metal, the magnetic behavior comes basically from d and f electrons [10,27].

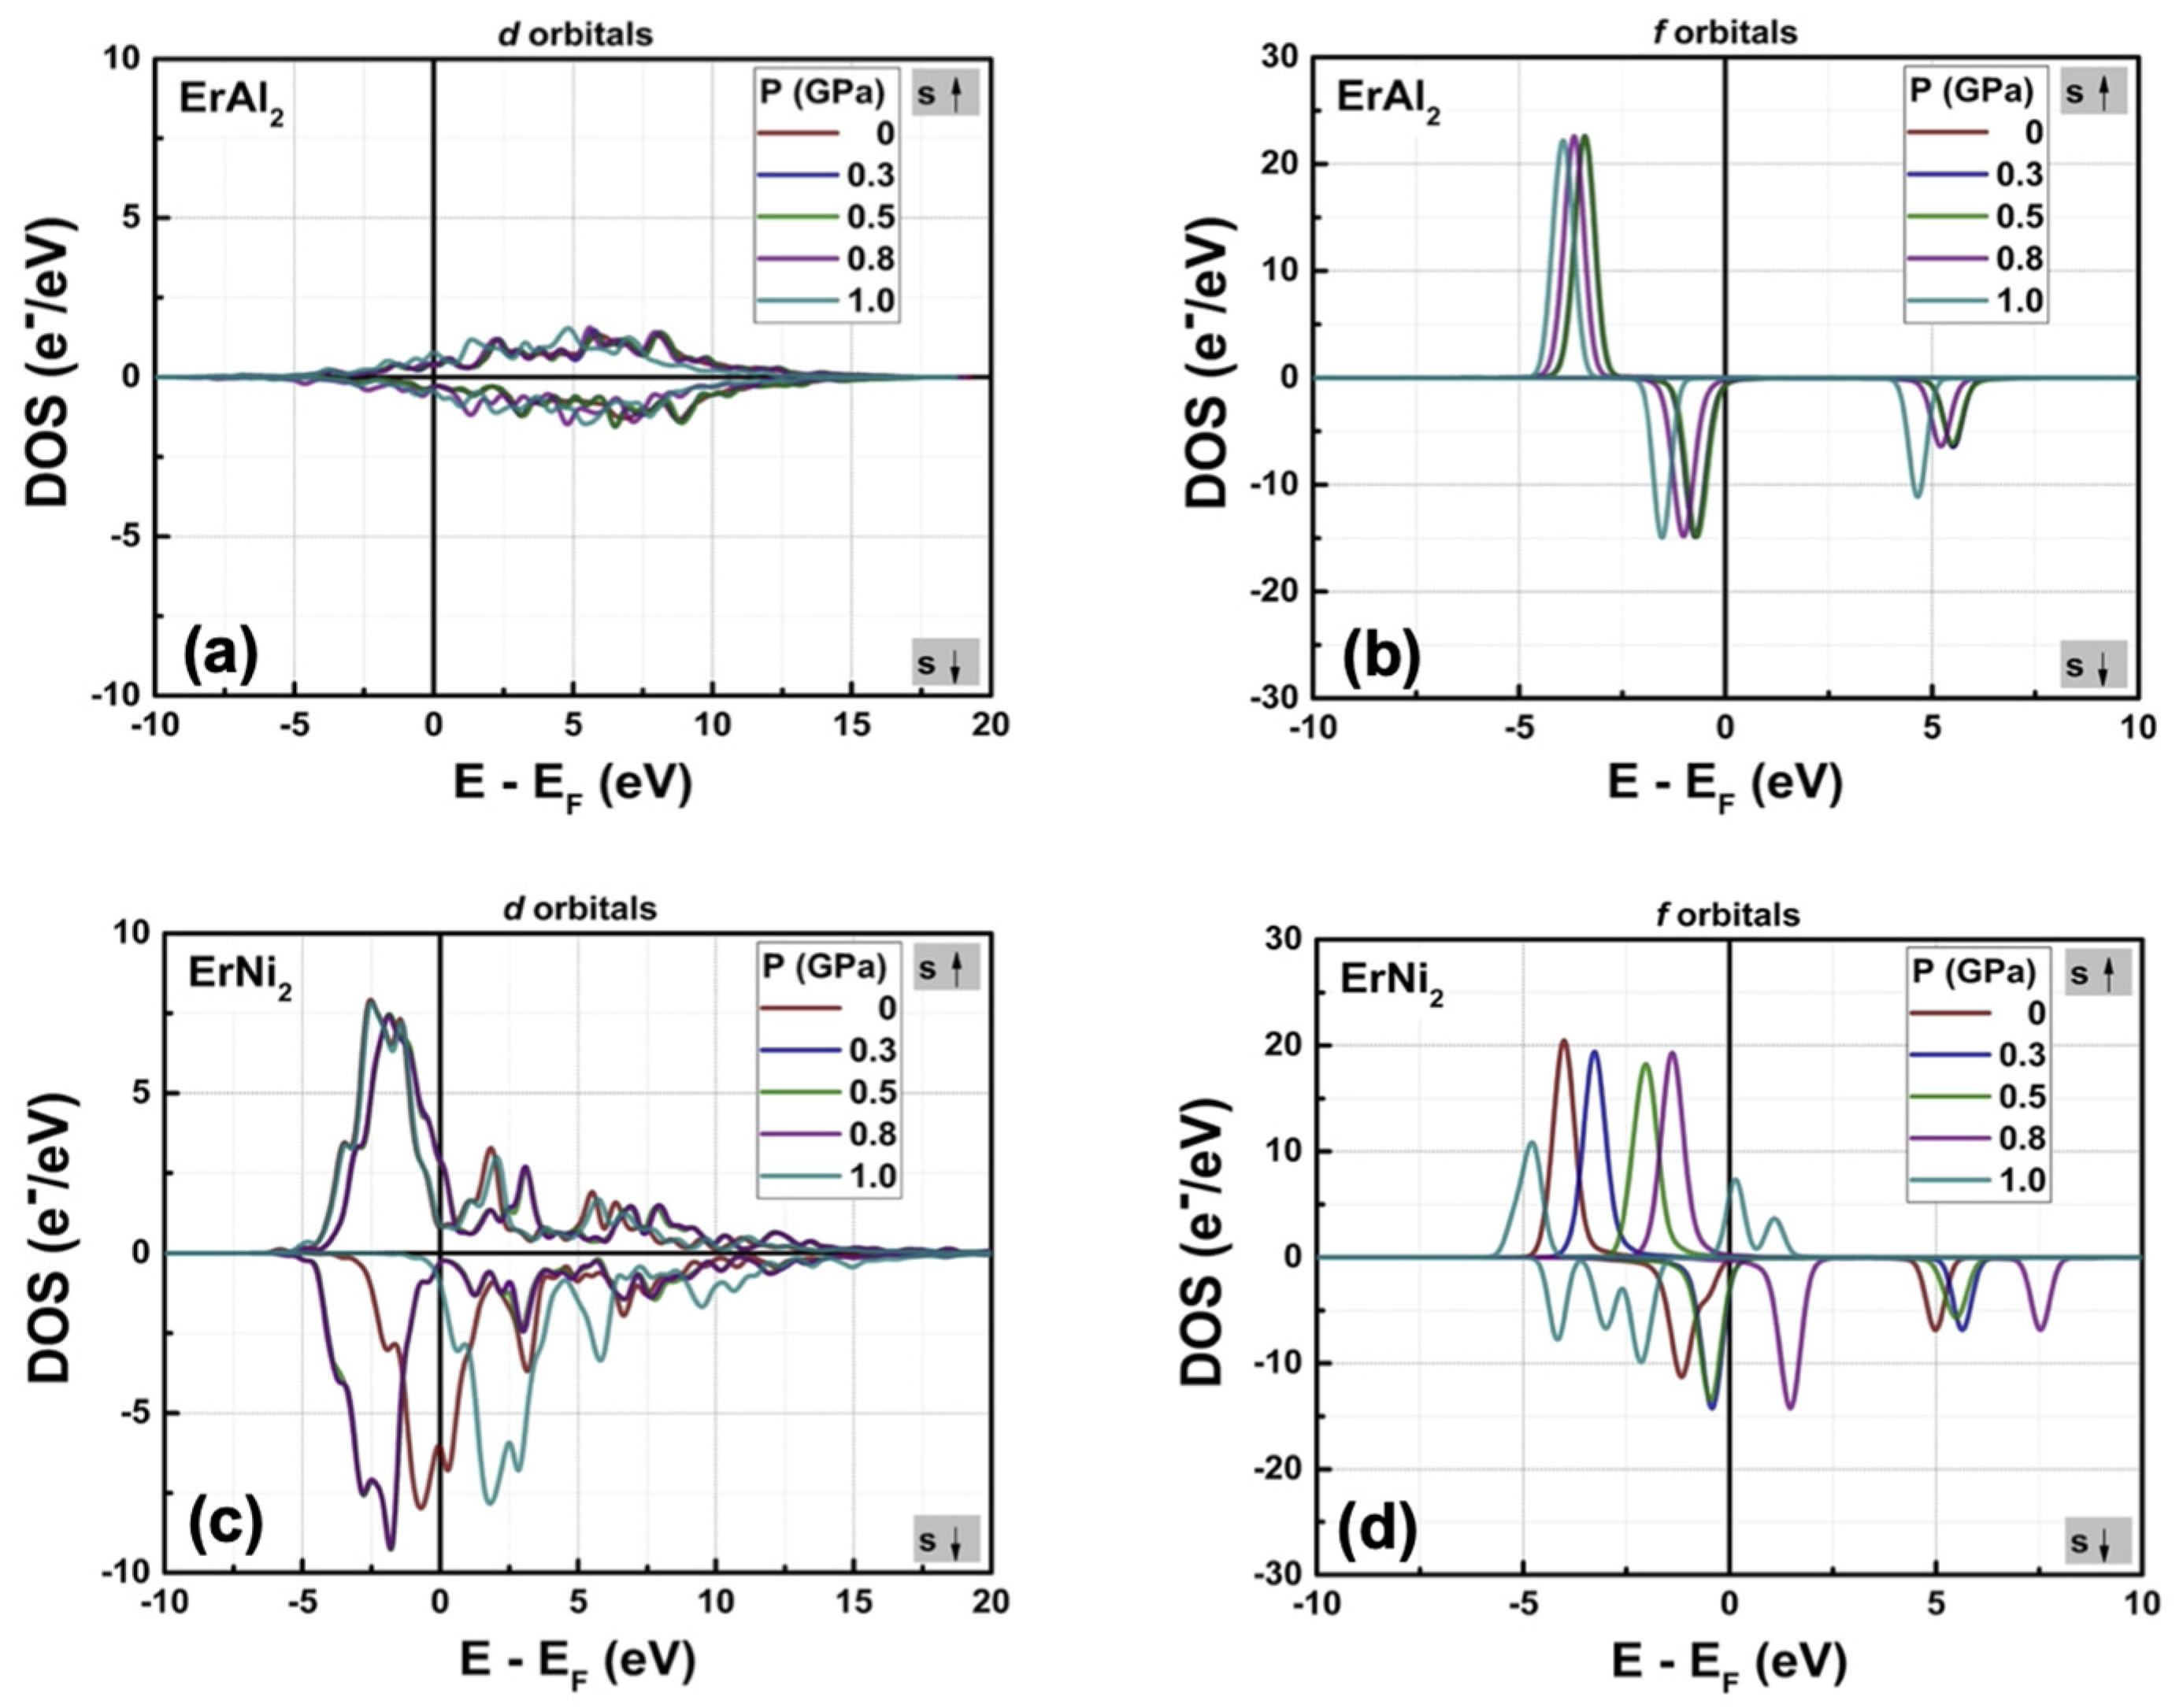
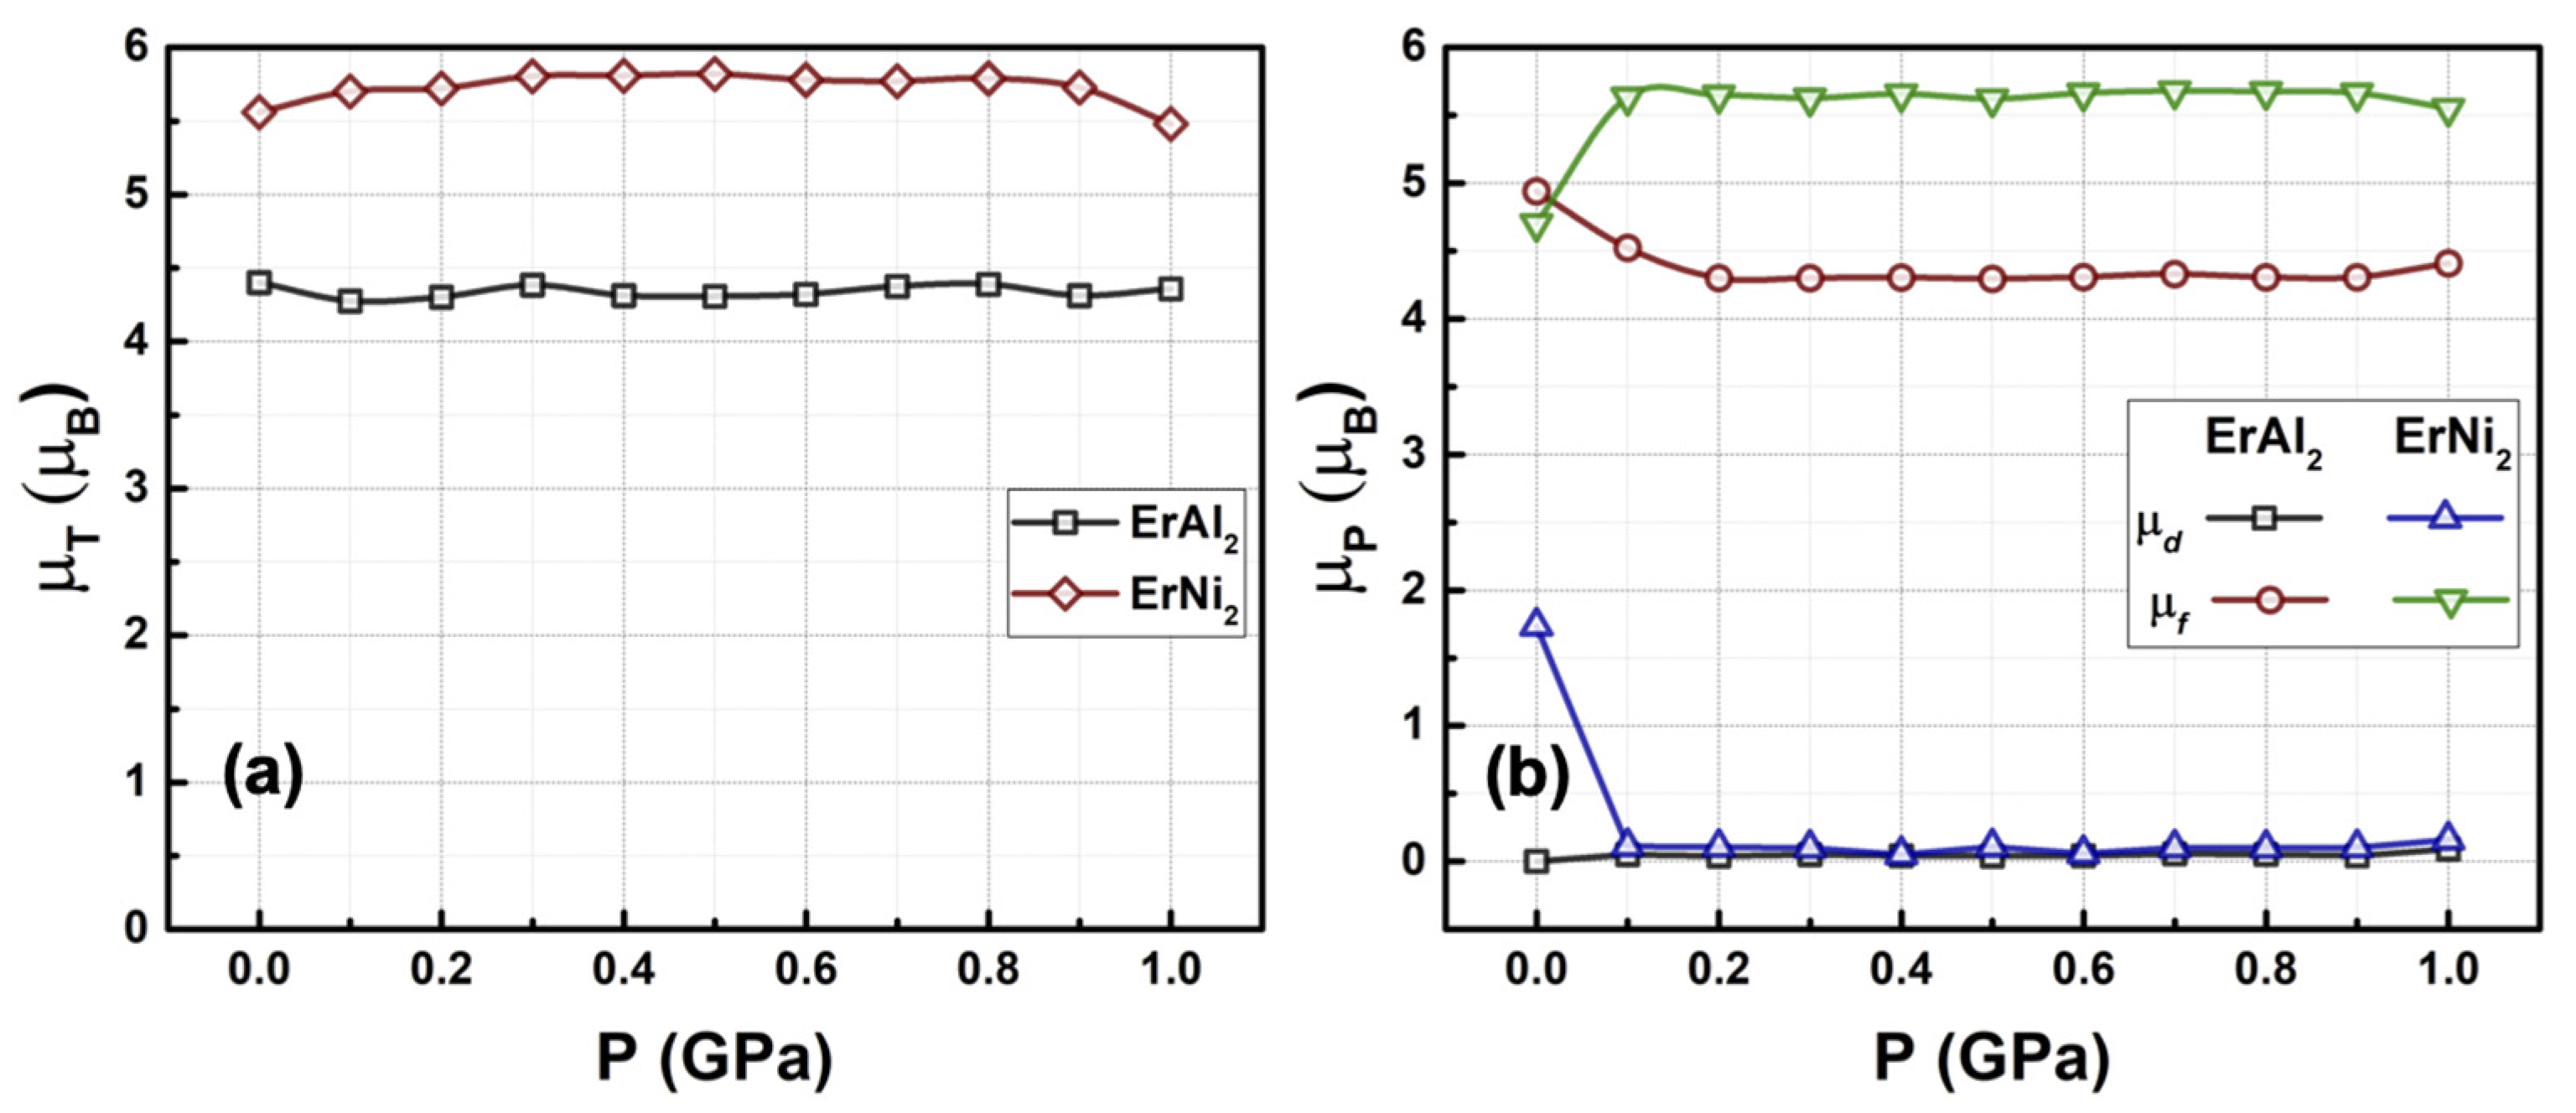
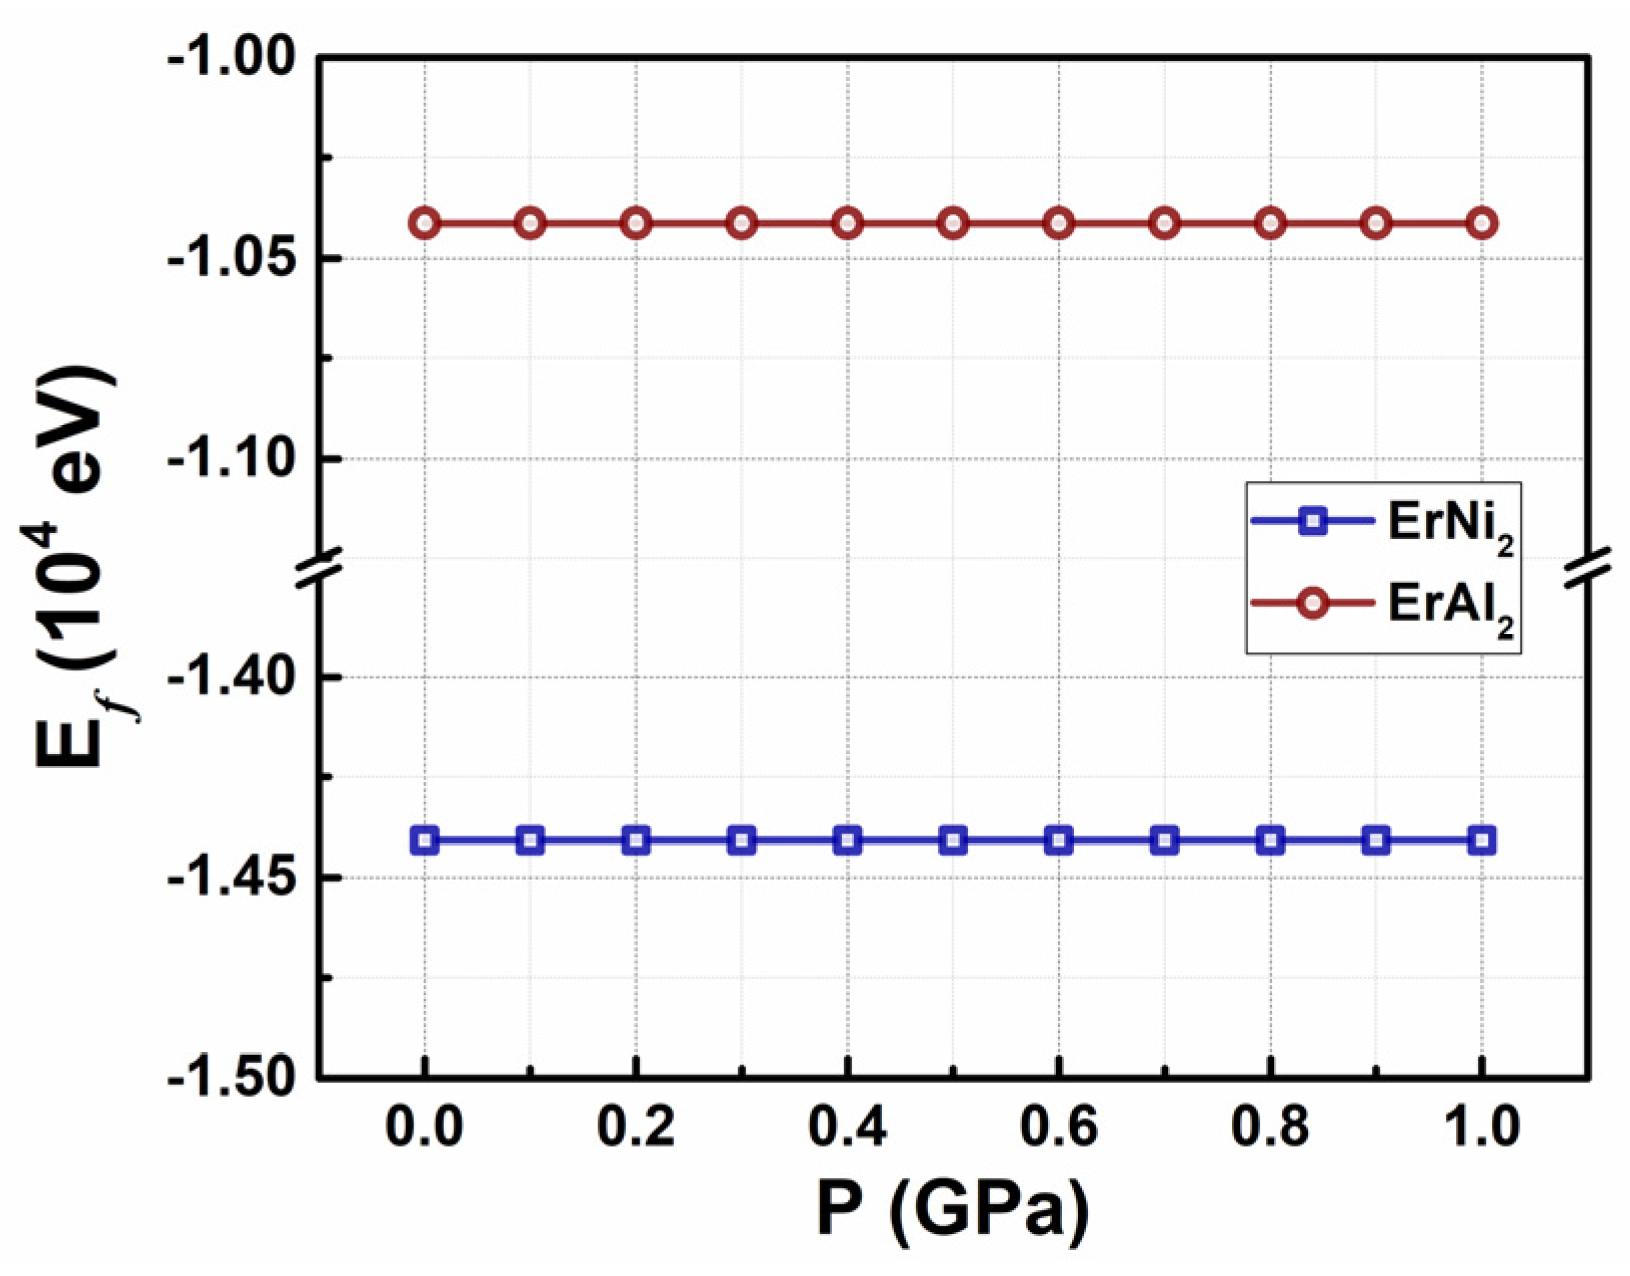
3.2. Electronic Structure at Moderate Hydrostatic Pressures

Figure 5a–d shows the calculated density of states (DOS) for the ferromagnetic ground state of ErAl2 and ErNi2 Laves phases under external hydrostatic pressures ranging from 0 GPa to 1.0 GPa. First, it is essential to note that the s and p orbitals remain nearly symmetric across all hydrostatic pressures and exhibit low electronic occupation compared to the d and f orbitals (refer to Figure 6a–d for additional details on the partial density of states, PDOS). Conversely, in both compounds, the p electronic bands are more responsive to pressure than the s bands, shifting slightly toward higher energies while maintaining their symmetric behavior. The electronic population is redistributed per eV for the p and f electronic bands. In both ErAl2 and ErNi2, the s bands maintain their shape. In contrast, the p band in ErAl2 splits into a double peak at P = 1.0 GPa, whereas in ErNi2, a double peak is observed within the range of 0 GPa ≤ P ≤ 1.0 GPa. At P = 1.0 GPa, ErNi2 exhibits a double peak for the spin-up p-band, while the spin-down p-band remains nearly a single peak. Notably, f orbitals are the most electronically populated within the studied pressure range. They shift far from the Fermi level while retaining their asymmetry in the DOS profile as the pressure approaches to 0.9 GPa in ErAl2. Conversely, in ErNi2, the f, d, and p orbitals start to disrupt the DOS symmetry at 1.0 GPa (with each spin-up band shifting to higher energy and the spin-down band remaining at lower energy), as shown in Figure 5d. This indicates the presence of Pauli paramagnetism, which stems from the shift of the spin-up band relative to the spin-down band. When the external hydrostatic pressure rises to 1 GPa, the spin-up 4f bands in ErAl2 alloy move significantly away from the Fermi level compared to P = 0 GPa. They shift from −3.41 eV at 0 GPa to −3.95 eV at 1 GPa for spin-up bands and from −0.74 eV at 0 GPa to −1.55 eV at 1 GPa for spin-down bands, as illustrated in Figure 6b. Conversely, the 4f bands for the ErNi2 alloy shifted closer to the Fermi level for both spin-up and spin-down branches at pressures up to 0.9 GPa. An exception occurs at an external pressure of 1 GPa, where the band splits into several others; see Figure 6d. Figure 6a shows that in ErAl2, the 4d and 3d bands move closer to the Fermi level as the applied external pressures increase to 1 GPa, reaching −1.33 eV and −0.98 eV for the bottom of the spin-up and spin-down branches, respectively. The same occurs for both spin-up and spin-down Ni 3d bands (most electronic states) of ErNi2; they move closer to the Fermi level when the applied external pressure increases from 0 GPa to 1 GPa, as shown in Figure 6c.
Figure 7a illustrates the relationship between the total magnetic moment and the applied hydrostatic pressure for the ErAl2 and ErNi2 Laves phases. Notably, up to 1.0 GPa, the calculated magnetic moment for the ferromagnetic ErAl2 and ErNi2 Laves phases remains nearly constant, with mean values of 4.33 μB/f.u. for ErAl2 and 5.73 μB/f.u. for ErNi2. Figure 7b illustrates how the contributions of electrons from the d and f orbitals to the net magnetic moment vary with pressure in both compounds. In ErAl2, the electrons localized in the f orbitals account for a nearly constant in the entire net atomic magnetic moment across the full pressure range. The 4f magnetic moment for ErAl2 is smoothly decreased when P is going from 0 GPa to 0.2 GPa. The contribution from electrons localized in the 3d orbitals decreases dramatically to zero at 0.1 GPa. As the external hydrostatic pressure increases from 0.1 to 1.0 GPa, the Ni 3d-electron bands do not contribute more the magnetic behavior in ErNi2. As a result, the electrons in the f orbitals are the main contributors to the total magnetic moment in the ferromagnetic ErNi2 Laves phase; the 4f magnetic moment is increased when P is 0.1 GPa. Finally, the large polarization of Er 4f electrons is not further pressure-dependent for both alloys.
The formation energy was calculated by employing the followed formulae:
E f = E T i = 1 n i E i
where ET is the total energy of the system, ni is the number of atoms of the element “i” and Ei is the reference energy of the element “i”. The formation energy for the two studied Laves phases as a function of the applied hydrostatic pressure P, within the range of 0 GPa ≤ P ≤ 1.0 GPa, is illustrated in Figure 8. As indicated by the figure, the stability of the crystalline structures ErAl2 and ErNi2 remains unaffected by the external hydrostatic pressures applied. The formation energy, Ef, is approximately −1.04 × 10⁴ eV for ErAl2 and −1.44 × 10⁴ eV for ErNi2. The primitive cubic lattice parameter, obtained from geometric optimization, decreases from a0 = 5.555 Å at 0 GPa to 5.526 Å at 1.0 GPa for ErAl2. In comparison, the lattice parameter for ErNi2 decreases from a0 = 5.103 Å at 0 GPa to 5.085 Å as the pressure increases from 0 to 1.0 GPa. The relative compressive stress caused by this lattice reduction can be calculated using Δ = (VP − V0)/V0 × 100%, where ΔV is the volume difference VP − V0. Δ reaches values of −1.56% and −1.01% at P = 1.0 GPa for ErAl2 and ErNi2, respectively. Table 3 summarizes the compressive stress values in the crystal structure up to 1.0 GPa and the bulk modulus B, which slightly increase with the hydrostatic pressure dependence and the stress tensor diagonal component σij (i = j = 1, 2, 3). The mean value of ErNi2 bulk modulus (<B> ≈ 131 GPa) is almost twice as large as that of ErAl2 bulk moduli (<B> ≈ 66 GPa); see Table 3. As previously mentioned, based on pressure spin-polarization DFT calculations, the cubic crystalline structures remain stable within the applied range of compressive stress.
In ErAl2 and ErNi2, the dAl-Al and dNi-Ni interatomic distances (between two Al or Ni atoms) decrease by 0.54% and 0.35% under an applied pressure of 1 GPa (see Table 3). Concurrently, the interatomic distances dEr-Al and dEr-Ni (between Er atoms and Al or Ni atoms) diminish by 0.52% and 0.33%, respectively. Note that ErAl2 exhibits greater sensitivity to pressure than the ErNi2 alloy. The interatomic distances change very little with the applied pressure for both Laves phases. This maintains the same ferromagnetic environment for each atom, with only the electronic states adjusting due to the applied hydrostatic pressure. Consequently, the values of the saturation spontaneous magnetic moment remain nearly constant for each Laves phase.

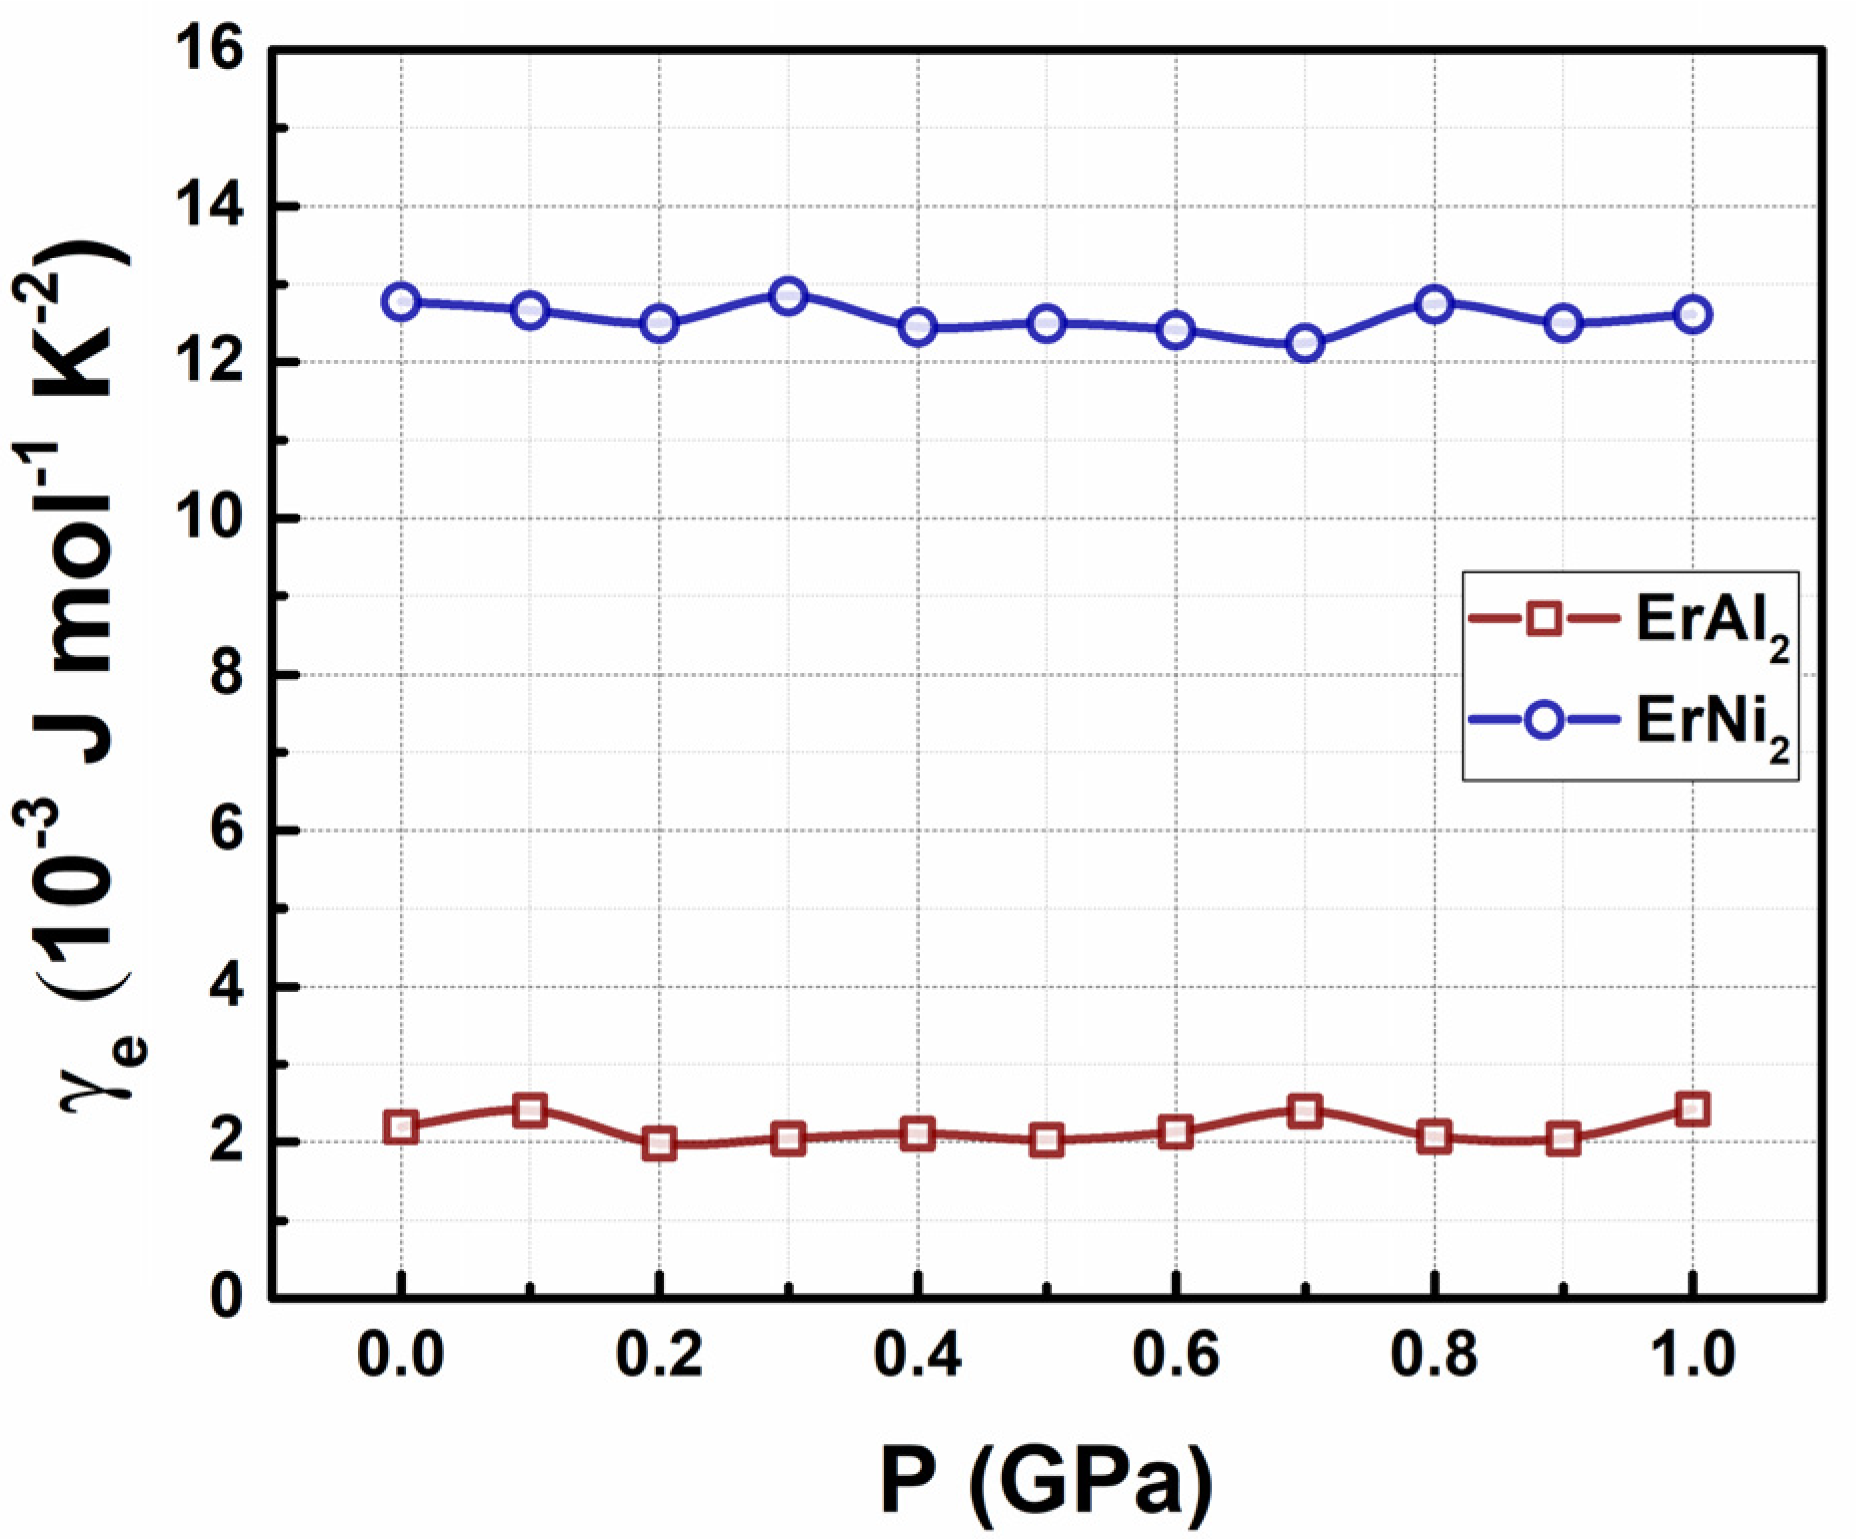
3.3. Determination of Electronic Coefficient in Specific Heat Capacity

From metals theory, in the absence of hydrostatic pressure, the Fermi energy EF at T = 0 K can be calculated as
E F = h 2   k B 2 2   m e 3   N 8   π   V 2 / 3
where N/V represents the electron density and me is the mass of the electron. If one atom contributes one electron to the Fermi gas in the solid, the ErAl2 and ErNi2 compounds exhibit electron densities N/V of 1.687 × 1028 m3 and 2.208 × 1028 m3, respectively (assuming mass densities of 6.20 × 10³ kg/m3 [13,41] and 10.44 × 10³ kg/m3 [42], along with molar masses of 221.223 g mol−1 and 216.468 g mol−1, respectively). Our calculations of the Fermi energy EF and the temperature T F = E F / k B at T = 0 K yield 2.401 eV and 2.788 × 10⁴ K for ErAl2, and 2.873 eV and 3.336 × 10⁴ K for ErNi2. The obtained values align with those reported for other pure metals such as Al (18.1 × 1028 m3, 11.7 eV, 13.6 × 10⁴ K), Au (5.9 × 1028 m3, 5.55 eV, 6.43 × 10⁴ K), and Na (2.65 × 1028 m3, 3.26 eV, 3.78 × 10⁴ K), among others [43]. Thus, the electronic or Sommerfeld coefficient can be calculated using the following formula:
γ e = π 2   k B 2   N A 3   E F = π 2   k B   N A 3   T F
where NA is the Avogadro constant. The obtained γe values from Equation (4) are 1.470 × 10⁻³ J mol−1 K−2 for ErAl2 and 1.229 × 10⁻³ J mol−1 K−2 for ErNi2.
Based on the DFT simulations, we can also calculate the γe coefficient for metals and alloys using the Einstein–Debye model:
c p T = γ e   T + β p h   T 3
where c p ,   e = γ e   T and c p ,   p h = β p h   T 3 denote the electronic and phonon contributions to the specific heat capacity at constant pressure.
In the low-temperature limit (that is, far from the Debye temperature, i.e., T << TD), the electronic coefficient γe in the Sommerfeld approximation can be correlated with the electronic density of states Δn(EF) at the Fermi level [39] using the expression:
γ e =   π 2   k B 2 3 Δ n ( E F )
where kB is the Boltzmann constant. This expression remains valid within the framework of hydrostatic pressure. Figure 9 presents the results obtained from DFT calculations using Equation (6) for the electronic specific heat coefficient of both alloys. At P = 0 GPa, the γe coefficient for ErAl2 is 2.1 × 10 3 J mol−1 K−2, which is in reasonable agreement with previous values calculated from the electron gas model in metals (i.e., 1.470 × 10⁻³ J mol−1 K−2). In contrast, the γe coefficient for ErNi2 at P = 0 GPa reaches 13.0 × 10⁻³ J mol−1 K−2, almost 10 times the value obtained from the electron gas model (i.e., 1.229 × 10⁻³ J mol−1 K−2). As shown in Figure 9, the γe coefficient remains nearly constant for both alloys up to a hydrostatic pressure of 1.0 GPa.

4. Conclusions

Through DFT calculations utilizing the revised Perdew–Burke–Ernzerhof (RPBE) exchange–correlation functional within a Generalized Gradient Approximation (GGA) framework and incorporating Hubbard U correction, we investigated the effects of hydrostatic pressure of up to 1.0 GPa on the stability of the crystal structure, as well as on the electronic and magnetic properties of the cubic Laves phases ErAl2 and ErNi2. The main findings can be summarized as follows: (a) The net spontaneous magnetic moment per formula unit remained constant throughout the entire pressure range considered, with values of 4.40 μB/f.u. for ErAl2 along the <001> hard magnetization axis and 5.56 μB/f.u. for ErNi2 along the <001> easy magnetization axis. (b) The cubic MgCu2-type crystal structure retains its stability up to 1 GPa. At this pressure, the compressive stress affecting the crystalline structure is −1.56% for ErAl2 and −1.01% for ErNi2. The interatomic distances change very little with the applied pressure, which keeps virtually the same ferromagnetic environment for each atom, while a rearrangement of the electronic states (mainly in the f, d, and p orbitals) occurs due to the applied hydrostatic pressure. (c) The electronic contribution to the specific heat aligns in order of magnitude with the anticipated data from the metal gas model and remains stable up to 1.0 GPa. (d) The d-f hybridization lowers electronic states and diminishes the spontaneous magnetic moments.

Author Contributions

Conceptualization, T.L.-S. and C.F.S.-V.; methodology, T.L.-S. and C.F.S.-V.; software, T.L.-S.; validation, T.L.-S., J.L.E.-C. and C.F.S.-V.; formal analysis, T.L.-S., J.L.E.-C. and C.F.S.-V.; investigation, T.L.-S., J.L.E.-C., J.L.S.L. and C.F.S.-V.; resources, J.L.S.L. and C.F.S.-V.; data curation, T.L.-S. and C.F.S.-V.; writing—original draft preparation, T.L.-S. and C.F.S.-V.; writing—review and editing, T.L.-S., J.L.S.L., J.L.E.-C. and C.F.S.-V.; visualization, J.L.S.L. and C.F.S.-V.; supervision, C.F.S.-V.; project administration, J.L.S.L.; funding acquisition, J.L.S.L. and C.F.S.-V. All authors have read and agreed to the published version of the manuscript.

Funding

This research was funded by CONAHCyT, under the research project CF-2023-I-2143 and CBF-2025-G-1263.

Data Availability Statement

The data supporting this study’s findings are available from the corresponding author upon reasonable request.

Acknowledgments

This work was supported by CONAHCyT, México, under the research projects CF-2023-I-2143 and CBF-2025-G-1263 and Laboratorio Nacional de Nanociencias y Nanotecnología (LINAN, IPICyT). The authors thank Universidad Autónoma de Ciudad Juárez for providing BIOVIA Materials Studio 2020 (20.1.0.5) software licensing to perform materials science modeling and simulations. T. López-Solenzal thanks the financial support from CONAHCyT, México, for his PhD studies. C.F. Sánchez-Valdés acknowledges the support from IIT-UACJ for his research activities.

Conflicts of Interest

The authors declare that they have no known competing financial interests or personal relationships that could have appeared to influence the work reported in this paper.

References

  1. Pecharsky, V.K.; Gschneider, K.A., Jr. Magnetocaloric effect and magnetic refrigeration. J. Magn. Magn. Mater. 1999, 200, 44–56. [Google Scholar] [CrossRef]
  2. Moya, X.; Mathur, N.D. Caloric materials for cooling and heating. Science 2020, 370, 797–803. [Google Scholar] [CrossRef] [PubMed]
  3. Moya, X.; Kar-Narayan, S.; Mathur, N.D. Caloric materials near ferroic phase transitions. Nat. Mater. 2014, 14, 439–450. [Google Scholar] [CrossRef] [PubMed]
  4. Franco, V.; Blázquez, J.S.; Ipus, J.J.; Law, J.Y.; Moreno-Ramírez, L.M.; Conde, A. Magnetocaloric effect: From materials research to refrigeration devices. Prog. Mater. Sci. 2018, 93, 112–232. [Google Scholar] [CrossRef]
  5. Tang, X.; Sepehri-Amin, H.; Terada, N.; Martin-Cid, A.; Kurniawan, I.; Kobayashi, S.; Kotani, Y.; Takeya, H.; Lai, J.; Matsushita, Y.; et al. Magnetic refrigeration material operating at a full temperature range required for hydrogen liquefaction. Nat. Commun. 2022, 13, 1817. [Google Scholar] [CrossRef]
  6. Smith, A.; Bahl, C.R.H.; Bjørk, R.; Engelbrecht, K.; Nielsen, K.K.; Pryds, N. Materials challenges for high performance magnetocaloric refrigeration devices. Adv. Energy Mater. 2012, 2, 1288–1318. [Google Scholar] [CrossRef]
  7. Pecharsky, V.K.; Gschneidner, K.A., Jr. Giant magnetocaloric effect in Gd5(Si2Ge2). Phys. Rev. Lett. 1997, 78, 4494. [Google Scholar] [CrossRef]
  8. Kitanovski, A. Energy applications of magnetocaloric materials. Adv. Energy Mater. 2020, 10, 1903741. [Google Scholar] [CrossRef]
  9. Lyubina, J. Magnetocaloric materials for energy efficient cooling. J. Phys. D Appl. Phys. 2017, 50, 053002. [Google Scholar] [CrossRef]
  10. Gschneidner, K.A., Jr.; Pecharsky, V.K. Binary rare earth Laves phases—An overview. Zeitschrift Kristallogr. 2006, 221, 375–381. [Google Scholar] [CrossRef]
  11. Stein, F.; Leineweber, A. Laves phases: A review of their functional and structural applications and an improved fundamental understanding of stability and properties. J. Mater. Sci. 2021, 56, 5321–5427. [Google Scholar] [CrossRef]
  12. Liu, W.; Bykov, E.; Taskaev, S.; Bogush, M.; Khovaylo, V.; Fortunato, N.; Aubert, A.; Zhang, H.; Gottschall, T.; Wosnitza, J.; et al. A study on rare-earth Laves phases for magnetocaloric liquefaction of hydrogen. Appl. Mat. Today 2022, 29, 101624. [Google Scholar] [CrossRef]
  13. Gschneidner, K.A., Jr.; Pecharsky, V.K.; Tsokol, A.O. Recent developments in magnetocaloric materials. Rep. Prog. Phys. 2005, 68, 1479. [Google Scholar] [CrossRef]
  14. Kumar, K.S.; Hazzledine, P.M. Polytypic transformations in Laves phases. Intermetallics 2004, 12, 763–770. [Google Scholar] [CrossRef]
  15. Sánchez Llamazares, J.L.; Zamora, J.; Sánchez-Valdés, C.F.; Álvarez-Alonso, P. Design and fabrication of a cryogenic magnetocaloric composite by spark plasma sintering based on the RAl2 Laves phases (R = Ho, Er). J. Alloys Compd. 2020, 831, 154779. [Google Scholar] [CrossRef]
  16. Sánchez Llamazares, J.L.; Ibarra-Gaytán, P.; Sánchez-Valdés, C.F.; Ríos-Jara, D.; Álvarez-Alonso, P. Magnetocaloric effect in ErNi2 melt-spun ribbons. J. Rare Earths. 2020, 38, 612–616. [Google Scholar] [CrossRef]
  17. Biswas, A.; Pathak, A.K.; Zarkevich, N.A.; Liu, X.; Mudryk, Y.; Balema, V.; Johnson, D.D.; Pecharsky, V.K. Designed materials with the giant magnetocaloric effect near room temperature. Acta Mater. 2019, 180, 341–348. [Google Scholar] [CrossRef]
  18. Hafner, J.; Wolverton, C.; Ceder, G. Toward computational materials design: The impact of density functional theory on materials research. MRS Bull. 2006, 31, 659–668. [Google Scholar] [CrossRef]
  19. Pan, F.-C.; Lin, X.-l.; Li, J.; Ma, L.; Ma, L.-C.; Cheng, H.M. The electronic structures and Ferromagnetism of Cu-Doped ZnO: The first-principle calculation Study. J. Supercond. Nov. Magn. 2018, 31, 2103–2110. [Google Scholar] [CrossRef]
  20. Patel, P.D.; Shinde, S.; Gupta, S.D. First principle calculation of structural, electronic and magnetic properties of Mn2RhSi Heusler alloy. AIP Conf. Proc. 2018, 2005, 040004. [Google Scholar] [CrossRef]
  21. Wang, S. First-principles prediction of ferromagnetism in transition-metal doped monolayer AlN. Superlattices Microstruct. 2019, 122, 171–180. [Google Scholar] [CrossRef]
  22. Odkhuu, D.; Tsevelmaa, T.; Sangaa, D.; Tsogbadrakh, N.; Rhim, S.H.; Hong, S.C. First-principles study of magnetization reorientation and perpendicular magnetic anisotropy in CuFe2O4/MgO heterostructures. Phys. Rev. B 2018, 98, 094408. [Google Scholar] [CrossRef]
  23. Kanomata, T.; Endo, H.; Mori, S.; Okajima, H.; Hihara, T.; Sumiyama, K.; Kaneko, T.; Suzuki, K. Specific heat of MnAlGe, MnGaGe and MnZnSb. J. Magn. Magn. Mater. 1995, 140–144 Pt 1, 133–134. [Google Scholar] [CrossRef]
  24. Aschauer, U.; Braddell, R.; Brechbuhl, S.A.; Derlet, P.M.; Spaldin, N.A. Strain-induced structural instability in FeRh. Phys. Rev. B 2016, 94, 014109. [Google Scholar] [CrossRef]
  25. He, L.; Zhu, J.; Zhang, L. First-principles study of Structural phase transition, electronic, elastic and thermodynamic properties of C15-type Laves phases TiCr2 under pressure. Physica B Condens. Matter. 2018, 531, 79–84. [Google Scholar] [CrossRef]
  26. Purwins, H.G.; Walker, E.; Barbara, B.; Rossignol, M.F.; Furrer, A. Single crystal magnetization of ErAl2 and interpretation in terms of the crystalline field. J. Phys. C Solid State Phys. 1976, 9, 1025–1030. [Google Scholar] [CrossRef]
  27. Gignoux, D.; Givord, F. Quadrupolar interactions in ErNi2. J. Magn. Magn. Mater. 1983, 31–34, 217–218. [Google Scholar] [CrossRef]
  28. Ibarra-Gaytán, P.J.; Sánchez Llamazares, J.L.; Álvarez-Alonso, P.; Sánchez-Valdés, C.F.; Gorria, P.; Blanco, J.A. Magnetic entropy table-like shape in RNi2 composites for cryogenic refrigeration. J. Appl. Phys. 2015, 117, 17C116. [Google Scholar] [CrossRef]
  29. Eyert, V. A comparative study on methods for convergence acceleration of iterative vector sequences. J. Comput. Phys. 1996, 124, 271–285. [Google Scholar] [CrossRef]
  30. Pfrommer, B.G.; Côté, M.; Louie, S.G.; Cohen, M.L. Relaxation of crystals with the quasi-Newton method. J. Comput. Phys. 1997, 131, 233–240. [Google Scholar] [CrossRef]
  31. Lewars, E. Computational Chemistry: Introduction to the Theory and Applications of Molecular and Quantum Mechanics, 1st ed.; Springer: Dordrecht, The Netherland, 2004; ISBN 0-306-48391-2. [Google Scholar]
  32. Clark, S.J.; Seagall, M.D.; Pickard, C.J.; Hasnip, P.J.; Probert, M.I.J.; Refson, K.; Payne, M.C. First principles methods using CASTEP. Z. Kristallogr. 2005, 220, 567–570. [Google Scholar] [CrossRef]
  33. Bader, R.F.W. The density in density functional theory. J. Mol. Struct. THEOCHEM 2010, 943, 2–18. [Google Scholar] [CrossRef]
  34. Monkhorst, H.J.; Pack, J.D. Special points for Brillouin-zone integrations. Phys. Rev. B 1976, 13, 5188–5192. [Google Scholar] [CrossRef]
  35. Cococcioni, M.; de Gironcoli, S. Linear response approach to the calculation of the effective interaction parameters in the LDA+U method. Phys. Rev. B 2005, 71, 035105. [Google Scholar] [CrossRef]
  36. Anisimov, V.I.; Zaanen, J.; Andersen, O.K. Band theory and Mott insulators: Hubbard U instead of Stoner I. Phys. Rev. B 1991, 44, 943–954. [Google Scholar] [CrossRef]
  37. Moroni, E.G.; Kresse, G.; Hafner, J.; Furthmüller, J. Ultrasoft pseudopotentials applied to magnetic Fe, Co, and Ni: From atoms to solids. Phys. Rev. B 1997, 56, 15629. [Google Scholar] [CrossRef]
  38. Staroverov, V.N.; Scuseria, G.E.; Tao, J.; Perdew, J.P. Test of the ladder of density functionals for bulk solids and surfaces. Phys. Rev. B 2004, 69, 075102. [Google Scholar] [CrossRef]
  39. Cyrot, M.; Lavagna, M. Density of states and magnetic properties of the rare-earth compounds RFe2, RCo2 and RNi2. J. Physique 1979, 40, 763–771. [Google Scholar] [CrossRef]
  40. Taylor, K.N.R. Intermetallic rare-earth compounds. Adv. Phys. 1971, 20, 551–660. [Google Scholar] [CrossRef]
  41. Harris, I.R.; Mansey, R.C.; Raynor, G.V. Rare earth intermediate phases: III. The cubic laves phases formed with aluminium and cobalt. J. Less Common Met. 1965, 9, 270–280. [Google Scholar] [CrossRef]
  42. Gschneidner, K.A., Jr.; Eyring, L. Handbook on the Physics and Chemistry of Rare Earths. In Alloys and Intermetallics; North-Holland: Amsterdam, The Netherlands, 1978; Volume 2, ISBN 0444850228. [Google Scholar]
  43. Tipler, P.A.; Llewellyn, R. Modern Physics, 5th ed.; W.H. Freeman and Company: New York, NY, USA, 2008; ISBN 13 978-0-7167-7550-8/10 0-7167-7550-6. [Google Scholar]
Figure 1. Schematic representation of the cubic MgCu2-type crystal structure (a) and its primitive cell (b) for the ferromagnetically ordered ErM2 Laves phases with M = Al and Ni. Purple and grey spheres represent Er and M atoms, respectively; the arrow in the purple spheres represents the magnetic moment of the rare earth element.
Metals 15 00680 g001
Figure 2. Calculated total density of states (DOS) at P = 0 GPa in ErAl2 and ErNi2 Laves phases for electronic bands: (a) s, p, and (b) d-f. The Fermi level, indicated by the vertical solid line, is set to 0 eV. The vertical arrows indicate the spin-up and spin-down electronic bands in spin polarized DOS.
Metals 15 00680 g002
Figure 3. Calculated partial DOS at P = 0 GPa for the ErAl2 and ErNi2 Laves phases. The spin-up and spin-down electronic bands are indicated by vertical arrows in partial DOS.
Metals 15 00680 g003
Figure 4. Calculated partial electronic DOS for orbitals d (a) and f (b) in the ErAl2 and ErNi2 Laves phases.
Metals 15 00680 g004
Figure 5. Effect of hydrostatic pressure on the calculated total density of states (DOS) in ErAl2 [(a) s and p orbitals, and (b) hybridized d-f orbitals], and ErNi2 [(c) s and p orbitals, and (d) hybridized d-f orbitals].
Metals 15 00680 g005
Figure 6. Evolution of the calculated partial DOS with the applied hydrostatic pressure (0 GPa ≤ P ≤ 1.0 GPa) for the d and f orbitals in ErAl2 [(a,b)] and in ErNi2 [(c,d)] compounds.
Metals 15 00680 g006
Figure 7. Total magnetic moment (a) and magnetic moment per d and f orbitals (b) as a function of the applied hydrostatic pressure (0 GPa ≤ P ≤ 1.0 GPa) for the ErAl2 and ErNi2 Laves phases.
Metals 15 00680 g007
Figure 8. Formation energy as a function of applied hydrostatic pressure (0 GPa ≤ P ≤ 1.0 GPa) for the two studied Laves phases.
Metals 15 00680 g008
Figure 9. Electronic specific heat coefficient as a function of the hydrostatic pressures up to P = 1.0 GPa for ErAl2 and ErNi2 Laves phases.
Metals 15 00680 g009
Table 1. Magnetic moment values obtained from the calculated DOS using Equation (1), the spin-polarized electron numbers of nS↑ and nS↓, and the electronic state difference Δn(EF) at the Fermi level determined for the ferromagnetic Laves phases ErAl2 and ErNi2 along the <001> axis.
CompoundnS↑ (EF)
(e/eV)
nS↓ (EF)
(e/eV)
Δn(EF)
(e/eV)
μ S
B/f.u.)
μ S
B/f.u.)
μ T D F T + U
B/f.u.)
μ T E x p
B/f.u.)
Magnetization
Axis
Reference
ErAl21.31−2.24−0.9330.19−25.804.404.40
4.75
hard[40]
[26]
ErNi20.78−6.20−5.4236.46−30.405.565.30
6.23
easy[27]
[40]
Single crystal with TC = 14 K [26]; Single crystal with TC = 7 K [27].
Table 2. Magnetic moment values of the s, p, d, and f orbitals determined from PDOS calculations for ErAl2 and ErNi2 Laves phases.
Laves PhaseμsB/f.u.)μ pB/f.u.)μdB/f.u.)μfB/f.u.)μPB/f.u.)
ErAl2−0.005−0.002−0.0014.9404.932
ErNi2−0.058−0.2491.7374.7016.131
Table 3. Unit cell volume (VP) of the rhombohedral trigonal structure, bulk modulus B, the diagonal component σij of the stress tensor, and compressive stress (Δ) as a function of the applied hydrostatic pressure for the ErAl2 and ErNi2 phases (0.0 GPa ≤ P ≤ 1.0 GPa).
AlloyErAl2ErNi2
P (GPa)a (Å) dAl-Al (Å)dEr-Al (Å)VP3)Δ (%)B (GPa)σij (GPa)a (Å)dNi-Ni (Å)dEr-Ni (Å)VP3)Δ (%)B (GPa)σij (GPa)
0.05.55512.7773.257121.2180.00063.76–0.001845.10302.5512.99193.9490.000128.13–0.00631
0.15.55302.7763.256121.090–0.10564.53–0.069605.10232.5502.99093.853–0.101128.56–0.10767
0.25.55032.7753.254120.908–0.25564.87–0.164205.10102.5492.98993.737–0.225129.90–0.22623
0.35.54552.7723.251120.590–0.51765.76–0.318885.09992.5482.98893.653–0.314129.89–0.31054
0.45.54342.7713.250120.456–0.62865.96–0.389915.09732.5472.98793.560–0.413130.11–0.40776
0.55.54122.7703.249120.310–0.74866.14–0.471085.09562.5462.98693.464–0.516130.82–0.50732
0.65.53742.7683.247120.062–0.95366.98–0.590765.09392.5462.98593.366–0.620131.39–0.61002
0.75.53452.7673.245119.873–1.10867.08–0.693115.09212.5452.98493.270–0.722131.91–0.71256
0.85.53152.7653.243119.677–1.27067.56–0.798215.09042.5442.98393.182–0.816132.08–0.80705
0.95.52752.7633.242119.324–1.56167.96–0.882245.08882.5432.98293.102–0.901132.88–0.89113
1.05.52592.7623.240119.318–1.56668.04–0.993895.08532.5422.98192.994–1.015133.12–1.00668
Disclaimer/Publisher’s Note: The statements, opinions and data contained in all publications are solely those of the individual author(s) and contributor(s) and not of MDPI and/or the editor(s). MDPI and/or the editor(s) disclaim responsibility for any injury to people or property resulting from any ideas, methods, instructions or products referred to in the content.

