3.1. Microstructural Analysis
Table 1 shows the chemical composition of the Mg-Zn-Ce alloy, with Mg as the base element (93.93 wt.%) and Zn, Ce, and RE as key alloying elements, along with trace impurities.
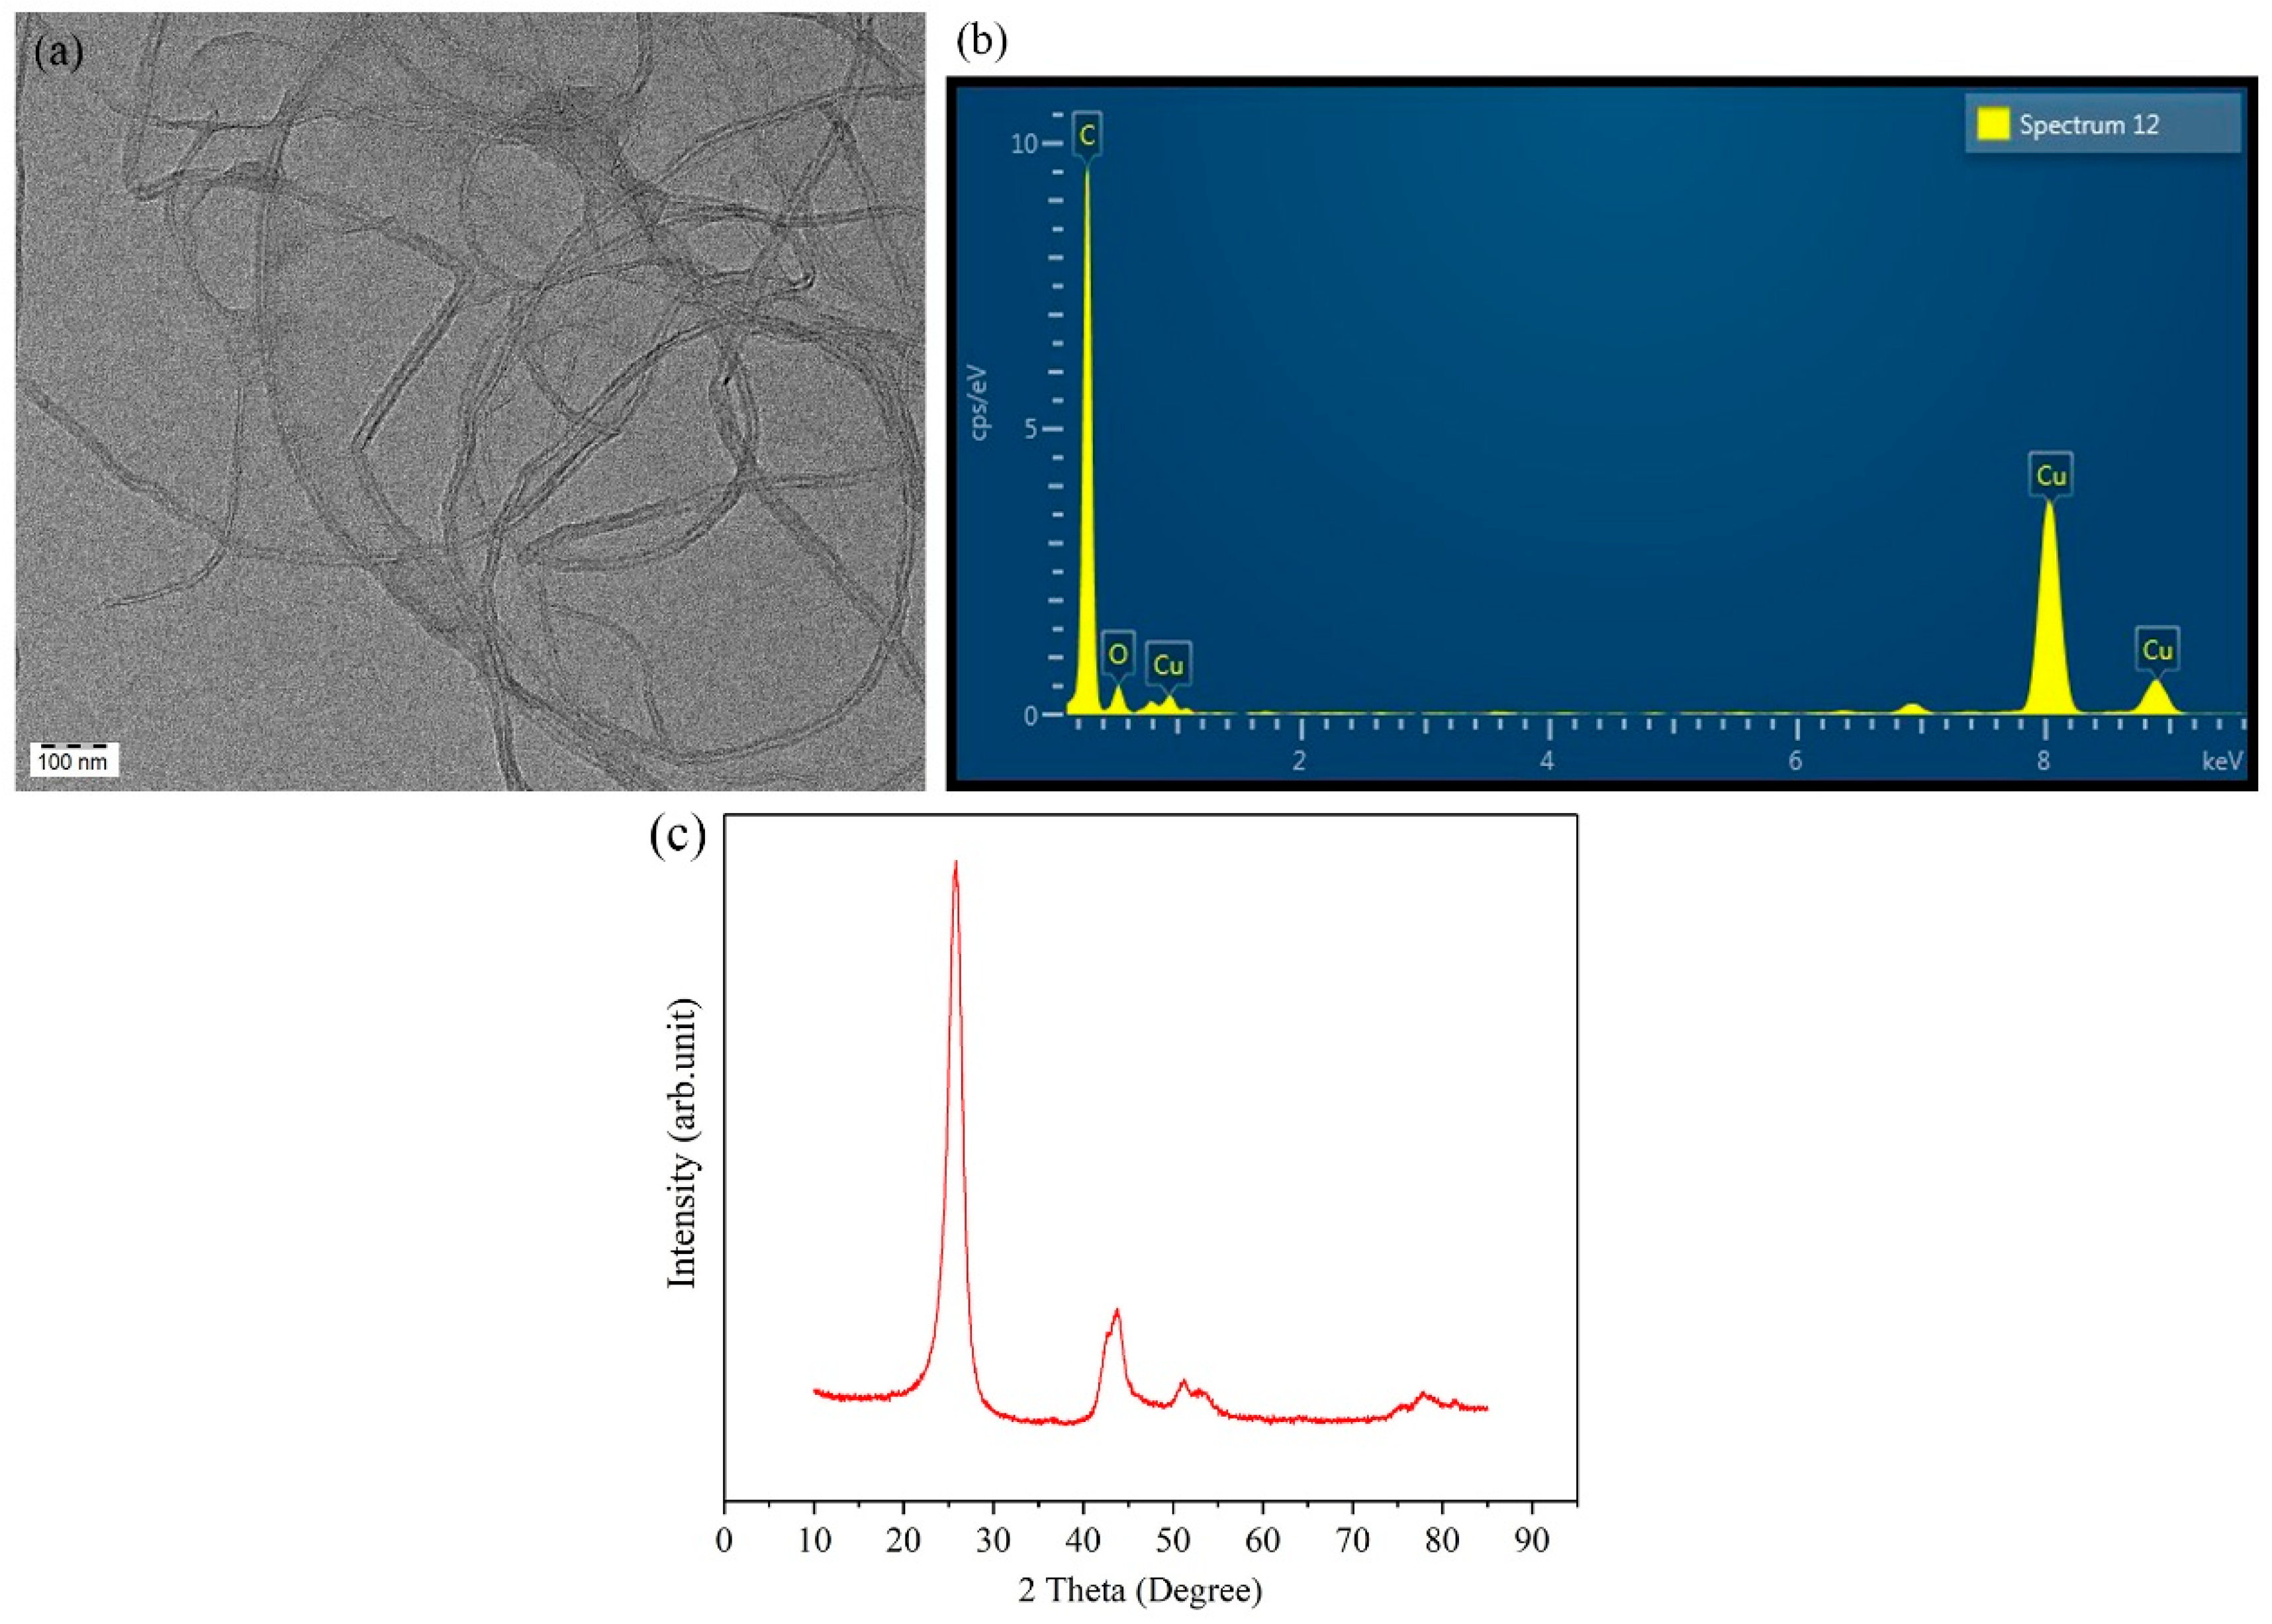
Figure 1a–c highlight the structural features of MWCNTs. The TEM image clearly shows their entangled, tube-like morphology, whereas the EDS spectrum reveals that carbon is the dominant element, with small copper signals possibly arising from the TEM grid. The XRD pattern displays separate (002) and (100) peaks, which indicate the graphitic structure present in multiwalled carbon nanotubes.
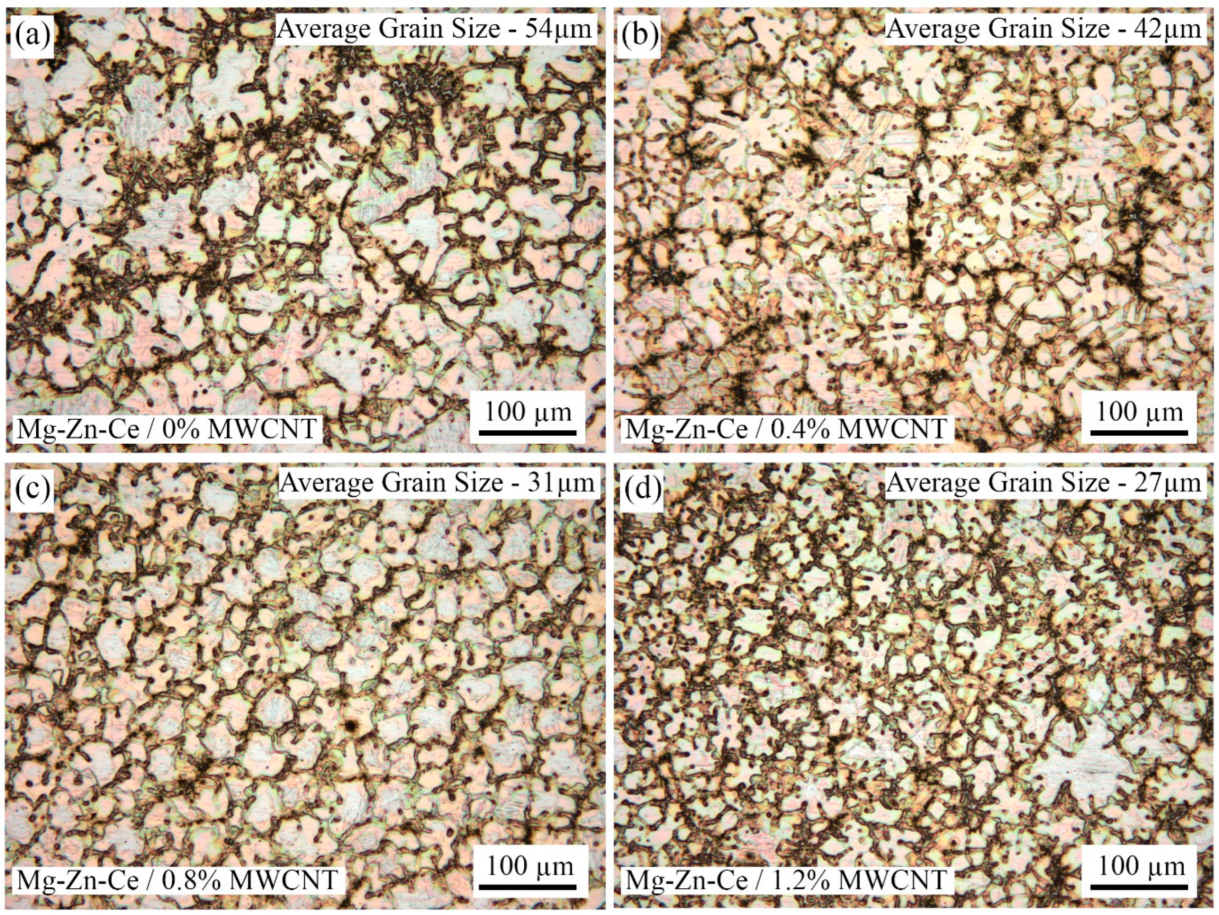
The grain size reduction is evident in the magnesium nanocomposites synthesized by UHSS casting, as depicted in the optical microscope images,
Figure 3a–d. The reduction in grain size is proportional to the increase in MWCNT particles added in the Mg-Zn-Ce matrix. The monolithic alloy has the largest average grain size (AGS) of 104 µm when compared to other nanocomposites, as inferred from the optical microscope images. In 0.4% nanocomposites (AGS-65 µm), the combination of larger grains and smaller grains is visible, which suggests that the MWCNT-induced grain pinning effect is not adequate. The most uniform-looking refined grains (AGS-46 µm) and the least-thick grain boundaries are present in the 0.8% nanocomposite, as seen in
Figure 3c. The 1.2% nanocomposites have the smallest grain size of 37 µm (
Figure 3d); however, the porosities are visible as darker zones in the grain boundaries. The darker regions at the grain boundaries of 1.2% might also be attributed to agglomeration of MWCNT nanoparticles due to inadequate processing parameters [
26]. The densities of the nanocomposites were measured using Archimedes’ principle, and the porosity percentage was calculated. The base alloy showed a theoretical density of 1.8 g/cm
3 and an experimental density of 1.72 g/cm
3 with 4.3% porosity. With 0.4 wt.% MWCNT, the theoretical density was 1.79 g/cm
3, and the experimental density was 1.72 g/cm
3 at 3.8% porosity. For 0.8 wt.% MWCNT, the values were 1.79 g/cm
3 and 1.75 g/cm
3 with 2.1% porosity. Lastly, the 1.2 wt.% MWCNT composite had a theoretical density of 1.78 g/cm
3 and an experimental density of 1.73 g/cm
3 at 3.2% porosity. The 0.8% nanocomposite obtained the highest density when compared to all other nanocomposites, which is due to the presence of MWCNT, which enhanced densification. The density of MWCNTs (1.2 g/cm
3) is lower than that of magnesium alloy (1.8 g/cm
3), but it is closer to that of regular ceramic reinforcements. This lower density contributes to maintaining the lightweight nature of the nanocomposite but is not the primary factor in selecting MWCNTs as reinforcement. The MWCNTs are selected due to their exceptional mechanical strength, high aspect ratio, one-dimensional morphology, reinforcement particle size, high melting point, and thermal stability, along with their density compatibility. The addition of one-dimensional MWCNTs in the Mg-Zn-Ce matrix has initiated multiple nucleation sites and a grain pinning effect, which is the major reason for the grain refinement. Therefore, as the MWCNT concentration increases, the grain size is refined. The interfacial bonding, dispersion behavior, grain refinement by pinning, increased nucleation sites, and good interfacial bonding of MWCNT with the magnesium nanocomposites were the major contributions to the enhanced microstructural changes. The brighter regions are α-Mg primary phase, and the dark-colored spots within the grains are secondary phases, MgZn
2. The ternary phases, Mg
7Zn
3RE, are mainly present at the grain boundaries [
23]. Similarly, the Mg
17Ce
2 and Mg
12Ce phases are also present as secondary phases in the magnesium matrix, with a globular morphology [
30].
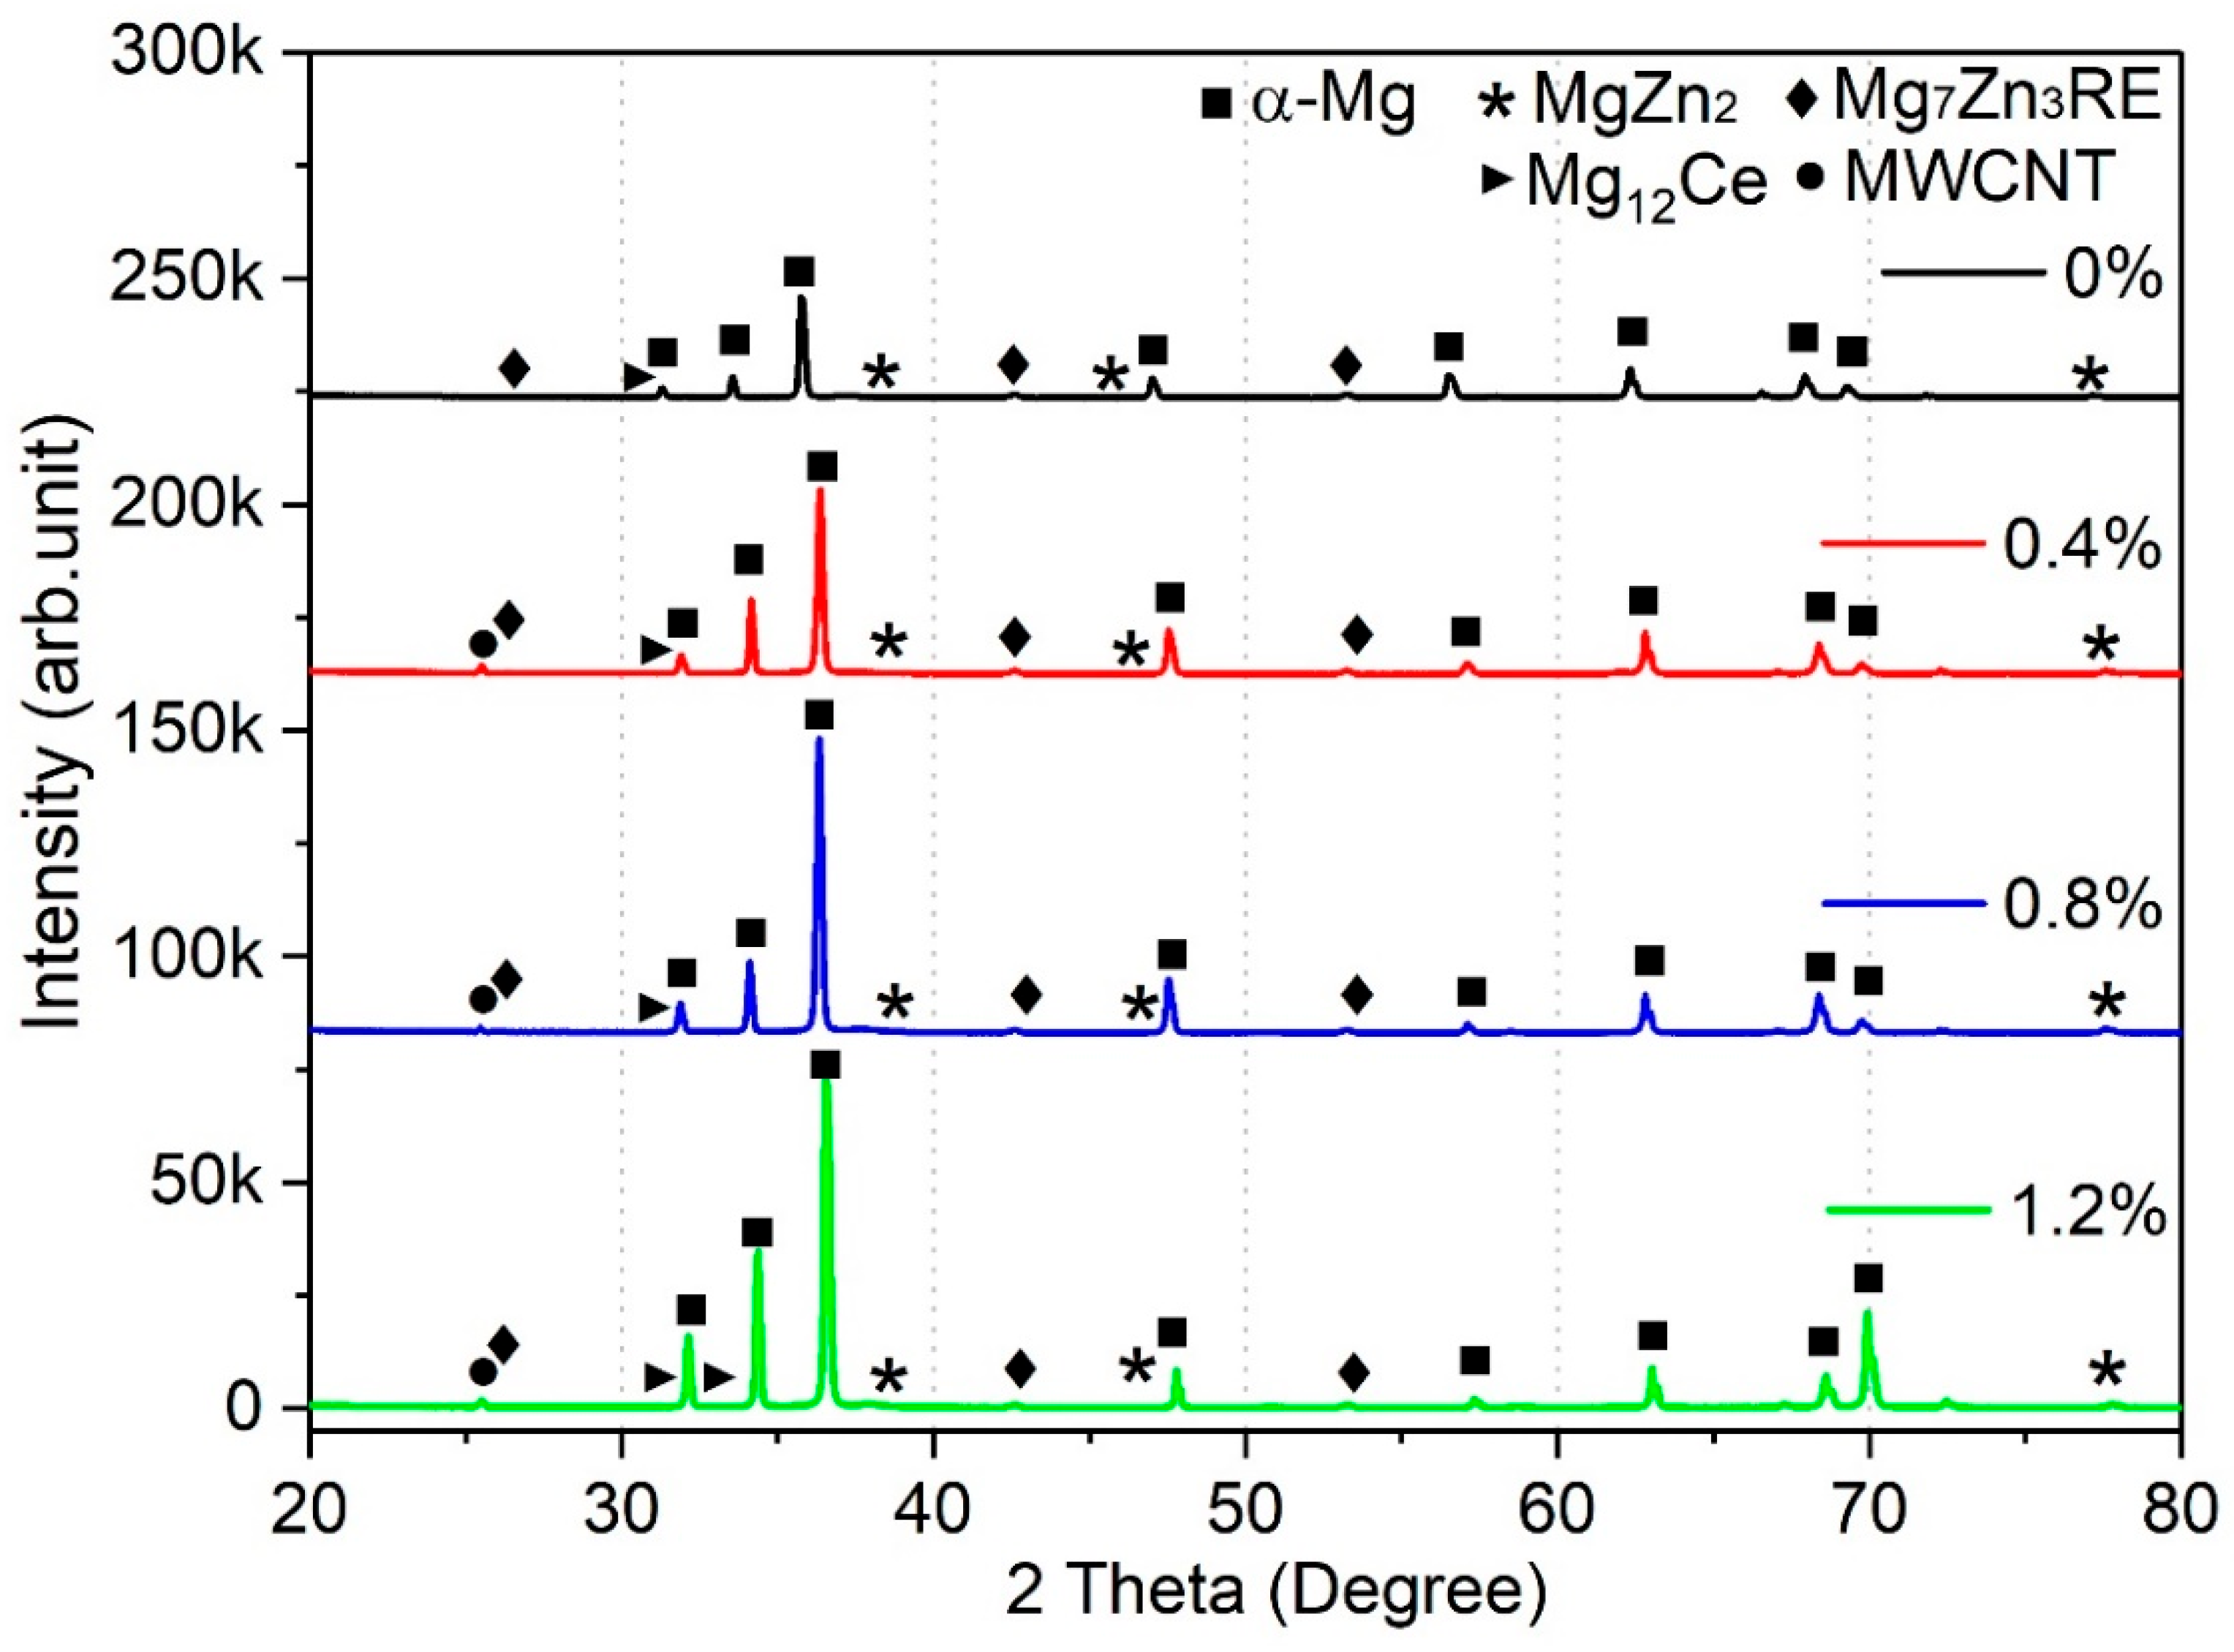
The XRD peaks of Mg-Zn-Ce/MWCNT nanocomposites are represented in
Figure 4. The Mg
7Zn
3RE, MgZn
2, and Mg
12Ce secondary phases are observed in the XRD peaks of all the nanocomposites and monolithic material. These phases are observed and correlated with those of optical microscope images. The intensities of these peaks are increasing as the weight percentage of MWCNT added in the Mg-Zn-Ce nanocomposites, which is attributed to the quantity of secondary phases and their texture changes that happen due to grain refinement [
18]. Additionally, the MWCNT peak is present at 26°; however, the intensity of the peak is substantially less compared to that of Mg phases.
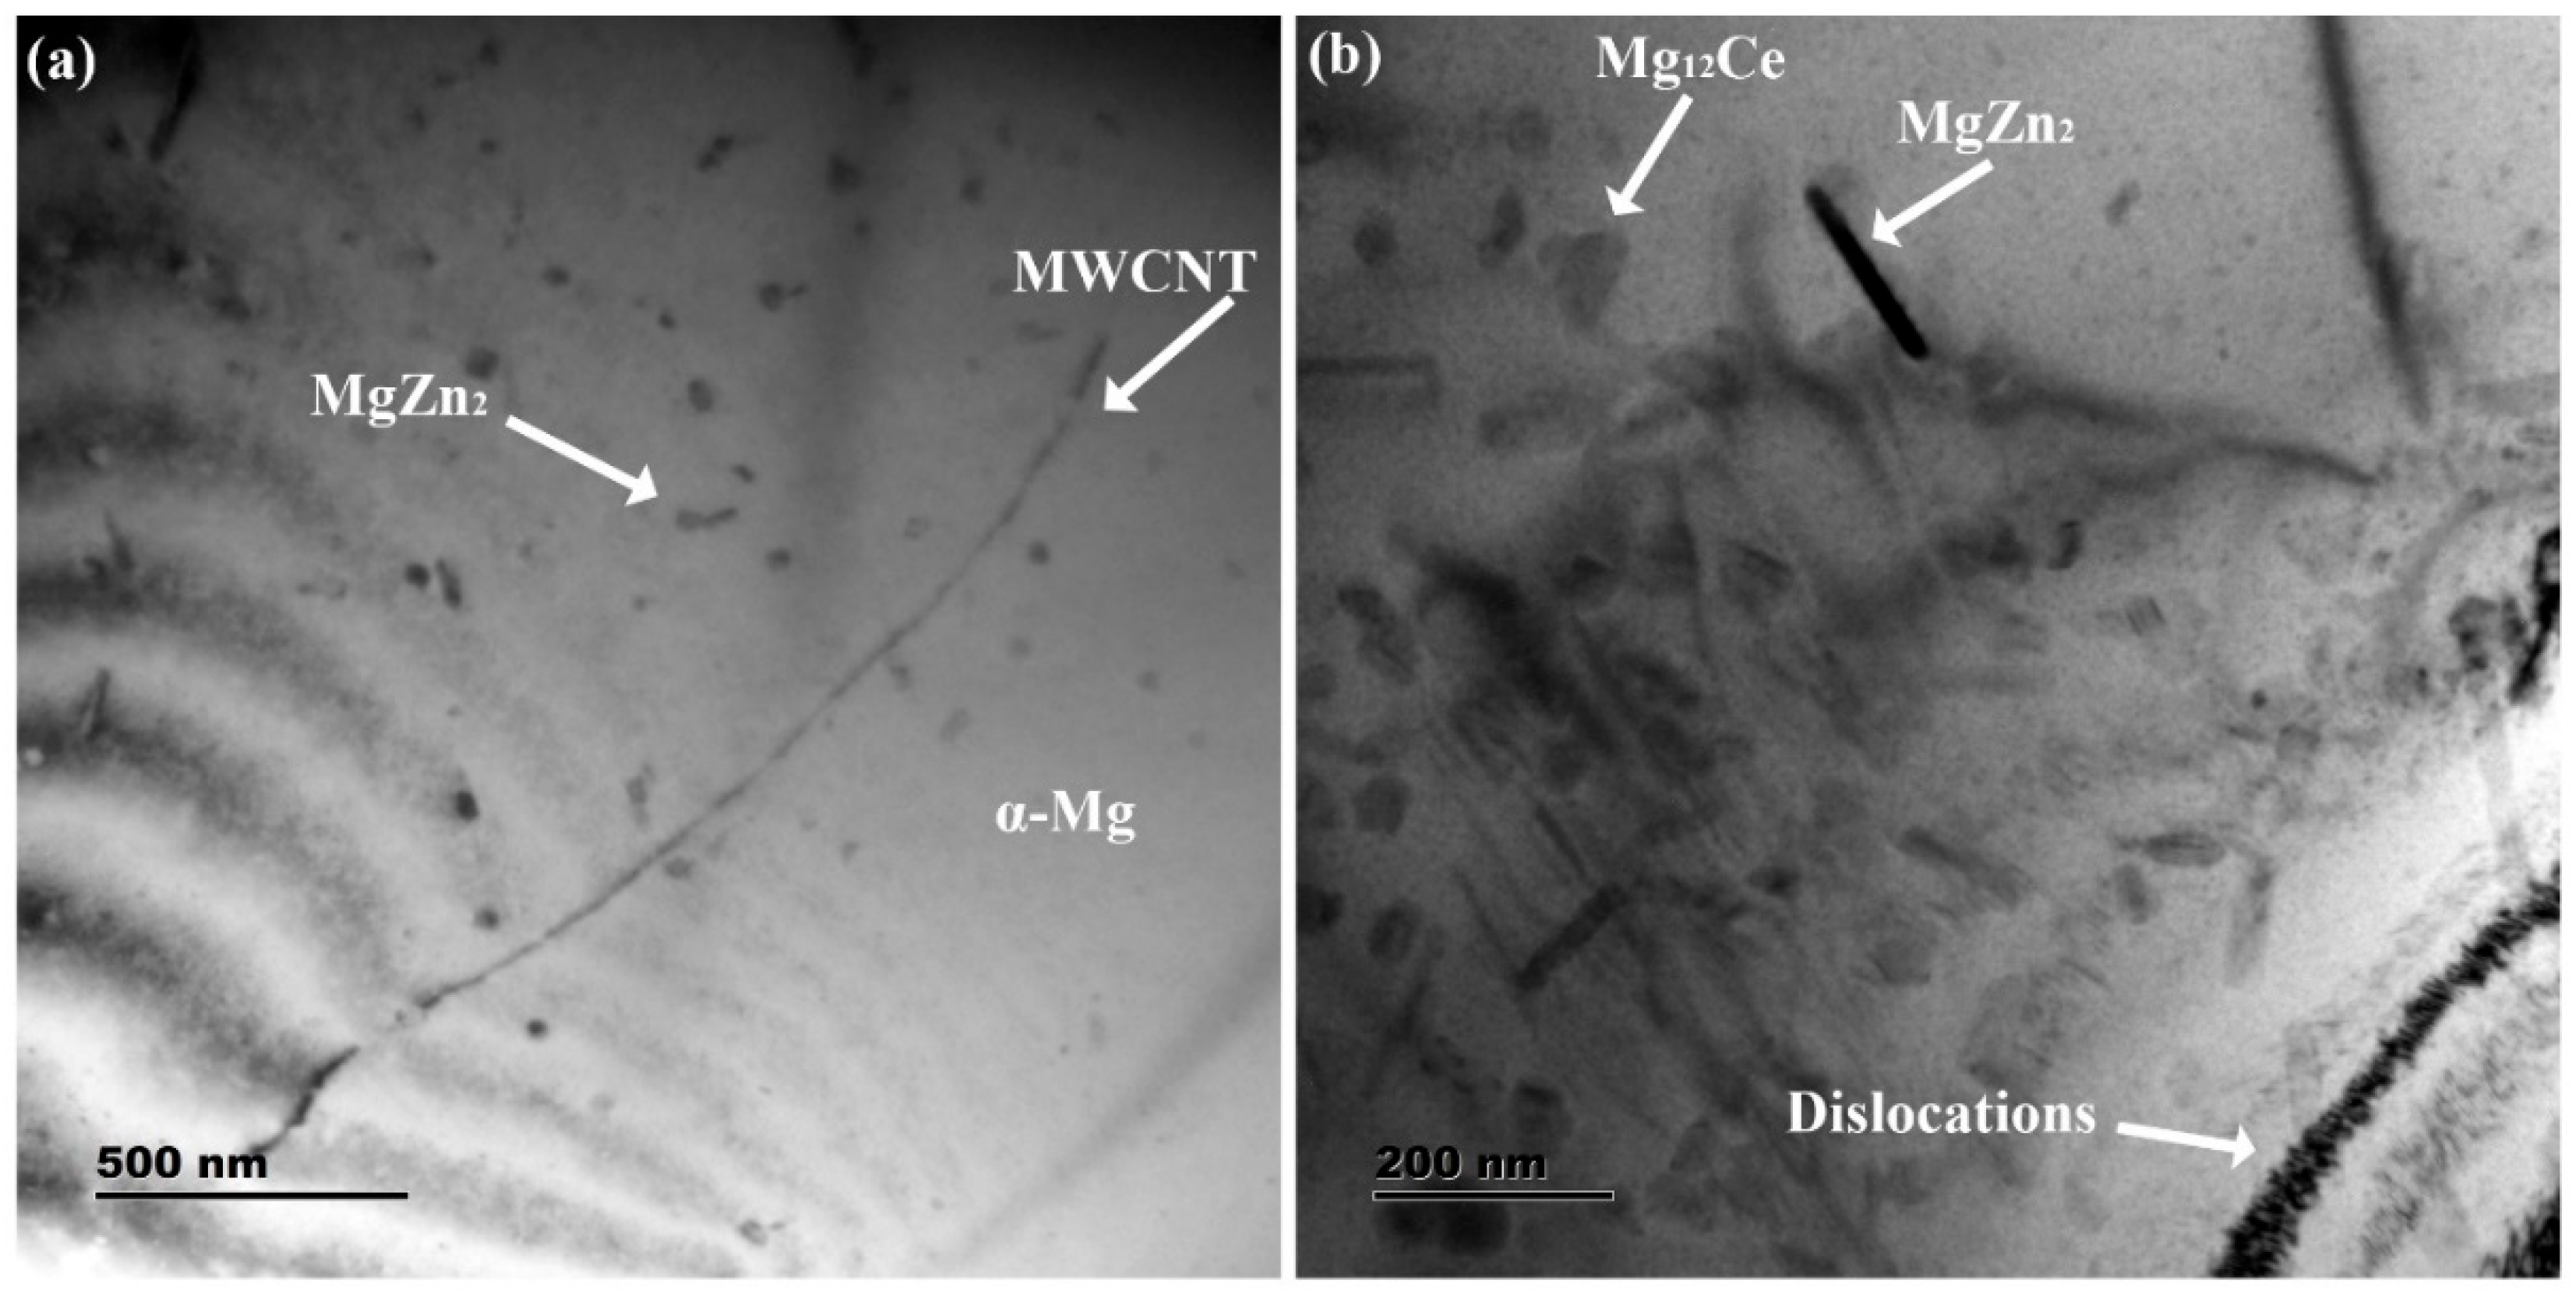
The TEM microstructures of the Mg-Zn-Ce/MWCNT nanocomposites are shown in
Figure 5a,b. The unbounded MWCNT particles, which have no reactive byproducts or interfacial defects, are depicted in
Figure 5a. The needle-shaped MgZn
2 phases are smaller in size and are present near the MWCNT particles [
31]. The reduction in the size of secondary phases is attributed to the thermal diffusivity of Z1 near the MWCNT. However, as seen in
Figure 5b, the dislocation arrays are formed due to the thermal mismatch of α-Mg phases and MWCNT. The dislocations also generate more quantities of secondary phases, such as MgZn
2 and Mg
12Ce. Therefore, the addition of MWCNT as reinforcement in the Mg-Zn-Ce matrix has increased the quantities of secondary phases, which could be correlated to the increase in XRD peak intensities of higher concentration nanocomposites.
3.2. Corrosion Results
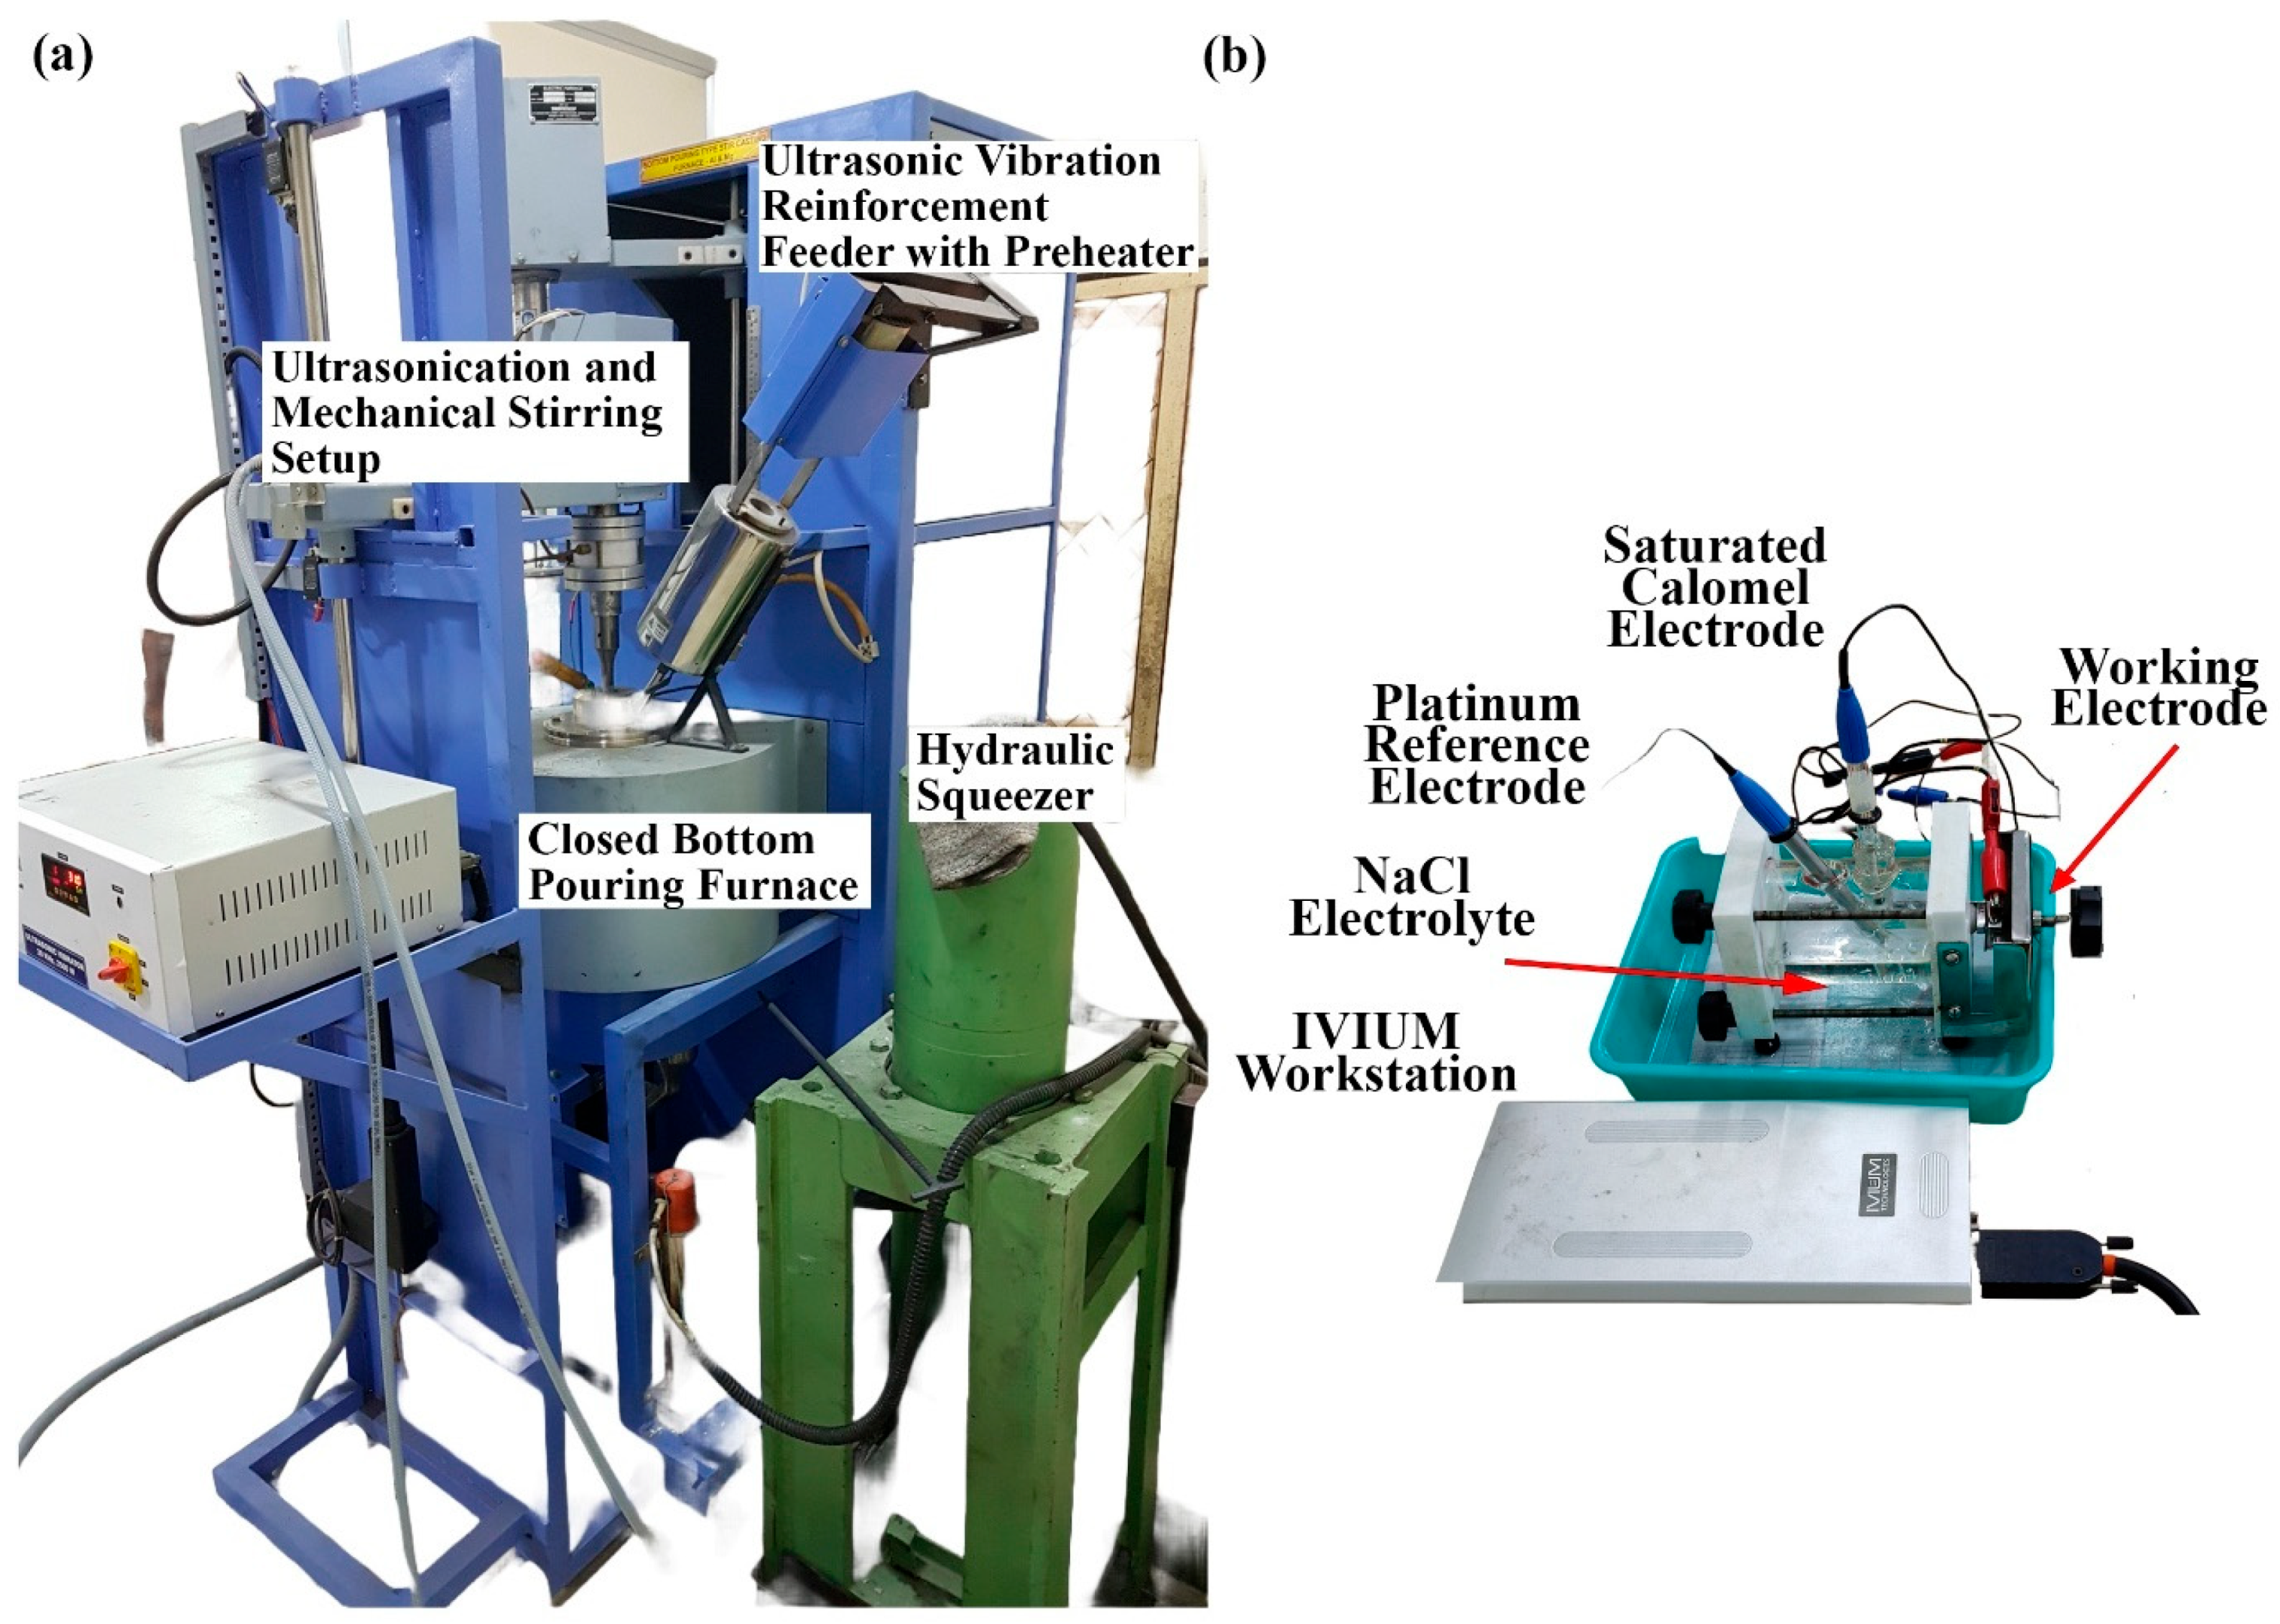
Table 2 presents the composition details of Mg-Zn-Ce-based nanocomposites reinforced with varying weight percentages of multiwalled carbon nanotubes (MWCNTs), specifically 0.4 wt.%, 0.8 wt.%, and 1.2 wt.%. These nanocomposites, along with the base alloy (0% MWCNT), were subjected to electrochemical corrosion tests in different NaCl electrolyte concentrations, 0.4 M, 0.6 M, 0.8 M, and 1 M, to evaluate their corrosion behavior under varying chloride ion environments.
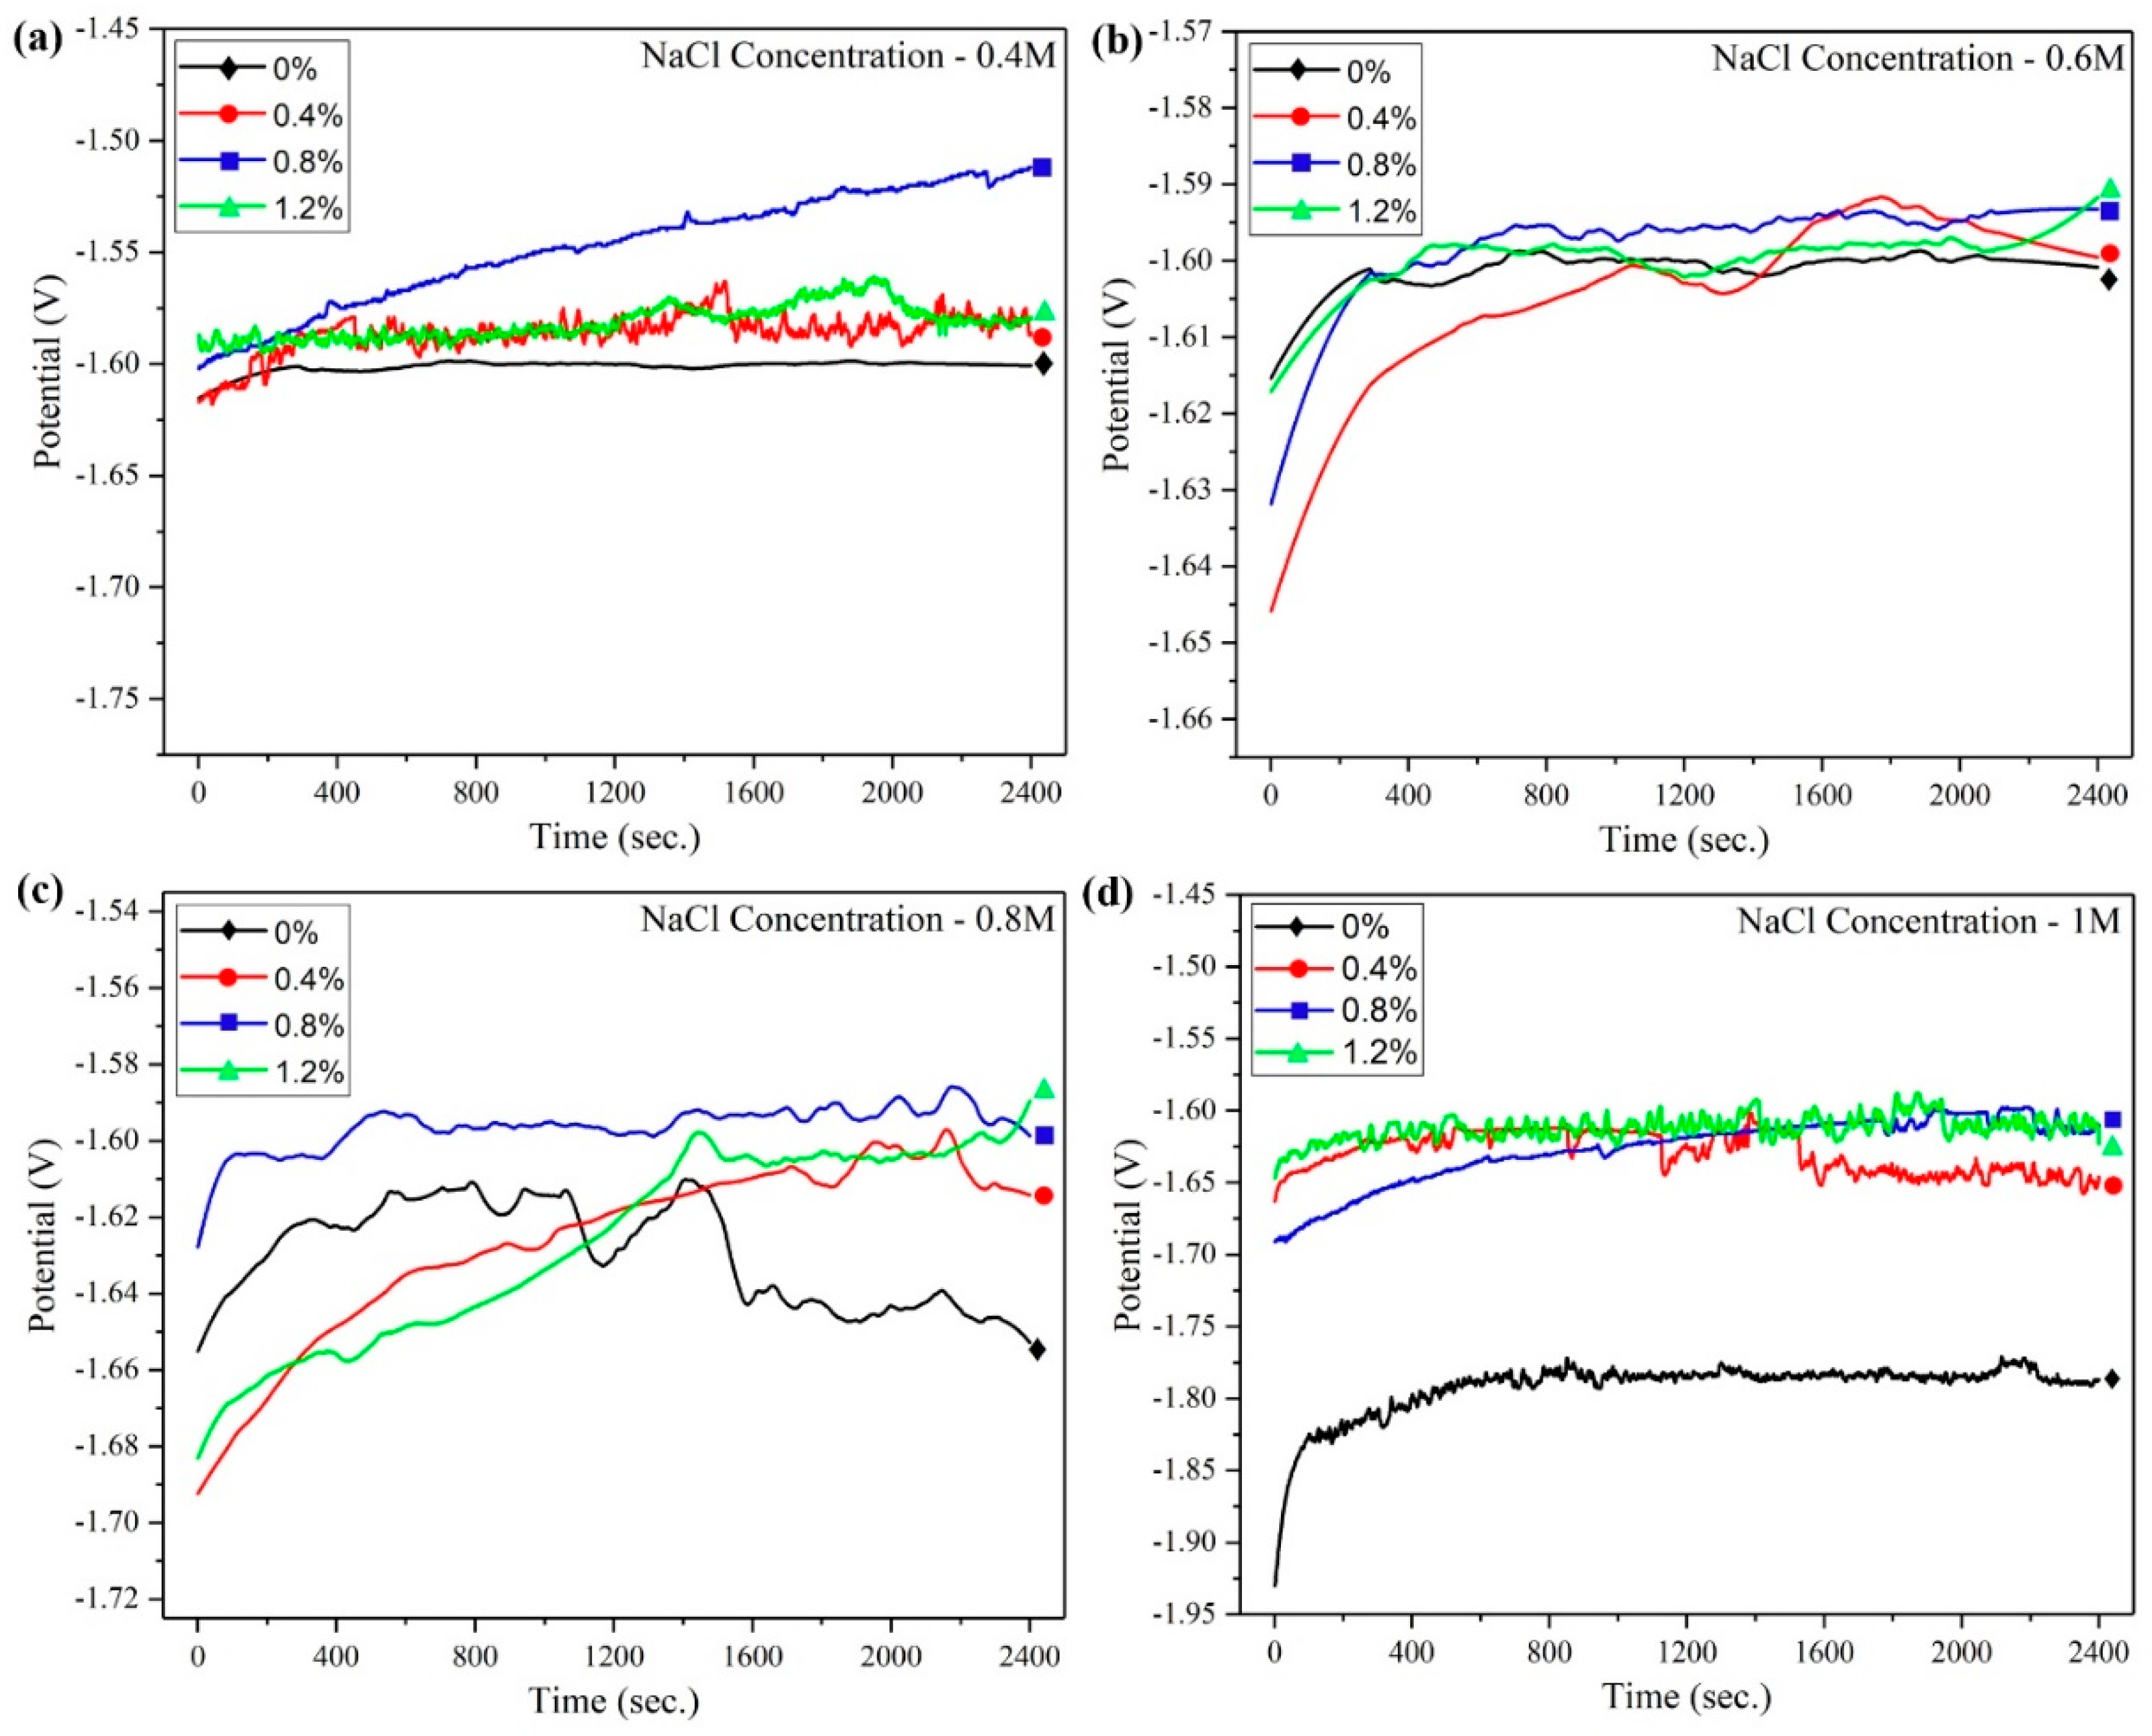
The open circuit potential (OCP) of Mg-Zn-Ce/MWCNT nanocomposites with respect to time (2400 s), while immersed in the NaCl solutions having four different concentrations, is illustrated in
Figure 6a–d. In the 0.4 M NaCl concentration, the 0% nanocomposite exhibited the lowest potential value of −1.59 V, with minimum variations with respect to time. Similarly, the monolithic alloy has the lowest potential value (−1.787 V at 1 M NaCl) when compared to all other nanocomposites tested under different NaCl concentrations, which is due to the large grain size and presence of larger α-Mg phases that create corrosion by galvanic action [
12].
The incorporation of MWCNT has increased the positive potential values of the nanocomposites, and the highest average positive potential value of −1.541 V was achieved for the 0.8% nanocomposite at 0.4 M NaCl. The OCP values ranged from 1.601 V to −1.593 V at 0.6 M NaCl for 0% to 0.8% nanocomposite, respectively.
The grain refinement and shielding effect of MWCNT have improved the corrosion resistance of the nanocomposites. The nanocomposites initiated oxide formation as soon as they were exposed to the NaCl electrolyte, and hence, the corrosion resistance of the nanocomposites gradually increased. This phenomenon was represented by the increase in positive potential values when compared at the initial and final exposure times. Also, the time taken by each composition of nanocomposites to become a stable potential varies, depending upon the different corrosion mechanisms it is undergoing [
32].
A similar positively increasing trend was obtained for the nanocomposites tested in the 0.6 M NaCl concentration electrolyte, where the 0.8% nanocomposite had the least positive potential of −1.593 V and −1.601 V for the monolithic Mg-Zn-Ce alloy. In the higher NaCl concentrations (0.8 M and 1 M), the passivation of nanocomposites was stable up to 1200 s, and further exposure of the material’s surface to the NaCl electrolyte till 2400 s has deteriorated the oxide film, and the potential values decreased. The nanocomposite corrosion behavior at higher concentrations of NaCl is different when compared to lower concentrations. Furthermore, the stable OCP values of −1.787 V, −1.638 V, −1.599 V, and −1.614 V were attained for 0%, 0.4%, 0.8%, and 1.2% nanocomposites, respectively, at 1 M NaCl concentration. This is notable from all the OCP values at different NaCl concentration electrolytes, with the nanocomposite having 0.8 wt.% of MWCNT in Mg-Zn-Ce alloy matrix displaying the highest positive potential when compared to other materials. However, the OCP value should not be directly correlated to the corrosion resistance, as it only provides thermodynamics for the corrosion system. Therefore, the electrochemical impedance spectroscopy (EIS) and potentiodynamic polarization of Mg-Zn-Ce/MWCNT nanocomposites were analyzed as follows.
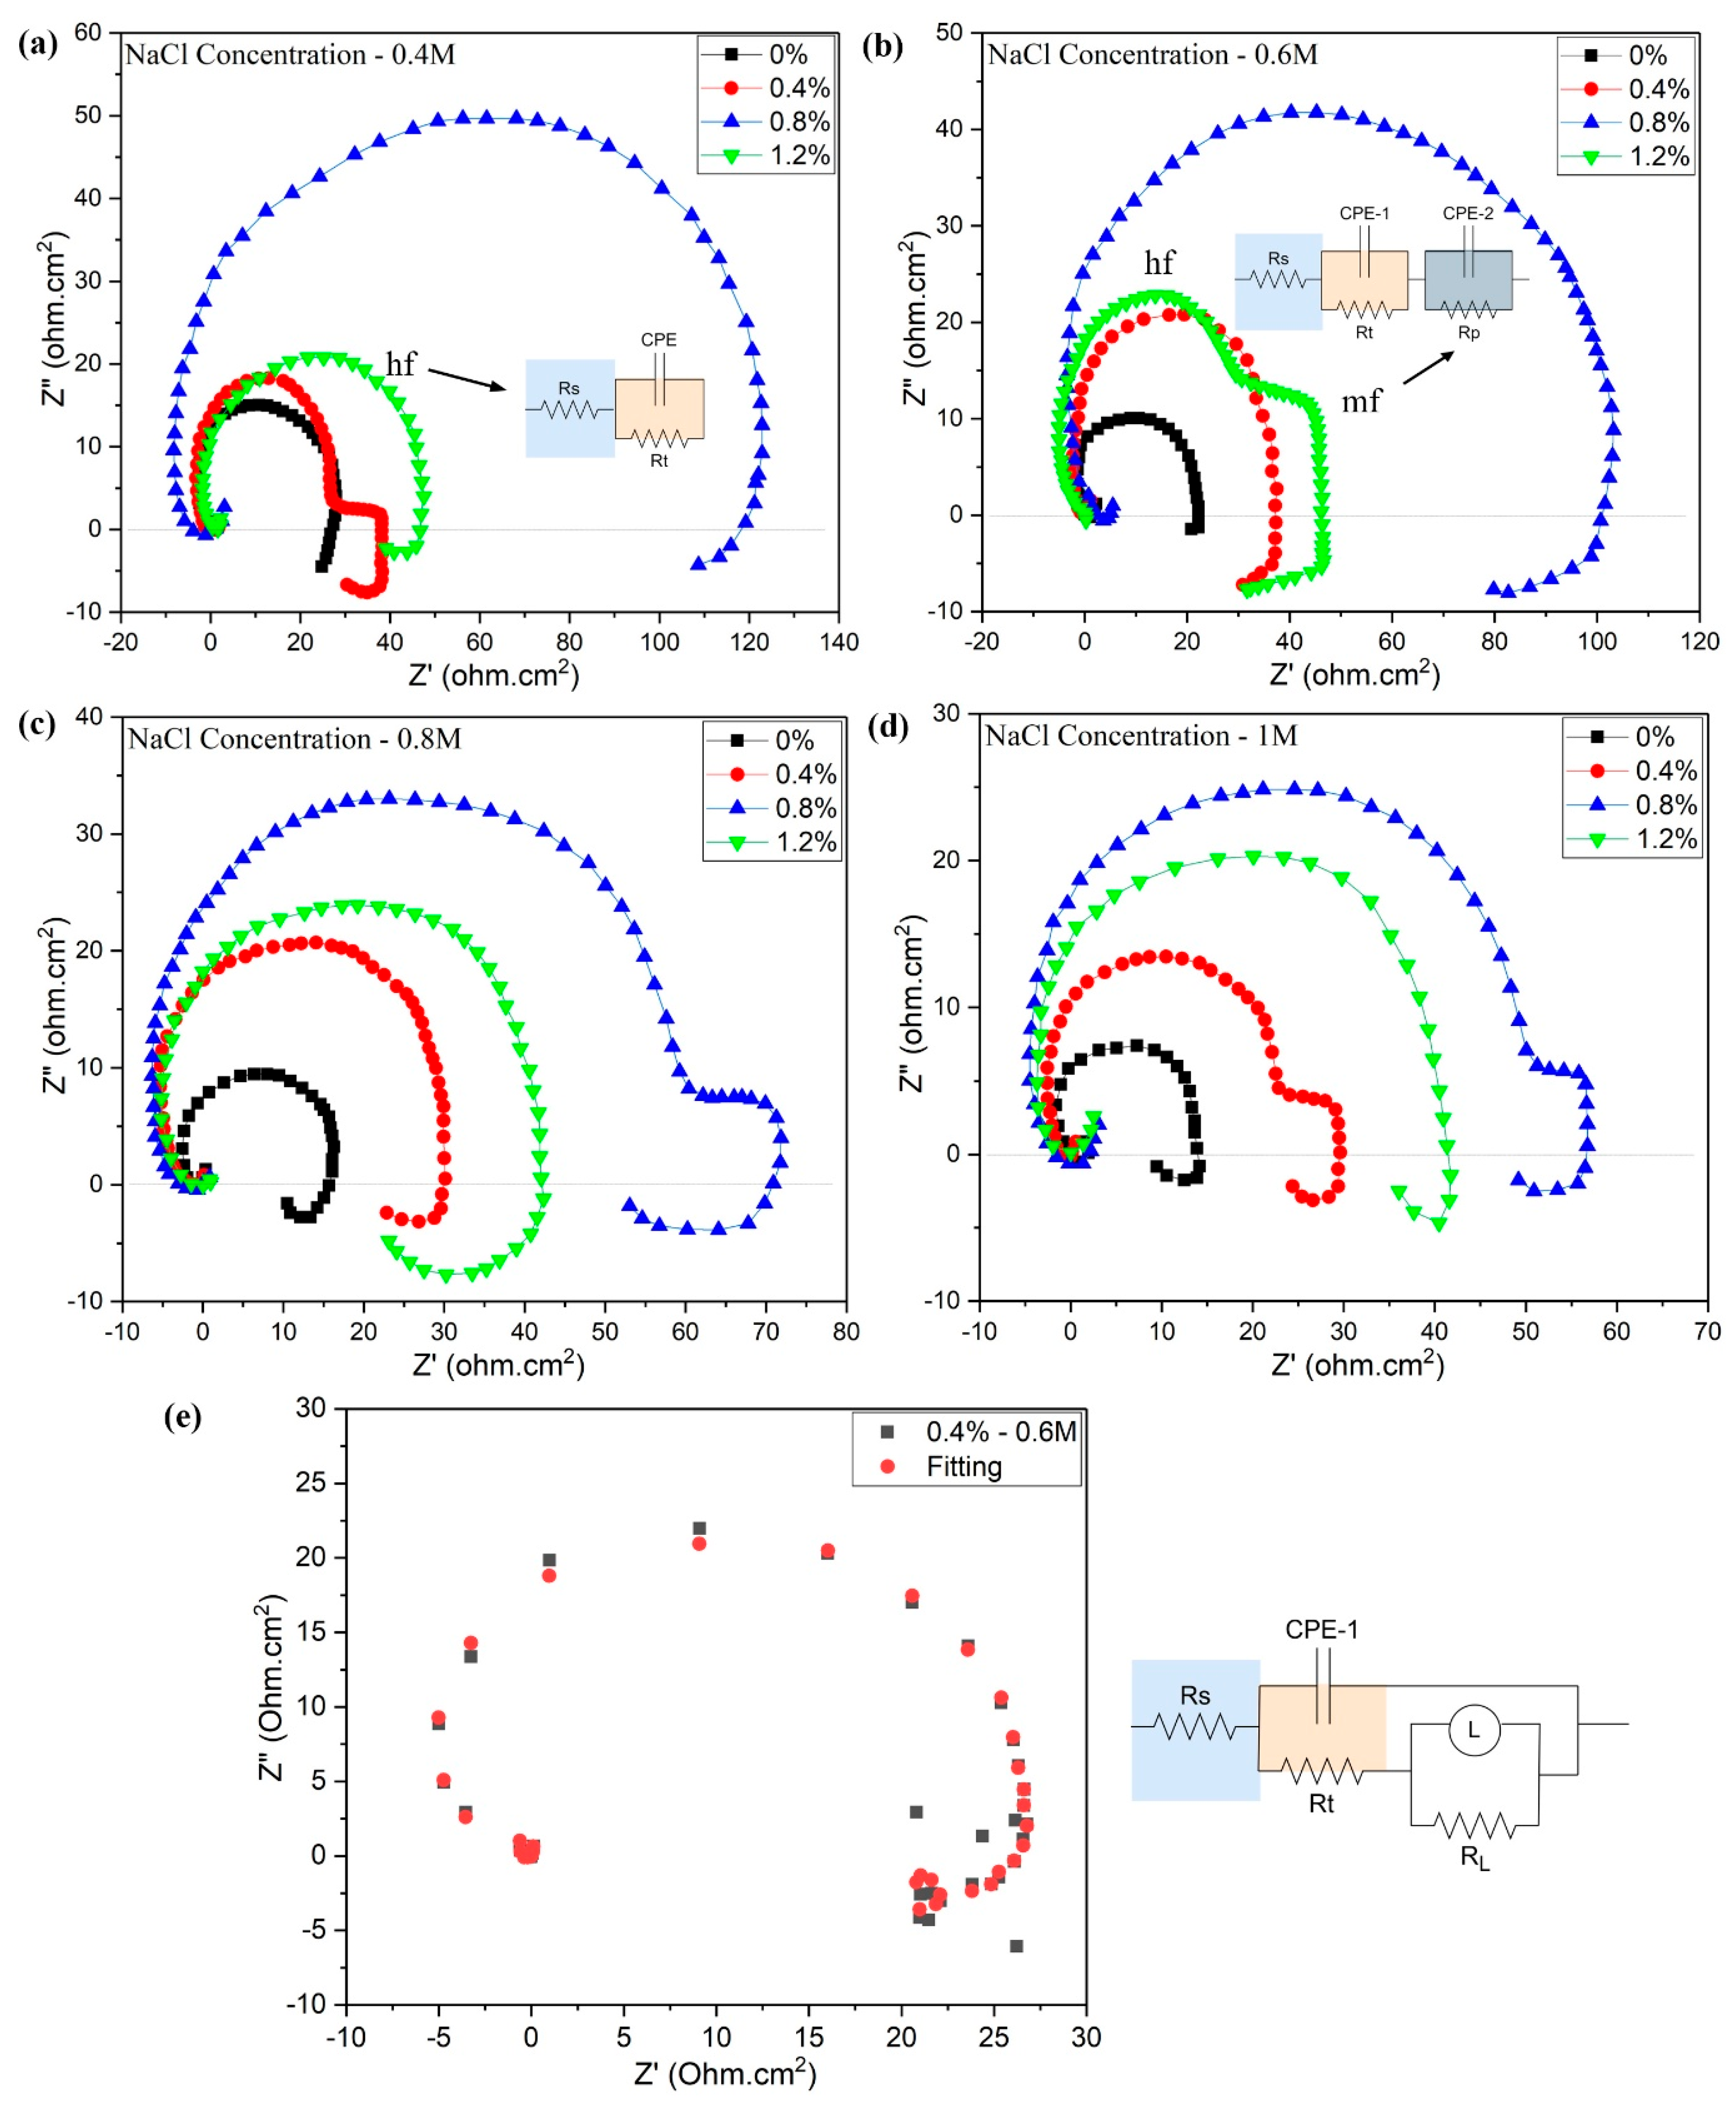
The Nyquist plots of Mg-Zn-Ce/MWCNT nanocomposites corroded at different NaCl concentrations (0.4, 0.6, 0.8, and 1 M) are illustrated in
Figure 7a–d. The EIS spectra studies were performed at ambient room temperature at 28 °C. The arc diameters of the Nyquist plots are correlated with the electron flow from the surface of the tested materials immersed in the electrolyte, and hence, the corrosion mechanism could be identified using these capacitive loops. The larger capacitive arc is generally derived from the materials with good corrosion resistance that are not losing electrons. [
33]. Similarly, the pattern of Nyquist plots also varies based on the mechanism of corrosion in a particular material. In this study, the Mg-Zn-Ce/MWCNT nanocomposites showed both single-loop as well as two capacitive loops in the Nyquist plot, which are attributed to the higher, mid, and lower frequencies. The Nyquist plot of 0.4 wt.% Mg-Zn-Ce/MWCNT nanocomposite in 0.6 M NaCl (
Figure 7e) demonstrates evident inductive character in the low-frequency range, and the fitted equivalent circuit with an inductive component correctly captures the same. The same inductive loops were also noticed for other nanocomposites under varying NaCl concentrations (0.4 M, 0.8 M, and 1 M), signifying that the inductive behavior is a general tendency in these magnesium-based nanocomposites, most probably due to localized corrosion activities and surface film formation/dissolution dynamics.
The single-loop Nyquist plot is formed in the higher frequency (hf) range, where the material is subjected to electrochemical reactions and the resistive impedance offered by the material during Mg dissolution, whereas the higher and mid-frequency (mf) are linked to the two capacitive loops. The secondary loop is linked to medium frequency, where the Mg2+ ions are diffused over countering the oxide layers. The lower frequency provides the stability of the electrochemical reaction and dynamics of Mg(OH)2 corrosion elements.
In the Nyquist plots shown in
Figure 7a–d, the semicircle arc representing the Mg-Zn-Ce monolithic alloy is noted as 0%, displaying the smallest diameter when compared to all other nanocomposites tested in all the low and high NaCl concentrations. The Mg
2+ ions are formed at the anode, and the mass transfer is highest for the monolithic alloy. Therefore, the surface of the monolithic alloys exhibits high material removal, attributed to the larger surface area of α-Mg [
7]. The Mg-Zn-Ce/0.8 wt.%MWCNT nanocomposites, represented as 0.8%, have comparatively lesser quantities of magnesium α phases due to the presence of refined grains. The arc diameter of nanocomposites is highest for 0.8% nanocomposites when compared to all other compositions of Mg-Zn-Ce/MWCNT nanocomposites. A similar large pattern of arc was achieved in all the NaCl concentrations for the 0.8% nanocomposite. However, in all the NaCl concentrations, the 1.2% Mg-Zn-Ce nanocomposite arc diameter is lower when compared to the 0.8% nanocomposite, which suggests that the electron transfer rate was higher in 1.2% than in 0.8% nanocomposite.
The MWCNT has enhanced the grain refinement by acting as the nucleation point inside the Mg-Zn-Ce melt, thus the dendritic growth of α-Mg starts. However, the dendritic growth adheres to the adjacent MWCNT particles present in the molten nanocomposite melt. Therefore, the grains formed in the 0.8% nanocomposites are finer grains when compared to all other nanocomposites (0.4 and 1.2%). The solute element phases are present mainly in the grain boundaries and as some intergranular precipitates. Similarly, the MWCNTs are distributed evenly in the Mg-Zn-Ce matrix and grain boundaries. The large semicircle Nyquist arc of 0.8% nanocomposite in all NaCl concentrations corresponds to lesser electron loss as the formation of denser passive oxide films is present on the nanocomposite surface. The Mg(OH)2 passive films are uniformly formed in 0.8% nanocomposite and are higher in quantity when compared to the monolithic alloy, as the presence of finer grains has created many chemically active diffusion regions for the formation of oxides.
The process of corrosion in the Mg-Zn-Ce alloy in the NaCl solution is characterized by active corrosion with localized pitting. Magnesium alloys in a chloride medium are quickly dissolved by chloride ions. Magnesium rapidly undergoes anodic dissolution, facilitating the evolution of H
2 in cathodic locations, as given in below equation. The diminutive semicircles in Nyquist plot indicate less corrosion resistance.
Whereas the Mg-Zn-Ce alloy with 0.4% MWCNT demonstrates a somewhat improved barrier effect, the MWCNT dispersed throughout the matrix reduces the defect channel and results in a denser passive film. The arc of the Nyquist plot is quite extensive, indicating that the enhanced film in the Mg-Zn-Ce alloy containing 0.8% MWCNT exhibits exceptional passivation and corrosion resistance. MWCNT was uniformly distributed under these conditions, enhancing film stability and obstructing the inclusion of chloride ions by augmenting the protective qualities of film formation, which leads to a large arc in the Nyquist plot. The Mg-Zn-Ce alloy with 1.2% MWCNT permits partial corrosion due to CNT aggregation. This aggregation leads to film imperfections or localized galvanic corrosion. A reduction in arc width indicates protection below 0.8%. The effect of the mechanism of corrosion in the base Mg-Zn-Ce alloy towards the addition of MWCNT in various proportions with reference to the Nyquist plot is discussed in
Figure 8.
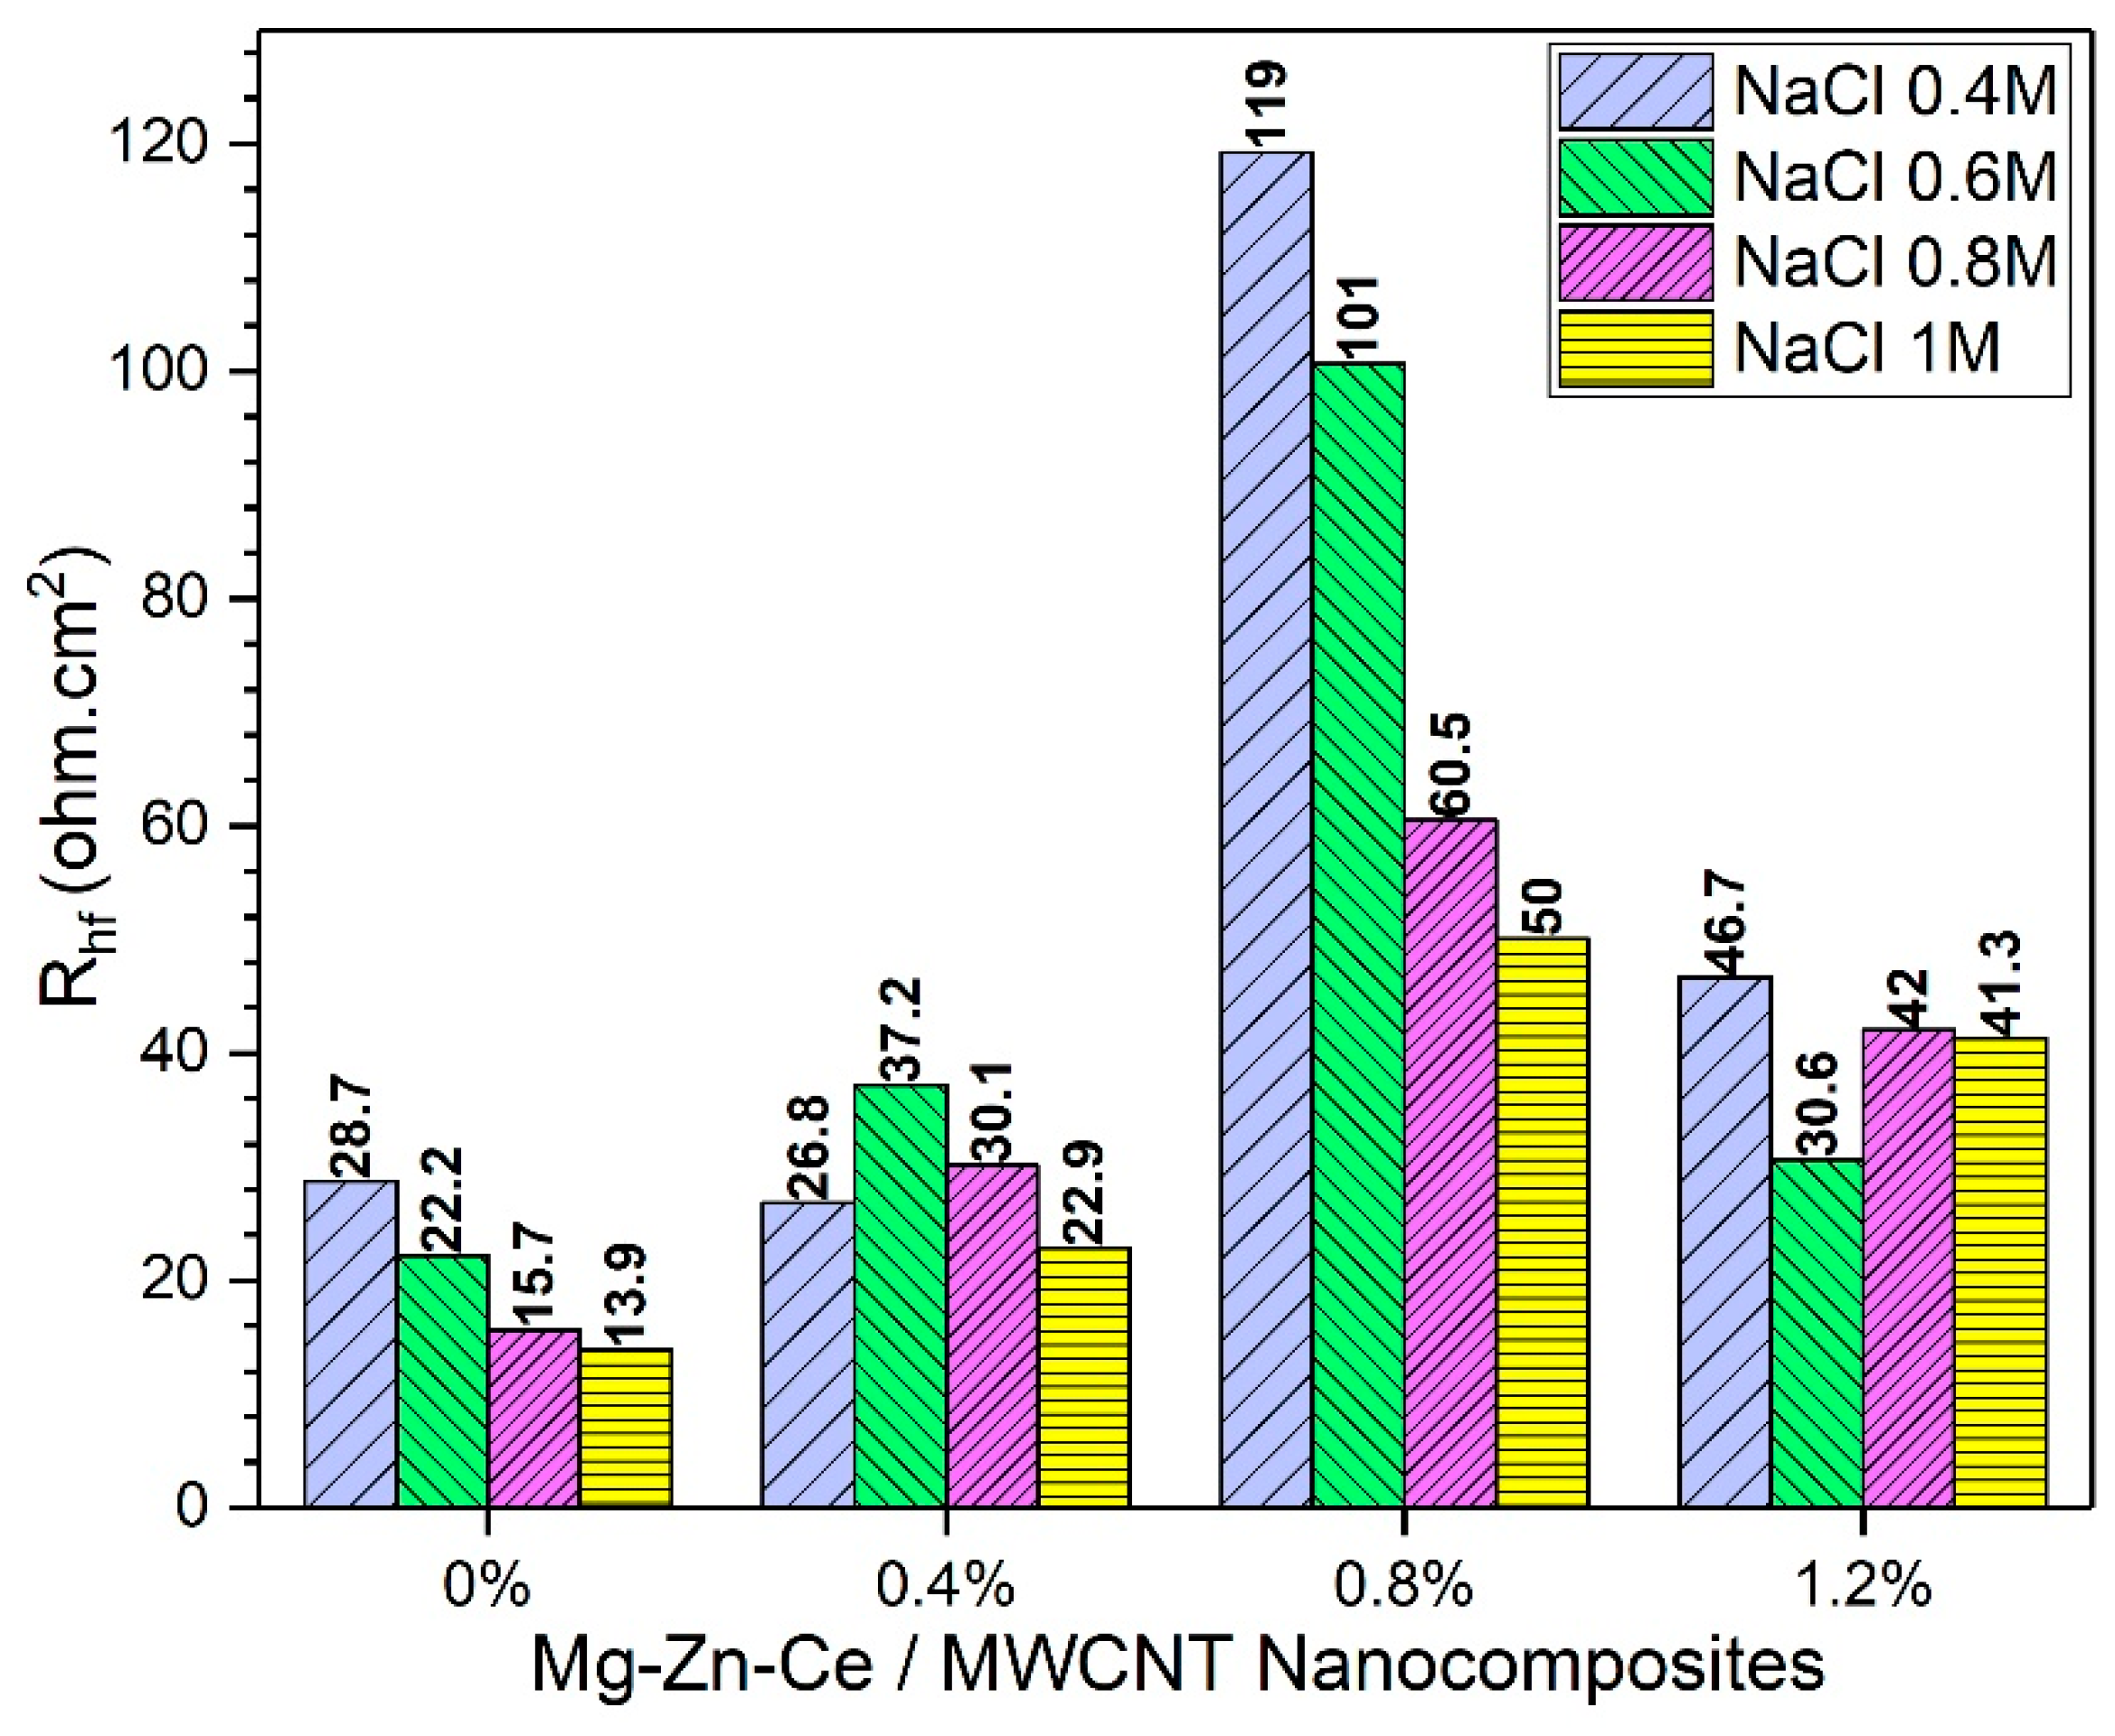
The passive layer formations in the nanocomposites are degraded by a higher concentration of NaCl. Therefore, more Mg
2+ ions are released through the passive layer breaking point. Finally, the MgCl
2 compounds are formed due to the reaction between Mg
2+ and large quantities of Cl
−. The surface degradation and formation of localized corrosion pits are highest for the monolithic Mg-Zn-Ce alloy, followed by 0.4%, 1.2%, and 0.8% nanocomposites. These results are attributed to the diameter of the capacitive loops derived from the Nyquist plots for the nanocomposites, and the corresponding high-frequency resistance (R
hf) plots are shown in
Figure 9.
The high-frequency resistance is inversely proportional to the rate of corrosion [
33]. Thus, the comparison of R
hf values within the same composition of nanocomposites has shown a decrease in R
hf values as the NaCl concentration is increased from 0.4 M to 1 M. The highest value of resistance is achieved in the lowest NaCl concentration; therefore, the passive layers are protected from the Cl
− attack.
The frequency response of the magnesium nanocomposites exposed in the NaCl electrolytes system is analyzed by the Bode magnitude plot and phase diagram, as received from the IVIUM software, as shown in
Figure 10a–h, in addition to the EIS data for a higher understanding of corrosion behavior [
33]. In the 0.8% nanocomposite, the magnitude plot shows almost constant amplitude at higher frequency regimes irrespective of the NaCl concentrations. Similarly, the phase plot corresponding to 0.8% nanocomposites has attained the peak value at the midway frequency. Thus, the oxide passive layers had reduced the flow of current at mid and higher frequencies. However, above 0.6 M NaCl concentration, the magnitude slightly varies for the 0.8% nanocomposite at midway and low frequency. The oxide layers deteriorate to expose fresh magnesium surface, and again a small amount of passivation is achieved from the obstructive layer of MWCNT, which resists further α-Mg movement. This also corresponds to the two capacitive loops, as shown in the EIS spectra of the 0.8% nanocomposite,
Figure 7c,d.
The near-zero degrees were attained by all the nanocomposites at a lower frequency and approximately −150° peak phase value at the midway frequency. The nanocomposites have resistance behavior at low frequency and capacitive behavior at mid-frequency. The nanocomposites exposed in 0.4 M and 0.6 M NaCl concentration showed an approximate phase value of −100° at higher frequency, whereas in 0.8 M and 1 M conditions, the phase value was reduced to an average of −50° phase angle. The phase angle values at 0.4 M and 0.6 M conditions in hf zone have capacitive behavior, where the oxide layer domination is higher and material removal is comparatively lesser. Furthermore, in higher NaCl concentration conditions (0.8 M and 1 M), the phase angle values at the hf zone have a transition effect from capacitance to resistance. This transition indicates the aggressive chlorine attack in the oxide layer, which causes depletion, and a few micro-passivations due to the presence of MWCNT nano-reinforcements.
The Bode magnitude and phase plots are fitted in corresponding equivalent circuits based on the above understanding. The constant phase element (CPE), charge transfer resistance (Rt), and solution resistance (Rs) are attributed to single-loop EIS spectra, as depicted in
Figure 7a. Similarly, the equivalent circuit for two-loop EIS spectra, as shown in
Figure 7b, corresponds to the CPE-1 and CPE-2, which are constant phase elements and the charge transfer resistance (Rt) and protective film resistance (Rp), respectively.
The potentiodynamic polarization plots of the Mg-Zn-Ce/MWCNT nanocomposites exposed in 0.4 M to 1 M NaCl concentrations are displayed in
Figure 11a–d, and their corresponding E
corr, I
corr, and corrosion rates are noted in
Table 3. The anodic and cathodic reactions could be understood by using these Tafel plots, and the corrosion behavior of the nanocomposites is also analyzed. The magnesium ions are formed by releasing the valence electrons on the left side of the Tafel plot, which represents the anodic dissolution process, whereas the hydrogen evolution takes place on the cathodic right side of the Tafel curve. From
Figure 11a, the monolithic alloy has obtained the lowest E
corr value of −1.53 V and corresponding I
corr value of 28.8 µA/cm
2, which was highest among all other MWCNT reinforced nanocomposites exposed to 0.4 M NaCl concentration. The corrosion rate (0.43 mm/Year) of the monolithic alloy was highest in 0.4 M concentration, and a similar trend was achieved for the 0% sample tested in all NaCl concentrations when compared to MWCNT-reinforced nanocomposites. The OCP curves, as shown in
Figure 6a–d are identical with the Tafel trends. These results could be attributed to the presence of lesser quantities of secondary phases in the base Mg-Zn-Ce alloy, which increased the Cl
− action over the passive layer and exposed the α-Mg due to inadequate resistance to corrosion offered by the secondary phases. Additionally, according to the Hall–Petch equation, the hardness of the samples is proportional to the grain size of a material [
1,
2,
3,
4,
5]. Therefore, since the base alloy had the largest grain size, the corresponding hardness is comparatively lower than the nanocomposites. These factors are responsible for the reduction in corrosion resistance of the monolithic Mg-Zn-Ce alloy.
At a lower NaCl concentration of 0.4 M, the micro-galvanic effect due to the presence of secondary phases and MWCNT nanoparticles is negligible for all the nanocomposites, as seen from the smooth cathodic curve in
Figure 11a. The Tafel plots derived from the nanocomposites exposed to higher NaCl concentrations (0.6 M, 0.8 M, and 1 M) have varying curve deviations, which suggest that multiple electrochemical reactions are undergoing at the surface of galvanic interactions. Similarly, the higher Cl
− ion concentration has increased the corrosion rate, which is attributed to the higher values of current density and smaller semicircle loop in Nyquist plots. However, the 0.8% nanocomposites have shown better corrosion resistance compared to all other nanocomposites in all the NaCl concentrations. The MWCNT has offered a barrier effect to the nanocomposites, which has reduced the corrosion rate. From
Figure 11c,d, the 0.8% nanocomposite exposed to 0.8 M and 1 M has a non-linear cathodic curve, which suggests micro-galvanic reactions between the magnesium phase, MWCNT particles, and secondary precipitates.
The corrosion rate of nanocomposites exposed to varying NaCl concentrations has decreased with an increase in MWCNT concentration until 0.8 wt.%, and then a slight increase in corrosion rate was observed for the nanocomposites with 1.2 wt.% MWCNT. The high surface energy and heterogeneous nucleation sites provided by MWCNTs promote localized solute segregation and facilitate the precipitation of thermodynamically stable phases during solidification and thermal processing [
34]. Therefore, the formation of MgZn
2, Mg
7Zn
3RE, and other secondary phases are increased due to the presence of MWCNT particles. The MWCNT particle has a one-dimensional morphology, which has promoted grain refinement, and it simultaneously acts as a barrier to Mg
2+ release. At higher concentrations of 0.6 M, 0.8 M, and 1 M, the corrosion rates are higher as the MgCl
2 formation has increased from Mg(OH)
2.
Pitting corrosion is a major degradation mechanism in magnesium nanocomposites, particularly in chloride-containing environments like physiological solutions. The addition of nanoparticles like SiC, Al
2O
3, CNTs, or graphene, besides improving mechanical properties, creates micro-galvanic couples because of differences in potential between the matrix and the reinforcements, which enhance anodic dissolution at the interface; hence, proper interface bonding is needed with the matrix material to reduce this galvanic couple effect [
35]. Nanoparticle agglomeration and interfacial defects also act as favored locations for pit initiation by inducing microstructural heterogeneity and localized electrochemical activity. In addition, second phases or intermetallic compounds in the microstructure significantly affect localized corrosion by inducing galvanic effects [
36]. Surface imperfections, residual stress, and uneven reinforcement distribution resulting from production methods like stir casting or friction stir processing also induce pit nucleation.
Processing techniques significantly impact the distribution of MWCNTs within the metal matrix, which in turn affects the corrosion behavior of the nanocomposites. Evenly dispersed MWCNTs can increase corrosion resistance by blocking the entry of corrosive substances and reducing micro-galvanic activity. However, poor processing can lead to MWCNT clustering, which creates localized galvanic cells and accelerates corrosion. Therefore, meticulous control of the production parameters is necessary to achieve a uniform MWCNT dispersion and superior corrosion performance.
The orientation, distribution, and interfacial bonding of MWCNTs are highly dependent on the processing method. The dispersion of MWCNTs also predominantly relies on the processing techniques like high-energy ball milling powder metallurgy, friction stir processing (FSP), ultrasonication-assisted casting, and spark plasma sintering (SPS). Among all these processing techniques, the process of casting is the only technique that can offer the maximum productivity with good particle dispersion, but agglomeration is still a problem that must be addressed [
37]. Optimized parameter ultrasonication-assisted casting [
15] can ensure homogenous dispersion and good interfacial bonding to yield the maximum barrier effect and minimize cathodic-induced pitting. Poor processing could, however, lead to agglomeration of MWCNTs and create cathodic-rich clusters that promote pitting corrosion.
3.3. Microstructural Analysis and Mechanism of Corrosion
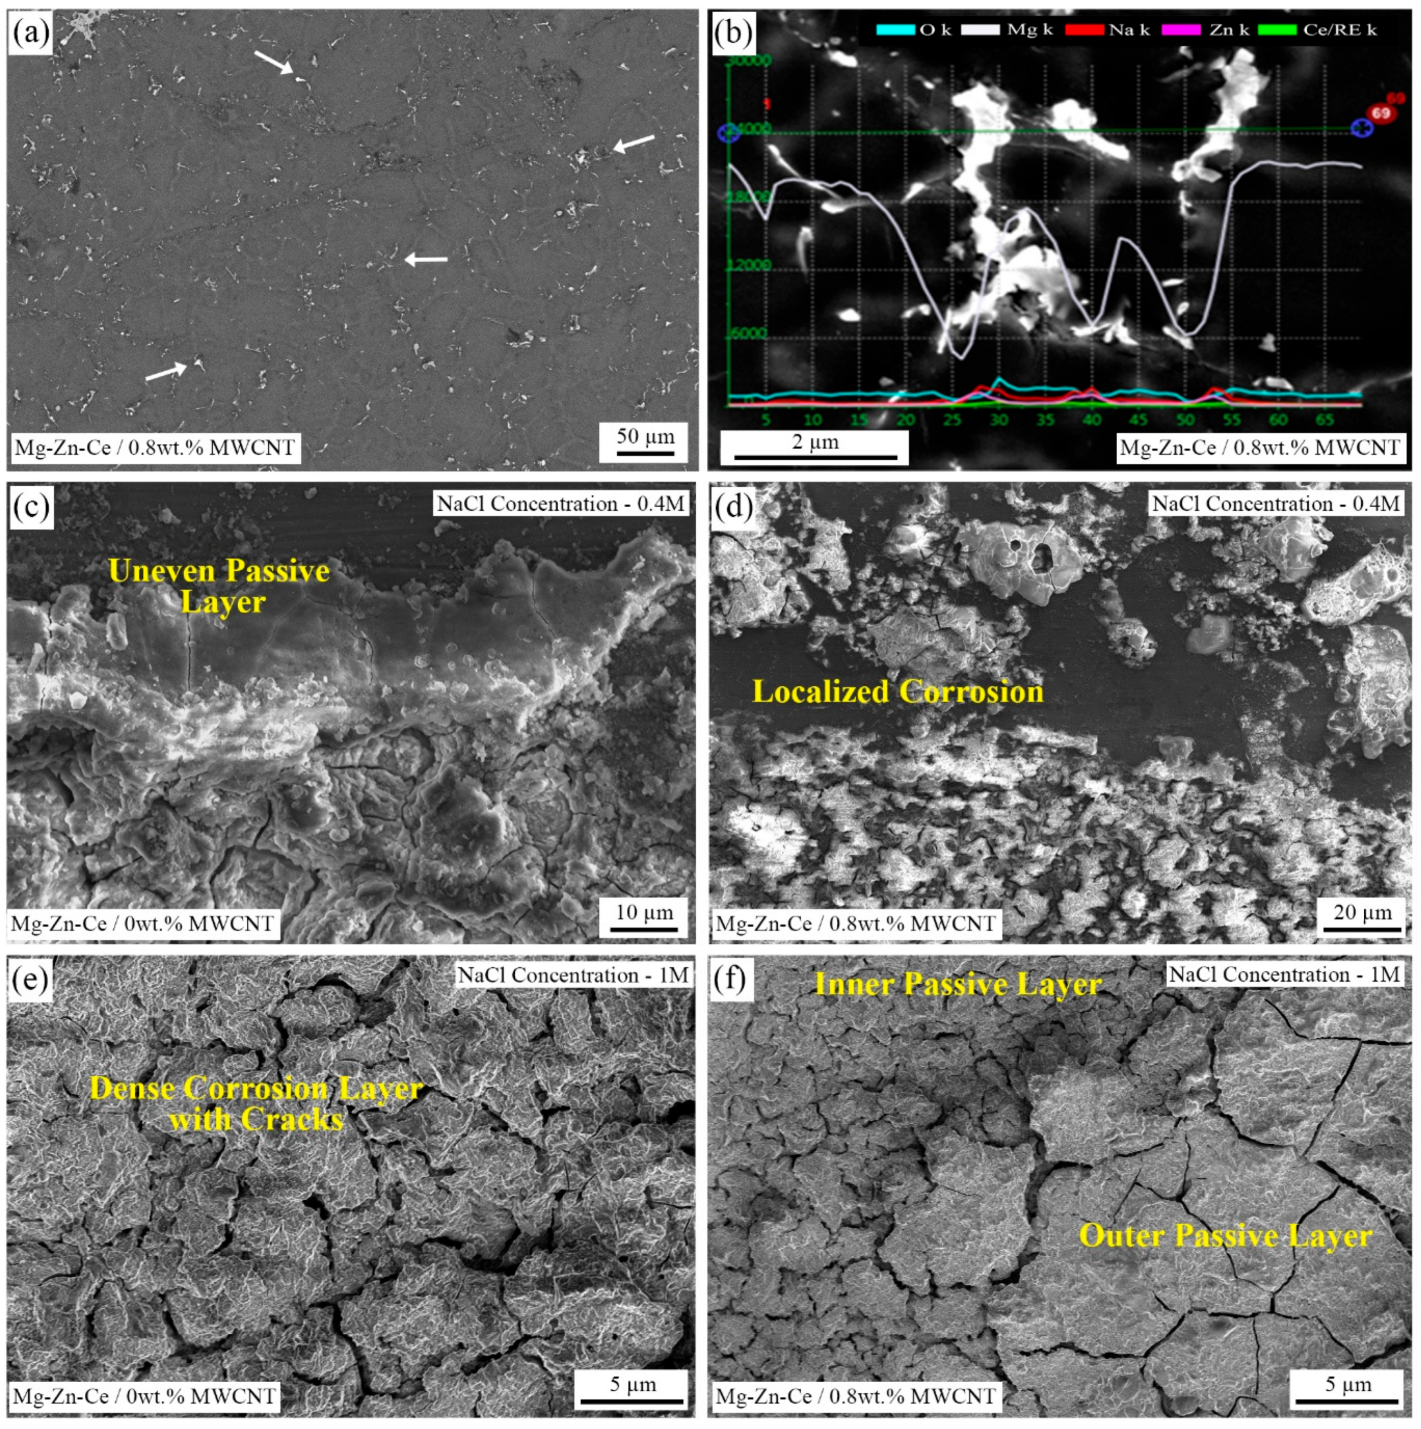
The SEM backscattered electron (SEM-BSE) image of monolithic Mg-Zn-Ce alloy with an arrow mark representing T-phases in the grain boundary and SEM energy-dispersive spectroscopy (SEM-EDS) of corroded 0.8 wt.% MWCNT nanocomposites at 0.4 M NaCl concentration are illustrated in
Figure 12a,b. The light-colored regions in the SEM micrographs represent the grain boundaries, which consist of Mg-Zn-RE phases, both in the base alloy as well as in the nanocomposites, which are confirmed by the line EDS scan across the grain boundary. Similarly, the oxide formation is higher in the grain boundaries.
Figure 12c,e depicts the SEM surface morphology of the UHSS-casted base Mg-Zn-Ce alloy, and similarly,
Figure 12d,f corresponds to Mg-Zn-Ce/0.8 wt.%MWCNT nanocomposites at 0.4 M and 1 M NaCl concentration, respectively. The corrosion byproducts show the quantity of reactions taken place on the surface of the material due to corrosion. Hence, the influence of lower NaCl concentration in the 0.8% nanocomposites is significantly less when compared to the monolithic alloy, as shown in
Figure 12c,d.
However, when the nanocomposites are exposed to higher NaCl concentrations of 1 M, the formation of the corrosive layer is thicker due to more chemical reactions at the material surface and the electrolyte interface. The Mg-Zn-Ce/MWCNT nanocomposite showed multilayered passive film formations when it was exposed to the NaCl electrolyte. The oxide layer adjacent to the material’s surface forms a thinner, dense MgO layer, and the outer surface consists of Mg(OH)
2, which is thicker and porous, as seen in
Figure 12f. The material removal is more in the grain boundaries due to misoriented α-Mg forming Mg
2+ ions easily during pitting corrosion. From the SEM surface morphology, it is evident that the grain size reduction of the 0.8% nanocomposite has improved the corrosion resistance of the material by lesser material removal from the grain boundaries, which might be attributed to the MWCNT barrier effect.
The Mg-Zn-Ce/MWCNT nanocomposites have an α-Mg phase, secondary phases (MgZn
2, Mg
12Ce, Mg
17Ce
2, Zr
4Zn), Mg
7Zn
3RE (T-phase), and MWCNT particles. Generally, corrosion is influenced by the reactions between the magnesium phase (anode) and other secondary phases or particles (cathode), which form a micro-galvanic couple [
33]. The corrosion behavior of the ZE41 alloy reinforced with MWCNT particles has complex corrosion mechanisms based on multiple factors, such as uniform distribution of MWCNT particles, formation of secondary phases, grain size of the nanocomposites, presence of agglomerated MWCNT particles, formation of micro-galvanic couple of cathodic MWCNT with magnesium alloys, placement of MWCNT particles within the grain or at the grain boundaries, Mg(OH)
2 and MgO passive layer formations, the barrier effect of MWCNT, and NaCl concentration.
The schematic diagram of corrosion mechanism in Mg-Zn-Ce alloy and MWCNT reinforced nanocomposites exposed to the NaCl electrolyte is illustrated in
Figure 13. Magnesium has the tendency to lose its two electrons and form magnesium ions (Mg
2+), and therefore, the corresponding standard electrode potential is −2.37 V. Generally, magnesium has a steady state working potential in a range of 1.5 to 1.8 V when subject to NaCl solution with varying concentration. Initially, the magnesium nanocomposite is immersed in the NaCl electrolyte, and anodic dissolution takes place involving several reactions, to finally form magnesium hydroxide along with the release of hydrogen gas. The passive Mg(OH)
2 layers are formed uniformly over the surface of the monolithic Mg-Zn-Ce alloy. The secondary phases present in the grain boundary act as highly reactive zones, and the formation of the passive layer is more likely to be near these zones. Therefore, the Mg(OH)
2 film density is inversely proportional to the grain size of the nanocomposites. This oxide film restricts the further release of magnesium, and thus, an equilibrium state is reached. However, the nanocomposites are immersed in NaCl electrolyte, and hence the chlorine ions (Cl
−) aggressively interact with Mg(OH)
2 layers and form MgCl
2 salts.
The MWCNT particles present in the Mg-Zn-Ce nanocomposites act as a cathode, and the Mg matrix as an anode; thus, they form a micro-galvanic couple. Since the length of MWCNT particles is on the micron scale, the pitting corrosion happens at the surface of the material due to the presence of MWCNT particles in the micron size. However, the MWCNTs have a one-dimensional morphology, and they are uniformly distributed in the Mg matrix due to ultrasonication-assisted hybrid stir–squeeze casting. The MWCNT forms a barrier to the Mg-matrix by not allowing the chlorine ion to disrupt the passive oxide layer. The grain refinement in the Mg-Zn-Ce nanocomposites is higher as the MWCNT concentration is increased. The electrochemical reactions are homogeneously distributed over the nanocomposite surface due to the presence of MWCNT particles; thus, the corrosion rate is comparatively decreased.
Altogether, due to the coarse grain of a material exposed to NaCl electrolyte, the passive layer formations are porous when compared to the fine-grain materials. In a fine-grained nanocomposite, the presence of variably oriented phases in the grain boundary acts as highly reactive zones. These highly reactive zones tend to form passive layers faster and denser than the coarser material, having a properly oriented α-Mg phase [
34]. Overall, the corrosion mechanism is mainly influenced by particle distribution and its corresponding effects in the magnesium nanocomposites.

 ,
, 


