
Warpage Prediction in Wire Arc Additive Manufacturing: A Comparative Study of Isotropic and Johnson–Cook Plasticity Models


Abstract
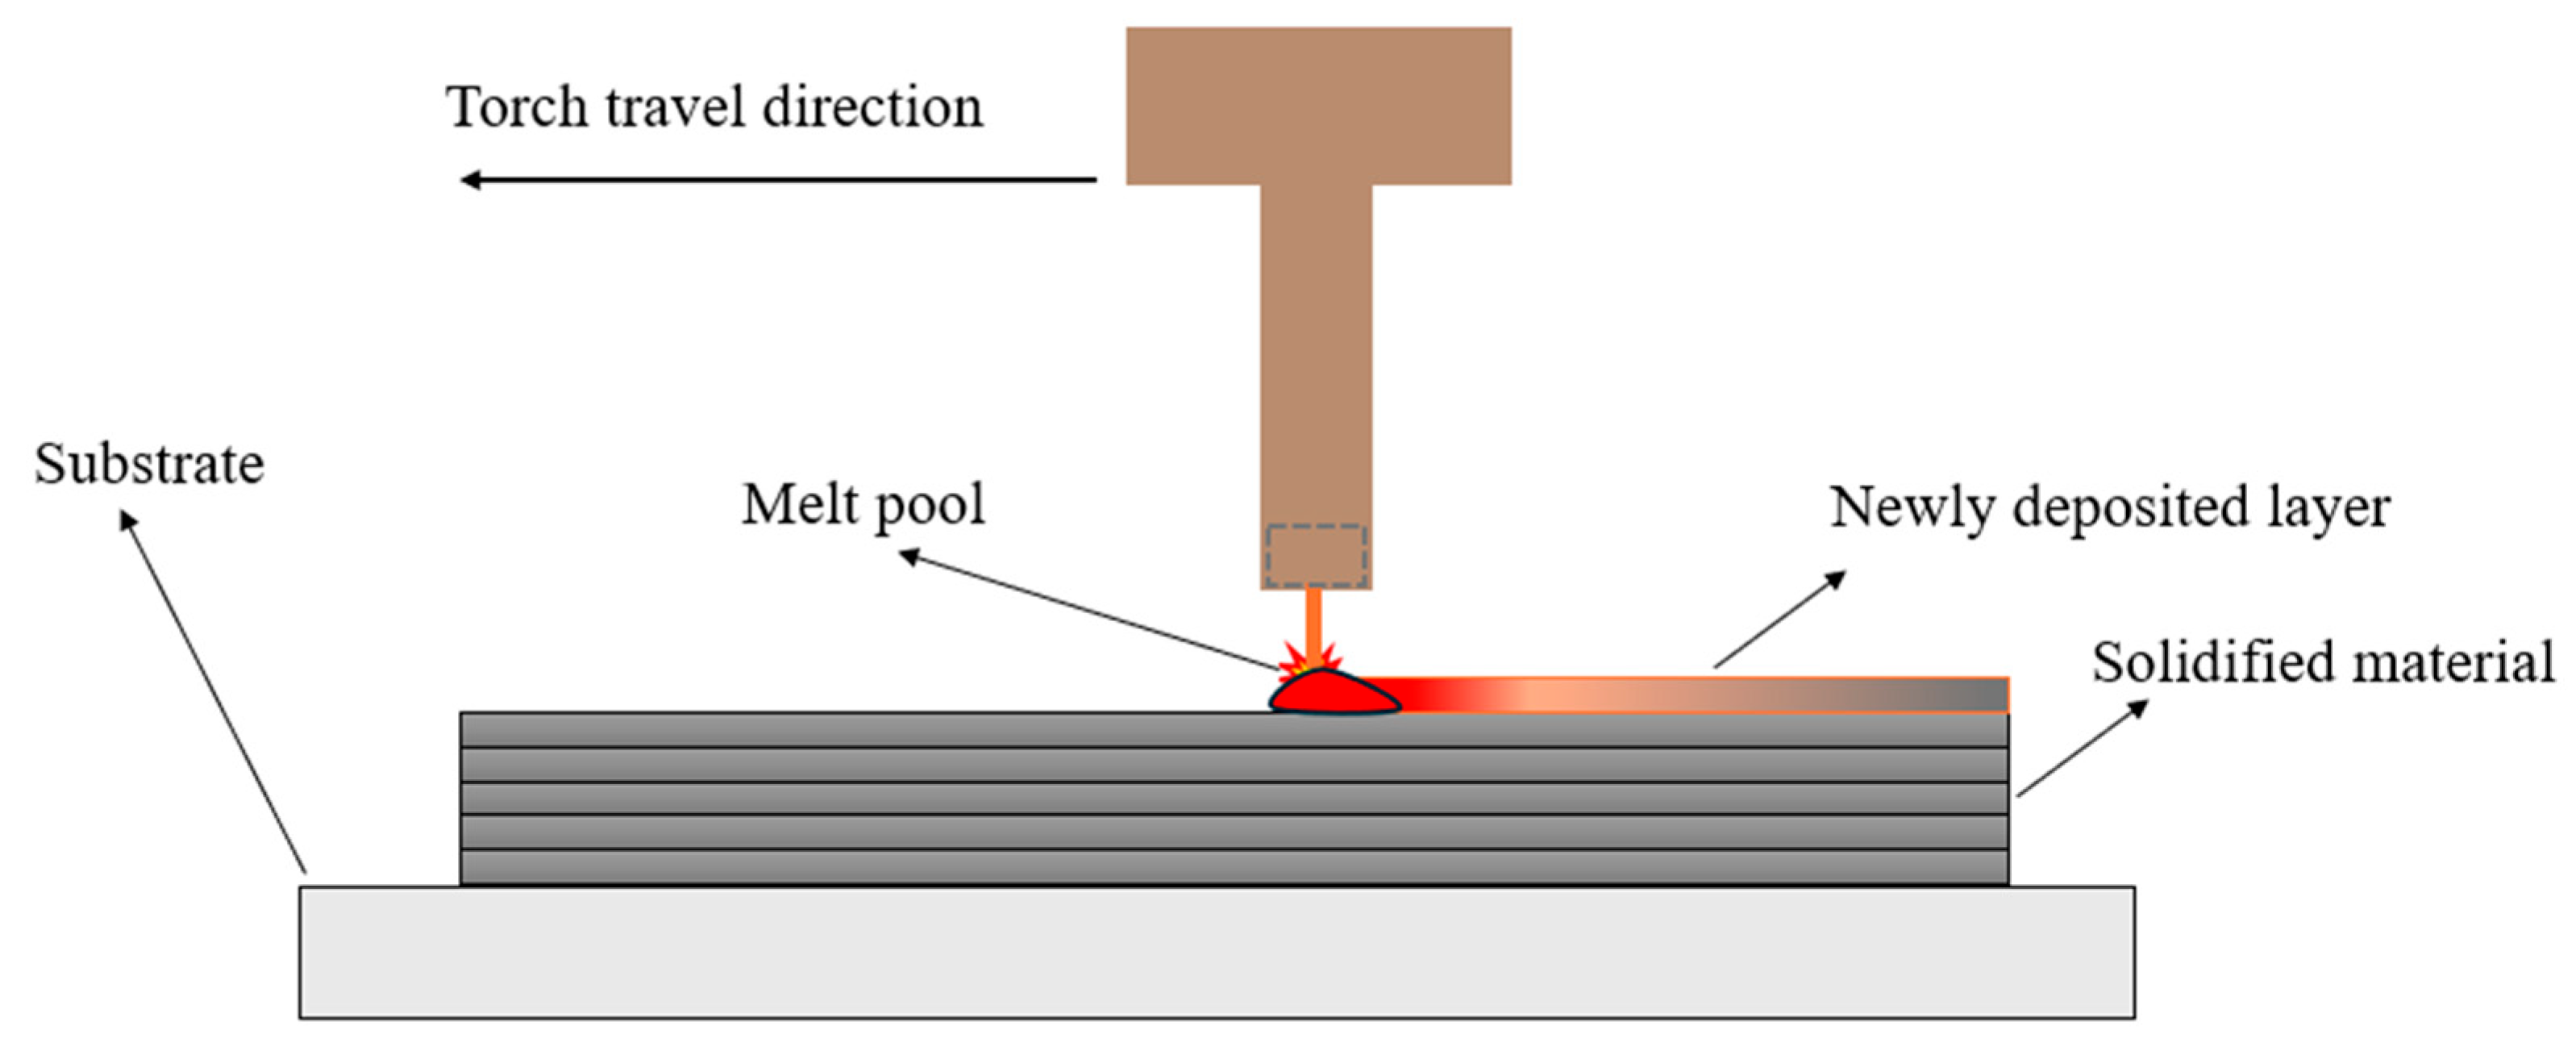
1. Introduction
2. Materials and Methods
2.1. Thermal Analysis
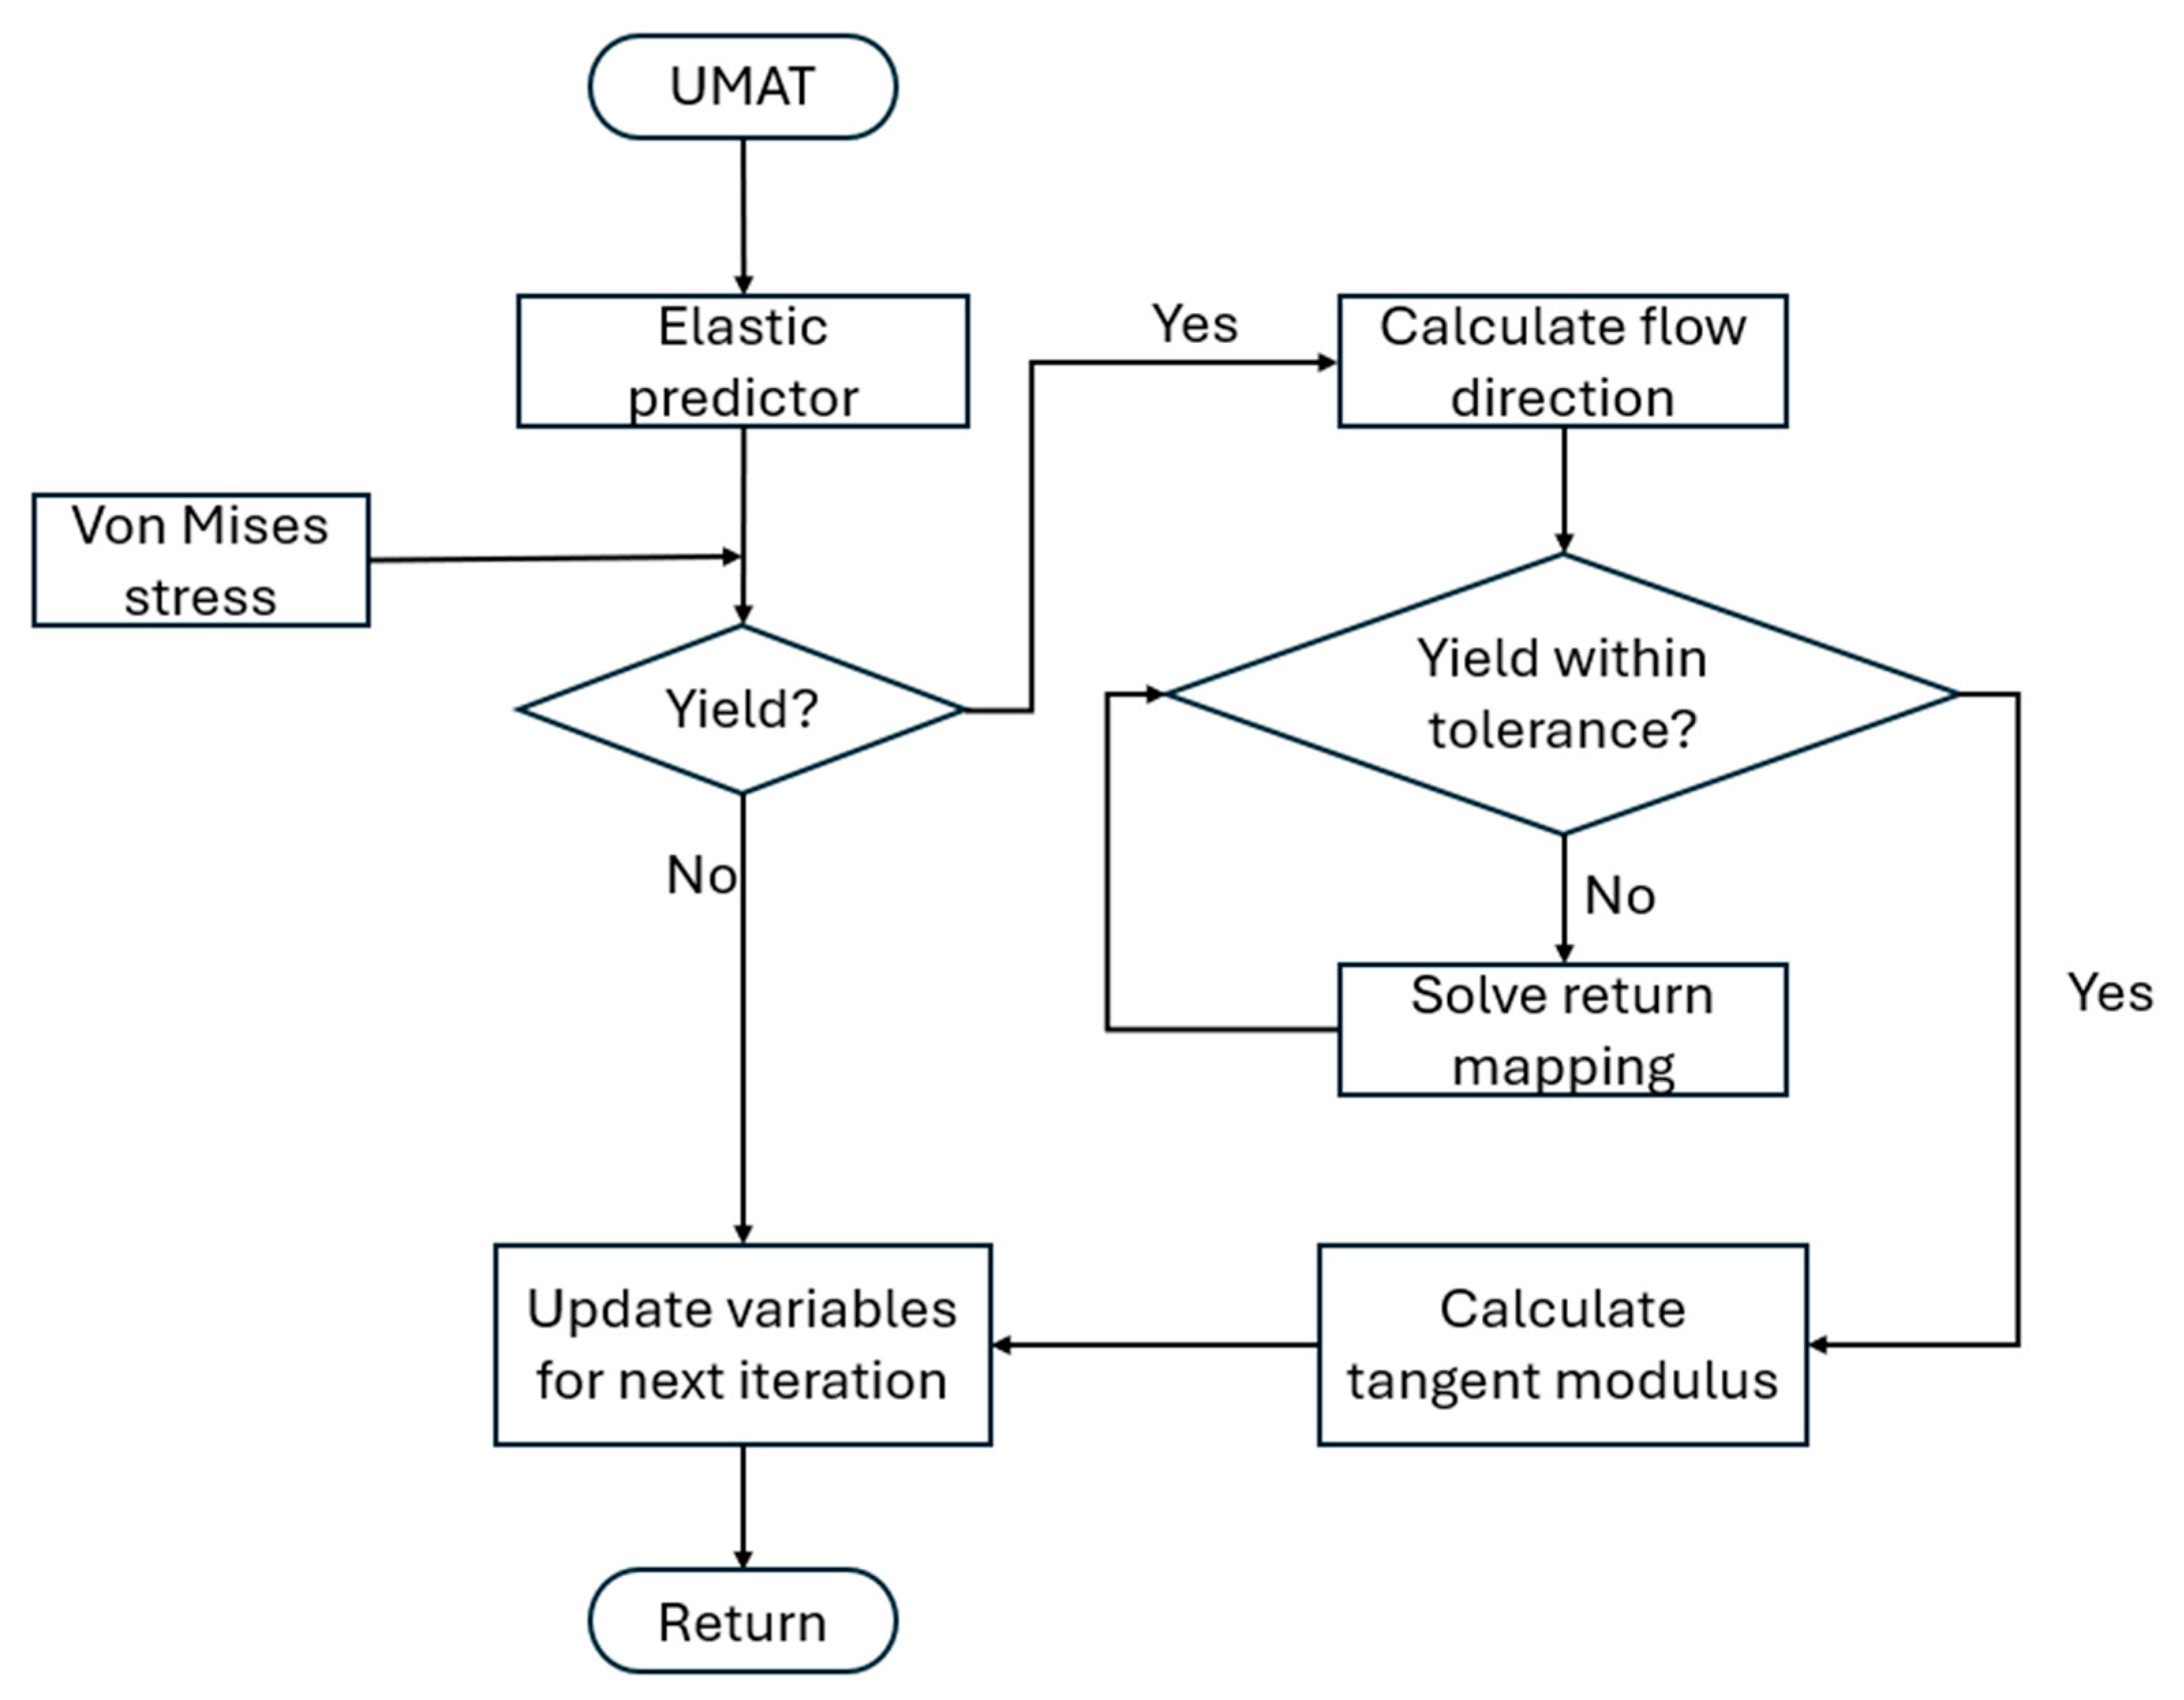
2.2. Mechanical Analysis
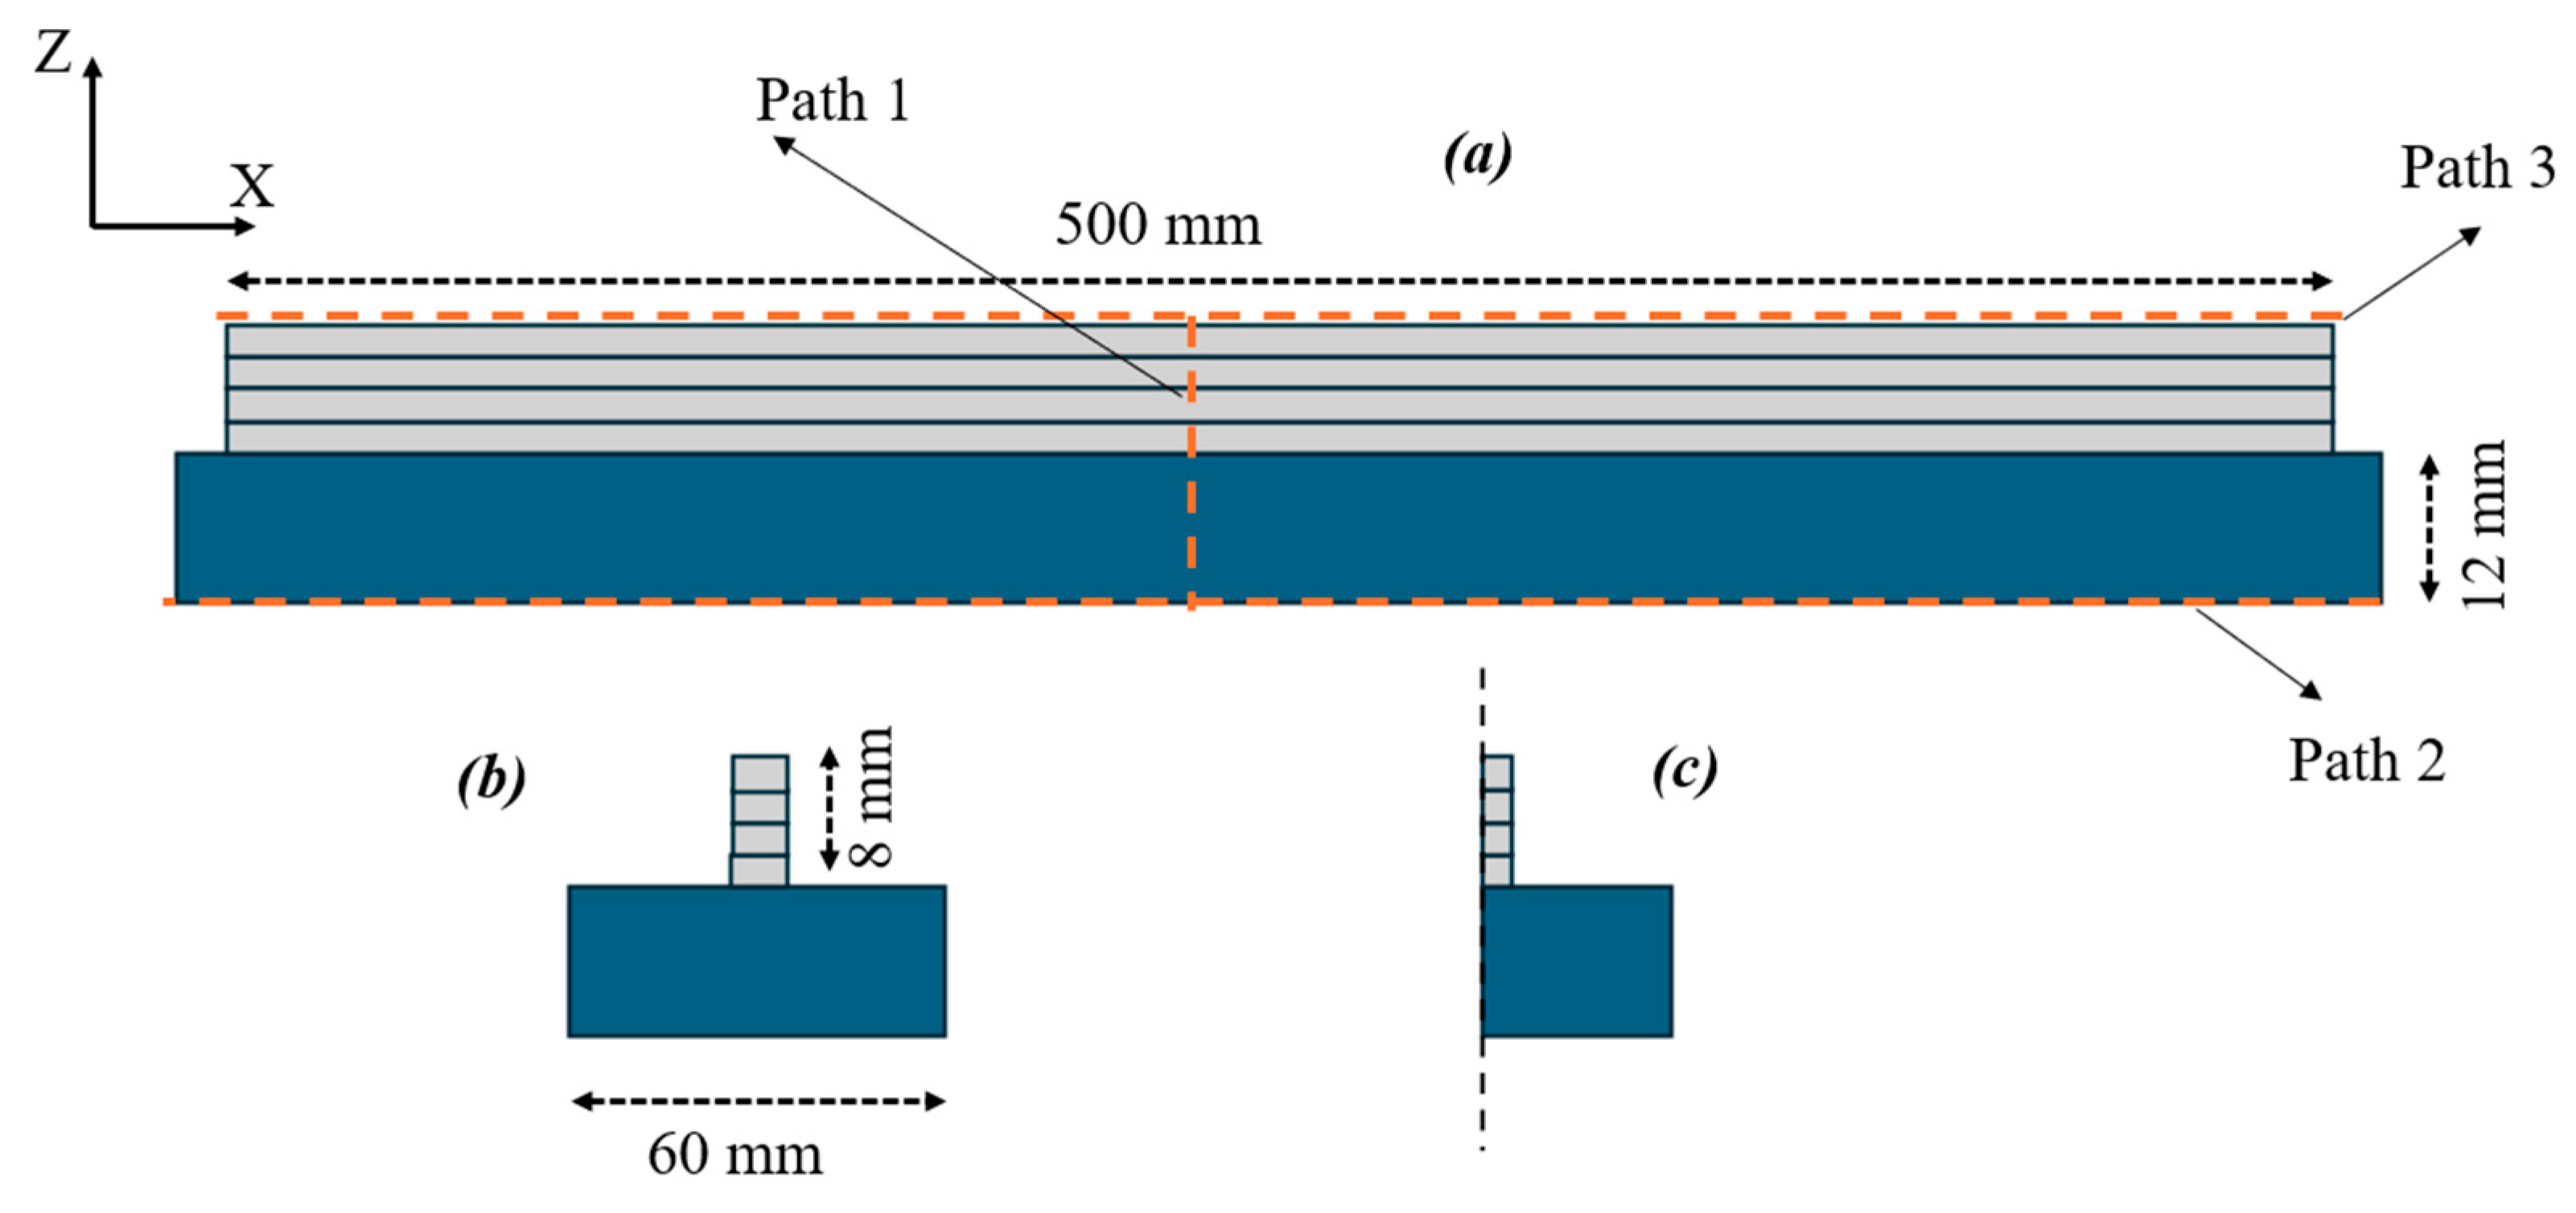
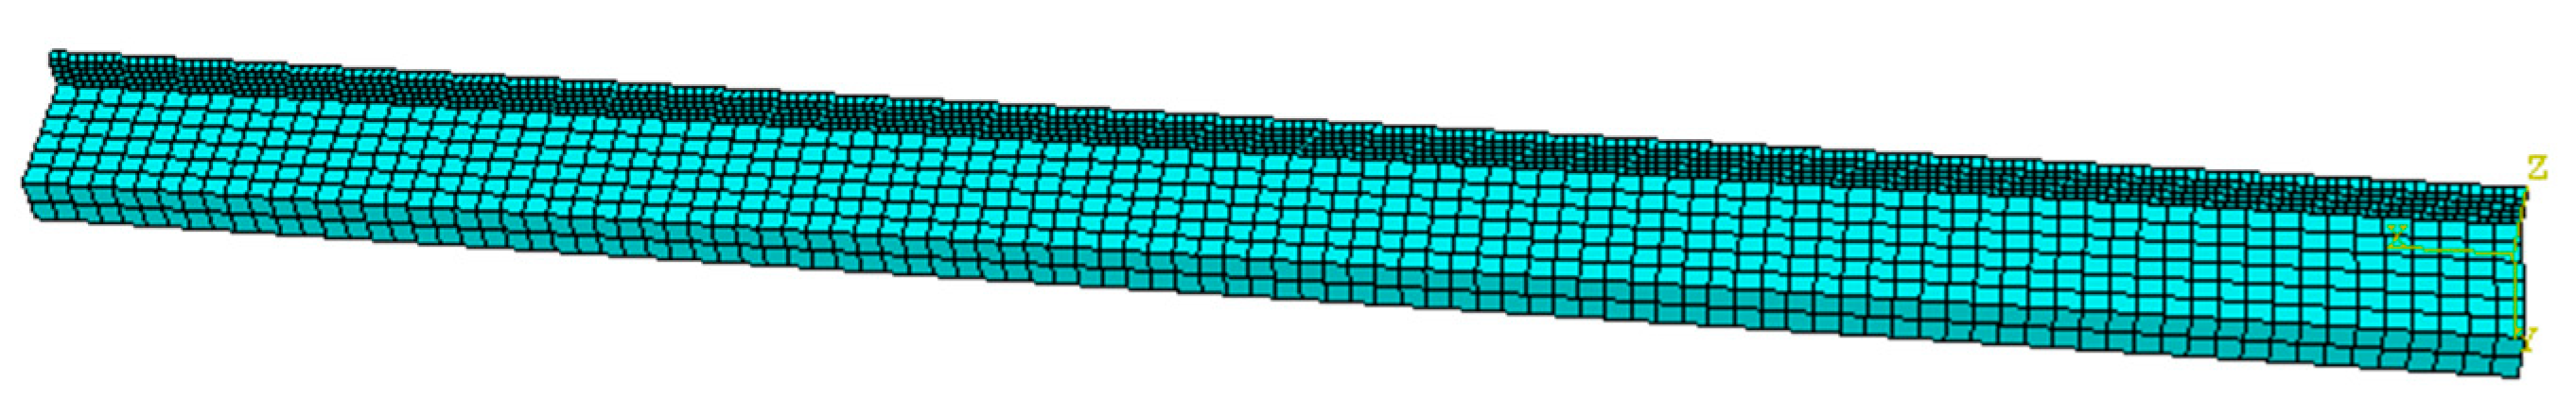
3. Thermal–Mechanical Finite Element Models
3.1. Thermal Simulation
3.2. Structural Simulation
3.3. Model Validation
4. Results and Discussion
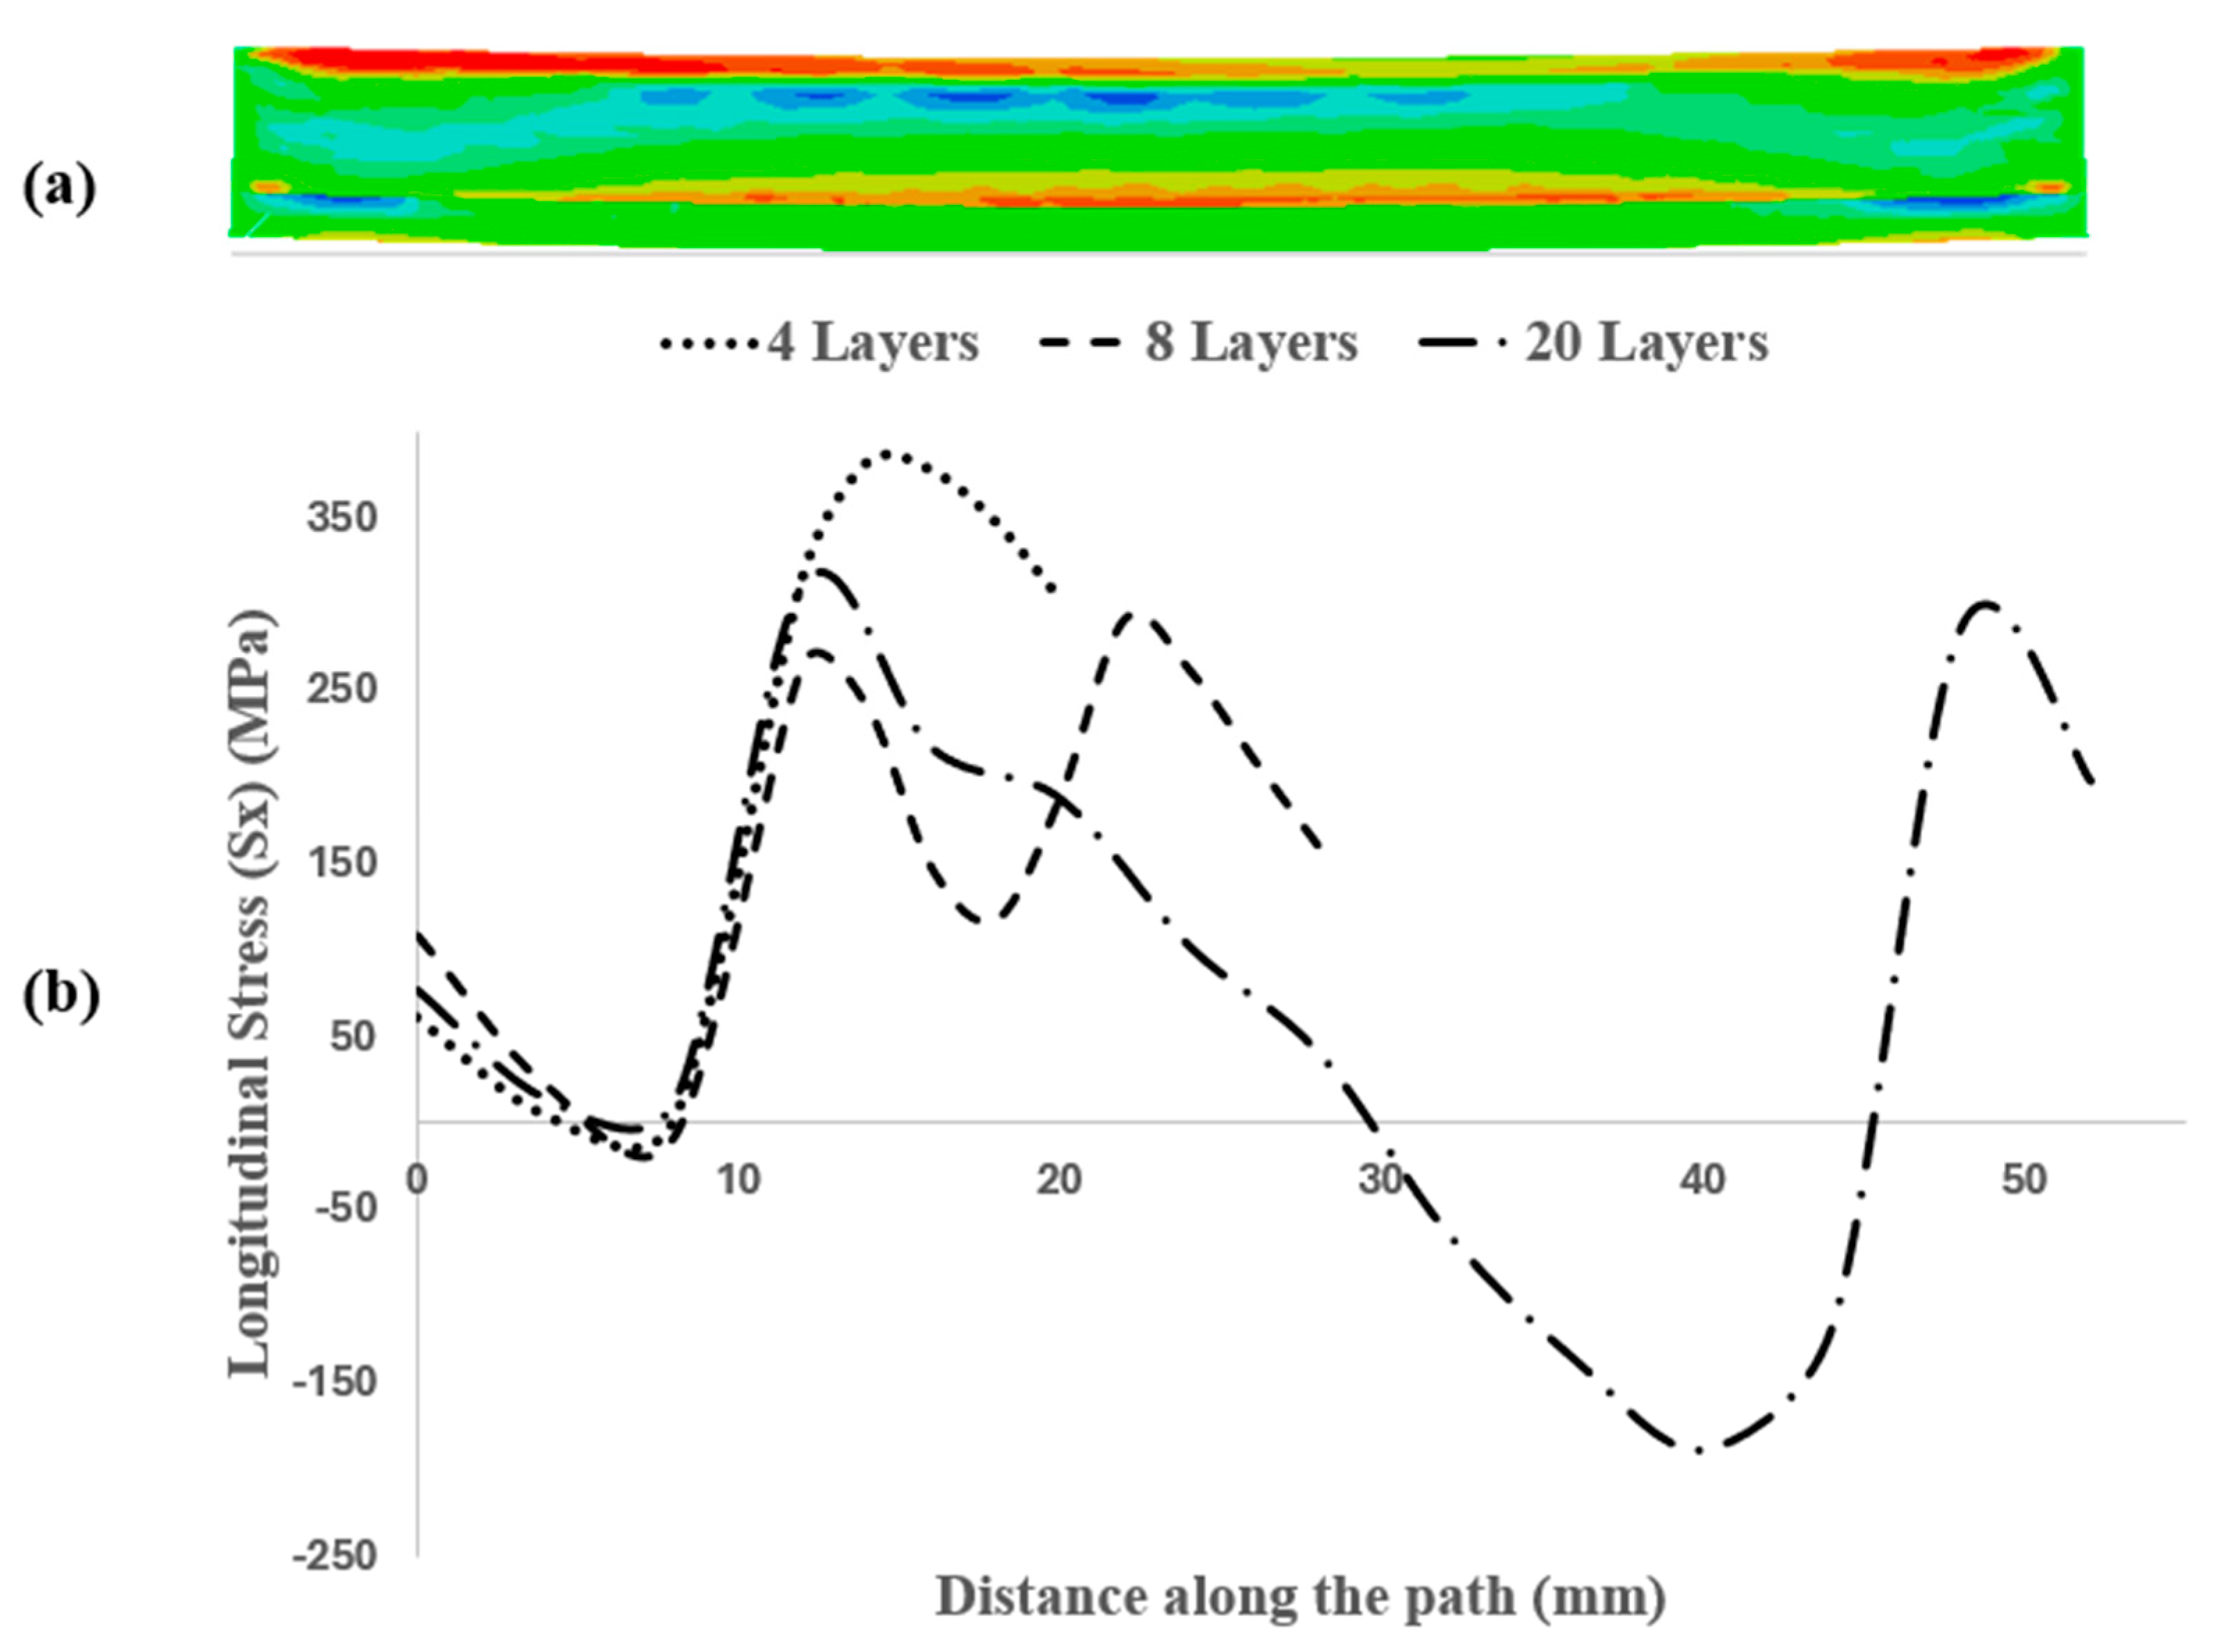
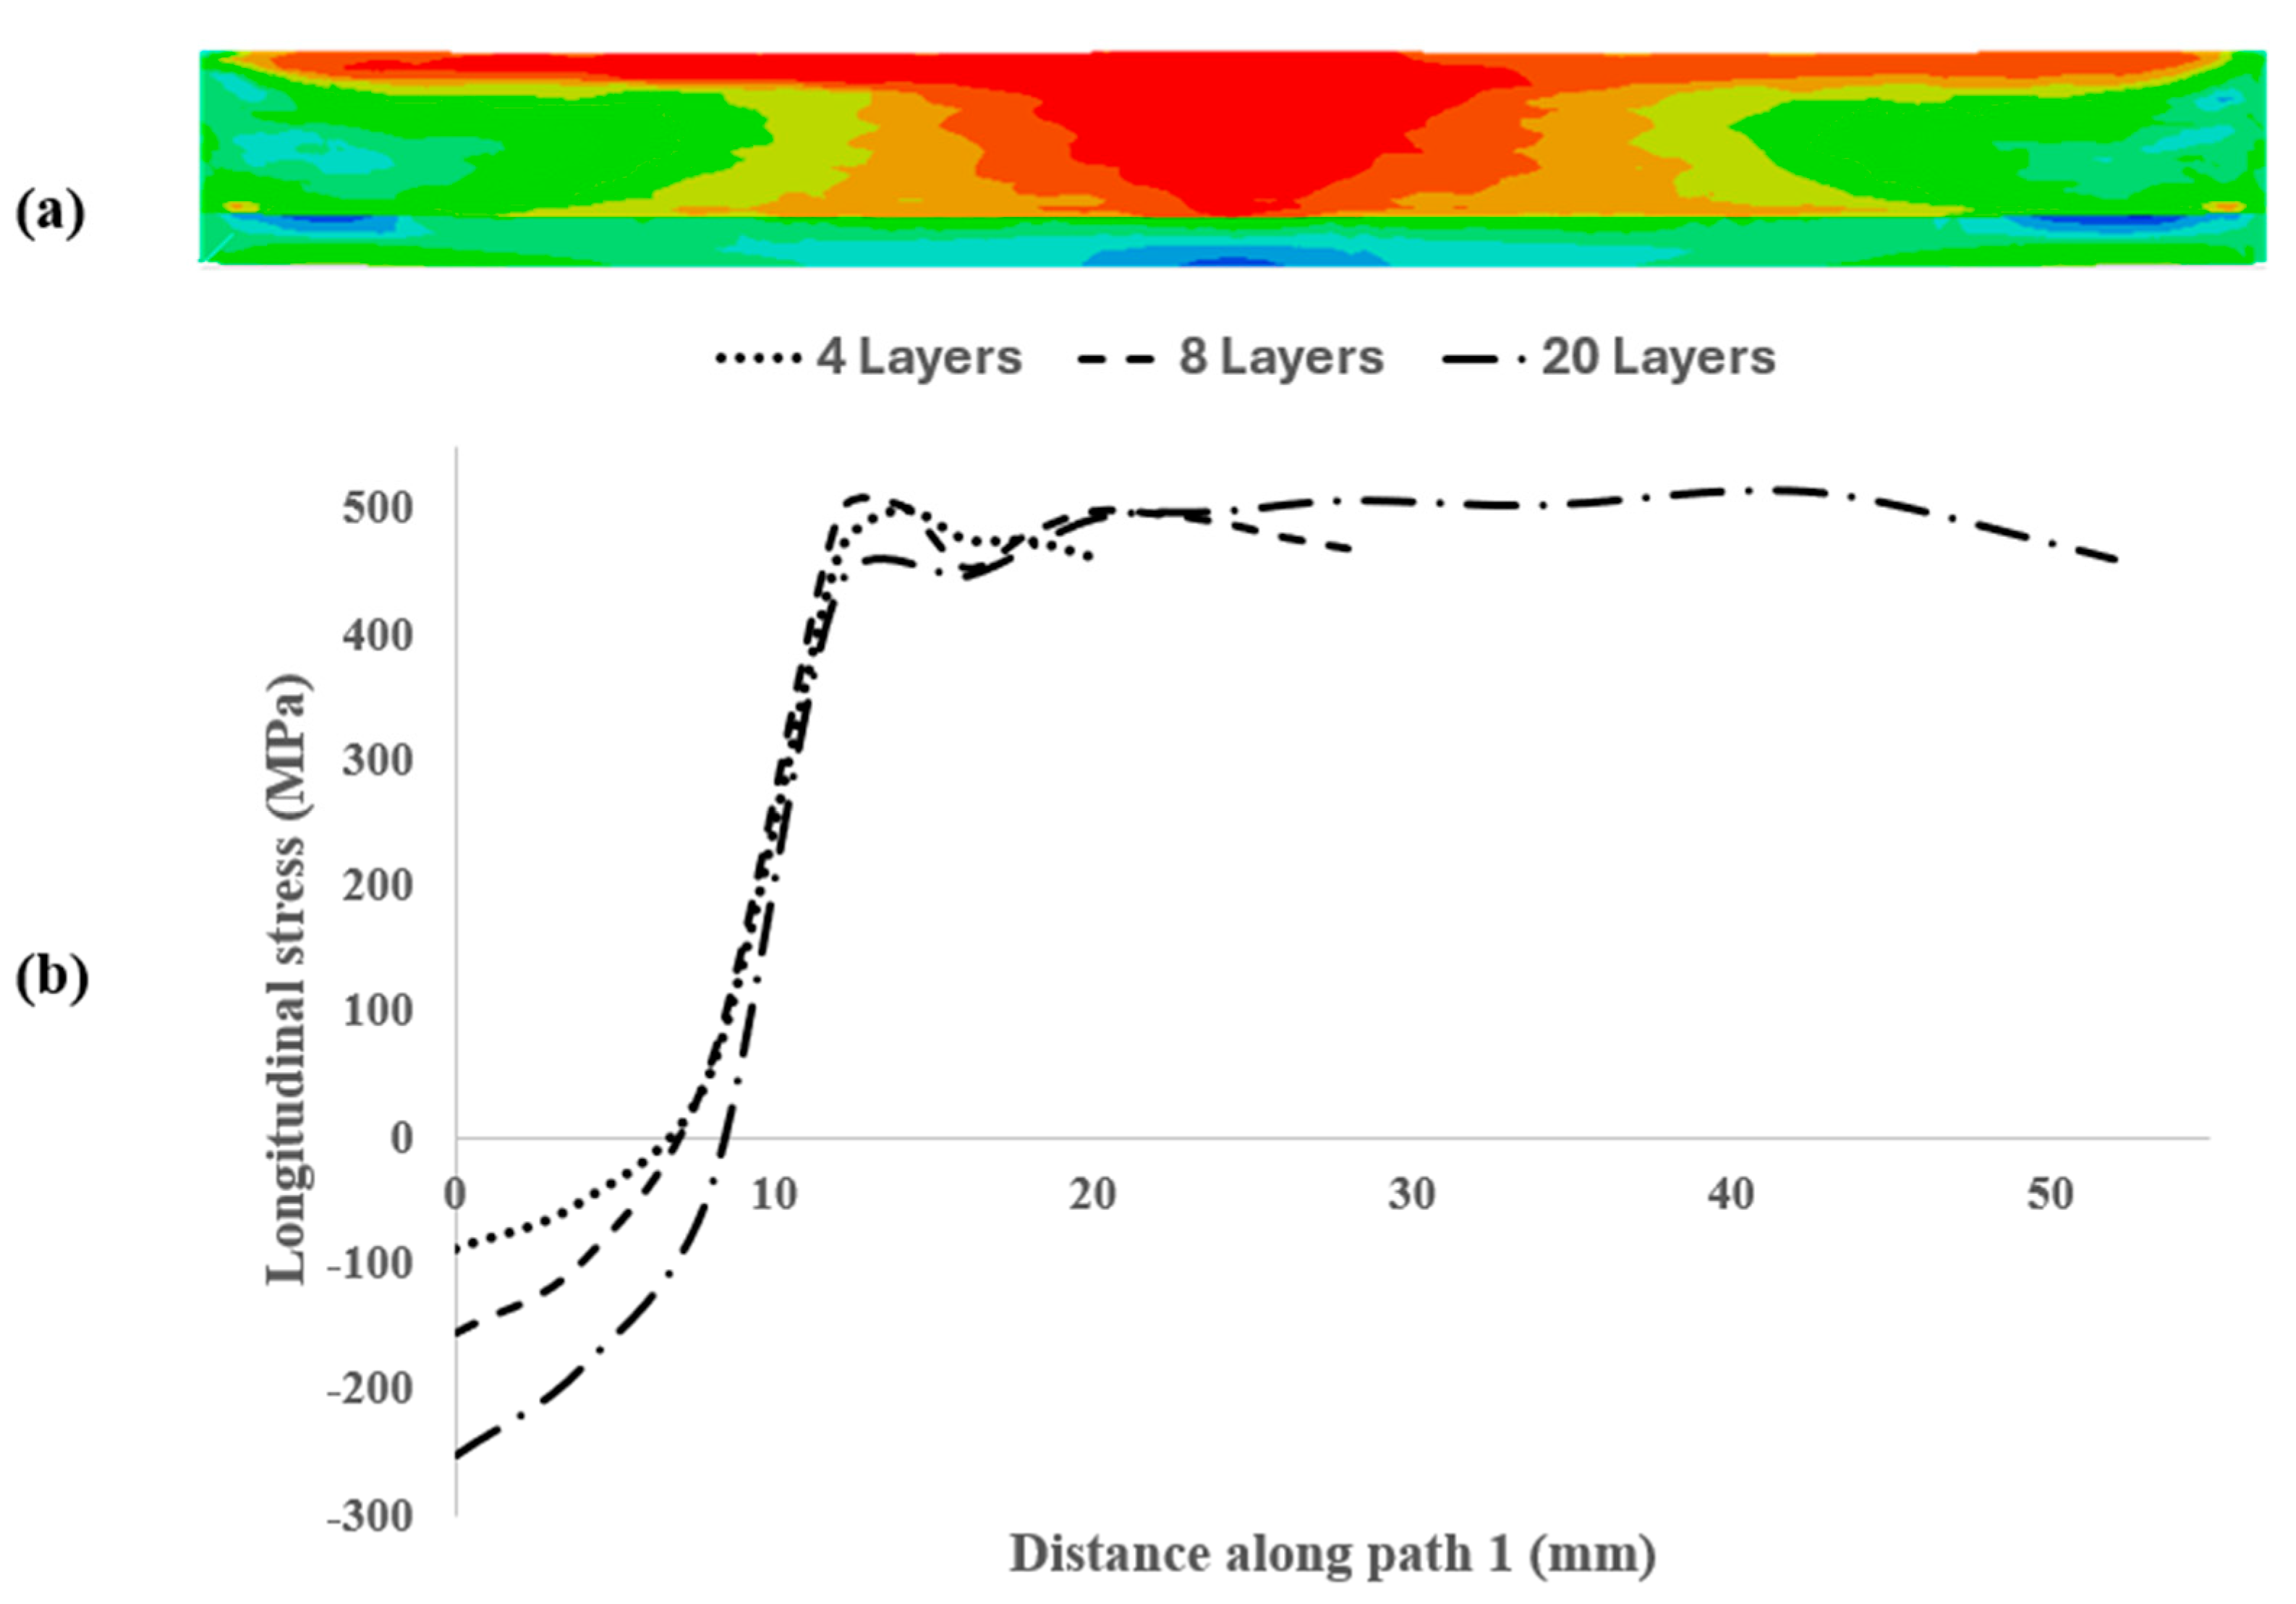
4.1. Residual Stress
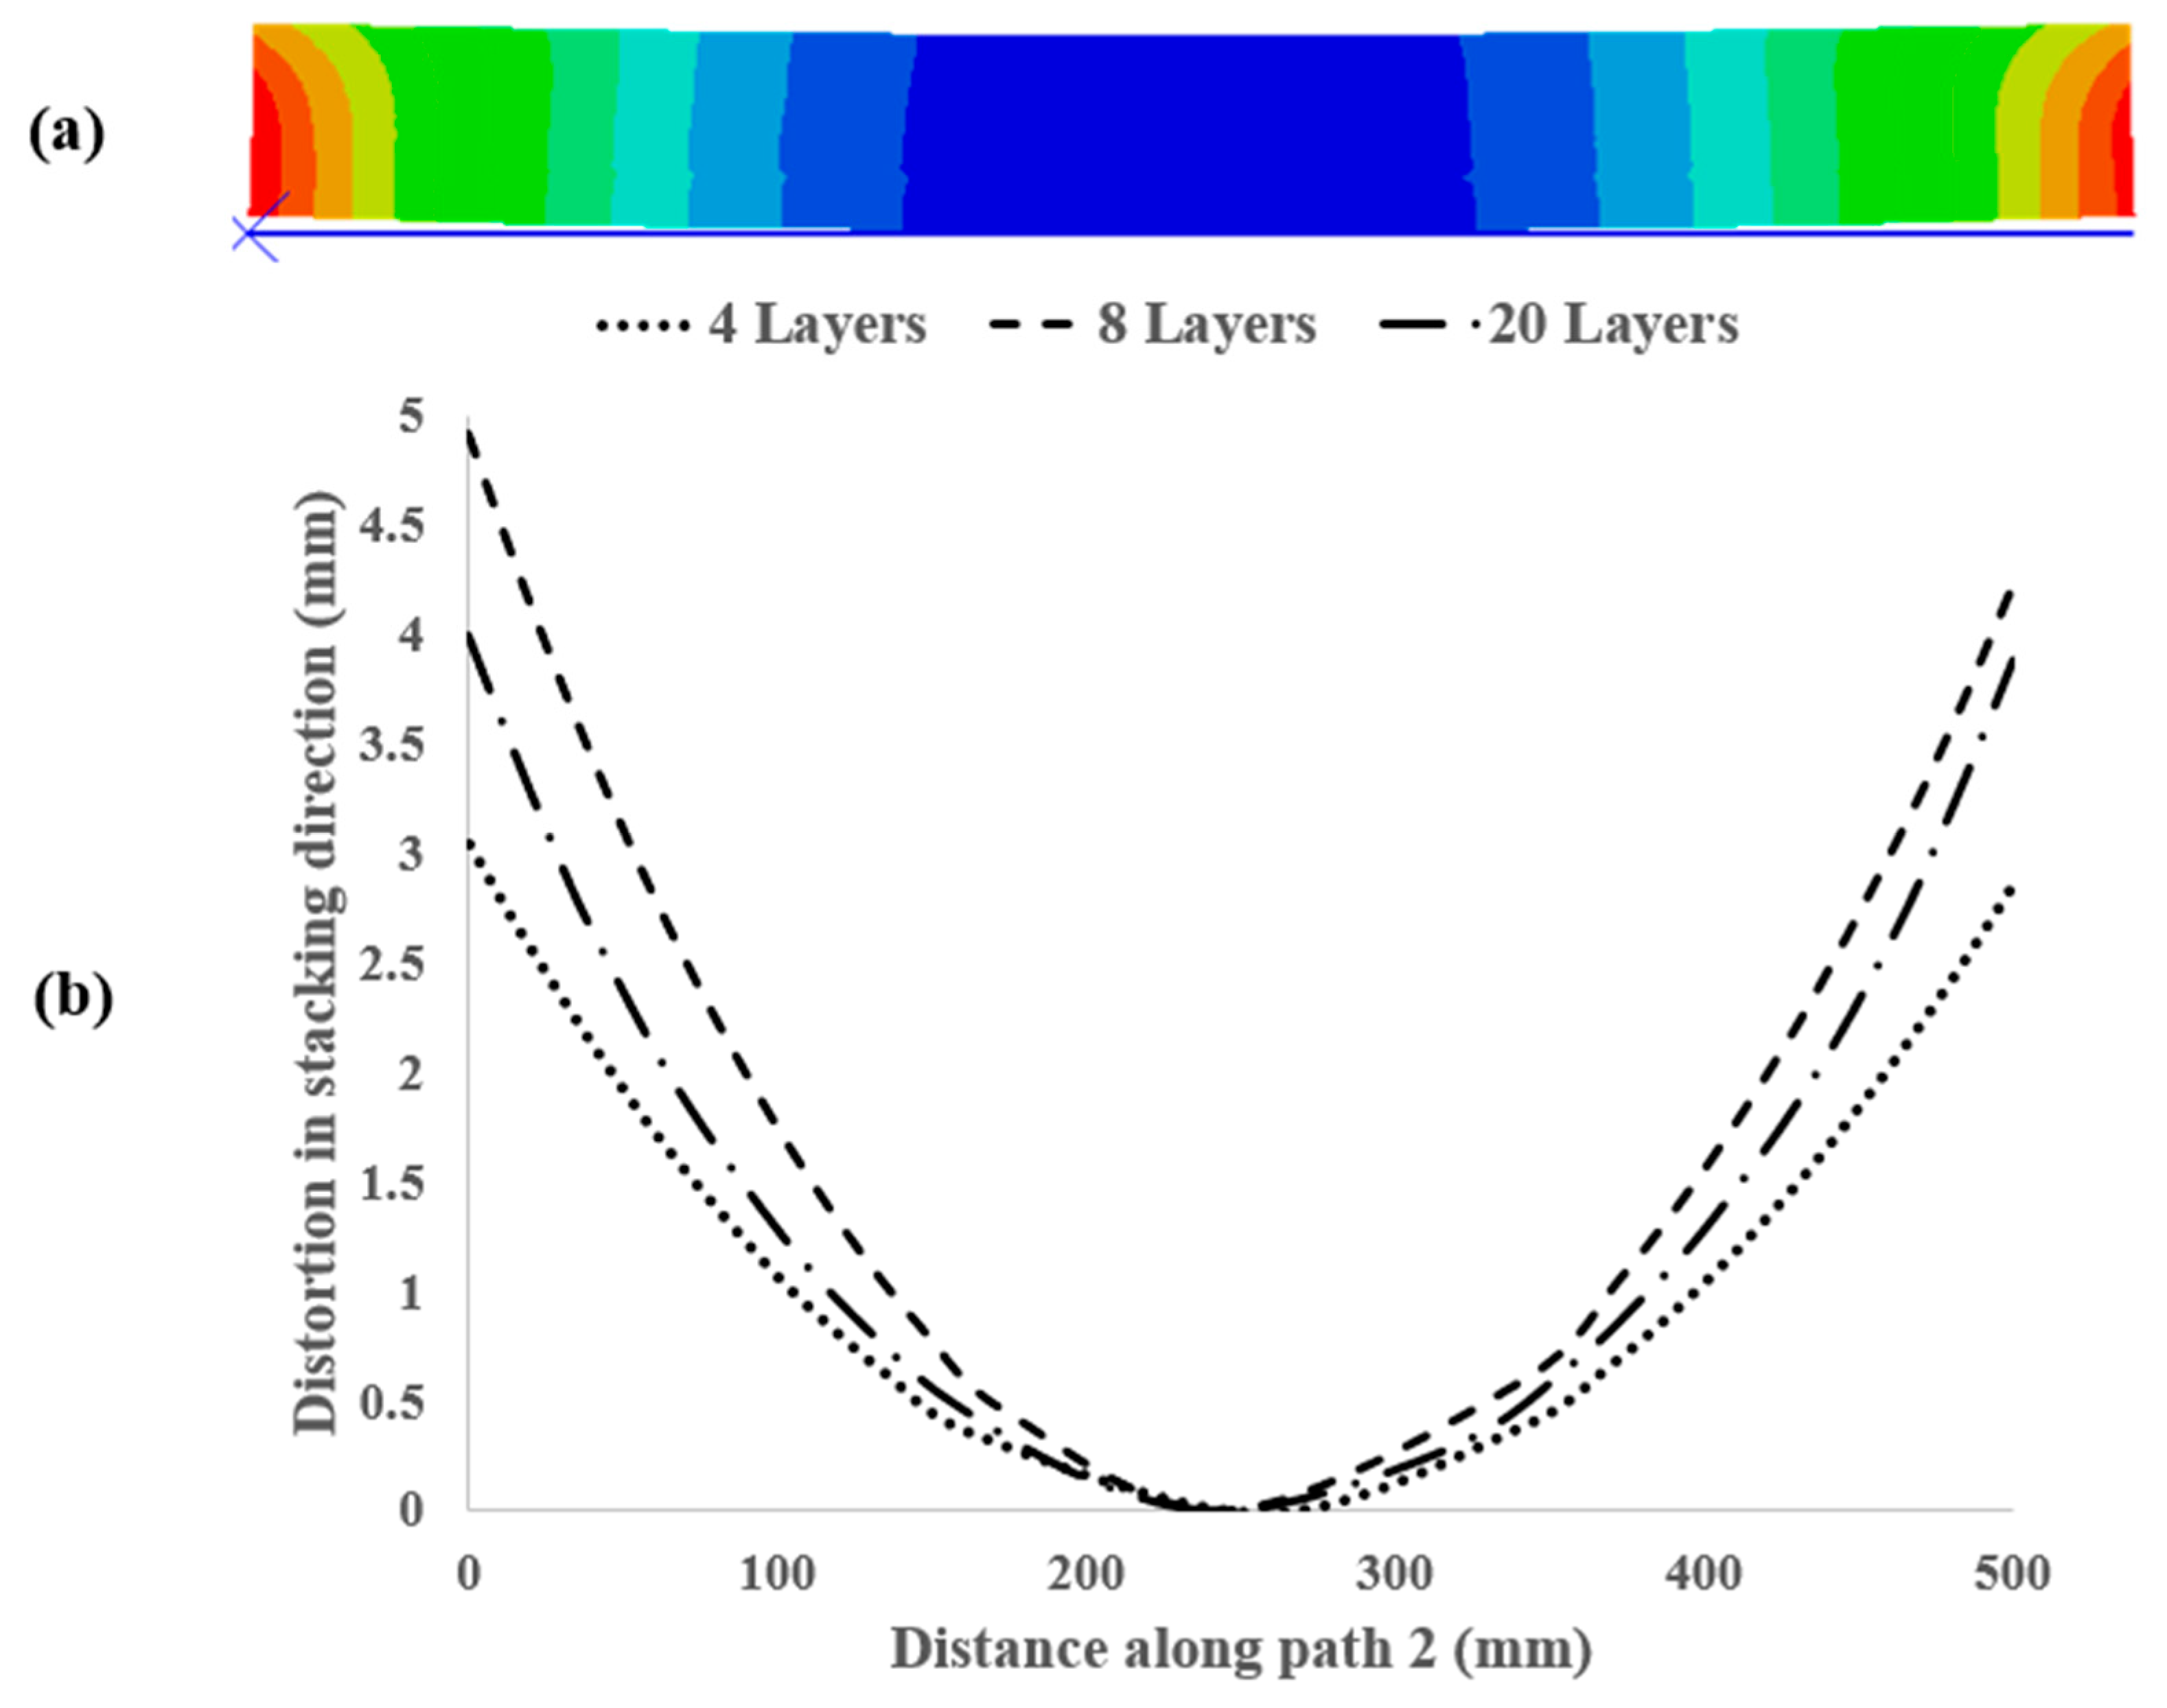
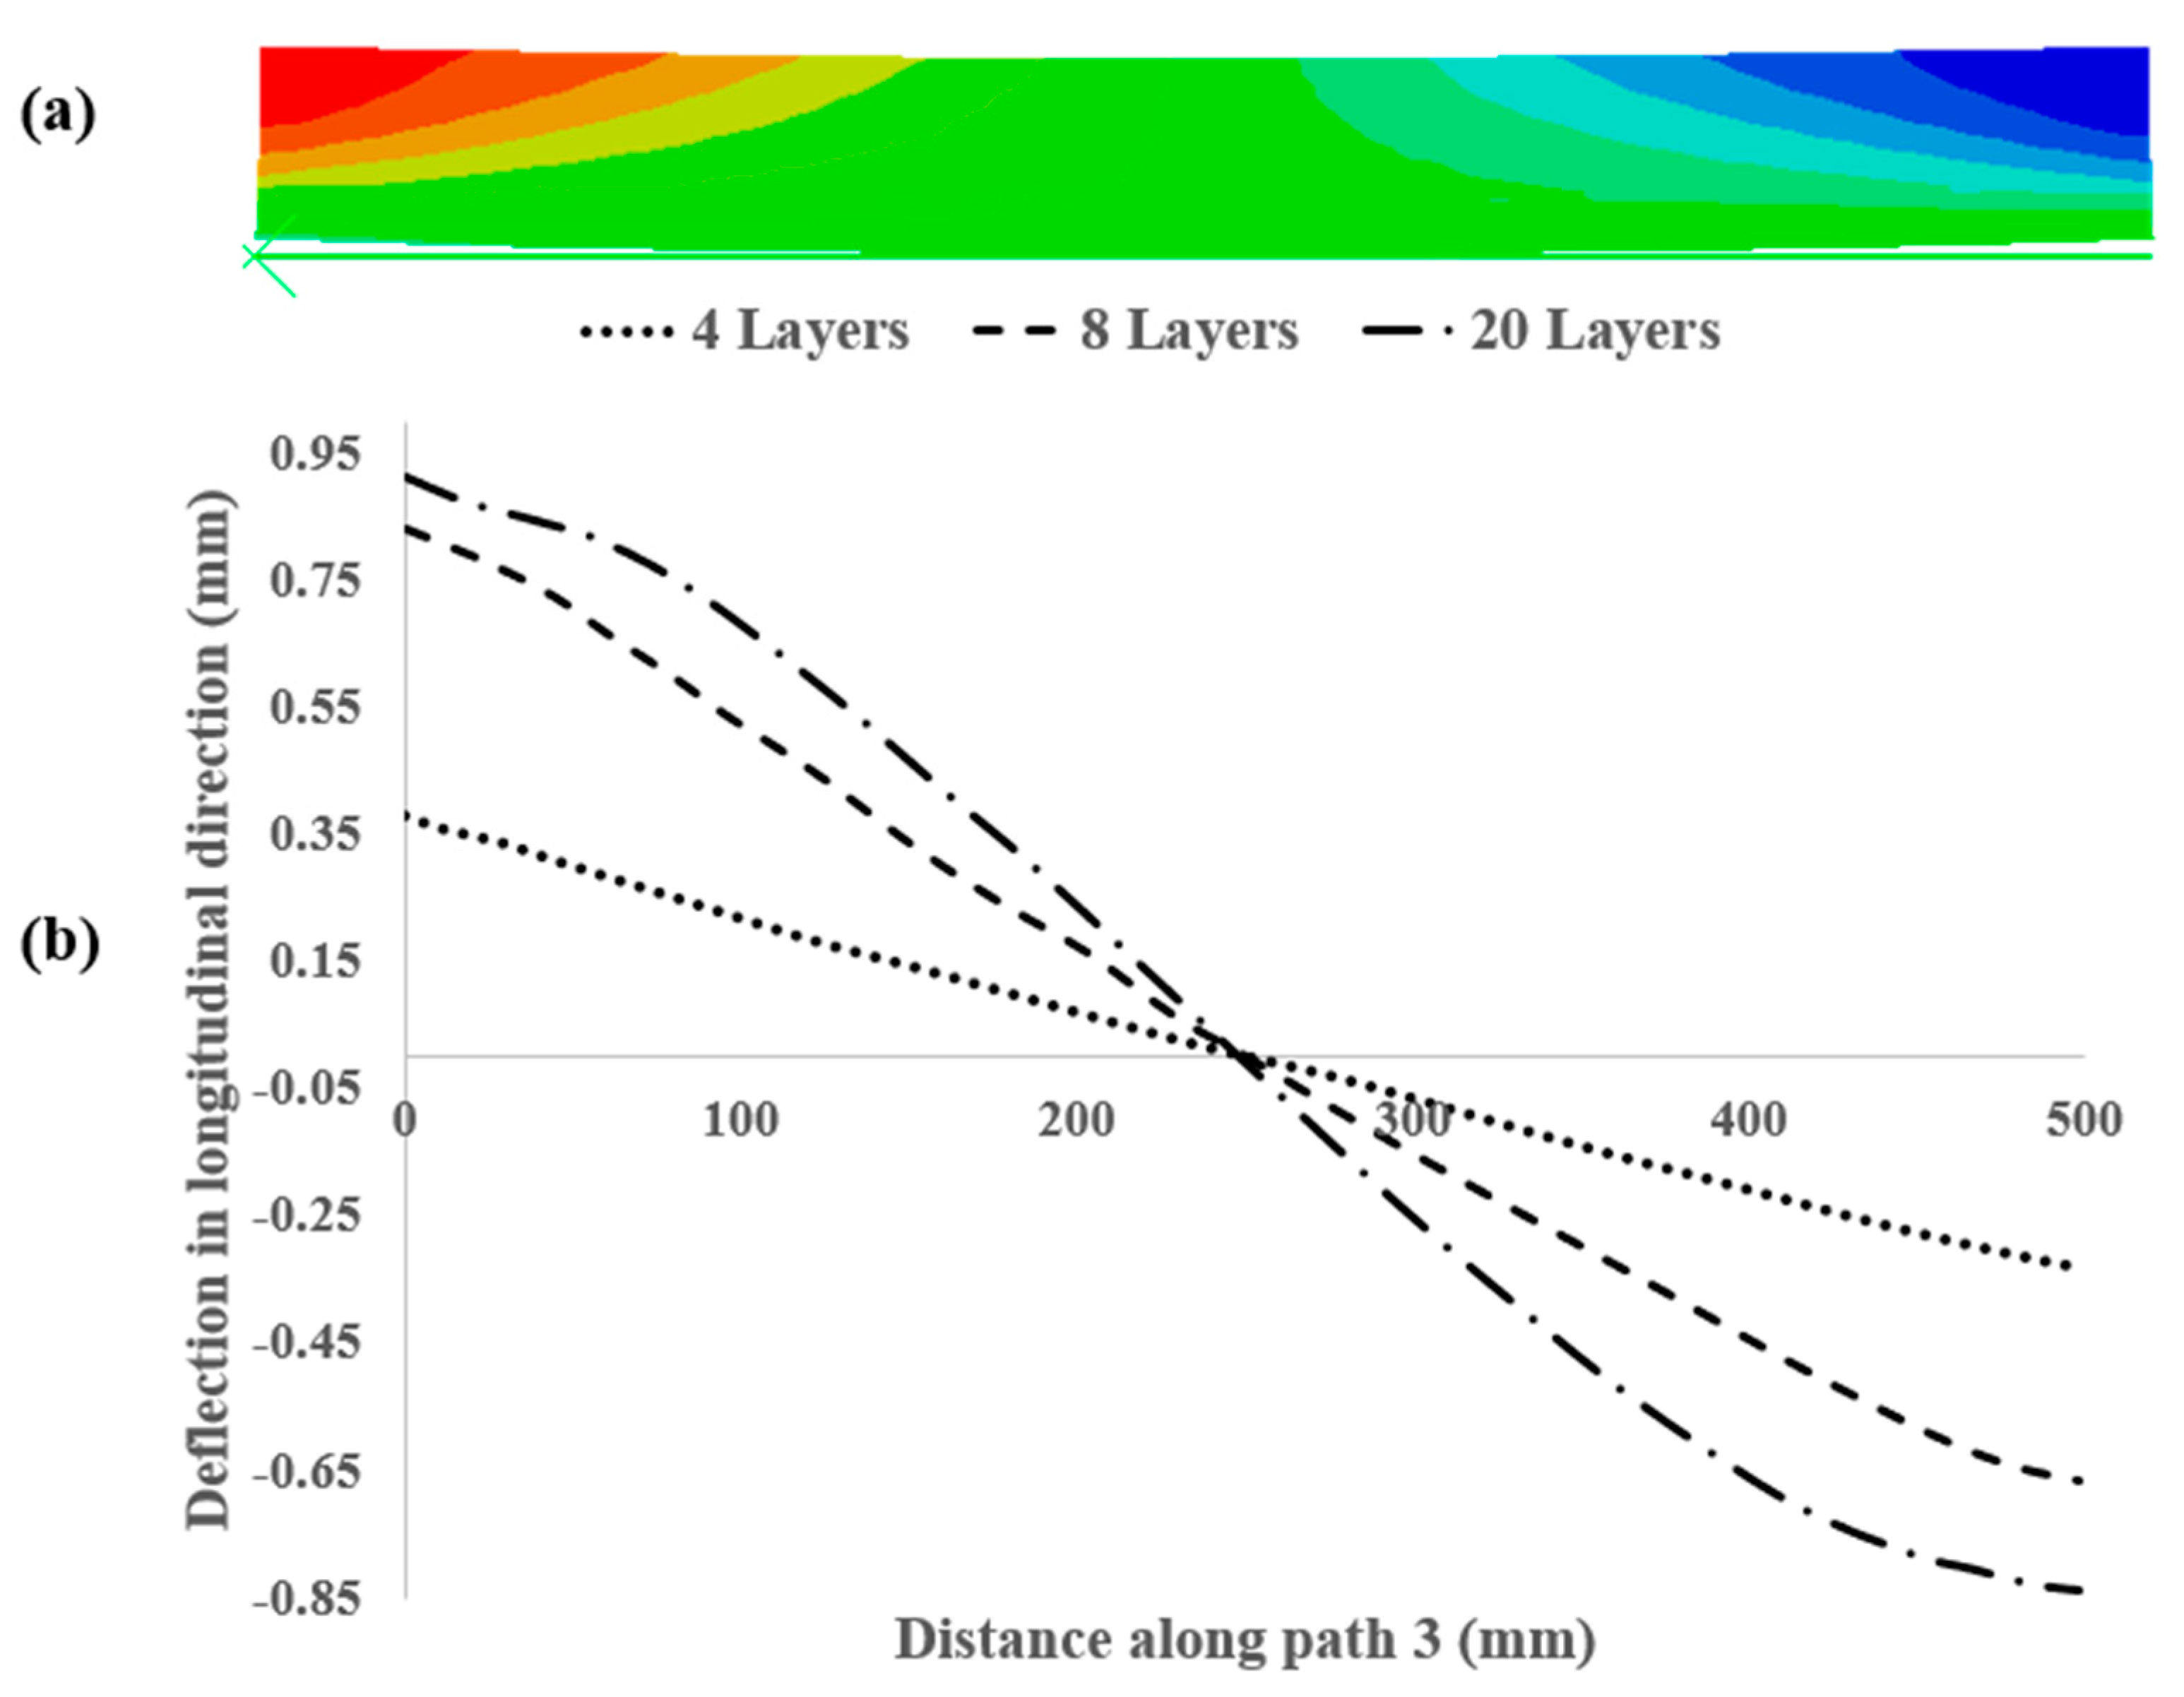
4.2. Deflection
5. Conclusions
6. Future Work
Author Contributions
Funding
Data Availability Statement
Conflicts of Interest
References
- Amal, M.S.; Justus Panicker, C.T.; Senthilkumar, V. Simulation of Wire Arc Additive Manufacturing to Find out the Optimal Path Planning Strategy. Mater. Today Proc. 2022, 66, 2405–2410. [Google Scholar] [CrossRef]
- Franke, J.; Heinrich, F.; Reisch, R.T. Vision Based Process Monitoring in Wire Arc Additive Manufacturing (WAAM). J. Intell. Manuf. 2024, 36, 1711–1721. [Google Scholar] [CrossRef]
- Williams, S.W.; Martina, F.; Addison, A.C.; Ding, J.; Pardal, G.; Colegrove, P. Wire + Arc Additive Manufacturing. Mater. Sci. Technol. 2016, 32, 641–647. [Google Scholar] [CrossRef]
- Martina, F.; Williams, S. Wire+arc Additive Manufacturing vs. Traditional Machining from Solid: A Cost Comparison. Mater. Sci. Technol. 2015, 32, 27. [Google Scholar]
- Rodrigues, T.A.; Duarte, V.; Miranda, R.M.; Santos, T.G.; Oliveira, J.P. Current Status and Perspectives on Wire and Arc Additive Manufacturing (WAAM). Materials 2019, 12, 1121. [Google Scholar] [CrossRef]
- Jafari, D.; Vaneker, T.H.J.; Gibson, I. Wire and Arc Additive Manufacturing: Opportunities and Challenges to Control the Quality and Accuracy of Manufactured Parts. Mater. Des. 2021, 202, 109471. [Google Scholar] [CrossRef]
- Langelandsvik, G.; Akselsen, O.M.; Furu, T.; Roven, H.J. Review of Aluminum Alloy Development for Wire Arc Additive Manufacturing. Materials 2021, 14, 5370. [Google Scholar] [CrossRef]
- Ngo, T.D.; Kashani, A.; Imbalzano, G.; Nguyen, K.T.Q.; Hui, D. Additive Manufacturing (3D Printing): A Review of Materials, Methods, Applications and Challenges. Compos. Part B Eng. 2018, 143, 172–196. [Google Scholar] [CrossRef]
- Xu, X.; Ganguly, S.; Ding, J.; Seow, C.E.; Williams, S. Enhancing Mechanical Properties of Wire + arc Additively Manufactured INCONEL 718 Superalloy through In-Process Thermomechanical Processing. Mater. Des. 2018, 160, 1042–1051. [Google Scholar] [CrossRef]
- Williams, S.W.; Colegrove, P.A.; Ganguly, S. Residual Stress Characterization and Control in the Additive Manufacture of Large Scale Metal Structures. In Proceedings of the International Conference on Residual Stresses, Sydney, Australia, 3–7 July 2016. [Google Scholar]
- A Surrogate Modeling Approach for Additive-Manufactured Materials. Available online: https://www.researchgate.net/publication/320403513_A_surrogate_modeling_approach_for_additive-manufactured_materials (accessed on 5 May 2025).
- Xin, H.; Sun, W.; Fish, J. Discrete Element Simulations of Powder-Bed Sintering-Based Additive Manufacturing. Int. J. Mech. Sci. 2018, 149, 373–392. [Google Scholar] [CrossRef]
- Xin, H.; Tarus, I.; Cheng, L.; Veljkovic, M.; Persem, N.; Lorich, L. Experiments and Numerical Simulation of Wire and Arc Additive Manufactured Steel Materials. Structures 2021, 34, 1393–1402. [Google Scholar] [CrossRef]
- Shah, A.; Aliyev, R.; Zeidler, H.; Krinke, S. A Review of the Recent Developments and Challenges in Wire Arc Additive Manufacturing (WAAM) Process. J. Manuf. Mater. Process. 2023, 7, 97. [Google Scholar] [CrossRef]
- Nagalingam, A.P.; Shamir, M.; Tureyen, E.B.; Sharman, A.R.C.; Poyraz, O.; Yasa, E.; Hughes, J. Recent Progress in Wire-Arc and Wire-Laser Directed Energy Deposition (DED) of Titanium and Aluminium Alloys. Int. J. Adv. Manuf. Technol. 2025, 136, 2035–2073. [Google Scholar] [CrossRef]
- Sethuraman, A.; Vijayaragavan, E.; Lakshmanan, T.; Geethapriyan, T.; Palani, I.A. Optimization and Finite Element Analysis Simulation on Mechanical Behavior of Wire Arc Additive Manufacturing for SS316L Using Response Surface Methodology. J. Mater. Eng. Perform. 2025, 34, 8096–8116. [Google Scholar] [CrossRef]
- Pragana, J.; Sampaio, R.; Bragança, I.; Silva, C.; Nielsen, C.; Martins, P. Macro-Scale Finite Element Simulation of Wire-Arc Additive Manufacturing. Proc. Inst. Mech. Eng. Part L J. Mater. Des. Appl. 2025, 239, 1013–1022. [Google Scholar] [CrossRef]
- Zhao, X.F.; Zapata, A.; Bernauer, C.; Baehr, S.; Zaeh, M.F. Simulation of Wire Arc Additive Manufacturing in the Reinforcement of a Half-Cylinder Shell Geometry. Materials 2023, 16, 4568. [Google Scholar] [CrossRef]
- Ding, J.; Colegrove, P.; Mehnen, J.; Ganguly, S.; Sequeira Almeida, P.M.; Wang, F.; Williams, S. Thermo-Mechanical Analysis of Wire and Arc Additive Layer Manufacturing Process on Large Multi-Layer Parts. Comput. Mater. Sci. 2011, 50, 3315–3322. [Google Scholar] [CrossRef]
- Zhang, L.; Michaleris, P. Investigation of Lagrangian and Eulerian Finite Element Methods for Modeling the Laser Forming Process. Finite Elem. Anal. Des. 2004, 40, 383–405. [Google Scholar] [CrossRef]
- Nakai-Chapman, J.; Fietek, C.; Love, A.; Sakai, J.; Park, Y.H. Metal Additive Manufacturing Simulation Using Sequentially Coupled Thermomechanical Analysis with Johnson–Cook Constitutive Material Model. Multiscale Multidiscip. Model. Exp. Des. 2024, 7, 801–810. [Google Scholar] [CrossRef]
- Johnson, G.R.; Cook, W.H. Fracture Characteristics of Three Metals Subjected to Various Strains, Strain Rates, Temperatures and Pressures. Eng. Fract. Mech. 1985, 21, 31–48. [Google Scholar] [CrossRef]
- Ming, L.; Pantalé, O. An Efficient and Robust VUMAT Implementation of Elastoplastic Constitutive Laws in Abaqus/Explicit Finite Element Code. Mech. Ind. 2018, 19, 308. [Google Scholar] [CrossRef]
- A Constitutive Model and Data for Metals Subjected to Large Strains, High Strain Rates and High Temperatures—百度学术 (Baidu Scholar). Available online: https://xueshu.baidu.com/usercenter/paper/show?paperid=0f71104f9f3ba4edde050dae0e91e74c (accessed on 5 May 2025).
- Zaera, R.; Fernández-Sáez, J. An Implicit Consistent Algorithm for the Integration of Thermoviscoplastic Constitutive Equations in Adiabatic Conditions and Finite Deformations. Int. J. Solids Struct. 2006, 43, 1594–1612. [Google Scholar] [CrossRef]
- Optional Strain Rate Forms For The Johnson Cook|PDF|Plasticity (Physics)|Yield (Engineering). Available online: https://www.scribd.com/document/81847980/Optional-Strain-Rate-Forms-for-the-Johnson-Cook (accessed on 5 May 2025).
- Montevecchi, F.; Venturini, G.; Scippa, A.; Campatelli, G. Finite Element Modelling of Wire-Arc-Additive-Manufacturing Process. Procedia CIRP 2016, 55, 109–114. [Google Scholar] [CrossRef]
- Yadav, S.; Singhal, S.; Jasra, Y.; Saxena, R.K. Determination of Johnson-Cook Material Model for Weldment of Mild Steel. Mater. Today Proc. 2020, 28, 1801–1808. [Google Scholar] [CrossRef]


| (mm) | (mm) | b (mm) | c (mm) | Q (W) | ||
|---|---|---|---|---|---|---|
| 2 | 6 | 2.5 | 3 | 2245.83 | 0.6 | 1.4 |
| A (MPa) | B (MPa) | n | C | m | (°C) | (°C) | |
|---|---|---|---|---|---|---|---|
| 363 | 792.7 | 0.5756 | 0.0054 | 1.6456 | 20 | 1525 | 0.6 |
| Type of Analysis | Analysis Time (Hour) | Maximum Increment Size (Second) |
|---|---|---|
| Thermal | 0.2 | 5 |
| Structural | 1.7 | 5 |
Disclaimer/Publisher’s Note: The statements, opinions and data contained in all publications are solely those of the individual author(s) and contributor(s) and not of MDPI and/or the editor(s). MDPI and/or the editor(s) disclaim responsibility for any injury to people or property resulting from any ideas, methods, instructions or products referred to in the content. |
© 2025 by the authors. Licensee MDPI, Basel, Switzerland. This article is an open access article distributed under the terms and conditions of the Creative Commons Attribution (CC BY) license (https://creativecommons.org/licenses/by/4.0/).
Share and Cite
Behseresht, S.; Park, Y.H. Warpage Prediction in Wire Arc Additive Manufacturing: A Comparative Study of Isotropic and Johnson–Cook Plasticity Models. Metals 2025, 15, 665. https://doi.org/10.3390/met15060665
Behseresht S, Park YH. Warpage Prediction in Wire Arc Additive Manufacturing: A Comparative Study of Isotropic and Johnson–Cook Plasticity Models. Metals. 2025; 15(6):665. https://doi.org/10.3390/met15060665
Chicago/Turabian StyleBehseresht, Saeed, and Young Ho Park. 2025. "Warpage Prediction in Wire Arc Additive Manufacturing: A Comparative Study of Isotropic and Johnson–Cook Plasticity Models" Metals 15, no. 6: 665. https://doi.org/10.3390/met15060665
APA StyleBehseresht, S., & Park, Y. H. (2025). Warpage Prediction in Wire Arc Additive Manufacturing: A Comparative Study of Isotropic and Johnson–Cook Plasticity Models. Metals, 15(6), 665. https://doi.org/10.3390/met15060665