

Experimental Study of Process Parameter Effects on Internal Defects in Titanium Coaxial Wire-Based Laser Metal Deposition


Abstract
1. Introduction
2. Materials and Methods
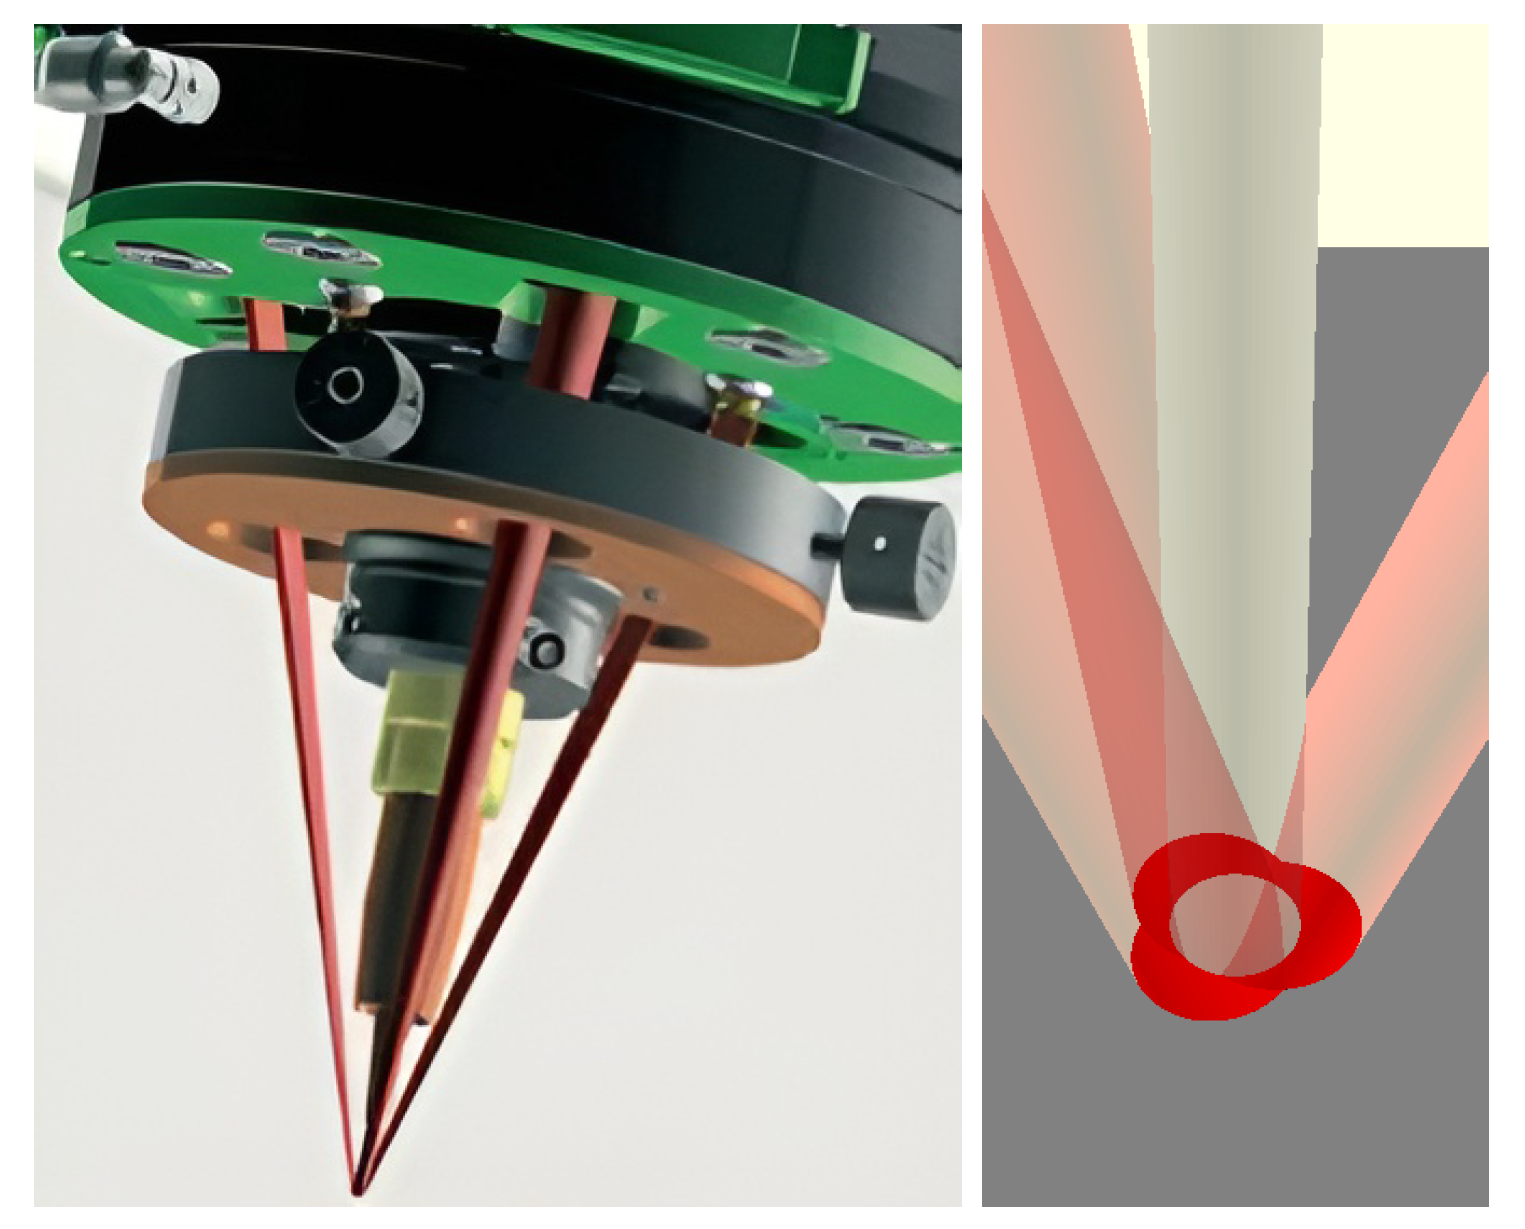
2.1. Experimental Setup
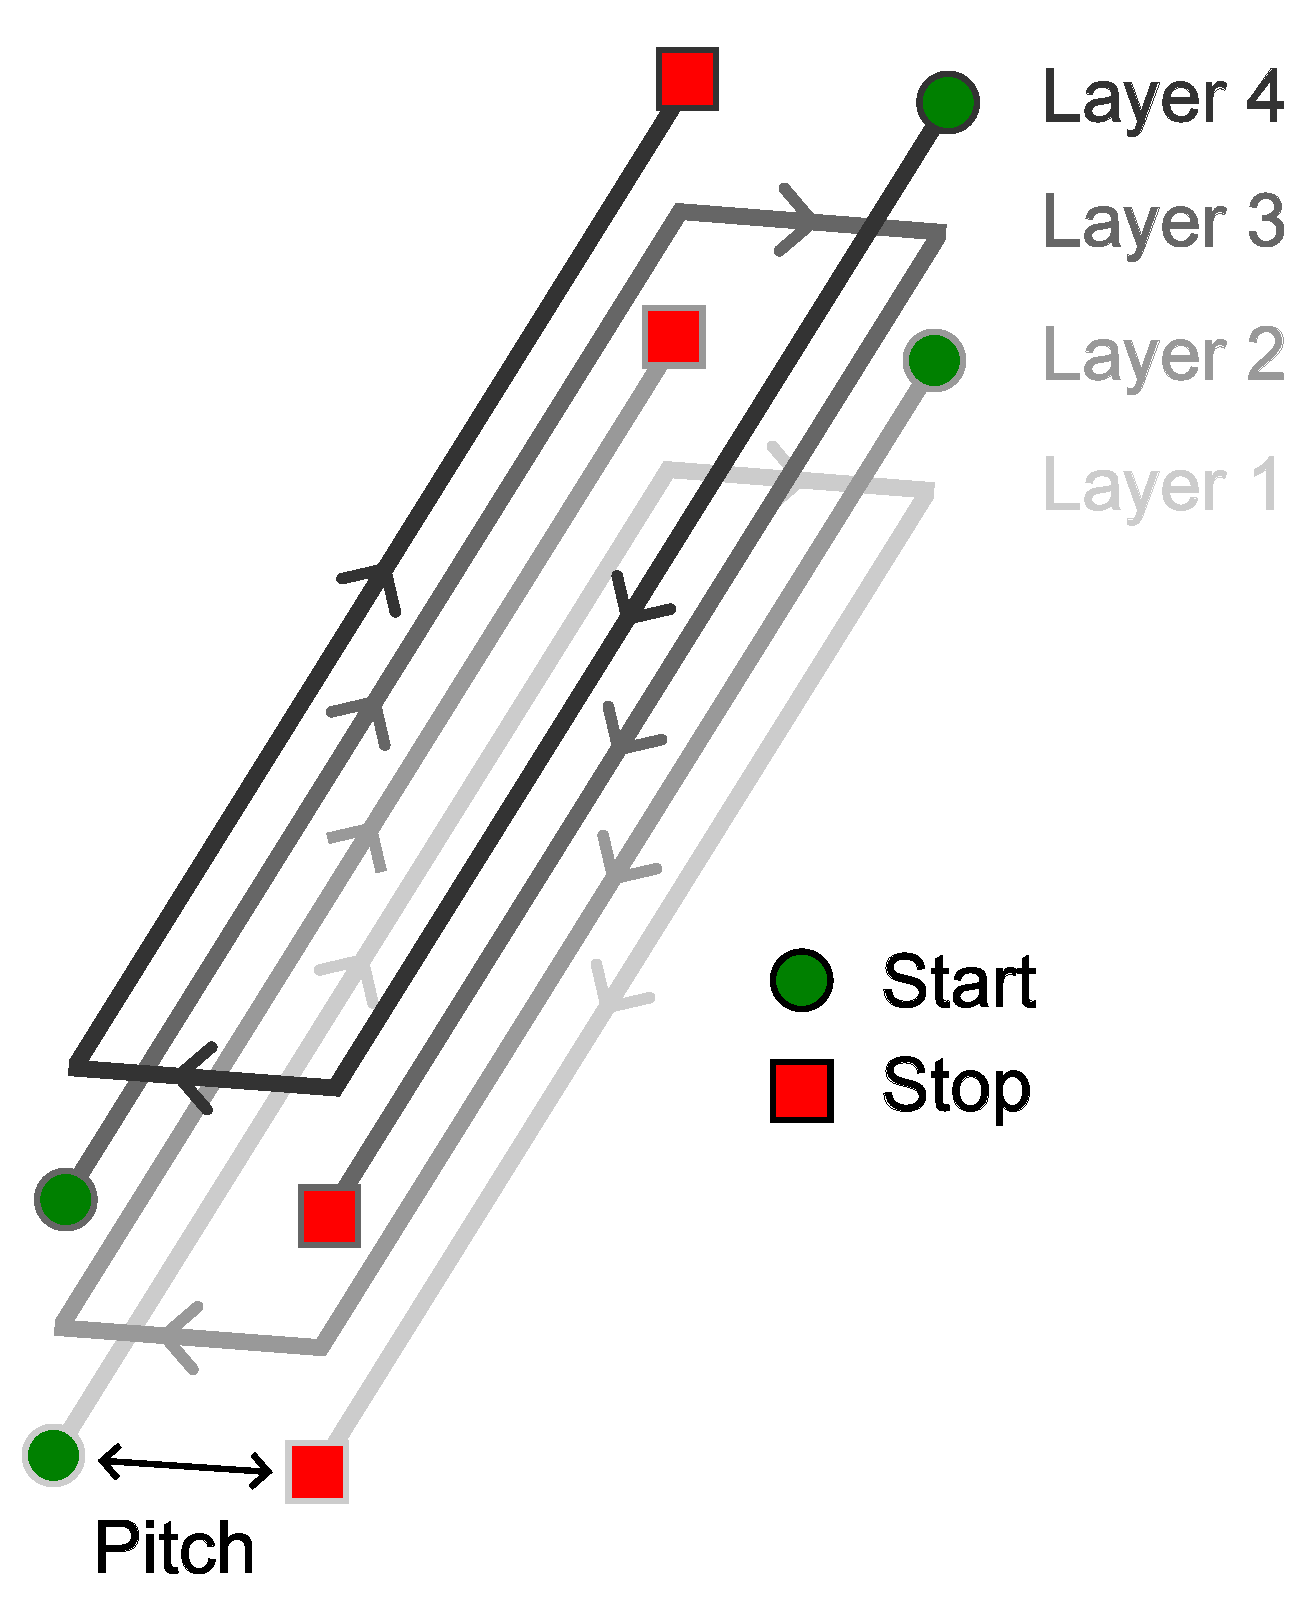
2.2. Experimental Design
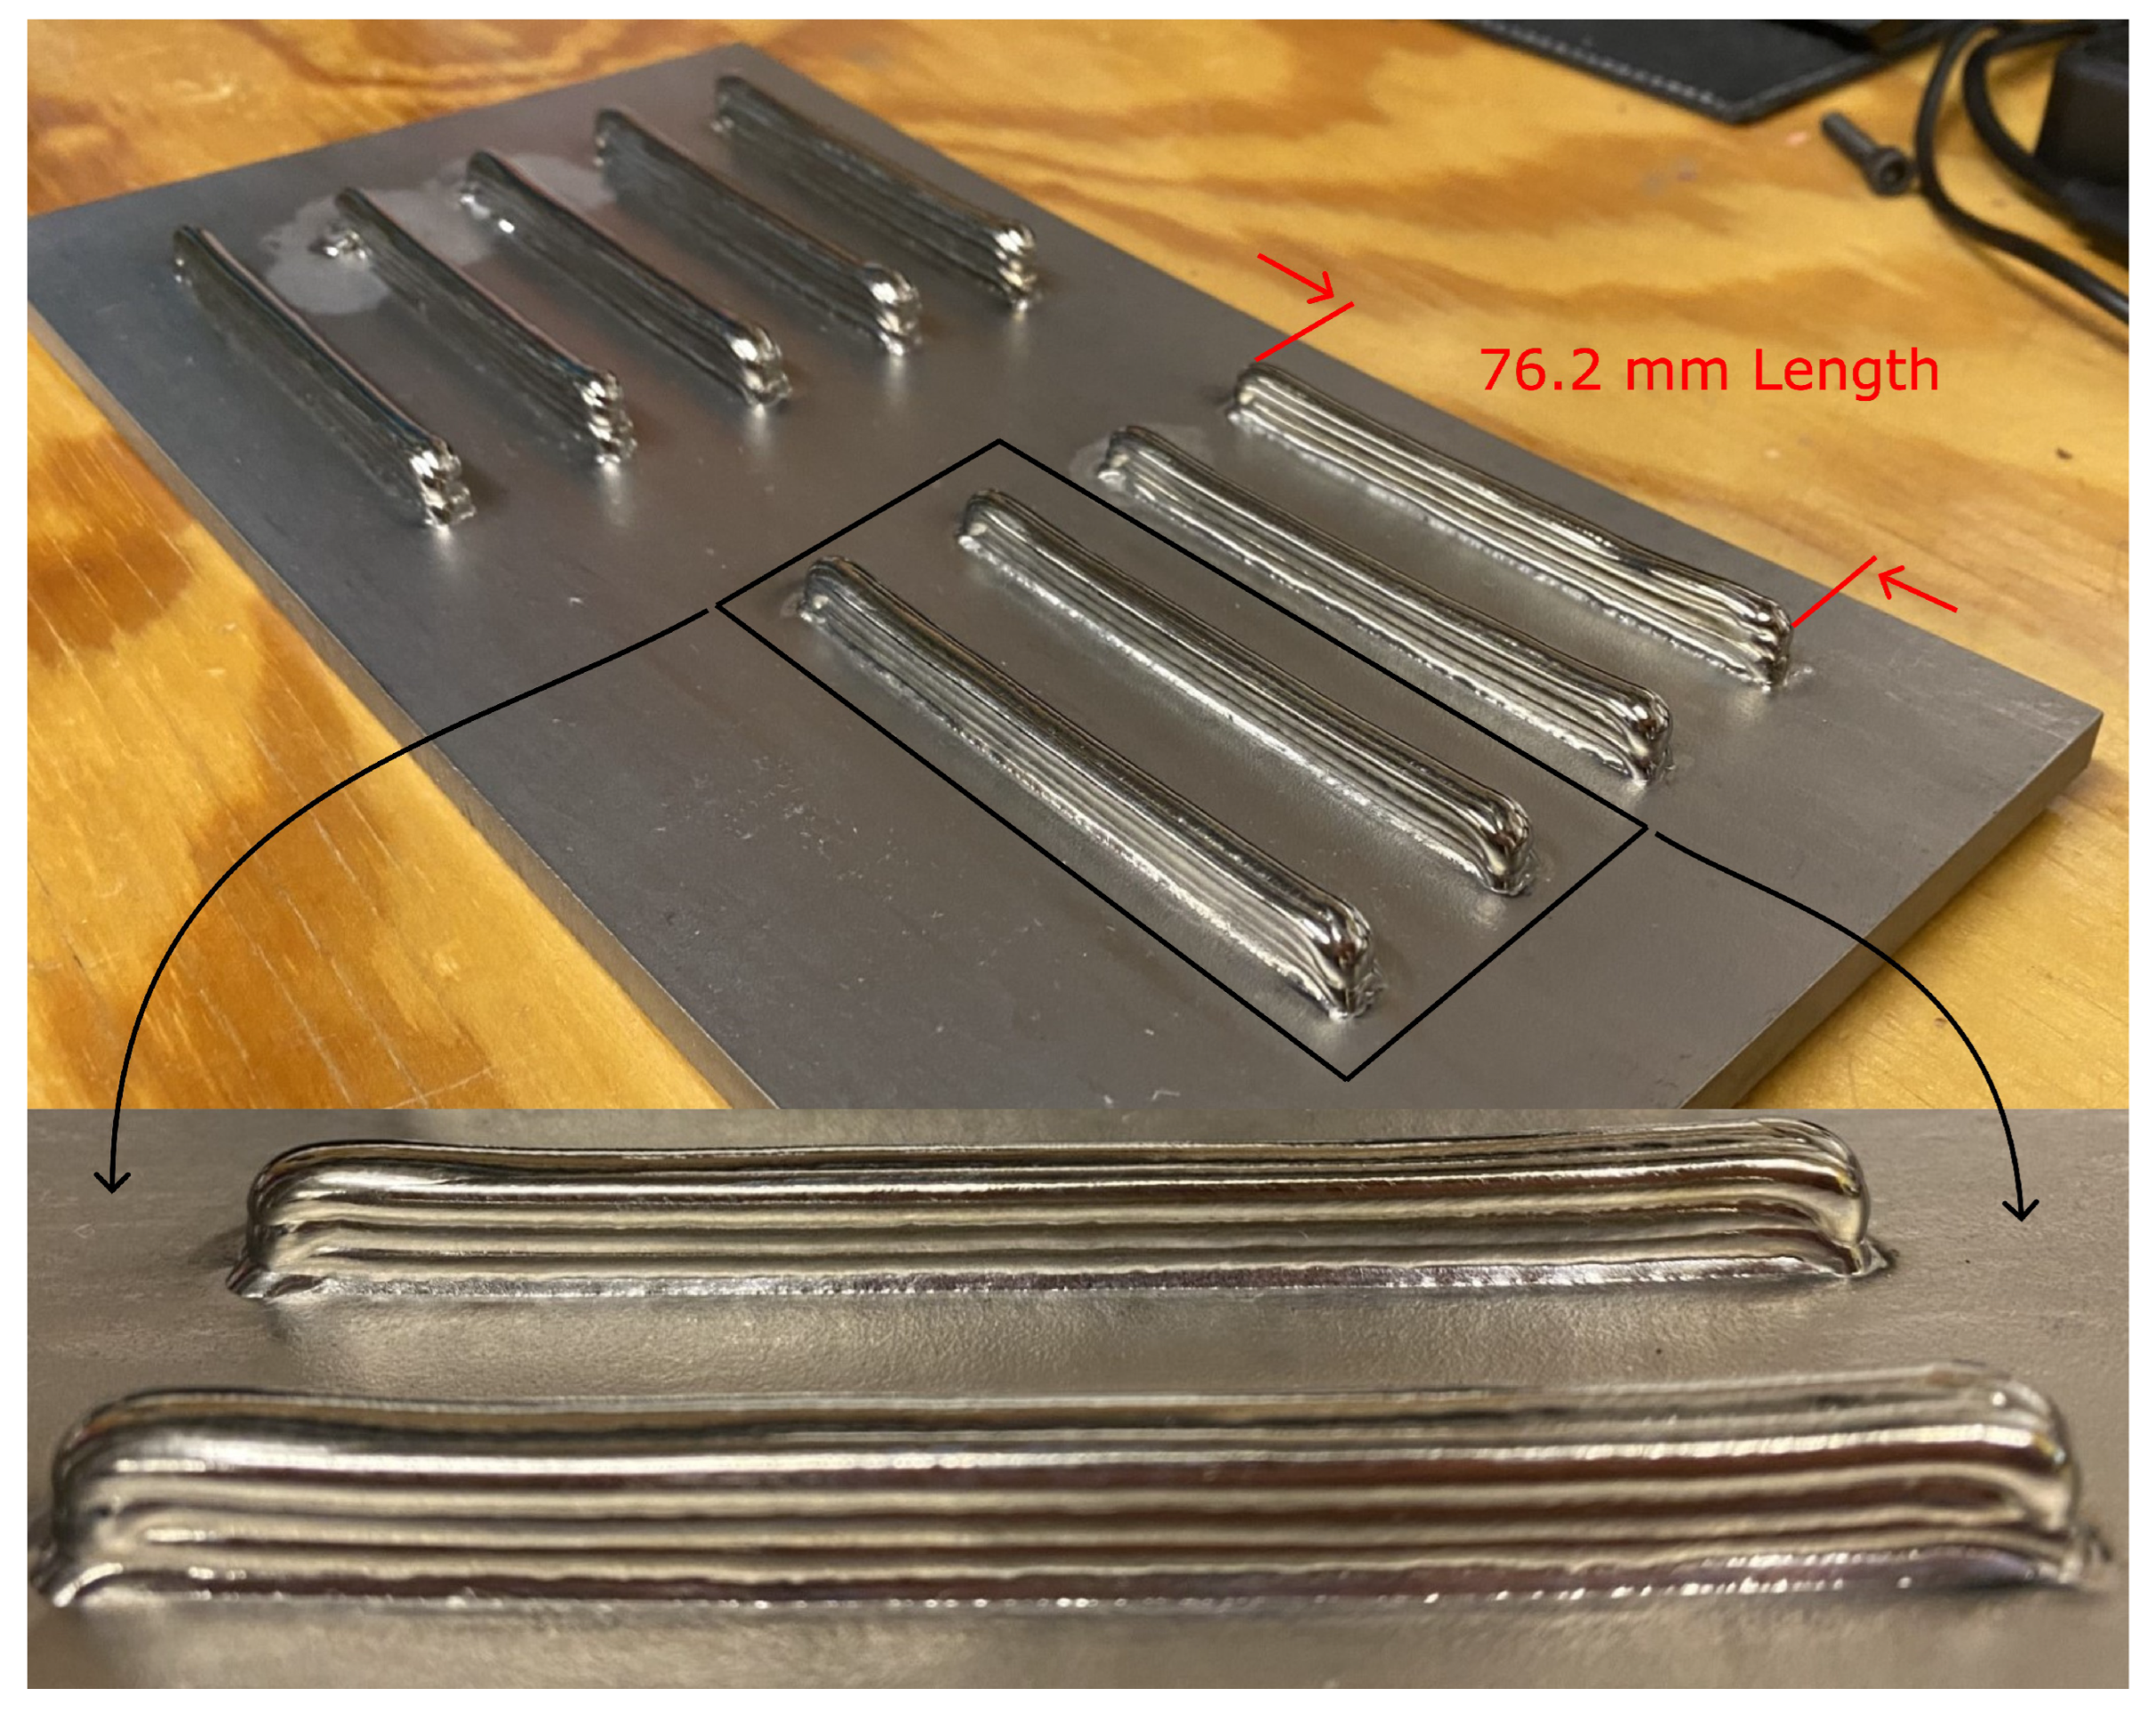
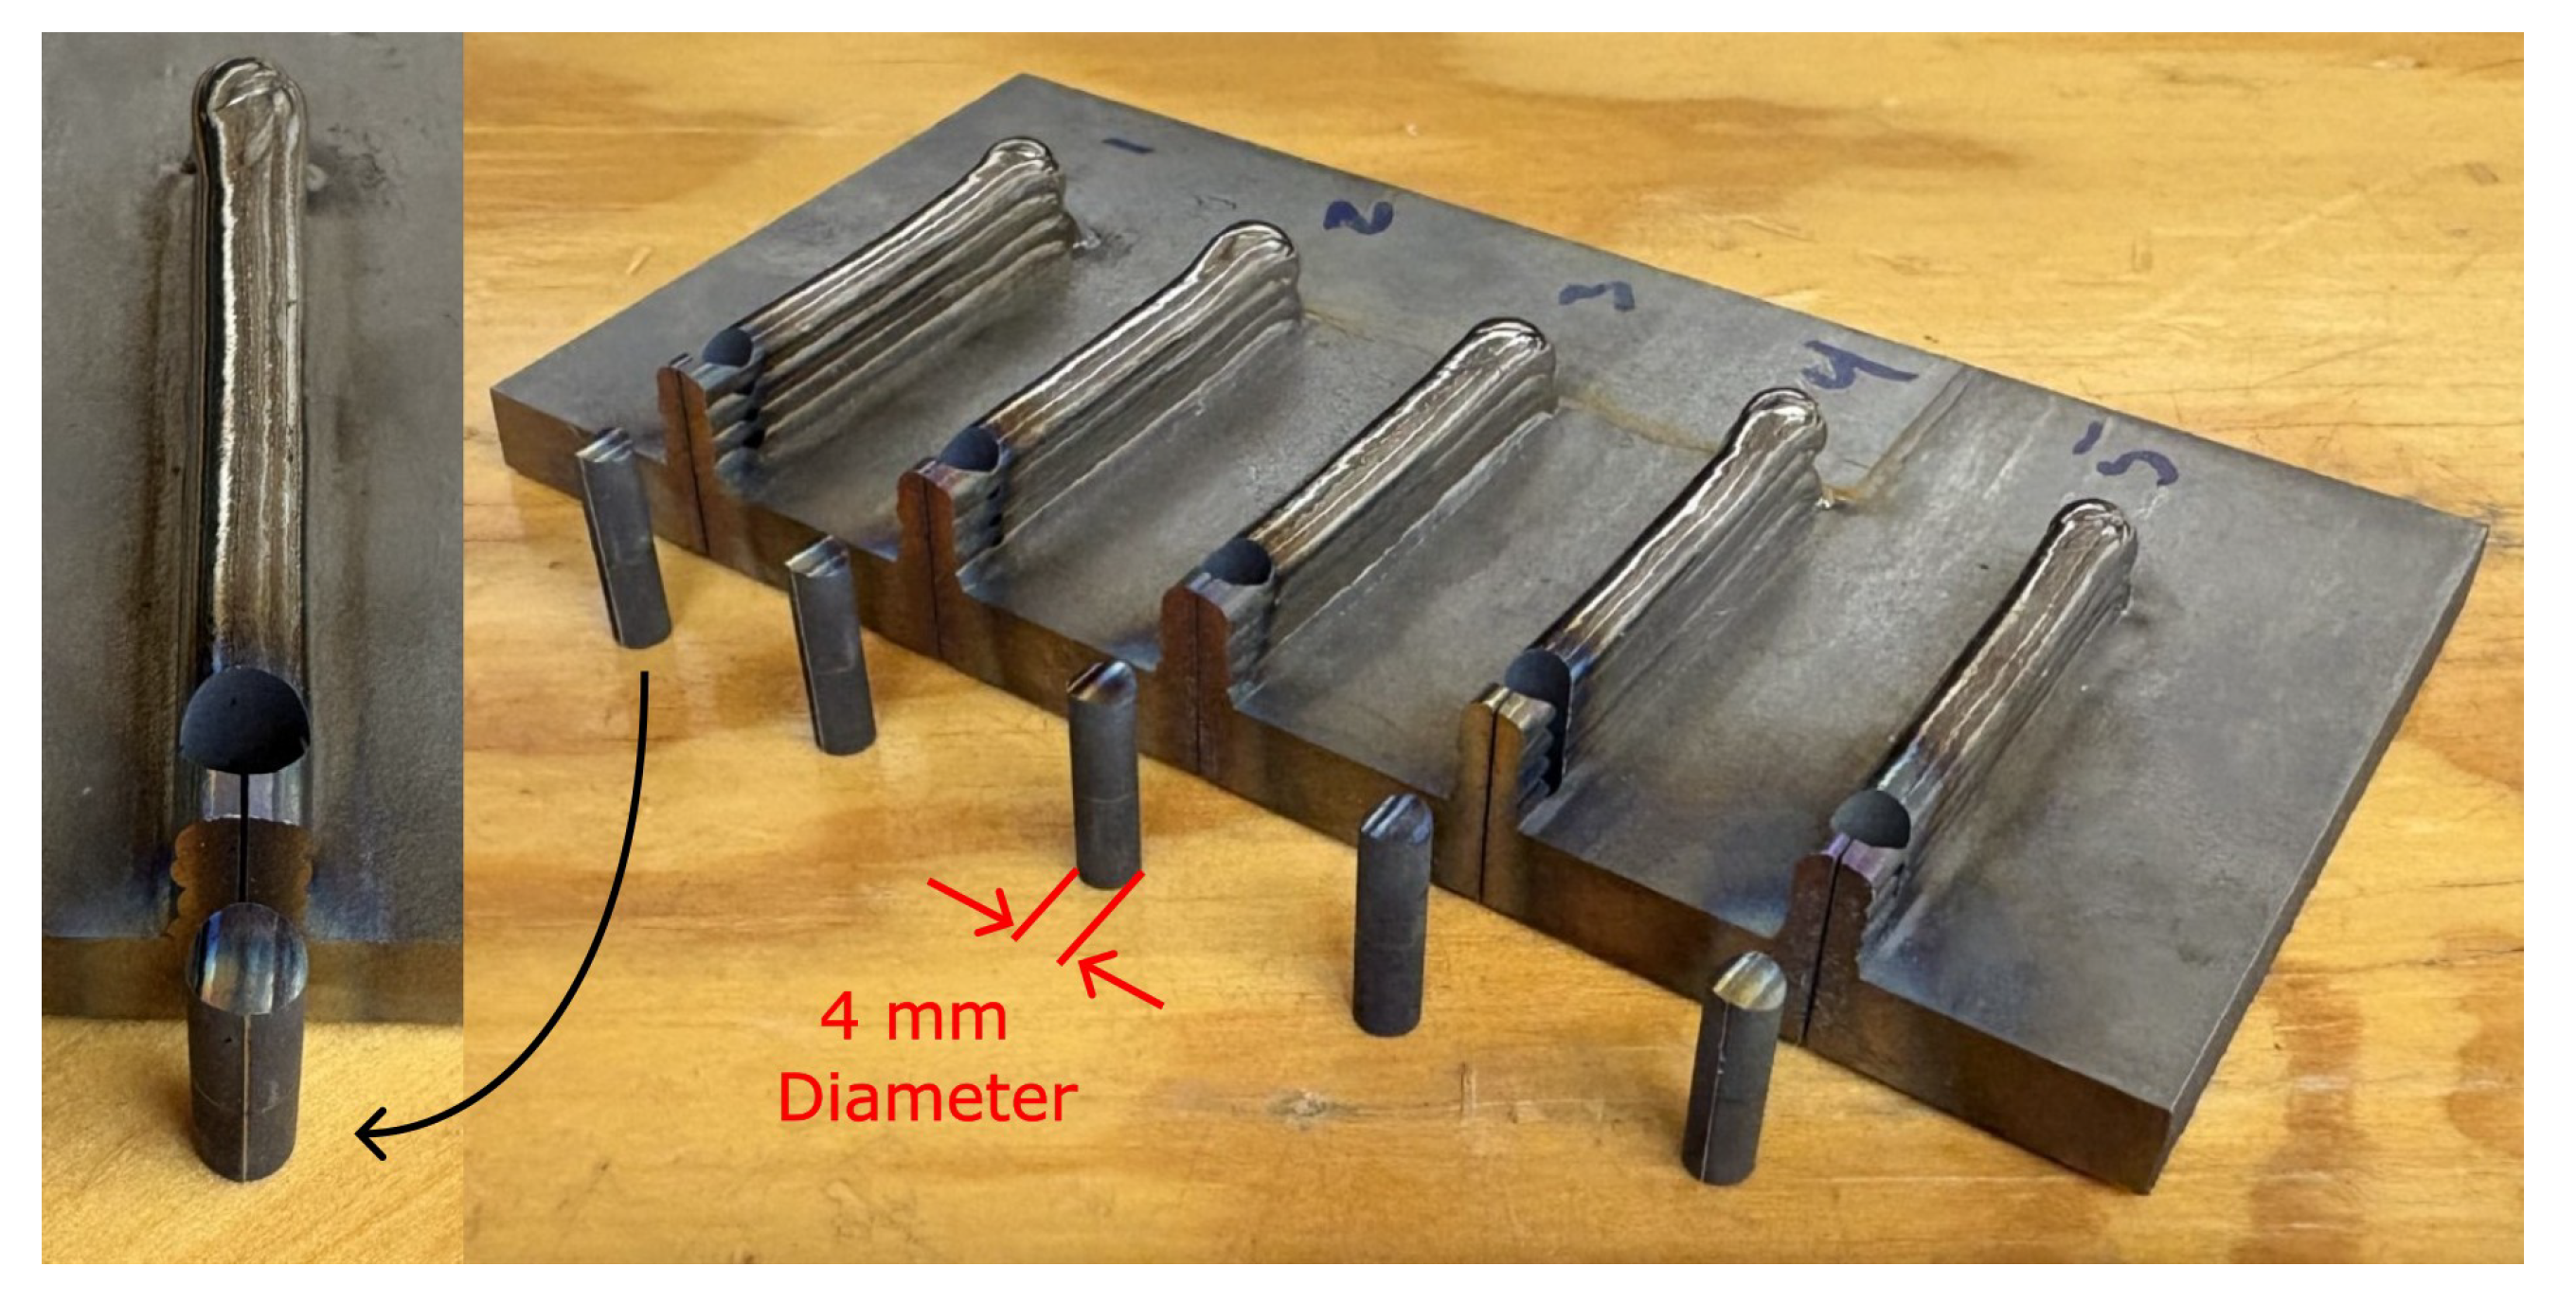
2.3. Experimental Procedure
3. Results
4. Discussion
5. Conclusions
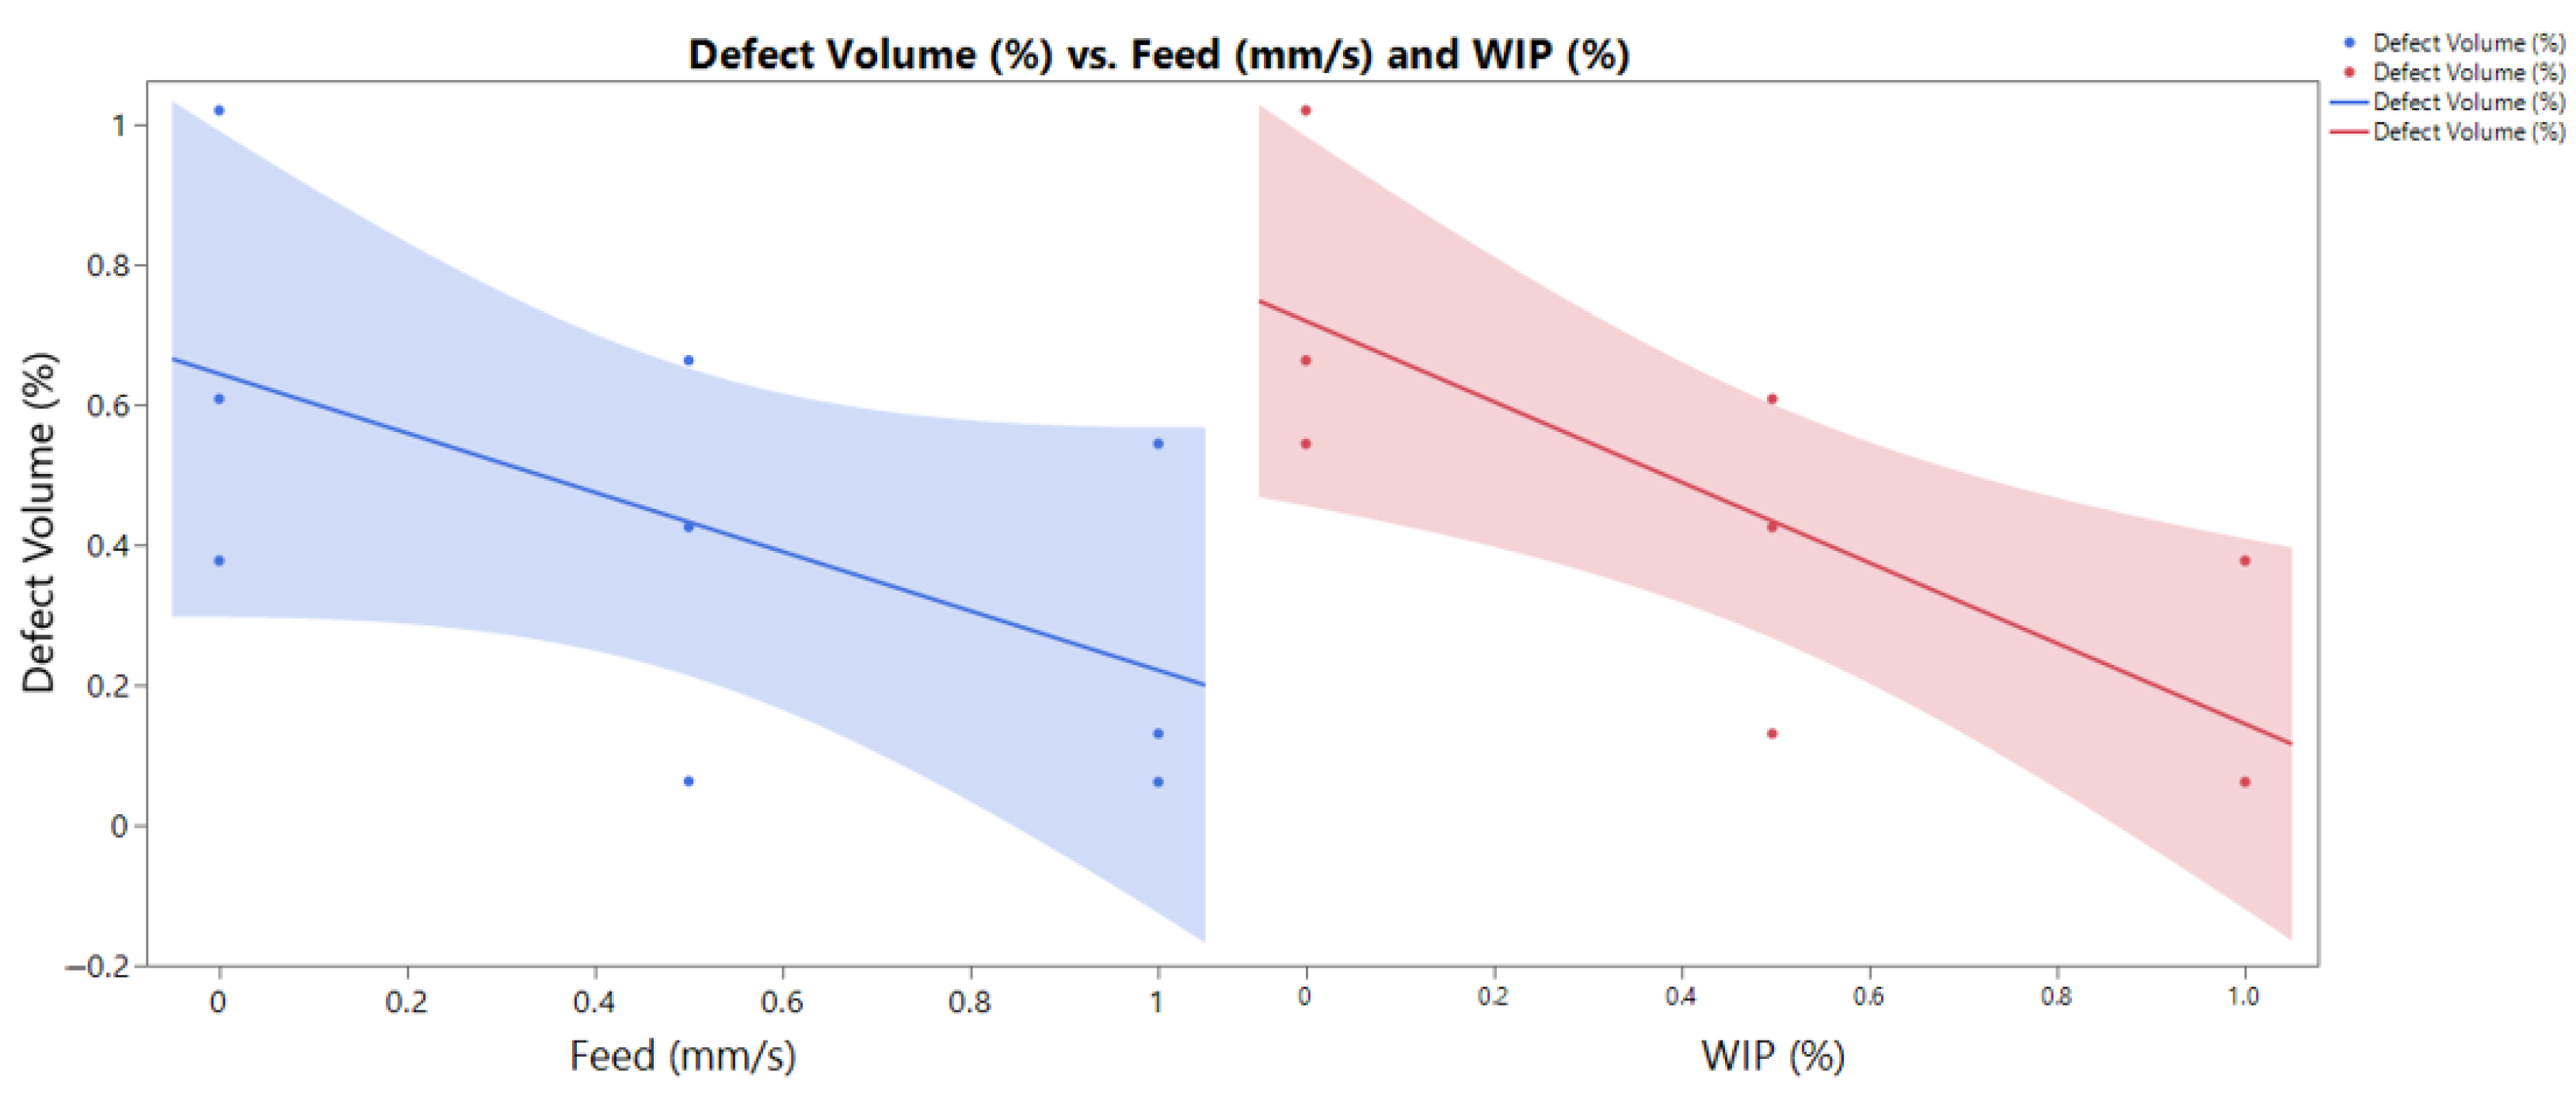
- Over the experimental settings, the traverse feed rate and WIP were found to have a linear effect on the resulting defect rate in the deposited material. The volume of internal defects decreases with an increasing traverse feed rate and WIP. Across the experimental levels, the defect volume percentage was reduced from 1.021% to 0.062%.
- To achieve a further reduction in defect volume or eliminate defects entirely, the traverse feed rate and WIP can be increased beyond the experimental levels or the wire feed speed can be reduced. These adjustments aim to increase the aspect ratio of the deposited bead but come at the expense of increased necessary laser power and/or a reduced deposition rate.
- The micro-CT technology provides a very useful and high-resolution view of the internal structure of a deposit. Though the technology is limited in its maximum sample size, it can be used to detect extremely small voids.
Author Contributions
Funding
Institutional Review Board Statement
Informed Consent Statement
Data Availability Statement
Conflicts of Interest
Abbreviations
| AM | additive manufacturing |
| DED | directed energy deposition |
| LP | laser power |
| Ti64 | Ti-6Al-4V |
| TC | treatment combination |
| WFS | wire feed speed |
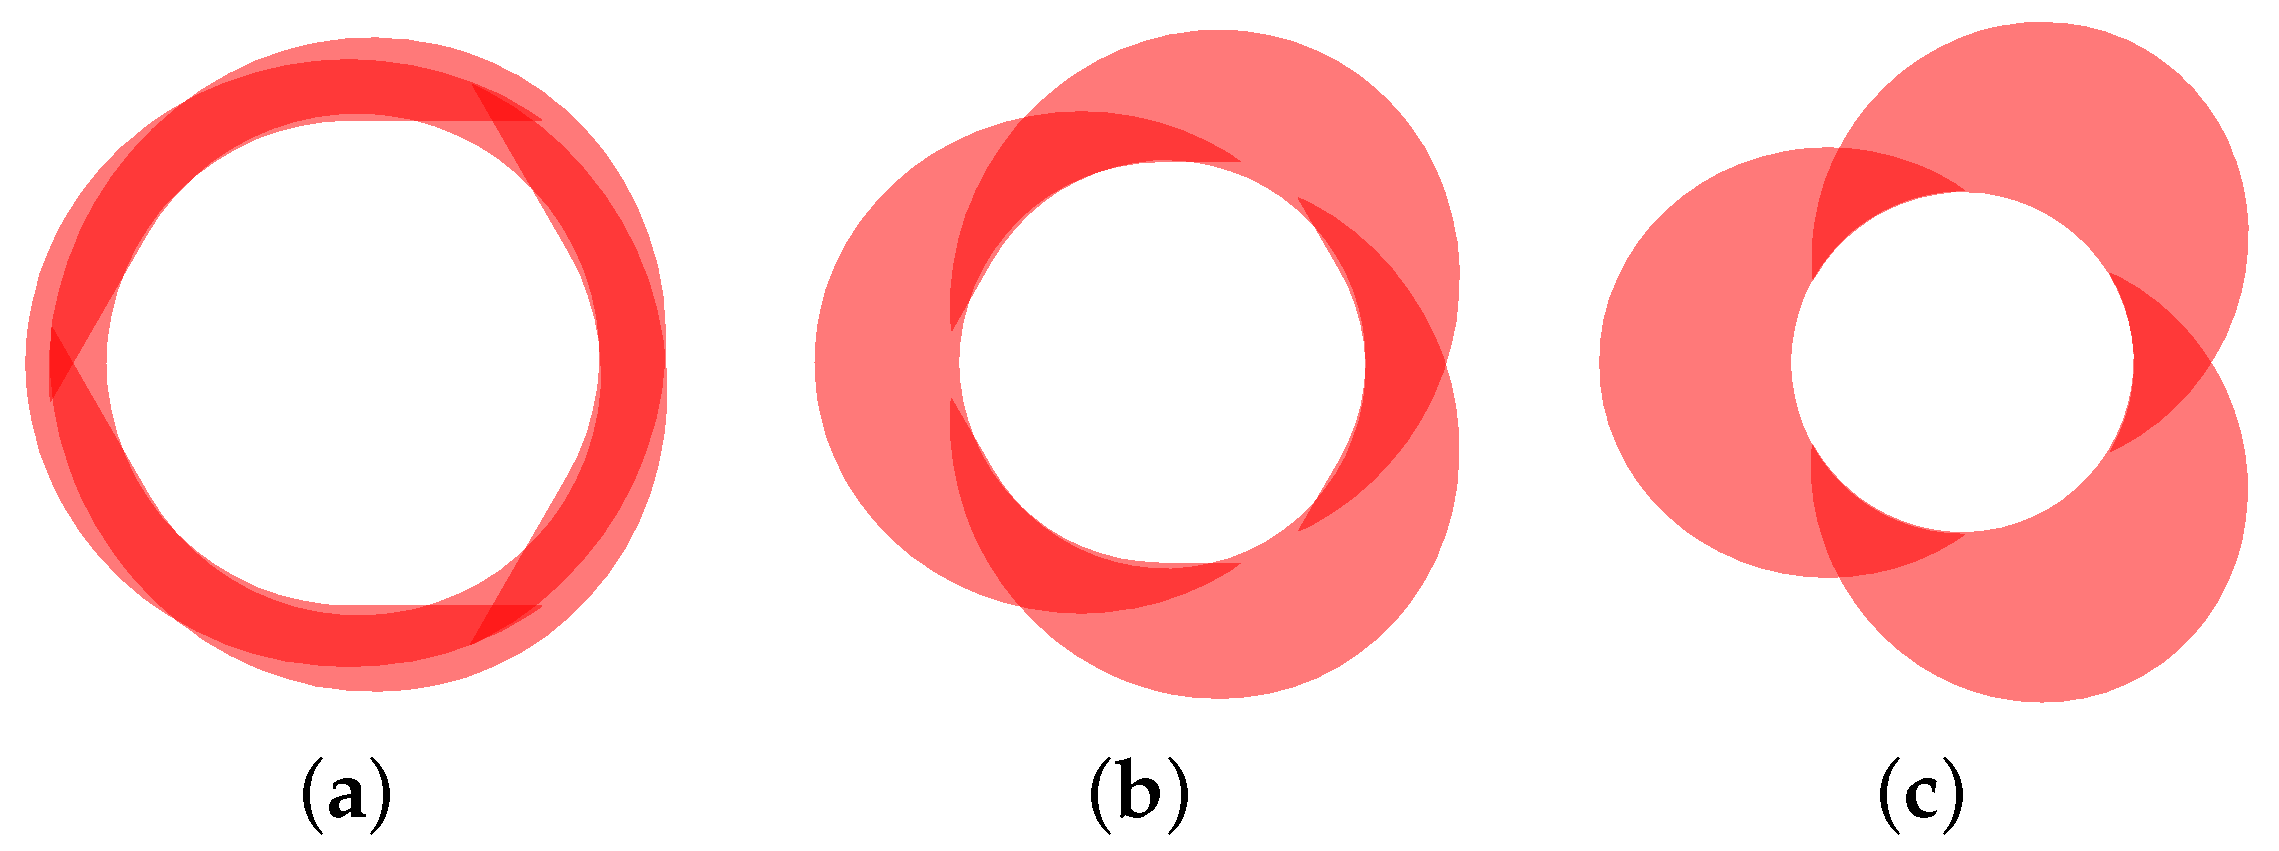
| WIP | workpiece illumination proportion |
References
- Thompson, S.M.; Bian, L.; Shamsaei, N.; Yadollahi, A. An overview of Direct Laser Deposition for additive manufacturing; Part I: Transport phenomena, modeling and diagnostics. Addit. Manuf. 2015, 8, 36–62. [Google Scholar] [CrossRef]
- Abdulrahman, K.O.; Akinlabi, E.T.; Mahamood, R.M. Laser metal deposition technique: Sustainability and environmental impact. Procedia Manuf. 2018, 21, 109–116. [Google Scholar] [CrossRef]
- GKN Aerospace. GKN Aerospace Expands RRSP Contract with Pratt & Whitney and Injects New Additive Manufacturing and Composite Technologies in Key Components. 2019. Available online: https://www.gknaerospace.com/news-insights/news/gkn-aerospace-expands-rrsp-contract-with-pratt-whitney-and-injects-new-additive-manufacturing-and-composite-technologies-in-key-components/ (accessed on 9 April 2025).
- GKN Aerospace. GKN Aerospace and Northrop Grumman Achieve Additive Manufacturing Milestone. 2022. Available online: https://www.gknaerospace.com/news-insights/news/gkn-aerospace-northrop-grumman-collaboration-achieves-additive-manufacturing-milestone/ (accessed on 9 April 2025).
- GKN Aerospace. GKN Aerospace Engine Systems’ Journey to Introduce Additive Manufacturing. 2018. Available online: https://www.gknaerospace.com/news-insights/news/gkn-aerospace-engine-systems-journey-to-introduce-additive-manufacturing/ (accessed on 9 April 2025).
- Ding, D.; Pan, Z.; Cuiuri, D.; Li, H. Wire-feed additive manufacturing of metal components: Technologies, developments and future interests. Int. J. Adv. Manuf. Technol. 2015, 81, 465–481. [Google Scholar] [CrossRef]
- Kisielewicz, A.; Thalavai Pandian, K.; Sthen, D.; Hagqvist, P.; Valiente Bermejo, M.A.; Sikström, F.; Ancona, A. Hot-Wire Laser-Directed Energy Deposition: Process Characteristics and Benefits of Resistive Pre-Heating of the Feedstock Wire. Metals 2021, 11, 634. [Google Scholar] [CrossRef]
- DebRoy, T.; Wei, H.; Zuback, J.; Mukherjee, T.; Elmer, J.; Milewski, J.; Beese, A.; Wilson-Heid, A.; De, A.; Zhang, W. Additive manufacturing of metallic components–Process, structure and properties. Prog. Mater. Sci. 2018, 92, 112–224. [Google Scholar] [CrossRef]
- Simpson, T.W. Additive Manufacturing with Wire: This system has the benefits of cheaper cost and easier handling. But there can be some drawbacks as well. Mod. Mach. Shop 2019, 91, 38–40. [Google Scholar]
- Xu, S.; Lei, D.; Yang, X.; Lu, X.; Chen, J.; Li, M.V. Wire arc additive manufacturing of components using TiC/Ti reinforced Al-Zn-Mg-Cu alloy wire: Microstructure evolution, strengthening mechanism, and fracture behavior. Mater. Charact. 2024, 217, 114452. [Google Scholar] [CrossRef]
- Ocylok, S.; Leichnitz, R.; Thieme, S.; Schmidt, M. Investigations on Laser Metal Deposition of Stainless Steel 316L with Coaxial Wire Feeding. In Proceedings of the Laser Assisted Net Shape Engineering 9 (LANE 2016), Fürth, Germany, 19–22 September 2016; pp. 1158–1163. [Google Scholar]
- Mathenia, R.; McLain, B.; Sparks, T.; Liou, F. A Study of Directionality Effects in Three-Beam Coaxial Titanium Wire-Based Laser Metal Deposition. Materials 2024, 17, 3201. [Google Scholar] [CrossRef]
- Kuznetsov, A.; Jeromen, A.; Levy, G.; Fujishima, M.; Govekar, E. Annular Laser Beam Cladding Process Feasibility Study. Phys. Procedia 2016, 83, 647–656. [Google Scholar] [CrossRef]
- Zapata, A.; Bernauer, C.; Stadter, C.; Kolb, C.G.; Zaeh, M.F. Investigation on the Cause-Effect Relationships between the Process Parameters and the Resulting Geometric Properties for Wire-Based Coaxial Laser Metal Deposition. Metals 2022, 12, 455. [Google Scholar] [CrossRef]
- Chen, Y.; Chen, X.; Jiang, M.; Lei, Z.; Wang, Z.; Liang, J.; Wu, S.; Ma, S.; Jiang, N.; Chen, Y. Coaxial laser metal wire deposition of Ti6Al4V alloy: Process, microstructure and mechanical properties. J. Mater. Res. Technol. 2022, 20, 2578–2590. [Google Scholar] [CrossRef]
- Wang, Y.K.; Shi, S.H.; Fu, G.Y.; Li, C.S. Research on the Key Process Parameters in Direct Laser Deposition Using Coaxial Inside-Beam Wire Feeding. Appl. Mech. Mater. 2011, 43, 401–404. [Google Scholar] [CrossRef]
- Kotar, M.; Govekar, E. The influence of the workpiece illumination proportion in annular laser beam wire deposition process. Procedia CIRP 2018, 74, 228–232. [Google Scholar] [CrossRef]
- Mathenia, R.; Flood, A.; McLain, B.; Sparks, T.; Liou, F. Effects of Laser Defocusing on Bead Geometry in Coaxial Titanium Wire-Based Laser Metal Deposition. Materials 2024, 17, 889. [Google Scholar] [CrossRef]
- Wire-Based Laser Metal Deposition (LMD-w). Available online: https://www.ipt.fraunhofer.de/en/technologies/additive-manufacturing/wire-based-laser-metal-deposition.html (accessed on 21 December 2023).
- Govekar, E.; Jeromen, A.; Kuznetsov, A.; Kotar, M.; Kondo, M. Annular laser beam based direct metal deposition. Procedia CIRP 2018, 74, 222–227. [Google Scholar] [CrossRef]
- Kotar, M.; Fujishima, M.; Levy, G.; Govekar, E. Initial transient phase and stability of annular laser beam direct wire deposition. CIRP Ann. 2019, 68, 233–236. [Google Scholar] [CrossRef]
- Kotar, M.; Fujishima, M.; Levy, G.N.; Govekar, E. Advances in the understanding of the annular laser beam wire cladding process. J. Mater. Process. Technol. 2021, 294, 117105. [Google Scholar] [CrossRef]
- Motta, M.; Demir, A.G.; Previtali, B. High-speed imaging and process characterization of coaxial laser metal wire deposition. Addit. Manuf. 2018, 22, 497–507. [Google Scholar] [CrossRef]
- Ji, S.; Liu, F.; Shi, T.; Fu, G.; Shi, S. Effects of Defocus Distance on Three-Beam Laser Internal Coaxial Wire Cladding. Chin. J. Mech. Eng. 2021, 34, 45. [Google Scholar] [CrossRef]
- Polamuri, S.K.; Chitral, S.; Adapa, M.K.; Nayak, A.; Kiran, D.V. A strategic approach to minimize lack of fusion defects in wire arc additive manufacturing. Prog. Addit. Manuf. 2025, 1–16. [Google Scholar] [CrossRef]
- Suwannatee, N.; Yamamoto, M.; Shinohara, S. Optimization of hot-wire fraction for enhance quality in GMAW. Weld. World 2023, 68, 1017–1032. [Google Scholar] [CrossRef]
- Emminghaus, N.; Paul, J.; Hoff, C.; Hermsdorf, J.; Kaierle, S. Development of an empirical process model for adjusted porosity in laser-based powder bed fusion of Ti-6Al-4V. Int. J. Adv. Manuf. Technol. 2022, 118, 1239–1254. [Google Scholar] [CrossRef]
- Bernauer, C.; Merk, T.; Zapata, A.; Zaeh, M. Laser Metal Deposition with Coaxial Wire Feeding for the Automated and Reliable Build-Up of Solid Metal Parts. Key Eng. Mater. 2022, 926, 65–79. [Google Scholar] [CrossRef]
- Furton, E.T.; Beese, A.M. Ductile fracture model describing the impact of internal pores: Model development and validation for additively manufactured Ti-6Al-4V. Addit. Manuf. 2025, 102, 104722. [Google Scholar] [CrossRef]
- Sai Deepak Kumar, A.; Pattanayak, D.K.; Fayaz Anwar, M.; Rajendran, A.; Vanitha, C. The Effect of Porosity, Oxygen and Phase Morphology on the Mechanical Properties of Selective Laser Melted Ti-6Al-4V with Respect to Annealing Temperature. Trans. Indian Inst. Met. 2023, 76, 1789–1798. [Google Scholar] [CrossRef]
- Shakhverdova, I.; Nowotny, S.; Thieme, S.; Kubisch, F.; Beyer, E.; Leyens, C. Coaxial Laser Wire Deposition. J. Phys. Conf. Ser. 2018, 1109, 012026. [Google Scholar] [CrossRef]
- Zhang, Y.; Liu, L.; Zhang, Z.; Qu, Z.; Liu, R.; Zhou, G.; Chen, L.; Zhang, Z. Effects of artificial embedded defect size and position on the fatigue lives of additive manufacturing Ti–6Al–4V alloy. Mater. Sci. Eng. A 2024, 909, 146863. [Google Scholar] [CrossRef]
- Kobryn, P.; Semiatin, S. Mechanical Properties of Laser-Deposited Ti-6Al-4V. Solid Freeform Fabrication Proceedings. 2001. Available online: https://utw10945.utweb.utexas.edu/Manuscripts/2001/2001-21-Kobryn.pdf (accessed on 9 April 2025).
- Harkin, R.; Wu, H.; Nikam, S.; Yin, S.; Lupoi, R.; Walls, P.; McKay, W.; McFadden, S. Evaluation of the role of hatch-spacing variation in a lack-of-fusion defect prediction criterion for laser-based powder bed fusion processes. Int. J. Adv. Manuf. Technol. 2023, 126, 659–673. [Google Scholar] [CrossRef]


| TC Label | Run Order | Aspect Ratio | Feed (mm/s) | WFS (mm/s) | WIP (%) | LP (W) | Pitch (mm) | Height (mm) |
|---|---|---|---|---|---|---|---|---|
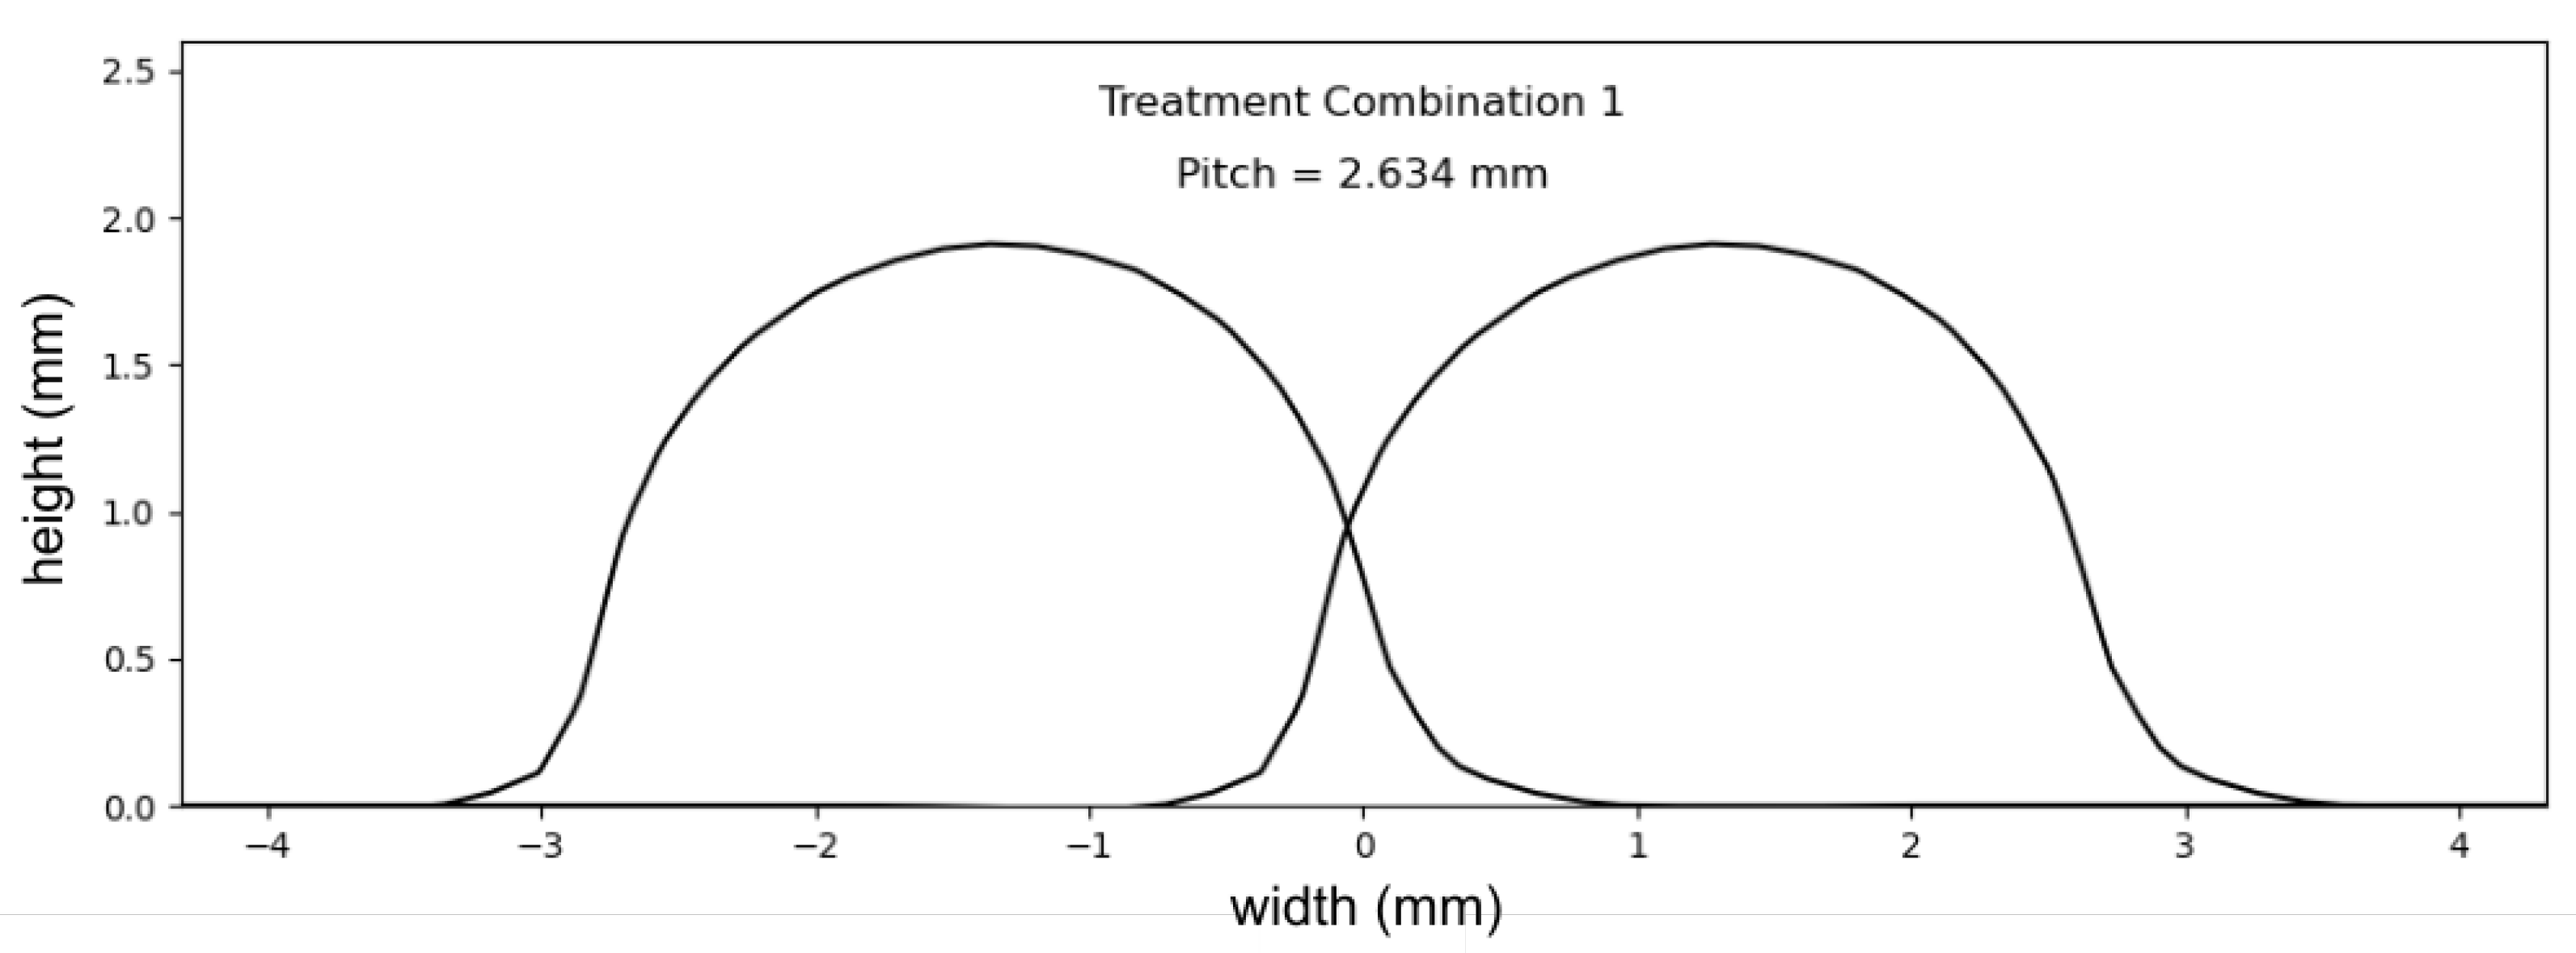
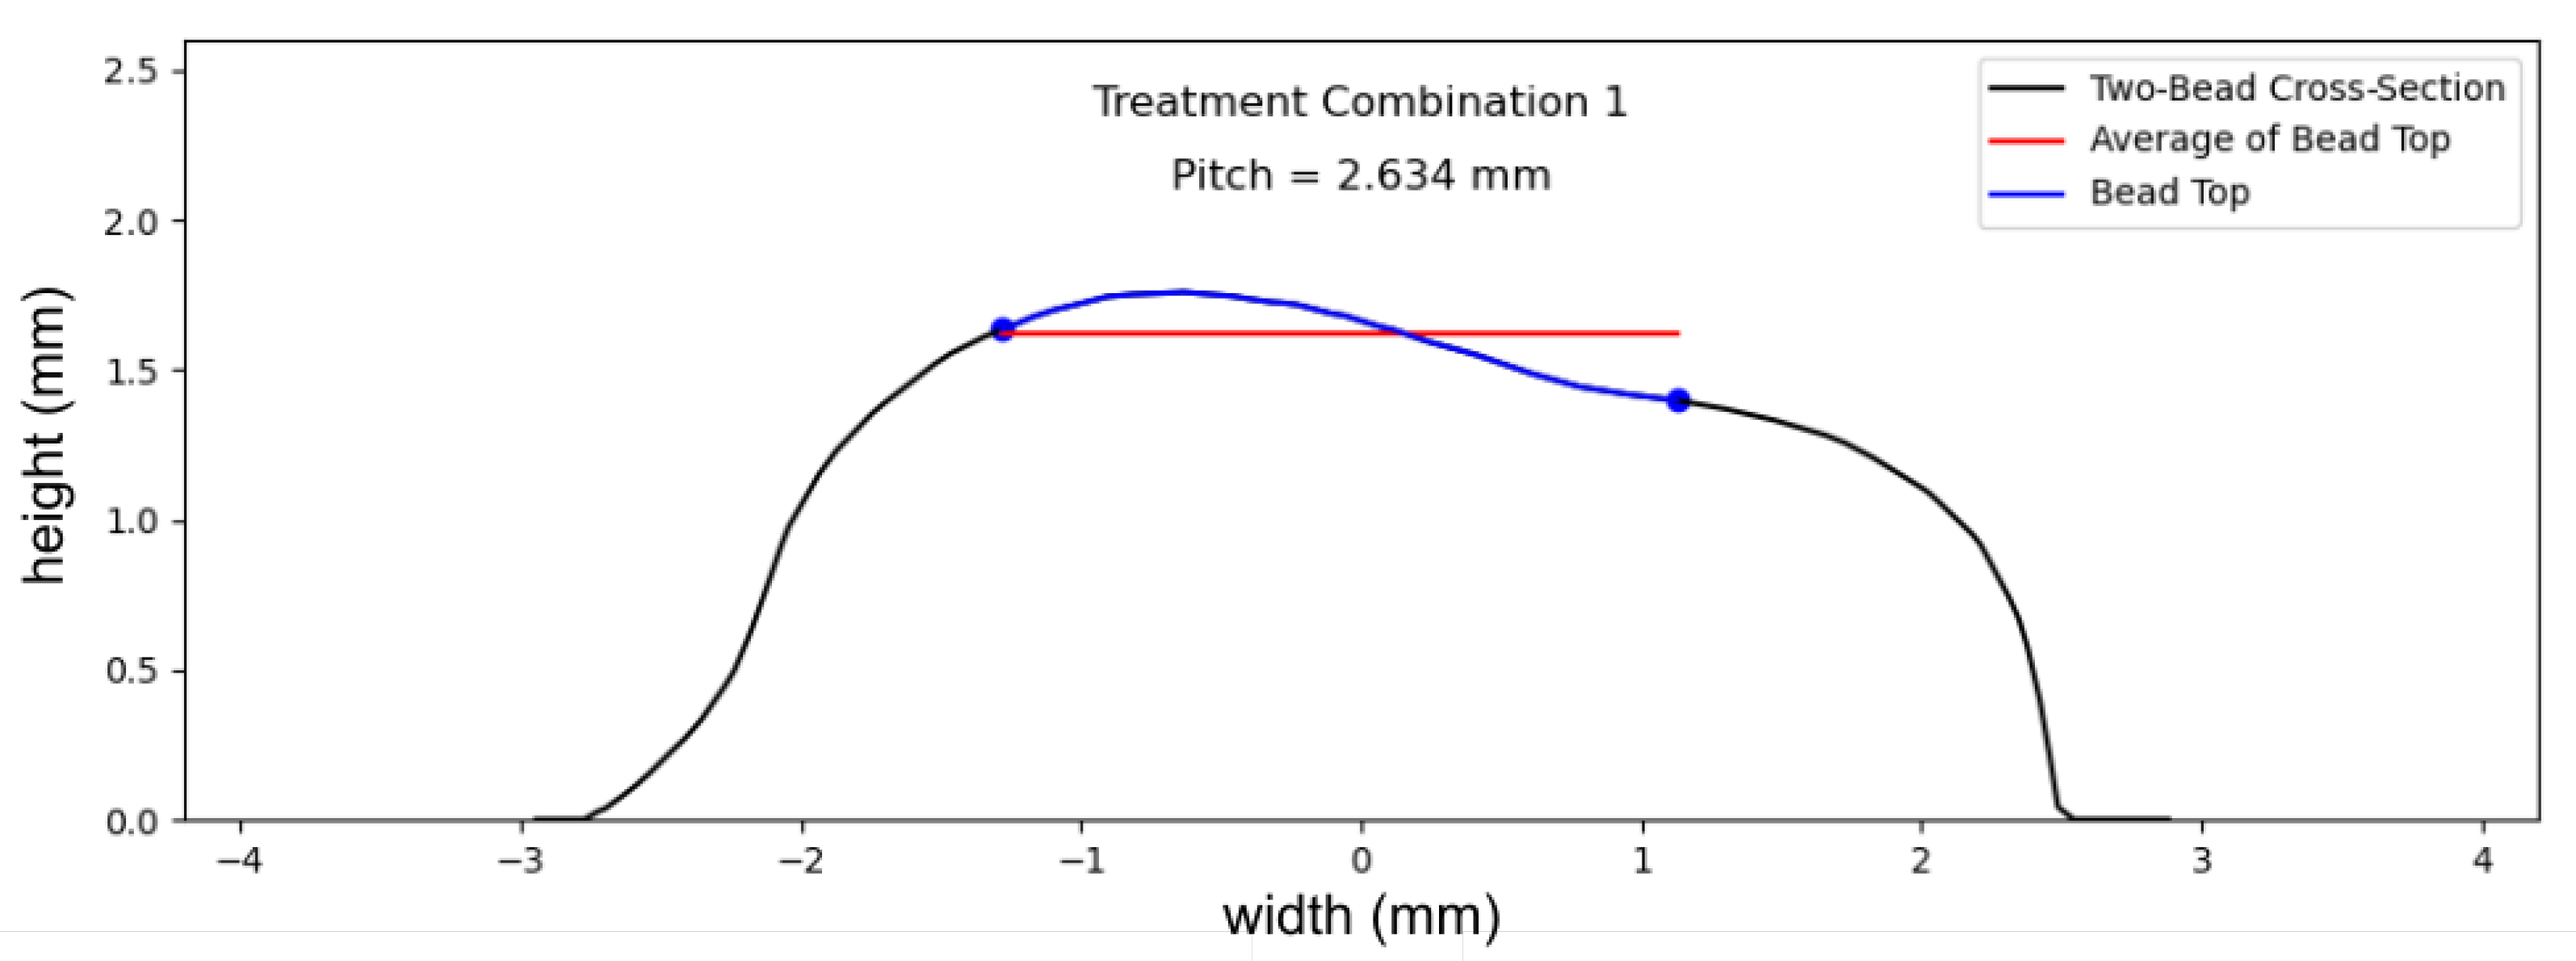
| 1 | 4 | 1.976 | 10.58 | 46.57 | 25.2 | 1324 | 2.634 | 1.972 |
| 2 | 9 | 2.254 | 10.58 | 46.57 | 40.0 | 1650 | 2.729 | 1.909 |
| 3 | 5 | 2.606 | 10.58 | 46.57 | 55.0 | 2200 | 2.912 | 1.758 |
| 4 | 2 | 2.132 | 12.28 | 46.57 | 25.2 | 1324 | 2.336 | 1.861 |
| 5 | 7 | 2.648 | 12.28 | 46.57 | 40.0 | 1650 | 2.547 | 1.758 |
| 6 | 1 | 2.826 | 12.28 | 46.57 | 55.0 | 2200 | 2.714 | 1.645 |
| 7 | 8 | 2.160 | 13.97 | 46.57 | 25.2 | 1324 | 2.200 | 1.745 |
| 8 | 6 | 2.519 | 13.97 | 46.57 | 40.0 | 1650 | 2.448 | 1.634 |
| 9 | 3 | 2.794 | 13.97 | 46.57 | 55.0 | 2200 | 2.639 | 1.472 |
| TC Label | Defect Count | Defect Volume (mm3) | Sample Volume (mm3) | Defect Volume (% of Sample) |
|---|---|---|---|---|
| 1 | 4 | 0.949 | 92.928 | 1.021 |
| 2 | 4 | 0.548 | 89.960 | 0.609 |
| 3 | 4 | 0.313 | 82.844 | 0.378 |
| 4 | 4 | 0.582 | 87.698 | 0.664 |
| 5 | 4 | 0.353 | 82.844 | 0.426 |
| 6 | 11 | 0.049 | 77.519 | 0.063 |
| 7 | 4 | 0.448 | 82.231 | 0.545 |
| 8 | 6 | 0.101 | 77.000 | 0.131 |
| 9 | 12 | 0.043 | 69.366 | 0.062 |
| Term | Estimate | Std Error | t Ratio | Prob > |t| |
|---|---|---|---|---|
| Intercept | 0.9319 | 0.0584 | 15.97 | <0.0001 |
| Feed | −0.4233 | 0.0715 | −5.92 | 0.0010 |
| WIP | −0.5754 | 0.0715 | −8.04 | 0.0002 |
Disclaimer/Publisher’s Note: The statements, opinions and data contained in all publications are solely those of the individual author(s) and contributor(s) and not of MDPI and/or the editor(s). MDPI and/or the editor(s) disclaim responsibility for any injury to people or property resulting from any ideas, methods, instructions or products referred to in the content. |
© 2025 by the authors. Licensee MDPI, Basel, Switzerland. This article is an open access article distributed under the terms and conditions of the Creative Commons Attribution (CC BY) license (https://creativecommons.org/licenses/by/4.0/).
Share and Cite
Mathenia, R.; McLain, B.; Sparks, T.; Liou, F. Experimental Study of Process Parameter Effects on Internal Defects in Titanium Coaxial Wire-Based Laser Metal Deposition. Metals 2025, 15, 499. https://doi.org/10.3390/met15050499
Mathenia R, McLain B, Sparks T, Liou F. Experimental Study of Process Parameter Effects on Internal Defects in Titanium Coaxial Wire-Based Laser Metal Deposition. Metals. 2025; 15(5):499. https://doi.org/10.3390/met15050499
Chicago/Turabian StyleMathenia, Remy, Braden McLain, Todd Sparks, and Frank Liou. 2025. "Experimental Study of Process Parameter Effects on Internal Defects in Titanium Coaxial Wire-Based Laser Metal Deposition" Metals 15, no. 5: 499. https://doi.org/10.3390/met15050499
APA StyleMathenia, R., McLain, B., Sparks, T., & Liou, F. (2025). Experimental Study of Process Parameter Effects on Internal Defects in Titanium Coaxial Wire-Based Laser Metal Deposition. Metals, 15(5), 499. https://doi.org/10.3390/met15050499