
Process Studies on the W-C-Ti System Using a High-Throughput Laser-Based Additive Manufacturing Approach

 , , , , and
Abstract
1. Introduction
2. Materials and Methods
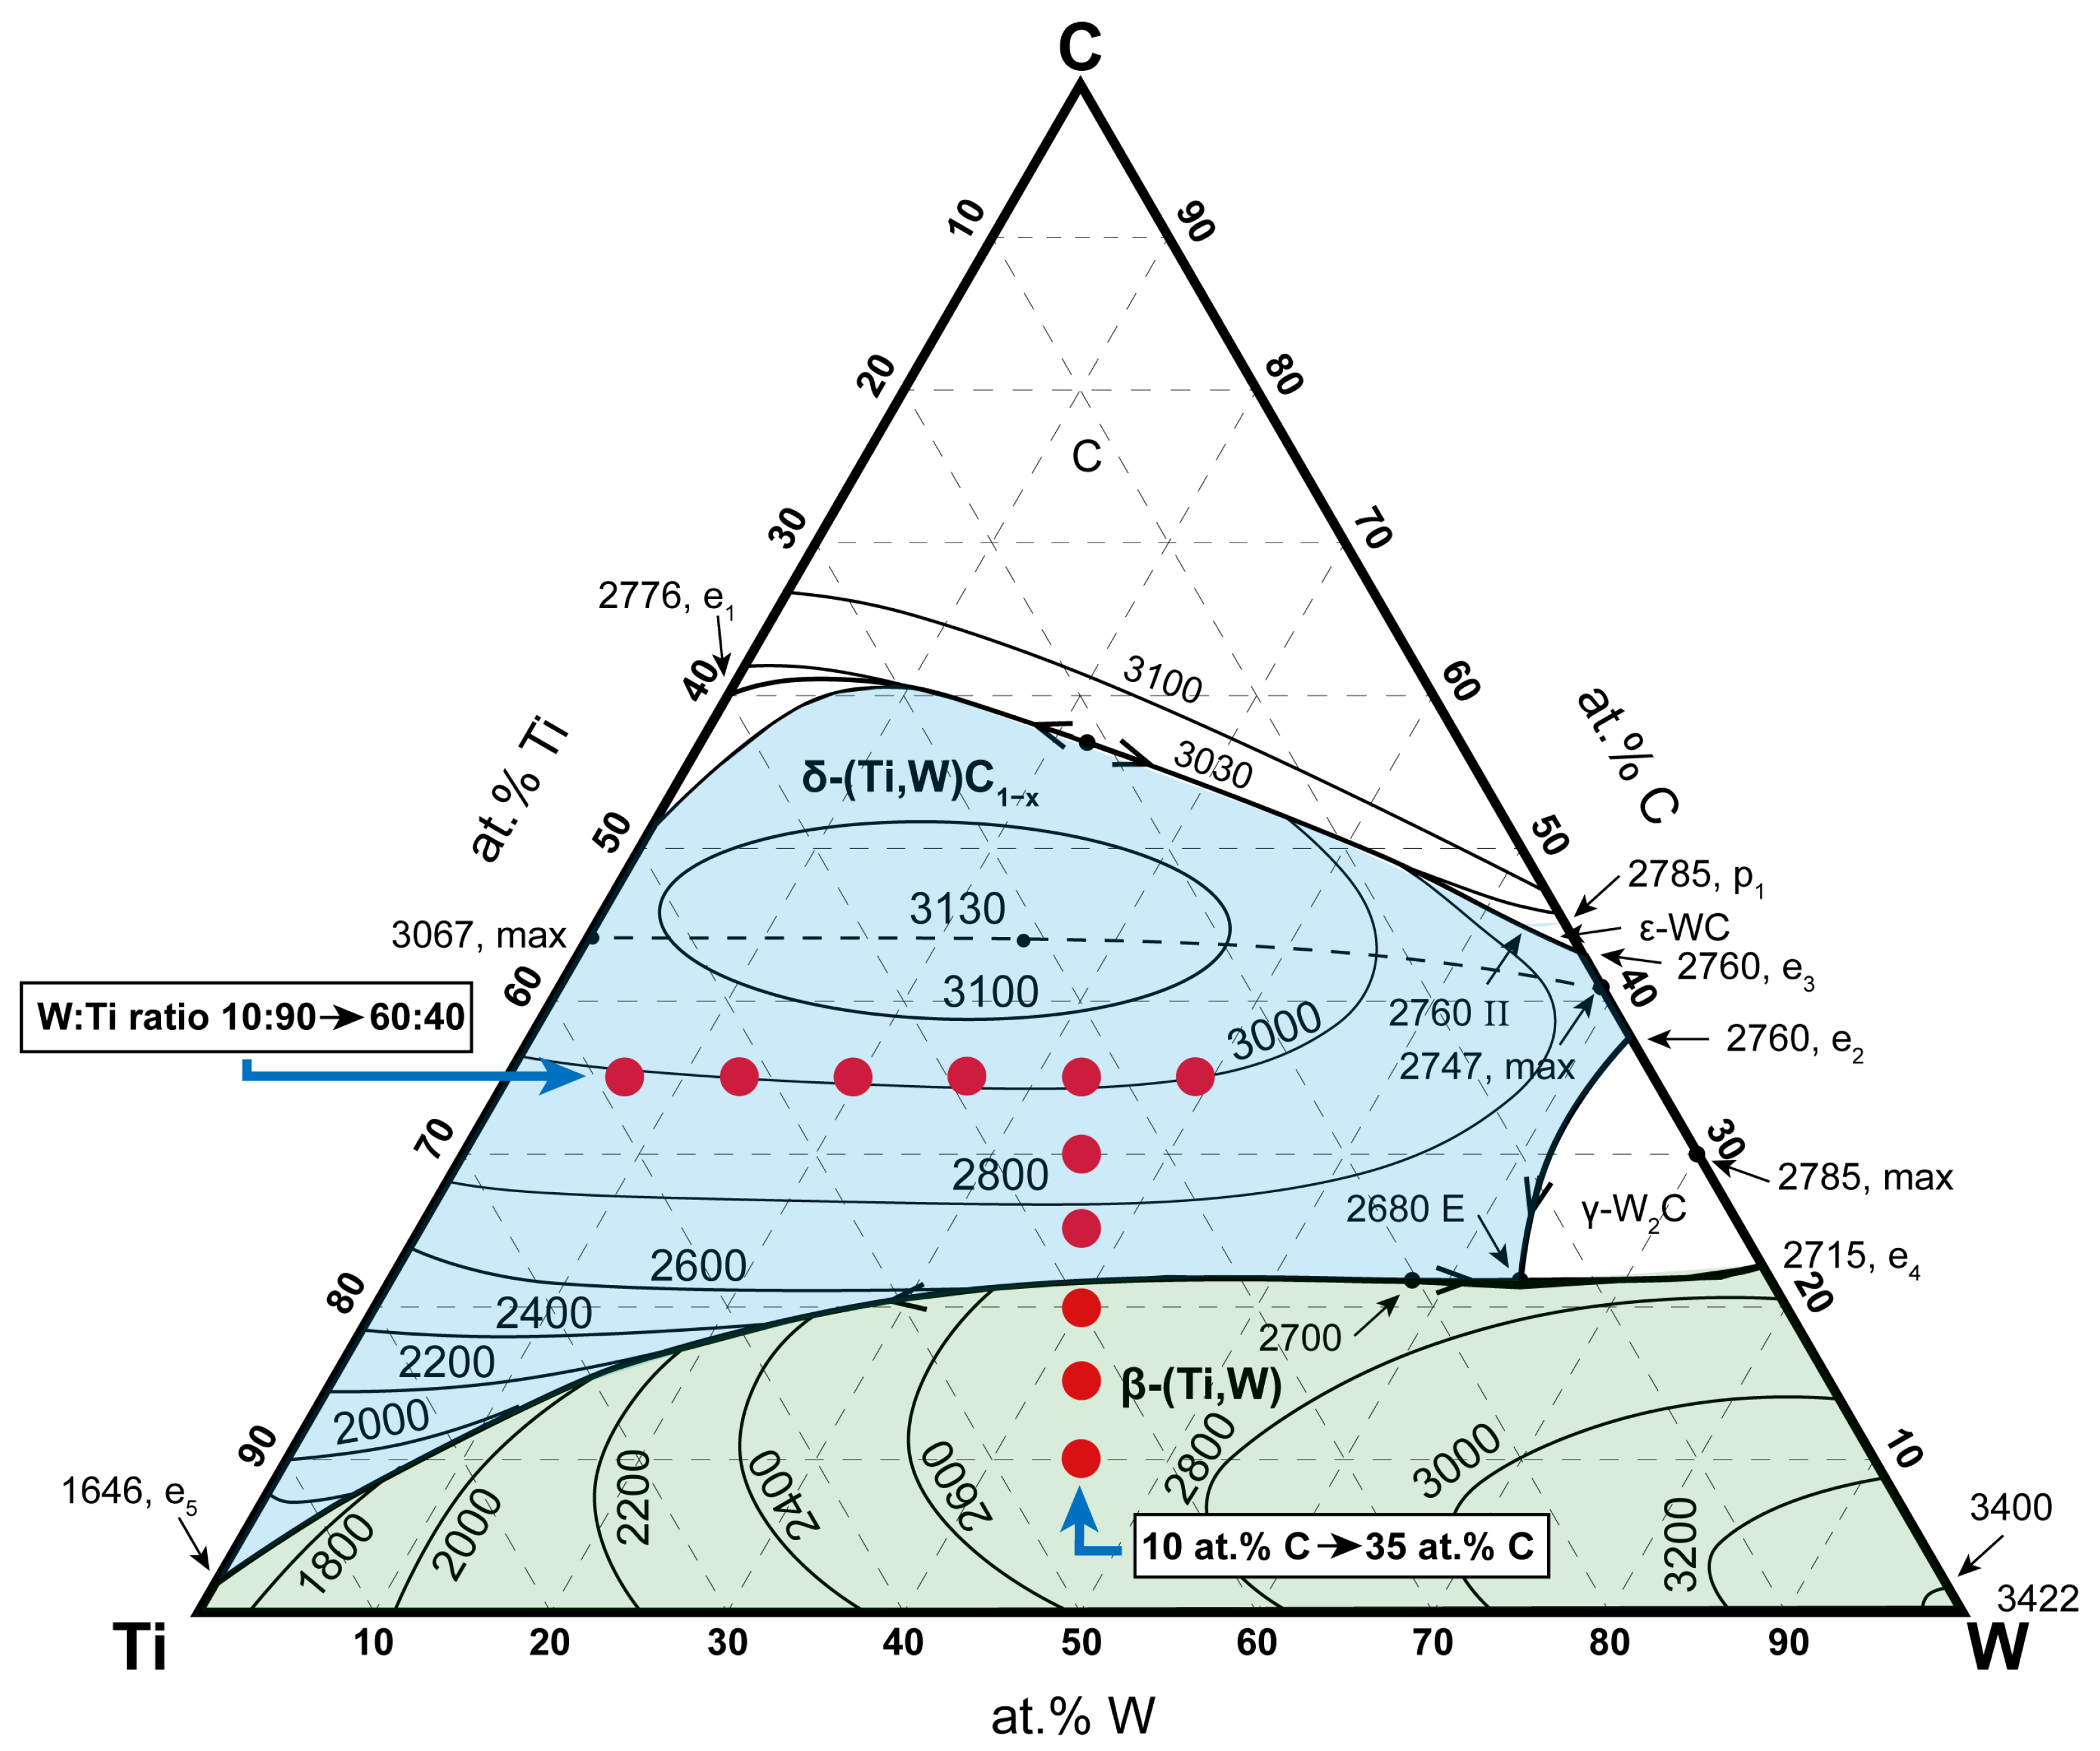
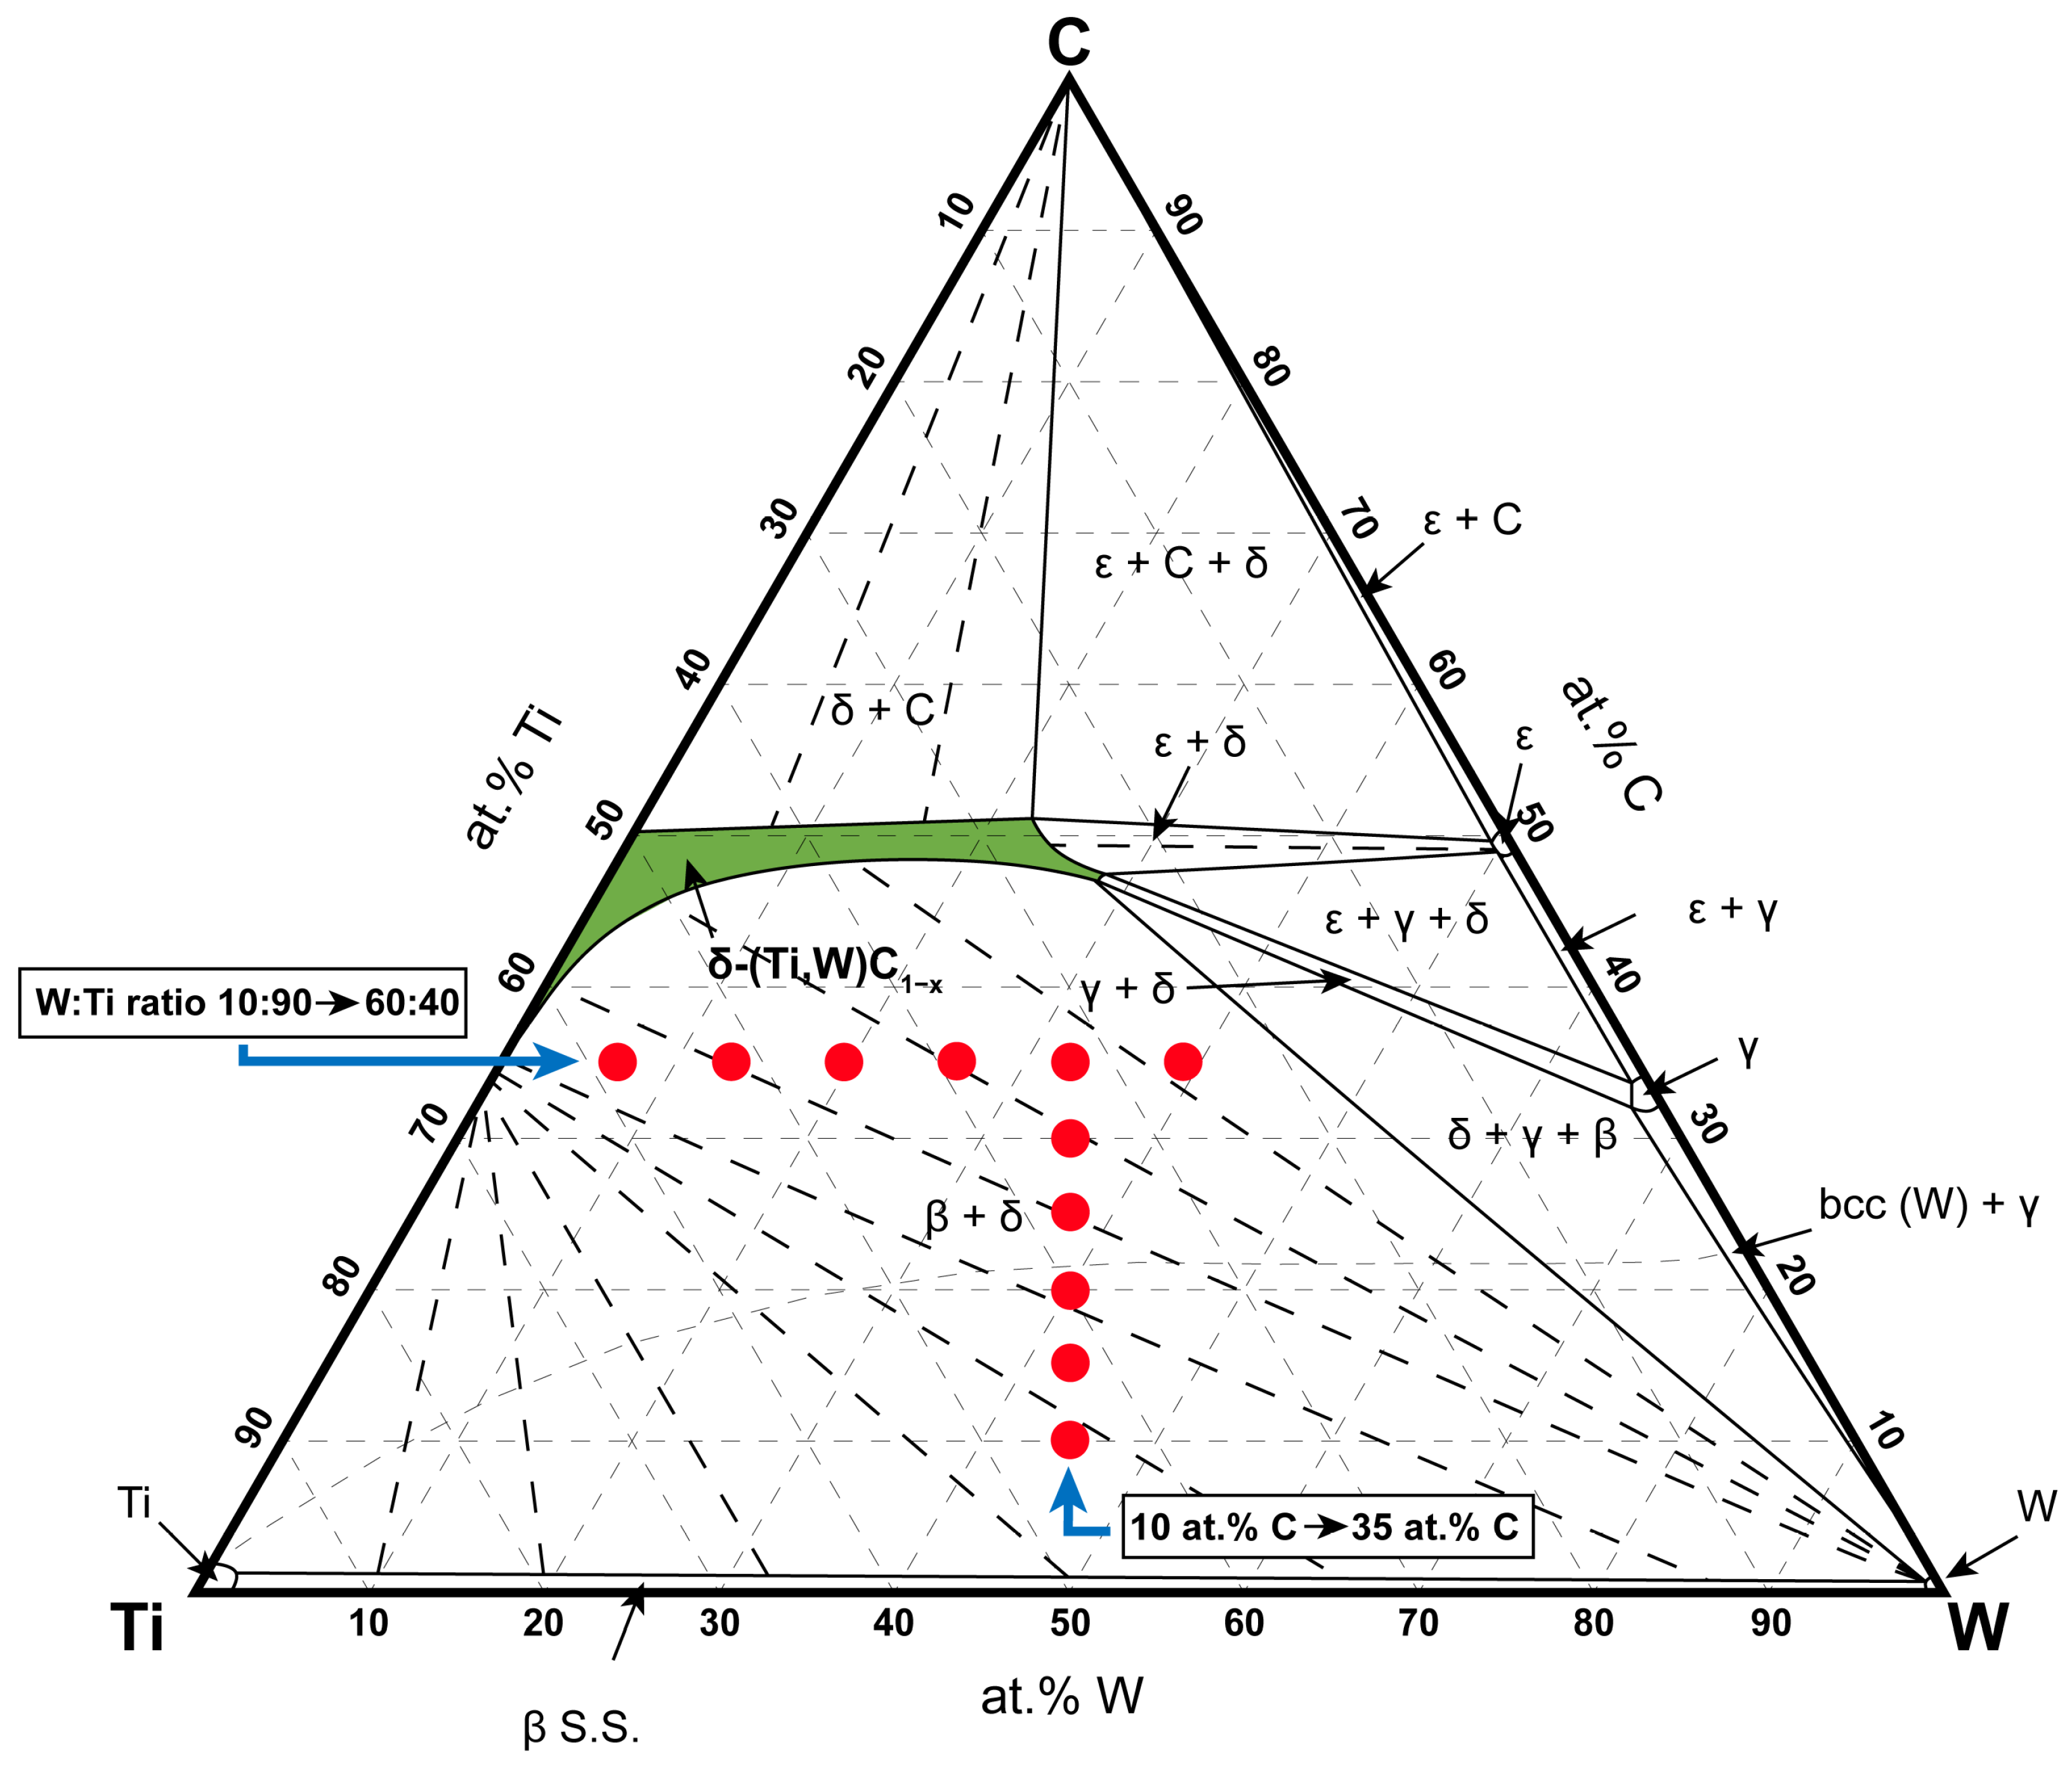
2.1. Alloy Selection to Investigate Carbon Content and Tungsten–Titanium Ratio Influence
2.2. High-Throughput Screening
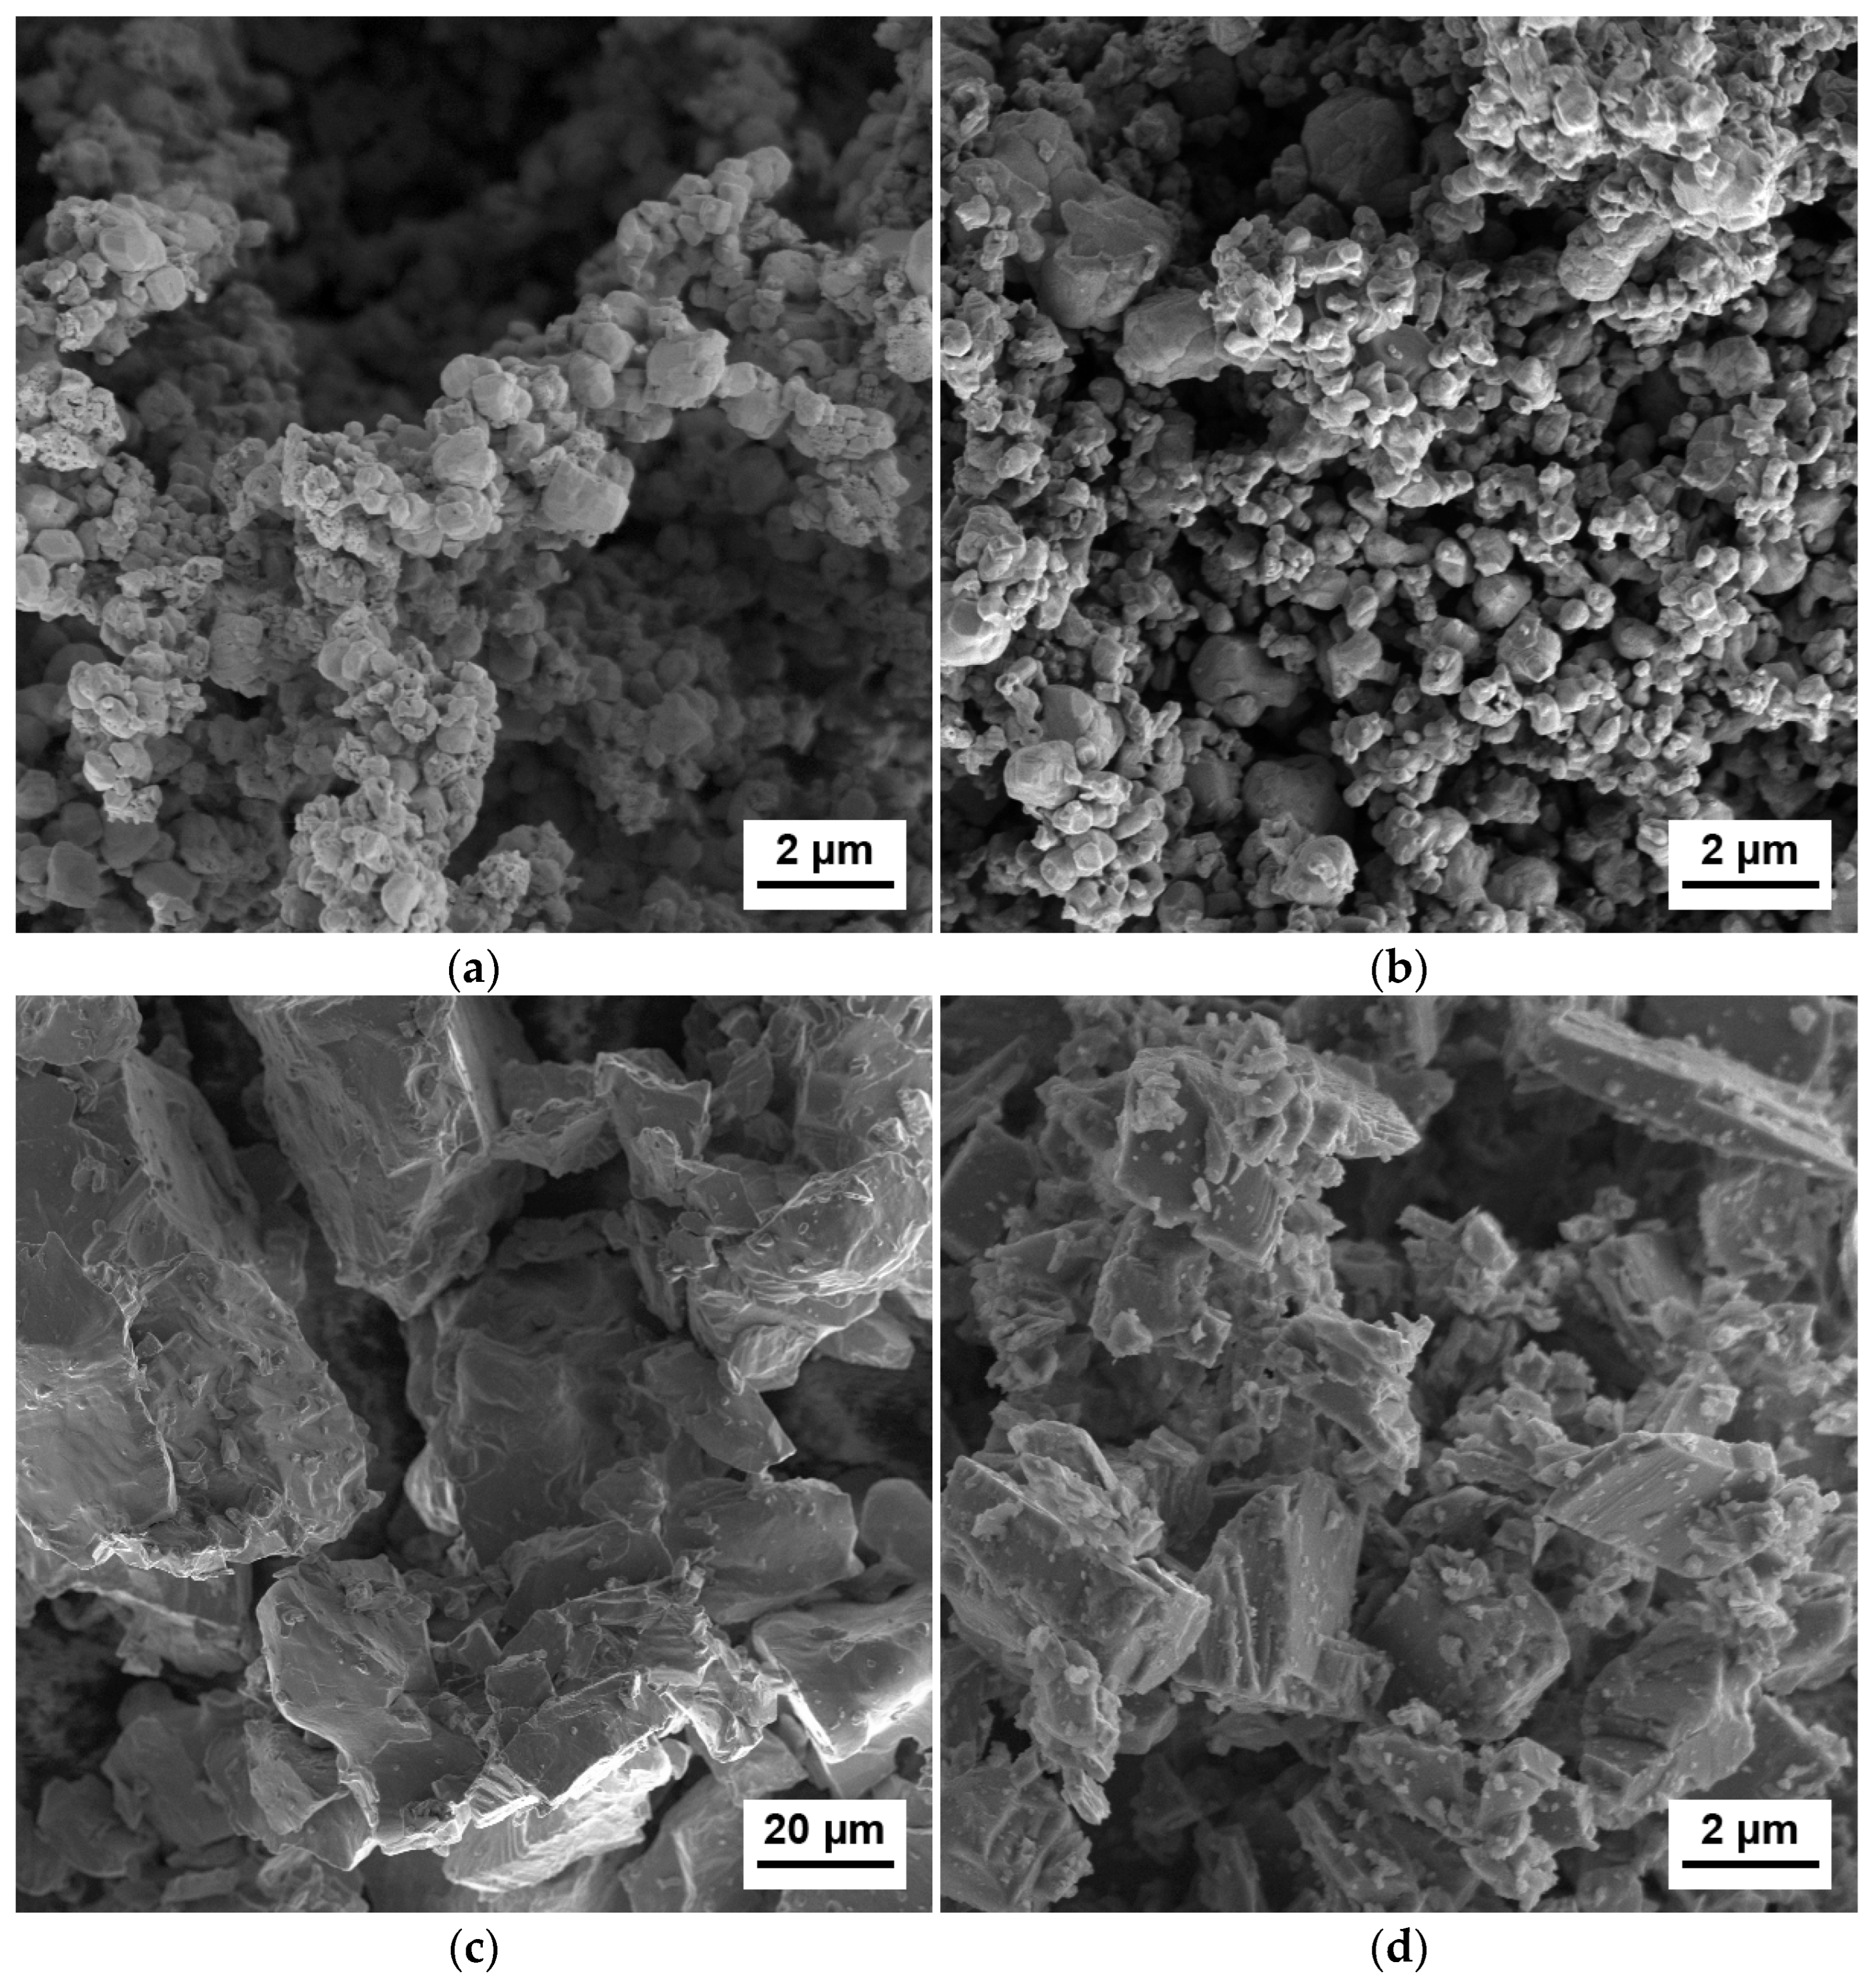
2.2.1. Powder Blending
2.2.2. Compacting
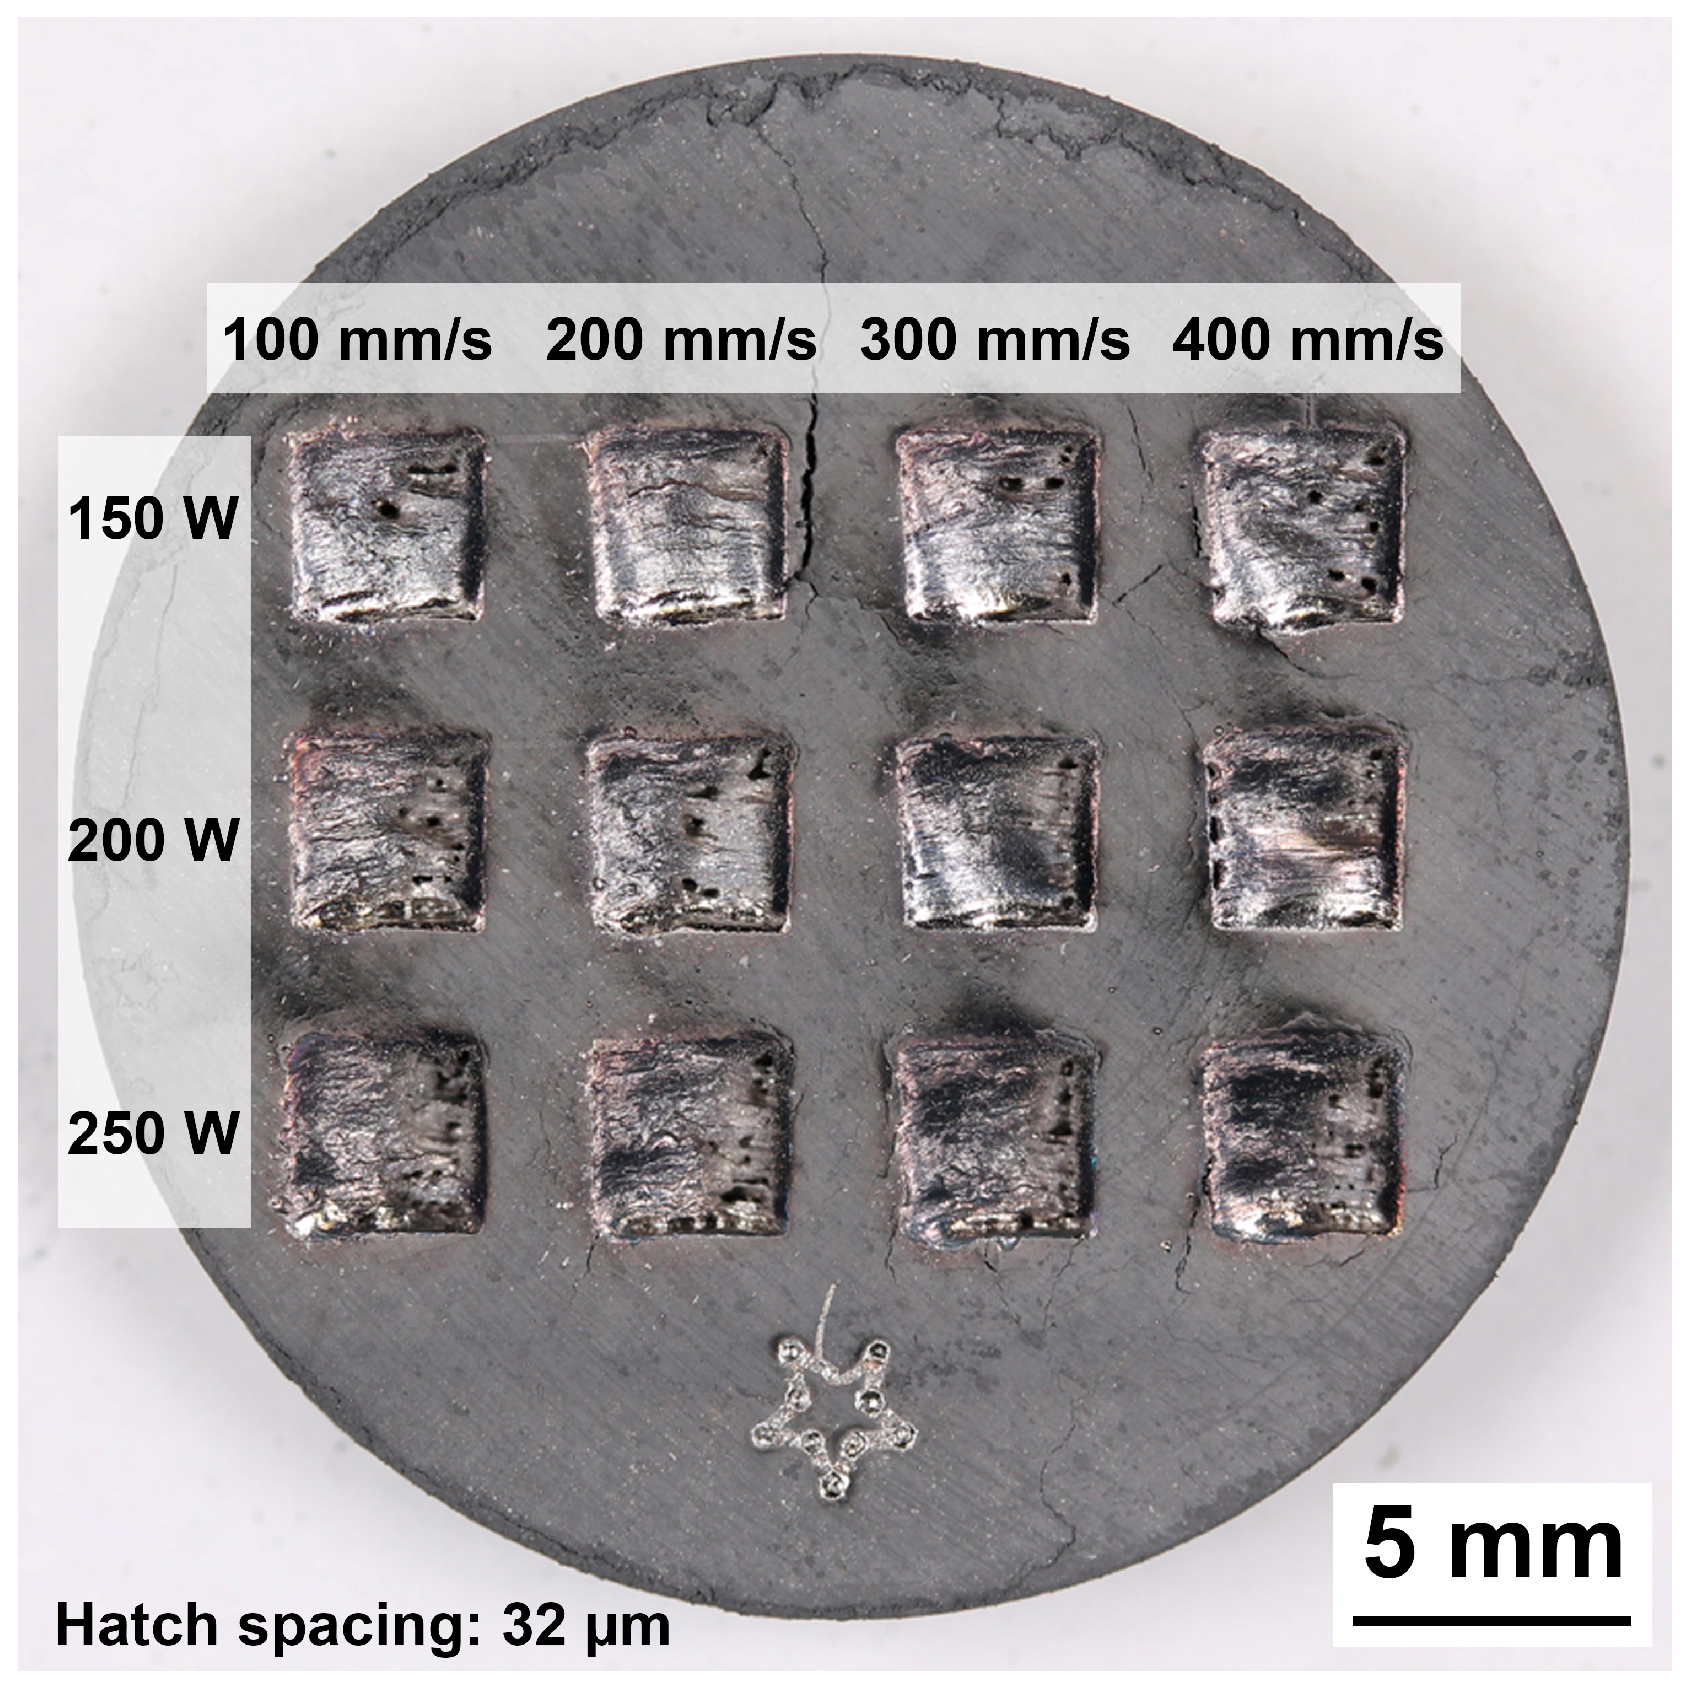
2.2.3. Laser Melting
2.3. Characterization
3. Results
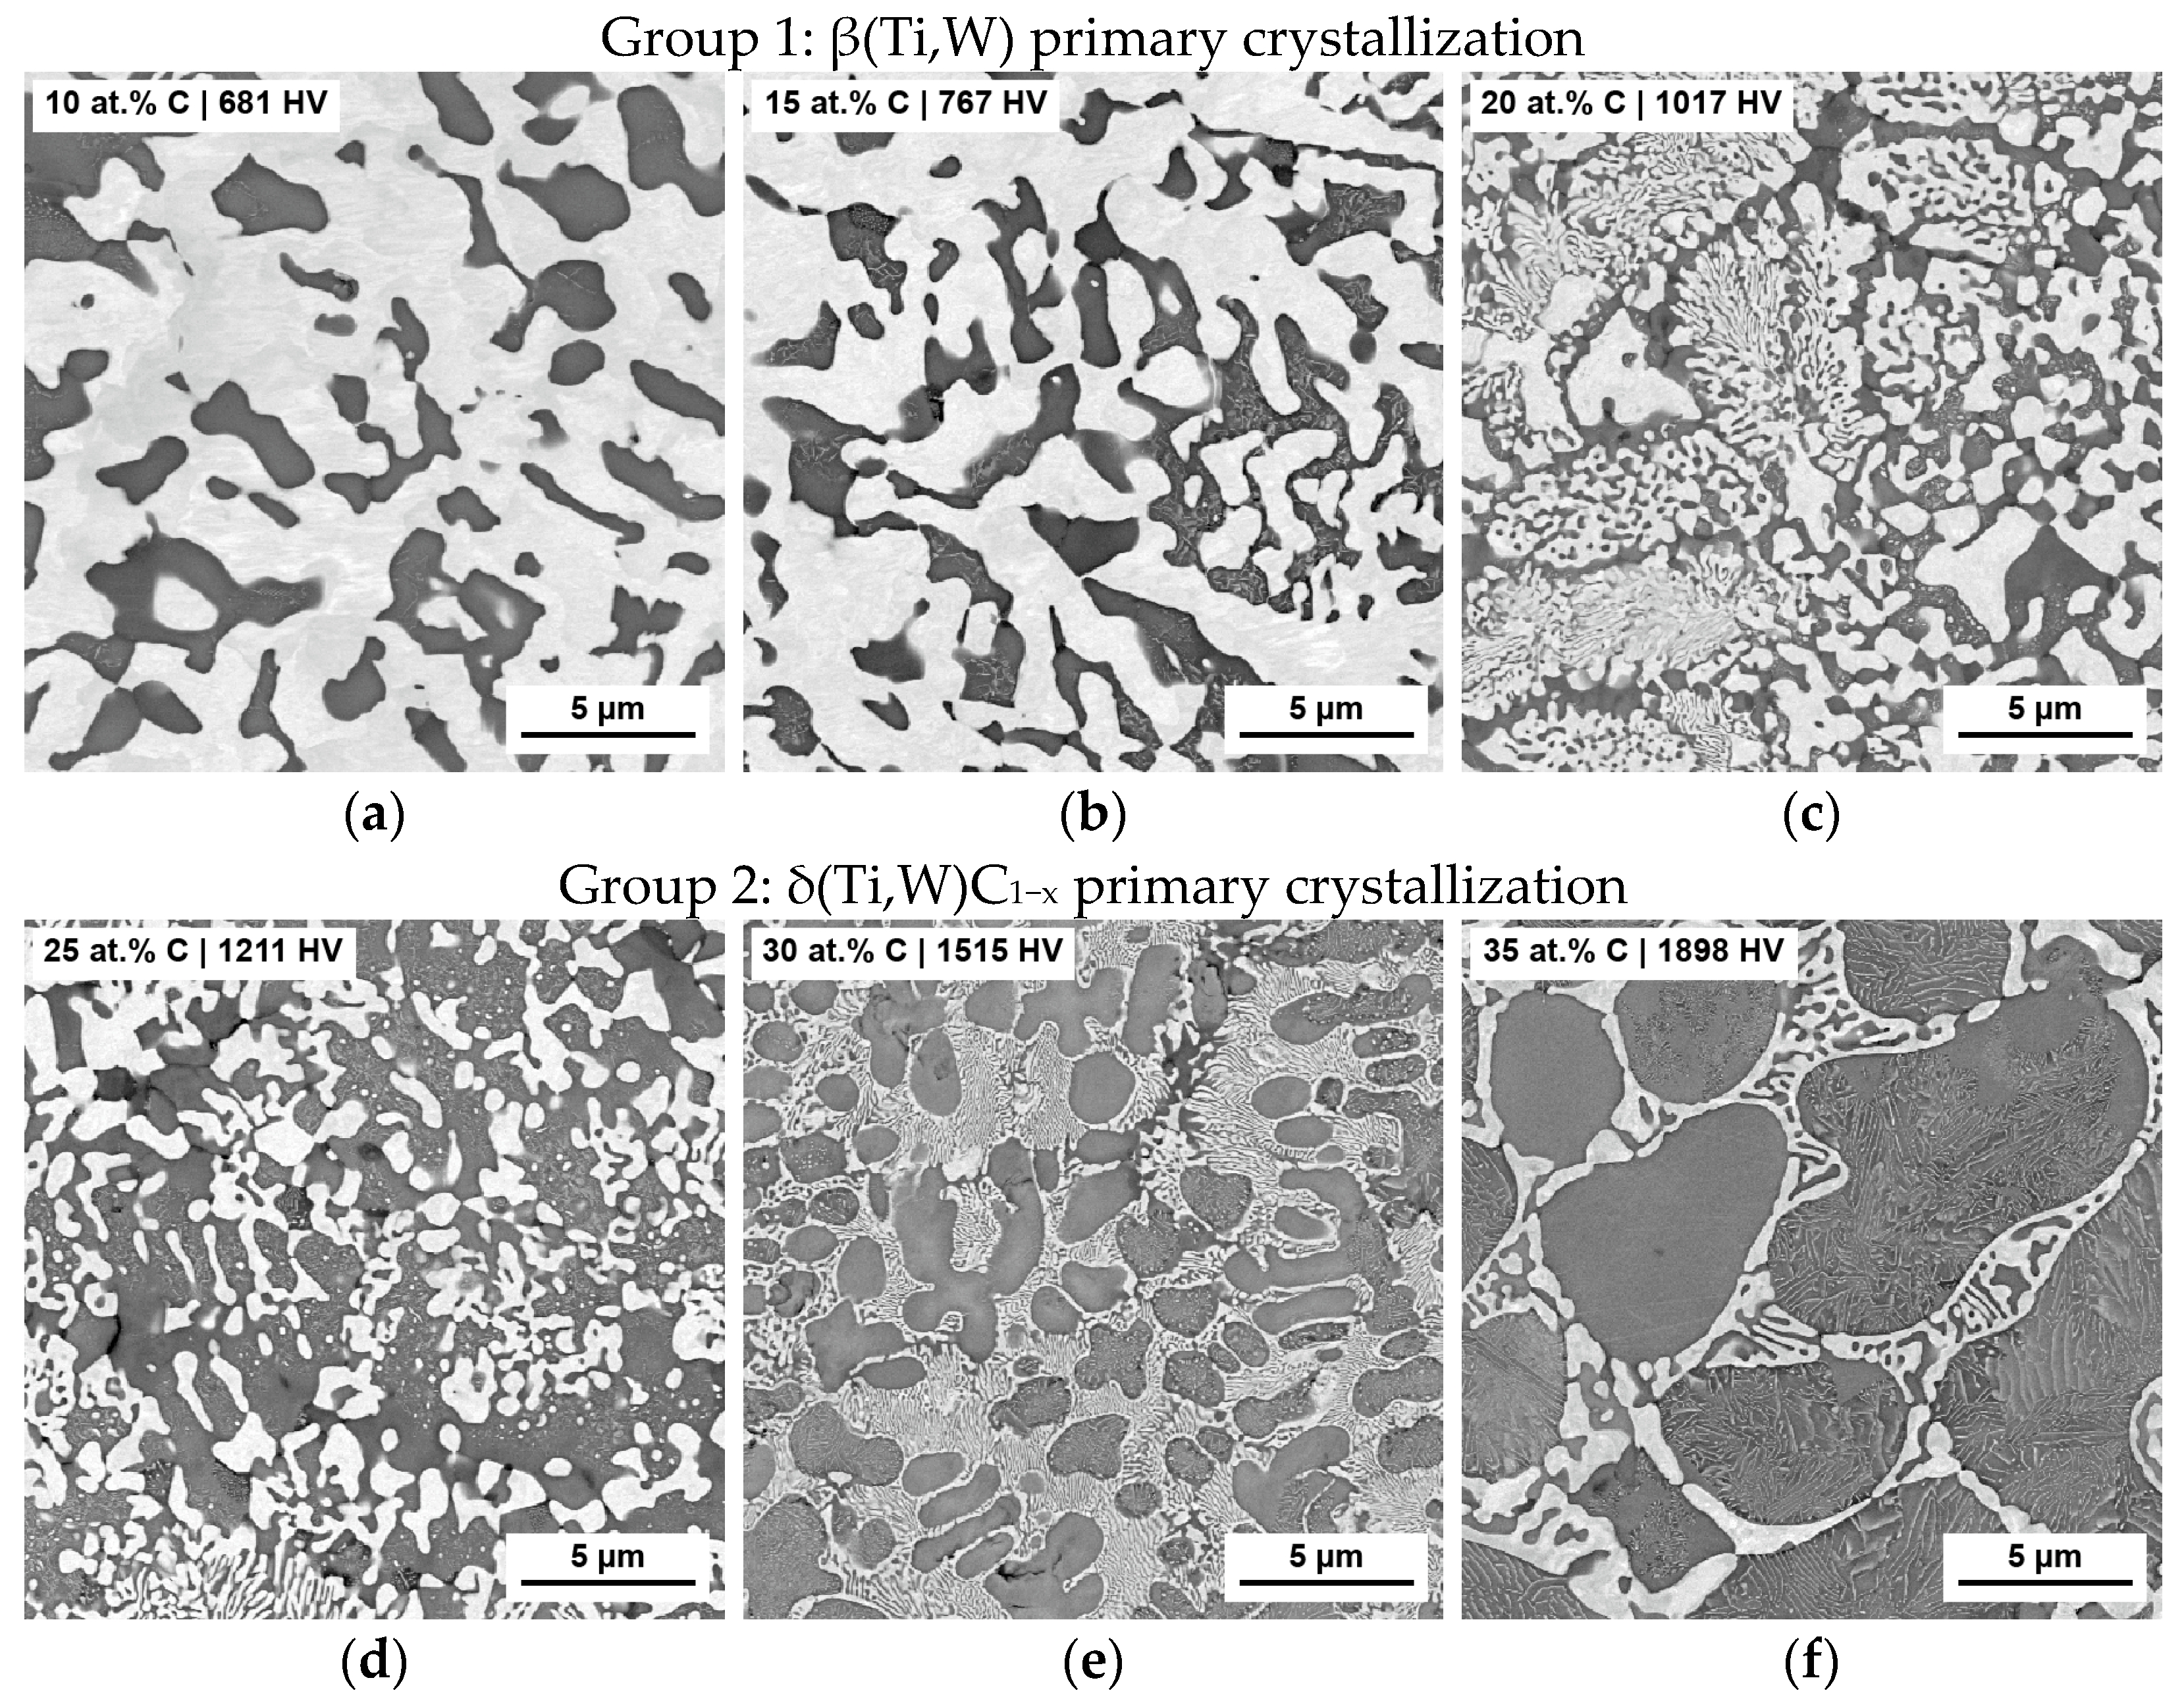
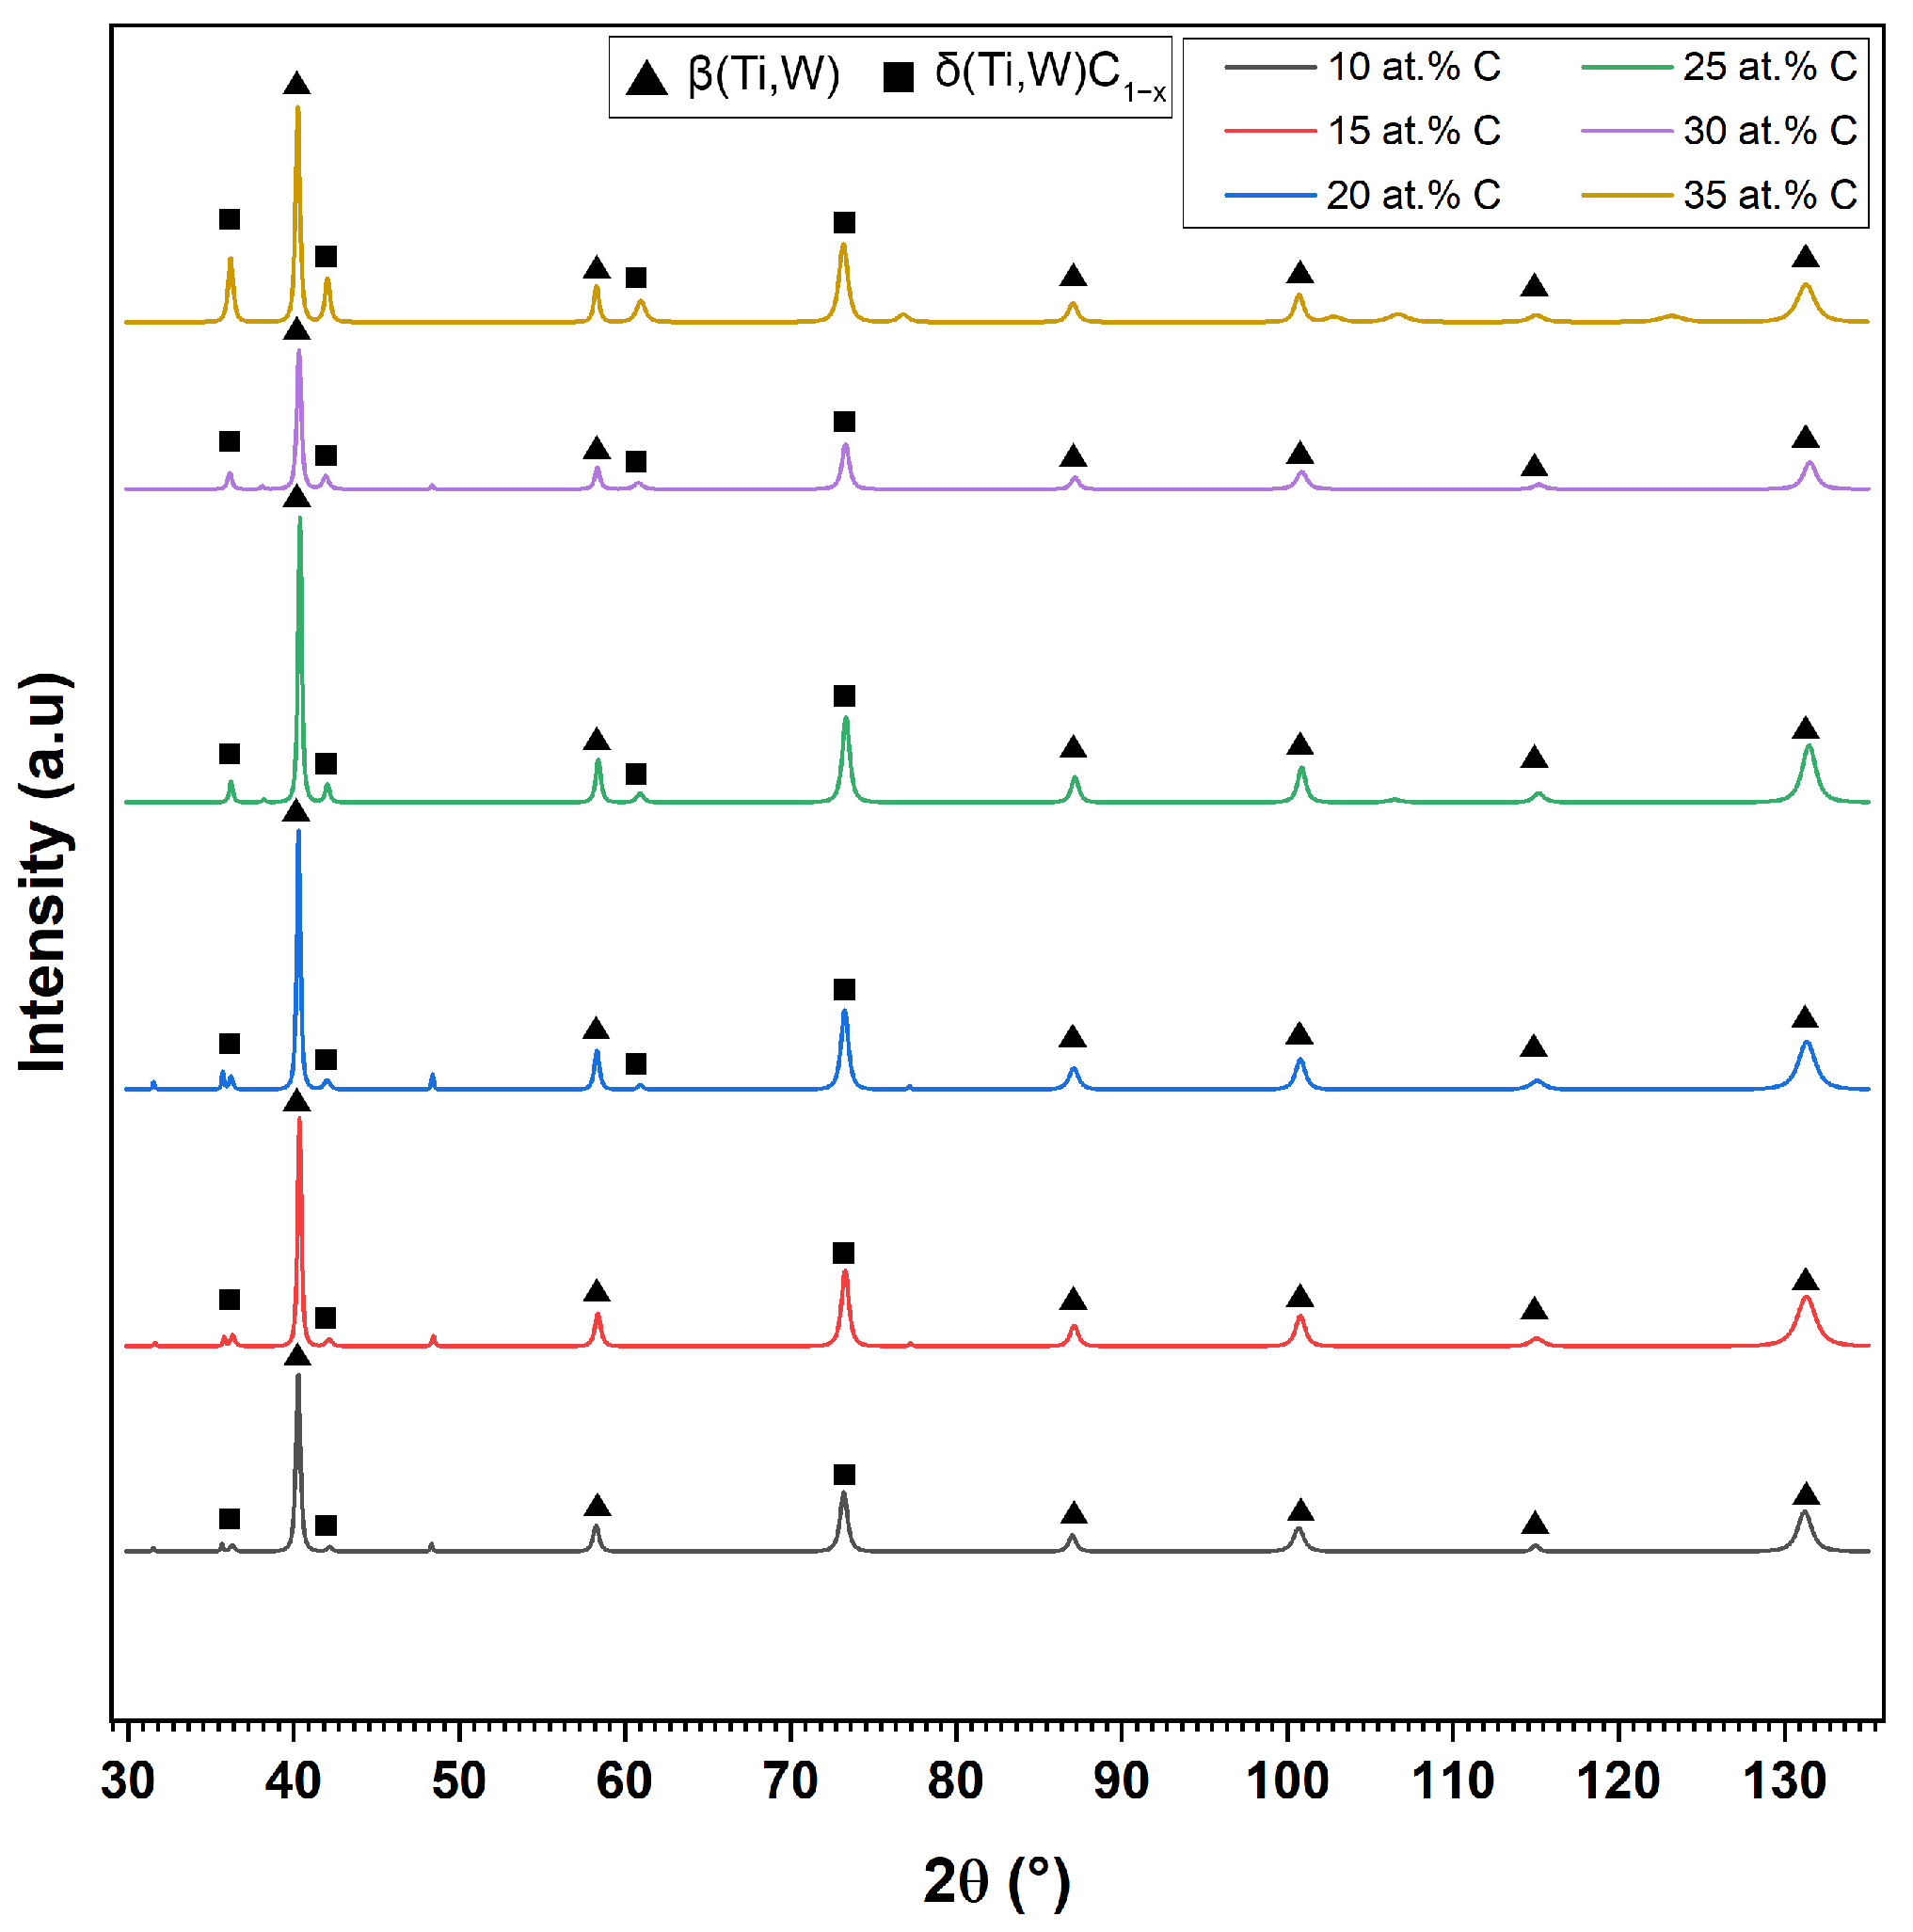
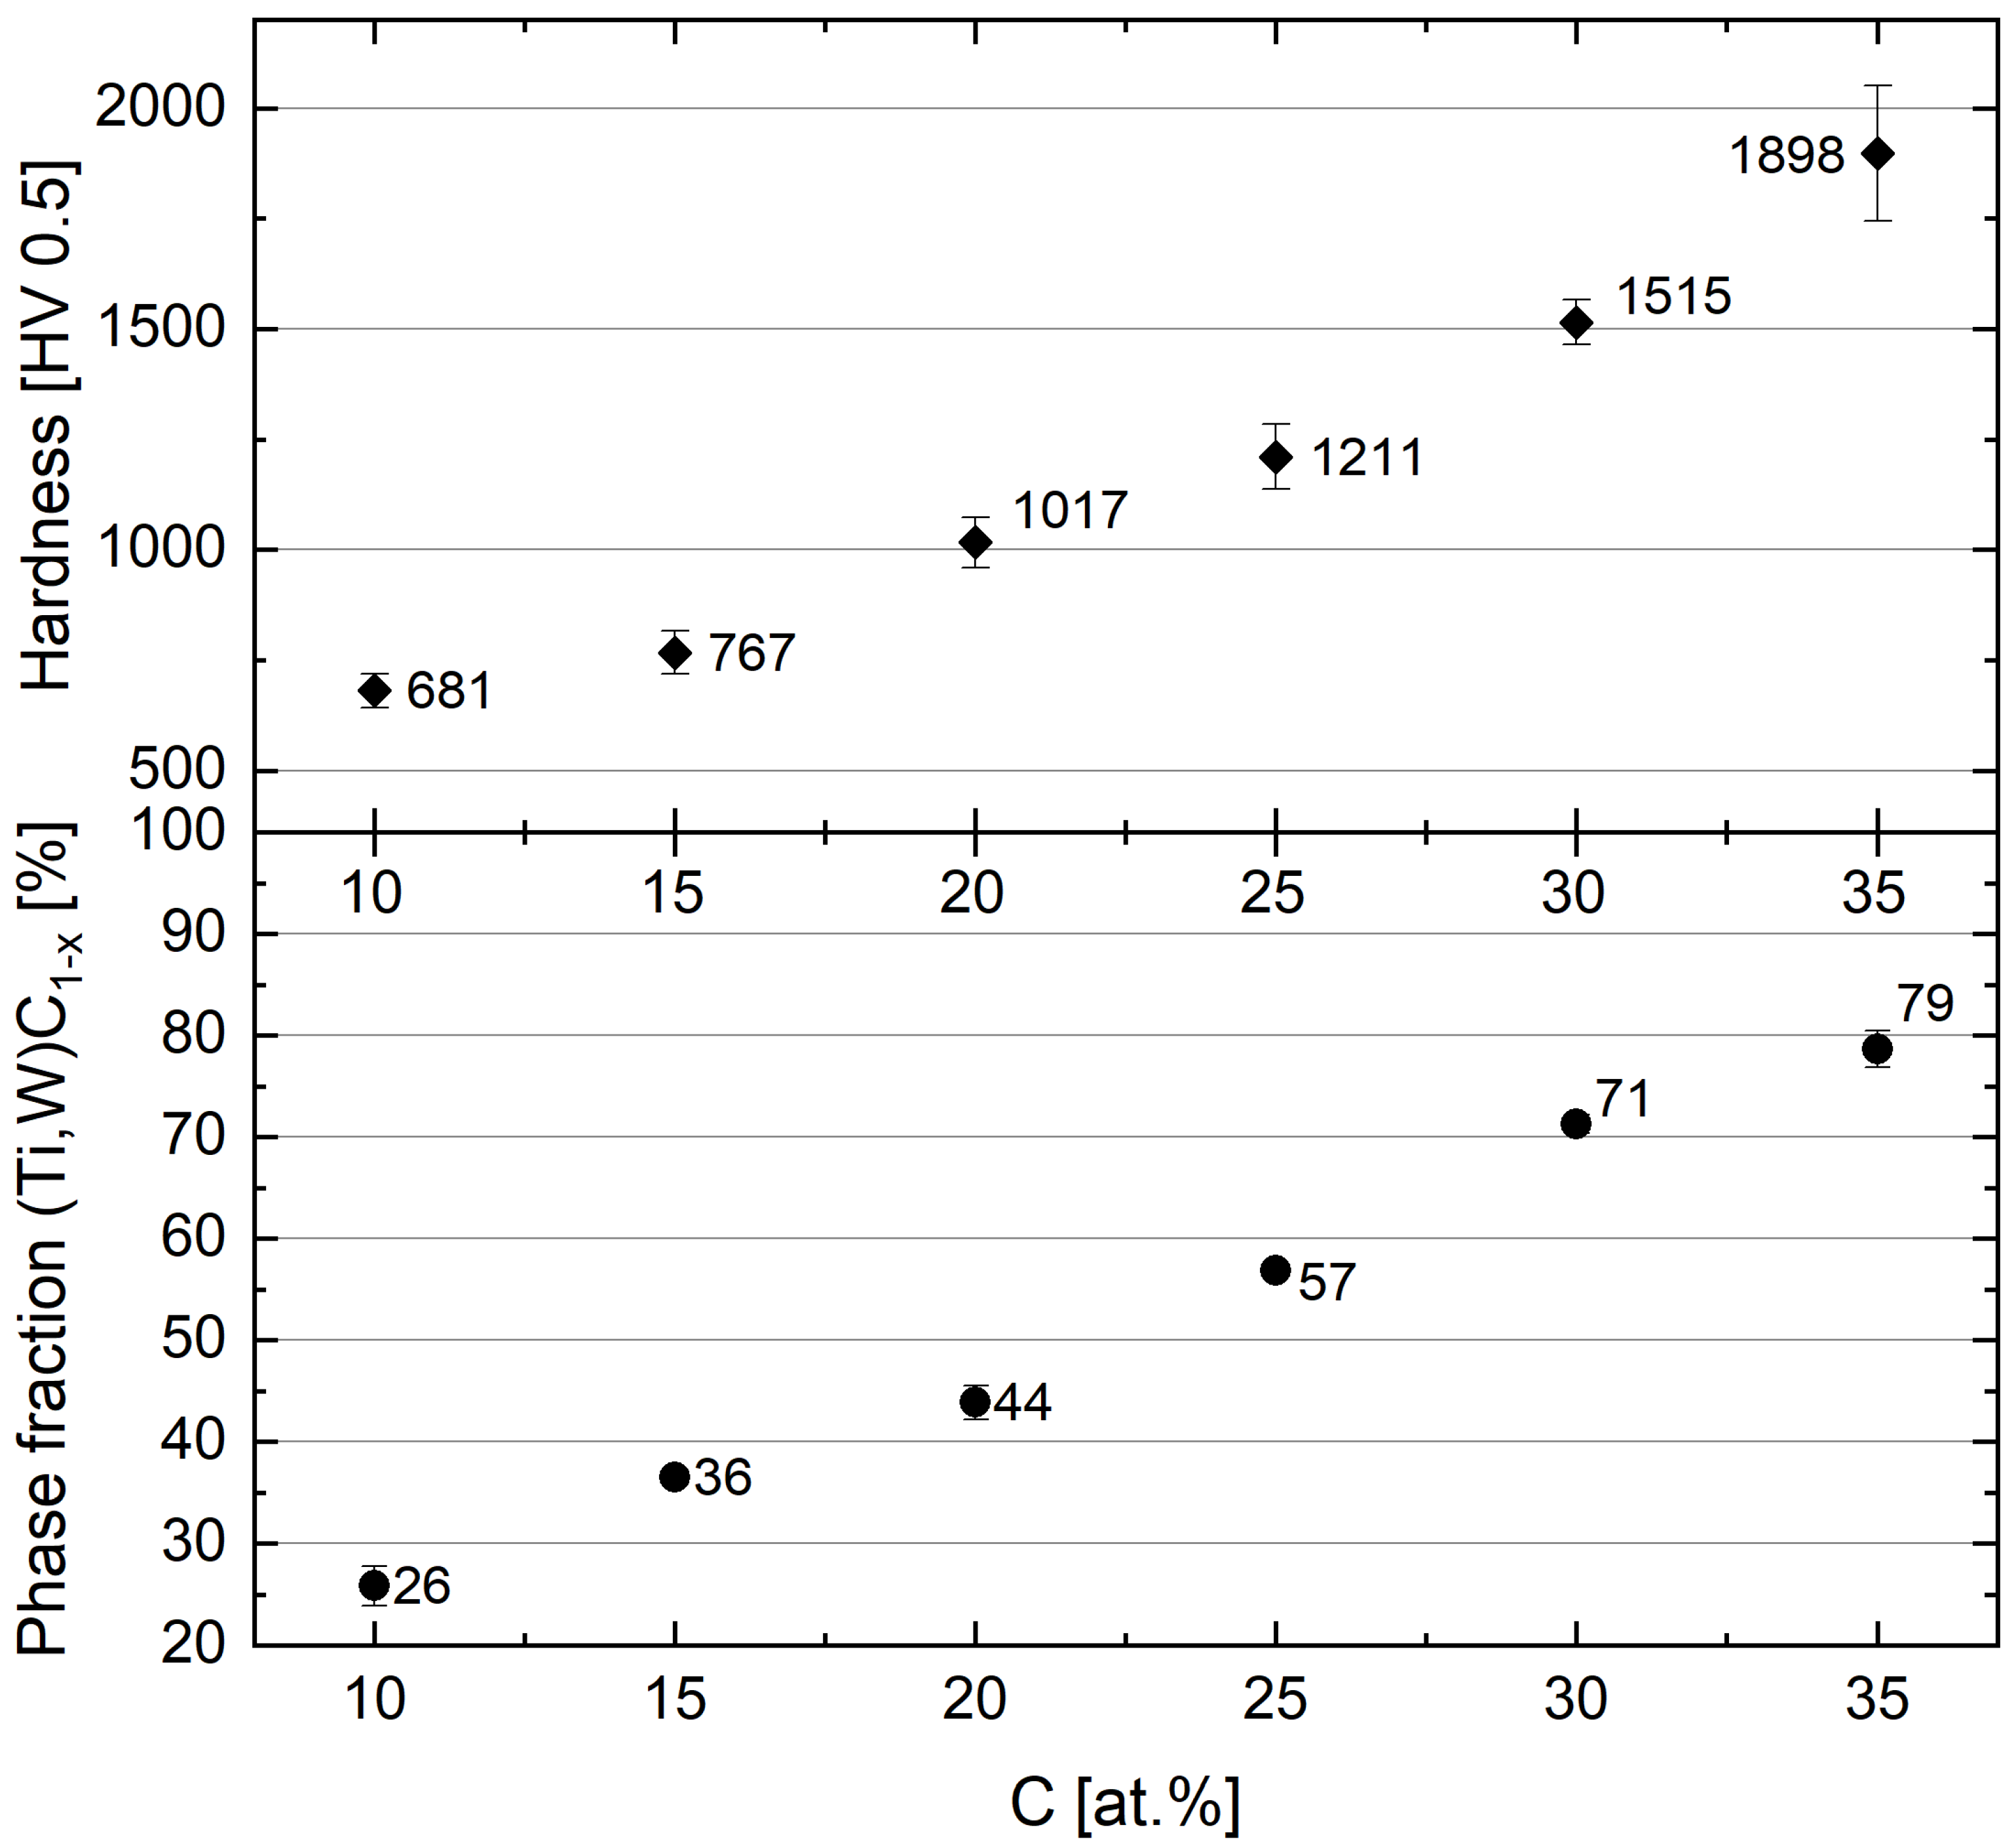
3.1. Screening 1—Influence of Carbon Content
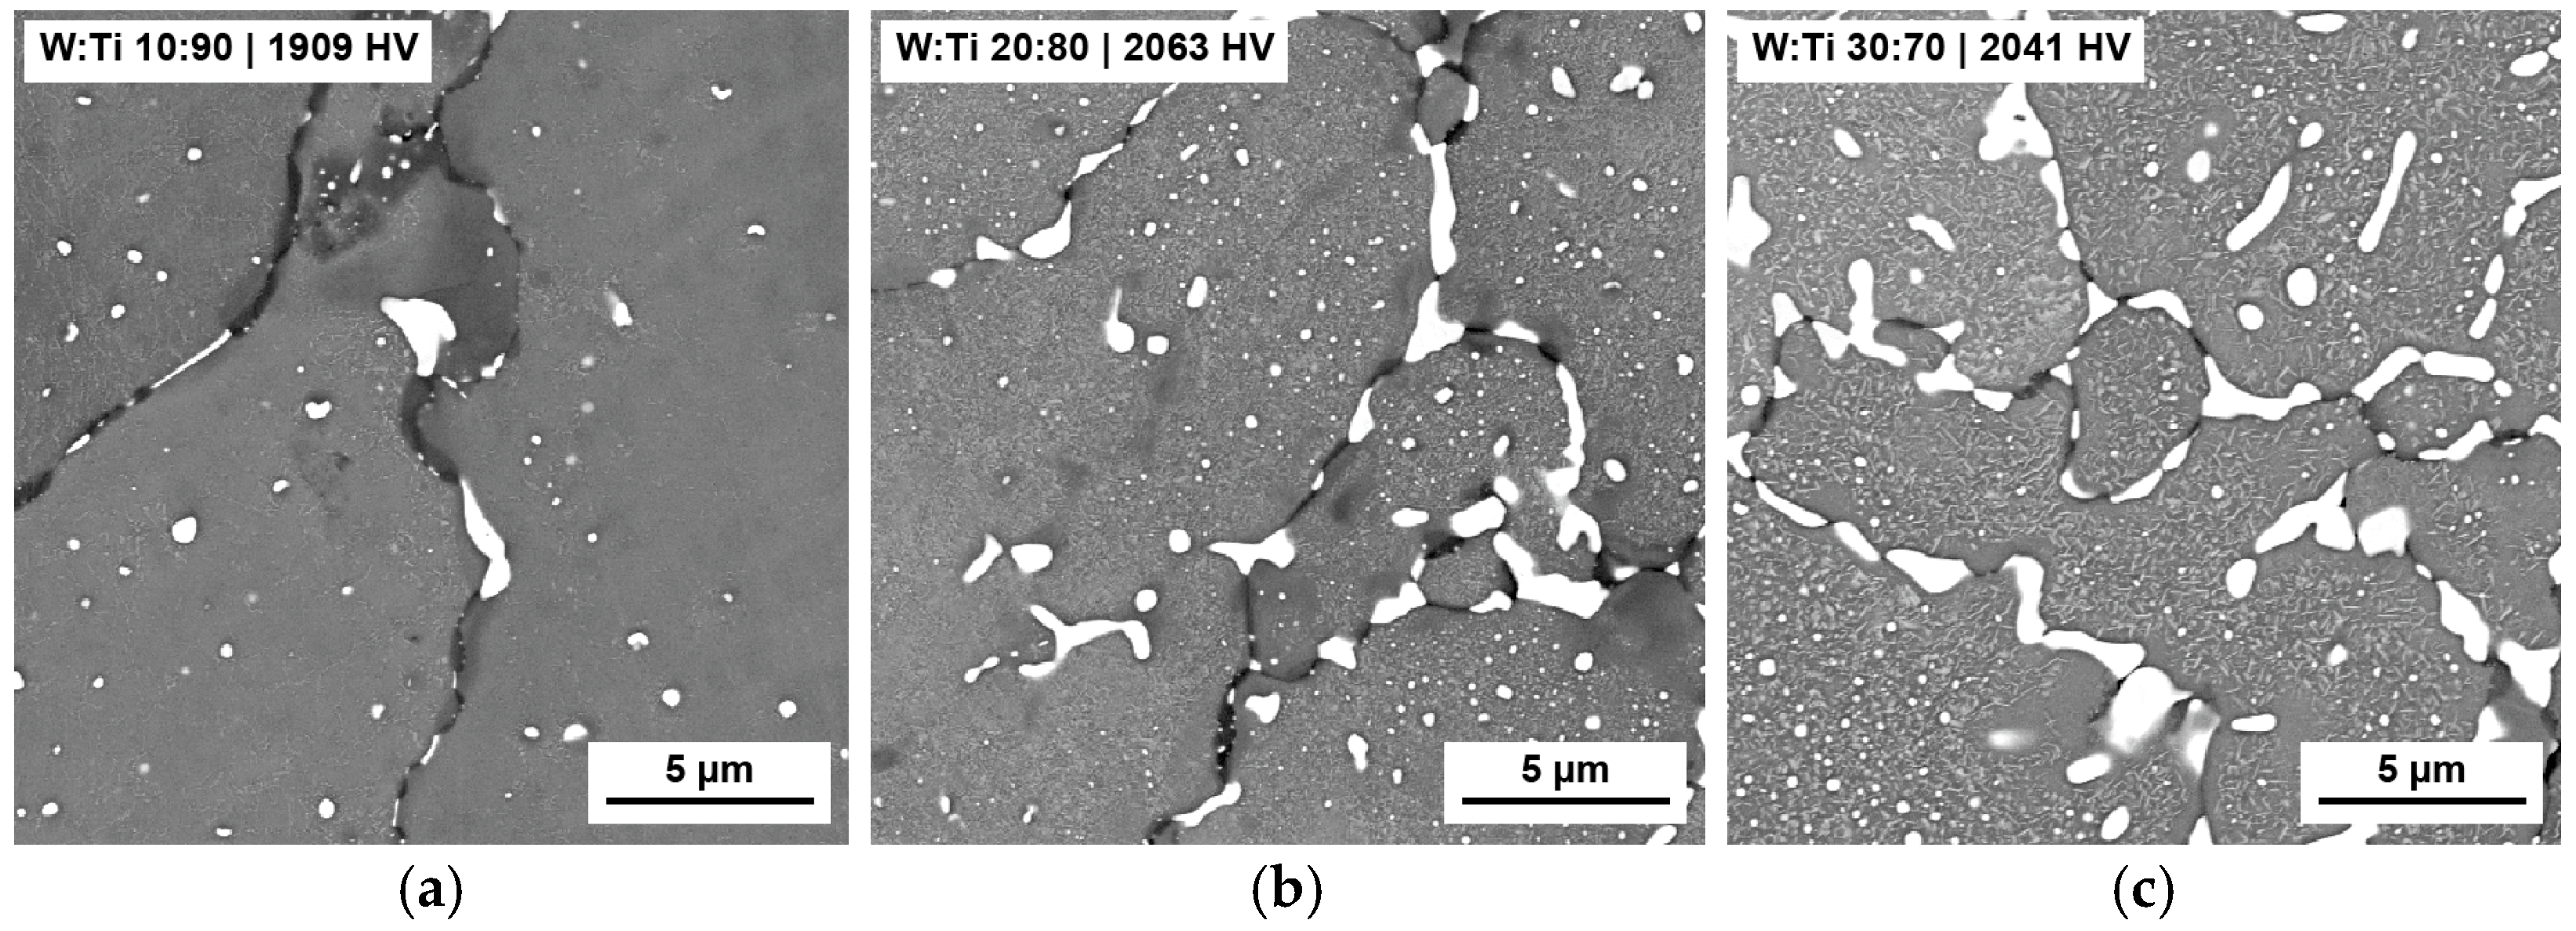
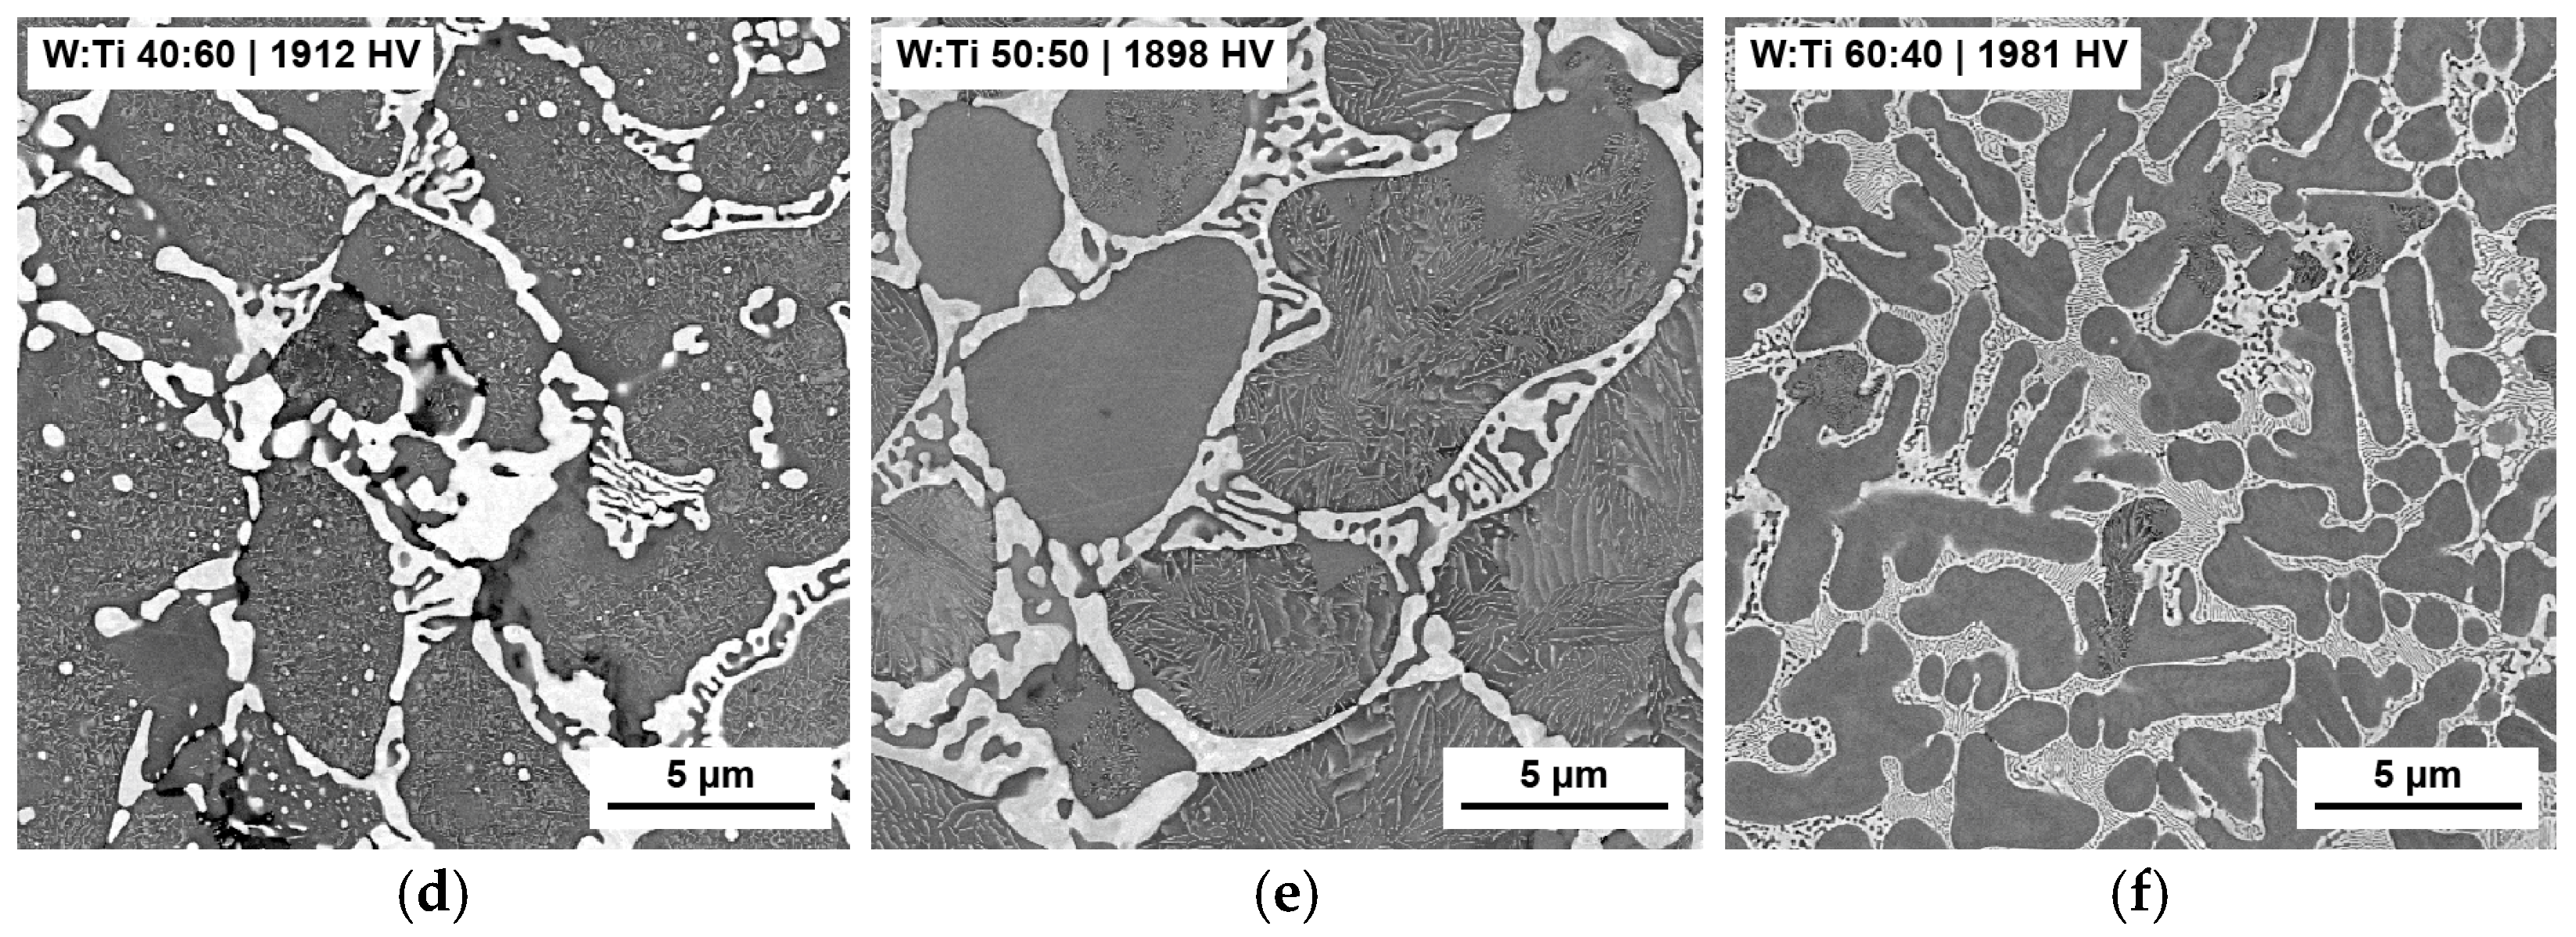
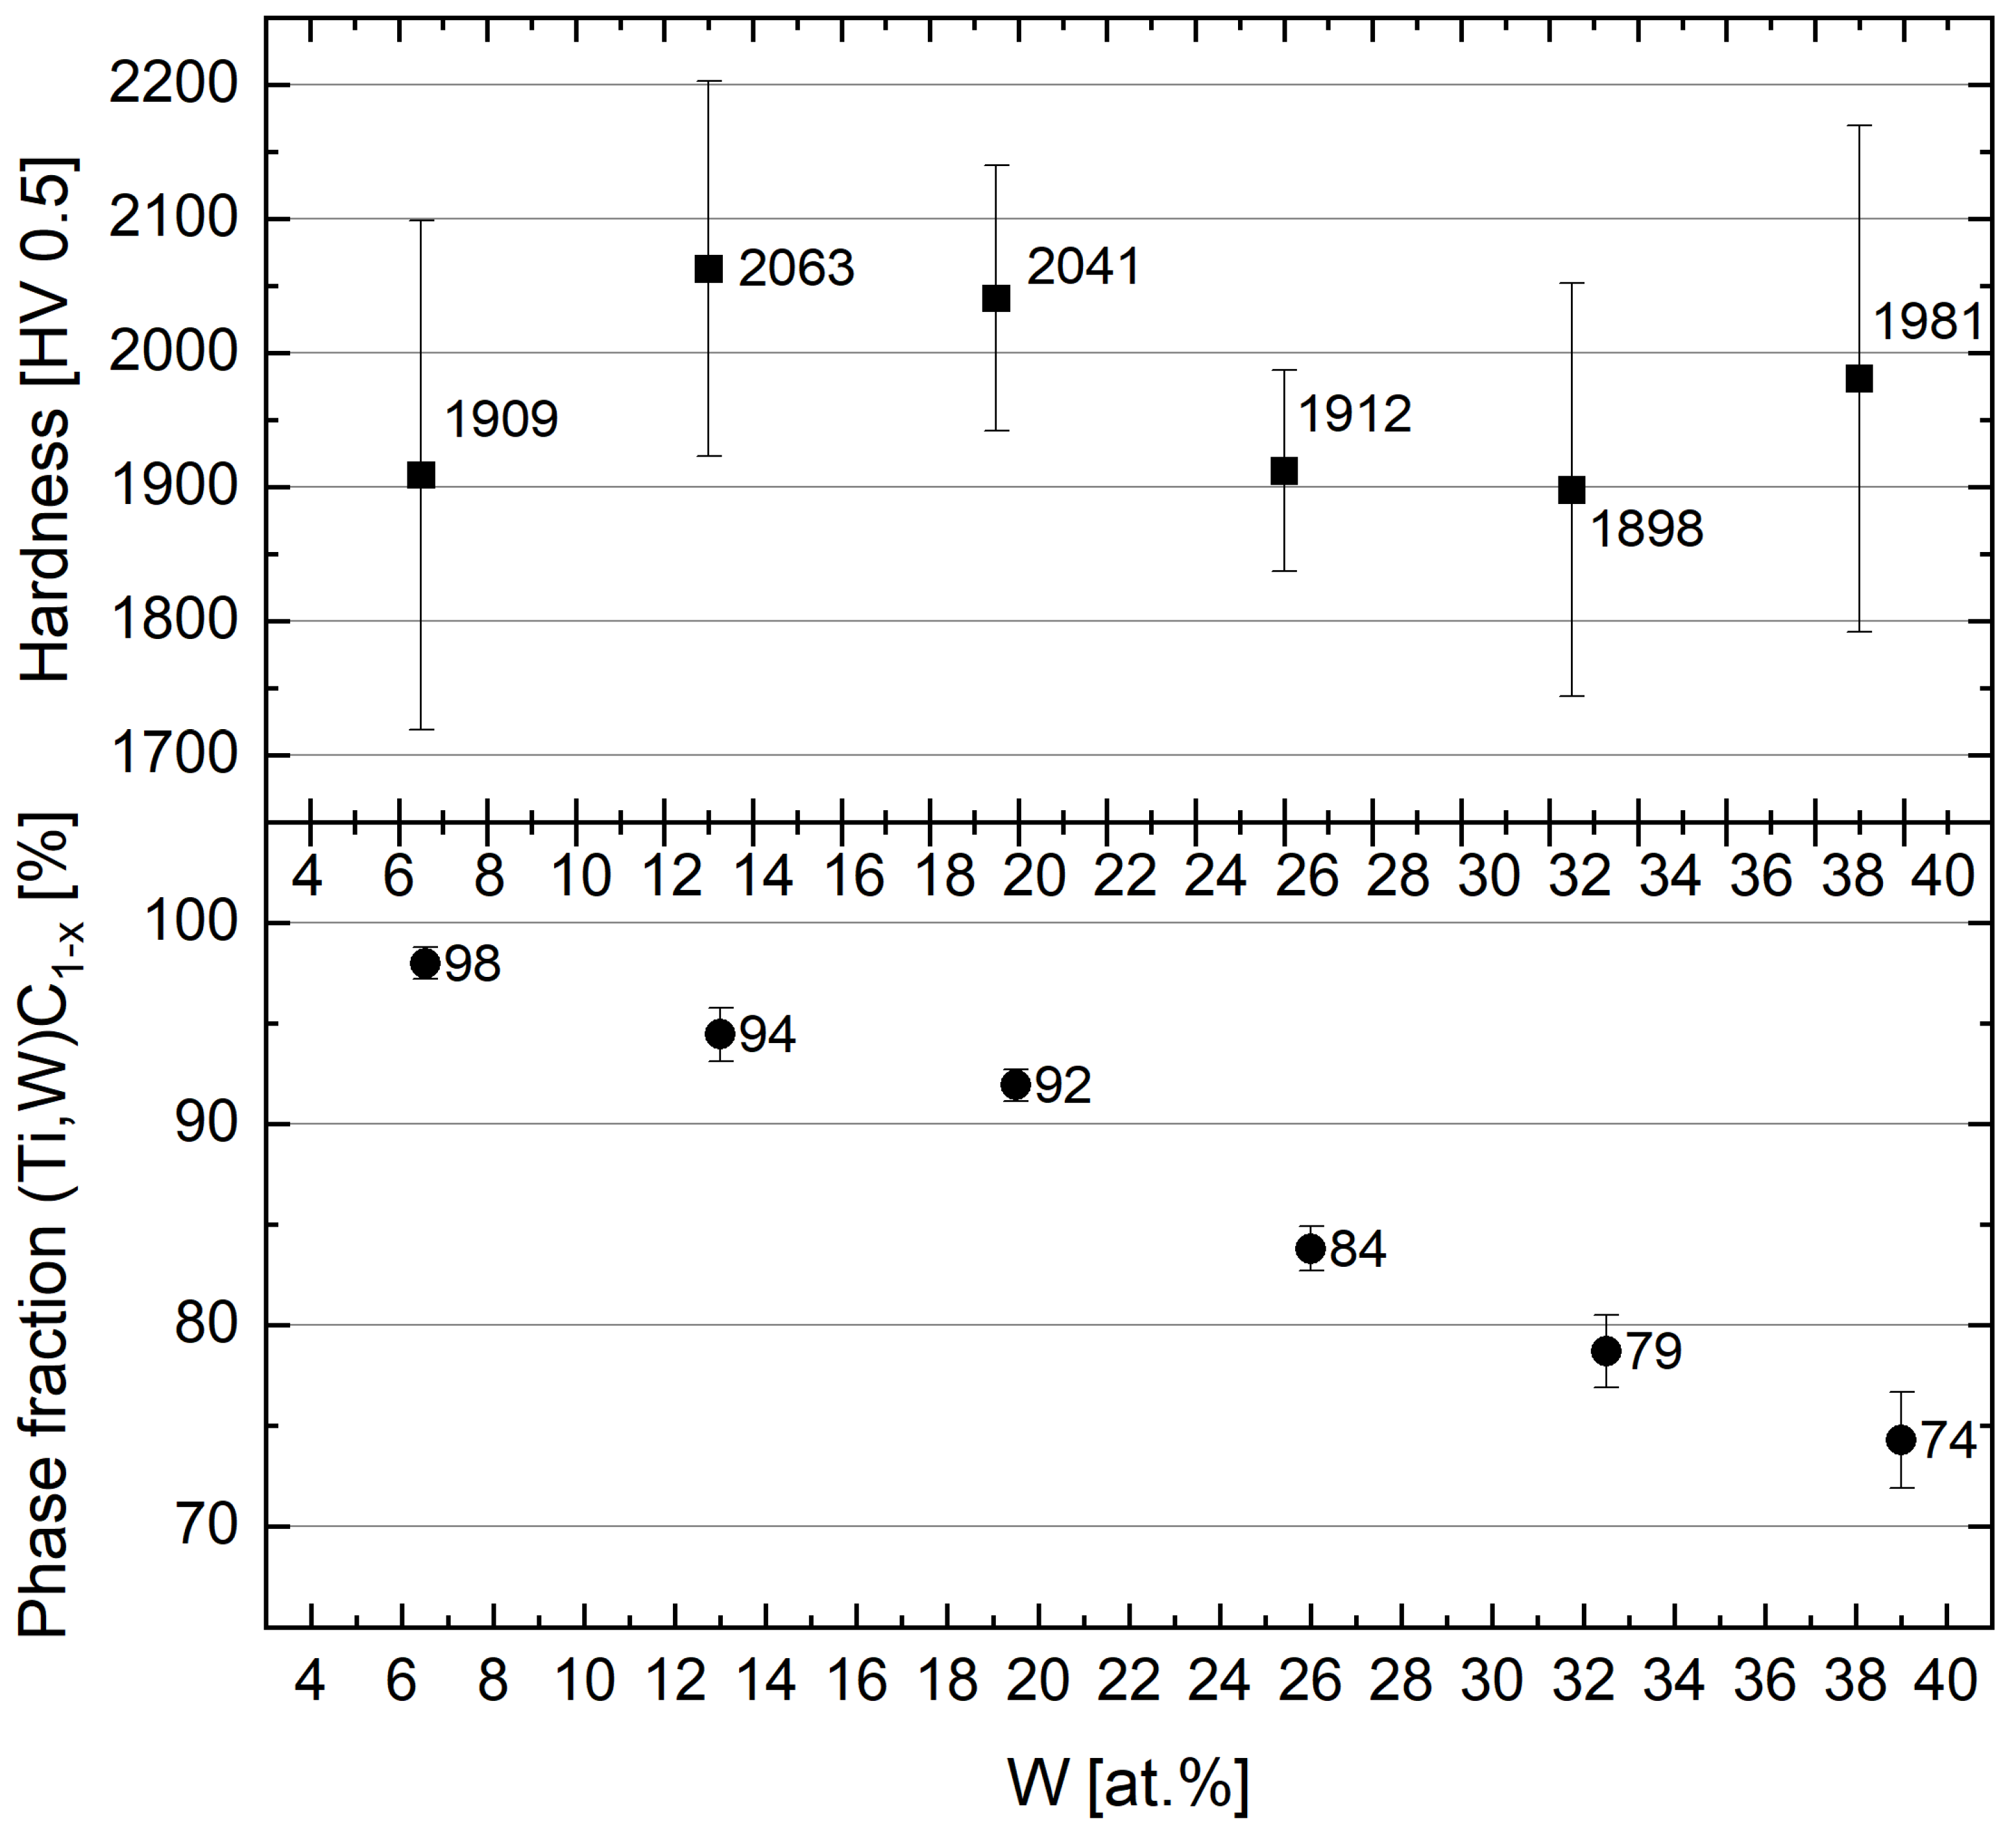
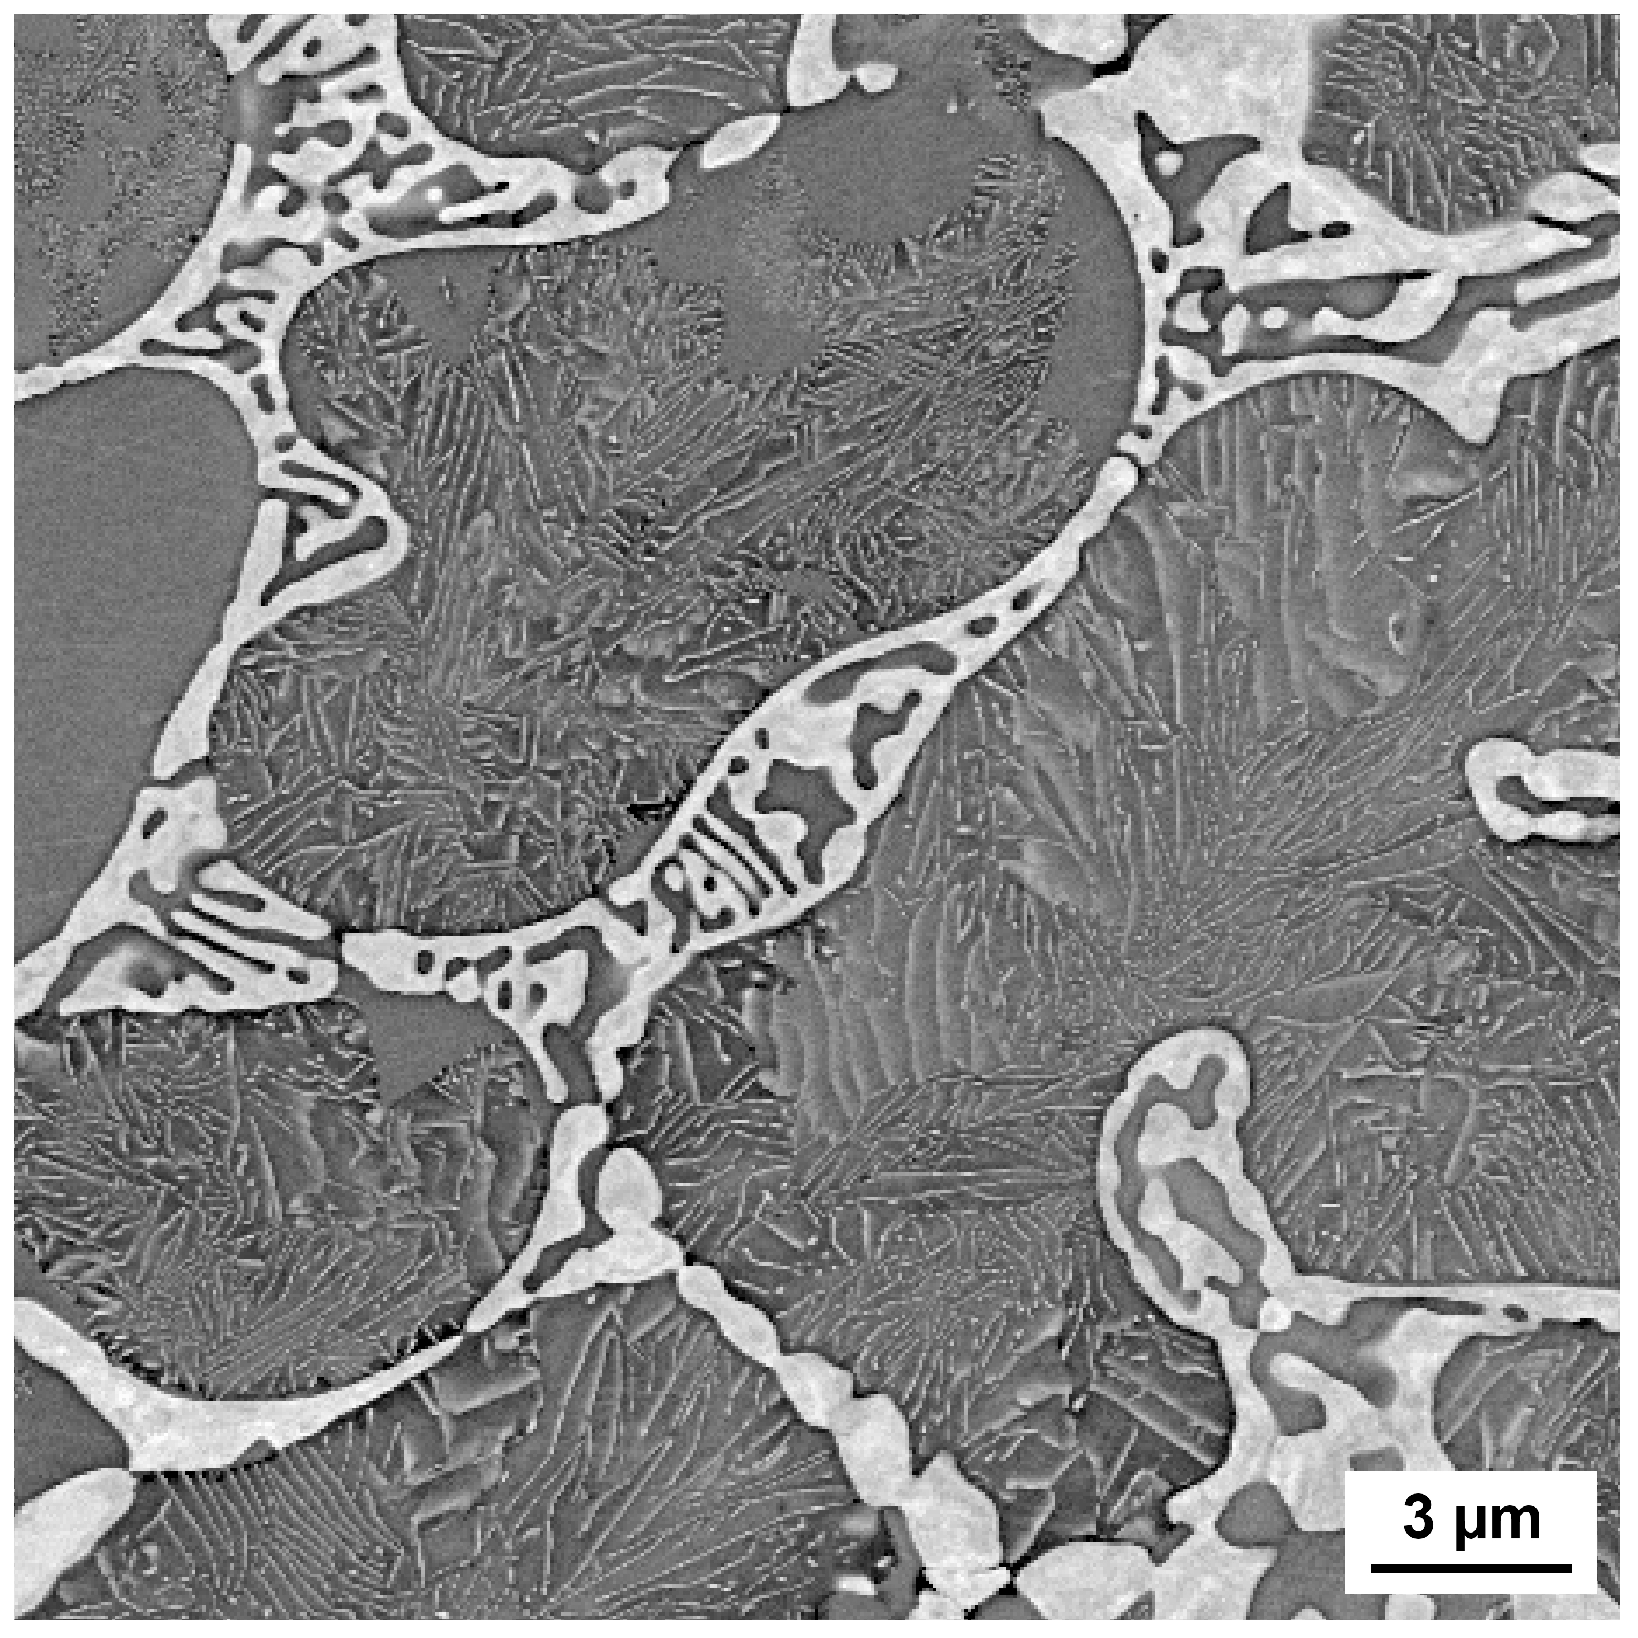
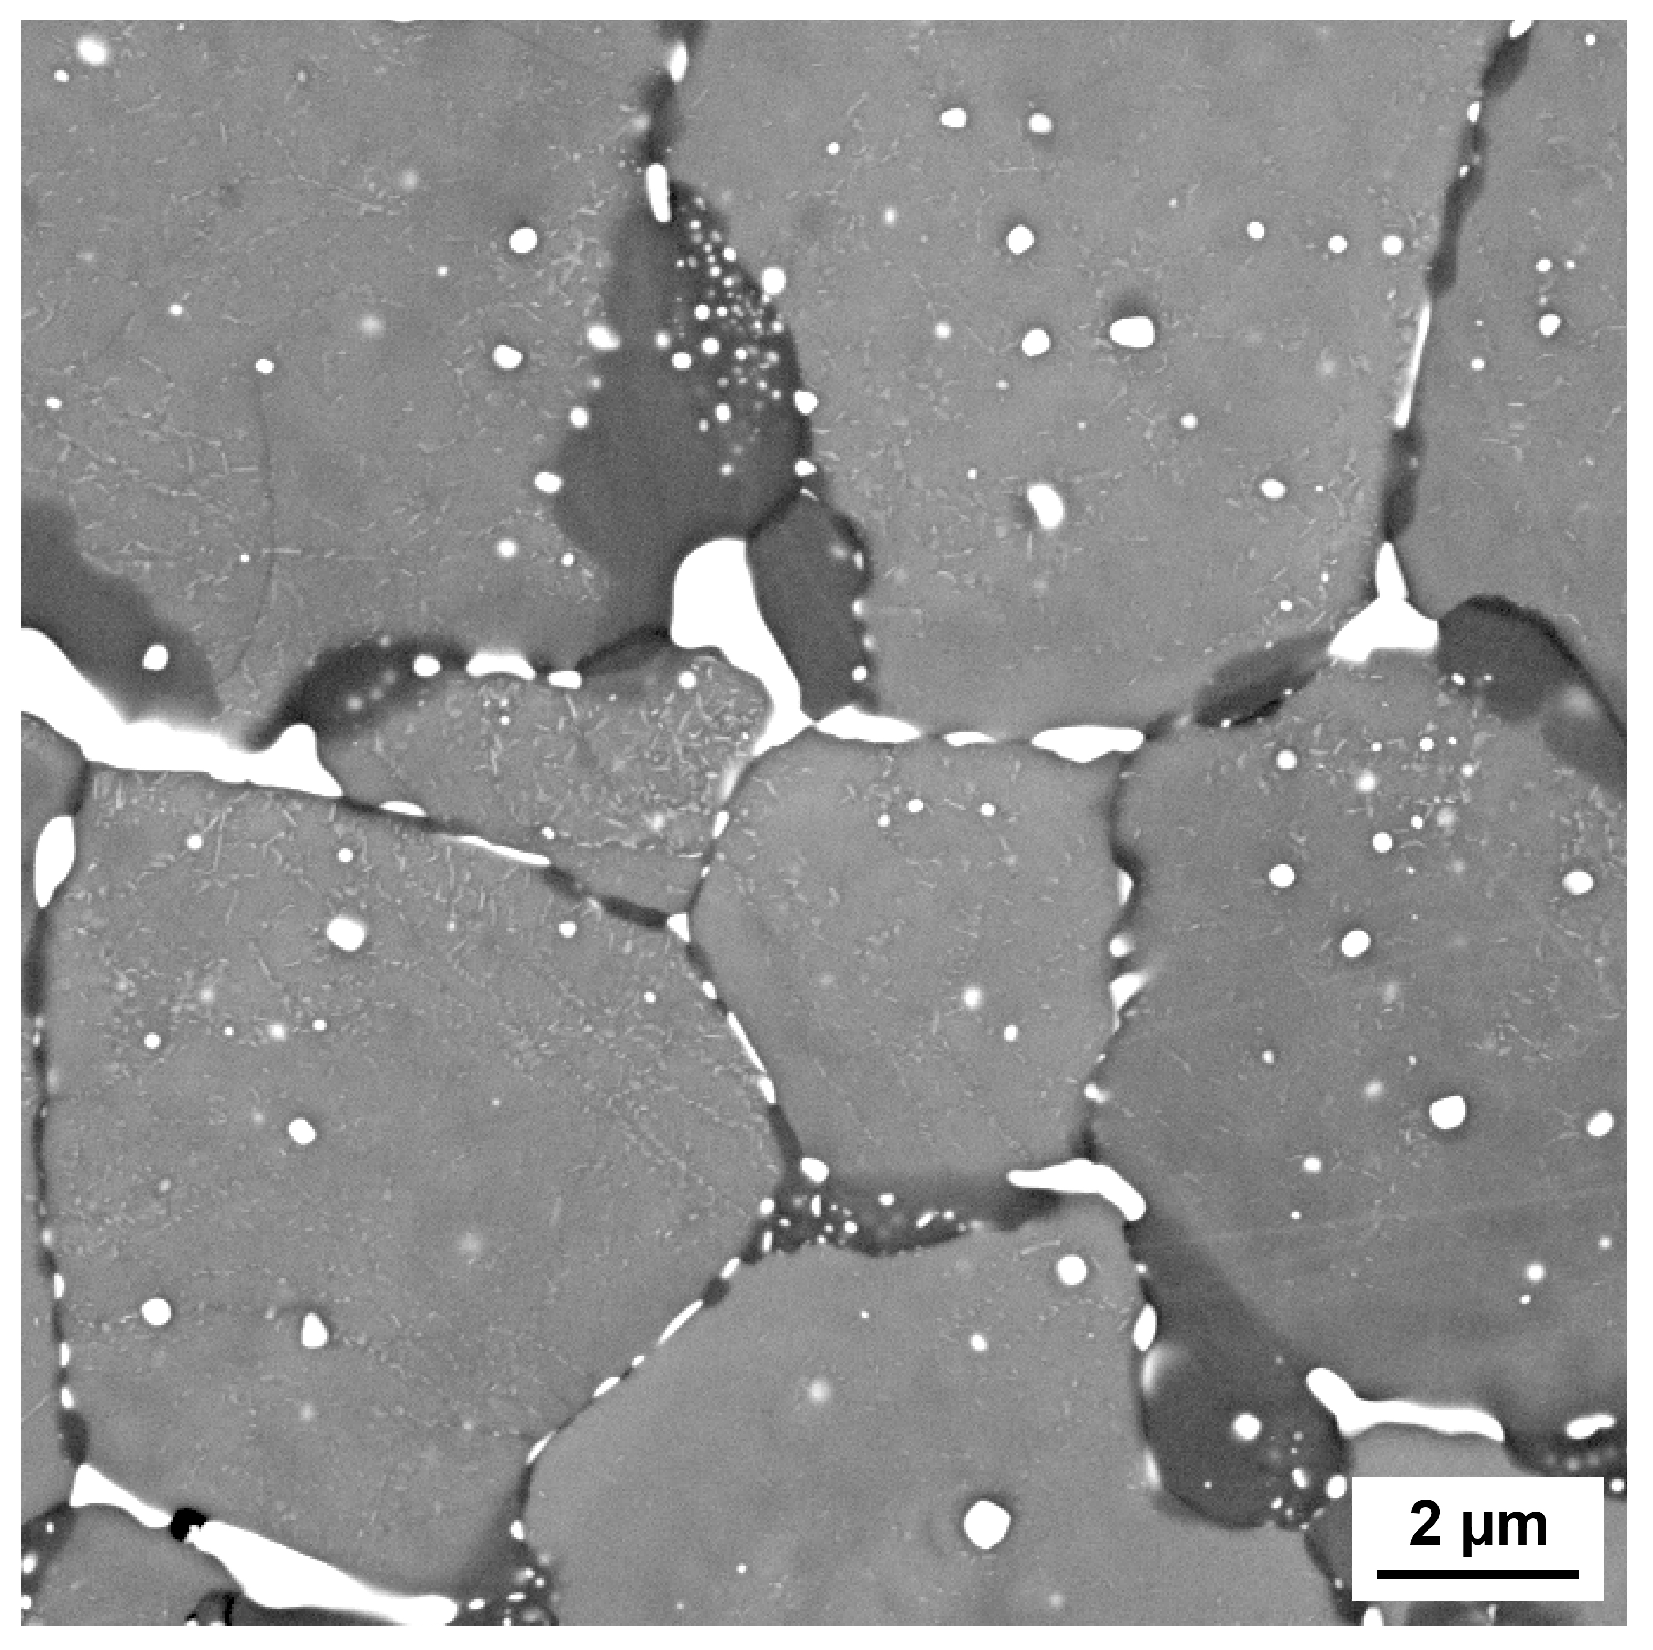
3.2. Screening 2—Influence of Tungsten–Titanium Ratio
4. Discussion
4.1. First Screening—Influence of Carbon Content
4.2. Second Screening—Influence of Tungsten–Titanium Ratio
5. Conclusions
Author Contributions
Funding
Data Availability Statement
Conflicts of Interest
References
- Dedalus Consulting. Global Market Research End User Analysis Database. 2022. Available online: https://www.dedalusconsulting.com/index.php (accessed on 24 March 2025).
- European Commission. Study on the Critical Raw Materials for the EU 2023—Final Report. 2023. Available online: https://op.europa.eu/en/publication-detail/-/publication/57318397-fdd4-11ed-a05c-01aa75ed71a1 (accessed on 11 March 2024).
- Angerer, J. Cobalt und Cobaltverbindungen [BAT Value Documentation in German language, 1989]. In The MAK-Collection for Occupational Health and Safety; Wiley-VCH Verlag GmbH & Co. KGaA: Weinheim, Germany, 2002; pp. 1–13. ISBN 3527600418. [Google Scholar]
- Uhlmann, E.; Bergmann, A.; Gridin, W. Investigation on Additive Manufacturing of Tungsten Carbide-cobalt by Selective Laser Melting. Procedia CIRP 2015, 35, 8–15. [Google Scholar] [CrossRef]
- Fortunato, A.; Valli, G.; Liverani, E.; Ascari, A. Additive Manufacturing of WC-Co Cutting Tools for Gear Production. Lasers Manuf. Mater. Process. 2019, 6, 247–262. [Google Scholar] [CrossRef]
- Genilke, S.; Wilms, M.B.; Seimann, M.; Weisheit, A.; Fries, S.; Kaletsch, A.; Bergs, T.; Schleifenbaum, J.H.; Broeckmann, C. Laser based Additive Manufacturing of WC-Co with High Temperature Powder Bed Pre-Heating. In Proceedings of the TOOLING 2019 Conference & Exhibition, Aachen, Germany, 12–16 May 2019; TEMA Technologie Marketing AG: Aachen, Germany, 2019. [Google Scholar]
- Kumar, S.; Czekanski, A. Optimization of parameters for SLS of WC-Co. RPJ 2017, 23, 1202–1211. [Google Scholar] [CrossRef]
- Khmyrov, R.S.; Safronov, V.A.; Gusarov, A.V. Obtaining Crack-free WC-Co Alloys by Selective Laser Melting. Phys. Procedia 2016, 83, 874–881. [Google Scholar] [CrossRef]
- García, J.; Collado Ciprés, V.; Blomqvist, A.; Kaplan, B. Cemented carbide microstructures: A review. Int. J. Refract. Met. Hard Mater. 2019, 80, 40–68. [Google Scholar] [CrossRef]
- Uhrenius, B. Calculation of the Ti-C, W-C and Ti-W-C phase diagrams. Calphad 1984, 8, 101–119. [Google Scholar] [CrossRef]
- Haldar, B.; Bandyopadhyay, D.; Sharma, R.C.; Chakraborti, N. The Ti-W-C (Titanium-Tungsten-Carbon) System. JPE 1999, 20, 337–343. [Google Scholar] [CrossRef]
- Hofmeister, W.; Costa, L.; Rajput, D.; Lansford, K. Cast carbide-metal composite components via laser based solid freeform fabrication. In International Congress on Applications of Lasers & Electro-Optics, Proceedings of the ICALEO® 2007: 26th International Congress on Laser Materials Processing, Laser Microprocessing and Nanomanufacturing, Orlando, FL, USA, 29 October–1 November 2007; Laser Institute of America: Orlando, FL, USA, 2007; p. 406. ISBN 978-0-912035-88-8. [Google Scholar]
- DIN EN ISO 6507-1:2005; Metallische Werkstoffe—Härteprüfung nach Vickers. DIN Deutsches Institut für Normung e.V.: Berlin, Germany, 2005.
- ISO 28079:2009; Hardmetals—Palmqvist Toughness Test. International Standard Organization: Geneva, Switzerland, 2009.
- Roebuck, B.; Bennett, E.; Lay, L.; Morrell, R. Palmqvist Toughness for Hard and Brittle Materials. Meas. Good Pract. Guide 2008, 9, 48. [Google Scholar]
- Reva, V.P.; Mansurov, Y.N.; Kuryavyi, V.G.; Petrov, V.V.; Kim, V.A. Manufacture of stronger hard-alloy cutting plates. Russ. Eng. Res. 2015, 35, 841–845. [Google Scholar] [CrossRef]
- Rudy, E. Constitution of ternary titanium-tungsten-carbon alloys. J. Less Common Met. 1973, 33, 245–273. [Google Scholar] [CrossRef]
- Ivashchenko, V.I.; Čaplovič, Ľ.; Shevchenko, V.I.; Gorb, L.; Leszczynski, J. Stability and mechanical, thermodynamic and optical properties of WC polytypes and the TiC-WC solid solutions: A first-principles study. J. Phys. Chem. Solids 2023, 183, 111652. [Google Scholar] [CrossRef]
- Bauccio, M. (Ed.) ASM Engineering Materials Reference Book, 2nd ed.; ASM International: Novelty, OH, USA, 1995; ISBN 0871705028. [Google Scholar]
- Groover, M.P. Fundamentals of Modern Manufacturing: Materials, Processes, and Systems, 4th ed.; J. Wiley & Sons: Hoboken, NJ, USA, 2010; ISBN 0-470-46700-2. [Google Scholar]
- Gottstein, G. Materialwissenschaft und Werkstofftechnik: Physikalische Grundlagen, 4th ed.; Springer Vieweg: Berlin/Heidelberg, Germany, 2014; ISBN 978-3-642-36603-1. [Google Scholar]


| Sample | W at.%|wt.% | C at.%|wt.% | Ti at.%|wt.% |
|---|---|---|---|
| 10 at.% C | 45.0|78.4 | 10.0|1.1 | 45.0|20.4 |
| 15 at.% C | 42.5|77.9 | 15.0|1.8 | 42.5|20.3 |
| 20 at.% C | 40.0|77.3 | 20.0|2.5 | 40.0|20.1 |
| 25 at.% C | 37.5|76.7 | 25.0|3.3 | 37.5|20.0 |
| 30 at.% C | 35.0|76.0 | 30.0|4.3 | 35.0|19.8 |
| 35 at.% C | 32.5|75.2 | 35.0|5.3 | 32.5|19.6 |
| Sample | W at.%|wt.% | C at.%|wt.% | Ti at.%|wt.% |
|---|---|---|---|
| W/Ti 10:90 | 6.5|27.06 | 35.0|9.52 | 58.5|63.42 |
| W/Ti 20:80 | 13.0|45.10 | 35.0|7.93 | 52.0|46.97 |
| W/Ti 30:70 | 19.5|57.98 | 35.0|6.80 | 45.5|35.22 |
| W/Ti 40:60 | 26.0|67.63 | 35.0|5.29 | 39.0|26.42 |
| W/Ti 50:50 | 32.5|75.20 | 35.0|5.30 | 32.5|19.60 |
| W/Ti 60:40 | 39.0|81.15 | 35.0|4.76 | 26.0|14.09 |
| Type | Name | Manufacturer | Grain Size | Purity |
|---|---|---|---|---|
| W | W0.7 µm | Wolfram Bergbau- und Hütten AG (Mittersill, Austria) | 0.7–0.8 µm (FSSS) | 99.0% |
| WC | Tungsten Carbide DS100 | Global Tungsten & Powders (Towanda, PA, USA) | 1.0–1.2 µm (FSSS) | 99.0% |
| Ti | Amperit 155.086 | Höganäs Germany GmbH (Goslar, Germany) | ≤63 µm | 98.8% |
| TiC | STD120 | H.C. Starck Surface Technology and Ceramic Powders GmbH (Munich, Germany) | 1.0–1.5 µm (FSSS) | 98.5% |
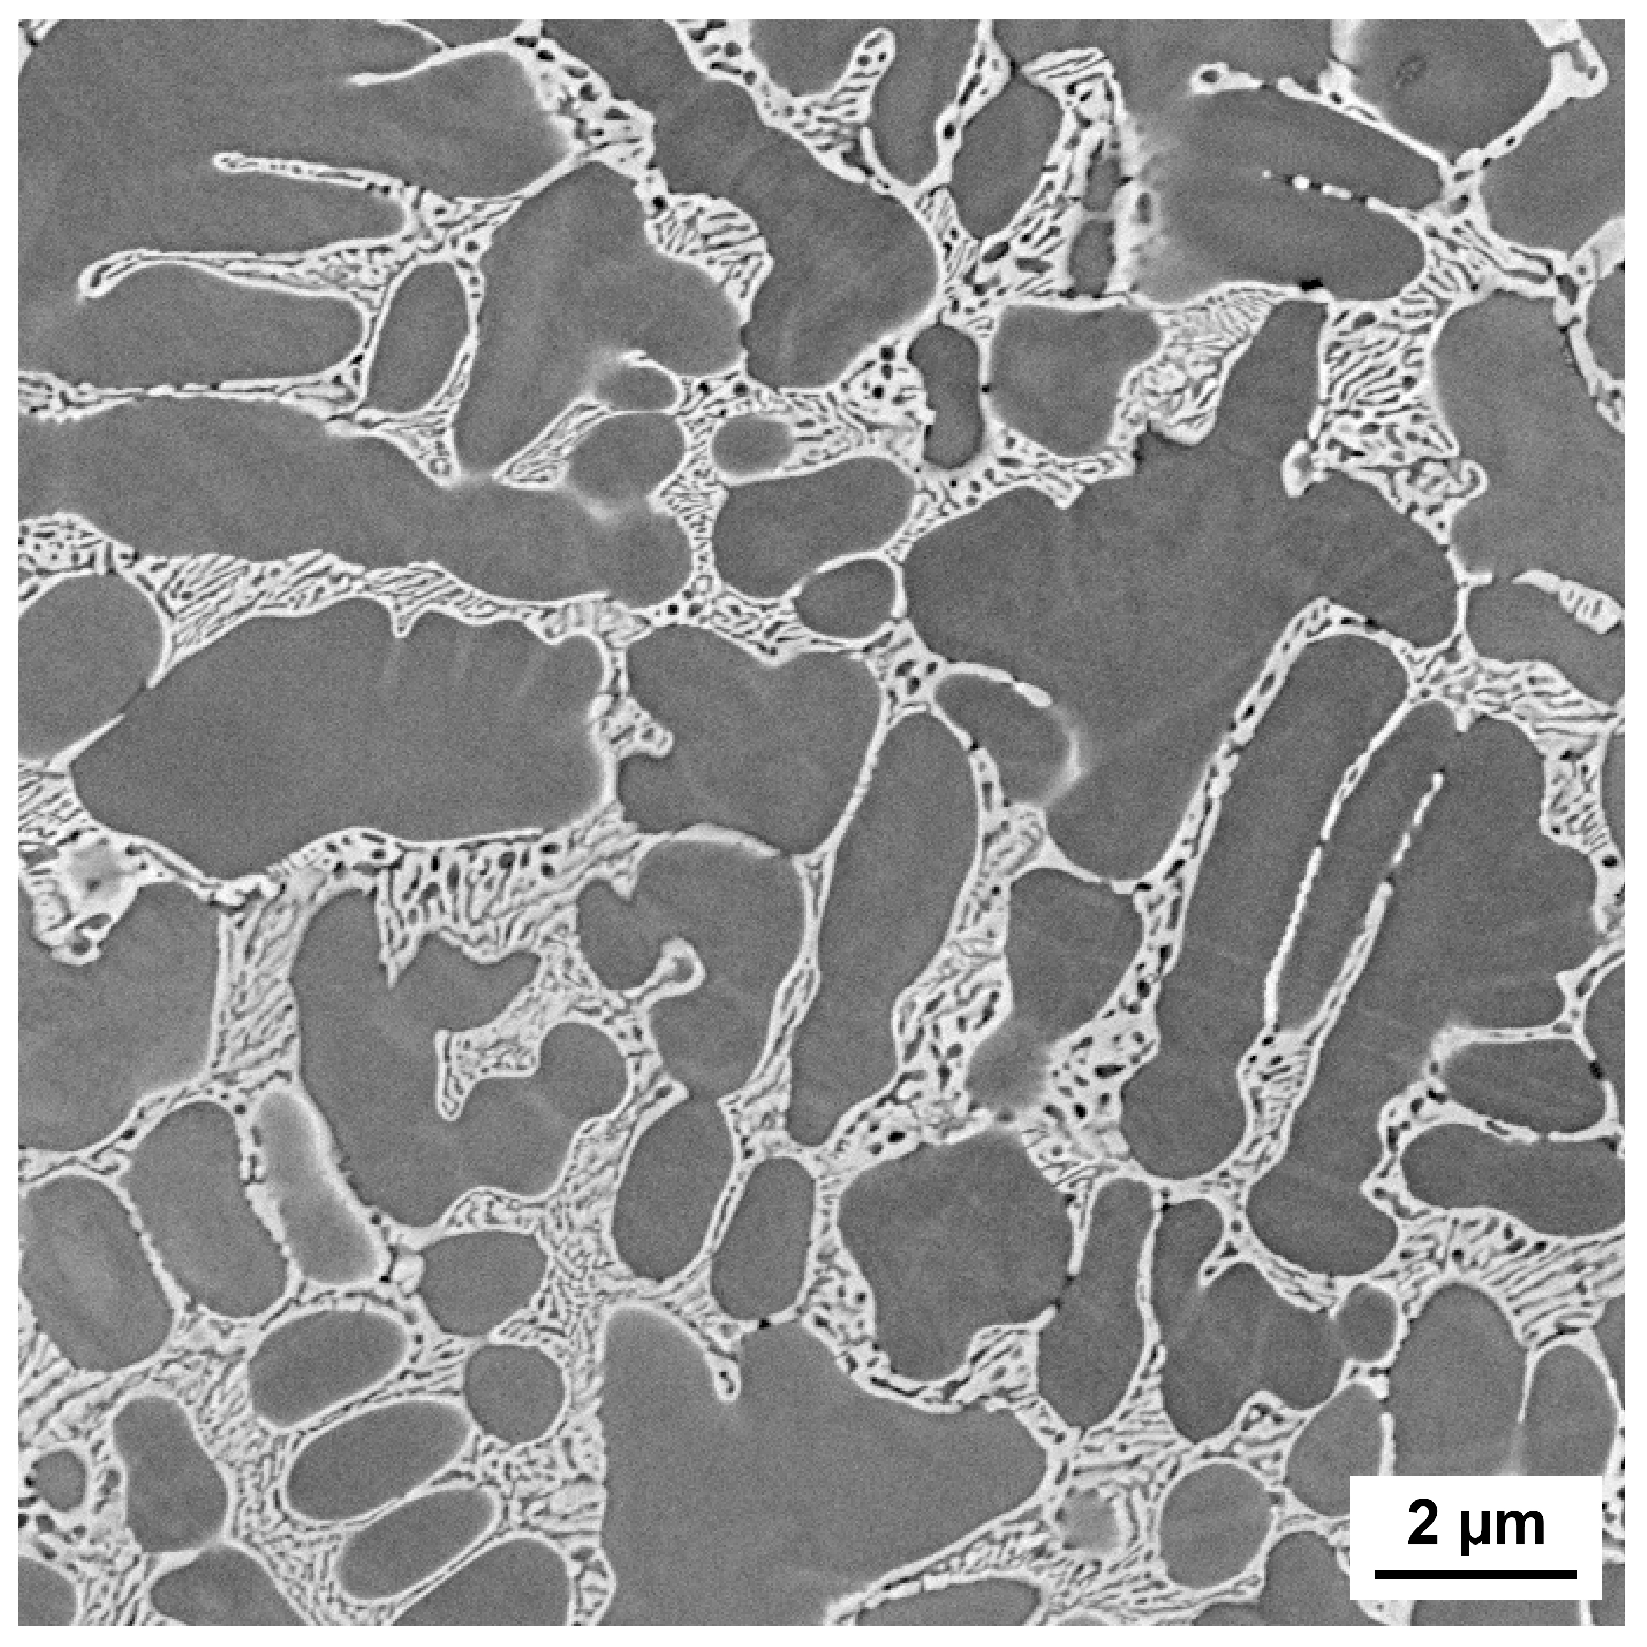
| Phase | C at.% | W at.% | Ti at.% |
|---|---|---|---|
| Light | - | 87.5 ± 1.79 | 12.5 ± 1.79 |
| Dark grey | 66.3 ± 0.24 | 12.6 ± 0.15 | 21.1 ± 0.19 |
Disclaimer/Publisher’s Note: The statements, opinions and data contained in all publications are solely those of the individual author(s) and contributor(s) and not of MDPI and/or the editor(s). MDPI and/or the editor(s) disclaim responsibility for any injury to people or property resulting from any ideas, methods, instructions or products referred to in the content. |
© 2025 by the authors. Licensee MDPI, Basel, Switzerland. This article is an open access article distributed under the terms and conditions of the Creative Commons Attribution (CC BY) license (https://creativecommons.org/licenses/by/4.0/).
Share and Cite
Schubert, T.; Malchus, C.; Schurr, J.; Wengenmayr, E.; Bernthaler, T.; Schneider, G. Process Studies on the W-C-Ti System Using a High-Throughput Laser-Based Additive Manufacturing Approach. Metals 2025, 15, 664. https://doi.org/10.3390/met15060664
Schubert T, Malchus C, Schurr J, Wengenmayr E, Bernthaler T, Schneider G. Process Studies on the W-C-Ti System Using a High-Throughput Laser-Based Additive Manufacturing Approach. Metals. 2025; 15(6):664. https://doi.org/10.3390/met15060664
Chicago/Turabian StyleSchubert, Tim, Christiana Malchus, Julian Schurr, Emanuel Wengenmayr, Timo Bernthaler, and Gerhard Schneider. 2025. "Process Studies on the W-C-Ti System Using a High-Throughput Laser-Based Additive Manufacturing Approach" Metals 15, no. 6: 664. https://doi.org/10.3390/met15060664
APA StyleSchubert, T., Malchus, C., Schurr, J., Wengenmayr, E., Bernthaler, T., & Schneider, G. (2025). Process Studies on the W-C-Ti System Using a High-Throughput Laser-Based Additive Manufacturing Approach. Metals, 15(6), 664. https://doi.org/10.3390/met15060664