Article

Preparation of Small-Sized and Uniformly Distributed SnO by Ultrasound at Room Temperature

1
State Key Laboratory of Complex Non-ferrous Metal Resources Clean Utilization, Kunming University of Science and Technology, Kunming 650093, China
2
Faculty of Metallurgical and Energy Engineering, Kunming University of Science and Technology, Kunming 650093, China
*
Authors to whom correspondence should be addressed.
Metals 2025, 15(6), 643; https://doi.org/10.3390/met15060643
Submission received: 14 May 2025 / Revised: 5 June 2025 / Accepted: 7 June 2025 / Published: 9 June 2025

Abstract

A novel ultrasound-assisted method for synthesizing small, uniform stannous oxide (SnO) at room temperature was proposed in this work. The experimental results showed that the median particle size D50 of SnO prepared by ultrasound was 5.2 μm, with a particle size distribution ranging from 2.9 to 8.7 μm and exhibiting a homogeneous micromorphology. This solves the problems of a median particle size D50 higher than 20 μm, a wide range of particle size distributions, and uneven micromorphology in conventional preparation. The XRD and SEM results revealed that the introduction of ultrasound promoted the conversion of the intermediate product Sn6O4(OH)4 to SnO, increased the exposure of the (001) and (002) crystal facets, promoted tetragonal growth, and suppressed particle aggregation, leading to finer and more uniformly distributed stannous oxide particles. BET and XPS analyses further demonstrated that ultrasound increased the specific surface area and the O-Sn2+ content, indicating enhanced surface reactivity.

1. Introduction

Stannous oxide (SnO) is an important p-type semiconductor oxide. The reversible transition between p-type and n-type conductivity can be achieved through precise modulation of the oxygen vacancy concentration, elemental doping, or external stimuli such as light and electric fields [1,2]. This unique property endows SnO with significant potential for applications in photoelectric devices, gas sensors, and catalysis [3,4]. In photoelectric applications, the high visible-light transparency and oxygen vacancy-dependent band structure of SnO, combined with carrier concentration modulation induced by the p-n transition, significantly enhance the performance of solar cells and photodetectors [5]. In gas sensing, p-n reversibility modulates electrical conductivity, and when combined with the chemical adsorption of reducing gases at surface oxygen vacancy sites, it enables high sensitivity and rapid response detection [6]. In catalytic applications, the high density of surface oxygen vacancies, their p-n conversion, and regulated electron transfer capability make SnO highly effective in redox reactions [7].
The size and uniformity of stannous oxide particles play important roles in their downstream application effects. As the particle size of stannous oxide decreases, its surface area per unit volume increases, providing more reactive sites and thereby enhancing the sensitivity of gas sensors. In the field of photocatalysis, smaller-sized stannous oxide particles exhibit superior catalytic performance due to their higher specific surface area and enhanced light-absorbing capabilities [8]. In addition, smaller particle sizes and improved uniformity contribute to higher ion diffusion rates and reduced electrochemical polarization, which are essential for improving the performance of stannous oxide in battery applications [9]. However, despite extensive research on the preparation of nanoscale stannous oxides, their practical use is hindered by issues such as clogging, agglomeration, and challenges in recycling. Jain et al. [10] reported that the use of nanoscale stannous oxide as an electrode material still has disadvantages such as low coulombic efficiency of the first cycle, poor volumetric performance, low mass loading, complex manufacturing processes and high costs. In contrast, micron-sized stannous oxides are more suitable for industrial applications due to their better cycling stability and mechanical strength [10,11]. Therefore, the aim of this study is to synthesize stannous oxides with smaller particle sizes in the micron-sized class.
Stannous oxide can be synthesized through various methods, including pulsed laser deposition, magnetron sputtering, hydrothermal synthesis, and sol–gel techniques. Among these methods, hydrothermal synthesis is the main method for preparing micron-sized stannous oxides due to its superior product yield, high crystallinity, and excellent process controllability [12]. However, existing techniques for hydrothermal synthesis often result in uneven particle size distributions and excessively large particles, which limit their application potential [13,14]. To address these challenges, numerous studies have been conducted to control the particle size of stannous oxide. Iqbal et al. [15] prepared SnO powders by the hydrothermal method and obtained samples with mean particle sizes ranging from 10 to 14 μm, but this process requires high-temperature conditions (230 °C) in an autoclave. Qin et al. [16] used ionic liquid microwave-assisted methods to prepare SnO with a mean particle size of 40 μm. Uchiyama et al. [17] obtained SnO samples with mean particle sizes of 10–20 μm using SnF2 and NaOH as raw materials in a gelatin-containing aqueous solution after hydrothermal treatment at 150 °C for 24 h. These methods generally have problems such as high energy consumption and large average particle size.
In recent years, ultrasound has been increasingly used in compound synthesis. The high-frequency vibration of ultrasound can produce a strong mechanical effect [18,19], which enhances the micro-mixing effect, shortens the mixing time, and improves the nucleation rate, thereby obtaining smaller particle sizes. Ultrasound forms tiny bubbles in the solution, and these bubbles vibrate and burst rapidly under the action of sound waves, generating a strong impact force, thus contributing to the refinement of the formed crystal particles. In addition, ultrasound can effectively break the crystal structure, making the product particles uniformly dispersed in the solvent, which helps the abrasion and fracture of the formed particles and avoids the aggregation of large particles. As a result, it has a greater advantage in reducing the size of the product particle size and improving its uniformity. Gielen et al. [20] investigated the effect of ultrasound on controlling the particle size distribution of acetaminophen crystals and reported that the introduction of ultrasound reduced the crystal size by about 30 μm compared to conventional conditions. Furusawa et al. [21] used ultrasound to synthesize bismuth–indium alloy particles and reported that there was a significant correlation between the ultrasonic time and the particle size, which decreased with increasing ultrasonic time. The average particle size after 30 min of reaction was 4.2 μm, whereas the average particle size after 60 min of reaction was 3.3 μm. In a study by Belca et al. [22], the crystallization of the active pharmaceutical ingredient Tegretol was facilitated using ultrasonic technology. The results indicated that the ultrasound-facilitated crystallization process significantly improved key aspects of crystallization, such as nucleation rates, crystal enlargement, and filtration duration, outperforming traditional techniques. In addition, ultrasonic technology can effectively mitigate particle agglomeration, reduce energy waste, and avoid depolymerization problems in the conventional crystallization process. Liu [23] investigated the impact of ultrasonic vibration on the dispersion and phase structure of WC-enhanced particles in laser-melted Ni60/WC composite coatings. The study revealed that ultrasound significantly improved the deposition of WC particles in the coatings, with the optimal distribution of tungsten carbide particles observed at an ultrasonic power of 600 W. Therefore, investigating the influence of ultrasonic treatment on the regulation of stannous oxide particle dimensions is of significant importance.
Stannous oxide with controlled particle size and uniform distribution is crucial for advanced applications. This work developed a novel ultrasound-assisted room-temperature synthesis method that eliminates the need for additional heating while achieving SnO particle size regulation. The effects of key parameters on particle size under ultrasound were investigated, process parameters were optimized, and the mechanism of ultrasound-mediated particle size control was elucidated.

2. Experimental

2.1. Materials

The stannous chloride dihydrate (SnCl2·2H2O, AR) used in this work was from Shanghai Zhan Yun Chemical Co. Ltd., Shang Hai, China, sodium hydroxide (NaOH, AR) was from Tianjin Zhiyuan Chemical Reagent Co., Ltd., Tianjin, China, and deionized water was made in our laboratory.

2.2. Experimental Procedure

The experimental flowchart for the preparation of stannous oxide by ultrasound is shown in Figure 1. First, 0.5 mol/L stannous chloride (SnCl2·2H2O) solution and 2 mol/L sodium hydroxide (NaOH) solution were prepared. Then, 100 mL of sodium hydroxide solution was added dropwise to 100 mL of stannous chloride solution. The ultrasonic rod was placed in the solution and operated at a specific power. In this research work, the sole distinction between conventional and ultrasonic methods was the presence or absence of ultrasound, with all other parameters remaining identical.
During the experiment, the key parameters, namely reaction temperature and ultrasonic power density, were monitored and adjusted using numerical control equipment. With the progress of the reaction, the color of the solution gradually changed from white to dark blue or dark gray. The solution was subjected to filtration to obtain a black-gray solid. The precipitate was subsequently isolated via centrifugation, rinsed with distilled water, and then dried at 60 °C for 24 h. The effects of the reaction endpoint pH (7, 9, 11, 13, and 14), reaction temperature (20, 30, 40, 50, and 60 °C), constant-temperature time (1, 8, 20, and 30 min), and ultrasonic power (540, 720 900, 1080, and 1260 W) on the particle size of the stannous oxide were investigated. The effects of the endpoint pH, reaction temperature, and constant-temperature time were first investigated at a fixed ultrasonic power of 900 W (determined to be optimal for controlling the particle size in preliminary tests). Subsequent ultrasonic power optimization was performed using the determined optimal conditions.
In this research, a laboratory-developed ultrasonic apparatus operating at a frequency of 20 kHz and a maximum power output of 1800 W was utilized. The ultrasonic power was adjusted by varying the percentage of the total power output.

2.3. Analytical Methods

The phase composition of the solid product was analyzed by an X-ray diffractometer (Rigaku Miniflex 600, Cu target, scanning speed of 5°/min, scanning range of 10–80°, Rigaku Corporation, Tokyo, Japan). The XRD data were analyzed using MDI Jade (Materials Data, Inc., Livermore, CA, USA, version 6.0). A Zeiss ordinary inverted fluorescence microscope (Zeiss, Axio Vert. A1. Carl Zeiss AG, Oberkochen, Germany) was employed to analyze the effect of different ultrasonic powers on the breakage of crystals. The particle size and uniformity of the stannous oxide products were determined by a laser particle size detector (Malvern Mastersizer 2000, Malvern Panalytical, Malvern, UK). The morphology of the products was observed by SEM (ZEISS Sigma 300, Carl Zeiss AG, Jena, Germany). The valence changes of tin in the product by XPS (Thermo Scientific K-Alpha, Thermo Fisher Scientific, Waltham, MA, USA) and the functional group structure of the product were analyzed by Fourier Transform Infrared Spectroscopy (Bruker Tensor 27, wavelength range of 400–4000 cm−1, Bruker Corporation, Billerica, MA, USA).
The yield of stannous oxide obtained from the reaction was calculated by weighing the solid product after filtration via Equation (1):
Y = m 1 m 0 × 100 %
where Y represents the stannous oxide yield, m 1 represents the actual mass of stannous oxide, and m 0 represents the theoretical mass of stannous oxide.

3. Results and Discussion

3.1. Effect of Experimental Parameters on the Particle Size

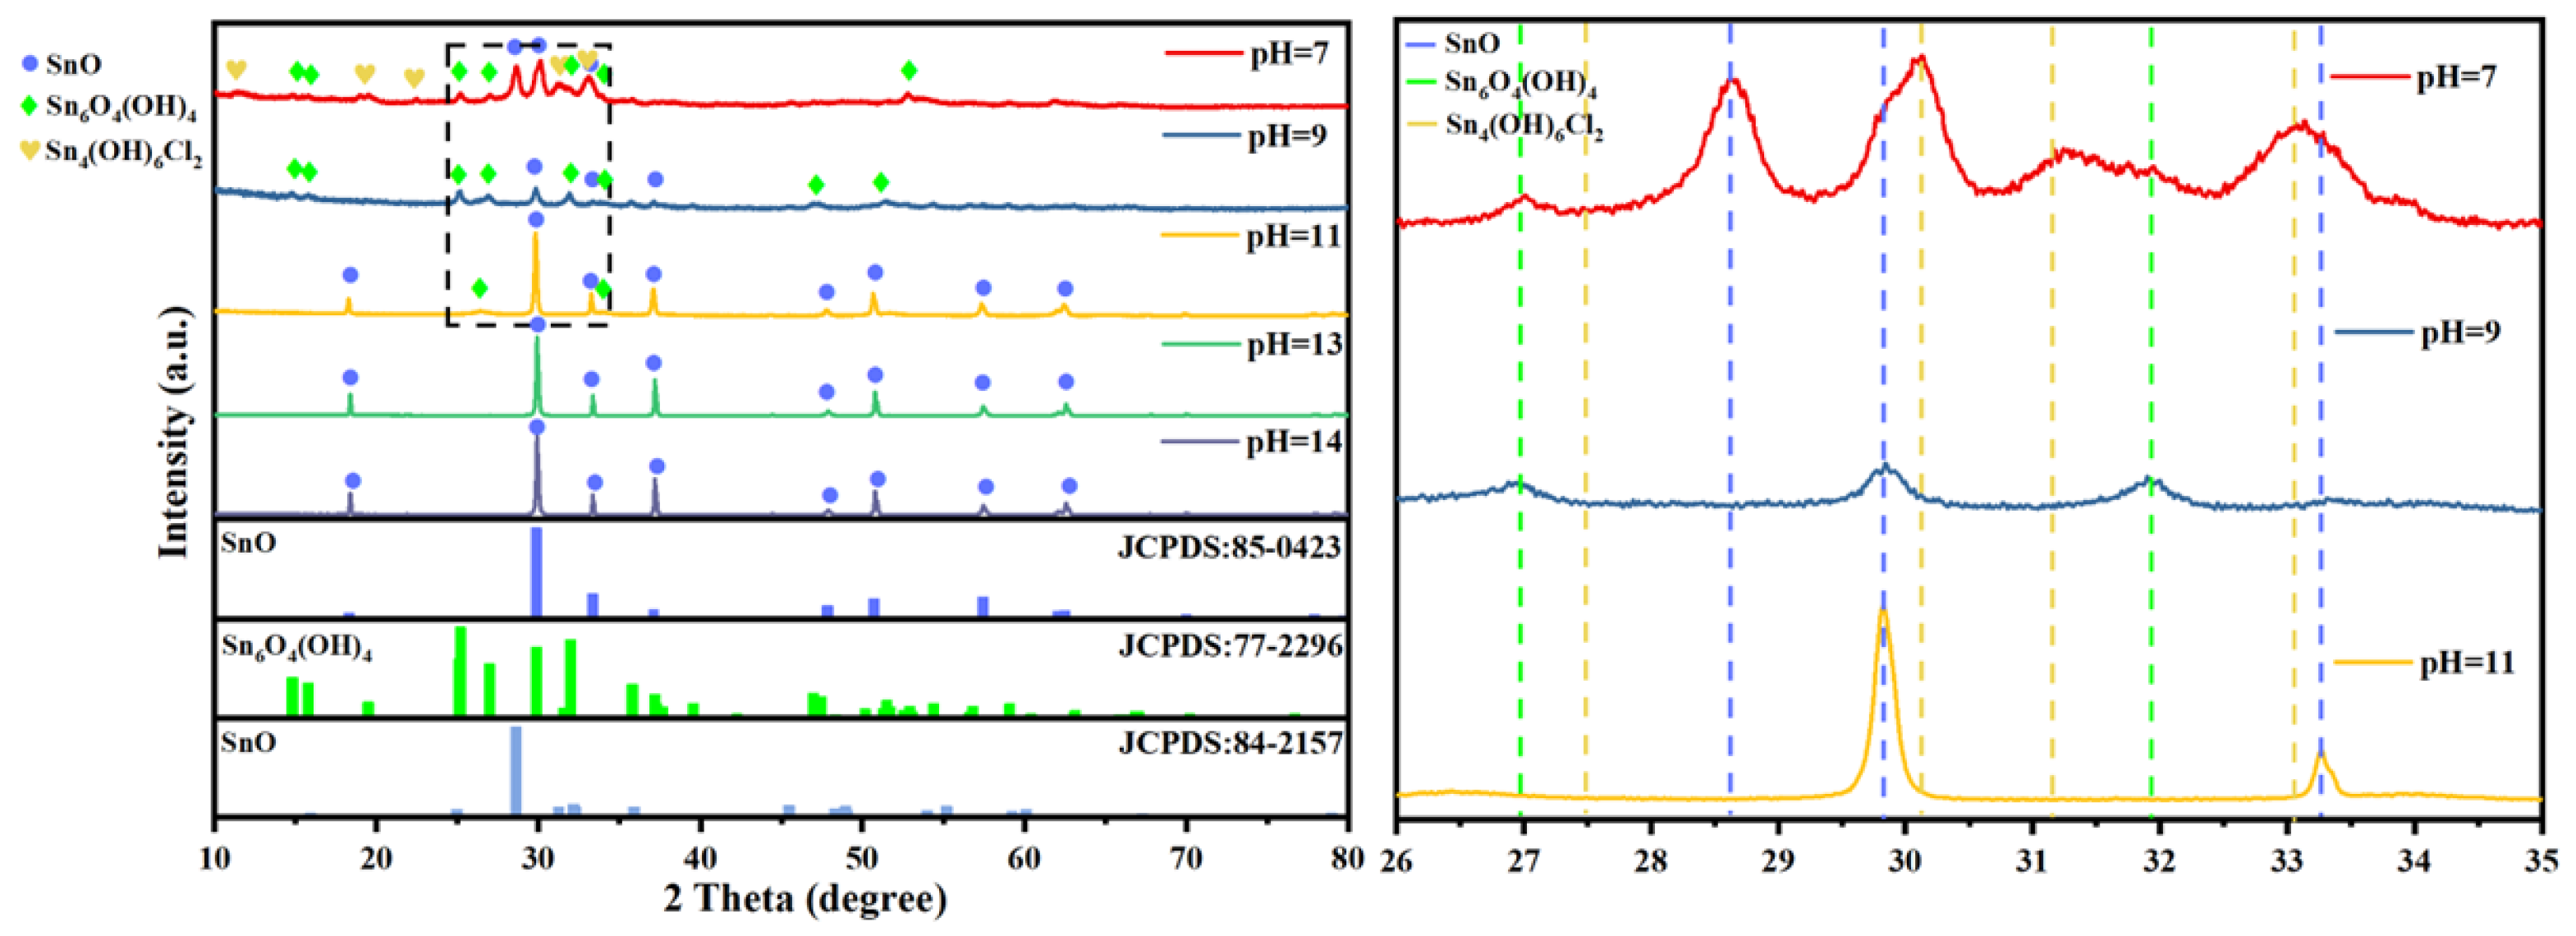
3.1.1. Endpoint pH Value

The endpoint pH value of the reaction was maintained by controlling the addition of NaOH solution and monitoring it in real time. In addition, during the preparation of stannous oxide, the stannous chloride solution gradually transitioned from a milky colloid to an off-white color as sodium hydroxide solution was added, eventually forming a black stannous oxide precipitate. After the formation of black stannous oxide, the reaction continued under specific conditions for a designated period, referred to as the “constant-temperature time”. The effects of different pH values (7, 9, 11, 13, and 14) on the prepared stannous oxide products were investigated at room temperature, with a reaction time of 30 min and an ultrasonic power of 900 W. The actual photographs and XRD results of the solid products obtained at different endpoint pH values are shown in Figure 2 and Figure 3, respectively.
As shown in Figure 2, the product color gradually changes from white to black with increasing pH, which may be due to the transformation of the white intermediate product Sn6O4(OH)4 to the black product SnO. SnCl2 in solution reacts with NaOH to produce the white colloidal precipitate intermediate product Sn6O4(OH)4, as shown in the reaction in Equation (2). The generated Sn6O4(OH)4 is further transformed to SnO under thermal or alkaline conditions:
6 S n C l 2 + 12 N a O H     S n 6 O 4 ( O H ) 4 + 12 N a C l + 4 H 2 O
S n 6 O 4 ( O H ) 4     6 S n O + 2 H 2 O
From the XRD results in Figure 3, at the endpoint pH value of 7, the composition of the solid product was more complex, with the main components being Sn6O4(OH)4, Sn4(OH)6Cl2, SnO, and other substances. And the peak intensities of the intermediate products Sn6O4(OH)4 and Sn4(OH)6Cl2, which are white in color, were obviously higher than those of SnO, which is black in color, resulting in the white color of the product. The formation of Sn4(OH)6Cl2 is due to Reaction (4) in addition to Reactions (2) and (3) in the case of low alkali addition. The formation of Sn4(OH)6Cl2 brings more harmful chloride ions into the final product, SnO, which affects the product quality.
4 S n C l 2 + 6 N a O H     S n 4 ( O H ) 6 C l 2 + 6 N a C l
When the endpoint pH value reached 9, the peak intensities of Sn6O4(OH)4 and SnO increased significantly, the peak intensity of Sn6O4(OH)4 showed a slight increase, and the diffraction peak of Sn4(OH)6Cl2 almost disappeared. These results suggest that the transformation of SnCl2 to Sn6O4(OH)4 and of Sn6O4(OH)4 to black SnO was promoted with the increase in NaOH concentration, and the color of the product became darker and earthy yellow. When the endpoint pH value was 11, the intermediate product Sn6O4(OH)4 was still present, but its diffraction peak was obviously weakened, the main phase was SnO, and the product was black. At a pH value of 13 and above, the intermediate product Sn6O4(OH)4 was completely converted into SnO, the diffraction peak of Sn6O4(OH)4 disappeared completely, and the diffraction peak of SnO could only be observed. This finding indicates that pure stannous oxide products can be obtained at the endpoint pH value of 13. A comparison of the endpoint pH values of 13 and 14 on the prepared stannous oxides revealed that they are basically the same. Considering the cost problem, the endpoint pH = 13 was selected as the optimal condition.

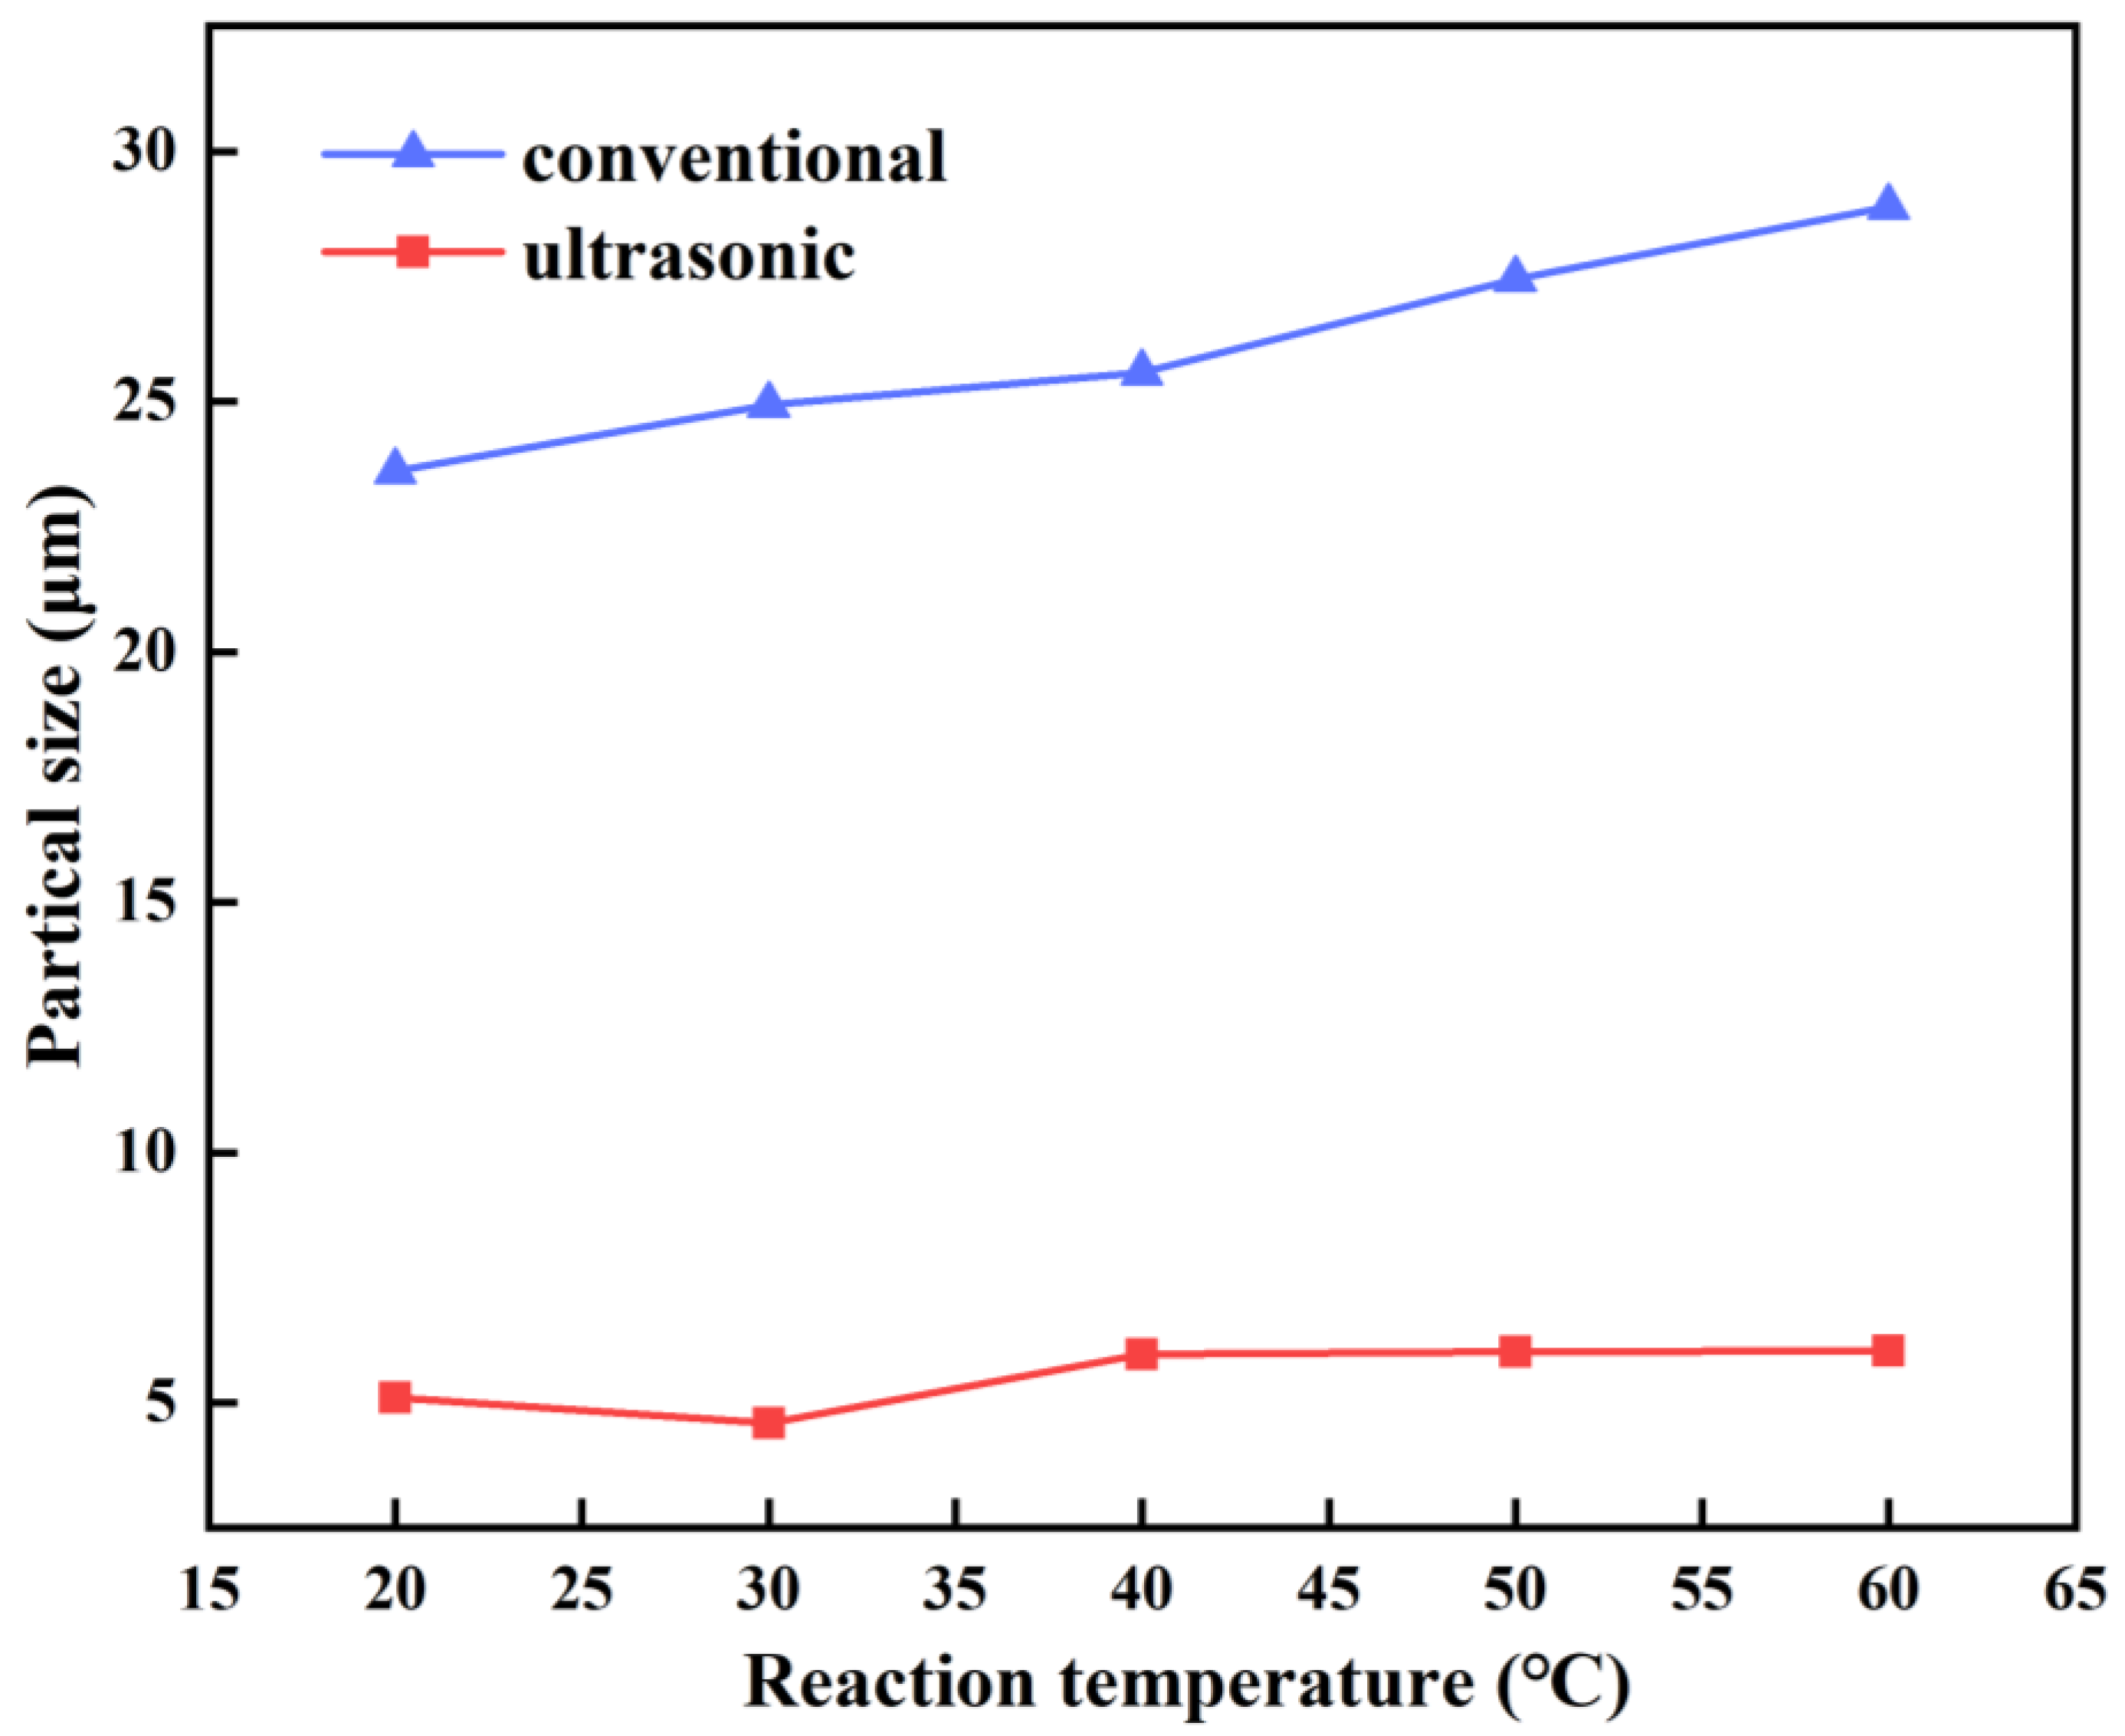
3.1.2. Reaction Temperature

The effects of various reaction temperatures (20, 30, 40, 50 and 60 °C) on the prepared stannous oxide products were investigated at an endpoint pH value of 13, constant-temperature time of 10 min, and ultrasonic power of 900 W. The median particle size D50 of the stannous oxide product obtained at different reaction temperatures under conventional and ultrasonic conditions is shown in Figure 4.
The median particle size D50 of stannous oxide obtained with ultrasound was significantly smaller and more uniform compared to that obtained using conventional methods. The median particle size D50 of the products prepared with ultrasound ranged from 4.6 to 5.2 μm, whereas that of the products prepared with conventional methods ranged from 23.6 to 28.9 μm. This difference can be attributed to the cavitation effect of ultrasound, which generates localized high-temperature and high-pressure environments, facilitating the breakdown of larger crystals and promoting the formation of numerous small nuclei [24]. At the same time, the mechanical effect of ultrasonic waves increases the diffusivity, enhances the micro-mixing, and inhibits the formation of agglomerates, resulting in smaller and more uniform particles.
In addition, the effect of temperature on the particle size of the product under ultrasonic conditions is not as strong as that under conventional conditions. Under conventional preparation conditions, the median particle size D50 increased from 23.6 to 28.9 μm as the temperature was raised from room temperature to 60 °C. This is because the increase in temperature during conventional preparation leads to a faster growth rate of stannous oxide crystals relative to the nucleation rate [25], resulting in larger particles. Wang et al. [26] studied the control of particle size and morphology of stannous oxide nano powder via the conventional hydrothermal synthesis method, and reported that the particle size of the powder increased with the increase in temperature, from 6.2 nm at 160 °C to 120 nm at 220 °C. In the presence of ultrasound, the median particle size of the product is relatively stable in the range of 4.6–5.2 μm at the temperature range of room temperature to 60 °C. Similarly, Al-Attri et al. [27] observed the synthesis of MIL-53(Al) with pure crystallinity and stable particle sizes ranging from 0.7 to 0.93 μm using ultrasonic-assisted synthesis at 150 °C for 6 h. This may be because ultrasound acts more on the nucleation stage rather than on the growth stage [28], coupled with the mechanical effect of ultrasound on crystal fragmentation, leading to elevated temperatures under ultrasound not having a significant effect on the size of crystals.
The effect of temperature on product particle size under ultrasonic conditions was minimal. Although the median particle size D50 of stannous oxide decreased slightly from 5.0 μm to 4.6 μm when the temperature increased from room temperature to 30 °C, increasing the temperature increased the energy consumption and cost. Therefore, room temperature (without external heating) was selected as the optimal preparation temperature.

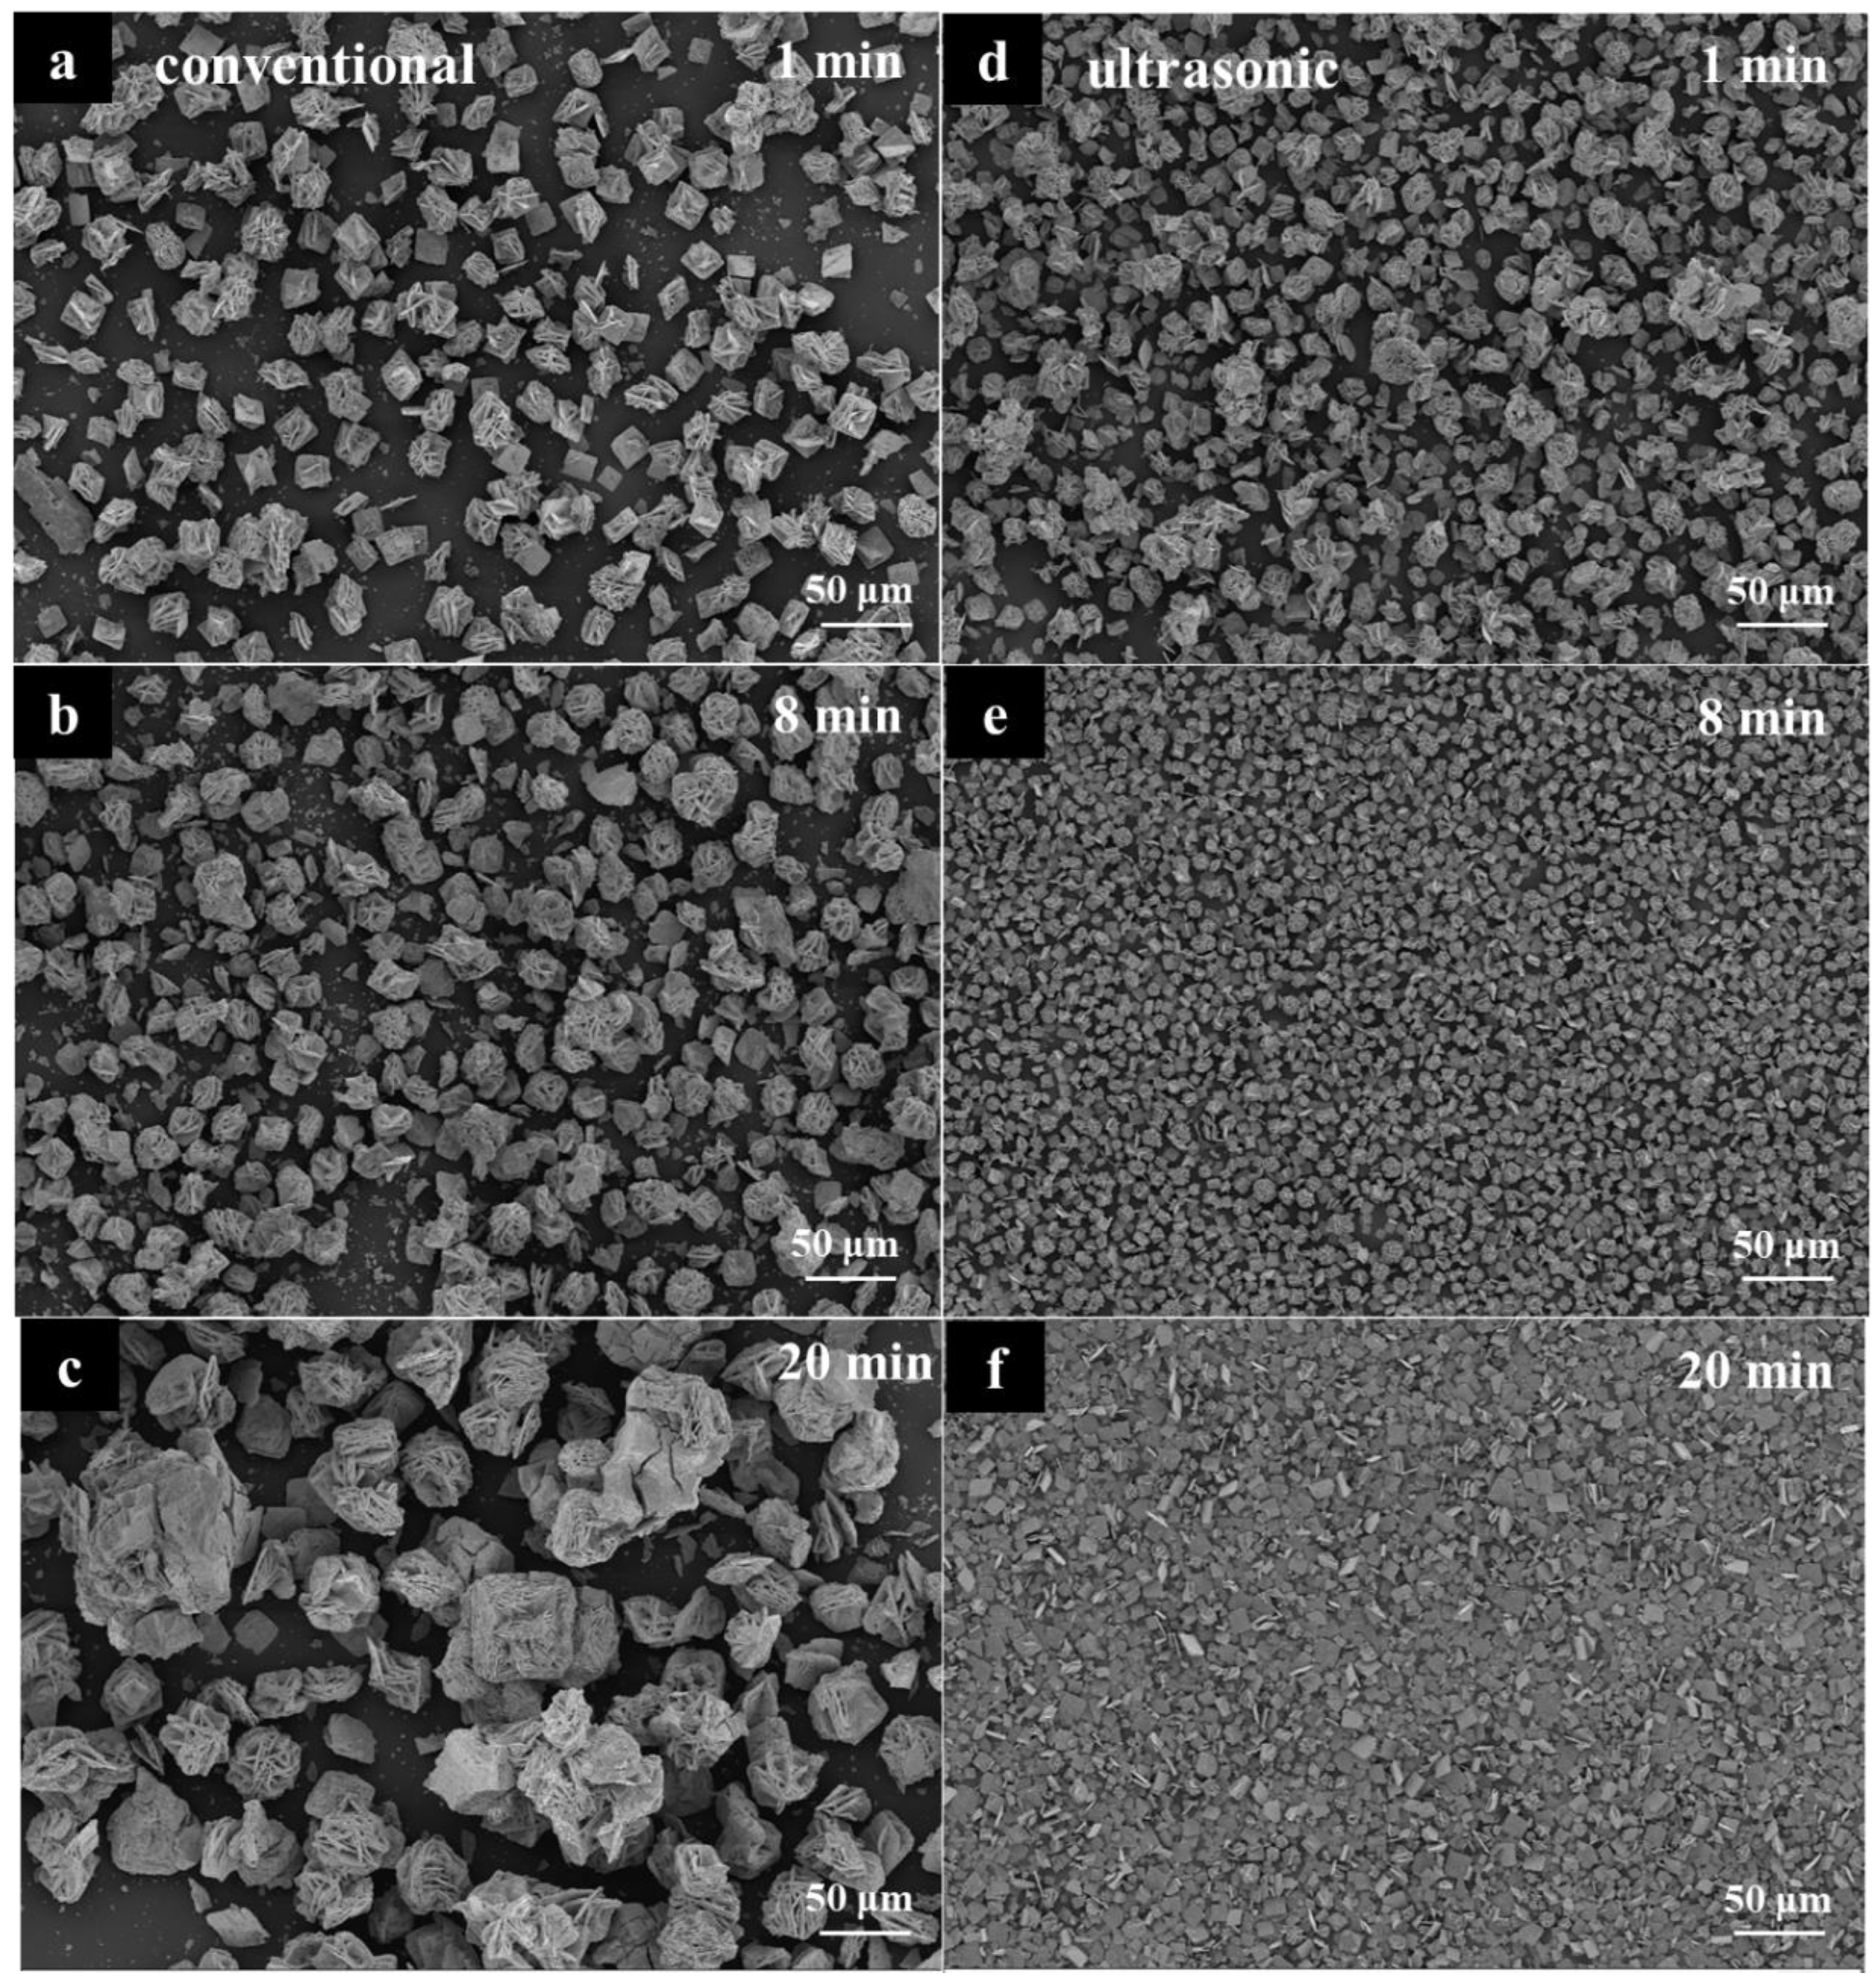
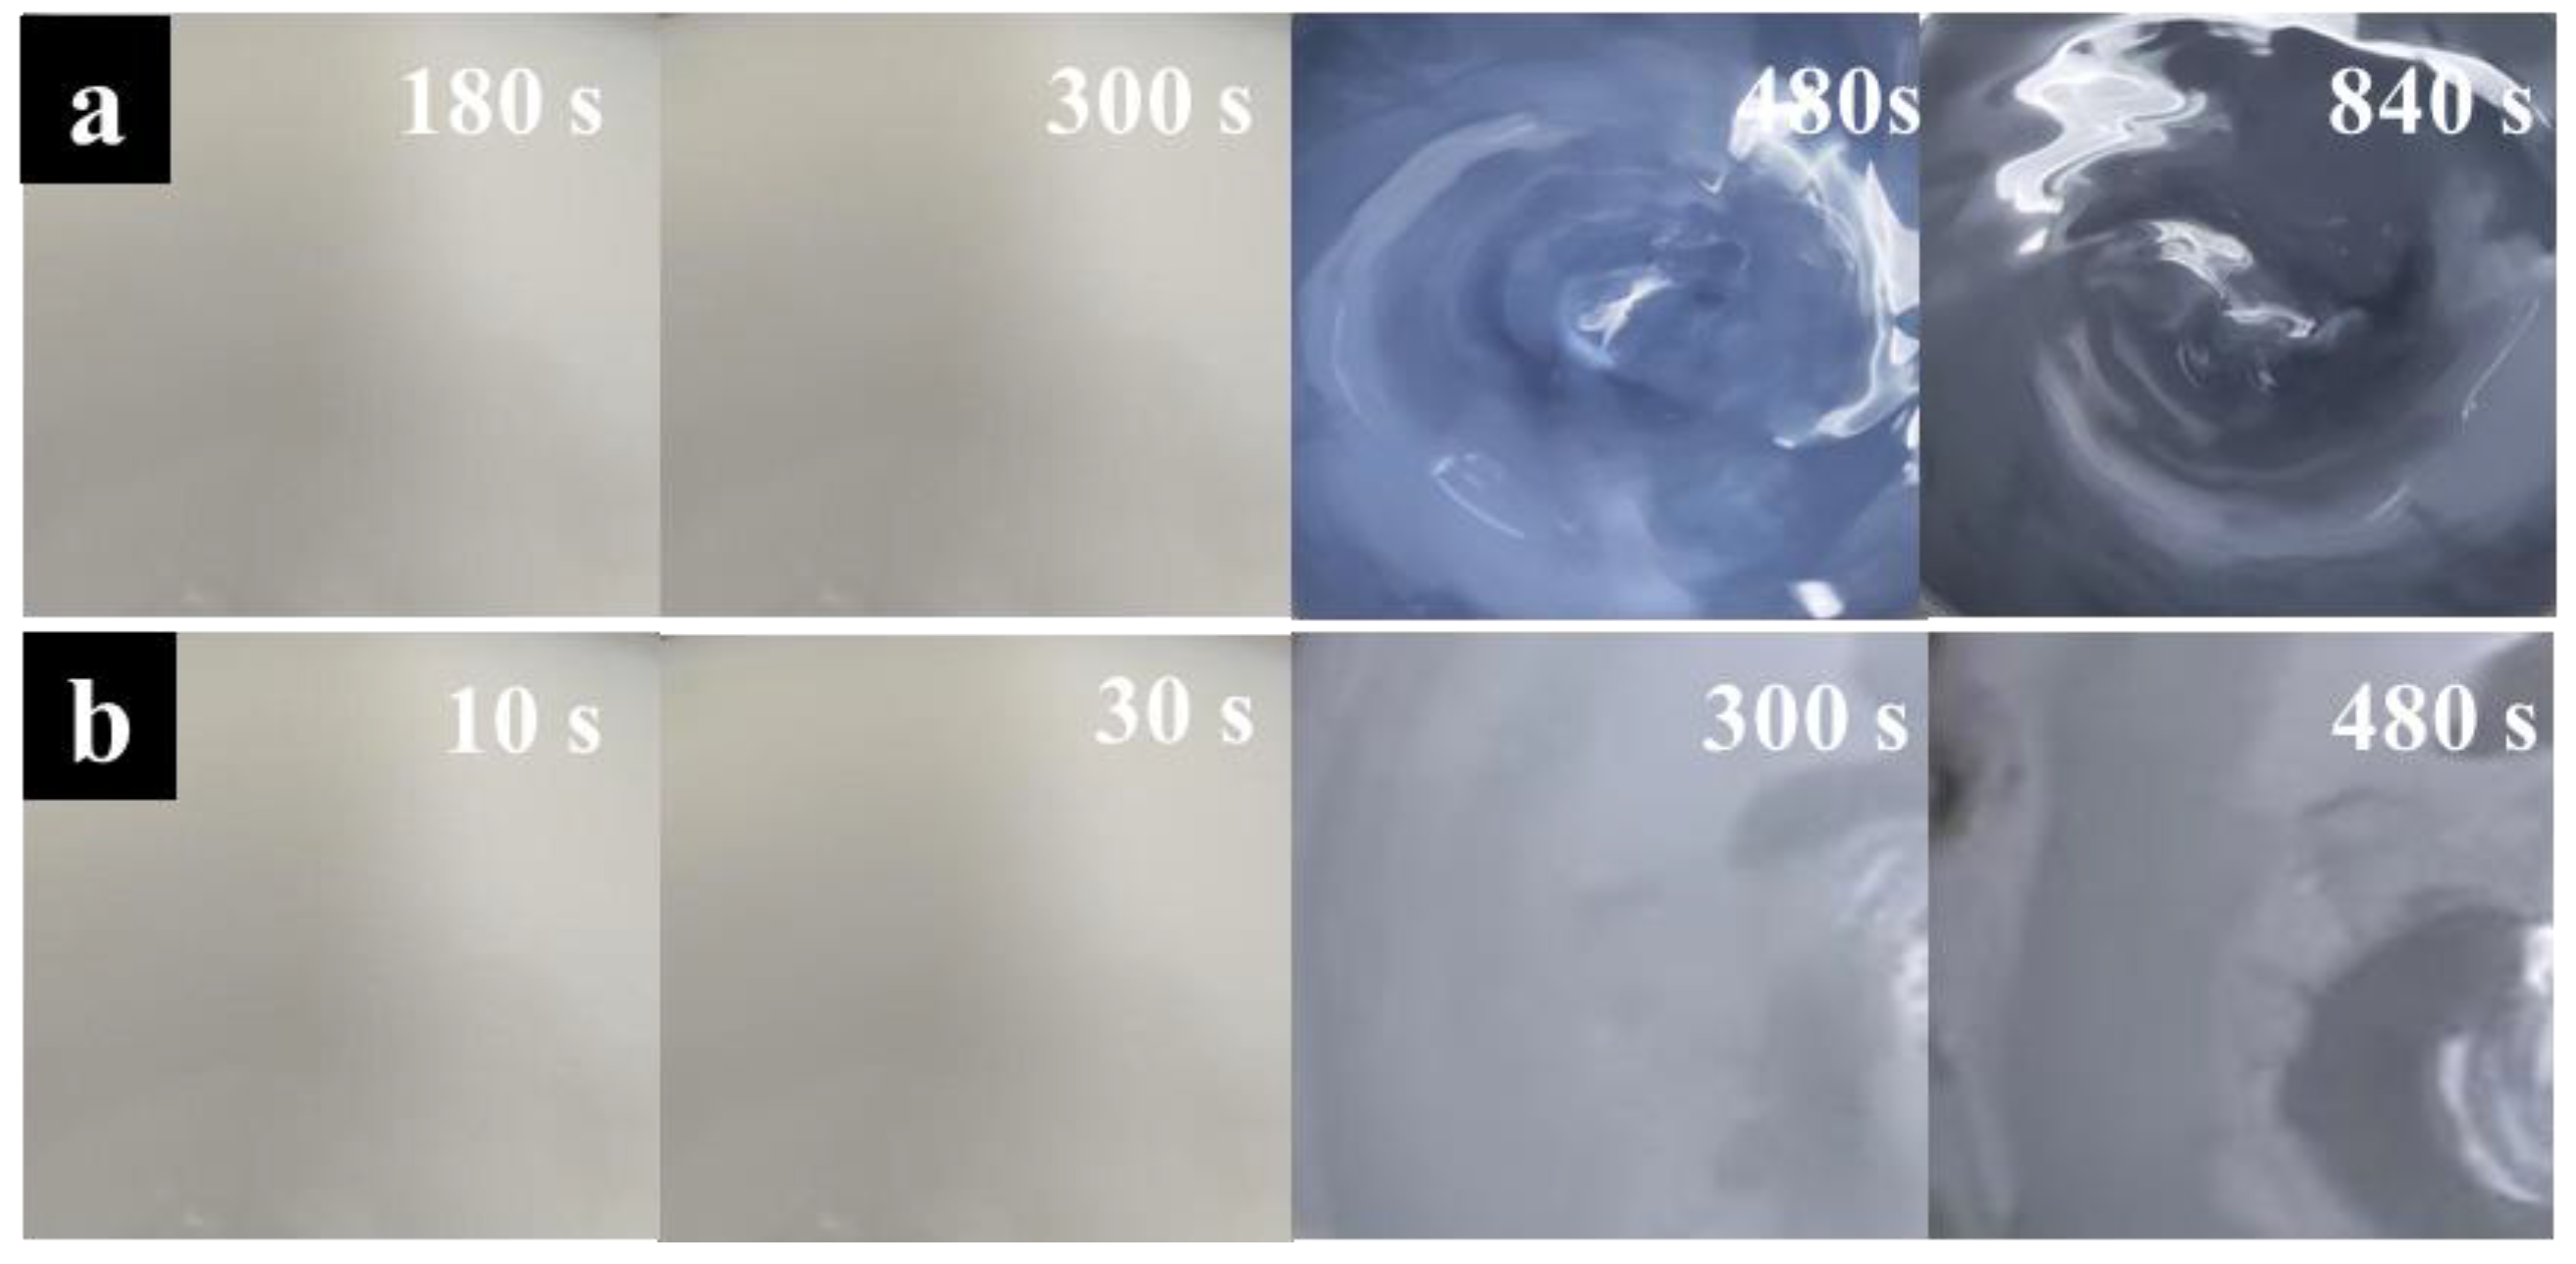
3.1.3. Constant-Temperature Time

At an endpoint pH value of 13, ultrasonic power of 900 W, and reaction temperature of room temperature, the effects of varying constant-temperature times on the prepared stannous oxide products were investigated. The median particle size D50 of stannous oxide obtained at different constant-temperature times under conventional and ultrasonic conditions is shown in Figure 5.
The median particle size D50 of the stannous oxide prepared using ultrasound was significantly smaller and more uniform than that prepared by the conventional method across different constant-temperature times. Specifically, the median particle size (D50) of the products prepared by ultrasound remained stable at 4–6 μm within the examined constant-temperature time range, whereas it fluctuated within a larger range of 20–35 μm under conventional conditions. This phenomenon is the same as that affected by temperature.
Figure 6 shows SEM images of the solid products obtained at different constant-temperature times during conventional and ultrasonic preparations. Combined with Figure 5, it can be seen that under the action of stirring, the stannous oxide particles obtained by both ultrasonic and conventional methods experienced a process of initial growth followed by breakage and shrinkage. The difference is that the addition of ultrasound greatly shortens this time. This process occurs at a constant-temperature time of about 15 to 25 min in the conventional method, whereas the action of ultrasound advances this stage to the range of a constant-temperature time of 1 to 8 min, and ultrasound is more effective in breaking the particles. When the ultrasonic constant-temperature time was extended from 1 to 8 min, the median particle size D50 of stannous oxide decreased from 5.6 to 4.6 μm, reaching its minimum value at 8 min. At this time, the yield increased from 80.74% to 86.84%. This is because the effect of ultrasound on promoting particle growth is weaker than the mechanical effect of ultrasound on breaking large particles into smaller crystals [24], leading to a decrease in particle size and an increase in yield. With the extension of time, the breaking effect of ultrasound on the particles weakens, and the ultrasound energy is mainly used to promote the growth of small crystals that have been formed [27], resulting in a gradual increase in particle size. The median particle size D50 of stannous oxide prepared by conventional preparation was more stable at about 23 μm when the conventional constant-temperature time was extended from 1 to 8 min. The median particle size D50 of stannous oxide increased significantly by extending the time, and the median particle size D50 increased to 33 μm at 20 min. However, after further extending the time, the median particle size D50 gradually decreased. The SEM image also showed that the stannous oxide obtained by the conventional method at 20 min was flowery with a large amount of tetragonal stannous oxide, and the particle size was obviously uneven.
To summarize, the stannous oxide particle size is the smallest and the yield is larger when the constant-temperature time is 8 min; therefore, a constant-temperature time of 8 min is chosen as the optimal condition.

3.1.4. Ultrasonic Power

The effects of different ultrasonic powers (540, 720, 900, 1080 and 1260 W) on the preparation of stannous oxide were investigated at the endpoint pH value of 13, constant-temperature time of 8 min, and reaction temperature of room temperature. The median particle size D50 of the stannous oxide products obtained with different ultrasonic powers is shown in Figure 7.
As shown in Figure 7, the ultrasonic power had a more significant effect on the median particle size D50 than either temperature or constant-temperature time. In the examined power range of 540–1260 W, the median particle size D50 of stannous oxide fluctuated from 5.0 to 7.0 μm. With increasing ultrasonic power, the particle size of the prepared stannous oxide showed a tendency to first decrease and then increase. When the ultrasonic power is low, the ultrasonic energy is mainly used to break the formed crystals into more and smaller crystals, whereas as the ultrasonic power increases, the increased ultrasonic energy not only breaks the crystals but also accelerates their growth rate. Fluorescence microscopy images of crystal morphology under different ultrasonic powers are shown in Figure 8. At the ultrasonic power of 720 W, it is observed that the integrity of the crystal is greater than that at 900 W, and at an ultrasonic power of 900 W, the SnO crystal under the same magnification undergoes obvious fragmentation, at which time the ultrasonic effect of crystal fragmentation reaches its maximum. As the ultrasonic power continues to increase, the integrity of the crystal is again greater at 1080 W and 1260 W than that at 900 W, which indicates that increased ultrasonic energy promotes the growth of the crystals after the breaking of the crystals.
A significant increase in the yield of stannous oxide was obtained at 900 W, reaching 79.4%, which was 3.2% higher than that at 540 W; a minimum particle size was obtained with a median particle size D50 of 5.2 μm, which is 1.7 μm smaller than the median particle size D50 at the 540 W condition. However, when the ultrasonic power increased to 1260 W, the particle size of stannous oxide was larger than that obtained at 900 W, while the yield improvement was marginal, showing only a 0.8% increase. Wu et al. [29] studied the synthesis of polydopamine (PDA) nanoparticles and reported that ultrasound-assisted synthesis promoted the reaction kinetics and increased the nucleation rate, resulting in smaller PDA nanoparticles. The research of Guo et al. [30] showed that the mean particle sizes of metallic Rb nanoparticles were 55 and 70 nm at ultrasonic powers of 320 and 240 W, respectively. In some cases, an increase in ultrasonic power leads to an increase in the median particle size of the particles. According to the study of Yang et al. [31], the size of particles decreased with increasing ultrasonic power at lower ultrasonic powers. It has been demonstrated that an increase in ultrasonic power may result in the continuous growth of particles, due to the energy provided thereby. Therefore, an excessive increase in ultrasonic power could not enhance particle refinement, but would lead to recolonization of particles or formation of larger particles, resulting in an increase in particle size, which is consistent with the results of the present experiments. To summarize, the smallest particle size and largest yield of stannous oxide were obtained at 900 W. Therefore, an ultrasonic power of 900 W was selected as the optimal condition.

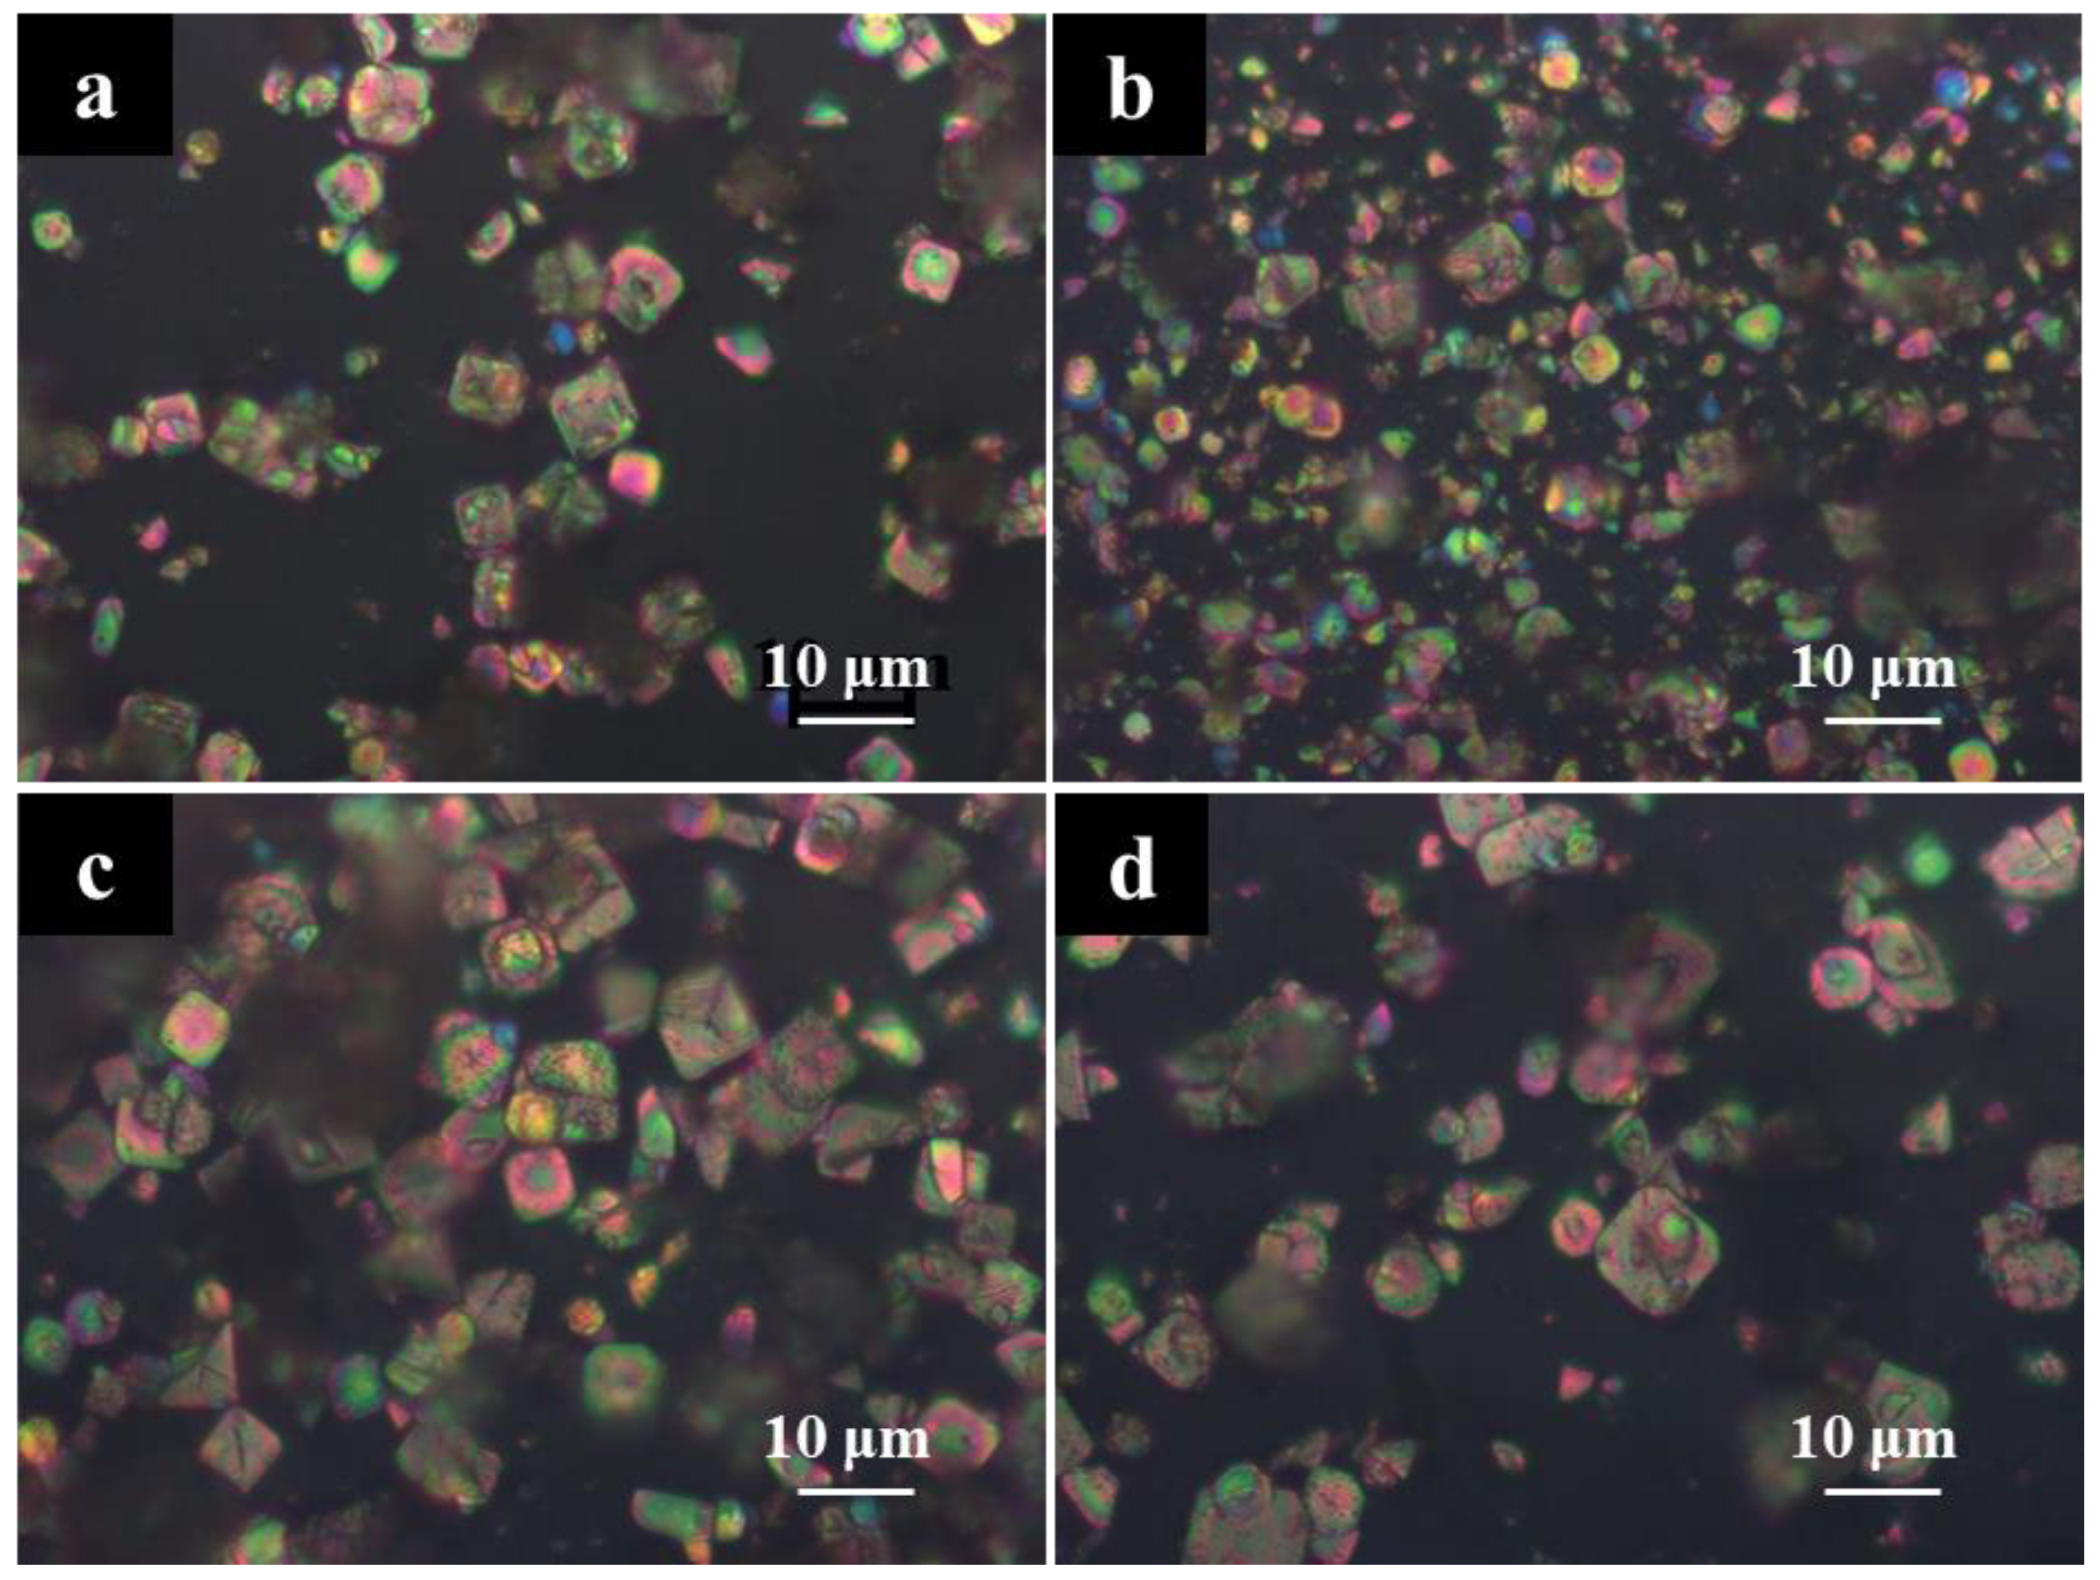
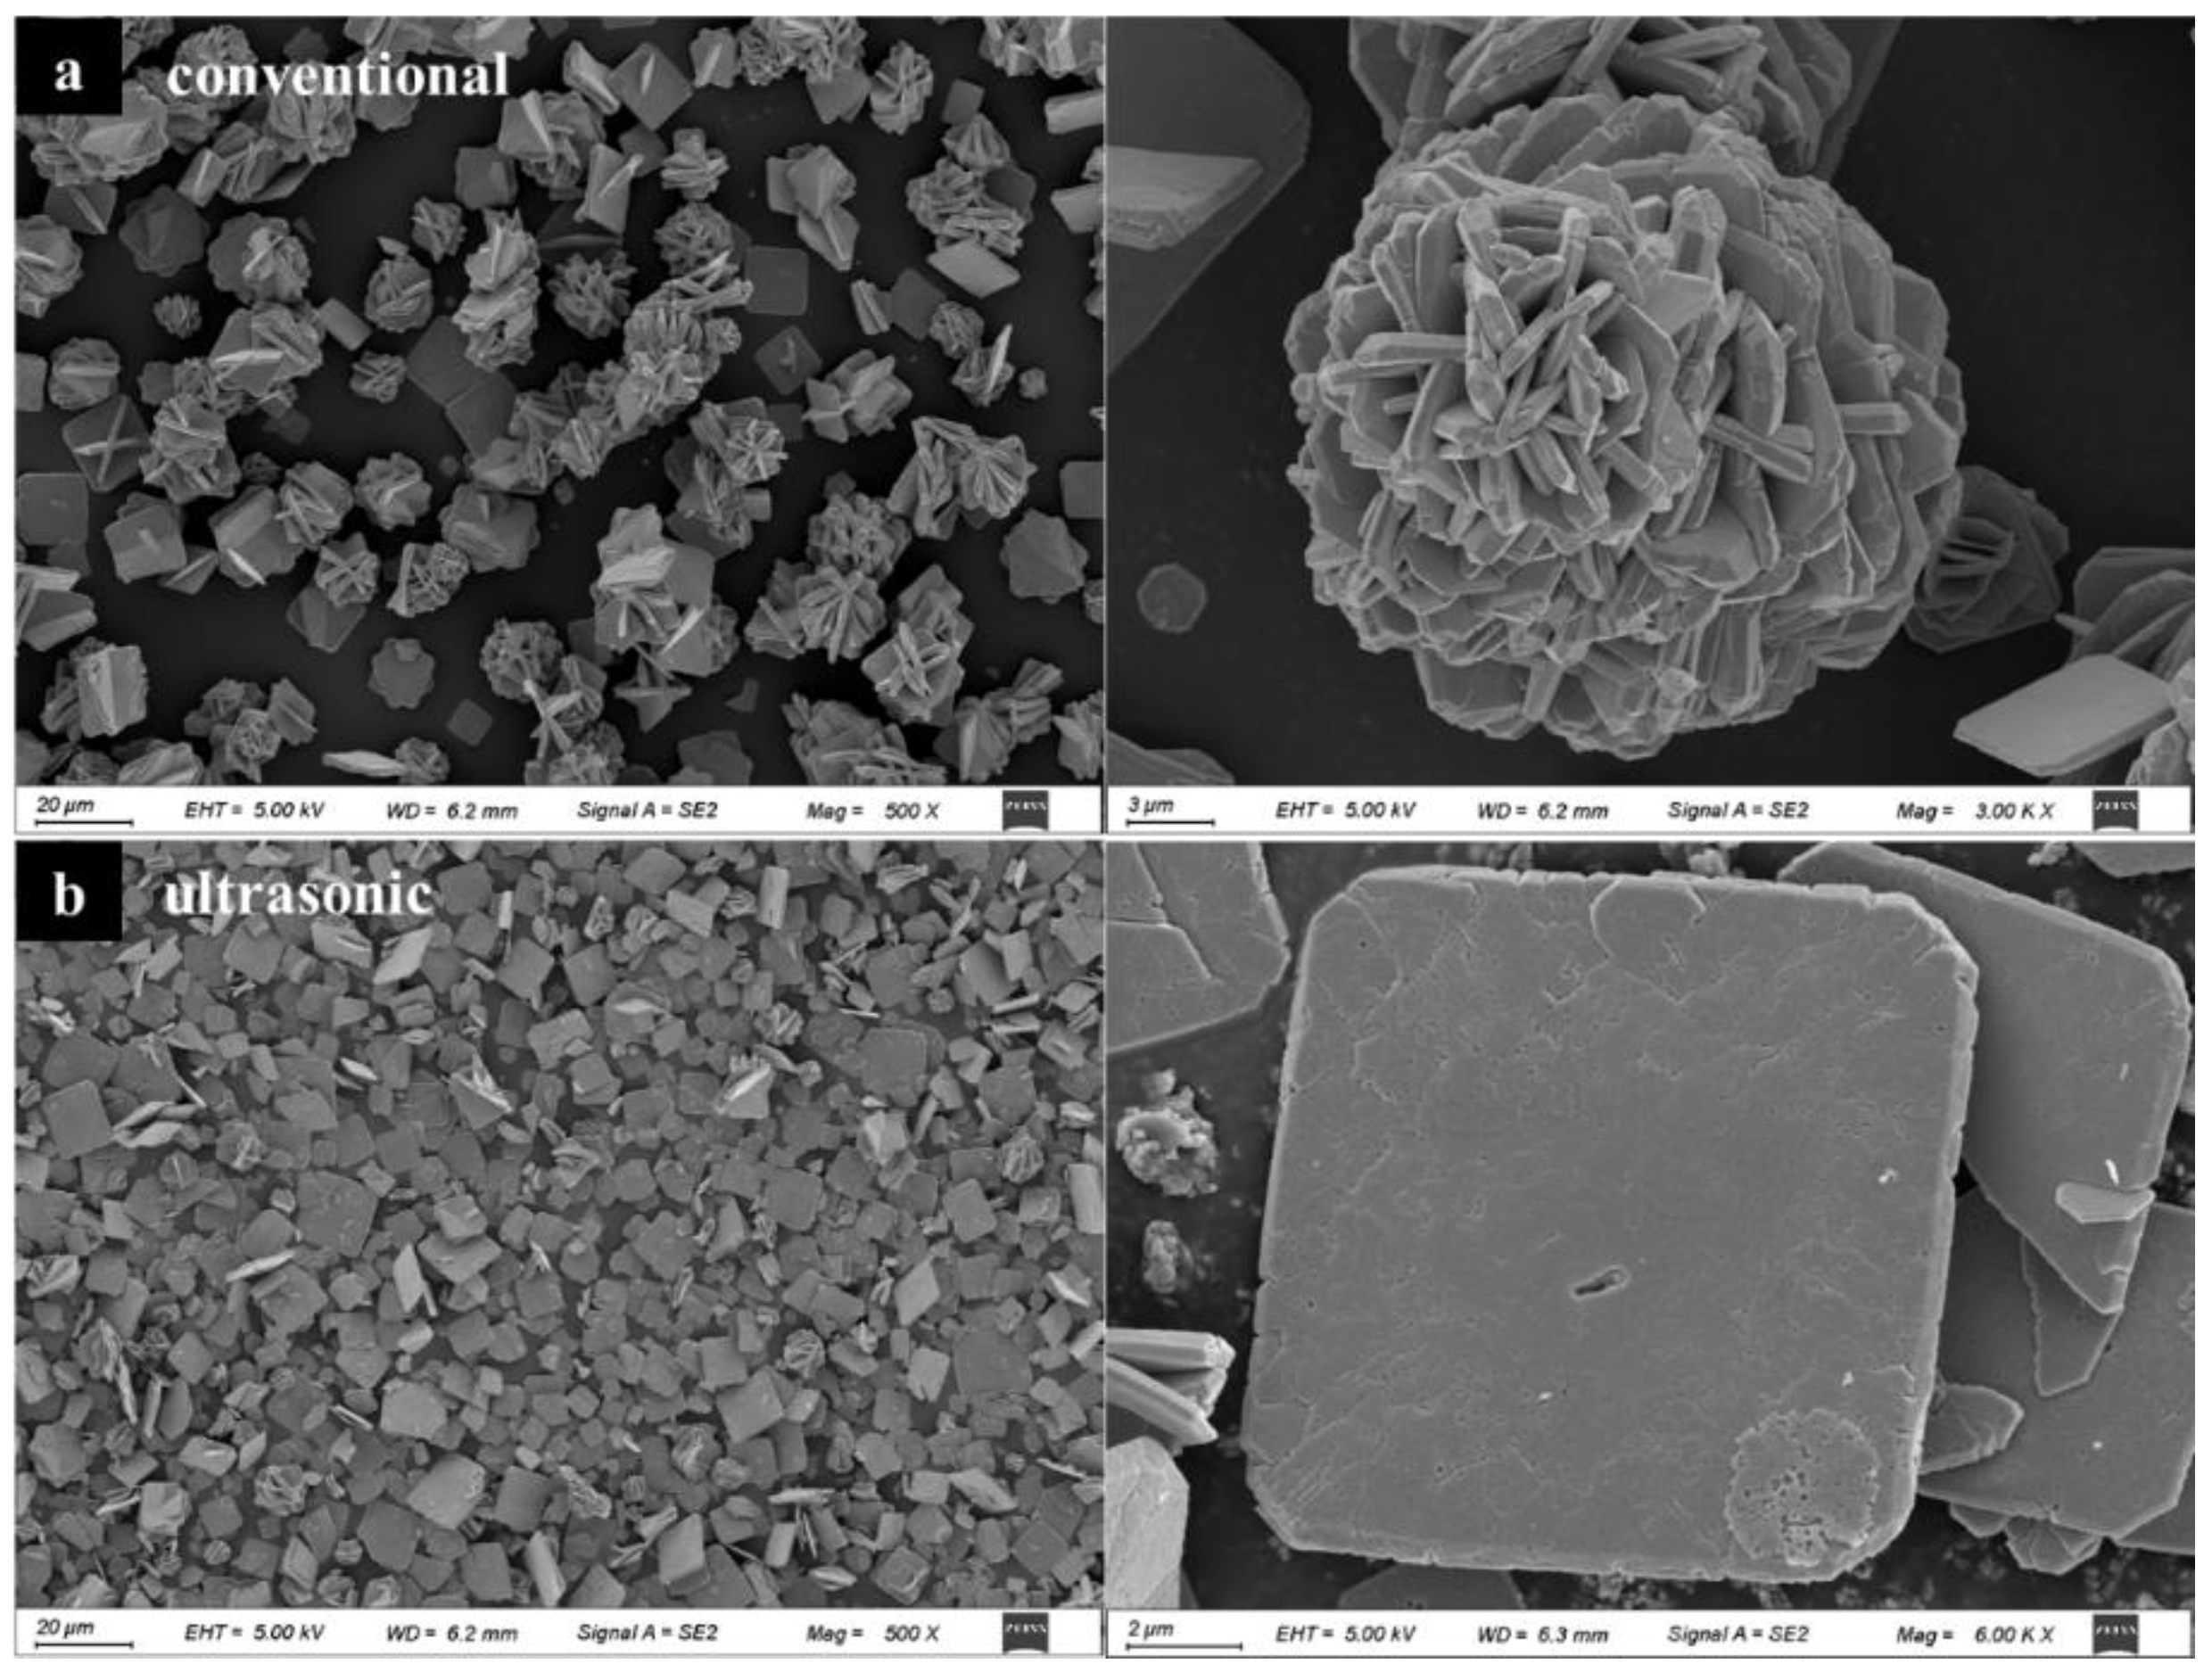
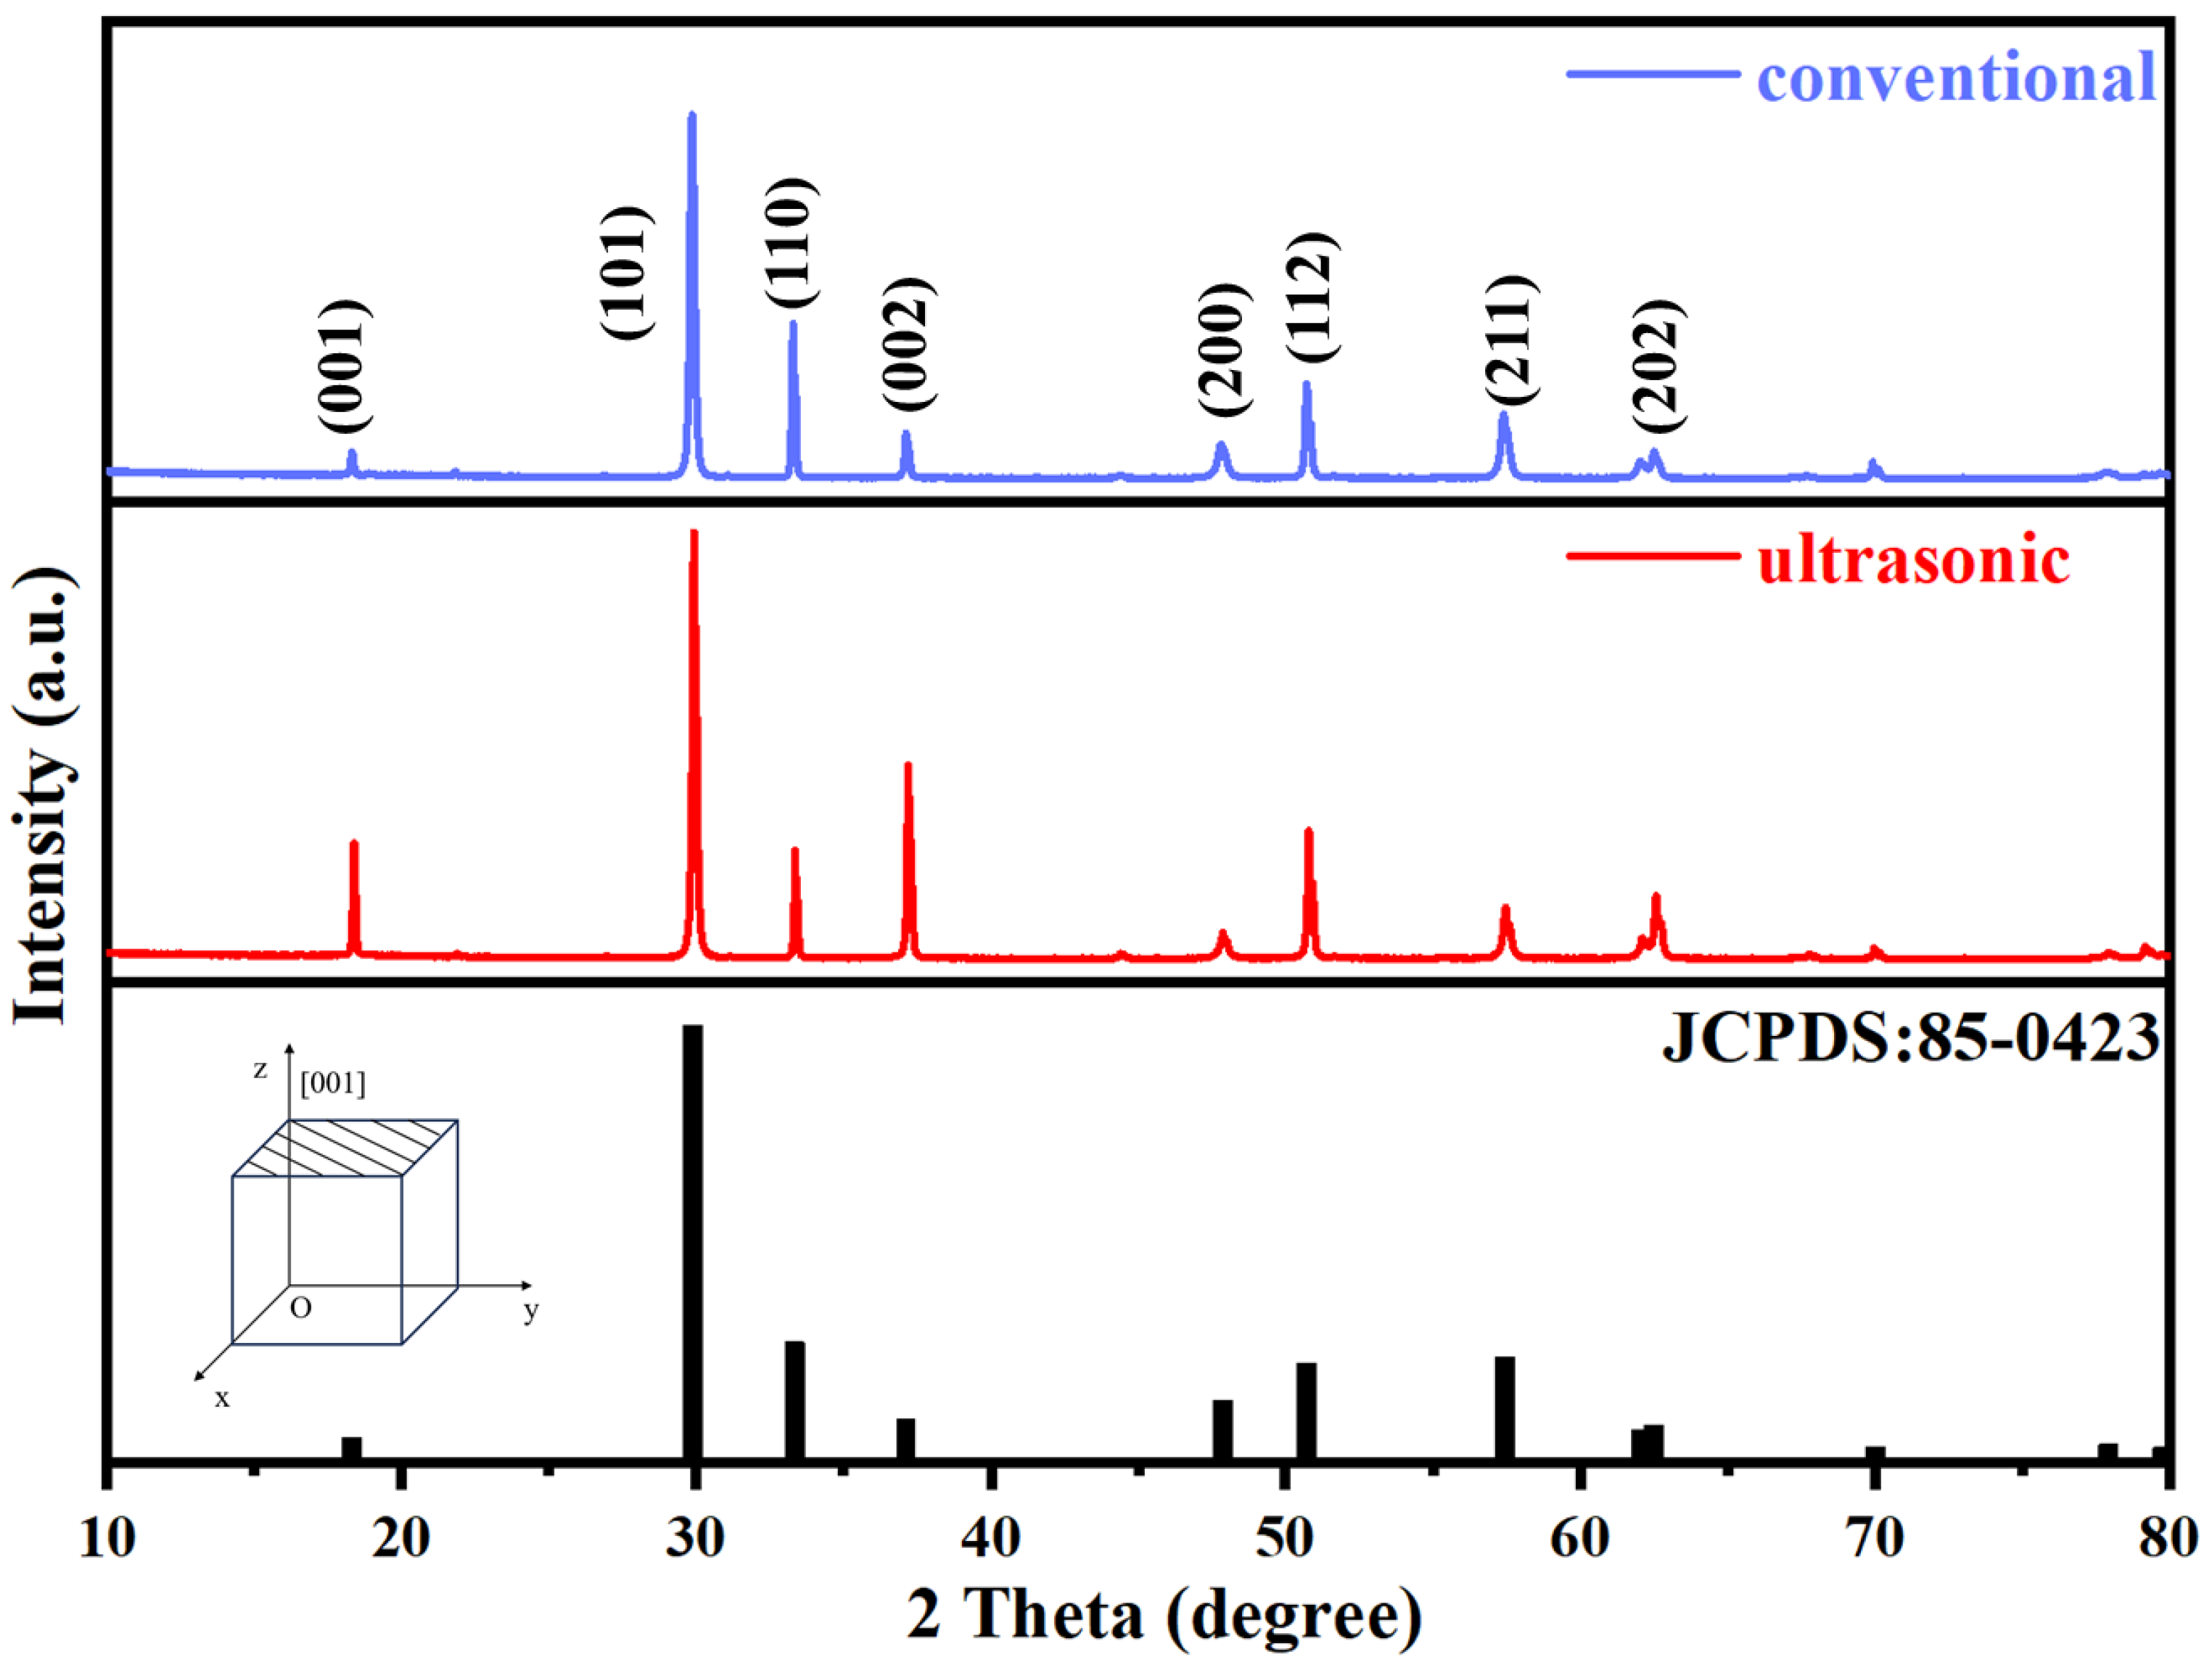
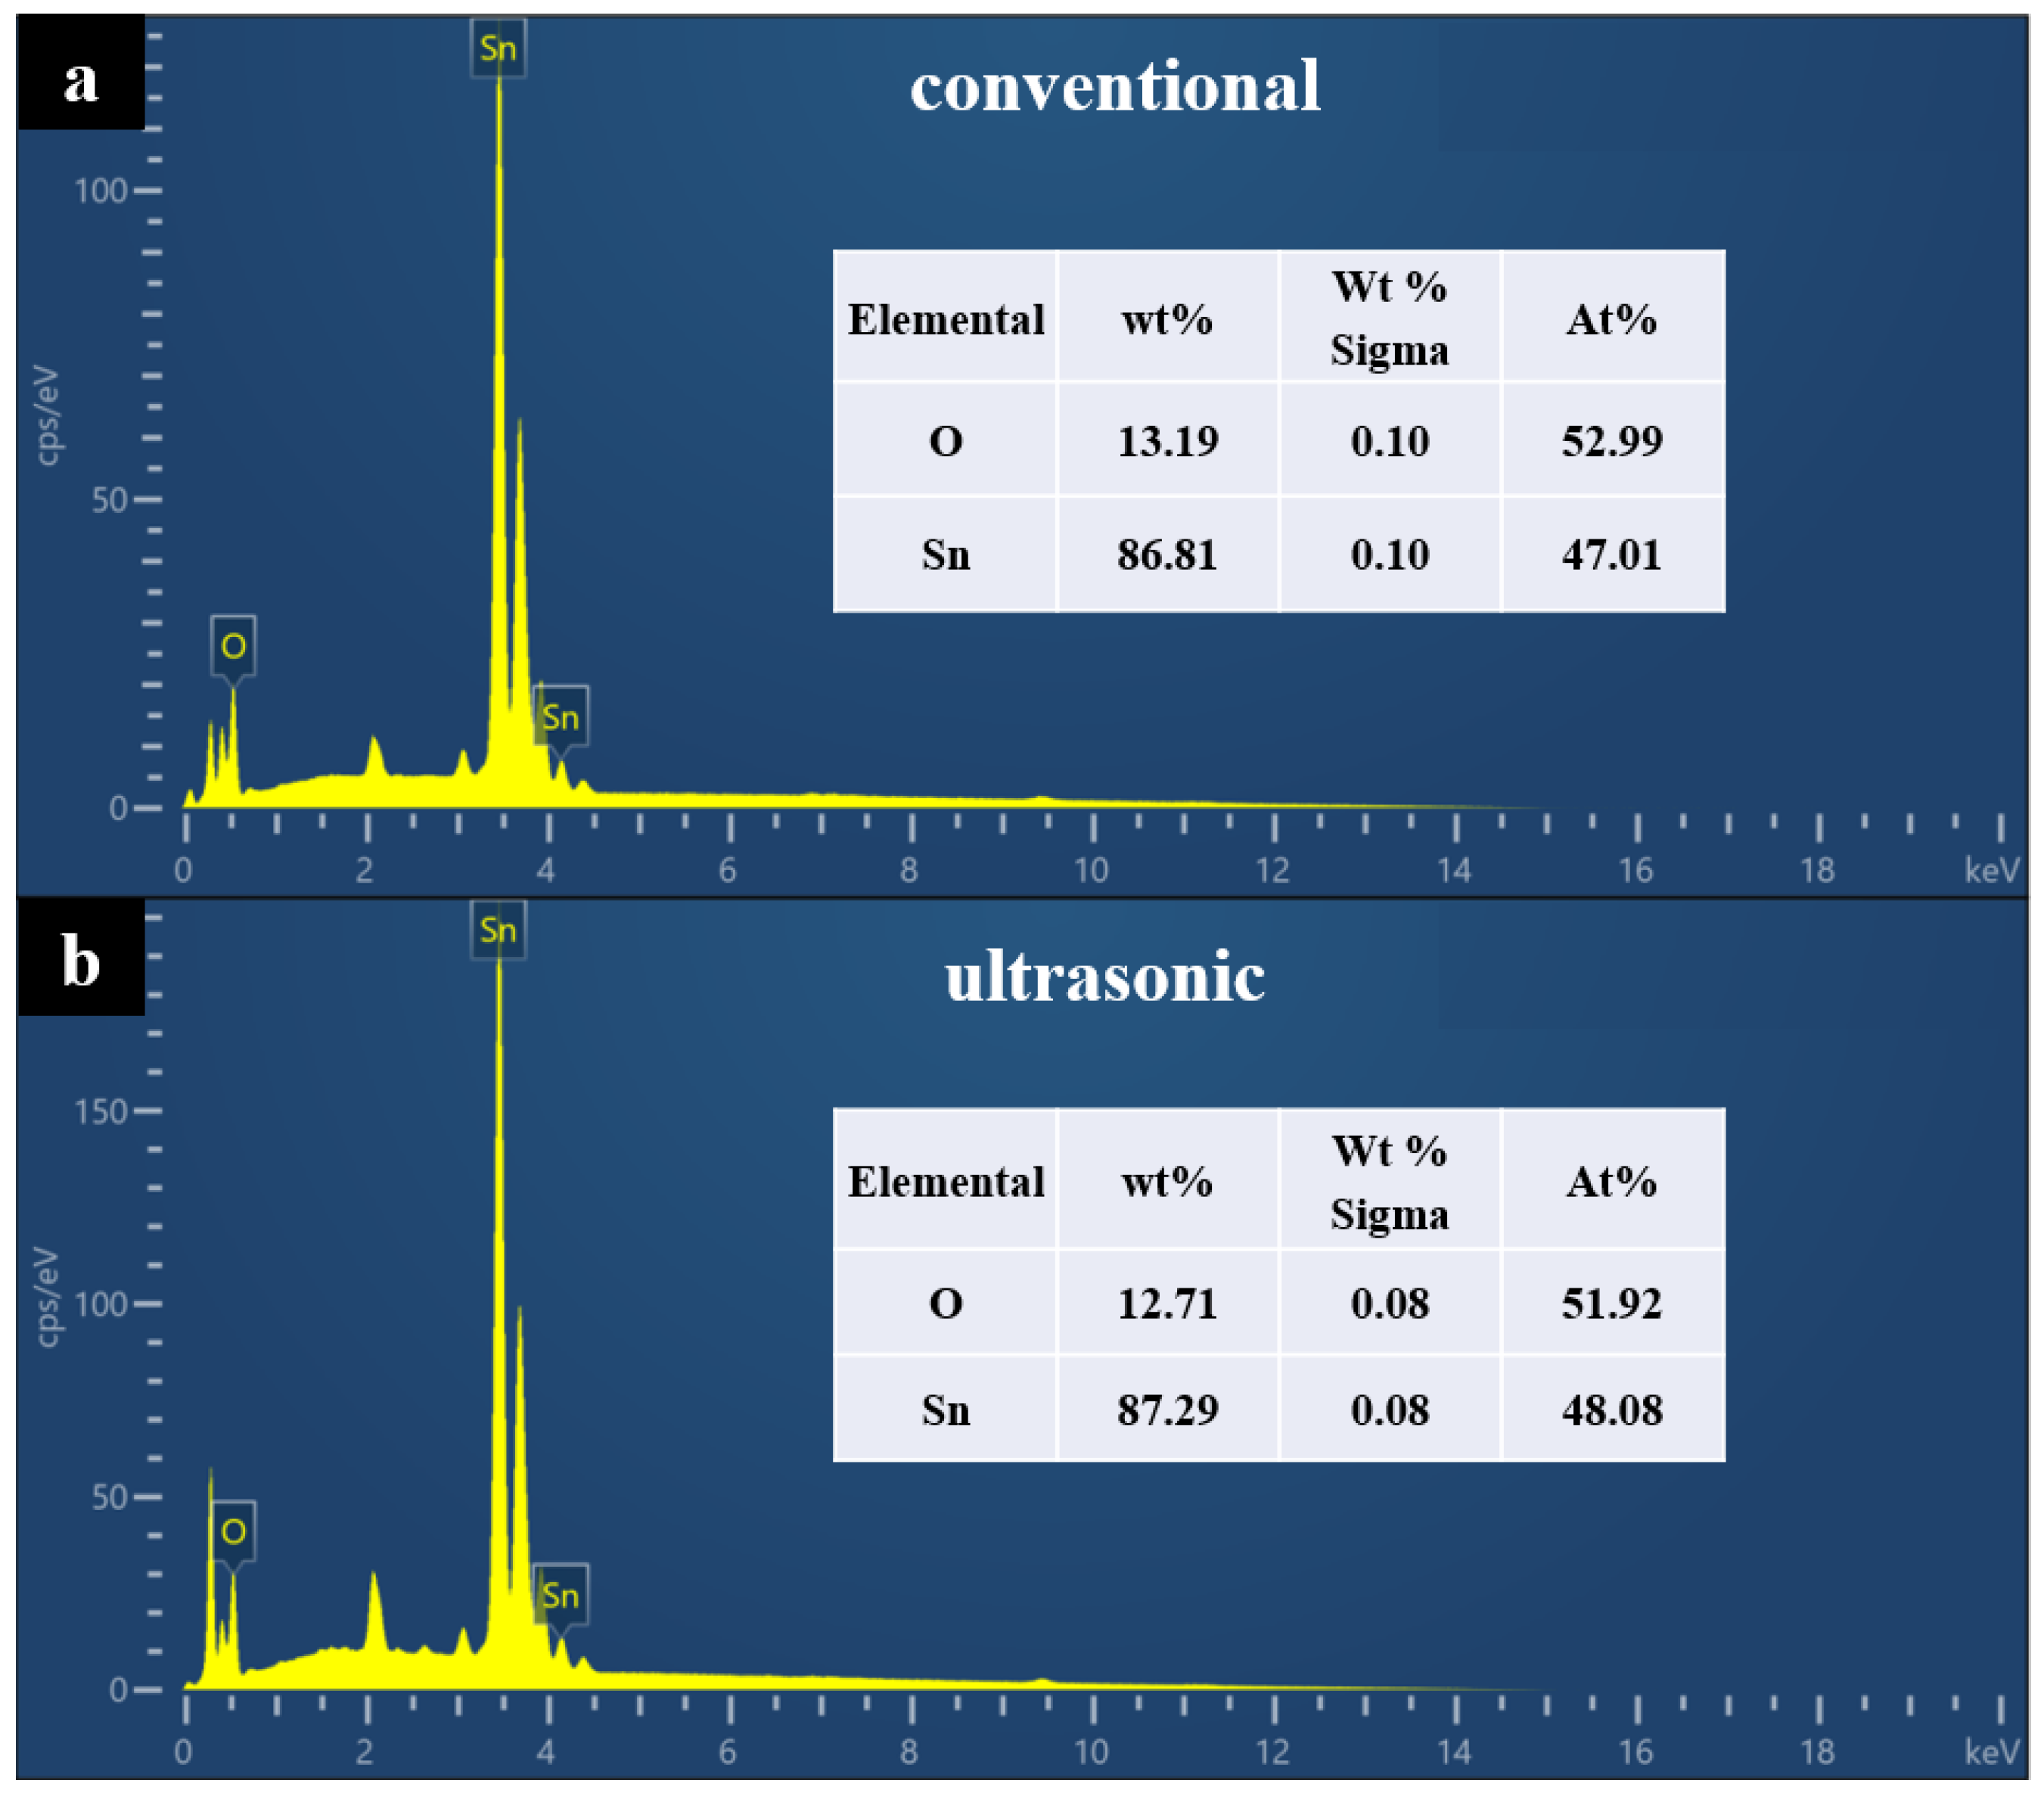
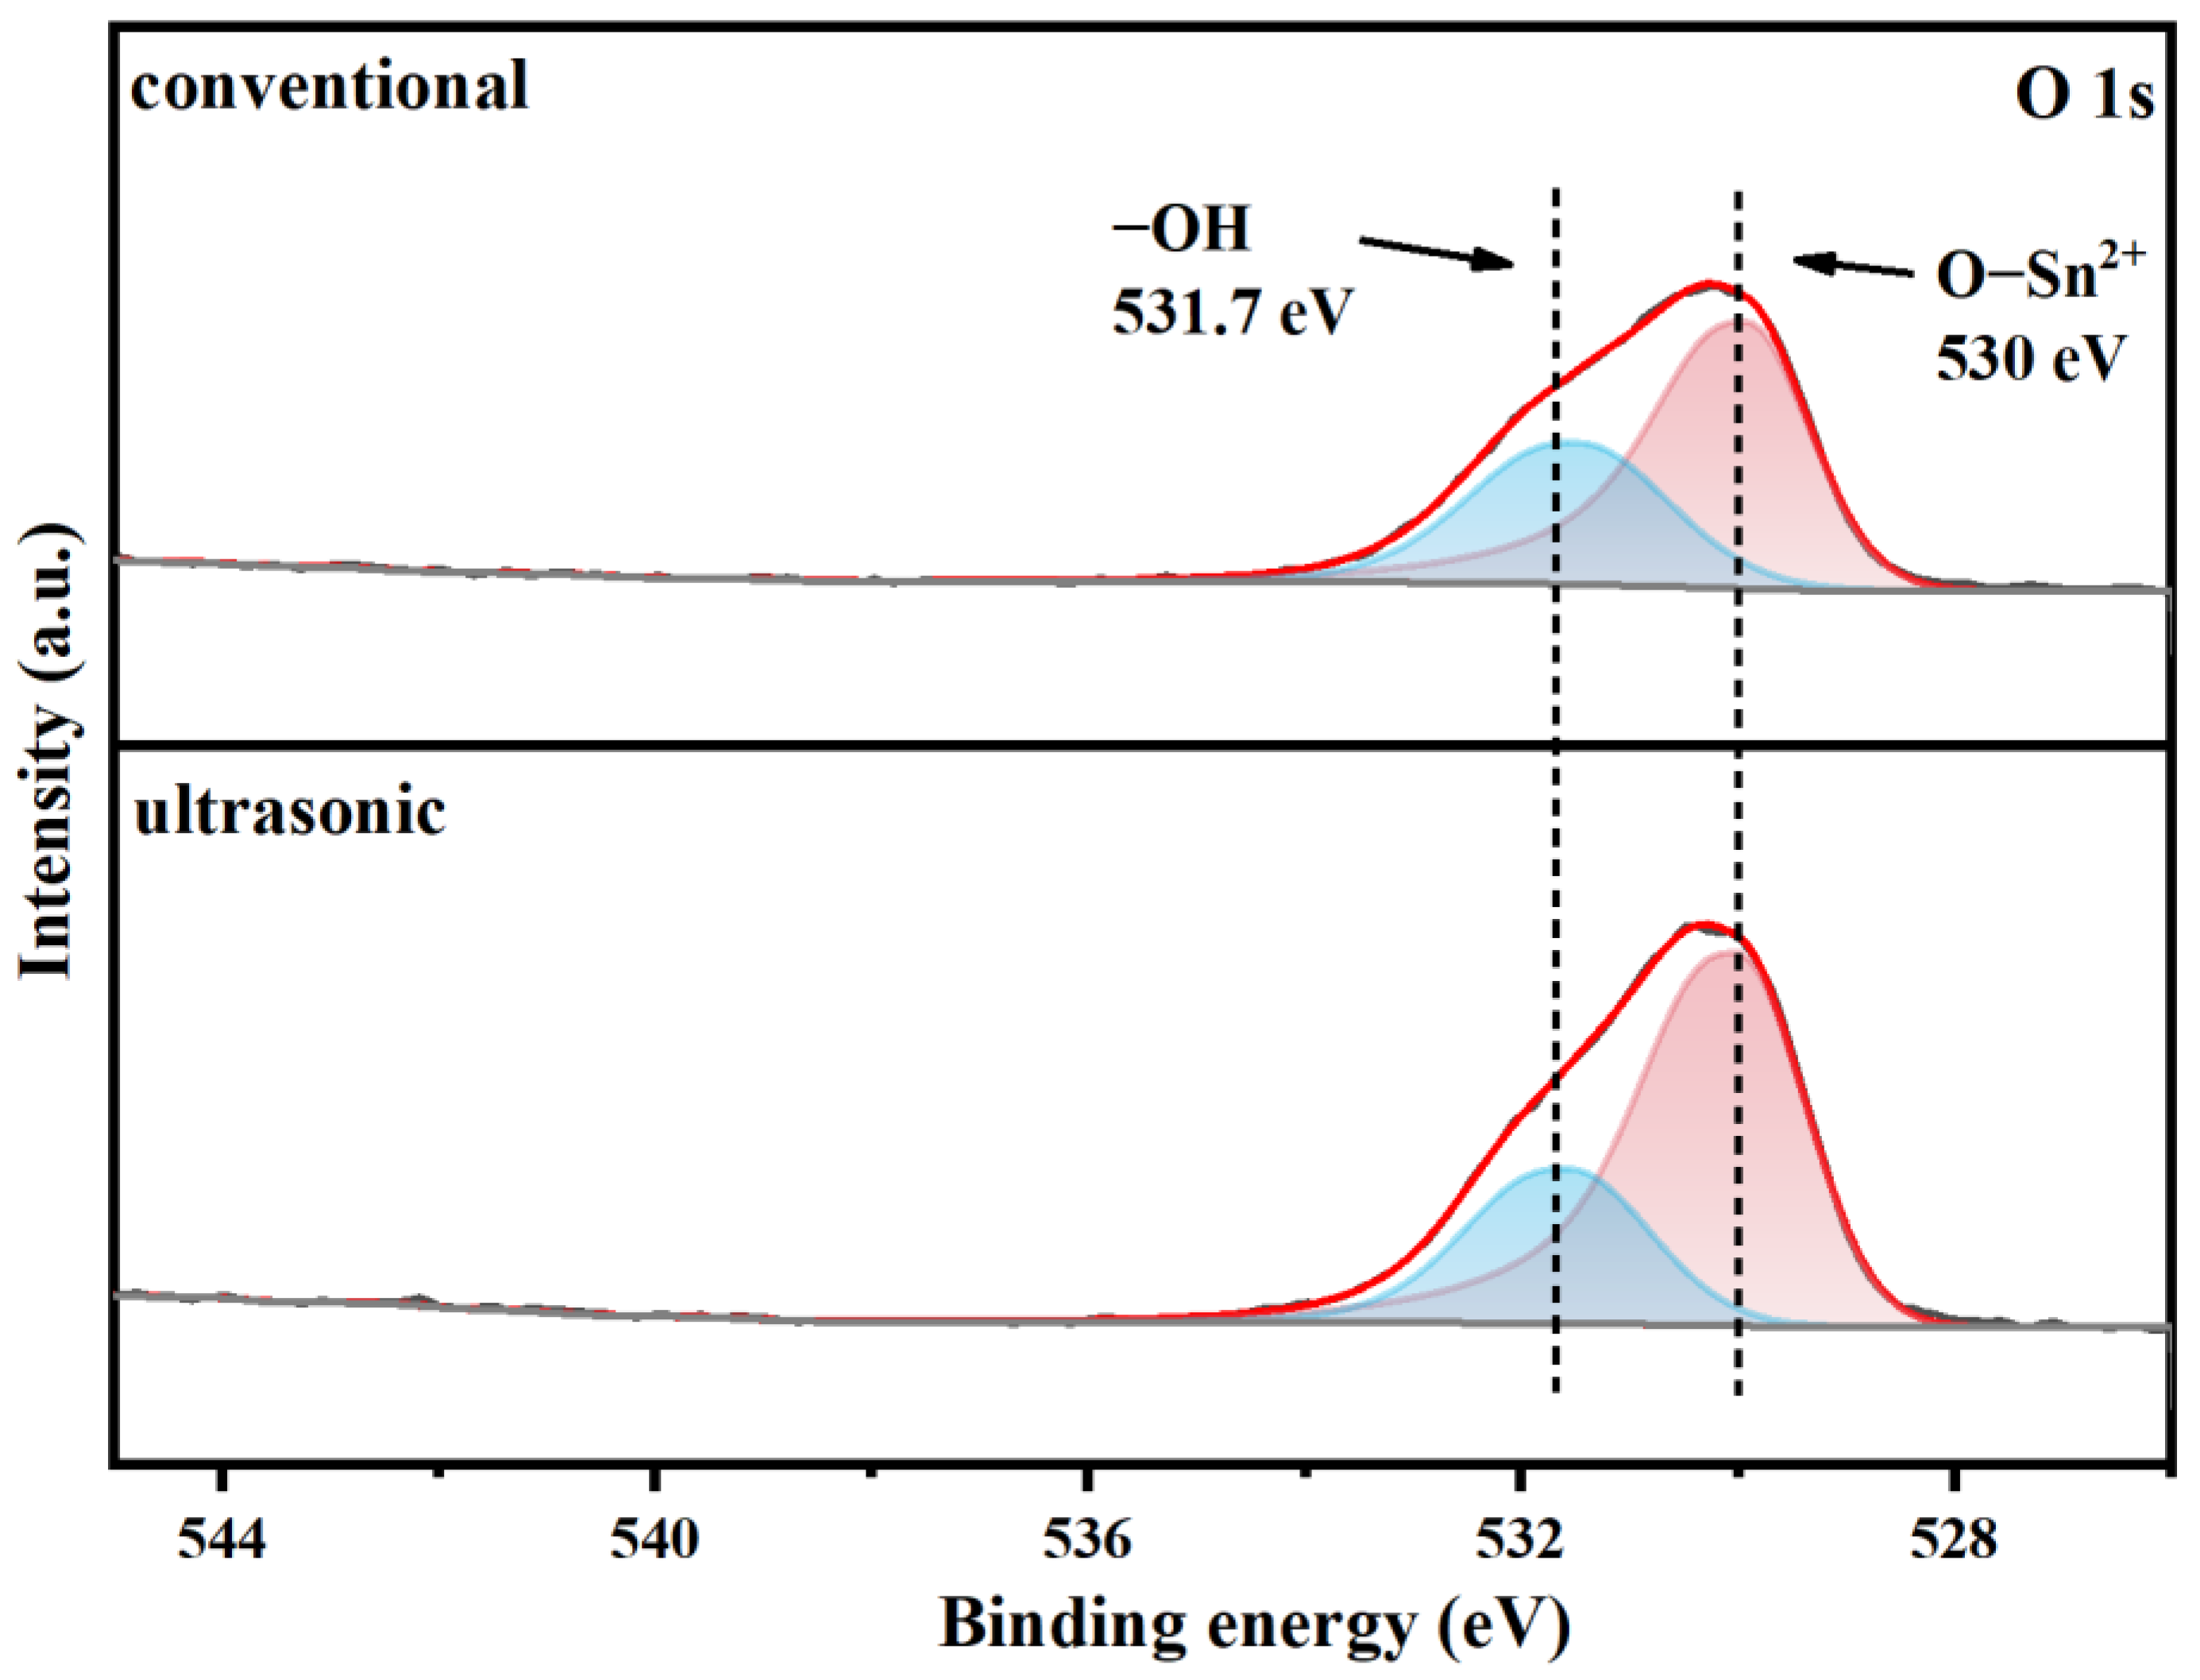
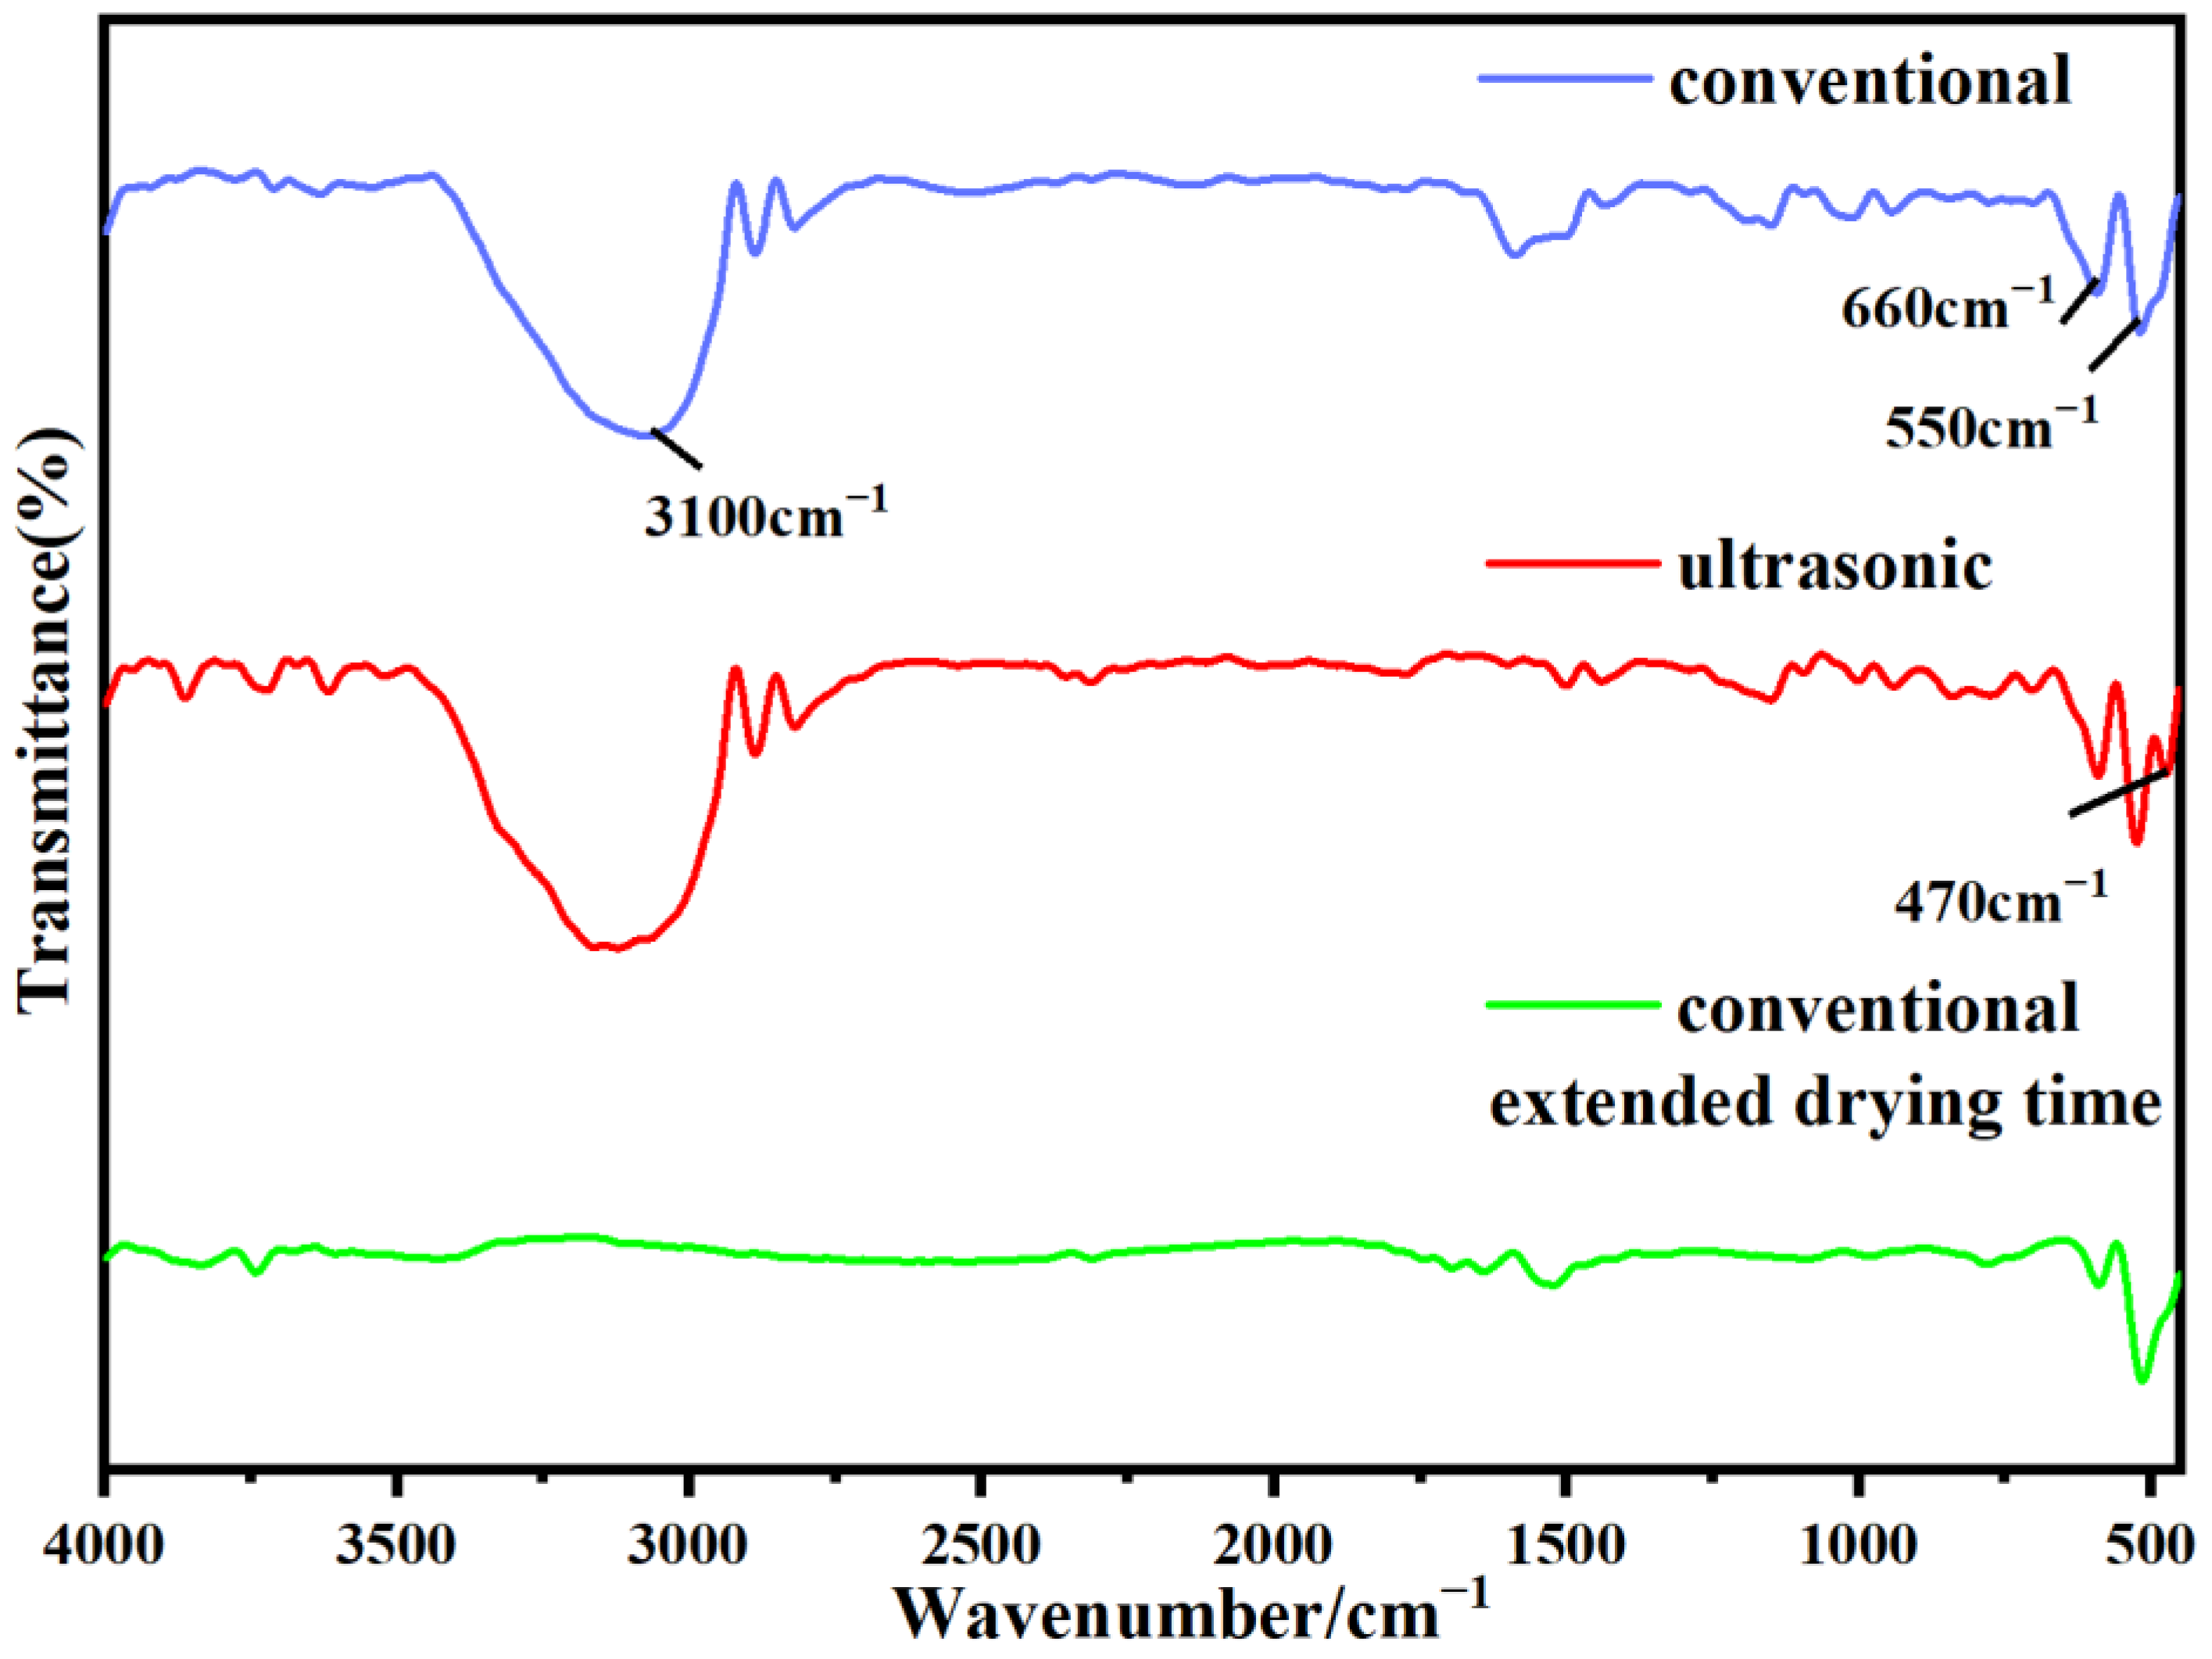
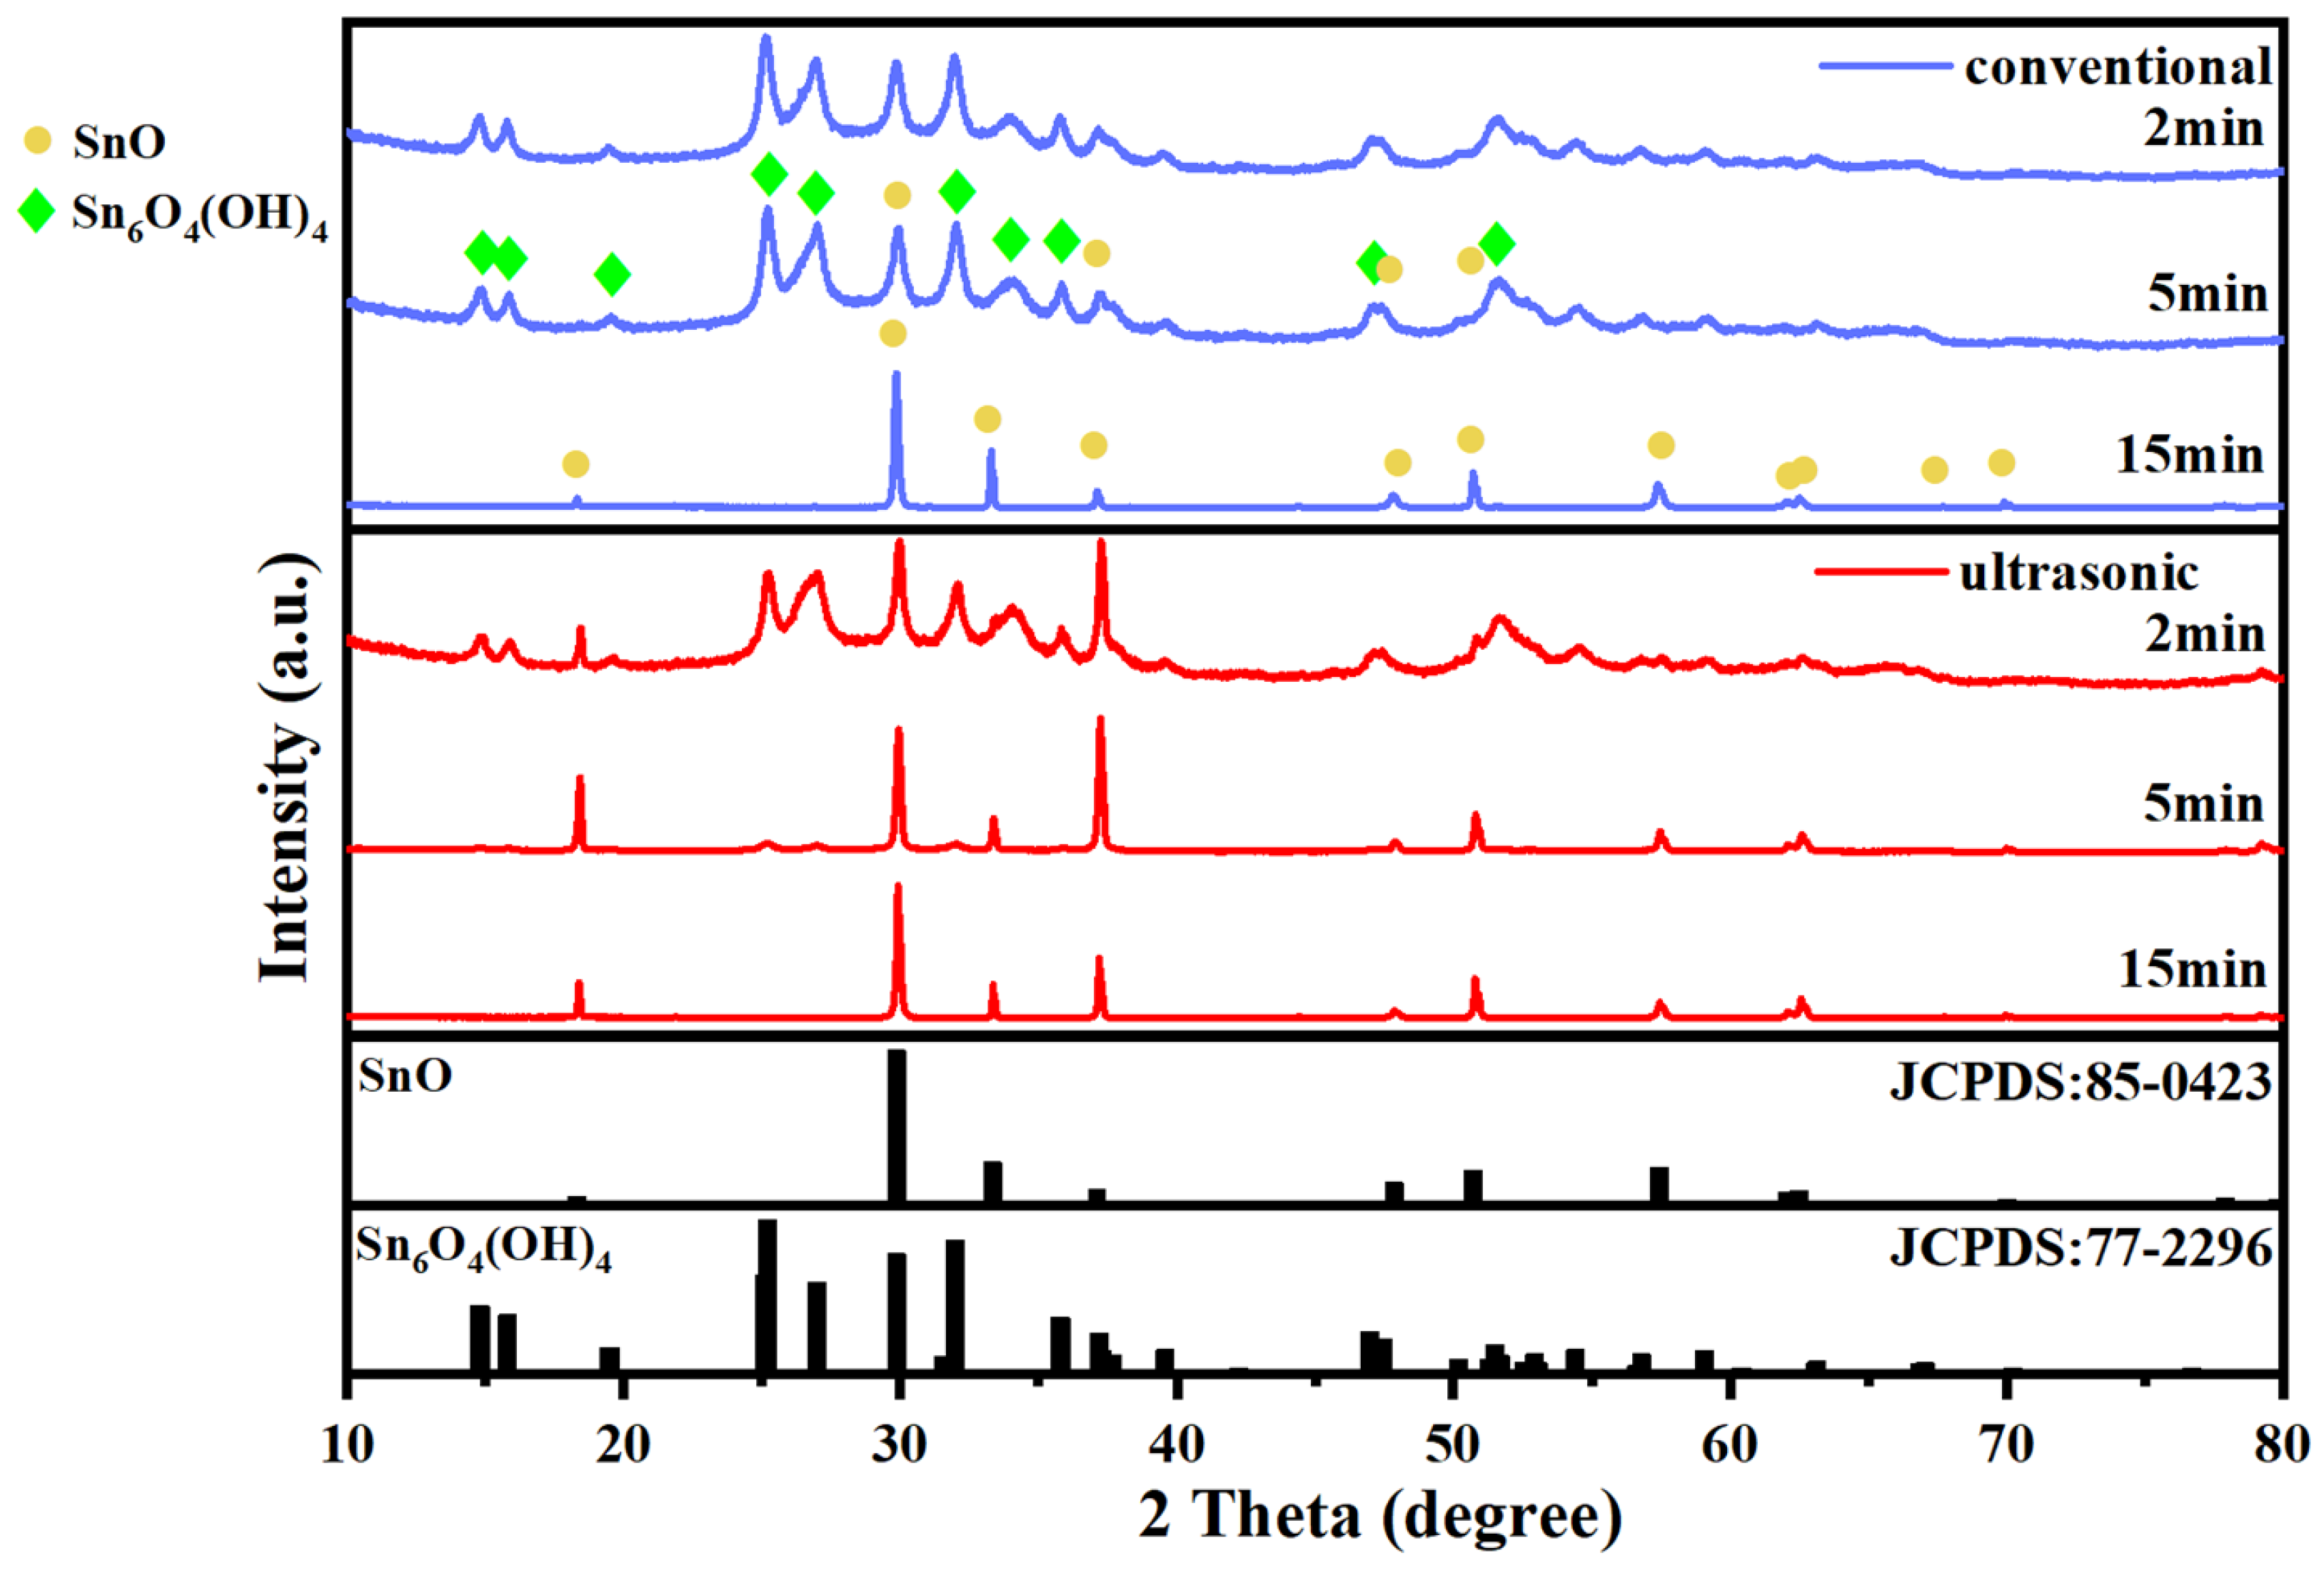
3.2. Characterization of Stannous Oxide Products Obtained by Ultrasonic and Conventional Methods

Under the optimal process conditions including an endpoint pH value of 13, constant-temperature time of 8 min, and reaction temperature of room temperature, the stannous oxide samples prepared with 900 W of ultrasonic power were compared with conventional samples (prepared without ultrasound). Table 1 shows the Sn elemental content of the solid product. According to the Sn content, the purity of stannous oxide obtained at conventional room temperature was only 97%, which does not meet the industry standard of stannous oxide products. This may also be the reason why the existing conventional processes for preparing stannous oxide require high temperatures rather than room temperature. In contrast, the purity of stannous oxide obtained under the action of ultrasound was 98.7%, which was higher than the industry standard of 98%. In other words, stannous oxide products that meet industry standards can be obtained under the action of ultrasound at room temperature.
Figure 9 reflects the particle size distribution of stannous oxide obtained by conventional and ultrasonic conditions.
The particle size distribution of the stannous oxide prepared with the conventional method was between 6.6 and 400 μm, with a wide range of particle size distribution, and an obvious bimodal particle size distribution structure, indicating that the particle size of the stannous oxide obtained with the conventional method was large and uneven. In contrast, after the introduction of ultrasound, the median particle size D50 of stannous oxide particles was significantly reduced to only 5.2 μm, representing a 15 μm decrease compared to that of conventional preparation. The particle size distribution was significantly narrowed, mainly concentrated in the range of 2.9–8.7 μm, and displayed a single-peak particle size distribution structure. These results demonstrate that ultrasound assistance can effectively refine particle size and enhance size homogeneity. Yang et al. [31] synthesized Cu nanoparticles by the wet chemical redox method under ultrasound and statistically analyzed the evolution of particle size distribution. The investigation revealed a direct correlation between the decrease in particle size and the increase in ultrasonic power. A mathematical model was developed to clarify the correlation between ultrasonic energy and the size distribution of metallic nanoparticles. This study also demonstrated that ultrasound is an effective method for refining and dispersing materials, which helps to improve particle size uniformity.
Table 2 shows the BET results of stannous oxide obtained by ultrasonic and conventional preparation methods. It can be seen that the specific surface area of the stannous oxide obtained by conventional preparation was only 1.099 m2/g, whereas that of the stannous oxide obtained by ultrasound reached 2.877 m2/g. The smaller the particle size, the more particles per unit mass, and the larger the corresponding specific surface area. And the larger the specific surface area, the larger the adsorption capacity, and the more active sites on the surface of the catalyst. Therefore, the introduction of ultrasound can obtain stannous oxide with better catalytic performance.
Figure 10 shows SEM images of the solid products after a constant-temperature time of 8 min under conventional and ultrasonic preparation. Flower-like and tetragonal structures were obtained under conventional preparation conditions, while the morphology of stannous oxide obtained under ultrasound was obviously more uniform and mainly tetragonal. Combined with the XRD results, it shows that ultrasound effectively promotes the formation of tetragonal stannous oxide. The electrical conductivity and mechanical strength of the obtained tetragonal stannous oxide are better than those of the floral stannous oxide [32,33].
Figure 11 shows the XRD patterns of conventional and ultrasonically obtained stannous oxide. Comparison of the XRD patterns between the prepared stannous oxide samples and the standard stannous oxide revealed the absence of other substances, indicating that pure stannous oxide was successfully synthesized through both conventional and ultrasonic methods. The peak intensity of stannous oxide prepared by the ultrasonic method was significantly higher than that prepared by the conventional method, suggesting that ultrasound treatment enhances the crystallinity and crystal integrity of stannous oxide. Moreover, the intensities of the diffraction peaks on the crystal surfaces of stannous oxide (001) and (002) increased under ultrasound. This result indicates that the introduction of ultrasound leads to an increase in the proportion of SnO with exposed (001) and (002) crystal faces, which tends to grow to form a lamellar structure [9].
According to the results in Figure 12, the main elements of the solid products obtained by ultrasound and conventional methods are Sn and O, and the atomic ratio of Sn to O is close to 1:1, and the content of Sn in the solid products obtained via the ultrasonic method is slightly higher than that obtained via the conventional method.
According to the results in Figure 13, the oxygen spectrum exhibits two distinct peaks corresponding to different binding energies. The peak at 531.7 eV can be assigned to adsorbed molecular water and hydroxyl (-OH), while the peak at 530 eV is characteristic of O-Sn2+. The O-Sn2+ content in the stannous oxide obtained by the ultrasonic method is much higher than that of the oxide obtained by the conventional method. This is due to the cavitation effect of ultrasound propagating in liquids, which can lead to a localized high-temperature and high-pressure environment. This environment promotes the formation of smaller particles of stannous oxide, which have higher surface energy [34], leading to an enhancement of the O-Sn2+ peak. Combined with the EDS results, only O-Sn2+ is present in the solid product and no elements other than Sn and O are present, which indicates that the solid product obtained is pure SnO.
Figure 14 shows the FTIR spectra of stannous oxides prepared by conventional and ultrasonic methods. The absorption peak at 470 cm−1 is usually attributed to the bending vibrational mode of Sn-O [35], the absorption peak at 550 cm−1 is attributed to the stretching vibration of Sn-O, and the absorption peak at 660 cm−1 is attributed to the antisymmetric stretching vibration of Sn-O. It can be seen that the peaks under the effect of ultrasound are slightly higher, which indicates that the stannous oxide obtained by ultrasound has higher Sn-O content. The absorption peak at 3000–3500 cm−1 is attributed to the O-H stretching vibration, which is due to the adsorption of water molecules or -OH groups on the surface of the sample [36,37]. The peak value under ultrasound is slightly higher than that under conventional conditions. This is because the stannous oxide obtained by ultrasound has a smaller particle size and larger specific surface area, which makes it easier to adsorb water molecules in the air. To further distinguish between adsorbed water and structural hydroxides, the drying duration at 60 °C was extended from 24 to 48 h, as shown in the curve labeled “conventional extended drying time” in Figure 14. The results revealed that the broad O-H stretching band (3000–3500 cm−1) nearly disappeared after prolonged drying. This demonstrates that the O-H signal originated primarily from physically adsorbed water rather than from hydroxide phases, as structural hydroxyl groups would have persisted under these conditions.

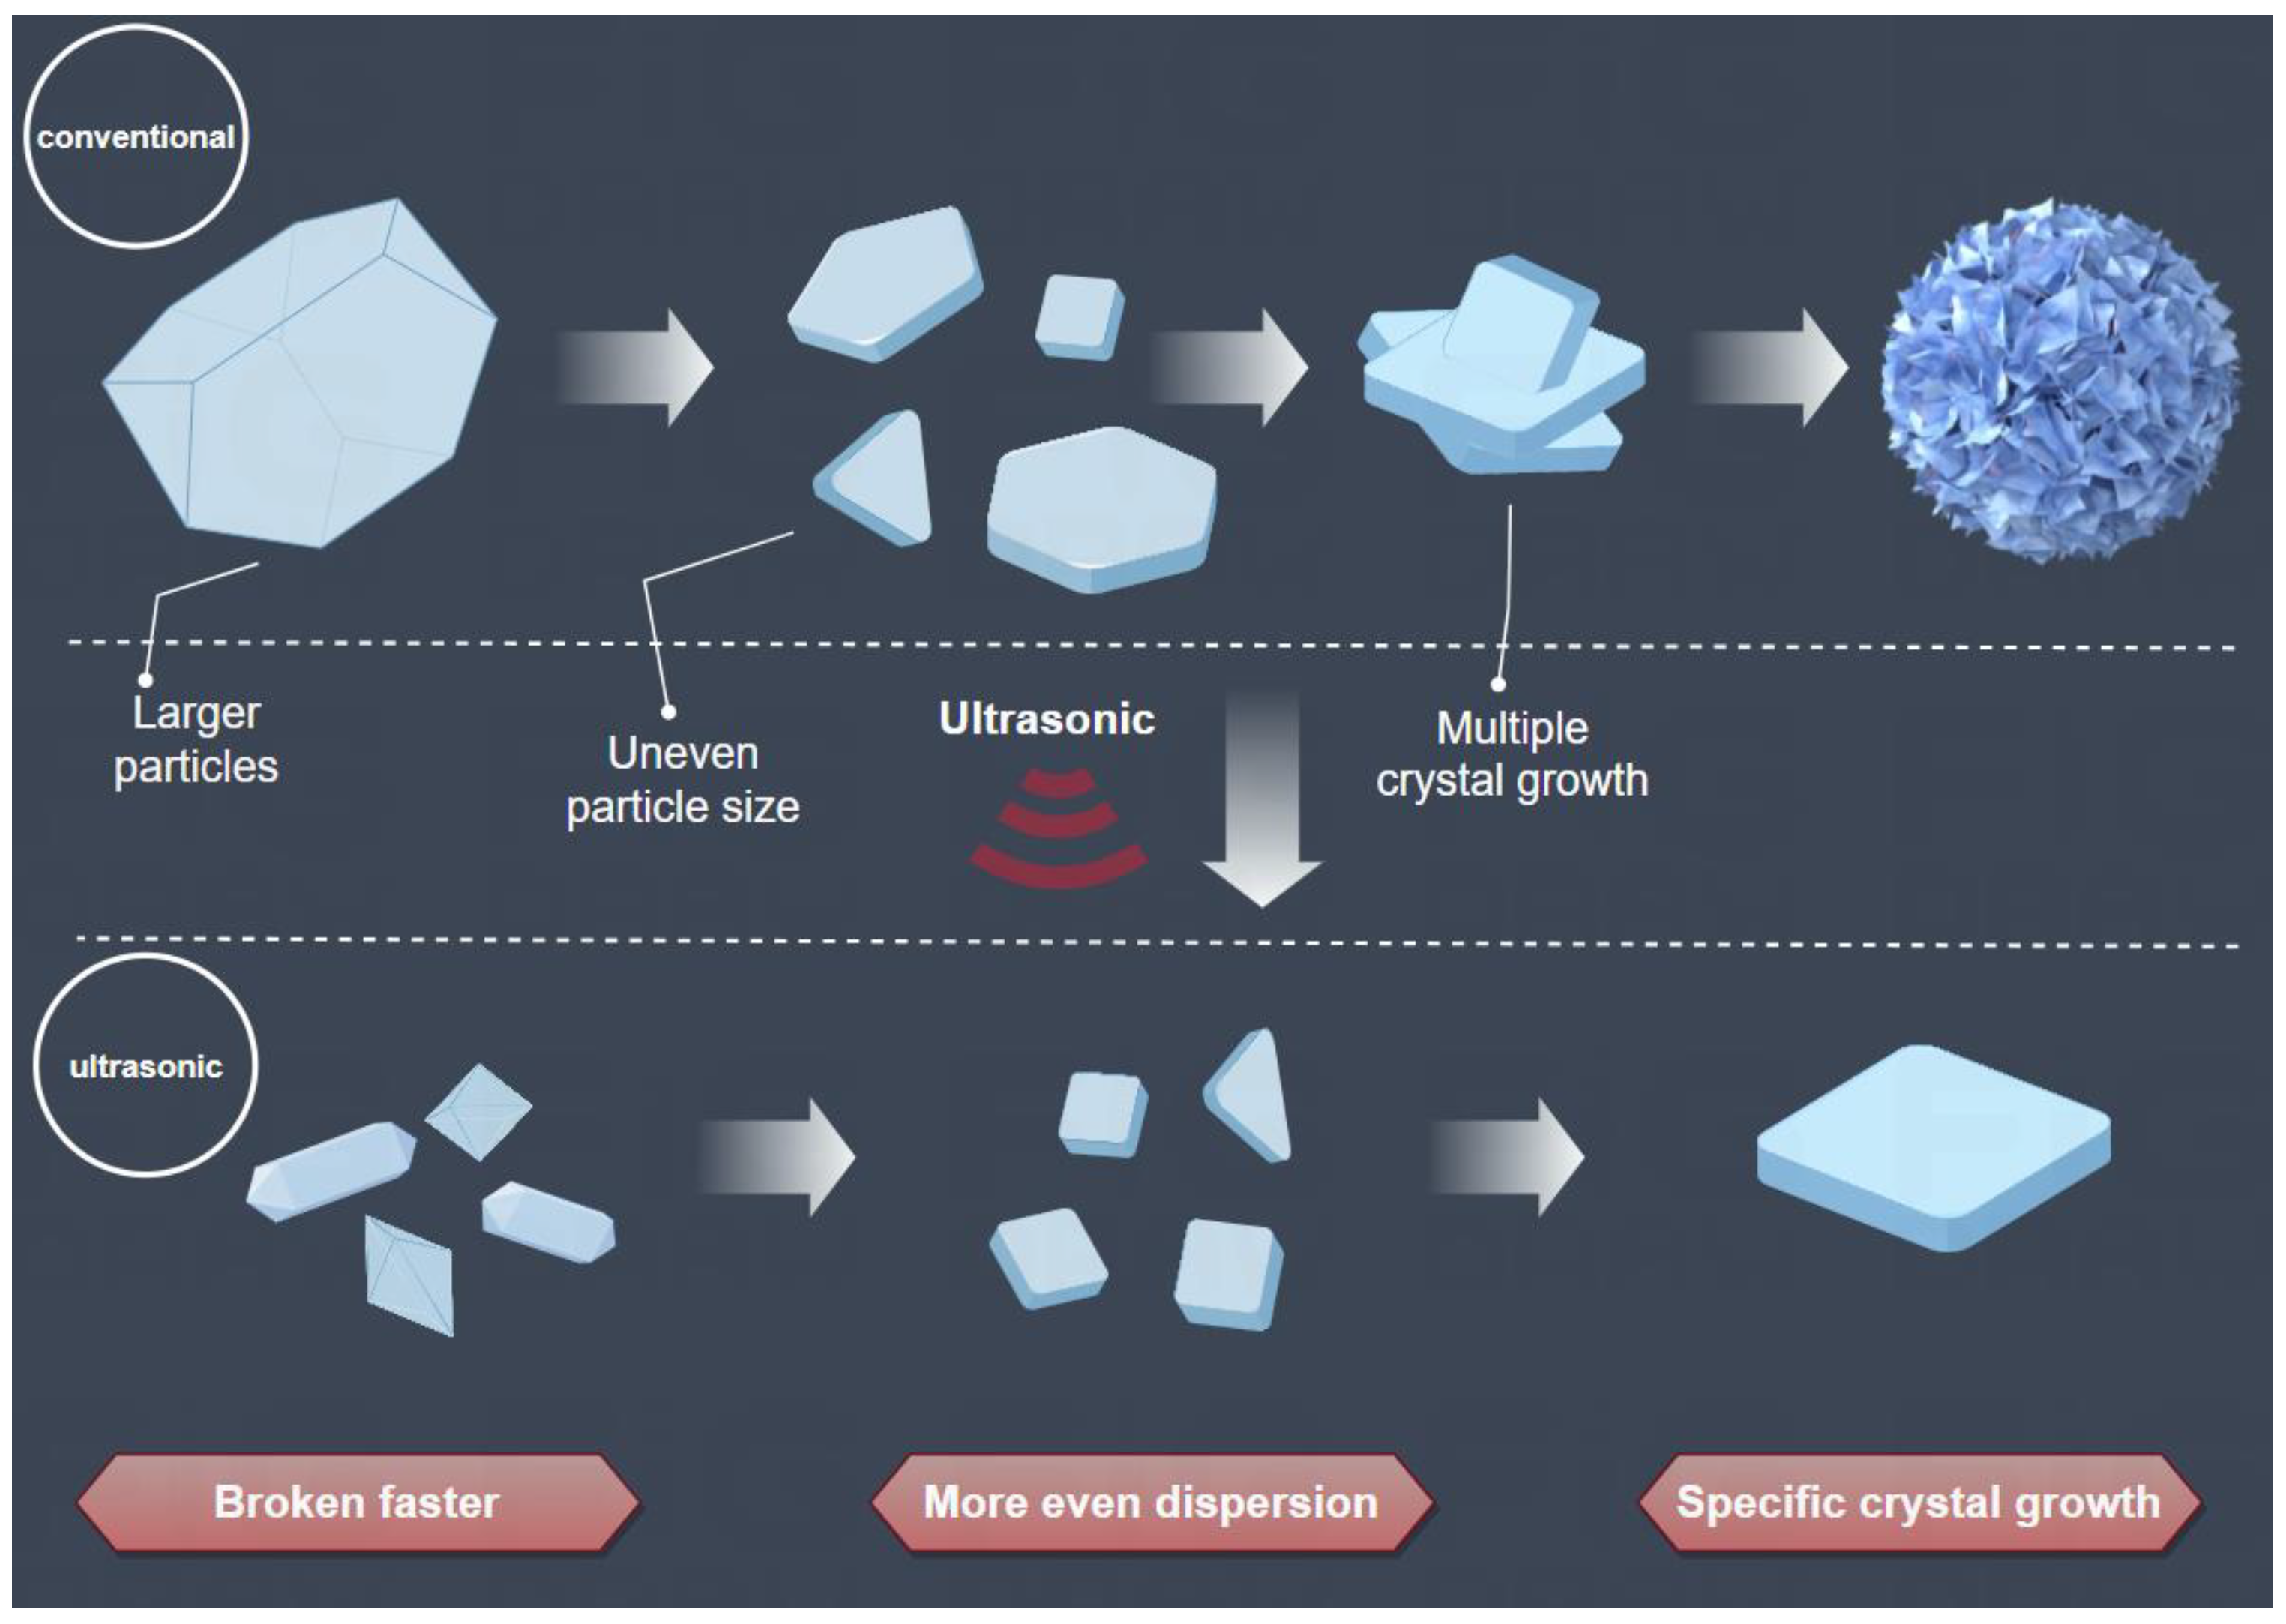
3.3. Enhanced Mechanism of Ultrasound for Product Size Control

Figure 15 shows the change in solution color with time during conventional and ultrasonic preparation of stannous oxide. In the conventional preparation process, the transformation time from the milky-white intermediate Sn6O4(OH)4 to the black precipitate SnO was approximately 420 s, which was significantly reduced to 180 s with ultrasound assistance, demonstrating that ultrasound substantially enhances the conversion of the intermediate Sn6O4(OH)4 to SnO. During the conventional process, the solution exhibited a blue-gray color at 420 s and turned dark black at 600 s, while in the ultrasonic method, the solution appeared gray at 180 s and progressed to gray-black by 300 s. The observed difference in the final color of the solutions obtained by conventional and ultrasonic methods is because the stannous oxide particles obtained by ultrasound are finer; therefore, the dispersion in the solution does not exhibit as dark a color as under conventional conditions. After the thorough reaction was completed, the reacted solution was left to stand for some time. The conventionally prepared solution delaminated quickly, whereas the solution delaminated more slowly after the addition of ultrasound, which was caused by the smaller size and better dispersion of the sample particles obtained from ultrasound preparation. Ong et al. [38] explored the effect of ultrasound assistance on the dispersion stability of stannous oxide nanoparticles in polar solvents. They reported that ultrasound could improve the dispersibility of stannous oxide nanoparticles, especially in distilled water, where the dispersion had the highest stability after 1 h of ultrasound. This suggests that ultrasound can improve the dispersibility and homogeneity of stannous oxide and reduce the agglomeration phenomenon.
After the SnCl2 solution was added, a milky-white colloid formed. After standing for about 1 min, the white colloid gradually delaminated and a white granular precipitate appeared at the bottom. This is because SnCl2 dissolves in water to generate SnCl2 aqueous solution at the beginning of the reaction. Since SnCl2 is a strong acid and weak base salt, Sn2+ is easily hydrolyzed under acidic conditions, and the following reactions occur [37]:
S n 2 +   +   H 2 O     S n ( O H ) +   +   H +
2 S n 2 + + 2 H 2 O     S n 2 ( O H ) 2 2 + + 2 H +
3 S n 2 + + 4 H 2 O     S n 3 ( O H ) 4 2 + + 4 H +
Among them, Reaction (5) is the main reaction of Sn2+ hydrolysis, and with the addition of NaOH solution, Sn3(OH)42+ is gradually converted to the intermediate product Sn6O4(OH)4. The reaction formula is as follows:
2 S n 3 ( O H ) 4 2 + + 4 O H     S n 6 O 4 ( O H ) 4 + 4 H 2 O
The intermediate product Sn6O4(OH)4 continues to react under alkaline conditions as follows:
S n 6 O 4 ( O H ) 4     6 S n O + 2 H 2 O
Figure 16 reflects the XRD patterns of the solid products obtained by conventional and ultrasonic methods with different reaction times. Under conventional conditions, Sn6O4(OH)4 was the dominant phase within 5 min, with Equation (8) representing the primary reaction. Between 5 and 15 min of reaction, with increasing time, Sn6O4(OH)4 gradually converted to SnO, as shown in Equation (9), and at 15 min, all the solid products were converted to SnO. The introduction of ultrasound greatly enhanced the rate of conversion to SnO. At 5 min, the dominant phase changed from Sn6O4(OH)4 to SnO, and the reaction mechanism followed Equation (9), indicating that ultrasound accelerated the reaction of Equation (9). The conversion time of SnO increased, and the ultrasound enhanced the growth of the (001) and (002) crystal surface, promoting the formation of tetragonal morphology. The application of ultrasound has been demonstrated to enhance the diffusion rate and collision frequency of solute molecules, resulting in a variety of effects. Firstly, it has been demonstrated that this leads to an increase in the rate of stannous oxide crystal formation. Secondly, it has been shown that it increases the number of stannous oxide crystals. Thirdly, it has been shown to inhibit the aggregation of particles, resulting in a more uniform particle size distribution [39].
Figure 17 shows the mechanism by which ultrasonication promotes particle size reduction and uniform distribution. The introduction of ultrasound promotes the conversion of the intermediate product Sn6O4(OH)4 to SnO, breaks up the formed stannous oxide particles to form smaller crystals, and enhances the dispersion of the particles in solution, thereby obtaining finer and more uniformly distributed stannous oxide particles. Ultrasound enhances the growth of the (001) and (002) crystal planes and promotes the formation of the tetragonal shape of stannous oxide.

4. Conclusions

To address the limitations of conventional SnO synthesis methods characterized by excessive particle dimensions and polydisperse distributions, a novel ultrasound-assisted room-temperature synthesis method was developed. Under optimal conditions (room temperature, pH 13, 900 W ultrasonic power, and 8 min constant-temperature time), the median particle size D50 was reduced to 5.2 μm with a narrowed monomodal distribution (2.9–8.7 μm), in contrast with conventional products, which exhibited a 20 μm median particle size D50 and broad bimodal dispersion (6.6–400 μm). The XRD and SEM results demonstrated that ultrasonic synthesis accelerated the conversion of the intermediate product Sn6O4(OH)4 to SnO, while promoting tetragonal growth through preferential (001) and (002) facet exposure, suppressing particle aggregation, and thereby producing finer and more uniformly distributed stannous oxide particles. BET and XPS results revealed an increased specific surface area and elevated O-Sn2+ content, indicating that modified surface reactivity was induced by ultrasonic synthesis. This methodology establishes an efficient room-temperature approach for producing SnO with controlled particle dimensions and improved homogeneity, offering a sustainable solution for industrial applications.

Author Contributions

Conceptualization, T.L.; methodology, M.F. and L.X.; software, M.F.; validation, L.X. and Q.Z.; formal analysis, M.F., L.X., Q.Z. and T.X.; investigation, Q.Z. and T.X.; resources, L.Z.; data curation, M.F.; writing—original draft preparation, M.F.; writing—review and editing, T.L. and L.Z.; visualization, M.F.; supervision, L.Z.; project administration, T.L.; funding acquisition, L.Z. All authors have read and agreed to the published version of the manuscript.

Funding

This work was financially supported by Yunnan Province Key R&D Plan (grant number: 202403AK140009), Yunnan Major Scientific and Technological Project (grant number: 202302AG050008), and “Yunnan Revitalization Talents Support Plan” High-end Foreign Talents Program.

Data Availability Statement

The original contributions presented in the study are included in the article. Further inquiries can be directed to the corresponding authors.

Conflicts of Interest

The authors declare no conflict of interest.

References

  1. Kelaidis, N.; Bousiadi, S.; Zervos, M.; Chroneos, A.; Lathiotakis, N.N. Electronic Properties of the Sn1−xPbx O Alloy and Band Alignment of the SnO/PbO System: A DFT Study. Sci. Rep. 2020, 10, 16828. [Google Scholar] [CrossRef]
  2. Panda, S.A.; Barala, S.; Hazra, A.; Gangopadhyay, S. Formation of All Tin Oxide p–n Junctions (SnO–SnO2) during Thermal Oxidation of Thin Sn Films. Phys. Status Solidi A—Appl. Mater. Sci. 2024, 627, 2400698. [Google Scholar] [CrossRef]
  3. Errico, L.A. Ab Initio FP-LAPW Study of the Semiconductors SnO and SnO2. Phys. B Condens. Matter 2007, 389, 140–144. [Google Scholar] [CrossRef]
  4. Chen, P.-J.; Jeng, H.-T. Phase Diagram of the Layered Oxide SnO: GW and Electron-Phonon Studies. Sci. Rep. 2015, 5, 16359. [Google Scholar] [CrossRef]
  5. Shi, H.; Deng, R.; Jiang, D.; Li, Y. Enhancing Photo-Response Performance through Ultrathin Al2O3 Modification at the p-SnO2: Al/n-GaN Heterojunction Interface. Opt. Mater. 2024, 156, 115950. [Google Scholar] [CrossRef]
  6. Sowmya, B.; John, A.; Panda, P.K. A Review on Metal-Oxide Based p-n and n-n Heterostructured Nano-Materials for Gas Sensing Applications. Sens. Int. 2021, 2, 100085. [Google Scholar] [CrossRef]
  7. Zhang, X.; Li, D.; Wang, L.; Yang, F.; Wang, Y. Induced Electron Transfer by Oxygen Vacancy Gradient on SnO2 Conductive Glass for Electrocatalytic Reduction. Sci. China Mater. 2021, 64, 2081–2085. [Google Scholar] [CrossRef]
  8. Han, Y.; Wu, X.; Shen, G.; Dierre, B.; Gong, L.; Qu, F.; Bando, Y.; Sekiguchi, T.; Filippo, F.; Golberg, D. Solution Growth and Cathodoluminescence of Novel SnO2 Core-Shell Homogeneous Microspheres. J. Phys. Chem. C 2010, 114, 8235–8240. [Google Scholar] [CrossRef]
  9. Zhang, R. Morphology Controlled Synthesis of SnO and TiO2/SnO Heterojunctions with Enhanced Photocatalytic Properties. Ph.D. Thesis, University of Science and Technology Beijing, Beijing, China, 2021. [Google Scholar]
  10. Jain, R.; Lakhnot, A.S.; Bhimani, K.; Sharma, S.; Mahajani, V.; Panchal, R.A.; Kamble, M.; Han, F.; Wang, C.; Koratkar, N. Nanostructuring versus Microstructuring in Battery Electrodes. Nat. Rev. Mater. 2022, 7, 736–746. [Google Scholar] [CrossRef]
  11. Guo, Y.; Hu, Y.; Zhang, Q.; Ruan, G.; Mao, Y.; Zhang, H.; Wang, R.; Zhao, P.; Li, M.; Tang, H.; et al. Fabrication of SnO2 Micron-Rods Embedding in 3D Composite of Graphene oxide@ MWNTs as High-Performance Anode for Lithium-Ion Batteries. J. Energy Storage 2023, 74, 109479. [Google Scholar] [CrossRef]
  12. Deng, P.; Ning, H.; Xie, W.; Liu, X.; Deng, Y.; Yao, R.; Peng, J. Research progress in stannous oxide thin film transistors. Mater. Eng. 2020, 48, 83–88. [Google Scholar]
  13. Jagadish, K.; Rai, R.K.; Pandey, M.; Chandni, U.; Ravishankar, N. Mutual Stabilization of Metastable Phases of Tin Oxide: Epitaxial Encapsulation of Tetragonal SnO Microcrystals by Orthorhombic SnO2. J. Phys. Chem. C 2022, 126, 15001–15010. [Google Scholar] [CrossRef]
  14. Kılıç, Ç.; Zunger, A. Origins of Coexistence of Conductivity and Transparency in SnO2. Phys. Rev. Lett. 2002, 88, 095501. [Google Scholar] [CrossRef]
  15. Iqbal, M.Z.; Wang, F.; Rafiuddin; Javed, Q.; Rafique, M.Y.; Li, Y.; Li, P. Preparation, Characterization and Optical Properties of Tin Monoxide Micro-Nano Structure via Hydrothermal Synthesis. Mater. Lett. 2012, 68, 409–412. [Google Scholar] [CrossRef]
  16. Qin, B.; Zhang, H.; Diemant, T.; Geiger, D.; Raccichini, R.; Behm, R.J.; Kaiser, U.; Varzi, A.; Passerini, S. Ultrafast Ionic Liquid-Assisted Microwave Synthesis of SnO Microflowers and Their Superior Sodium-Ion Storage Performance. ACS Appl. Mater. Interfaces 2017, 9, 26797–26804. [Google Scholar] [CrossRef]
  17. Uchiyama, H.; Nakanishi, S.; Kozuka, H. Hydrothermal Synthesis of Nanostructured SnO Particles through Crystal Growth in the Presence of Gelatin. J. Solid State Chem. 2014, 217, 87–91. [Google Scholar] [CrossRef]
  18. Jordens, J.; Canini, E.; Gielen, B.; Van Gerven, T.; Braeken, L. Ultrasound Assisted Particle Size Control by Continuous Seed Generation and Batch Growth. Crystals 2017, 7, 195. [Google Scholar] [CrossRef]
  19. Ashokkumar, M. The Characterization of Acoustic Cavitation Bubbles—An Overview. Ultrason. Sonochem. 2011, 18, 864–872. [Google Scholar] [CrossRef] [PubMed]
  20. Gielen, B.; Claes, T.; Janssens, J.; Jordens, J.; Thomassen, L.C.J.; Gerven, T.V.; Braeken, L. Particle Size Control during Ultrasonic Cooling Crystallization of Paracetamol. Chem. Eng. Technol. 2017, 40, 1300–1308. [Google Scholar] [CrossRef]
  21. Furusawa, A.; Hine, K.; Hayashi, Y.; Takizawa, H. Formation of Particle of Bismuth-Indium Alloys and Particle Diameter by Ultrasonic Cavitation. Ultrason. Sonochem. 2019, 50, 322–330. [Google Scholar] [CrossRef]
  22. Belca, L.M.; Ručigaj, A.; Teslič, D.; Krajnc, M. The Use of Ultrasound in the Crystallization Process of an Active Pharmaceutical Ingredient. Ultrason. Sonochem. 2019, 58, 104642. [Google Scholar] [CrossRef] [PubMed]
  23. Liu, H.; Hao, J.; Niu, Q.; Du, Q.; Zheng, X.; Liu, H.; Yang, H. Influence of Ultrasonic Assistance on the Microstructure and Friction Properties of Laser Cladded Ni60/WC Composite Coatings. J. Alloys Compd. 2025, 1010, 177149. [Google Scholar] [CrossRef]
  24. Zhou, N.; Zhang, C.; Zeng, X.; Yuan, J.; Zhou, L. A Molecular Dynamics Study of the Growth Rate of SiC Crystal and Its Dependence on the Temperature. Int. J. Mod. Phys. B 2016, 30, 1650152. [Google Scholar] [CrossRef]
  25. Ji, S.; Ji, X.; Song, Y.; Wei, Y.; Duan, T. Effect of Sintering Temperature on Crystal Growth and Evolution of CaZrTi2O7–CaNdTiNbO7 Ceramics: Minor Actinides Immobilization Host Materials. Nucl. Eng. Des. 2024, 429, 113643. [Google Scholar] [CrossRef]
  26. Wang, D.; Zhong, J.; Sun, B.; Bao, X.; Zhang, J. Tin Oxide Nanoparticles with Controlled Morphology and Particle Size by Hydrothermal Method. J. Inorg. Chem. 2008, 24, 892–896. [Google Scholar]
  27. Al-Attri, R.; Halladj, R.; Askari, S. Green Route of Flexible Al-MOF Synthesis with Superior Properties at Low Energy Consumption Assisted by Ultrasound Waves. Solid State Sci. 2022, 123, 106782. [Google Scholar] [CrossRef]
  28. Ruecroft, G.; Hipkiss, D.; Ly, T.; Maxted, N.; Cains, P.W. Sonocrystallization: The Use of Ultrasound for Improved Industrial Crystallization. Org. Process Res. Dev. 2005, 9, 923–932. [Google Scholar] [CrossRef]
  29. Wu, M.; Jiang, B.; Huang, P.; Wu, W. Ultrasound-Assisted Synthesis of PDA Nanoparticles with Controllable Size Regulation. Mater. Lett. 2023, 351, 135073. [Google Scholar] [CrossRef]
  30. Guo, Y.; Bao, H.; Fu, H.; Zhang, H.; Li, W.; Cai, W. Ultrasonic Emulsification Preparation of Metallic Rubidium Sol and Its Ignition Performance. J. Met. 2022, 58, 792–798. [Google Scholar]
  31. Yang, G.; Lin, W.; Lai, H.; Tong, J.; Lei, J.; Yuan, M.; Zhang, Y.; Cui, C. Understanding the Relationship between Particle Size and Ultrasonic Treatment during the Synthesis of Metal Nanoparticles. Ultrason. Sonochem. 2021, 73, 105497. [Google Scholar] [CrossRef]
  32. Aprile, C.; Teruel, L.; Alvaro, M.; Garcia, H. Structured Mesoporous Tin Oxide with Electrical Conductivity. Application in Electroluminescence. J. Am. Chem. Soc. 2009, 131, 1342–1343. [Google Scholar] [CrossRef]
  33. Grabowy, M.; Wojteczko, A.; Komarek, S.; Wilk, A.; Pędzich, Z. ATZ Composites with Enhanced Mechanical Reliability and Lifetime. J. Eur. Ceram. Soc. 2024, 44, 5319–5325. [Google Scholar] [CrossRef]
  34. Mahdavi, R.; Ashraf Talesh, S.S. The Effect of Ultrasonic Irradiation on the Structure, Morphology and Photocatalytic Performance of ZnO Nanoparticles by Sol-Gel Method. Ultrason. Sonochem. 2017, 39, 504–510. [Google Scholar] [CrossRef] [PubMed]
  35. Karmaoui, M.; Jorge, A.B.; McMillan, P.F.; Aliev, A.E.; Pullar, R.C.; Labrincha, J.A.; Tobaldi, D.M. One-Step Synthesis, Structure, and Band Gap Properties of SnO2 Nanoparticles Made by a Low Temperature Nonaqueous Sol–Gel Technique. ACS Omega 2018, 3, 13227–13238. [Google Scholar] [CrossRef]
  36. Sharif, M.S.; Aqeel, M.; Haider, A.; Naz, S.; Ikram, M.; Ul-Hamid, A.; Haider, J.; Aslam, I.; Nazir, A.; Butt, A.R. Photocatalytic, Bactericidal and Molecular Docking Analysis of Annealed Tin Oxide Nanostructures. Nanoscale Res. Lett. 2021, 16, 33. [Google Scholar] [CrossRef]
  37. Ibarguen, C.A.; Mosquera, A.; Parra, R.; Castro, M.S.; Rodríguez-Páez, J.E. Synthesis of SnO2 Nanoparticles through the Controlled Precipitation Route. Mater. Chem. Phys. 2007, 101, 433–440. [Google Scholar] [CrossRef]
  38. Ong, C.; Lee, W.; Lim, L.; Chong, W.; Chew, J.; Hayashi, Y.; Nishikawa, T.; Öhberg, P.; Ahmad, H.; Yap, Y. Dispersion Stability of Tin(IV) Oxide Nanoparticles in Polar Solvents and Water Aided by Ultrasonication. Jpn. J. Appl. Phys. 2023, 62, 035002. [Google Scholar] [CrossRef]
  39. Xiang, L.; Fu, M.; Wang, T.; Wang, D.; Xv, H.; Miao, W.; Le, T.; Zhang, L.; Hu, J. Application and Development of Ultrasound in Industrial Crystallization. Ultrason. Sonochem. 2024, 111, 107062. [Google Scholar] [CrossRef]
Figure 1. Experimental procedure flowchart.
Metals 15 00643 g001
Figure 2. Actual photographs of solid products obtained at different endpoint pH values. (a) pH = 7; (b) pH = 9; (c) pH = 11; (d) pH = 13; (e) pH = 14.
Metals 15 00643 g002
Figure 3. XRD patterns of solid products obtained at different endpoint pH values.
Metals 15 00643 g003
Figure 4. Effect of reaction temperature on the median particle size D50 of stannous oxide.
Metals 15 00643 g004
Figure 5. Effect of constant-temperature time on the median particle size D50 of stannous oxide under conventional and ultrasonic action.
Metals 15 00643 g005
Figure 6. Product size obtained by conventional preparation (ac) and ultrasonic preparation (df) with different constant-temperature times.
Metals 15 00643 g006
Figure 7. Effect of ultrasonic power on the median particle size D50 of stannous oxide.
Metals 15 00643 g007
Figure 8. (a) Ultrasonic power 720 W. (b) Ultrasonic power 900 W. (c) Ultrasonic power 1080 W. (d) Ultrasonic power 1260 W.
Metals 15 00643 g008
Figure 9. Particle size distribution of stannous oxide under conventional optimal conditions (a) and under optimal ultrasonic conditions (b).
Metals 15 00643 g009
Figure 10. (a) Conventional constant-temperature time 8 min. (b) Ultrasonic constant-temperature time 8 min.
Metals 15 00643 g010
Figure 11. Comparison of XRD patterns of conventional and ultrasonically obtained stannous oxide.
Metals 15 00643 g011
Figure 12. (a) Stannous oxide EDS obtained conventionally. (b) Stannous oxide EDS obtained by sonication.
Metals 15 00643 g012
Figure 13. Comparison of XPS oxygen spectra of stannous oxide obtained by conventional and ultrasound.
Metals 15 00643 g013
Figure 14. FTIR spectra of conventional and ultrasonically obtained stannous oxides.
Metals 15 00643 g014
Figure 15. (a) Variation of solution with time for conventional reaction process. (b) Variation of solution with time for ultrasonic reaction process.
Metals 15 00643 g015
Figure 16. XRD patterns of solid products obtained by conventional (blue) and ultrasonic (red) methods at different reaction times.
Metals 15 00643 g016
Figure 17. Mechanism diagram of ultrasound action.
Metals 15 00643 g017
Table 1. Sn contents of stannous oxide obtained by conventional and ultrasonic conditions.
SamplesSn%SnO Content%
Conventional85.4897
Ultrasonic86.9998.7
Table 2. BET results of stannous oxide samples obtained by ultrasonic and conventional methods.
SampleSpecific Surface Area (m2/g)Pore Volume
(m3/g)
Average Pore Size (nm)
Conventional1.0990.0053.417
Ultrasonic2.8770.0063.407
Disclaimer/Publisher’s Note: The statements, opinions and data contained in all publications are solely those of the individual author(s) and contributor(s) and not of MDPI and/or the editor(s). MDPI and/or the editor(s) disclaim responsibility for any injury to people or property resulting from any ideas, methods, instructions or products referred to in the content.

