
The Overload-Induced Delay Model of 7055 Aluminum Alloy Under Periodic Overloading


Abstract
1. Introduction
2. Materials and Test Conditions
2.1. Specimens
2.2. FCG Experiments
3. Experiment Results and Discussion
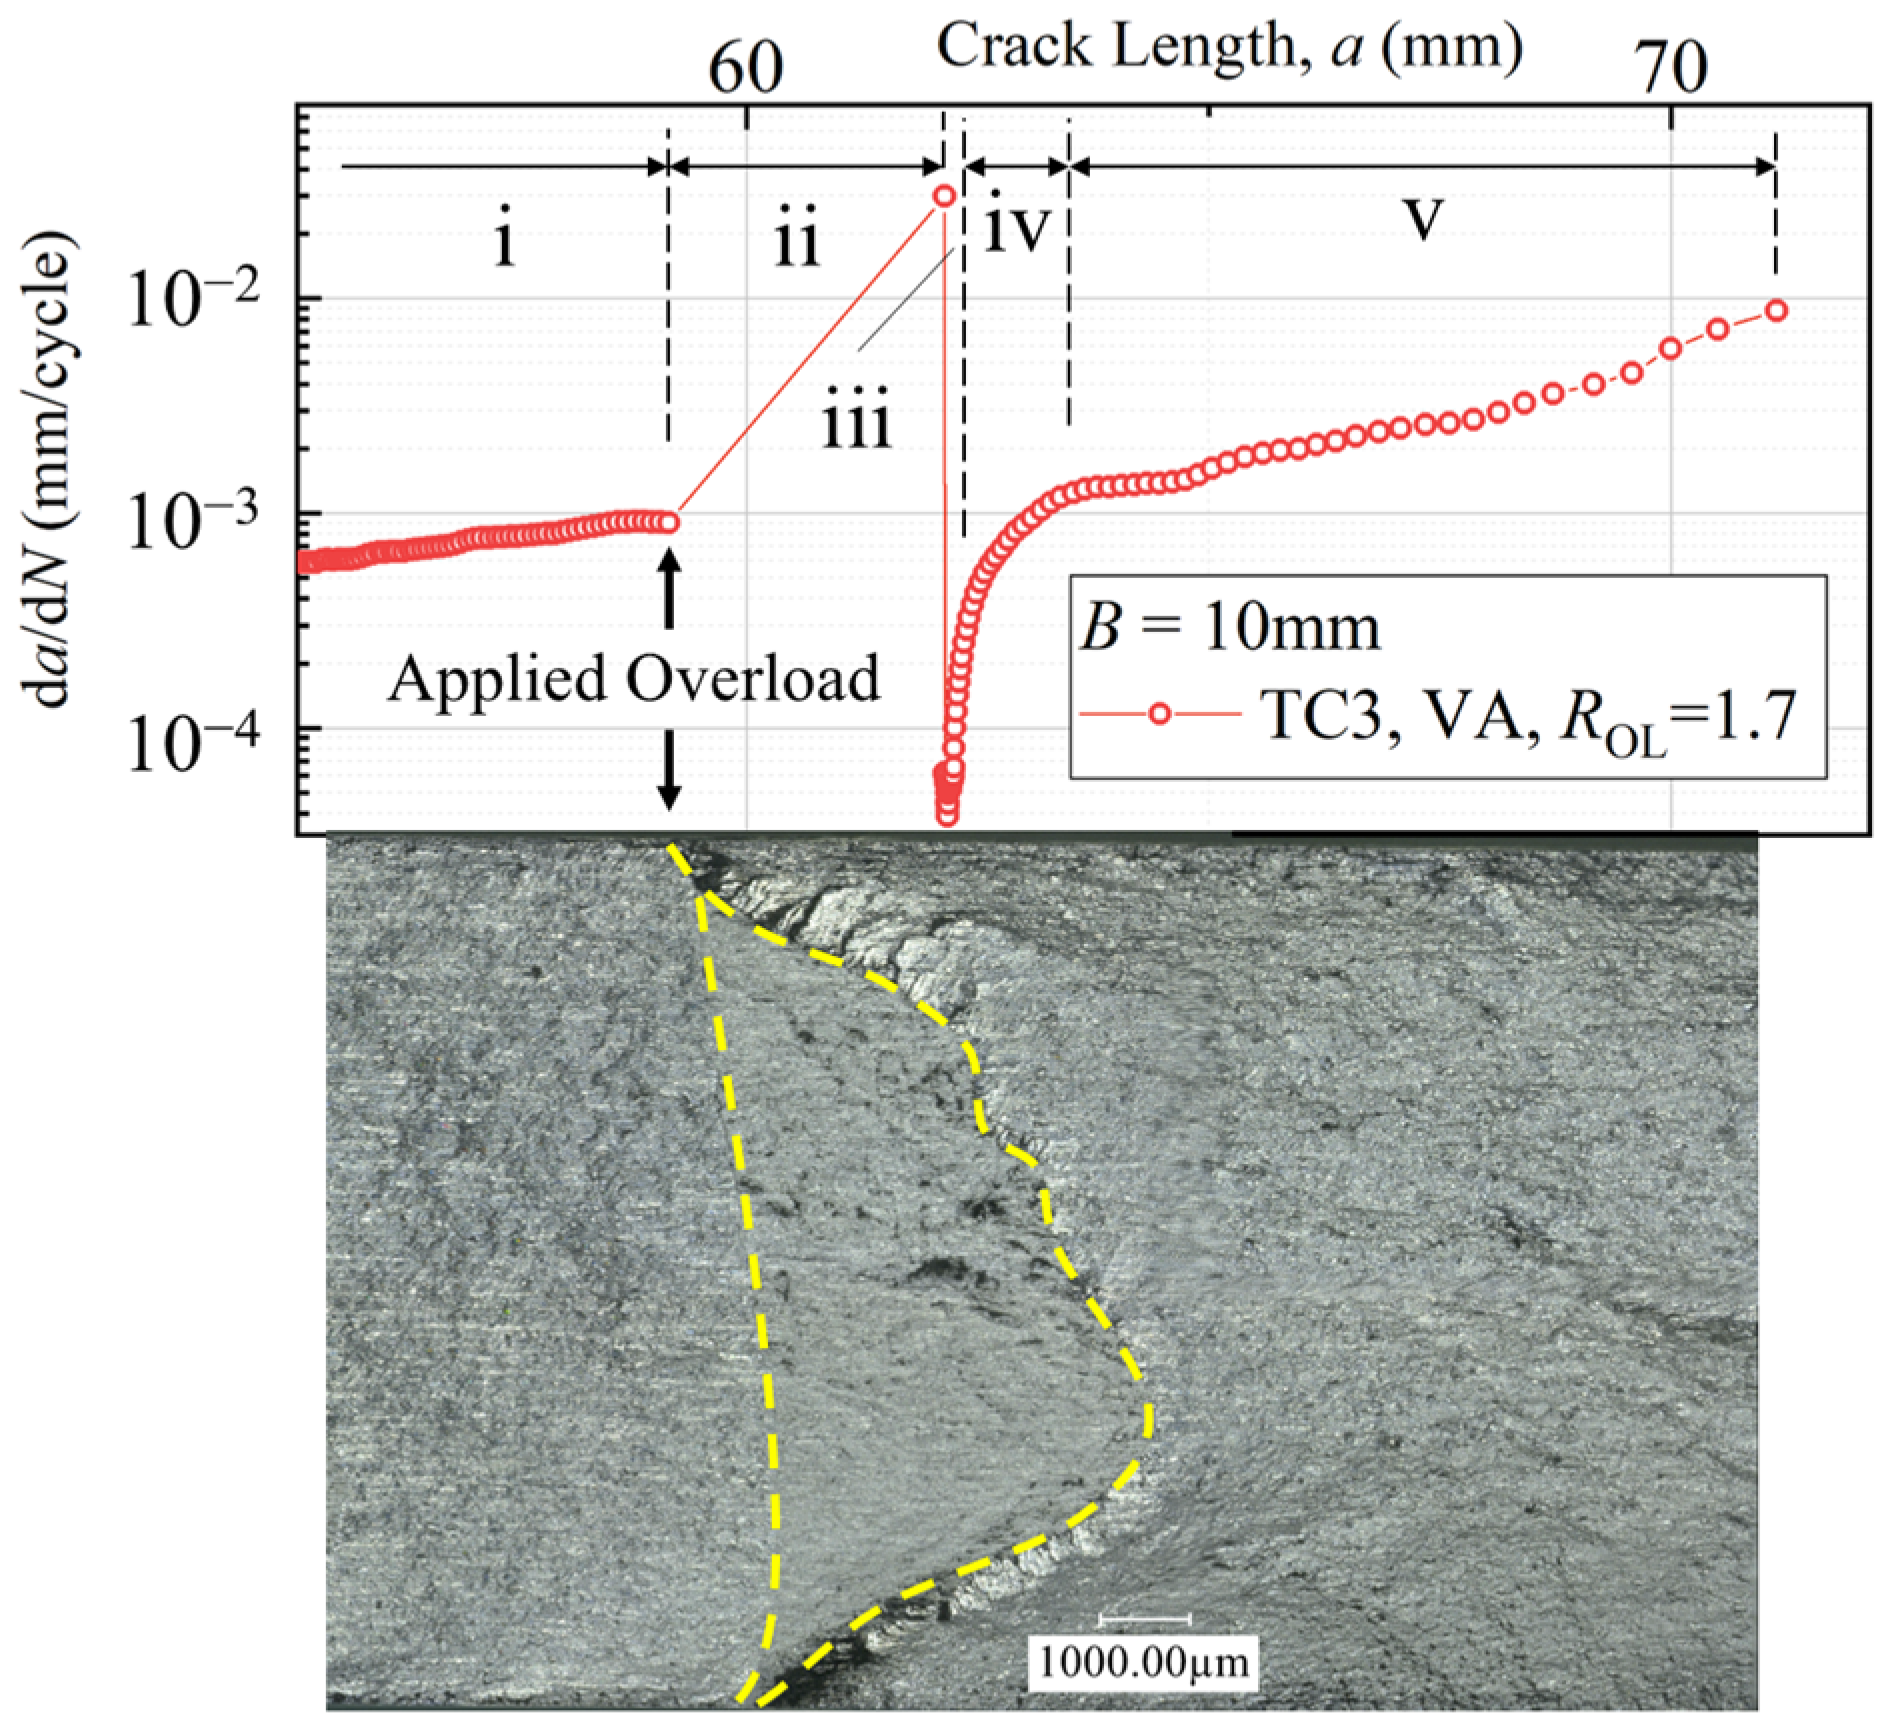
3.1. FCG Behavior Affected by Overload
- (i)
- Stable period before overload: In this stage, the FCG behavior is consistent with that under CA loading. The FCG rate da/dN can still be calculated and predicted by the Paris equation.
- (ii)
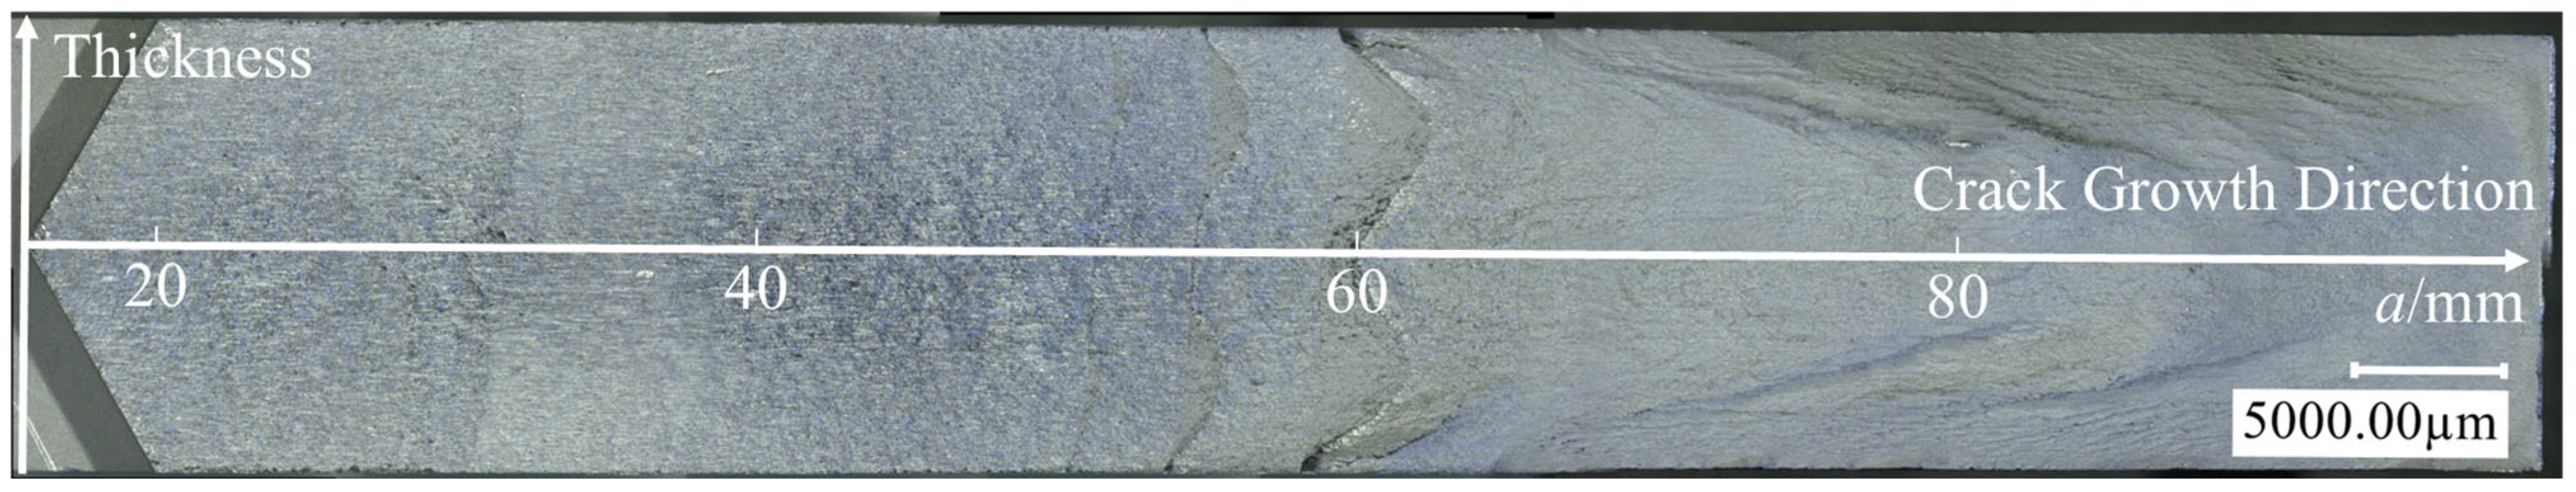
- Instantaneous acceleration period: Following the application of overload, the crack tip undergoes blunting, and the crack closure level established under the baseline loading immediately decreases. Concurrently, the applied overload POL, which exceeds the maximum baseline cyclic load Pmax, results in an effective SIF range ΔKeff higher than that before the overload (ΔKeff = Kmax − Kop, where Kop is the SIF at crack opening). Consequently, the crack tip propagates at an increased FCG rate. It is worth noting that the observable portion of this stage, as indicated by the area enclosed by the yellow dashed lines in Figure 8, was generated during a single overload cycle. This is because no fatigue striations were observed in the localized examination of this region, and its characteristics are consistent with those of static fracture. In other words, under a single tensile overload during periodic loading, this stage corresponds to only one overload cycle, after which the subsequent loading transitions directly into Stage iii.
- (iii)
- Delayed retardation period: After the overload is applied, the crack tip enters the overload plastic zone. The compressive residual stresses generated in the crack tip region during the overload process appear in the wake of the crack tip, leading to a rapid increase in the crack closure level. This causes ΔKeff to decrease swiftly, reaching the minimum FCG rate.
- (iv)
- Retardation period: As the crack continues to propagate further within the overload plastic zone, Kop decreases, and ΔKeff gradually increases, resulting in a gradual rise in da/dN. Due to the inherently three-dimensional nature of the crack opening, Kop in the plane strain region at the crack front is lower than that in the plane stress region on the specimen surface [34]. Therefore, the crack initially begins to open at the mid-thickness of the specimen and then extends towards the specimen surface, concurrently propagating forward.
- (v)
- Stable period after overload: Once the crack propagation extends beyond the influence range of the overload, the FCG rate returns to that under CA loading conditions. The hysteretic process induced by the single overload event concludes.
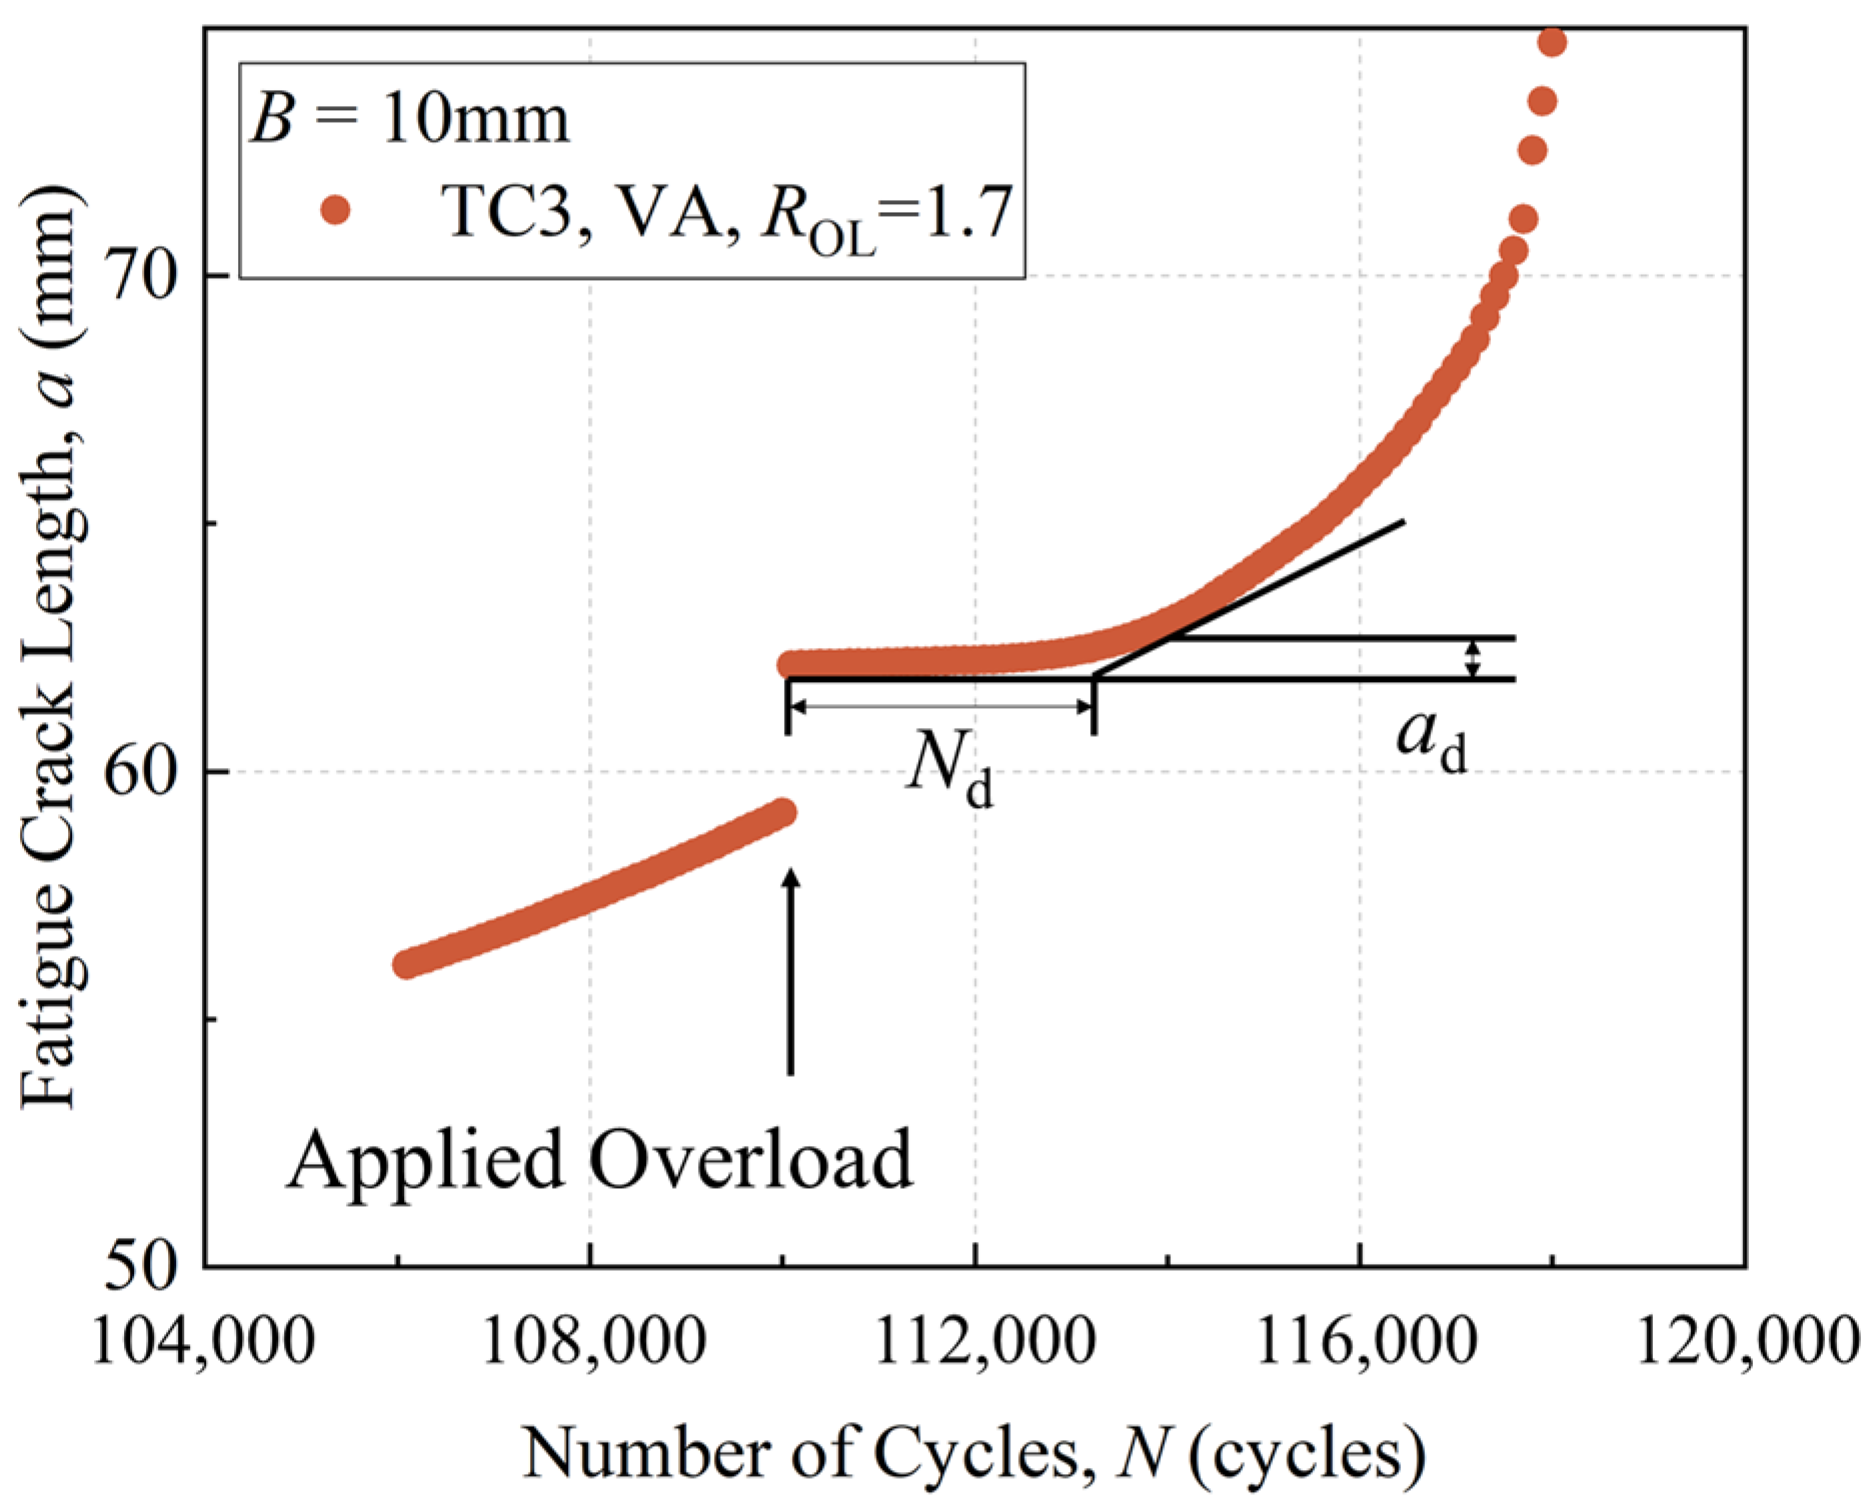
3.2. Delay Distance ad
3.3. Instantaneous Acceleration Period
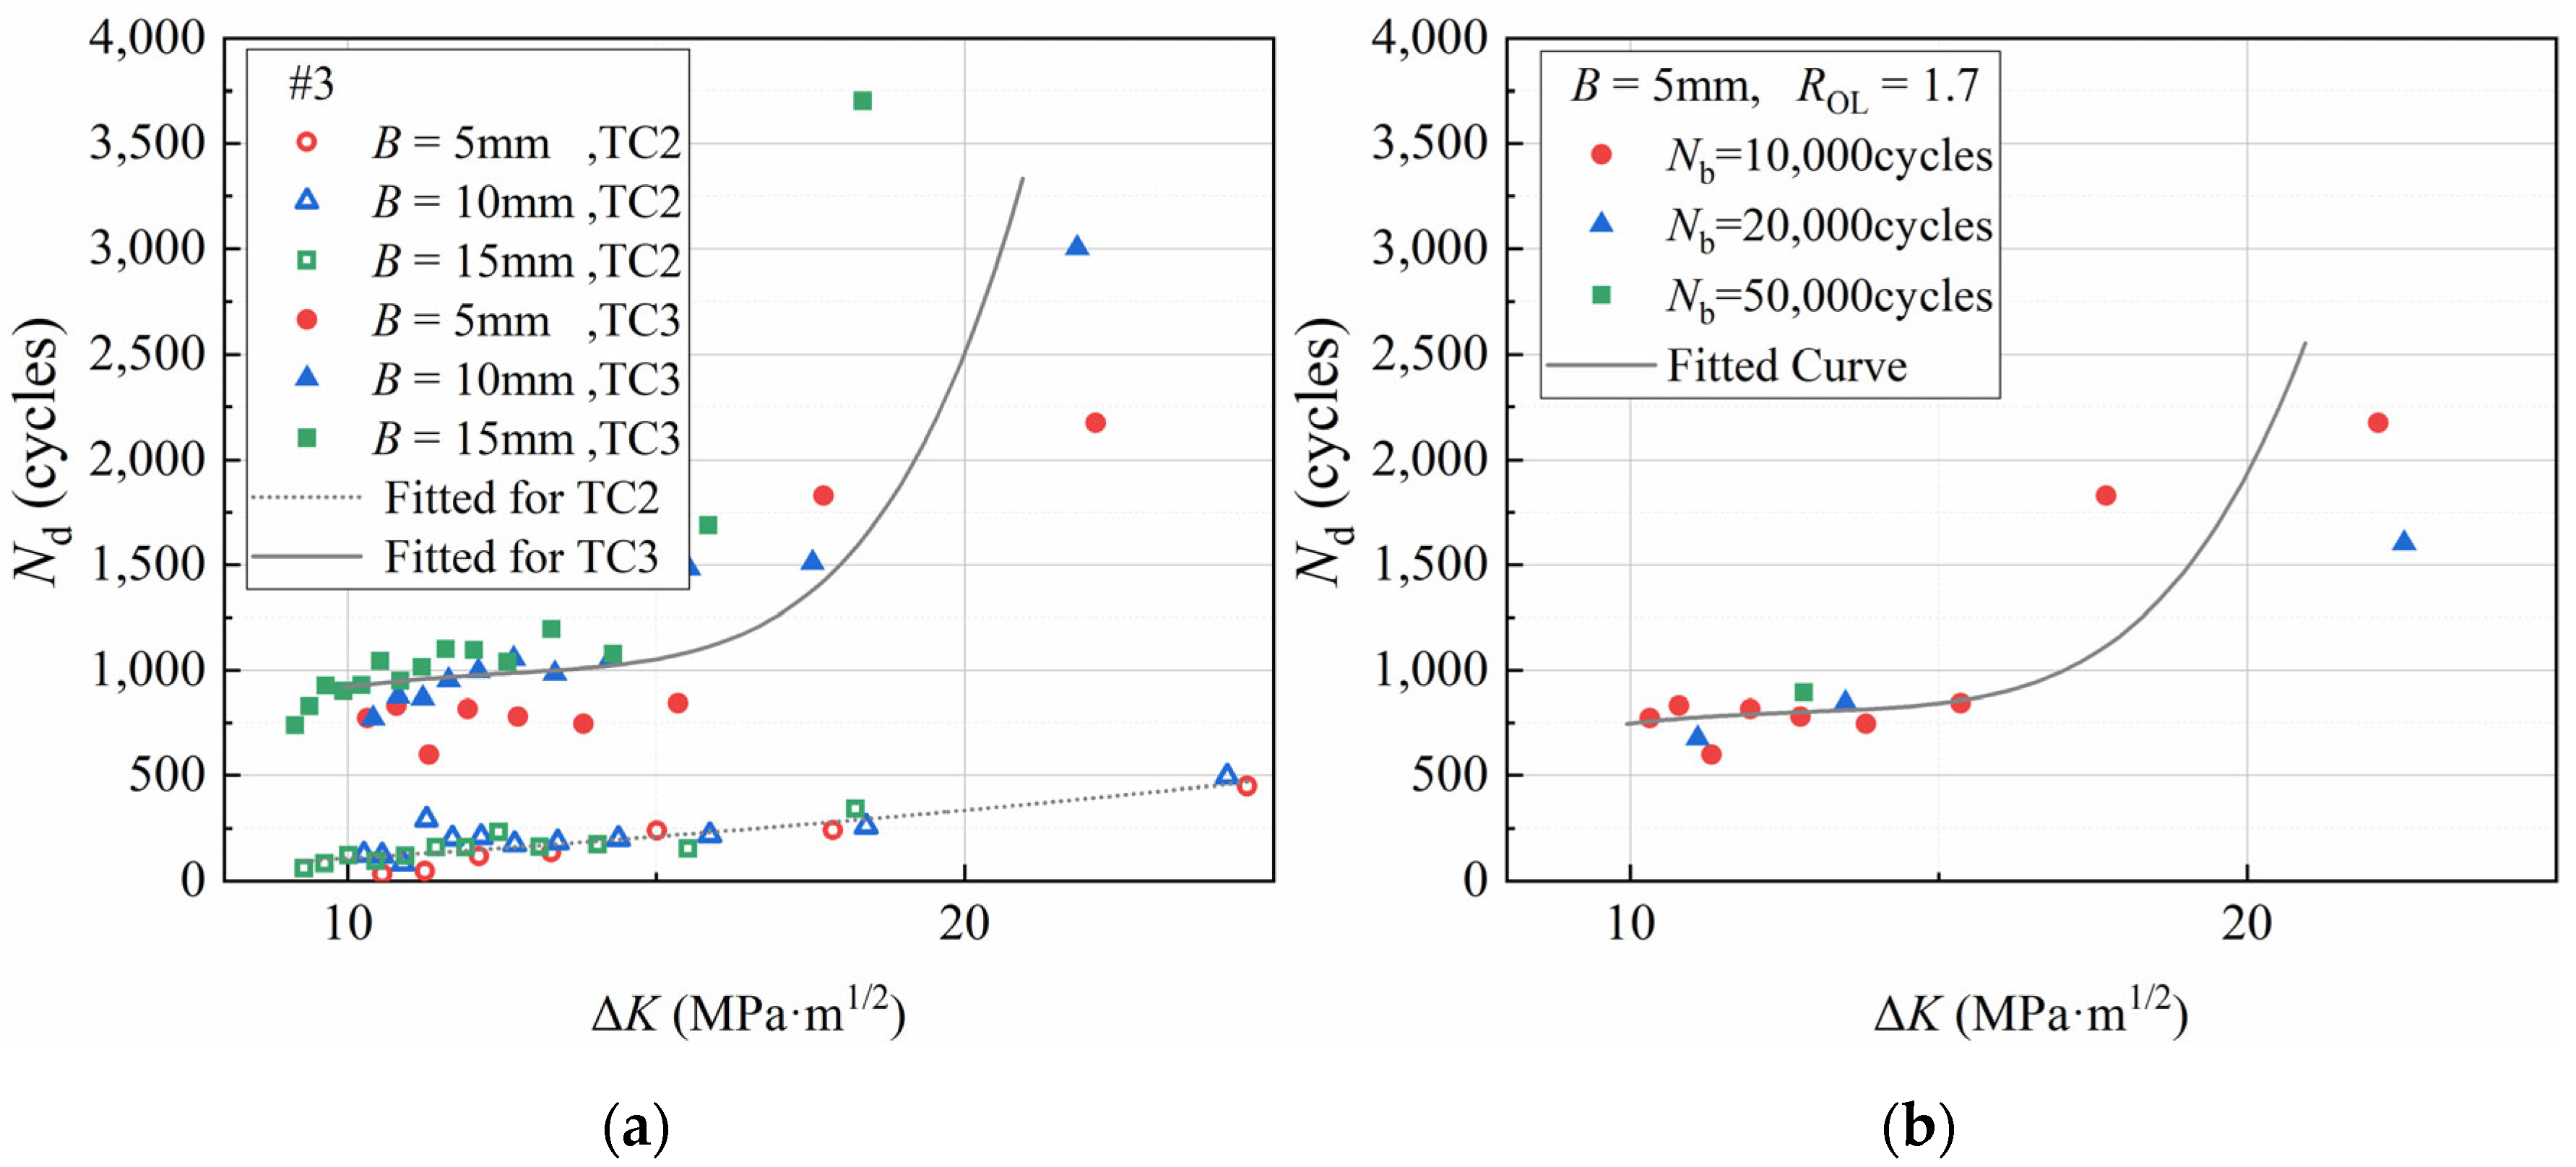
3.4. Delay Cycles Nd
3.5. Characteristics of the Fracture Surface
4. Conclusions
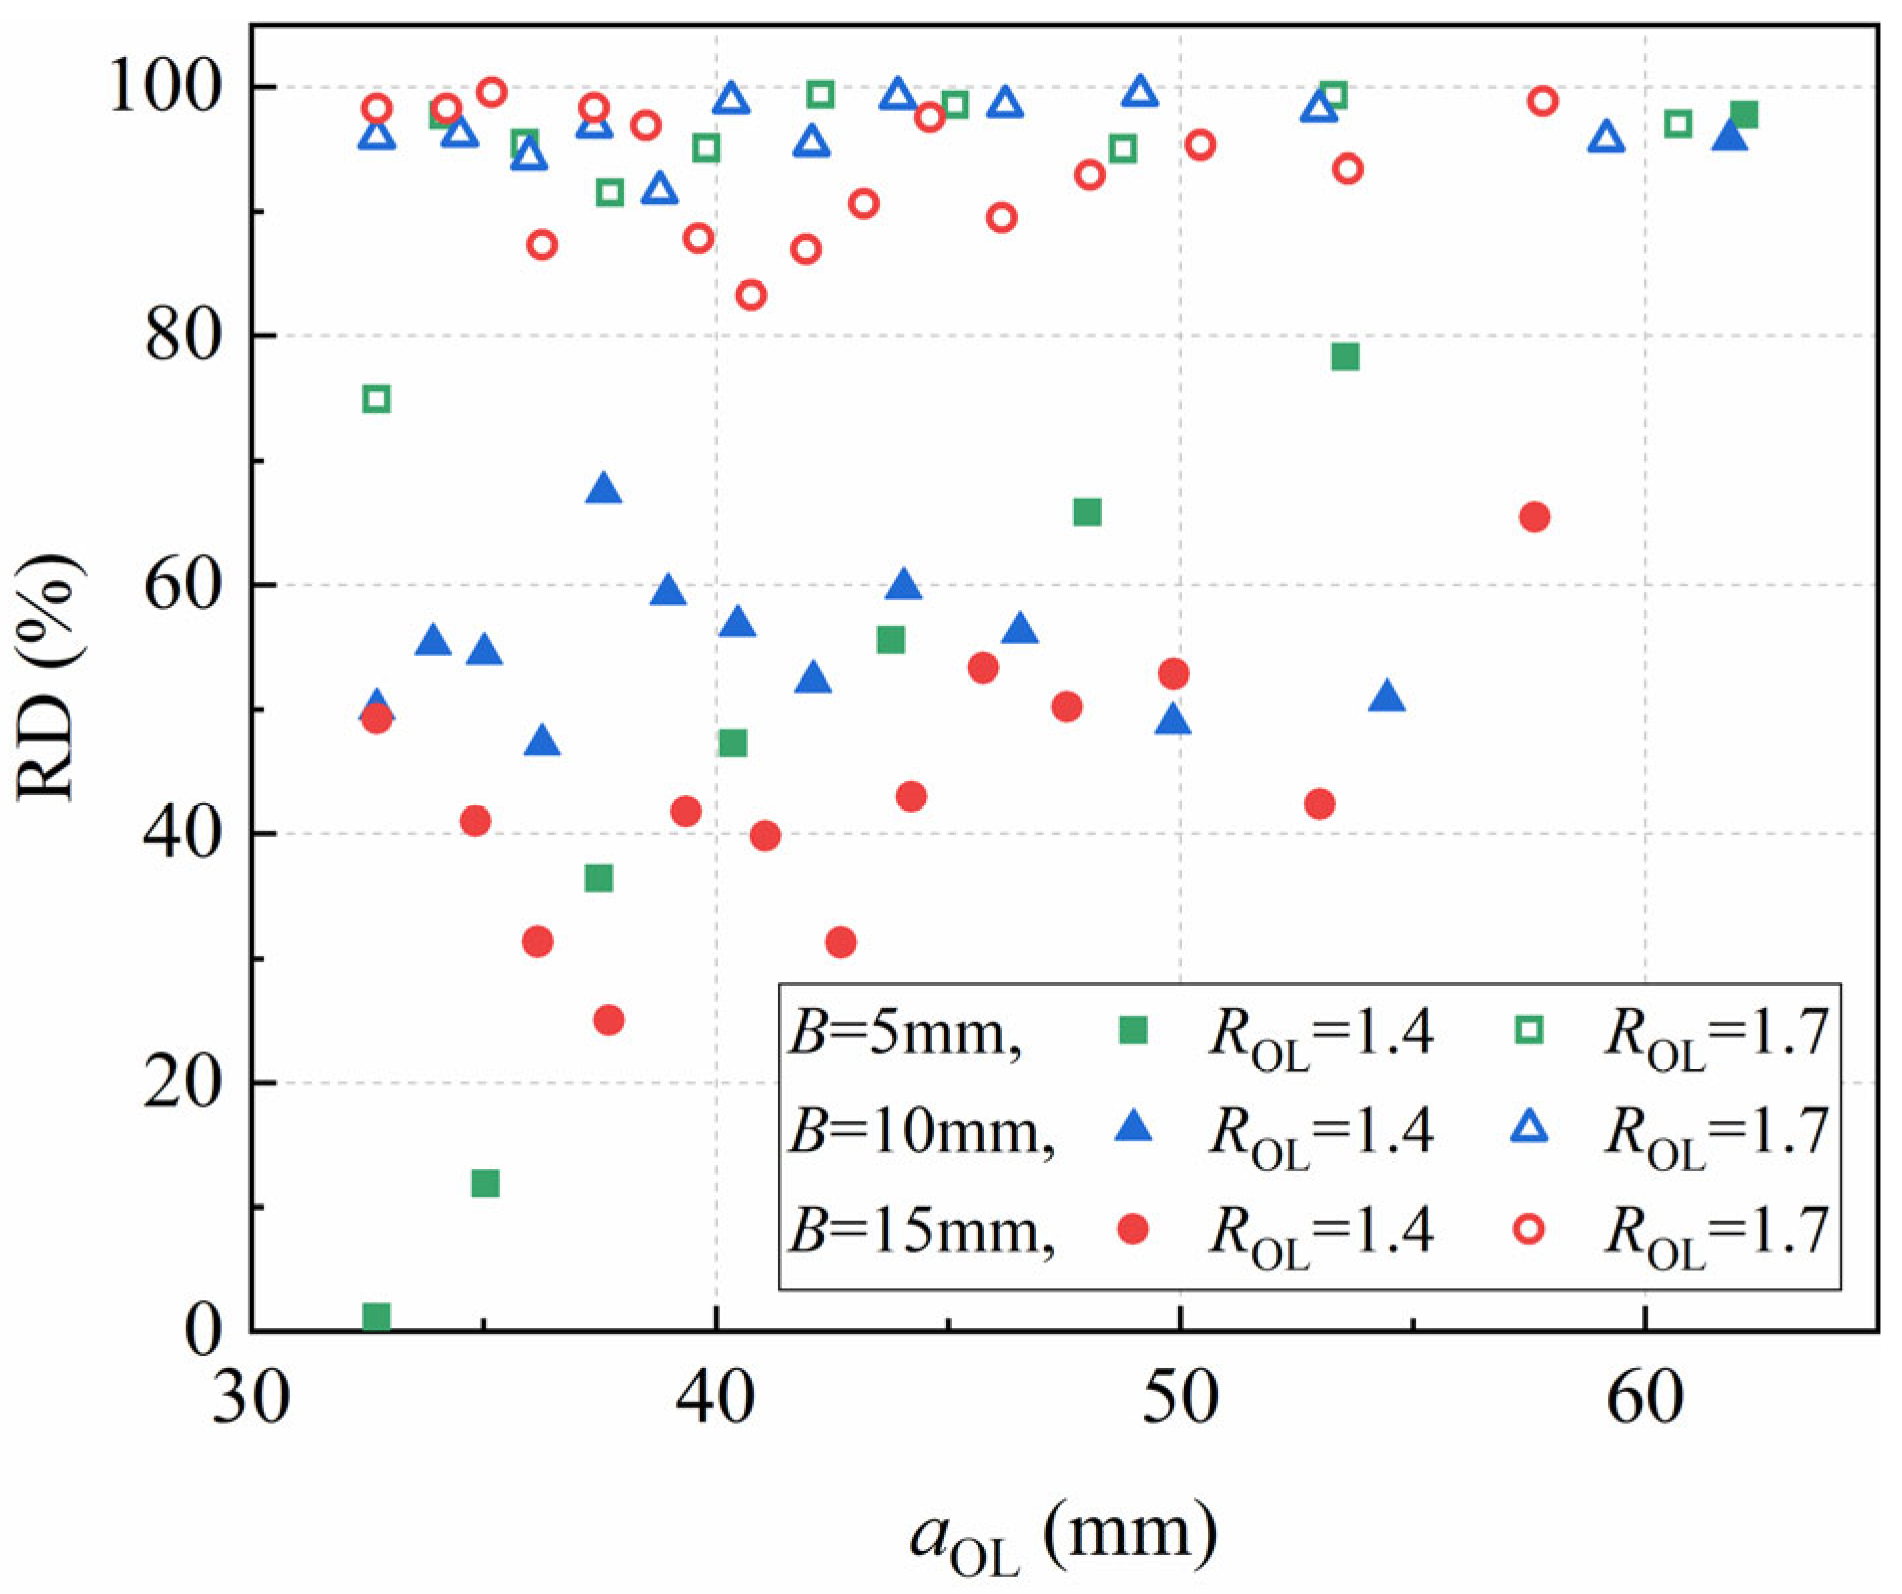
- 1.
- All specimens of the studied material exhibited an increased FCG life under periodic overload conditions compared to their CA counterparts. The larger the ROL, the greater the relative deviation degree RD of (da/dN)min from the FCG rate before overload. For 7055 aluminum alloy, the average RD values at 1.4 and 1.7 ROL are 50.3% and 94.8%, respectively, while the experimental data reveal that there is no significant correlation between this value and either the specimen thickness B or the crack length at overload aOL.
- 2.
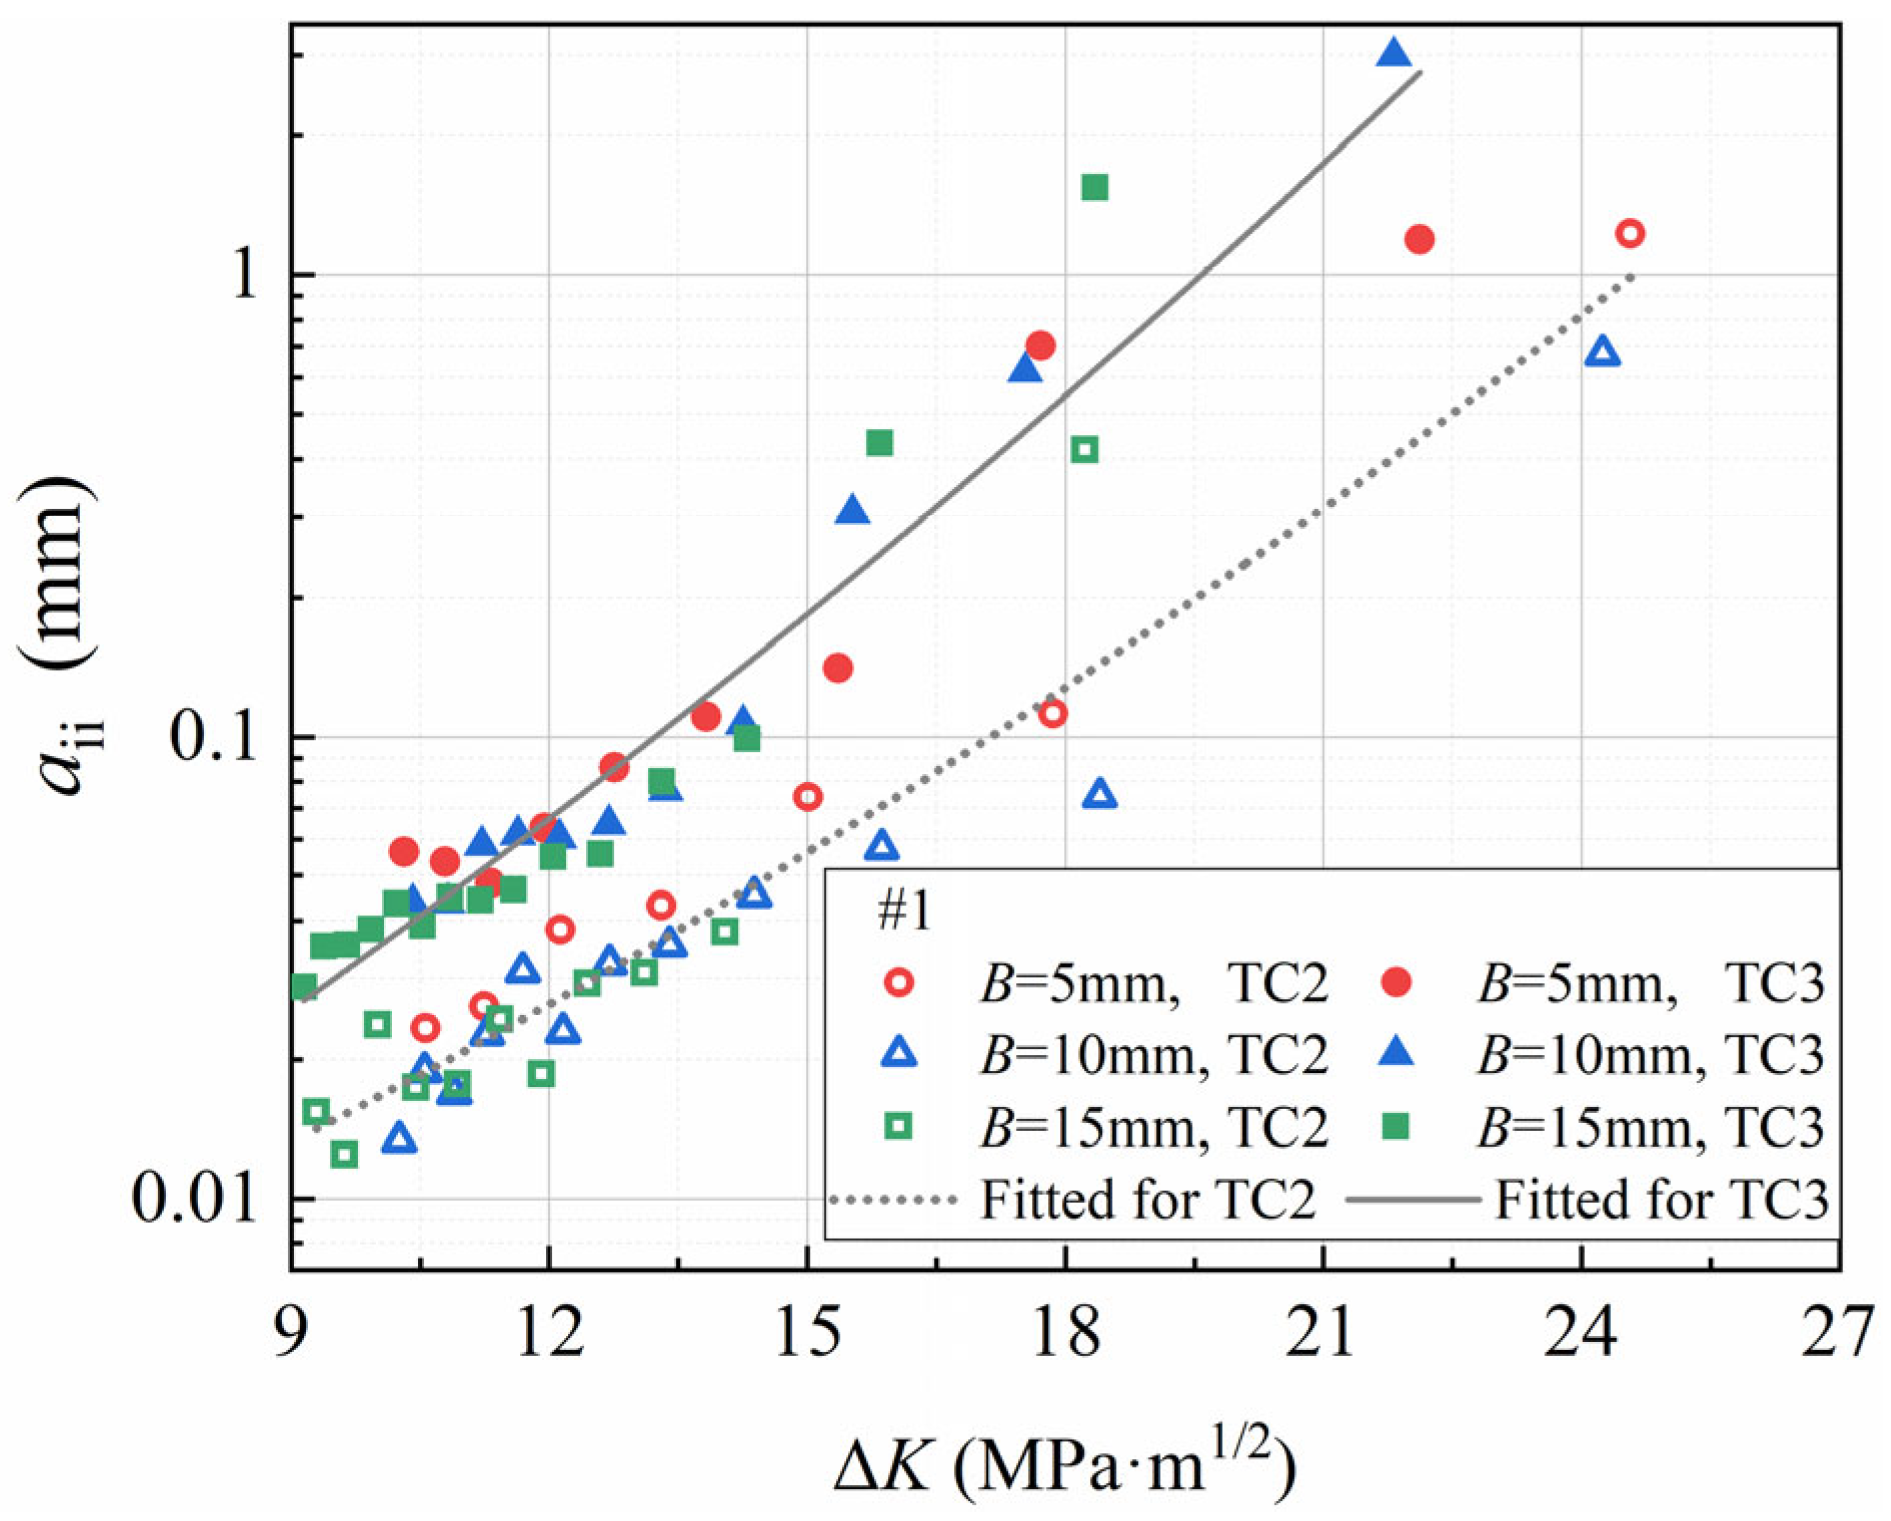
- The experimental results confirm that the crack growth increment aii during the instantaneous acceleration period plays a significant role in the assessment of FCG life under overload conditions. Periodic overload makes the cumulative impact of this period on FCG life more pronounced. An empirical model for the crack growth increment in this FCG was established and successfully fitted the experimental data. Furthermore, it was found that aii increases with the overload ratio ROL and the SIF range ΔK, while there is no significant correlation with specimen thickness B.
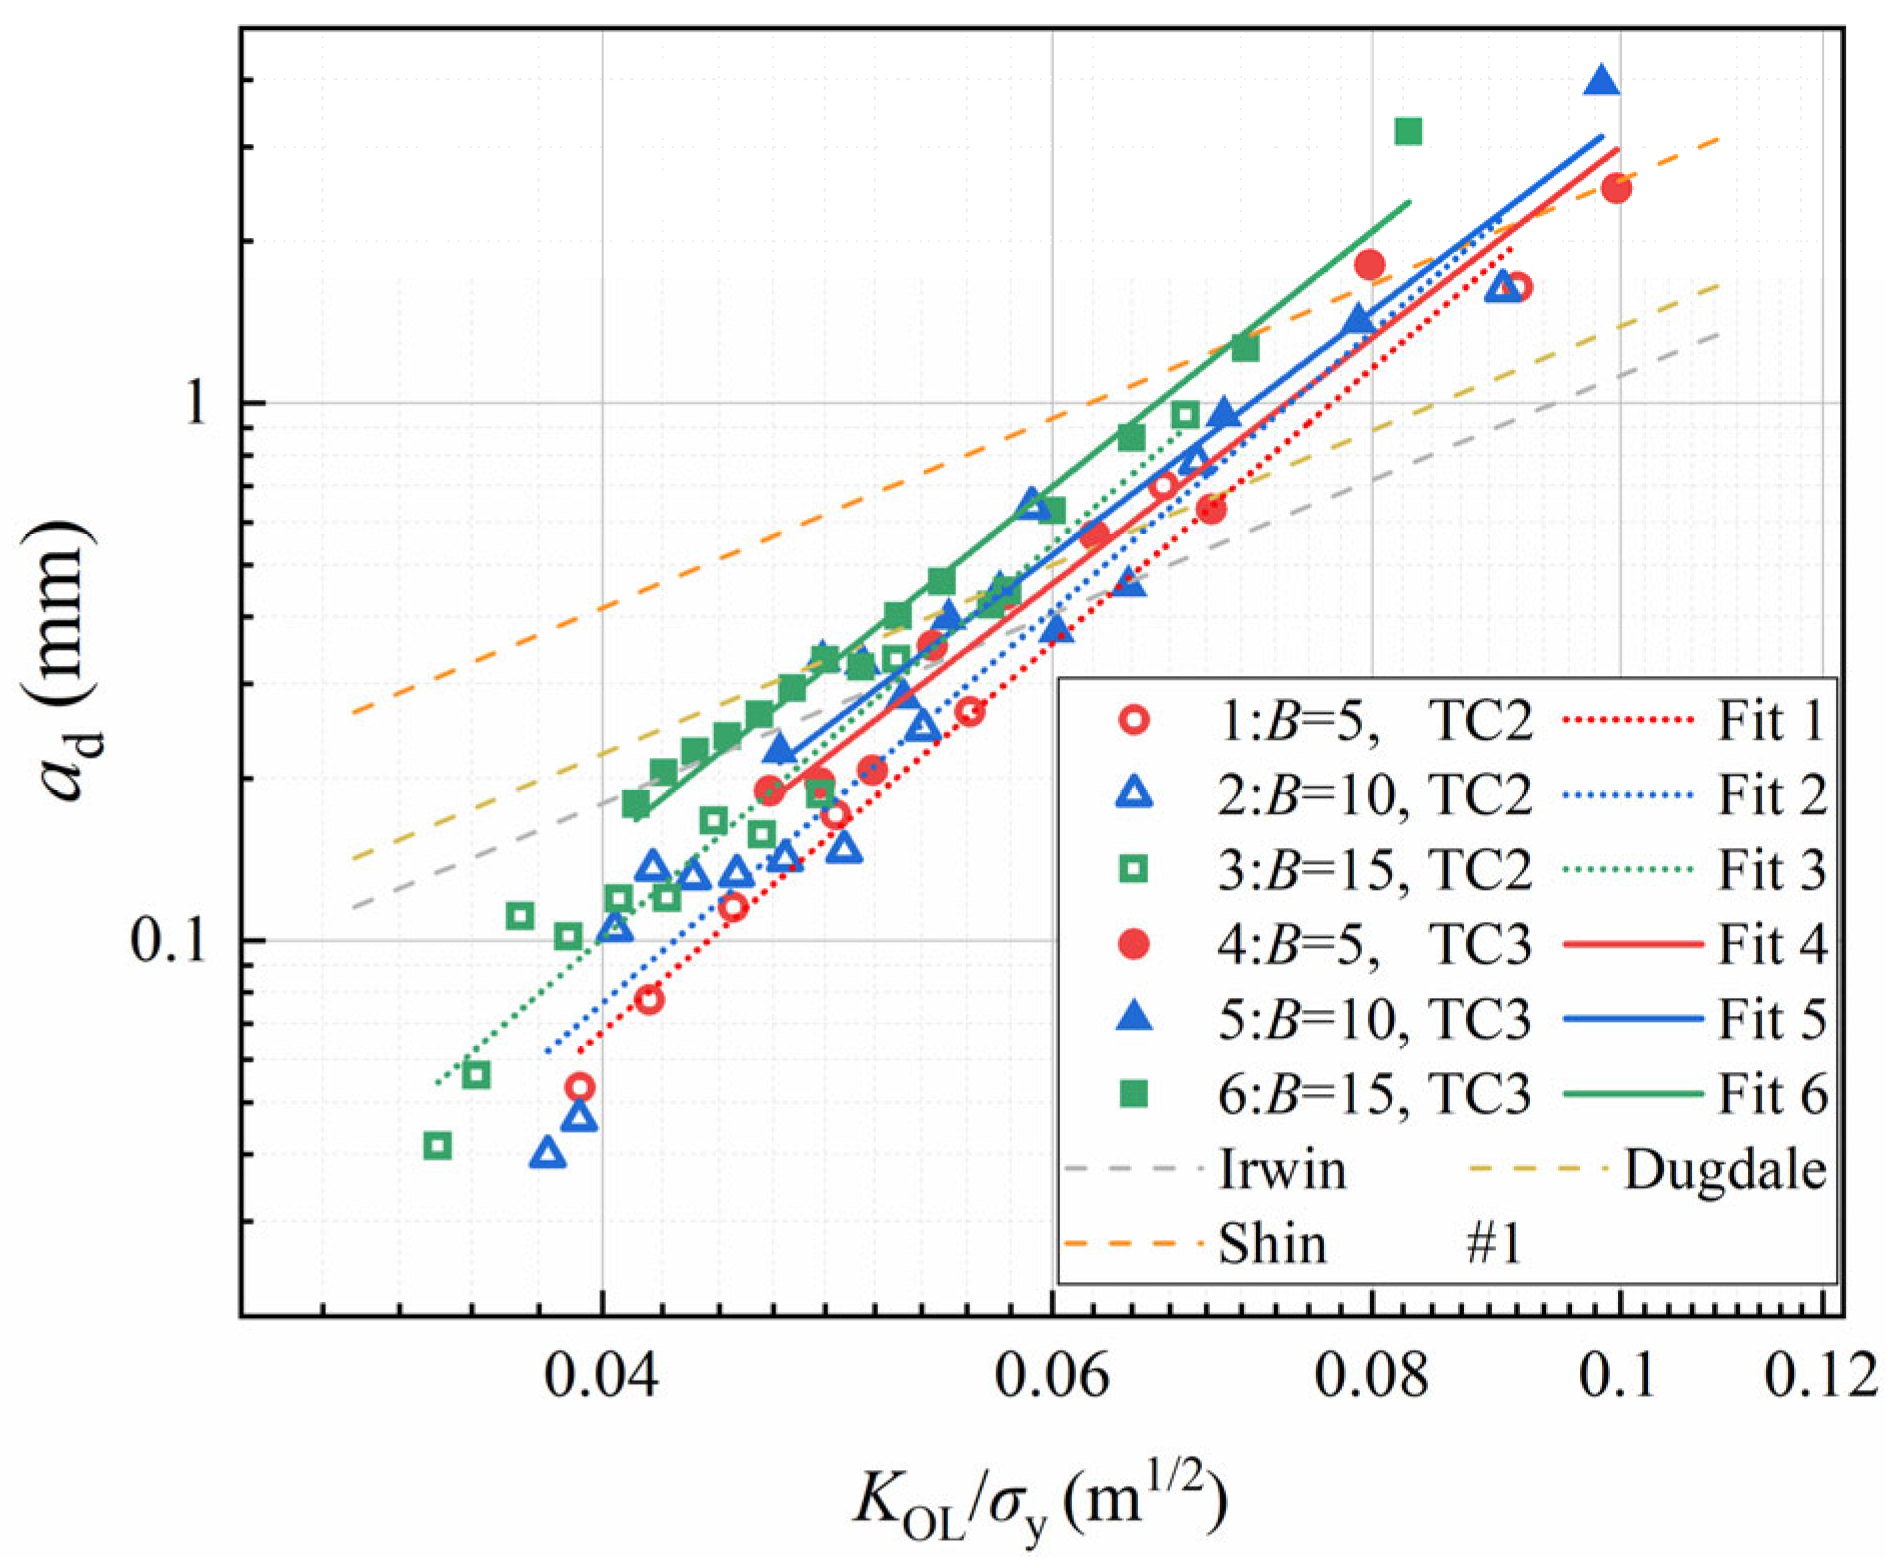
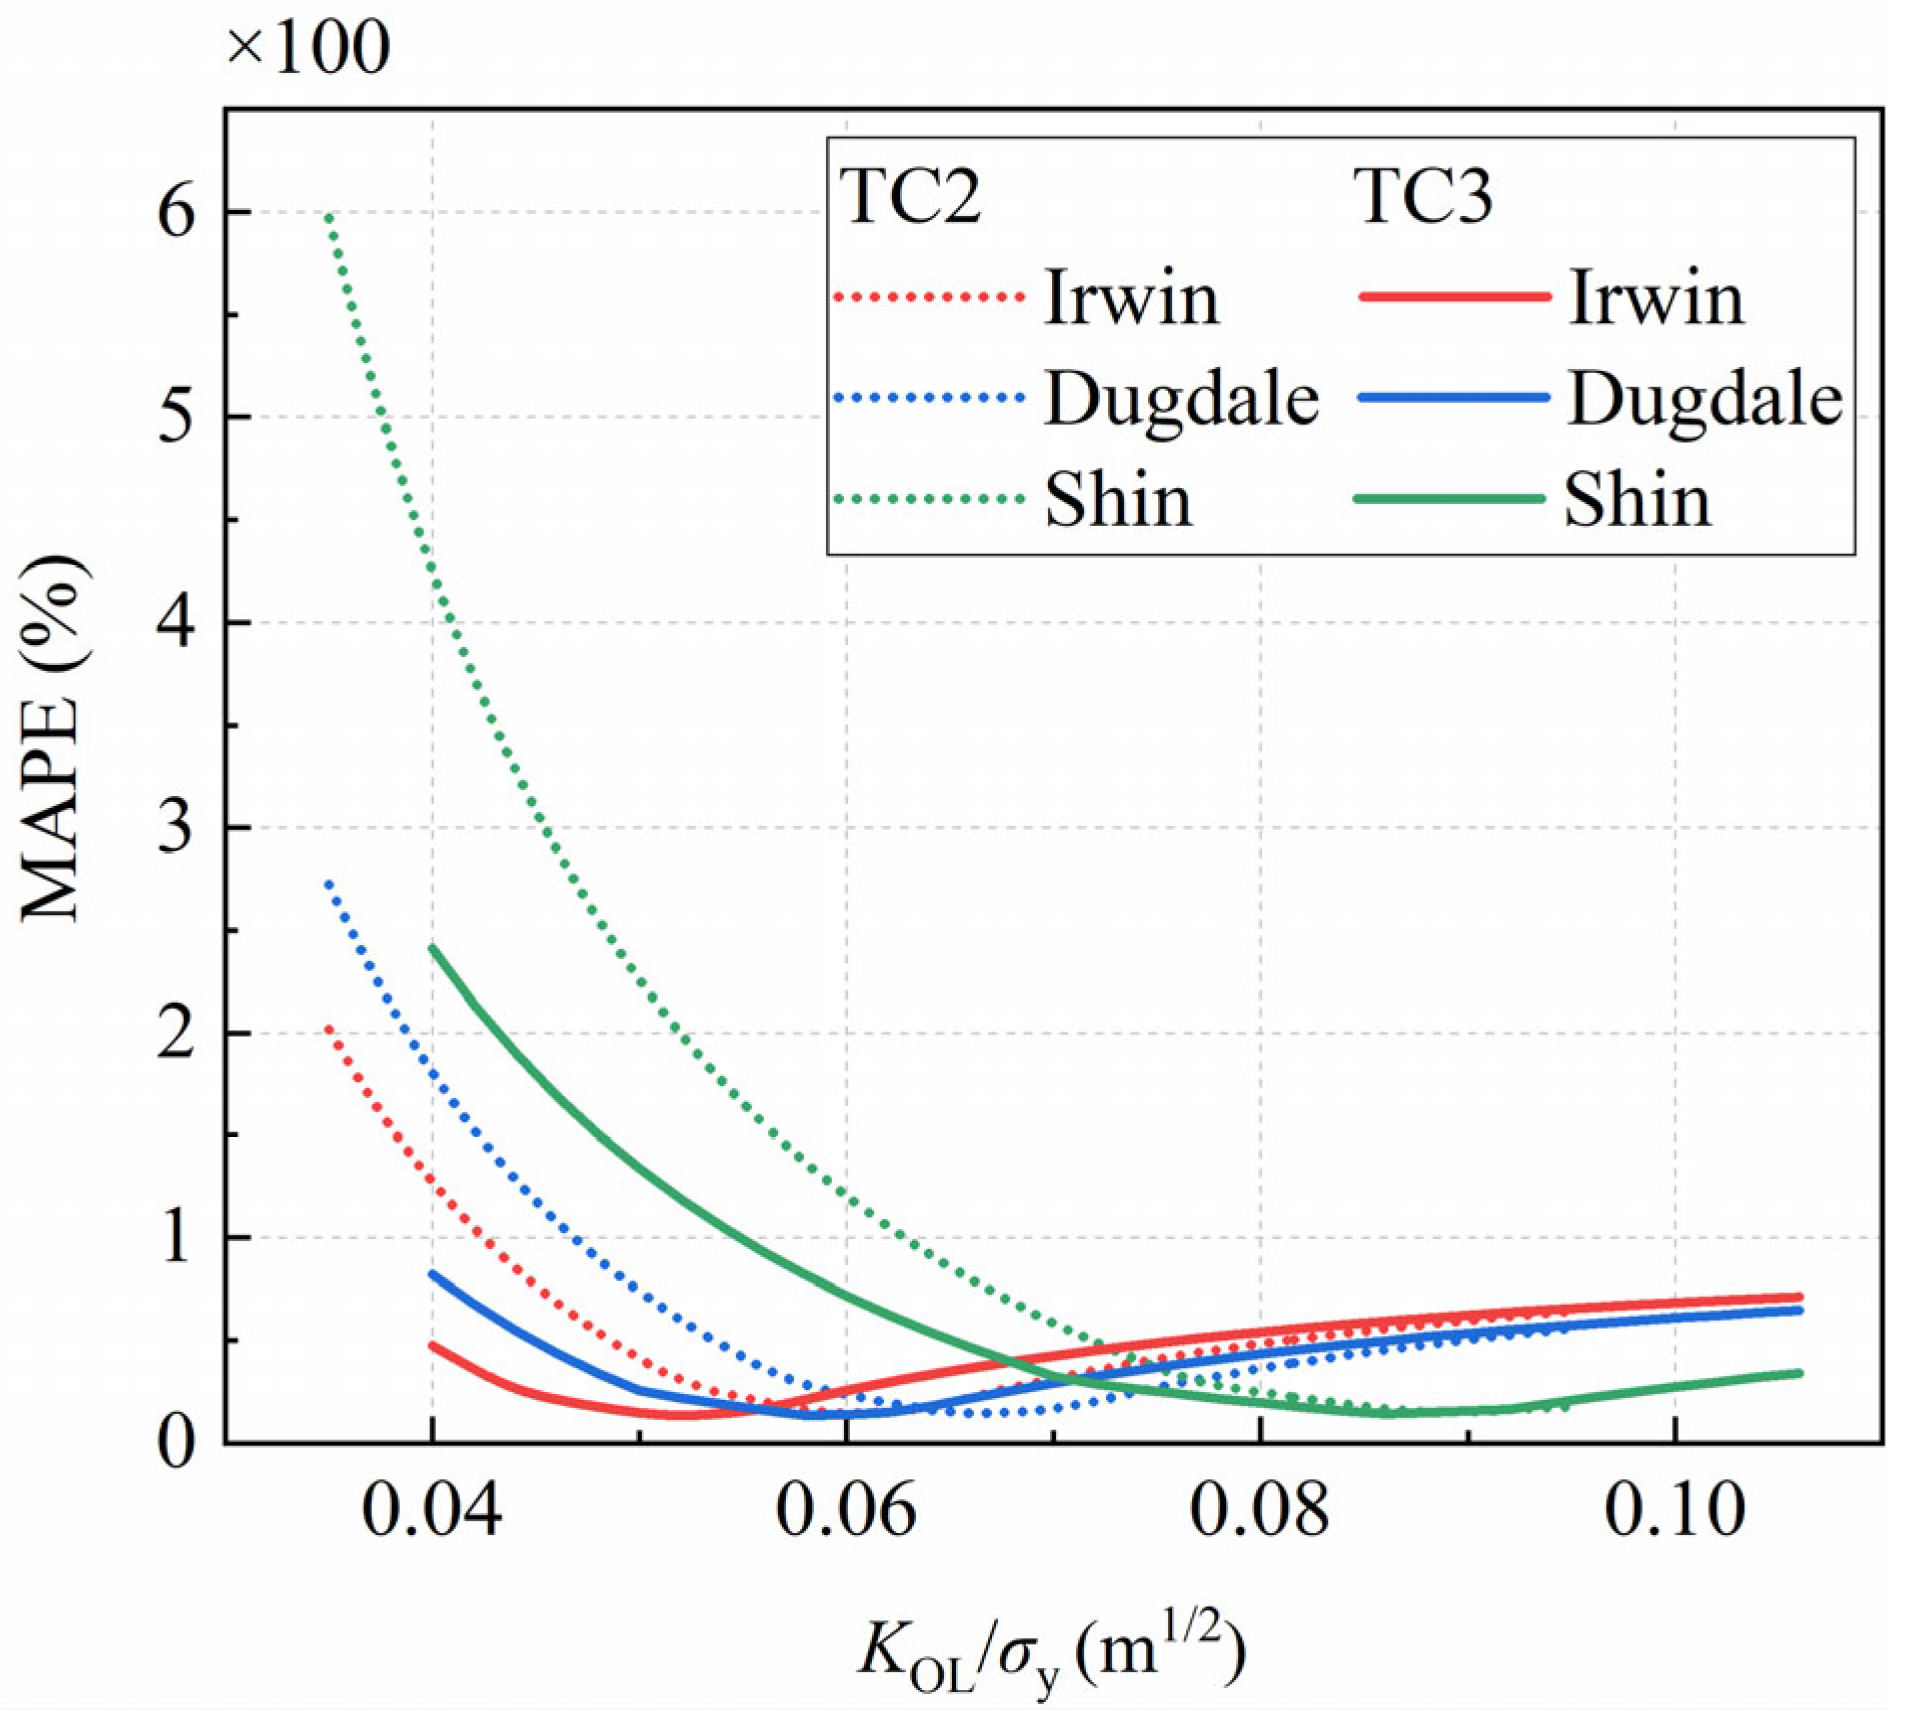
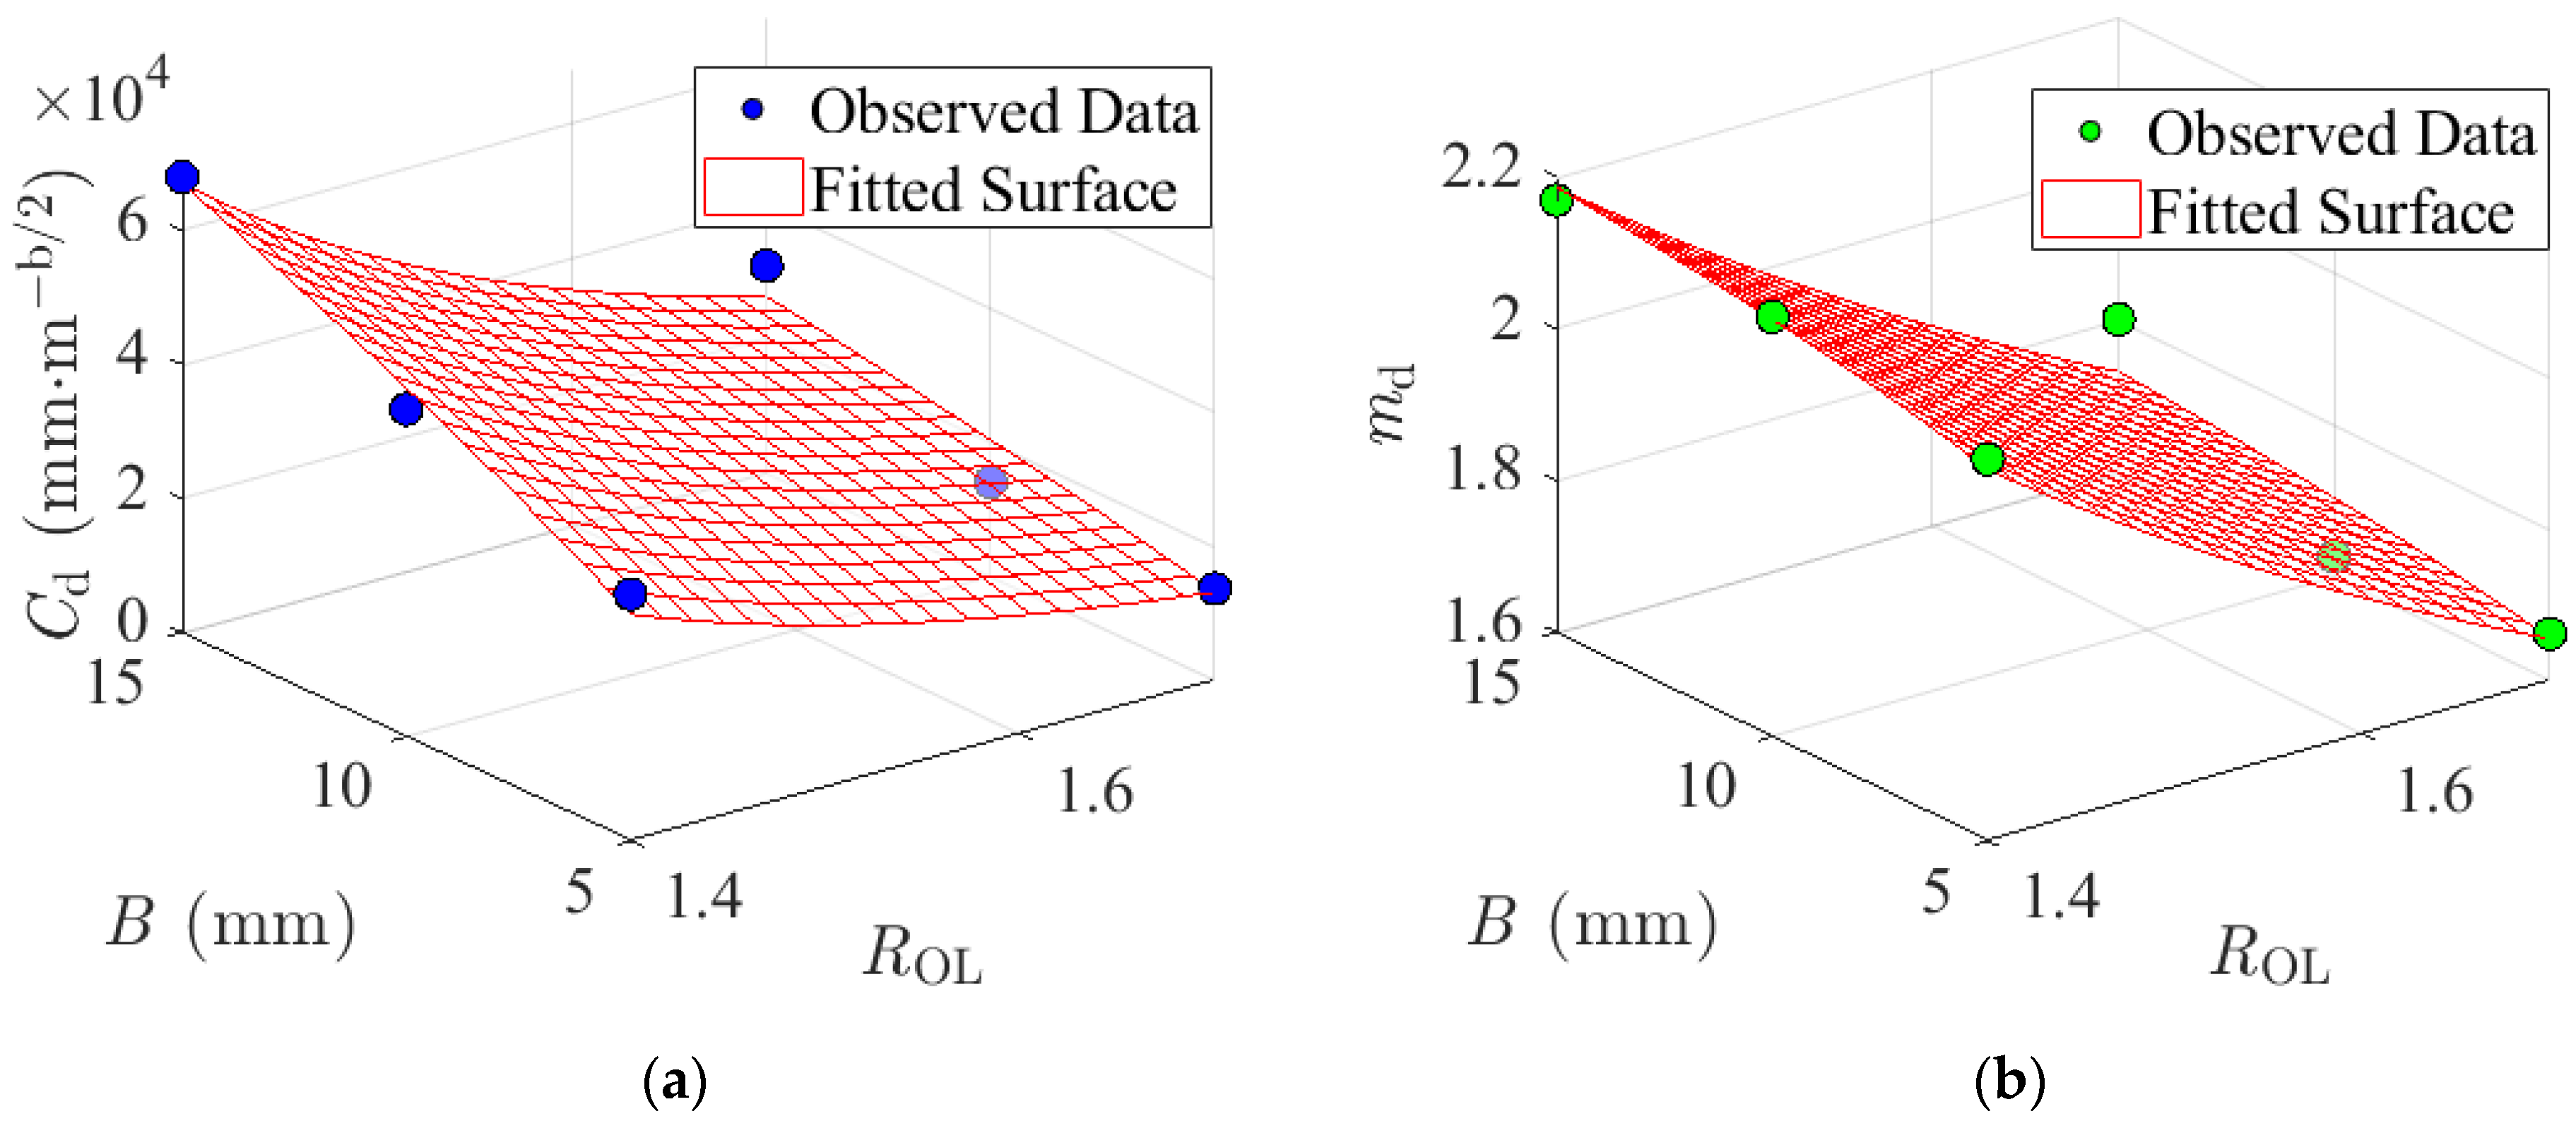
- 3.
- In this research, the MAPE between the plastic zone size calculation models proposed by Irwin, Dugdale, Shin and the experimental data for ad was assessed as a function of KOL/σy. The results indicate that ad follows a power–law relationship with KOL/σy, but the exponent bd exceeds 2. The established evaluation model for ad, which accounts for specimen thickness B and overload ratio ROL, demonstrates greater predictive accuracy for ad compared to the plastic zone models. Finally, by incorporating ad and aii into the Wheeler model, a calculation method for Nd was developed. The calculated Nd values under 1.4 and 1.7 ROL conditions show good agreement with the experimental results. Under periodic overload conditions, both ad and Nd exhibit an increasing trend with the elevation of ROL and B.
- 4.
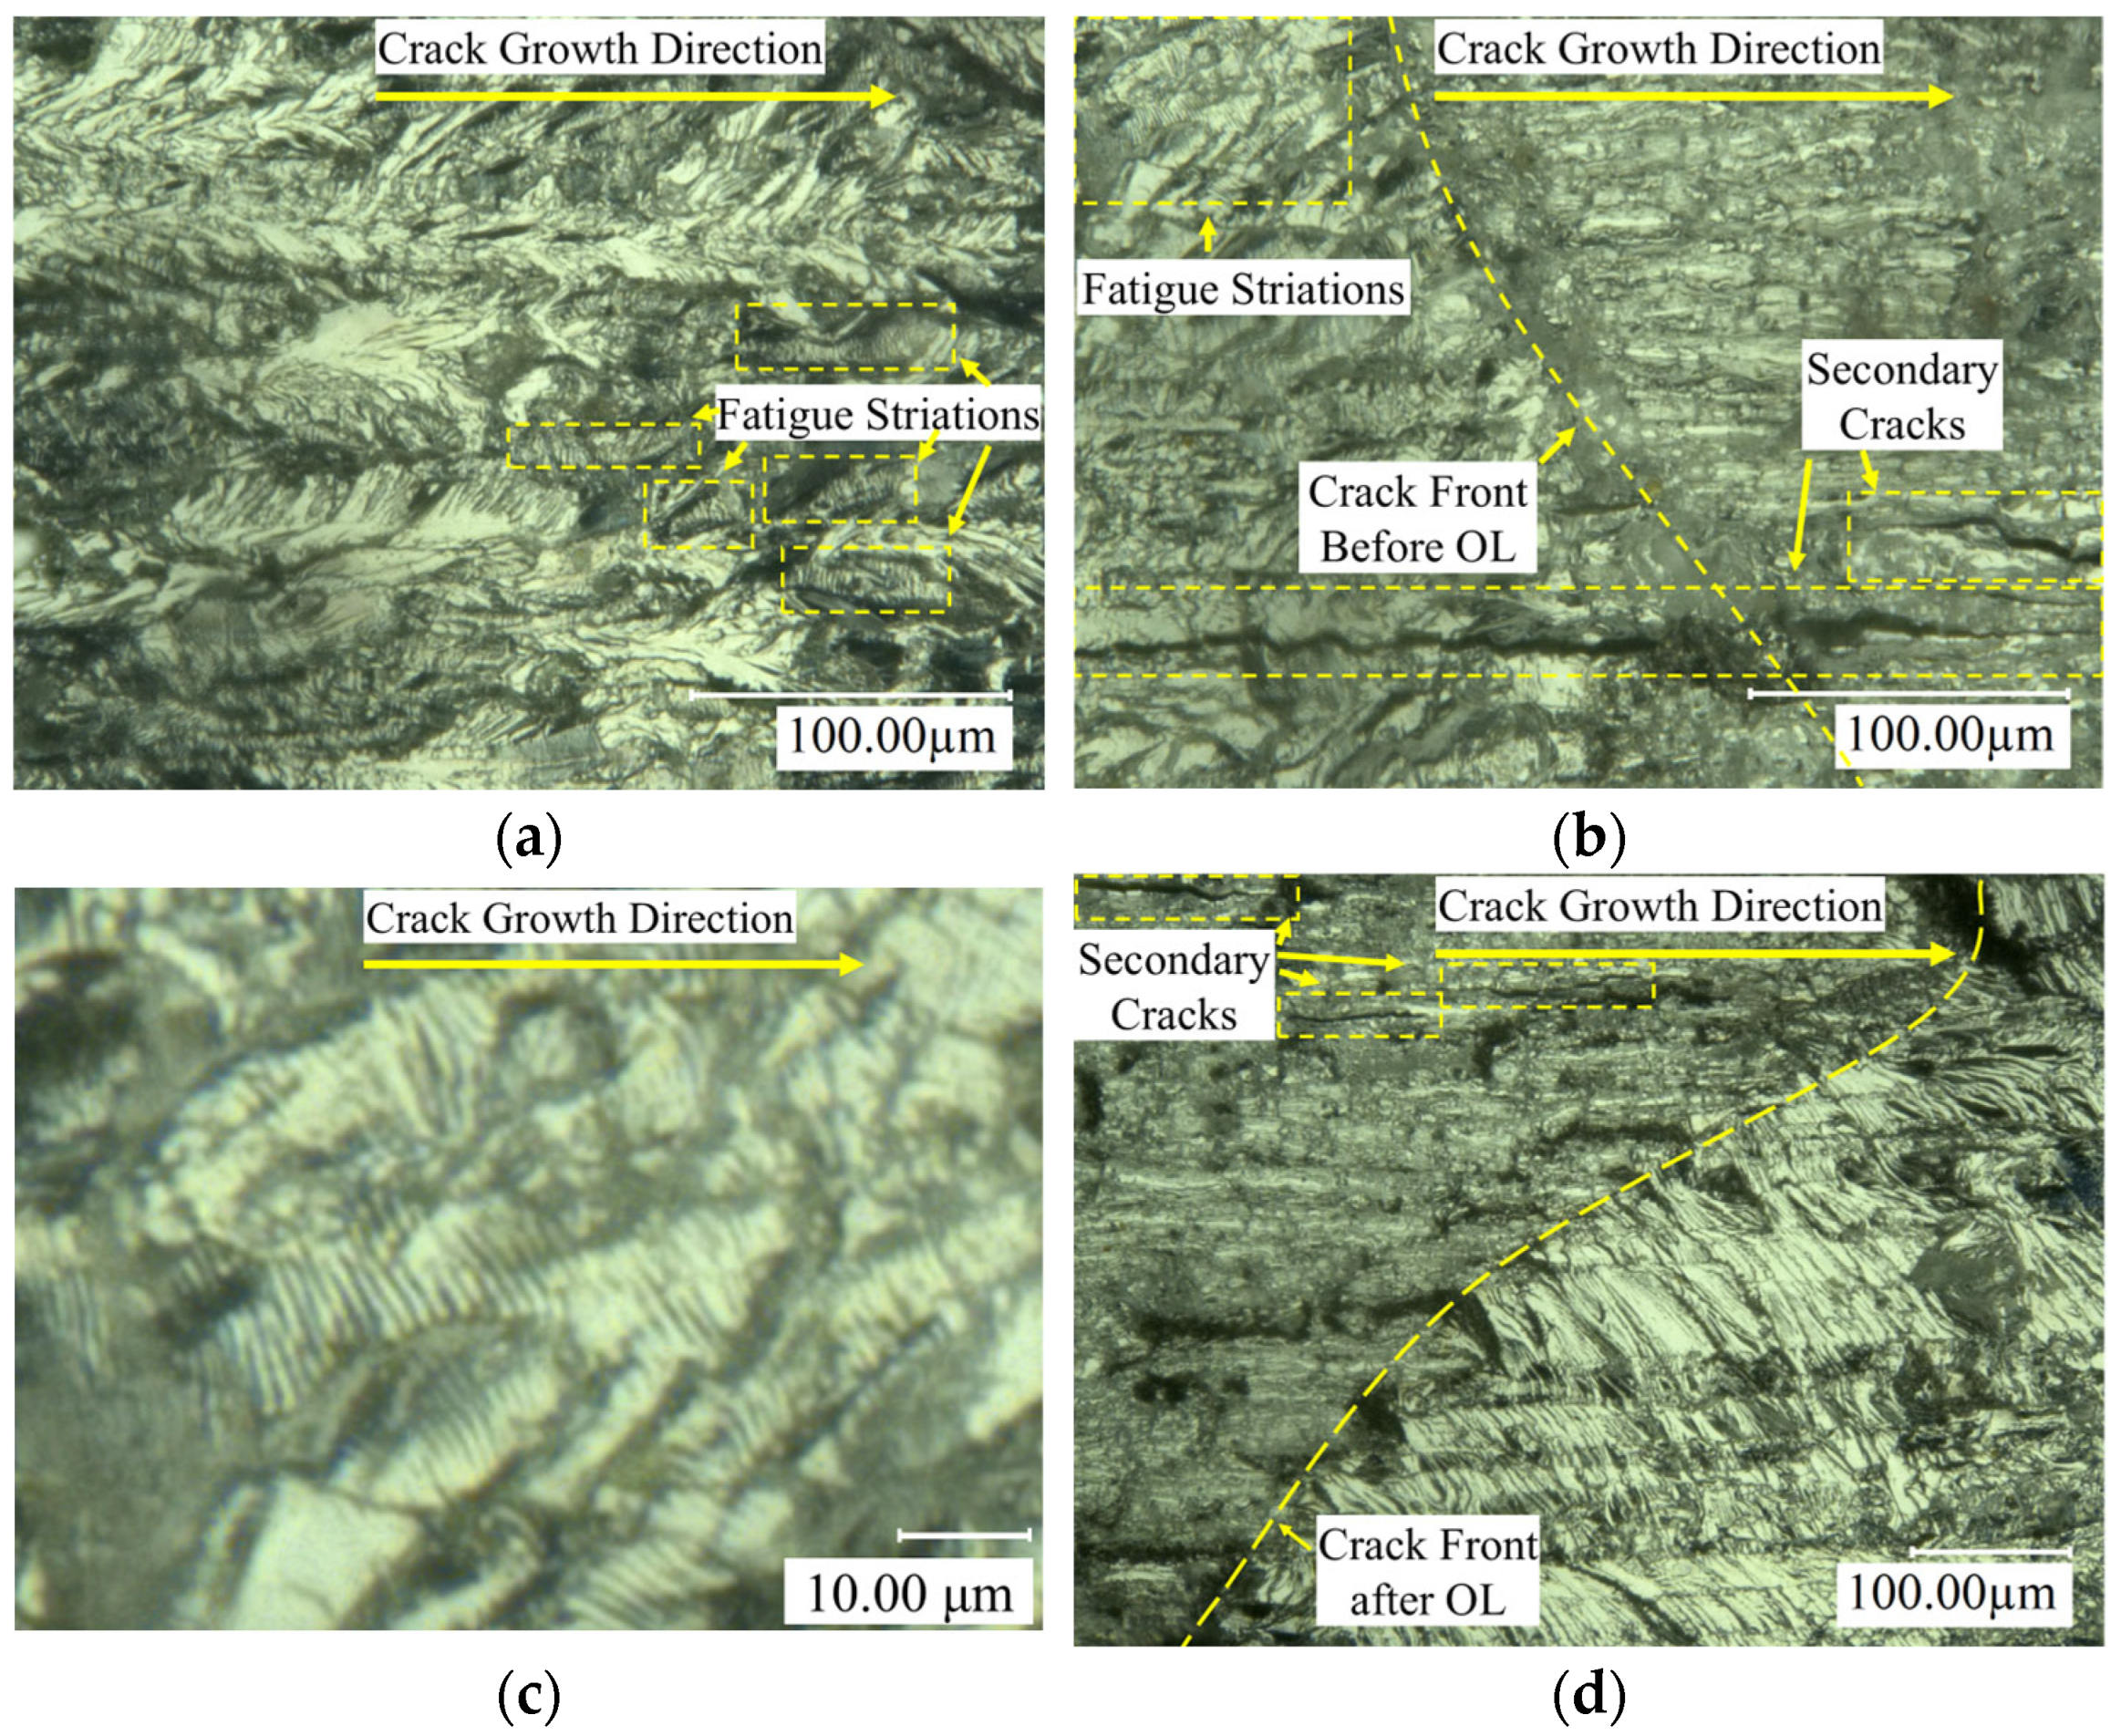
- Specimens with thickness B = 15 mm exhibit a double-peaked crack front morphology under overload conditions, which is inconsistent with the morphology observed in specimens with thicknesses of B = 5 mm and 10 mm. In all three thicknesses, numerous secondary cracks were observed in the fracture morphologies before and after the application of overload at 1.4 and 1.7 ROL. The ductile fracture characteristics within the overload damage zone are significantly weaker than those in regions subjected to fatigue loading, thereby providing a means to distinguish the boundaries of overload initiation and termination.
Author Contributions
Funding
Data Availability Statement
Acknowledgments
Conflicts of Interest
Abbreviations
| a | crack length, mm |
| ad | delay distance, mm |
| an | machined notch length, mm |
| aOL | crack length at overload application, mm |
| aii | the amount of crack propagation during instantaneous acceleration, mm |
| aiii | the amount of crack propagation during the delayed retardation period, mm |
| aiv | the amount of crack propagation during the retardation period, mm |
| B | specimen thickness, mm |
| C | coefficient in the Paris formula |
| Cd | coefficient in the ad expression |
| Cp | retardation parameter in the Wheeler formula |
| CODd | delay crack opening distance, mm |
| da/dN | crack growth rate, mm/cycle |
| (da/dN)min | minimum crack growth rate after overload application, mm/cycle |
| (da/dN)BL | crack growth rate before overload application, mm/cycle |
| (da/dN)OL | instantaneous accelerated crack growth rate after overload, mm/cycle |
| f | load frequency, Hz |
| K | stress-intensity factor, MPa·m1/2 |
| KOL | overload stress intensity factor, MPa·m1/2 |
| Kop | crack opening stress intensity factor, MPa·m1/2 |
| m | exponent in the Paris formula |
| m′ | exponent in the Cp expression |
| md | exponent in the ad expression |
| N | number of loading cycles |
| Nb | number of overload interval cycles |
| Nd | number of delay cycles |
| Nf | number of cycles to failure |
| Nj | number of cycles of the increment polynomial’s window center |
| NOL | number of cycles elapsed when overload applied |
| Ns | number of overload cycles applied |
| P | applied load, kN |
| Pmax | applied baseline maximum load, kN |
| Pmax,i | maximum value of cyclic load at stage i during pre-cracking, kN |
| Pmin | applied baseline minimum load, kN |
| POL | applied overload, kN |
| rp | plastic zone dimensions, mm |
| rp,OL | plastic zone dimensions under the applied overload, mm |
| R | stress ratio (σmin/σmax) |
| R2 | coefficient of determination |
| ROL | overload ratio (σOL/σmax) |
| sN | standard deviation of experimental FCG life data, cycles |
| V | crack opening displacement, mm |
| W | dimension relative to the width of the specimen, mm |
| Δai | increment of crack propagation in stage i of pre-cracking, mm |
| ΔK | range of stress-intensity factor (Kmax − Kmin), MPa·m1/2 |
| ΔKBL | range of baseline stress-intensity factor, MPa·m1/2 |
| α | normalize crack length (a/W) |
| α0 | coefficient related to the stress state in rp calculations |
| β(a) | shape factor related to the specimen’s geometric characteristics |
| εtrue | true strain, mm/mm |
| σ | stress applied, MPa |
| σa | stress amplitude, MPa |
| σb | ultimate tensile stress, MPa |
| σy | tensile yield stress, MPa |
| σmax | stress under applied baseline maximum load, MPa |
| σmin | stress under applied baseline minimum load, MPa |
| σOL | stress under applied overload, MPa |
| σtrue | true stress, MPa |
| Al | aluminum |
| ASTM | American society for testing and materials |
| CA | constant amplitude |
| CV | coefficient of variation |
| C(T) | Compact-tension specimen |
| EDM | electrical discharge machining |
| FCG | fatigue crack growth |
| ICP-MS | inductively coupled plasma mass spectrometry |
| L-T | longitudinal-transverse |
| MAPE | mean absolute percentage error |
| RD | relative deviation between (da/dN)min and (da/dN)BL |
| VA | variable amplitude |
References
- Dursun, T.; Soutis, C. Recent developments in advanced aircraft aluminium alloys. Mater. Des. 2014, 56, 862–871. [Google Scholar] [CrossRef]
- Soni, R.; Verma, R.; Garg, R.K.; Sharma, V. A critical review of recent advances in the aerospace materials. Mater. Today Proc. 2024, 113, 180–184. [Google Scholar] [CrossRef]
- Saarimäki, J.; Moverare, J.; Eriksson, R.; Johansson, S. Influence of overloads on dwell time fatigue crack growth in Inconel 718. Mater. Sci. Eng. A Struct. 2014, 612, 398–405. [Google Scholar] [CrossRef]
- Singh, K.D.; Parry, M.R.; Sinclair, I. Variable amplitude fatigue crack growth behavior—A short overview. J. Mech. Sci. Technol. 2011, 25, 663–673. [Google Scholar] [CrossRef]
- Heper, R.; Vardar, O. Elastic–plastic material response of fatigue crack surface profiles due to overload interactions. Int. J. Fatigue 2003, 25, 801–810. [Google Scholar] [CrossRef]
- Wang, S.C.; Yang, B.; Zhou, S.; Wang, Y.Z.; Xiao, S. Effect of stress ratio and overload on mixed-mode crack propagation behaviour of EA4T steel. Eng. Fract. Mech. 2024, 306, 110210. [Google Scholar] [CrossRef]
- Mansor, N.I.I.; Abdullah, S.; Ariffin, A.K. Effect of loading sequences on fatigue crack growth and crack closure in API X65 steel. Mar. Struct. 2019, 65, 181–196. [Google Scholar] [CrossRef]
- Wang, R. Corrosion Fatigue of Metallic Materials, 1st ed.; Northwestern Polytechnical University Press: Xi’an, China, 2001. [Google Scholar]
- Khan, S.U.; Alderliesten, R.C.; Schijve, J.; Benedictus, R. On the fatigue crack growth prediction under variable amplitude loading. In Computational and Experimental Analysis of Damaged Materials; Pavlou, D.G., Ed.; Transworld Research Network: Kerala, India, 2007; pp. 77–105. [Google Scholar]
- Kujawski, D.; Vasudevan, A.K.; Ricker, R.E.; Sadananda, K. On 50 years of fatigue crack closure dispute. Fatigue Fract. Eng. Mater. Struct. 2023, 46, 2816–2829. [Google Scholar] [CrossRef]
- McEvily, A.J.; Ritchie, R.O. Crack closure and the fatigue-crack propagation threshold as a function of load ratio. Fatigue Fract. Eng. Mater. Struct. 2002, 21, 847–855. [Google Scholar] [CrossRef]
- Sadananda, K.; Vasudevan, A.K.; Holtz, R.L.; Lee, E.U. Analysis of overload effects and related phenomena. Int. J. Fatigue 1999, 21, 233–246. [Google Scholar] [CrossRef]
- James, M.N.; Pacey, M.N.; Wei, L.W.; Patterson, E.A. Characterisation of plasticity-induced closure—Crack flank contact force versus plastic enclave. Eng. Fract. Mech. 2003, 70, 2473–2487. [Google Scholar] [CrossRef]
- Elber, W. Fatigue crack closure under cyclic tension. Eng. Fract. Mech. 1970, 2, 37–45. [Google Scholar] [CrossRef]
- Taylor, D.; Staniaszek, I.; Knott, J. When is a crack not a crack—Some data on the fatigue behavior of cracks and sharp notches. Int. J. Fatigue 1990, 12, 397–402. [Google Scholar] [CrossRef]
- Bathias, C.; Vancon, M. Mechanisms of overload effect on fatigue crack propagation in aluminum alloys. Eng. Fract. Mech. 1978, 10, 409–424. [Google Scholar] [CrossRef]
- Tavares, S.M.O.; Castro, P.M.S.T. Damage Tolerance of Metallic Aircraft Structures: Materials and Numerical Modelling; Altenbach, H., da Silva, L.F.M., Öchsner, A., Eds.; SpringerBriefs in Applied Sciences and Technology; Springer: Cham, Switzerland, 2019. [Google Scholar]
- Schijve, J. Fatigue of Structures and Materials, 2nd ed.; Springer: Berlin/Heidelberg, Germany, 2014. [Google Scholar]
- Xu, T.; He, S.S.; Zeng, D.F.; Lu, L.T. Numerical investigation of the fatigue crack growth under variable amplitude loading using an improved strip-yield model considering variable constraint and plastic shrinkage. Theor. Appl. Fract. Mech. 2025, 139, 104996. [Google Scholar] [CrossRef]
- Chen, F.; Wang, F.; Cui, W. Fatigue life prediction of engineering structures subjected to variable amplitude loading using the improved crack growth rate model. Fatigue Fract. Eng. Mater. Struct. 2011, 35, 278–290. [Google Scholar] [CrossRef]
- Vidler, J.; Kotousov, A.; Ng, C.T. Residual closure of fatigue cracks. Int. J. Solids Struct. 2024, 302, 112973. [Google Scholar] [CrossRef]
- Liu, Z.T.; Liu, S.L.; Cao, J.; Pan, Y.; Yao, W.X. Corrosion fatigue crack growth model for aluminum alloys in jet fuel. Fatigue Fract. Eng. Mater. Struct. 2024, 47, 4432–4449. [Google Scholar] [CrossRef]
- Vecchio, R.S.; Hertzberg, R.W.; Jaccard, R. Overload induced crack growth rate attenuation behavior in aluminum alloys. Scr. Metall. 1983, 17, 343–346. [Google Scholar] [CrossRef]
- Shin, C.S.; Hsu, S.H. On the mechanisms and behaviour of overload retardation in AISI 304 stainless steel. Int. J. Fatigue 1993, 15, 181–192. [Google Scholar] [CrossRef]
- McEvily, A.J.; Yang, Z. The nature of the two opening levels following an overload in fatigue crack growth. Metal. Mater. Trans. A 1990, 21, 2717–2727. [Google Scholar] [CrossRef]
- McEvily, A.J.; Ishihara, S.; Mutoh, Y. On the number of overload-induced delay cycles as a function of thickness. Int. J. Fatigue 2004, 26, 1311–1319. [Google Scholar] [CrossRef]
- Skorupa, M.; Skorupa, A.; Schijve, J.; Machniewicz, T.; Korbut, P. Fatigue crack growth behavior of 18G2A steel under constant amplitude loading and following a single overload. Arch. Mech. Eng. 2000, 47, 139–163. [Google Scholar]
- Li, S.C.; Zhang, Y.H.; Qi, L.; Kang, Y.L. Effect of single tensile overload on fatigue crack growth behavior in DP780 dual phase steel. Int. J. Fatigue 2018, 106, 49–55. [Google Scholar] [CrossRef]
- Bahram, K.; Chaib, M.; Slimane, A.; Bouchouicha, B. Simulation of the retardation effect after applying a simple overload on alloys of aluminum 2024-T351 using the Willenborg model. Fract. Struct. Integr. 2019, 14, 467–476. [Google Scholar] [CrossRef]
- Zhou, S.; Shen, Z.X.; Wang, L.; An, J.L. Study of overloading retardation on fatigue crack propagation behavior in 300M steel. Fatigue Fract. Eng. Mater. Struct. 2022, 45, 3288–3301. [Google Scholar] [CrossRef]
- ASTM E8M-22; Standard Test Methods for Tension Testing of Metallic Materials. ASTM International: West Conshohocken, PA, USA, 2022.
- ASTM E647-15e1; Standard Test Method for Measurement of Fatigue Crack Growth Rates. ASTM International: West Conshohocken, PA, USA, 2015.
- Zerbst, U.; Vormwald, M.; Pippan, R.; Gänser, H.-P.; Sarrazin-Baudoux, C.; Madia, M. About the fatigue crack propagation threshold of metals as a design criterion—A review. Eng. Fract. Mech. 2016, 153, 190–243. [Google Scholar] [CrossRef]
- Oplt, T.; Vojtek, T.; Kubíček, R.; Pokorný, P.; Hutař, P. Numerical modelling of fatigue crack closure and its implication on crack front curvature using ΔCTODp. Int. J. Fatigue 2023, 171, 107570. [Google Scholar] [CrossRef]
- Newman, J.C., Jr. Fatigue of engineered metallic materials using small-crack theory under constant-and variable-amplitude loading. Fatigue Fract. Eng. Mater. Struct. 2021, 44, 2858–2870. [Google Scholar] [CrossRef]
- Irwin, G.R. Plastic zone near a crack and fracture toughness. In Proceedings of the 7th Sagamore Research Conference, New York, NY, USA, 16–19 August 1960; Volume 4, pp. 63–78. [Google Scholar]
- Dugdale, D.S. Yielding of steel sheets containing slits. J. Mech. Phys. Solids 1960, 8, 100–108. [Google Scholar] [CrossRef]
- Shih, C.F. J-integral estimates for strain hardening materials in antiplane shear using fully plastic solution. In Mechanics of Crack Growth; Rice, J.R., Paris, P.C., Eds.; ASTM STP 590; ASTM International: Philadelphia, PA, USA, 1976; pp. 3–26. [Google Scholar]
- Ramberg, W.; Osgood, W.R. Description of Stress–Strain Curves by Three Parameters; NASA Scientific and Technical Information Facility: Washington, DC, USA, 1943. [Google Scholar]
- Vantadori, S.; Carpinteri, A.; Fortese, G.; Ronchei, C.; Scorza, D.; Zanichelli, A. Fatigue lifetime evaluation of notched components: Implementation of the control volume concept in a strain-based LCF criterion. Theor. Appl. Fract. Mec. 2018, 97, 400–408. [Google Scholar] [CrossRef]
- Susmel, L. The theory of critical distances: A review of its applications in fatigue. Eng. Fract. Mech. 2008, 75, 1706–1724. [Google Scholar] [CrossRef]
- Ostash, O.P.; Chepil, R.V.; Vira, V.V. Fatigue crack initiation and propagation at different stress ratio values of uniaxial pulsating loading. Fatigue Fract. Eng. Mater. Struct. 2010, 34, 430–437. [Google Scholar] [CrossRef]
- Feng, D.; Xu, R.; Li, J.C.; Huang, W.J.; Wang, J.T.; Liu, Y.; Zhao, L.X.; Li, C.B.; Zhang, H. Microstructure evolution behavior of spray-deposited 7055 aluminum alloy during hot deformation. Metals 2022, 12, 1982. [Google Scholar] [CrossRef]
- Andriollo, T.; Kouznetsova, V.G. A simplified formula to estimate the size of the cyclic plastic zone in metals containing elastic particles. Eng. Fract. Mech. 2020, 241, 107428. [Google Scholar] [CrossRef]
- McEvily, A.J.; Ishihara, S. On the retardation in fatigue crack growth rate due to an overload; a review. In Proceedings of the SAE Brasil International Conference on Fatigue Conference, Sao Paulo, Brazil, 19–22 November 2001. [Google Scholar] [CrossRef]
- Wheeler, O.E. Spectrum loading and crack growth. J. Basic Eng. 1972, 94, 181–186. [Google Scholar] [CrossRef]
- Hull, D. Fractography: Observing, Measuring and Interpreting Fracture Surface Topography; Cambridge University Press: London, UK, 1999. [Google Scholar]

| TC Id | Overload Ratio, ROL | Interval Cycles, Nb (Cycles) | B = 5 mm | B = 10 mm | B = 15 mm | |||
|---|---|---|---|---|---|---|---|---|
| (Cycles) | CV | (Cycles) | CV | (Cycles) | CV | |||
| TC1 | N/A | N/A | 71,610 | 7.23% | 83,654 | 6.07% | 97,057 | 9.25% |
| TC2 | 1.4 | 10,000 | 75,150 | 0.11% | 128,633 | 6.07% | 134,903 | 3.03% |
| TC3 | 1.7 | 10,000 | 101,421 | 2.48% | 112,691 | 7.99% | 170,000 | 8.32% |
| Thickness B | Cd × 103/mm·m−b/2 | md | R2 | |||
|---|---|---|---|---|---|---|
| TC2 | TC3 | TC2 | TC3 | TC2 | TC3 | |
| 5 mm | 36.825 | 13.771 | 4.1032 | 3.6625 | 0.9842 | 0.9637 |
| 10 mm | 48.856 | 14.095 | 4.1532 | 3.6267 | 0.9200 | 0.9369 |
| 15 mm | 67.952 | 30.847 | 4.1694 | 3.8014 | 0.9879 | 0.9716 |
| Thickness B | lnC | m | R2 |
|---|---|---|---|
| 5 mm | −14.536 | 2.553 | 0.977 |
| 10 mm | −14.106 | 2.325 | 0.948 |
| 15 mm | −12.833 | 1.885 | 0.947 |
Disclaimer/Publisher’s Note: The statements, opinions and data contained in all publications are solely those of the individual author(s) and contributor(s) and not of MDPI and/or the editor(s). MDPI and/or the editor(s) disclaim responsibility for any injury to people or property resulting from any ideas, methods, instructions or products referred to in the content. |
© 2025 by the authors. Licensee MDPI, Basel, Switzerland. This article is an open access article distributed under the terms and conditions of the Creative Commons Attribution (CC BY) license (https://creativecommons.org/licenses/by/4.0/).
Share and Cite
Liu, Z.; Cao, J.; Liu, S.; Yang, Y.; Yao, W. The Overload-Induced Delay Model of 7055 Aluminum Alloy Under Periodic Overloading. Metals 2025, 15, 644. https://doi.org/10.3390/met15060644
Liu Z, Cao J, Liu S, Yang Y, Yao W. The Overload-Induced Delay Model of 7055 Aluminum Alloy Under Periodic Overloading. Metals. 2025; 15(6):644. https://doi.org/10.3390/met15060644
Chicago/Turabian StyleLiu, Zuoting, Jing Cao, Shilong Liu, Yuqi Yang, and Weixing Yao. 2025. "The Overload-Induced Delay Model of 7055 Aluminum Alloy Under Periodic Overloading" Metals 15, no. 6: 644. https://doi.org/10.3390/met15060644
APA StyleLiu, Z., Cao, J., Liu, S., Yang, Y., & Yao, W. (2025). The Overload-Induced Delay Model of 7055 Aluminum Alloy Under Periodic Overloading. Metals, 15(6), 644. https://doi.org/10.3390/met15060644