
Effect of Laser Power on the Microstructure and Fracture of Notched IN718 Specimens Fabricated by Laser Powder Bed Fusion


Abstract
1. Introduction
2. Materials and Methods
2.1. L-PBF Process
2.2. Microstructural Characterization
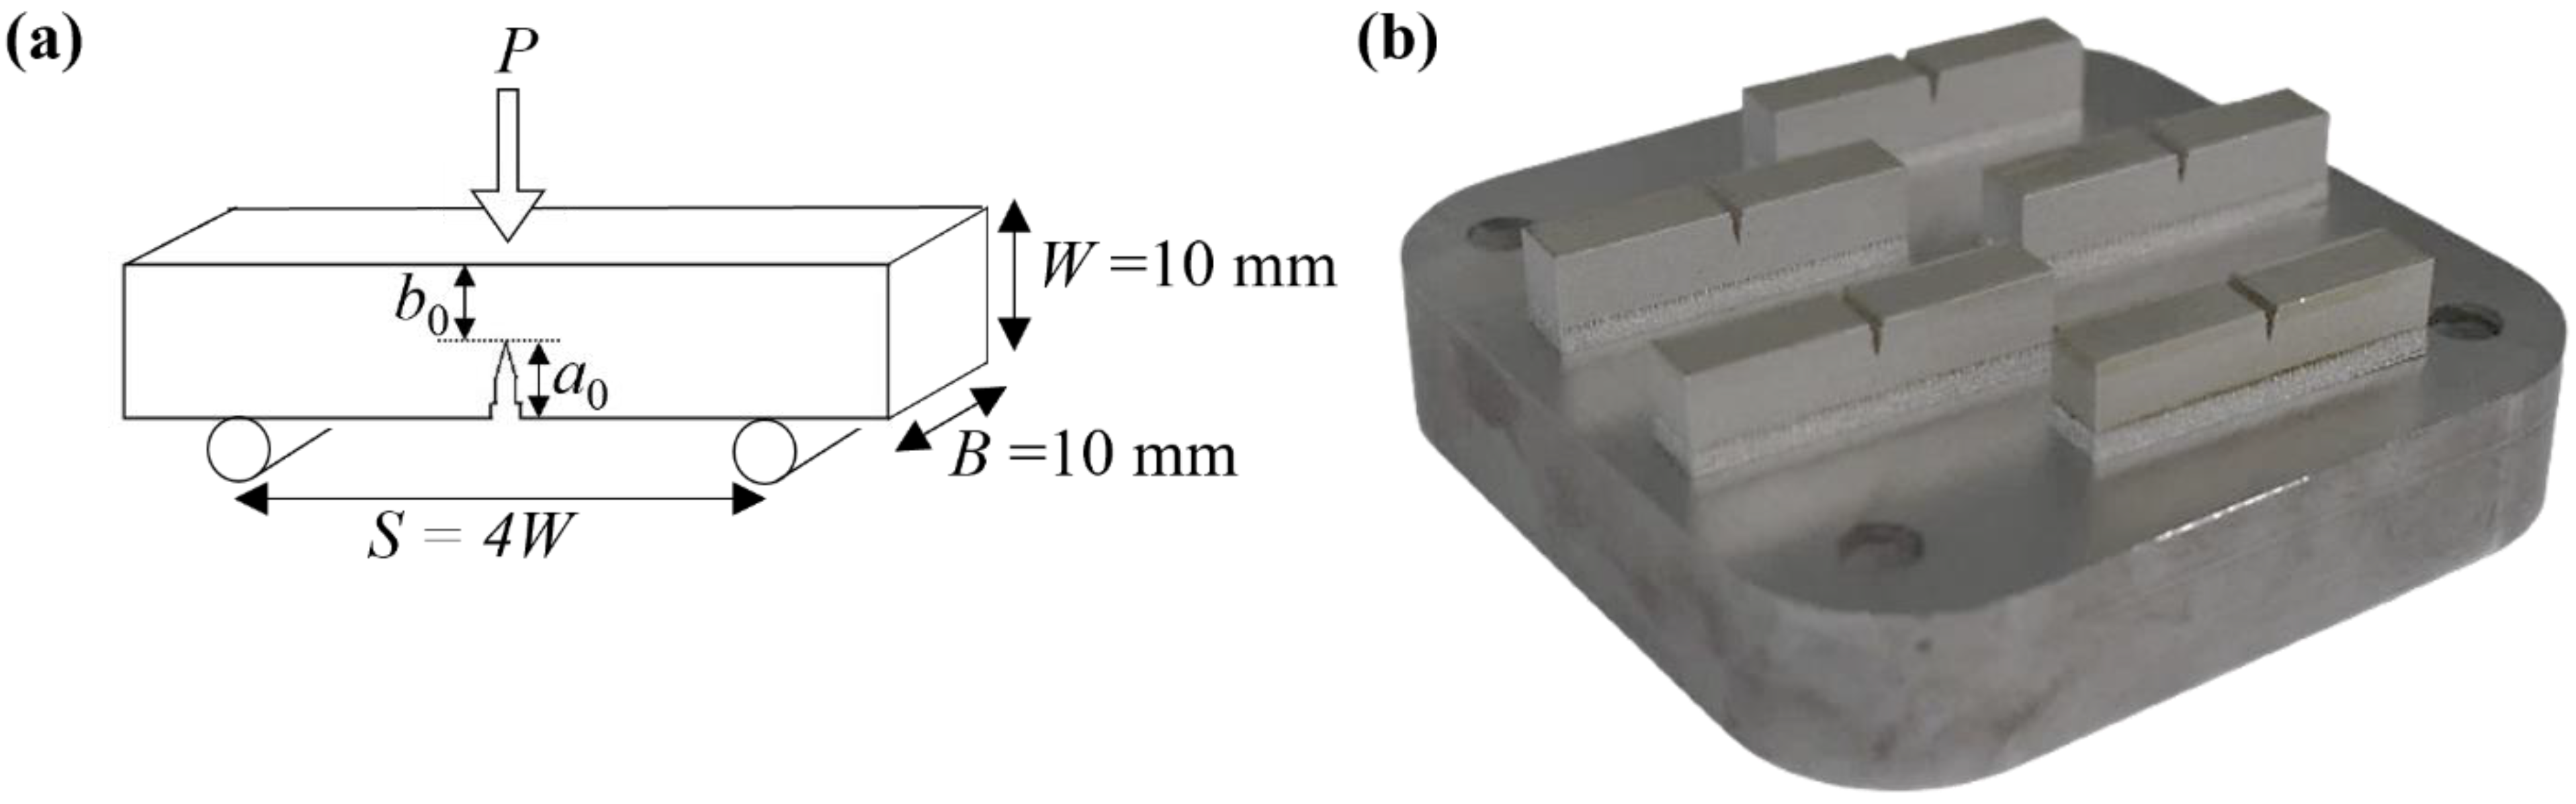
2.3. Mechanical Testing
3. Results and Discussion
3.1. Porosity and Relative Density
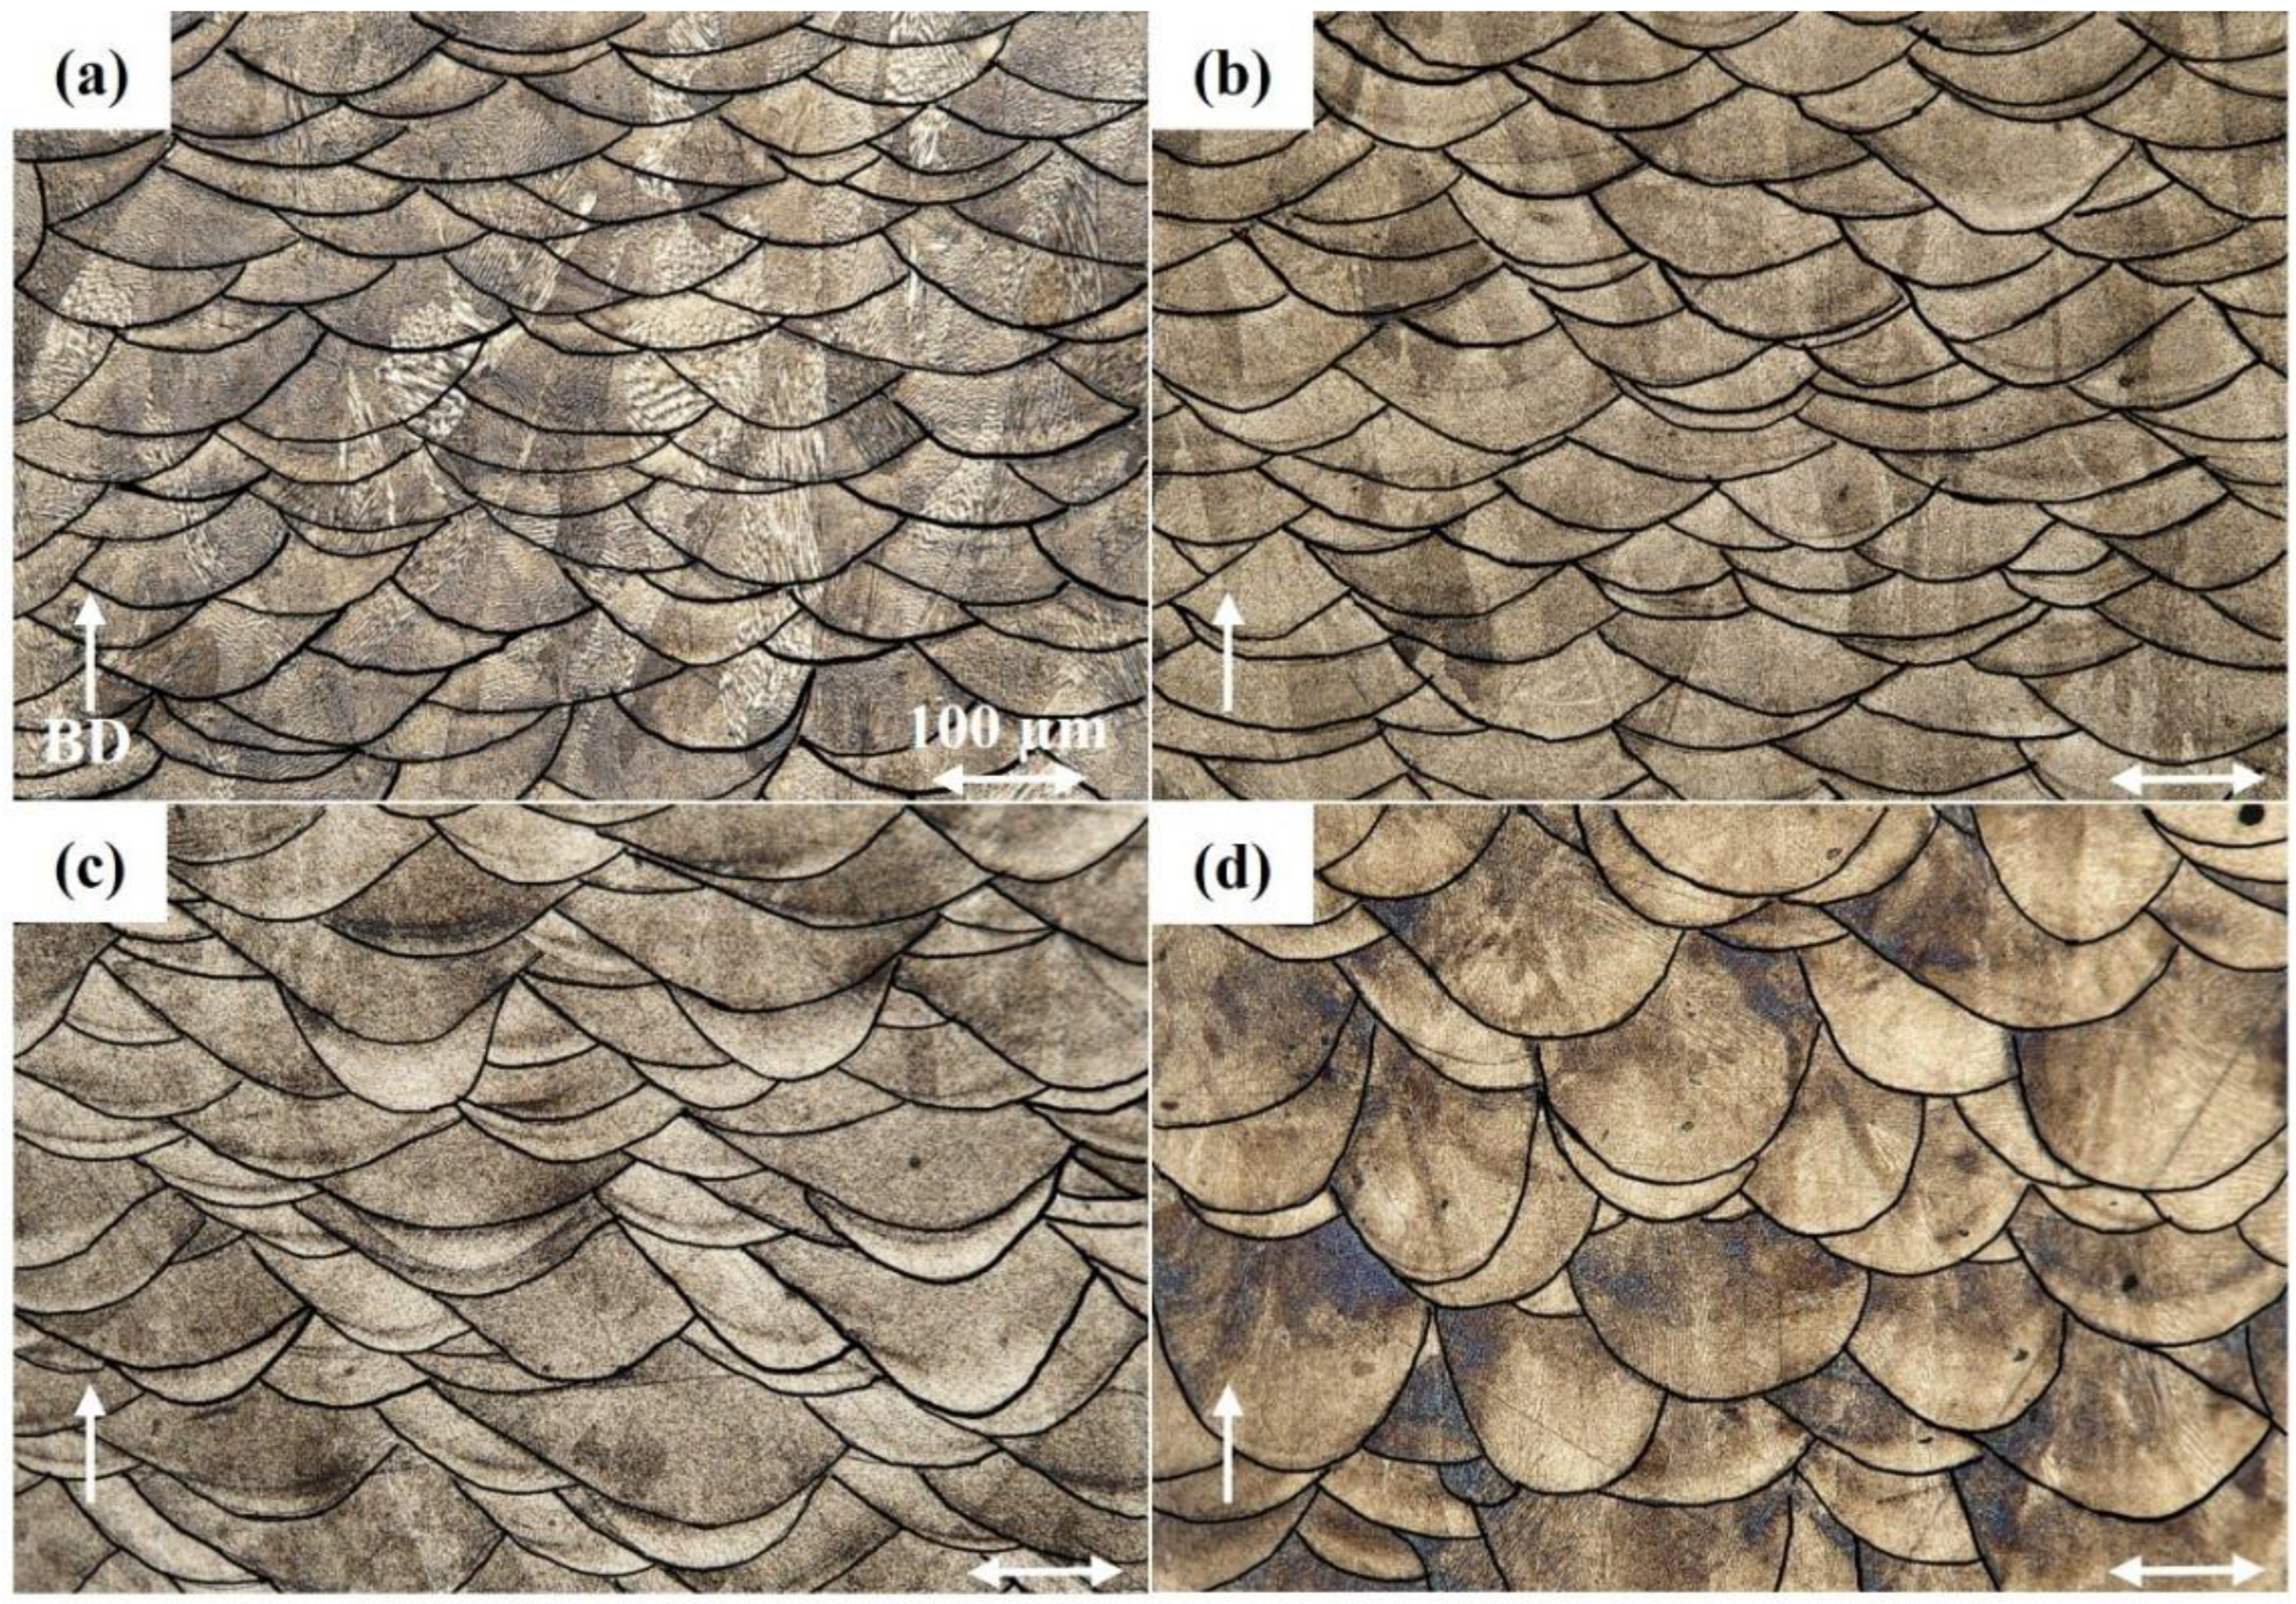
3.2. Melt Pools
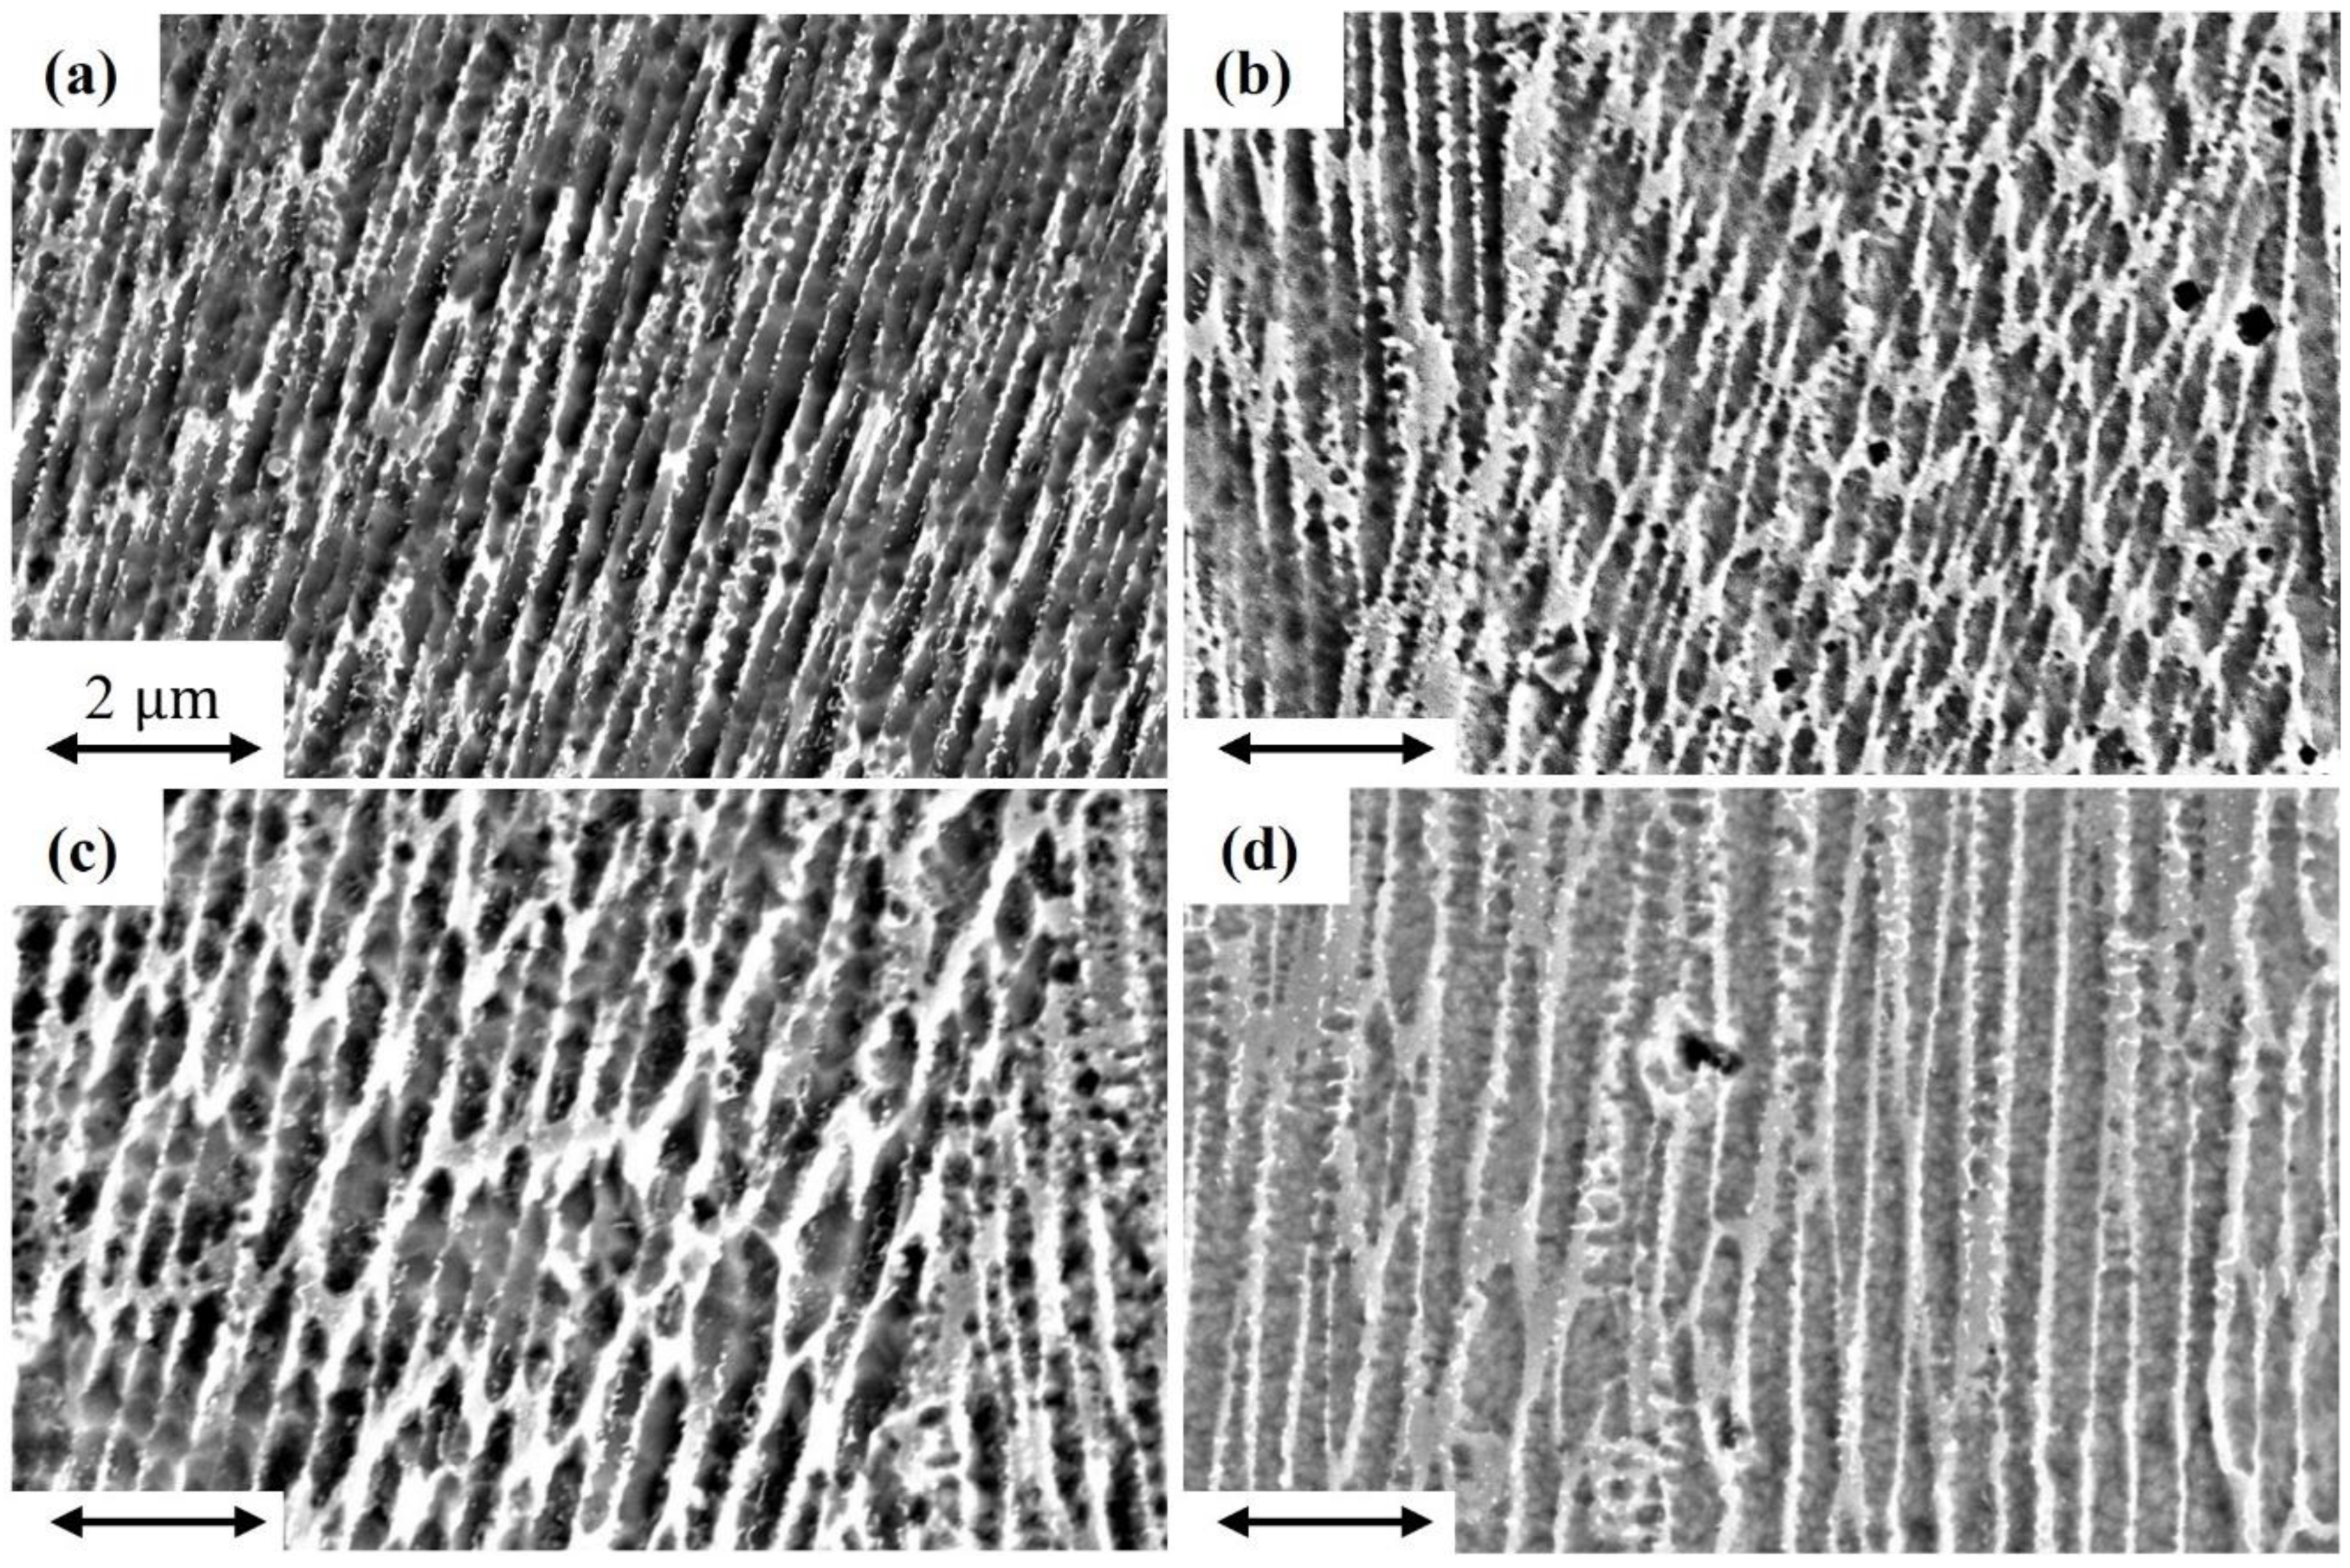
3.3. Microstructure
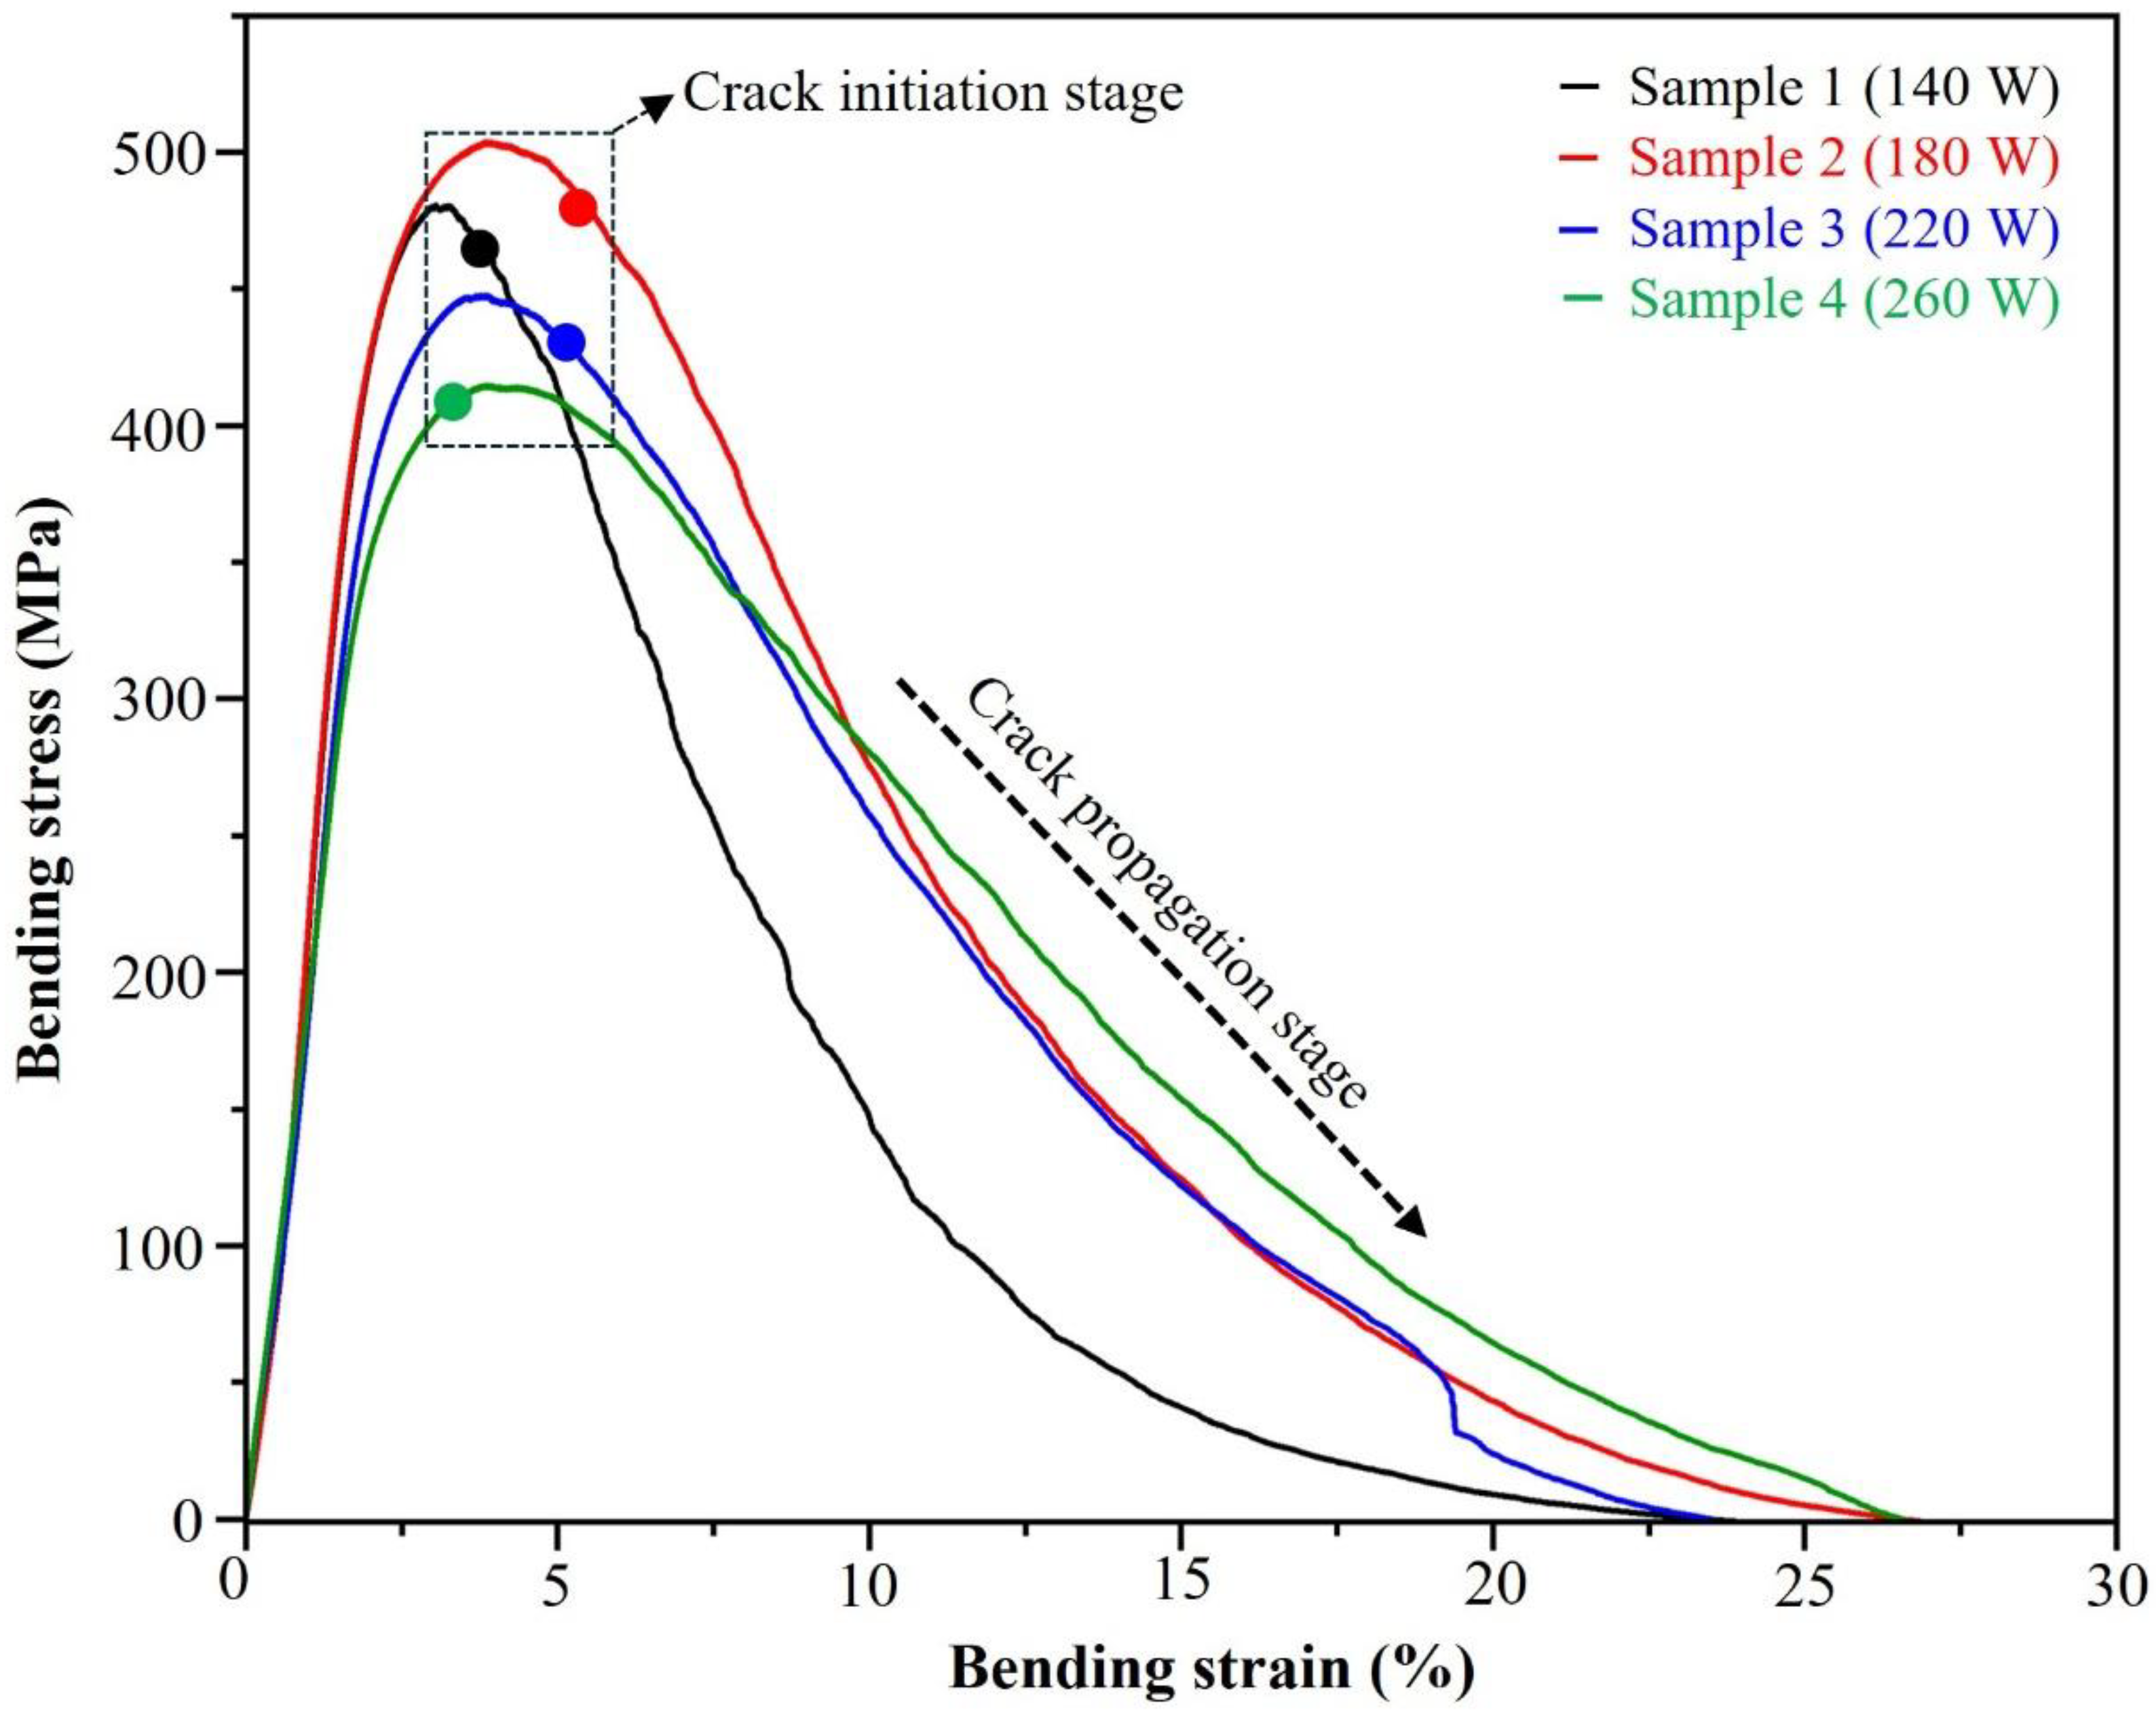
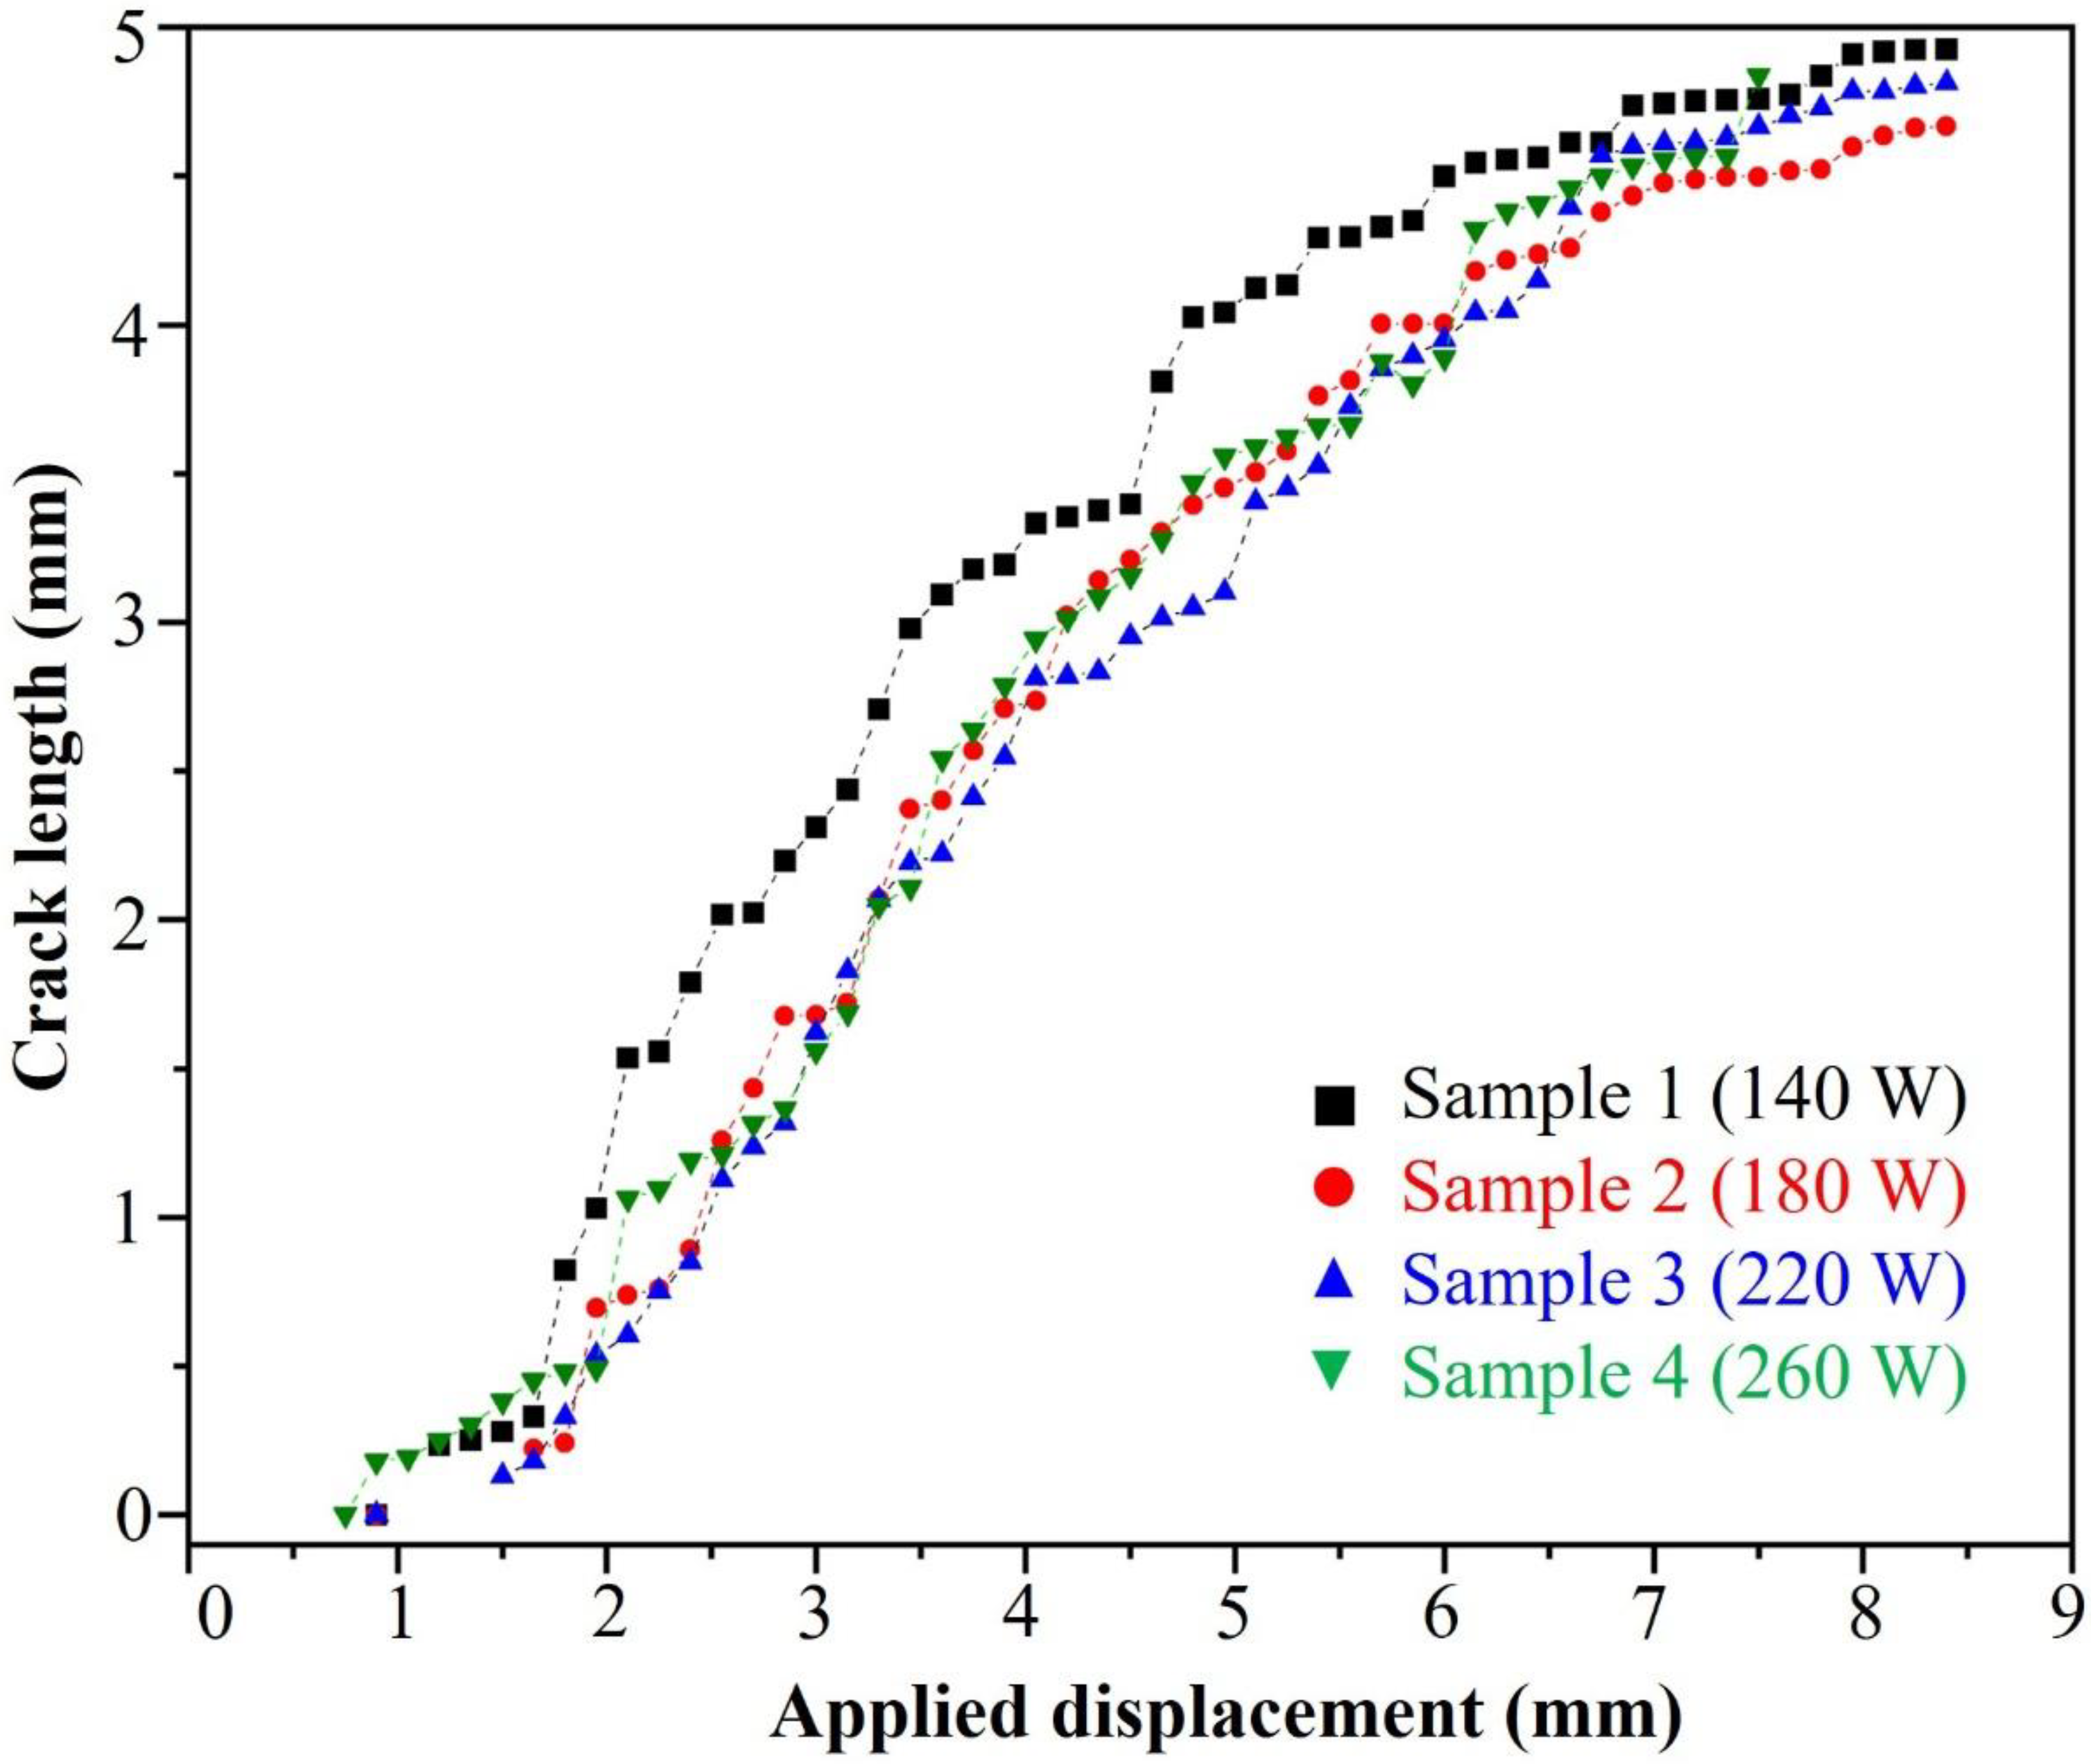
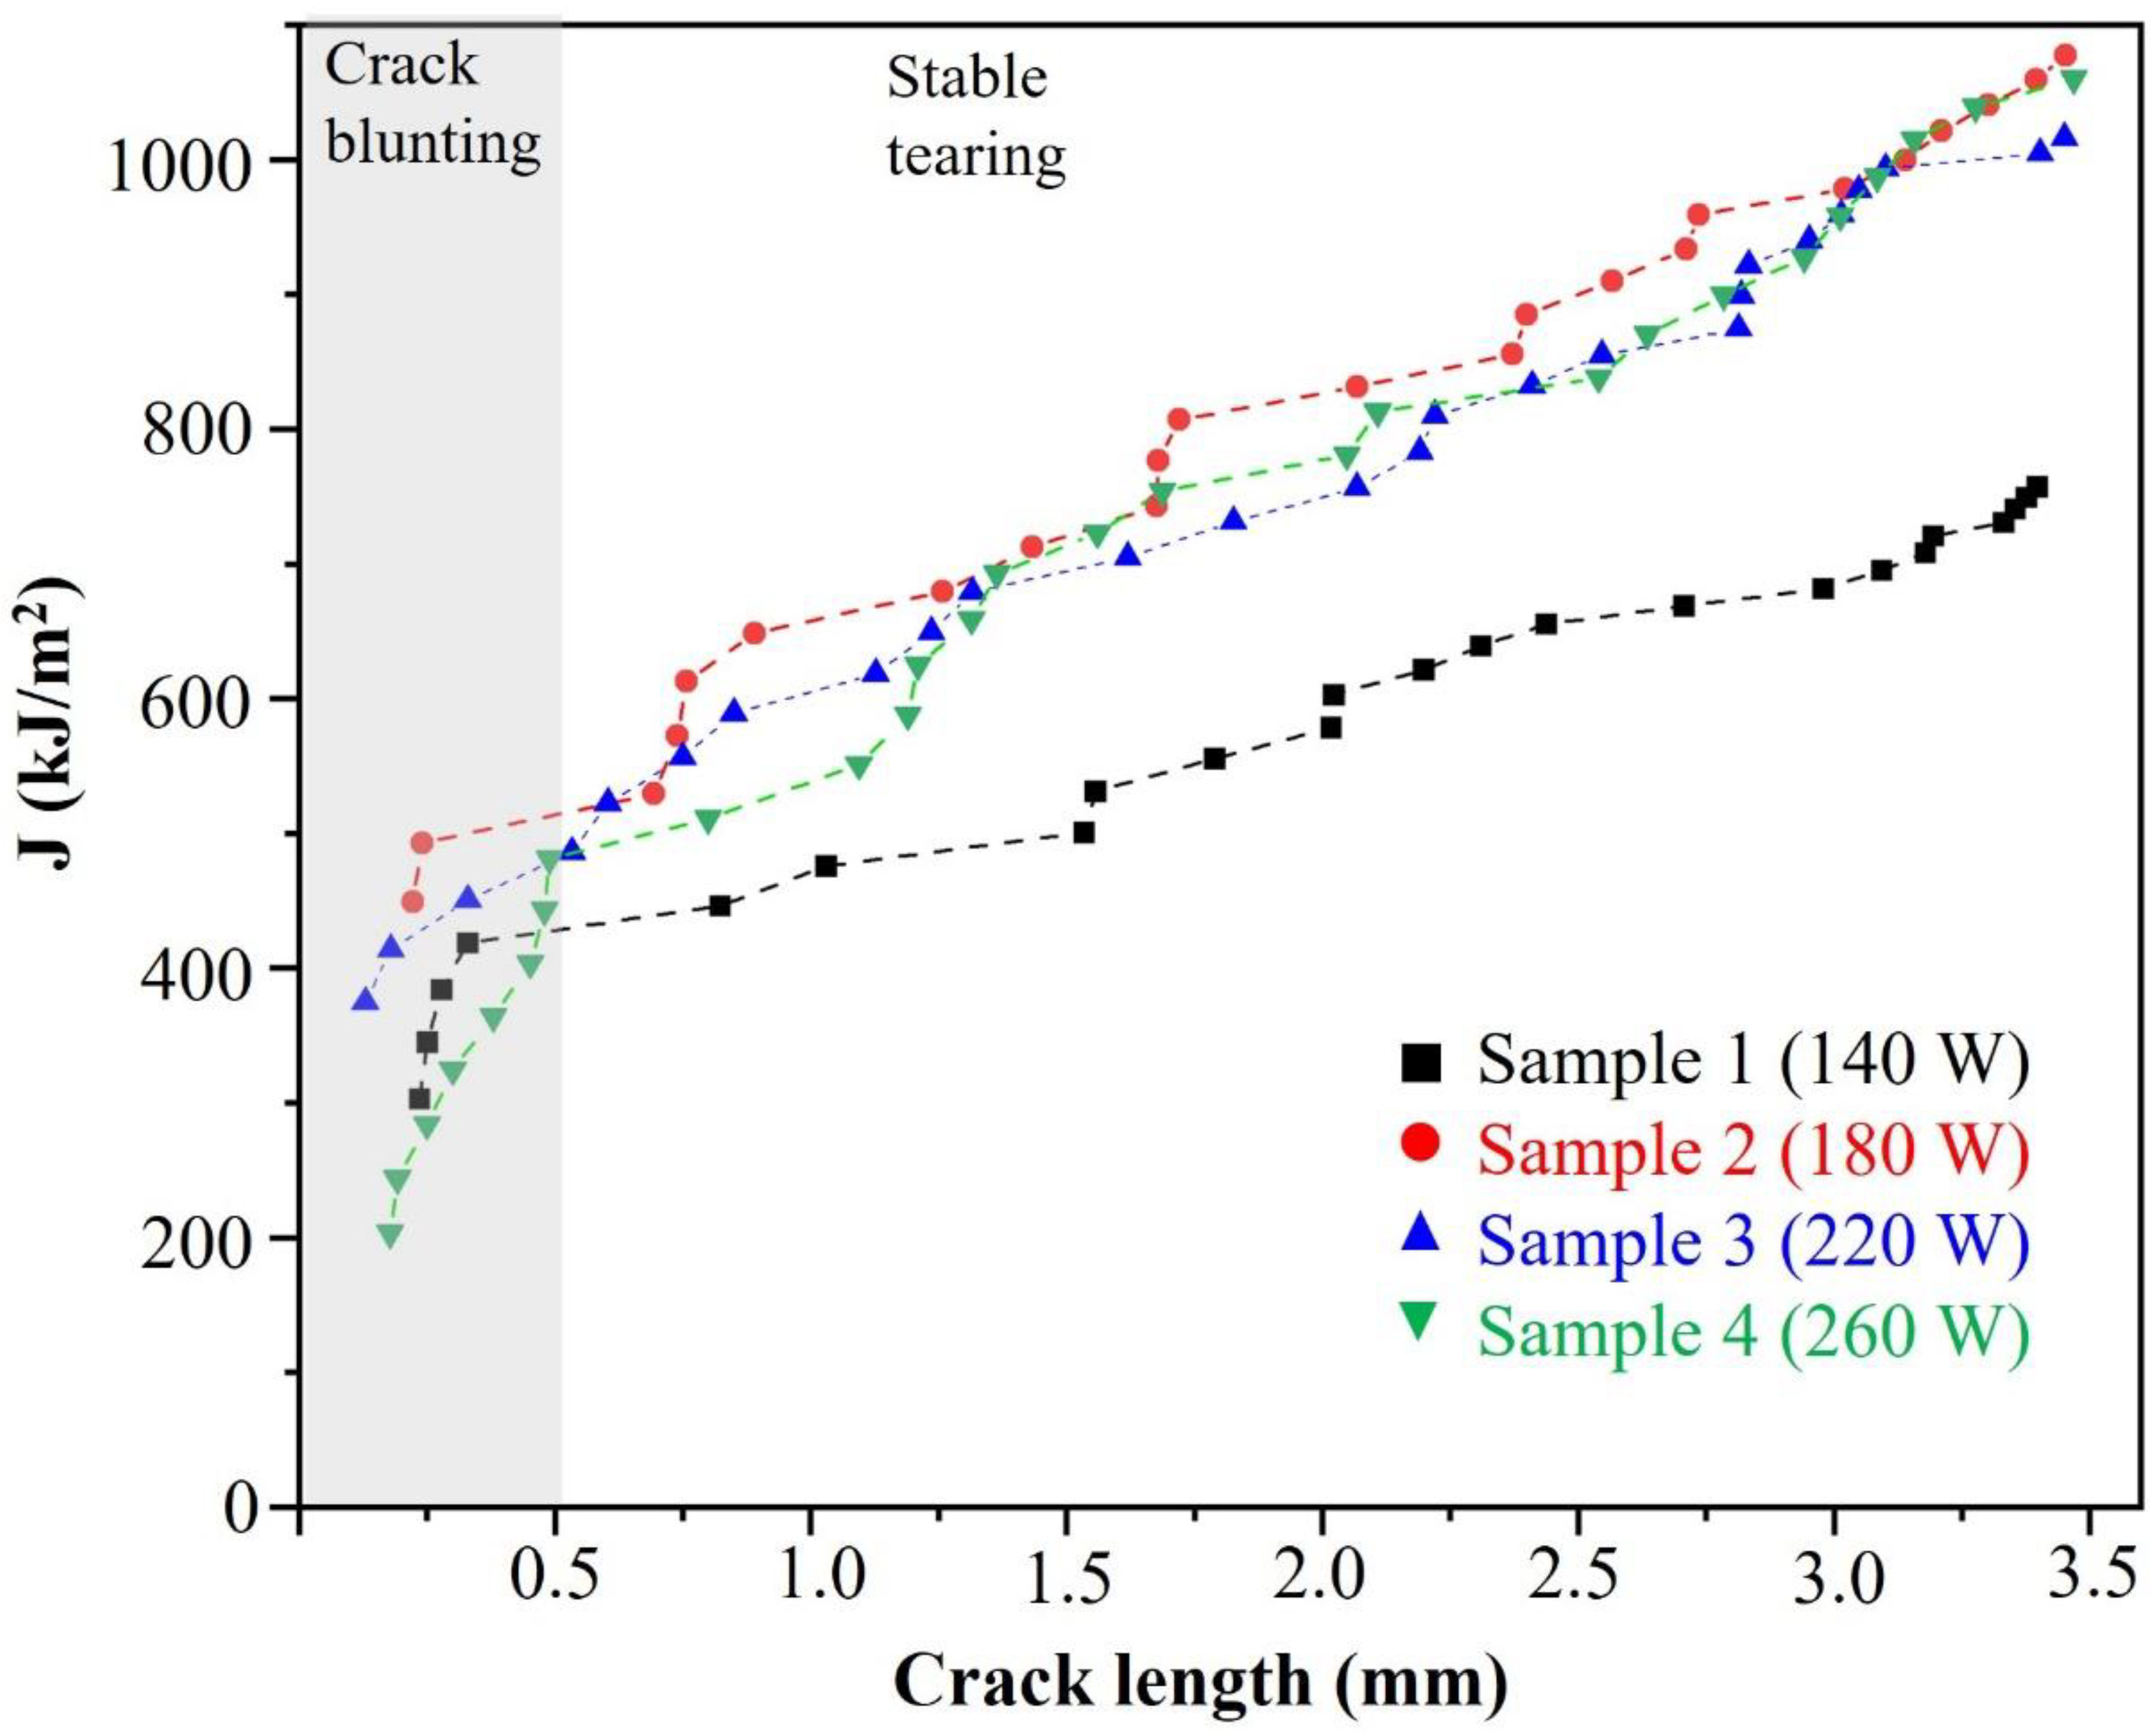
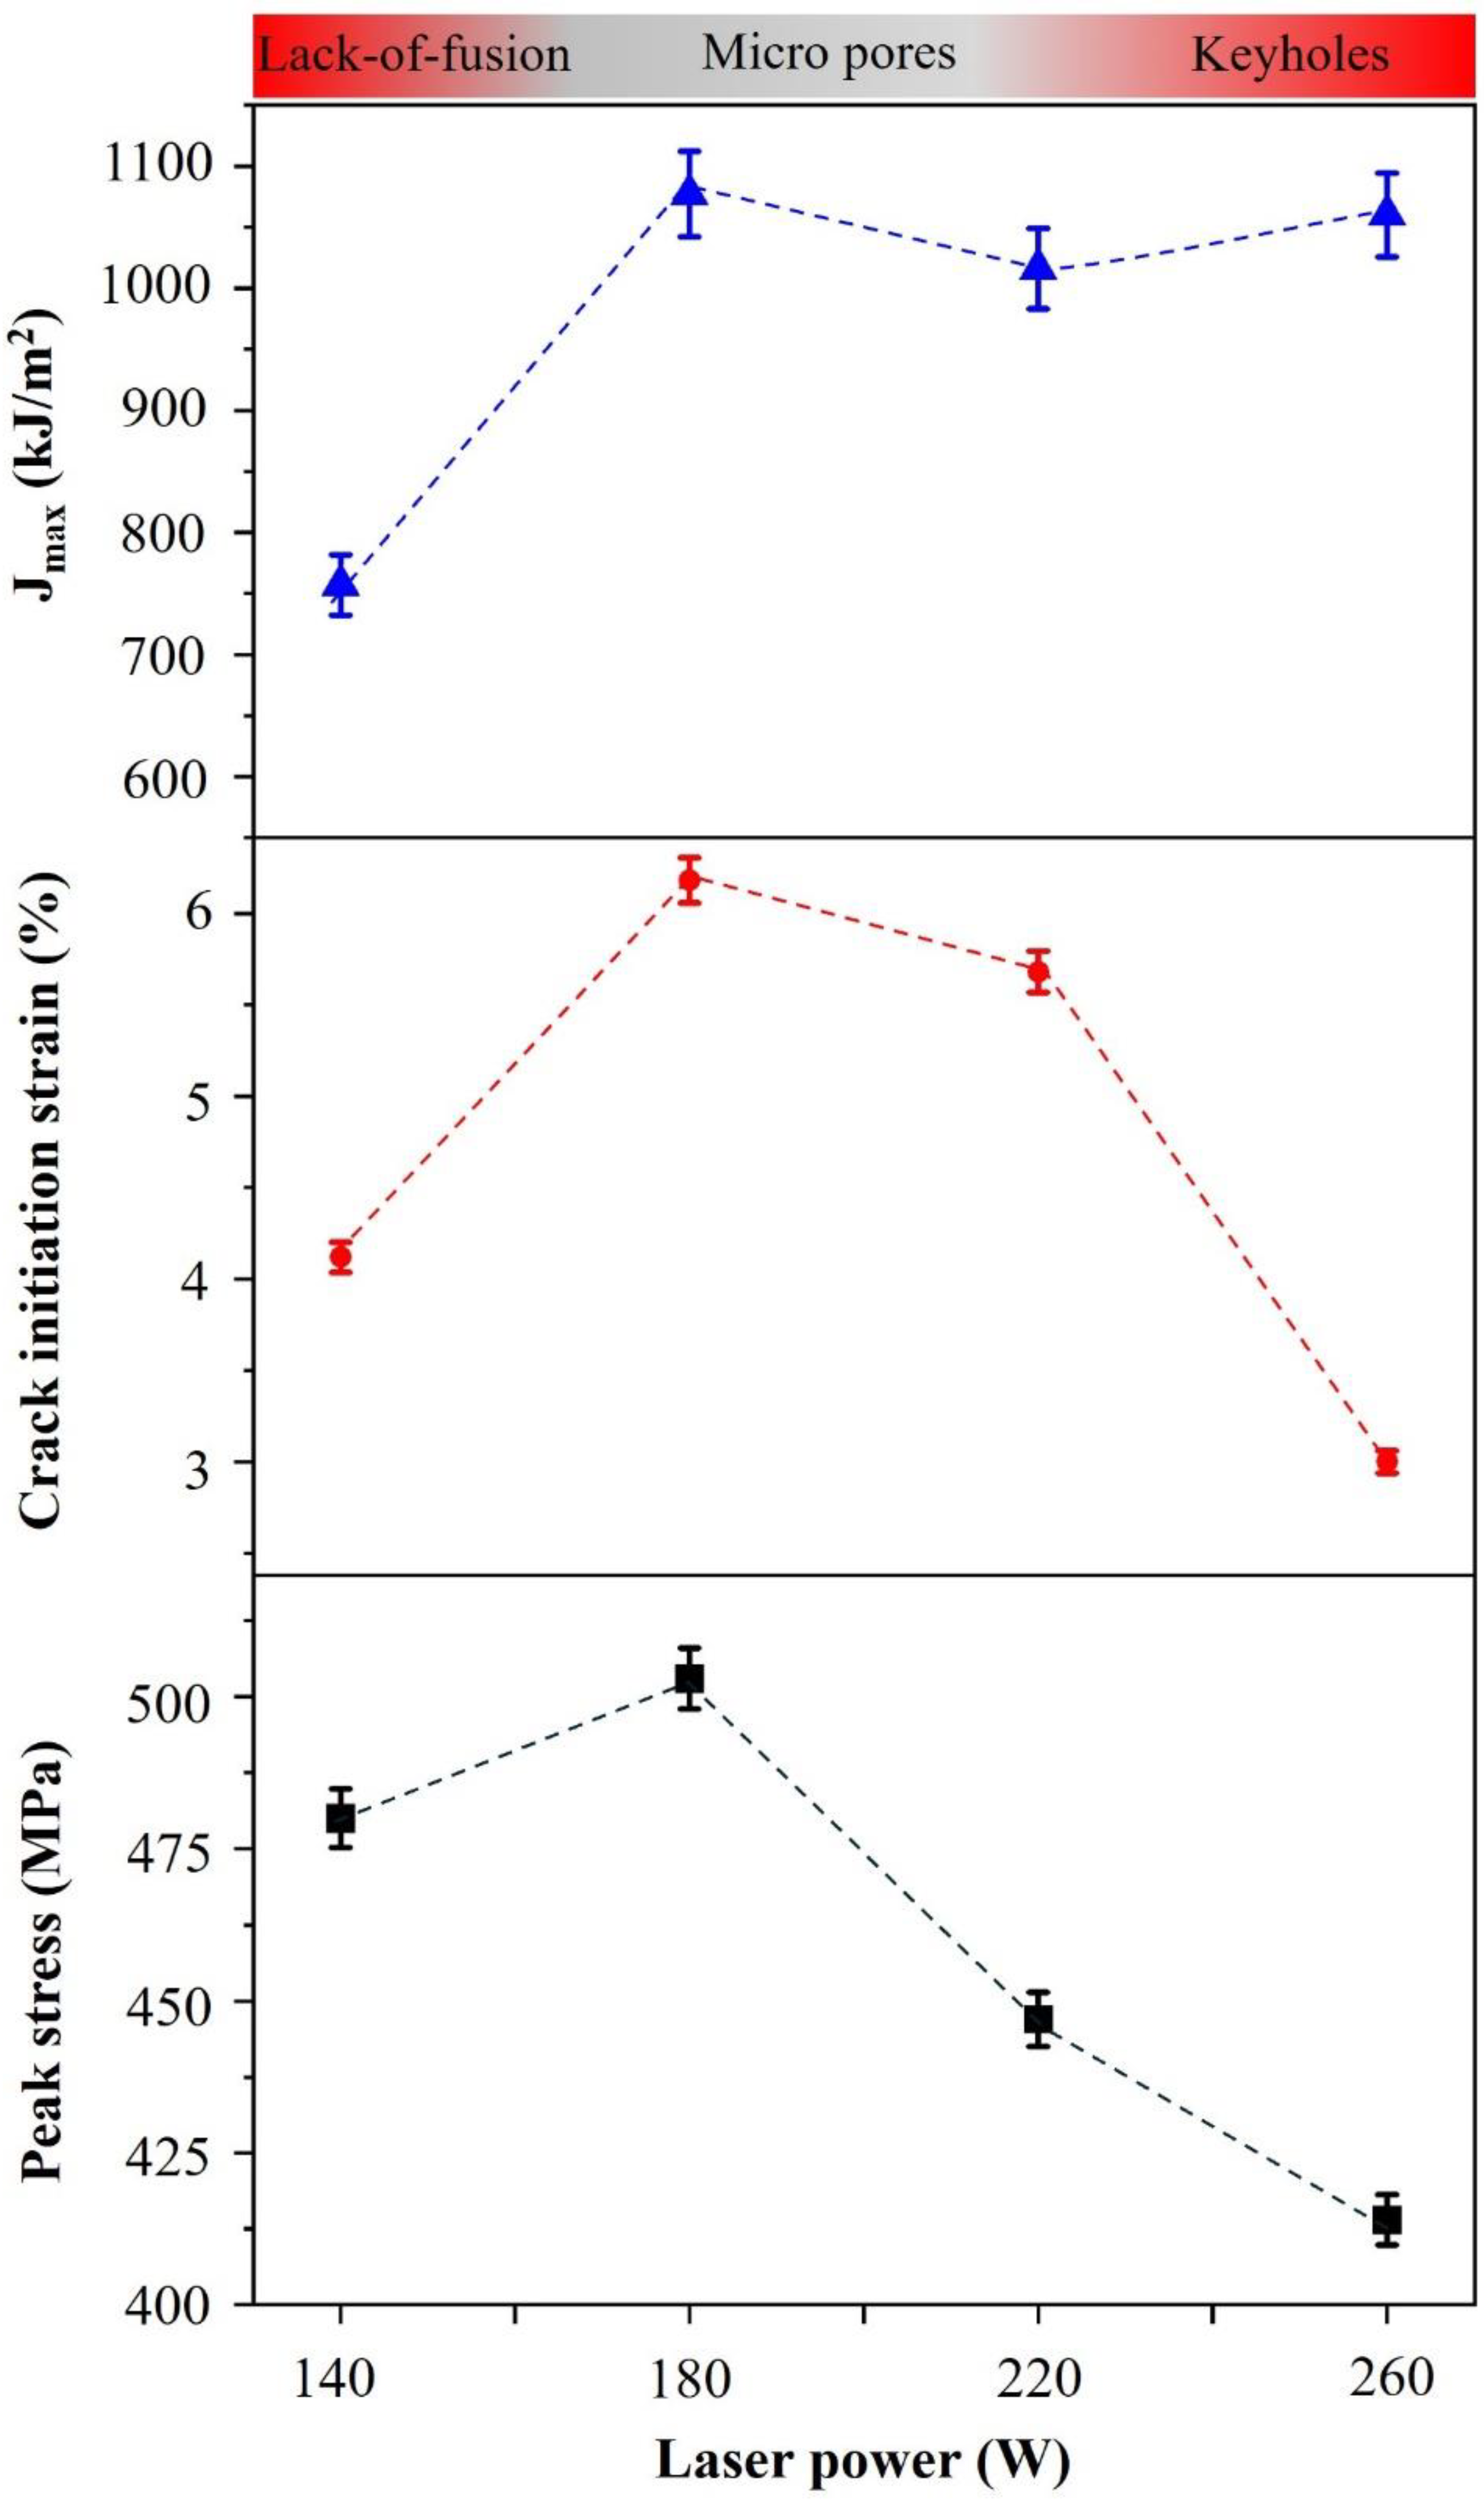
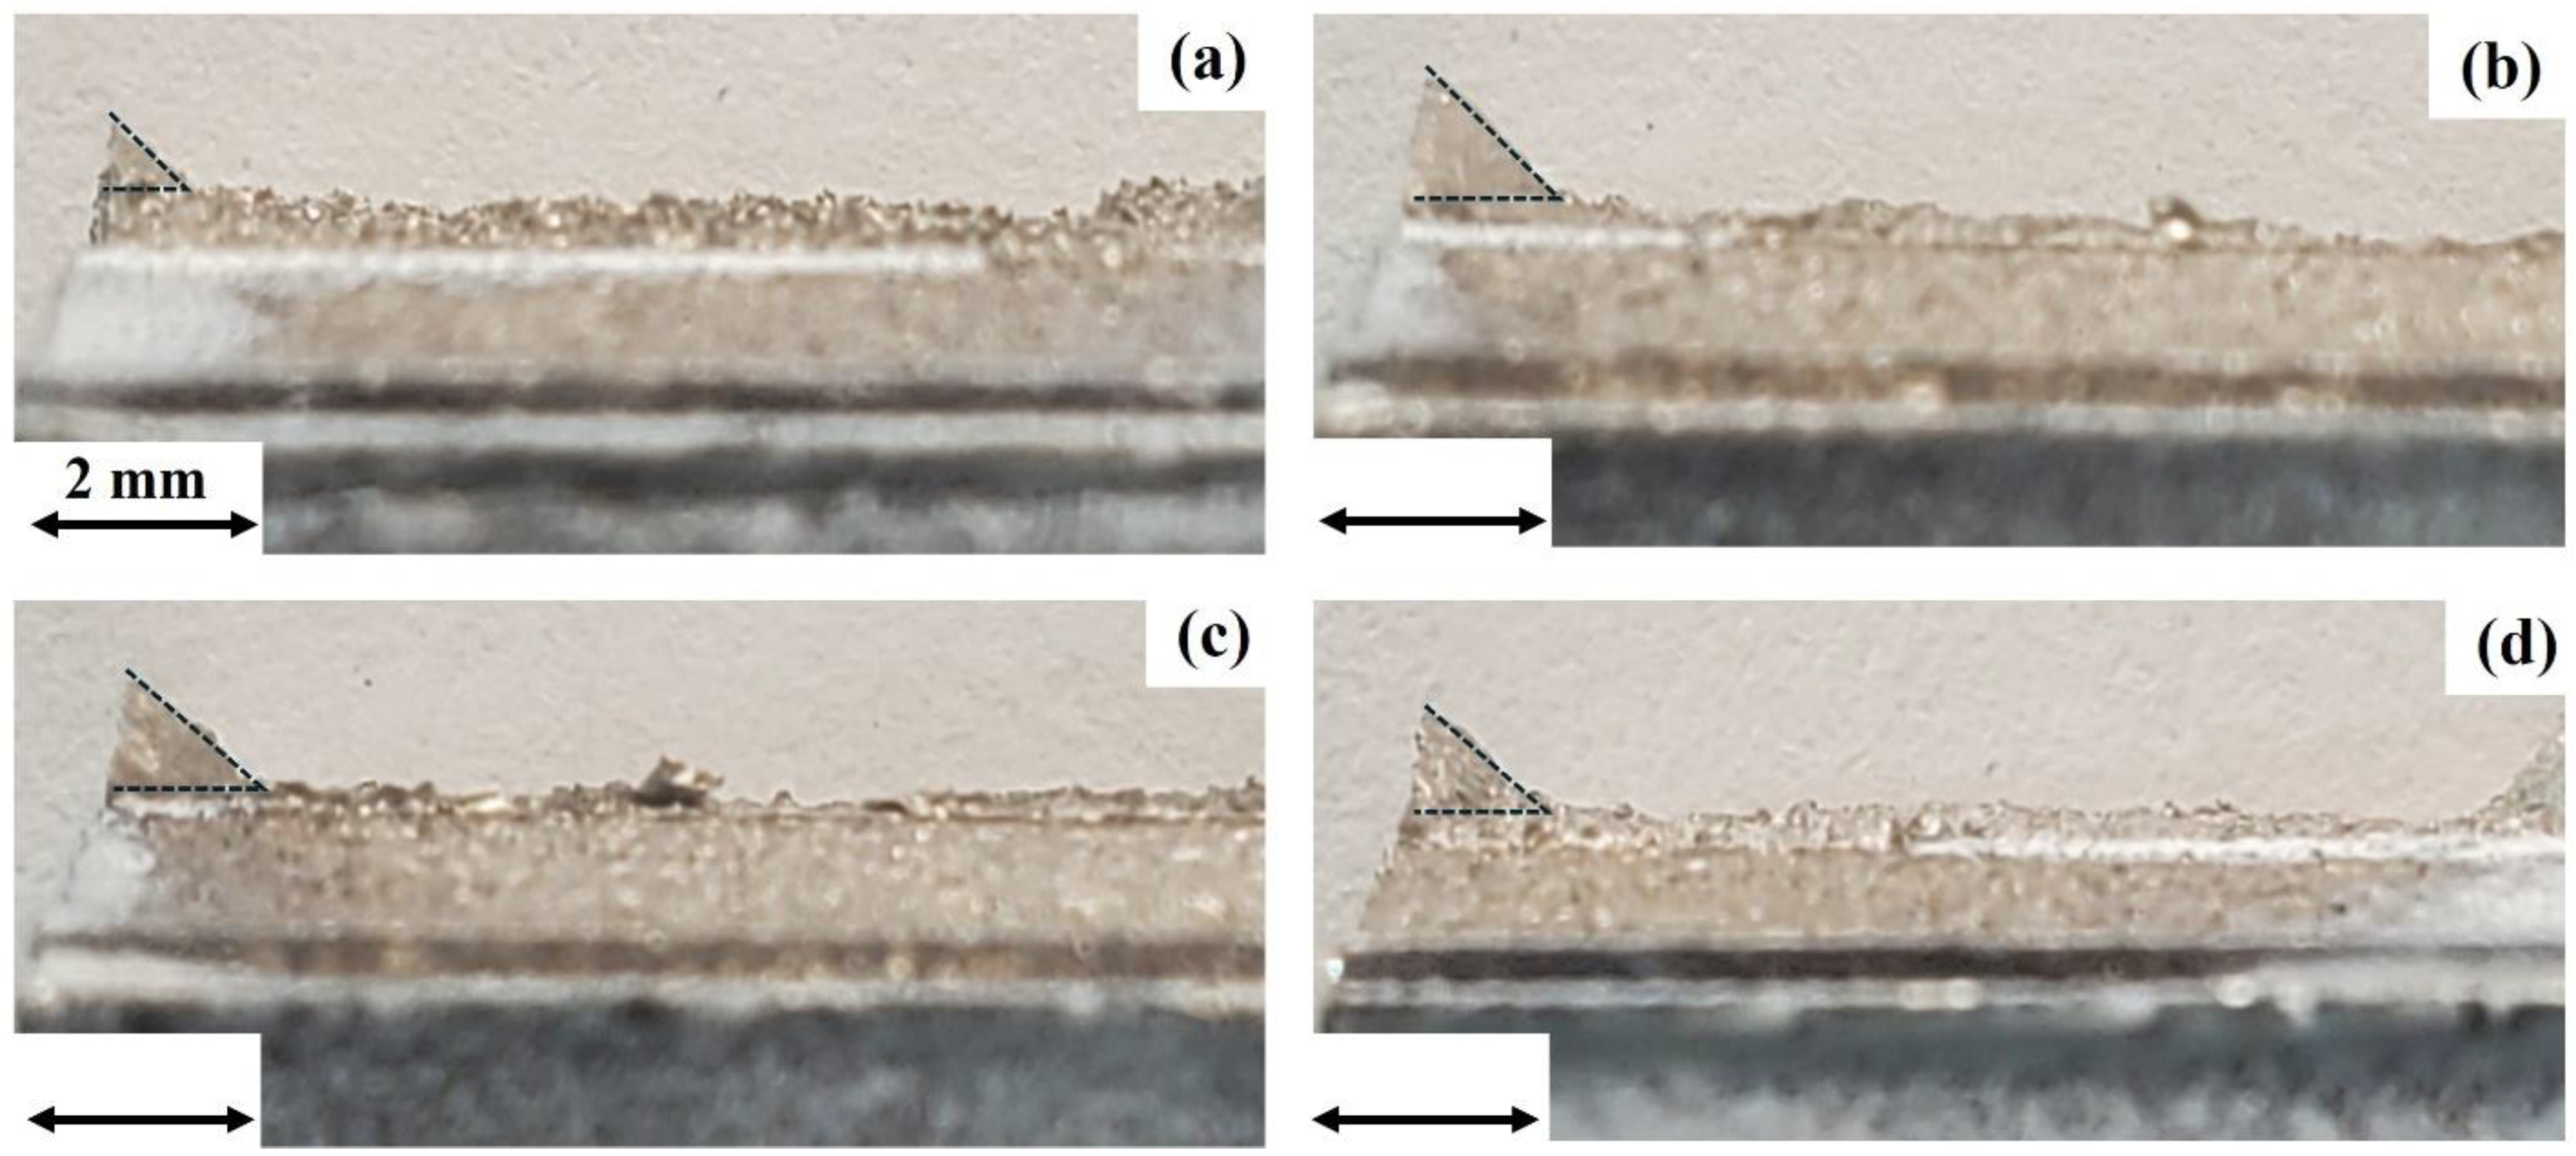
3.4. Fracture Behavior
4. Conclusions
Author Contributions
Funding
Data Availability Statement
Conflicts of Interest
References
- Qi, X.; Liang, X.; Wang, J.; Zhang, H.; Wang, X.; Liu, Z. Microstructure tailoring in laser powder bed fusion (L-PBF): Strategies, challenges, and future outlooks. J. Alloys Compd. 2024, 970, 172564. [Google Scholar] [CrossRef]
- Meng, G.; Gong, Y.; Zhang, J.; Jiang, Z.; Ren, Q.; Zhao, J. Microstructure and mechanical properties of Inconel 718 thin walls prepared by laser direct energy deposition and selective laser melting. Thin-Walled Struct. 2023, 193, 111284. [Google Scholar] [CrossRef]
- Liu, Y.; Wu, M.; Zhang, Z.; Wang, Y.; Meng, L.; Cai, K.; Zhu, H.; Xu, K.; Lu, J. Preparation of multifunctional protective coating on alloy surface by laser-electrodeposition additive-subtractive hybrid manufacturing. J. Mater. Process. Technol. 2024, 326, 118340. [Google Scholar] [CrossRef]
- Sun, S.-H.; Ishimoto, T.; Hagihara, K.; Tsutsumi, Y.; Hanawa, T.; Nakano, T. Excellent mechanical and corrosion properties of austenitic stainless steel with a unique crystallographic lamellar microstructure via selective laser melting. Scr. Mater. 2019, 159, 89–93. [Google Scholar] [CrossRef]
- Ravichander, B.B.; Jagdale, S.H.; Kumar, G. Interpenetrating microstructure in laser powder-bed fusion parts using selective rescanning. Addit. Manuf. Lett. 2024, 10, 100221. [Google Scholar] [CrossRef]
- Xiao, Z.; Chen, C.; Hu, Z.; Zhu, H.; Zeng, X. Effect of rescanning cycles on the characteristics of selective laser melting of Ti6Al4V. Opt. Laser Technol. 2020, 122, 105890. [Google Scholar] [CrossRef]
- Zhou, J.; Han, X.; Li, H.; Liu, S.; Yi, J. Investigation of layer-by-layer laser remelting to improve surface quality, microstructure, and mechanical properties of laser powder bed fused AlSi10Mg alloy. Mater. Des. 2021, 210, 110092. [Google Scholar] [CrossRef]
- Zhang, W.; Chabok, A.; Wang, H.; Shen, J.; Oliveira, J.P.; Feng, S.; Schell, N.; Kooi, B.J.; Pei, Y. Ultra-strong and ductile precipitation-strengthened high entropy alloy with 0.5% Nb addition produced by laser additive manufacturing. J. Mater. Sci. Technol. 2024, 187, 195–211. [Google Scholar] [CrossRef]
- Sofinowski, K.A.; Raman, S.; Wang, X.; Gaskey, B.; Seita, M. Layer-wise engineering of grain orientation (LEGO) in laser powder bed fusion of stainless steel 316L. Addit. Manuf. 2021, 38, 101809. [Google Scholar] [CrossRef]
- Ravichander, B.B.; Amerinatanzi, A.; Shayesteh Moghaddam, N. Study on the Effect of Powder-Bed Fusion Process Parameters on the Quality of as-Built IN718 Parts Using Response Surface Methodology. Metals 2020, 10, 1180. [Google Scholar] [CrossRef]
- Yang, T.; Liu, T.; Liao, W.; MacDonald, E.; Wei, H.; Zhang, C.; Chen, X.; Zhang, K. Laser powder bed fusion of AlSi10Mg: Influence of energy intensities on spatter and porosity evolution, microstructure and mechanical properties. J. Alloys Compd. 2020, 849, 156300. [Google Scholar] [CrossRef]
- Theeda, S.; Jagdale, S.H.; Ravichander, B.B.; Kumar, G. Optimization of process parameters in laser powder bed fusion of SS 316L parts using artificial neural networks. Metals 2023, 13, 842. [Google Scholar] [CrossRef]
- Gokcekaya, O.; Ishimoto, T.; Hibino, S.; Yasutomi, J.; Narushima, T.; Nakano, T. Unique crystallographic texture formation in Inconel 718 by laser powder bed fusion and its effect on mechanical anisotropy. Acta Mater. 2021, 212, 116876. [Google Scholar] [CrossRef]
- Jeong, S.G.; Karthik, G.M.; Kim, E.S.; Zargaran, A.; Ahn, S.Y.; Sagong, M.J.; Kang, S.H.; Cho, J.-W.; Kim, H.S. Architectured heterogeneous alloys with selective laser melting. Scr. Mater. 2022, 208, 114332. [Google Scholar] [CrossRef]
- Chandra, S.; Radhakrishnan, J.; Huang, S.; Wei, S.; Ramamurty, U. Solidification in metal additive manufacturing: Challenges, solutions, and opportunities. Prog. Mater. Sci. 2025, 148, 101361. [Google Scholar] [CrossRef]
- Liu, J.; Zhang, K.; Liu, J.; Zhang, R.; Zeng, Z.; Zhu, Y.; Huang, A. Discovering the role of the defect morphology and microstructure on the deformation behavior of additive manufactured Ti–6Al–4V. Mater. Sci. Eng. A 2022, 859, 144202. [Google Scholar] [CrossRef]
- DebRoy, T.; Wei, H.L.; Zuback, J.S.; Mukherjee, T.; Elmer, J.W.; Milewski, J.O.; Beese, A.M.; Wilson-Heid, A.; De, A.; Zhang, W. Additive manufacturing of metallic components—Process, structure and properties. Prog. Mater. Sci. 2018, 92, 112–224. [Google Scholar] [CrossRef]
- Chowdhury, S.; Yadaiah, N.; Prakash, C.; Ramakrishna, S.; Dixit, S.; Gupta, L.R.; Buddhi, D. Laser powder bed fusion: A state-of-the-art review of the technology, materials, properties & defects, and numerical modelling. J. Mater. Res. Technol. 2022, 20, 2109–2172. [Google Scholar]
- Narasimharaju, S.R.; Zeng, W.; See, T.L.; Zhu, Z.; Scott, P.; Jiang, X.; Lou, S. A comprehensive review on laser powder bed fusion of steels: Processing, microstructure, defects and control methods, mechanical properties, current challenges and future trends. J. Manuf. Process. 2022, 75, 375–414. [Google Scholar] [CrossRef]
- Wang, D.; Song, C.; Yang, Y.; Bai, Y. Investigation of crystal growth mechanism during selective laser melting and mechanical property characterization of 316L stainless steel parts. Mater. Des. 2016, 100, 291–299. [Google Scholar] [CrossRef]
- Luo, Q.; Yin, L.; Simpson, T.W.; Beese, A.M. Effect of processing parameters on pore structures, grain features, and mechanical properties in Ti-6Al-4V by laser powder bed fusion. Addit. Manuf. 2022, 56, 102915. [Google Scholar] [CrossRef]
- Volpato, G.M.; Tetzlaff, U.; Fredel, M.C. A comprehensive literature review on laser powder bed fusion of Inconel superalloys. Addit. Manuf. 2022, 55, 102871. [Google Scholar] [CrossRef]
- Liu, Q.; Wu, H.; Paul, M.J.; He, P.; Peng, Z.; Gludovatz, B.; Kruzic, J.J.; Wang, C.H.; Li, X. Machine-learning assisted laser powder bed fusion process optimization for AlSi10Mg: New microstructure description indices and fracture mechanisms. Acta Mater. 2020, 201, 316–328. [Google Scholar] [CrossRef]
- Vieille, B.; Keller, C.; Mokhtari, M.; Briatta, H.; Breteau, T.; Nguejio, J.; Barbe, F.; Azzouna, M.B.; Baustert, E. Investigations on the fracture behavior of Inconel 718 superalloys obtained from cast and additive manufacturing processes. Mater. Sci. Eng. A 2020, 790, 139666. [Google Scholar] [CrossRef]
- Davies, C.M.; Withnell, O.; Ronnerberg, T.; Williams, R.; Hooper, P.A. Fracture Analysis of 316L Steel Samples Manufactured by Selective Laser Melting. Procedia Struct. Integr. 2018, 13, 1384–1389. [Google Scholar] [CrossRef]
- Pitrmuc, Z.; Šimota, J.; Beránek, L.; Mikeš, P.; Andronov, V.; Sommer, J.; Holešovský, F. Mechanical and Microstructural Anisotropy of Laser Powder Bed Fusion 316L Stainless Steel. Materials 2022, 15, 551. [Google Scholar] [CrossRef]
- Wilson, T.; Sealy, M.; Bofarull, I.C.; Keller, C.; Vieille, B. Influence of processing parameters on the fracture behaviour of 316L SS printed by laser powder bed fusion. Mech. Mater. 2024, 198, 105133. [Google Scholar] [CrossRef]
- Vieille, B.; Duchaussoy, A.; Benmabrouk, S.; Henry, R.; Keller, C. Fracture behavior of Hastelloy X elaborated by laser powder bed fusion: Influence of microstructure and building direction. J. Alloys Compd. 2022, 918, 165570. [Google Scholar] [CrossRef]
- Benmabrouk, B.; Vieille, B.; Keller, C.; Joshi, S.S.; Hug, E. Fracture behavior of a Ni-20 wt.%Cr binary alloy processed by Laser Powder Bed Fusion: Influence of the specimen building orientation and rotation angle between layers. Eng. Fract. Mech. 2024, 307, 110340. [Google Scholar] [CrossRef]
- E1820-23b; Standard Test Method for Measurement of Fracture Toughness. ASTM International: West Conshohocken, PA, USA, 2023.
- Ravichander, B.B.; Mamidi, K.; Rajendran, V.; Farhang, B.; Ganesh-Ram, A.; Hanumantha, M.; Shayesteh Moghaddam, N.; Amerinatanzi, A. Experimental investigation of laser scan strategy on the microstructure and properties of Inconel 718 parts fabricated by laser powder bed fusion. Mater. Charact. 2022, 186, 111765. [Google Scholar] [CrossRef]
- Mills, W.J. The deformation and fracture characteristics of inconel X-750 at room temperature and elevated temperatures. Metall. Trans. A 1980, 11, 1039–1047. [Google Scholar] [CrossRef]
- King, W.E.; Barth, H.D.; Castillo, V.M.; Gallegos, G.F.; Gibbs, J.W.; Hahn, D.E.; Kamath, C.; Rubenchik, A.M. Observation of keyhole-mode laser melting in laser powder-bed fusion additive manufacturing. J. Mater. Process. Technol. 2014, 214, 2915–2925. [Google Scholar] [CrossRef]
- Brooks, N.; Porter, L.; Vaseghi, M.; Palazotto, A.; Davami, K. Mechanical, Morphological, and Microstructural Characterization of Additively Manufactured Inconel 718 After Laser Surface Remelting at Different Scan Speeds. Metall. Mater. Trans. A 2022, 53, 4471–4480. [Google Scholar] [CrossRef]
- McCartney, D.G.; Hunt, J.D. Measurements of cell and primary dendrite arm spacings in directionally solidified aluminium alloys. Acta Metall. 1981, 29, 1851–1863. [Google Scholar] [CrossRef]
- Deng, D.; Peng, R.L.; Brodin, H.; Moverare, J. Microstructure and mechanical properties of Inconel 718 produced by selective laser melting: Sample orientation dependence and effects of post heat treatments. Mater. Sci. Eng. A 2018, 713, 294–306. [Google Scholar] [CrossRef]
- Zhong, Q.; Wei, K.; Ouyang, T.; Li, X.; Zeng, X. Effect of rotation angle on surface morphology, microstructure, and mechanical properties of Inconel 718 alloy fabricated by high power laser powder bed fusion. J. Mater. Sci. Technol. 2023, 154, 30–42. [Google Scholar] [CrossRef]
- Liang, A.; Pey, K.S.; Polcar, T.; Hamilton, A.R. Effects of rescanning parameters on densification and microstructural refinement of 316L stainless steel fabricated by laser powder bed fusion. J. Mater. Process. Technol. 2022, 302, 117493. [Google Scholar] [CrossRef]


| Element | Fe | Cr | Ni | Mo | Nb + Ta | Mn | Si | P | C | Co | Al |
|---|---|---|---|---|---|---|---|---|---|---|---|
| Mass fraction (%) | Bal. | 17–21 | 50–55 | 2.8–3.30 | 4.75–5.50 | 0.35 | 0.35 | 0.015 | 0.08 | 1.0 | 0.2–0.8 |
| Sample No. | LP (W) | SS (mm/s) | HS (mm) | LT (mm) | VED (J/mm3) | Relative Density (%) |
|---|---|---|---|---|---|---|
| 1 | 140 | 600 | 0.12 | 0.03 | 64.8 | 98.40 |
| 2 | 180 | 600 | 0.12 | 0.03 | 83.3 | 99.83 |
| 3 | 220 | 600 | 0.12 | 0.03 | 101.8 | 99.65 |
| 4 | 260 | 600 | 0.12 | 0.03 | 120.4 | 99.34 |
| Sample No. | Width, X (µm) | Depth, Z (µm) | Depth to Half Width Ratio (Z/0.5X) |
|---|---|---|---|
| 1 | 138 ± 16 | 61 ± 11 | 0.88 |
| 2 | 156 ± 14 | 66 ± 8 | 0.85 |
| 3 | 192 ± 28 | 91 ± 17 | 0.95 |
| 4 | 192 ± 29 | 135 ± 21 | 1.41 |
| Sample No. | Grain Size (µm) | PDAS (µm) | Cooling Rate, 106 (K/s) |
|---|---|---|---|
| 1 | 22 ± 4 | 0.46 | 6.21 |
| 2 | 32 ± 3 | 0.64 | 2.22 |
| 3 | 36 ± 5 | 0.68 | 1.89 |
| 4 | 38 ± 6 | 0.78 | 1.23 |
Disclaimer/Publisher’s Note: The statements, opinions and data contained in all publications are solely those of the individual author(s) and contributor(s) and not of MDPI and/or the editor(s). MDPI and/or the editor(s) disclaim responsibility for any injury to people or property resulting from any ideas, methods, instructions or products referred to in the content. |
© 2025 by the authors. Licensee MDPI, Basel, Switzerland. This article is an open access article distributed under the terms and conditions of the Creative Commons Attribution (CC BY) license (https://creativecommons.org/licenses/by/4.0/).
Share and Cite
Akbar, N.I.; Nandigama, K.; Sati, I.; Ravichander, B.B.; Kumar, G. Effect of Laser Power on the Microstructure and Fracture of Notched IN718 Specimens Fabricated by Laser Powder Bed Fusion. Metals 2025, 15, 639. https://doi.org/10.3390/met15060639
Akbar NI, Nandigama K, Sati I, Ravichander BB, Kumar G. Effect of Laser Power on the Microstructure and Fracture of Notched IN718 Specimens Fabricated by Laser Powder Bed Fusion. Metals. 2025; 15(6):639. https://doi.org/10.3390/met15060639
Chicago/Turabian StyleAkbar, Naheen Ibn, Kalyan Nandigama, Ishaan Sati, Bharath Bhushan Ravichander, and Golden Kumar. 2025. "Effect of Laser Power on the Microstructure and Fracture of Notched IN718 Specimens Fabricated by Laser Powder Bed Fusion" Metals 15, no. 6: 639. https://doi.org/10.3390/met15060639
APA StyleAkbar, N. I., Nandigama, K., Sati, I., Ravichander, B. B., & Kumar, G. (2025). Effect of Laser Power on the Microstructure and Fracture of Notched IN718 Specimens Fabricated by Laser Powder Bed Fusion. Metals, 15(6), 639. https://doi.org/10.3390/met15060639