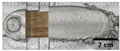
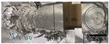
Figure 1.
A graphic with the 4 tools used during the study, starting from the left with the flat, knub, scroll, and knub–scroll tools.
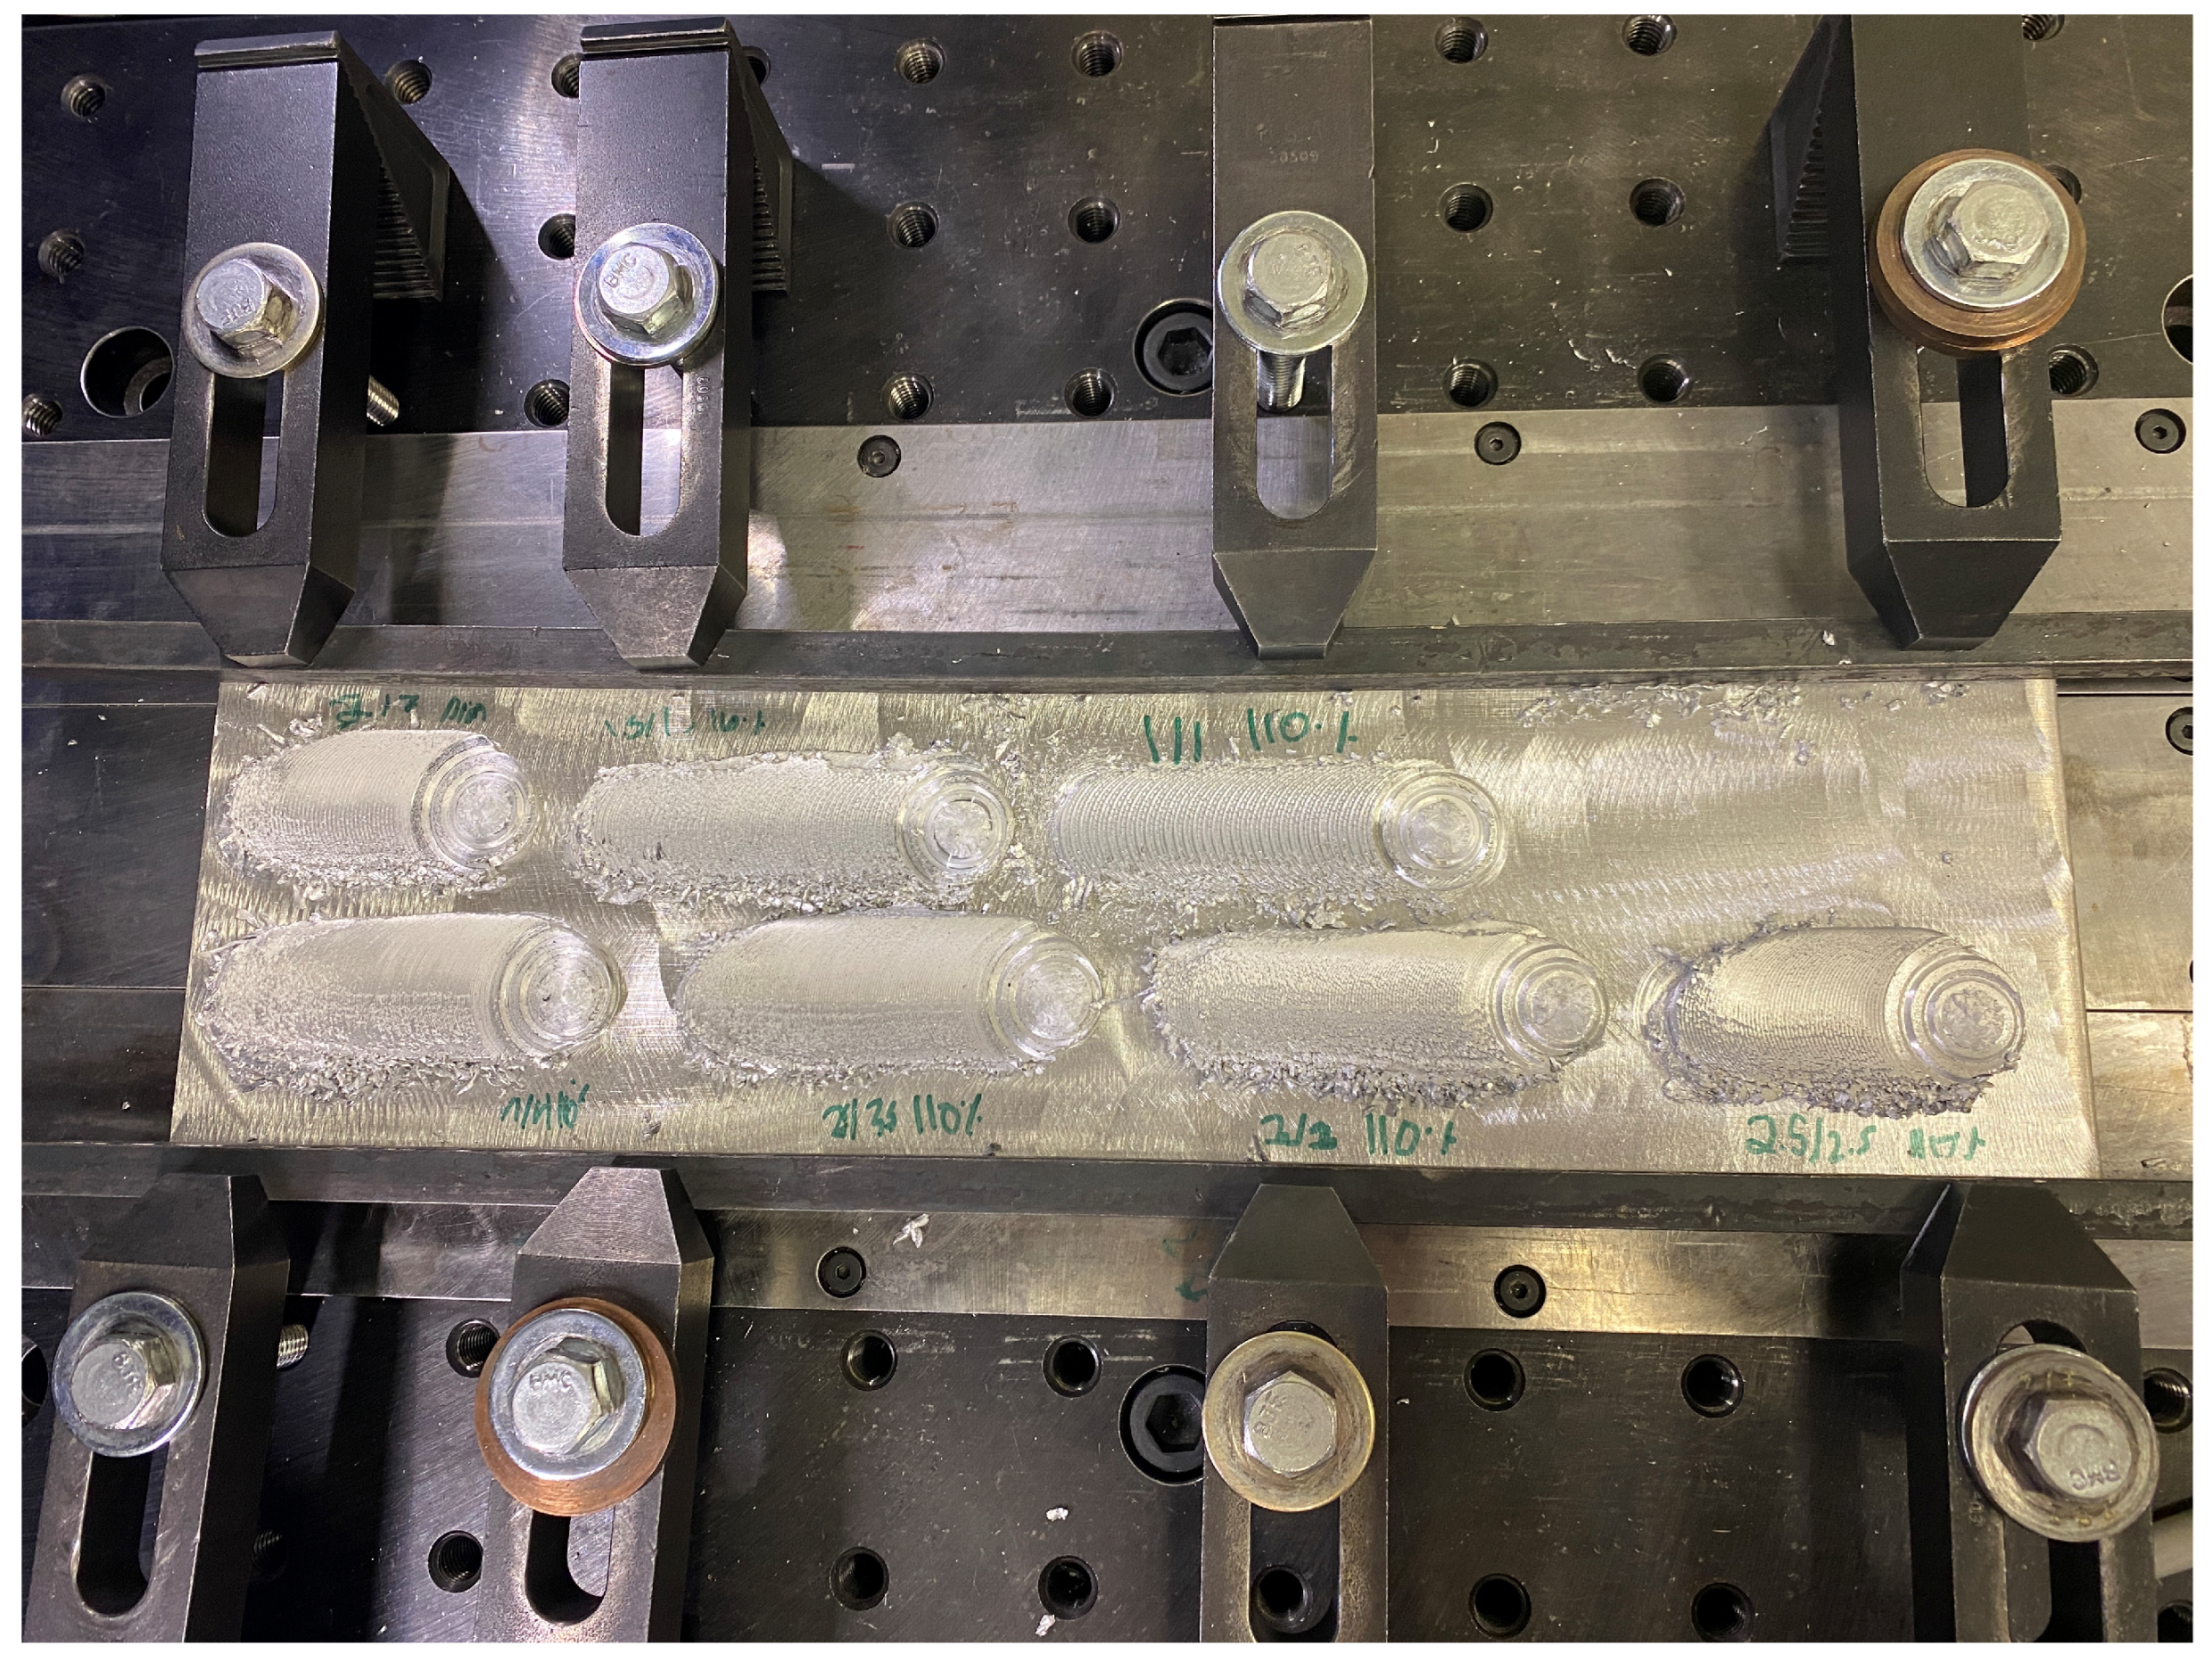
Figure 2.
A figure depicting the experimental setup used to run each deposition.
Figure 3.
A plot of the deposition widths of each tool type compared with the layer height; note that the tool diameter of 38 mm is presented as the dashed black line.
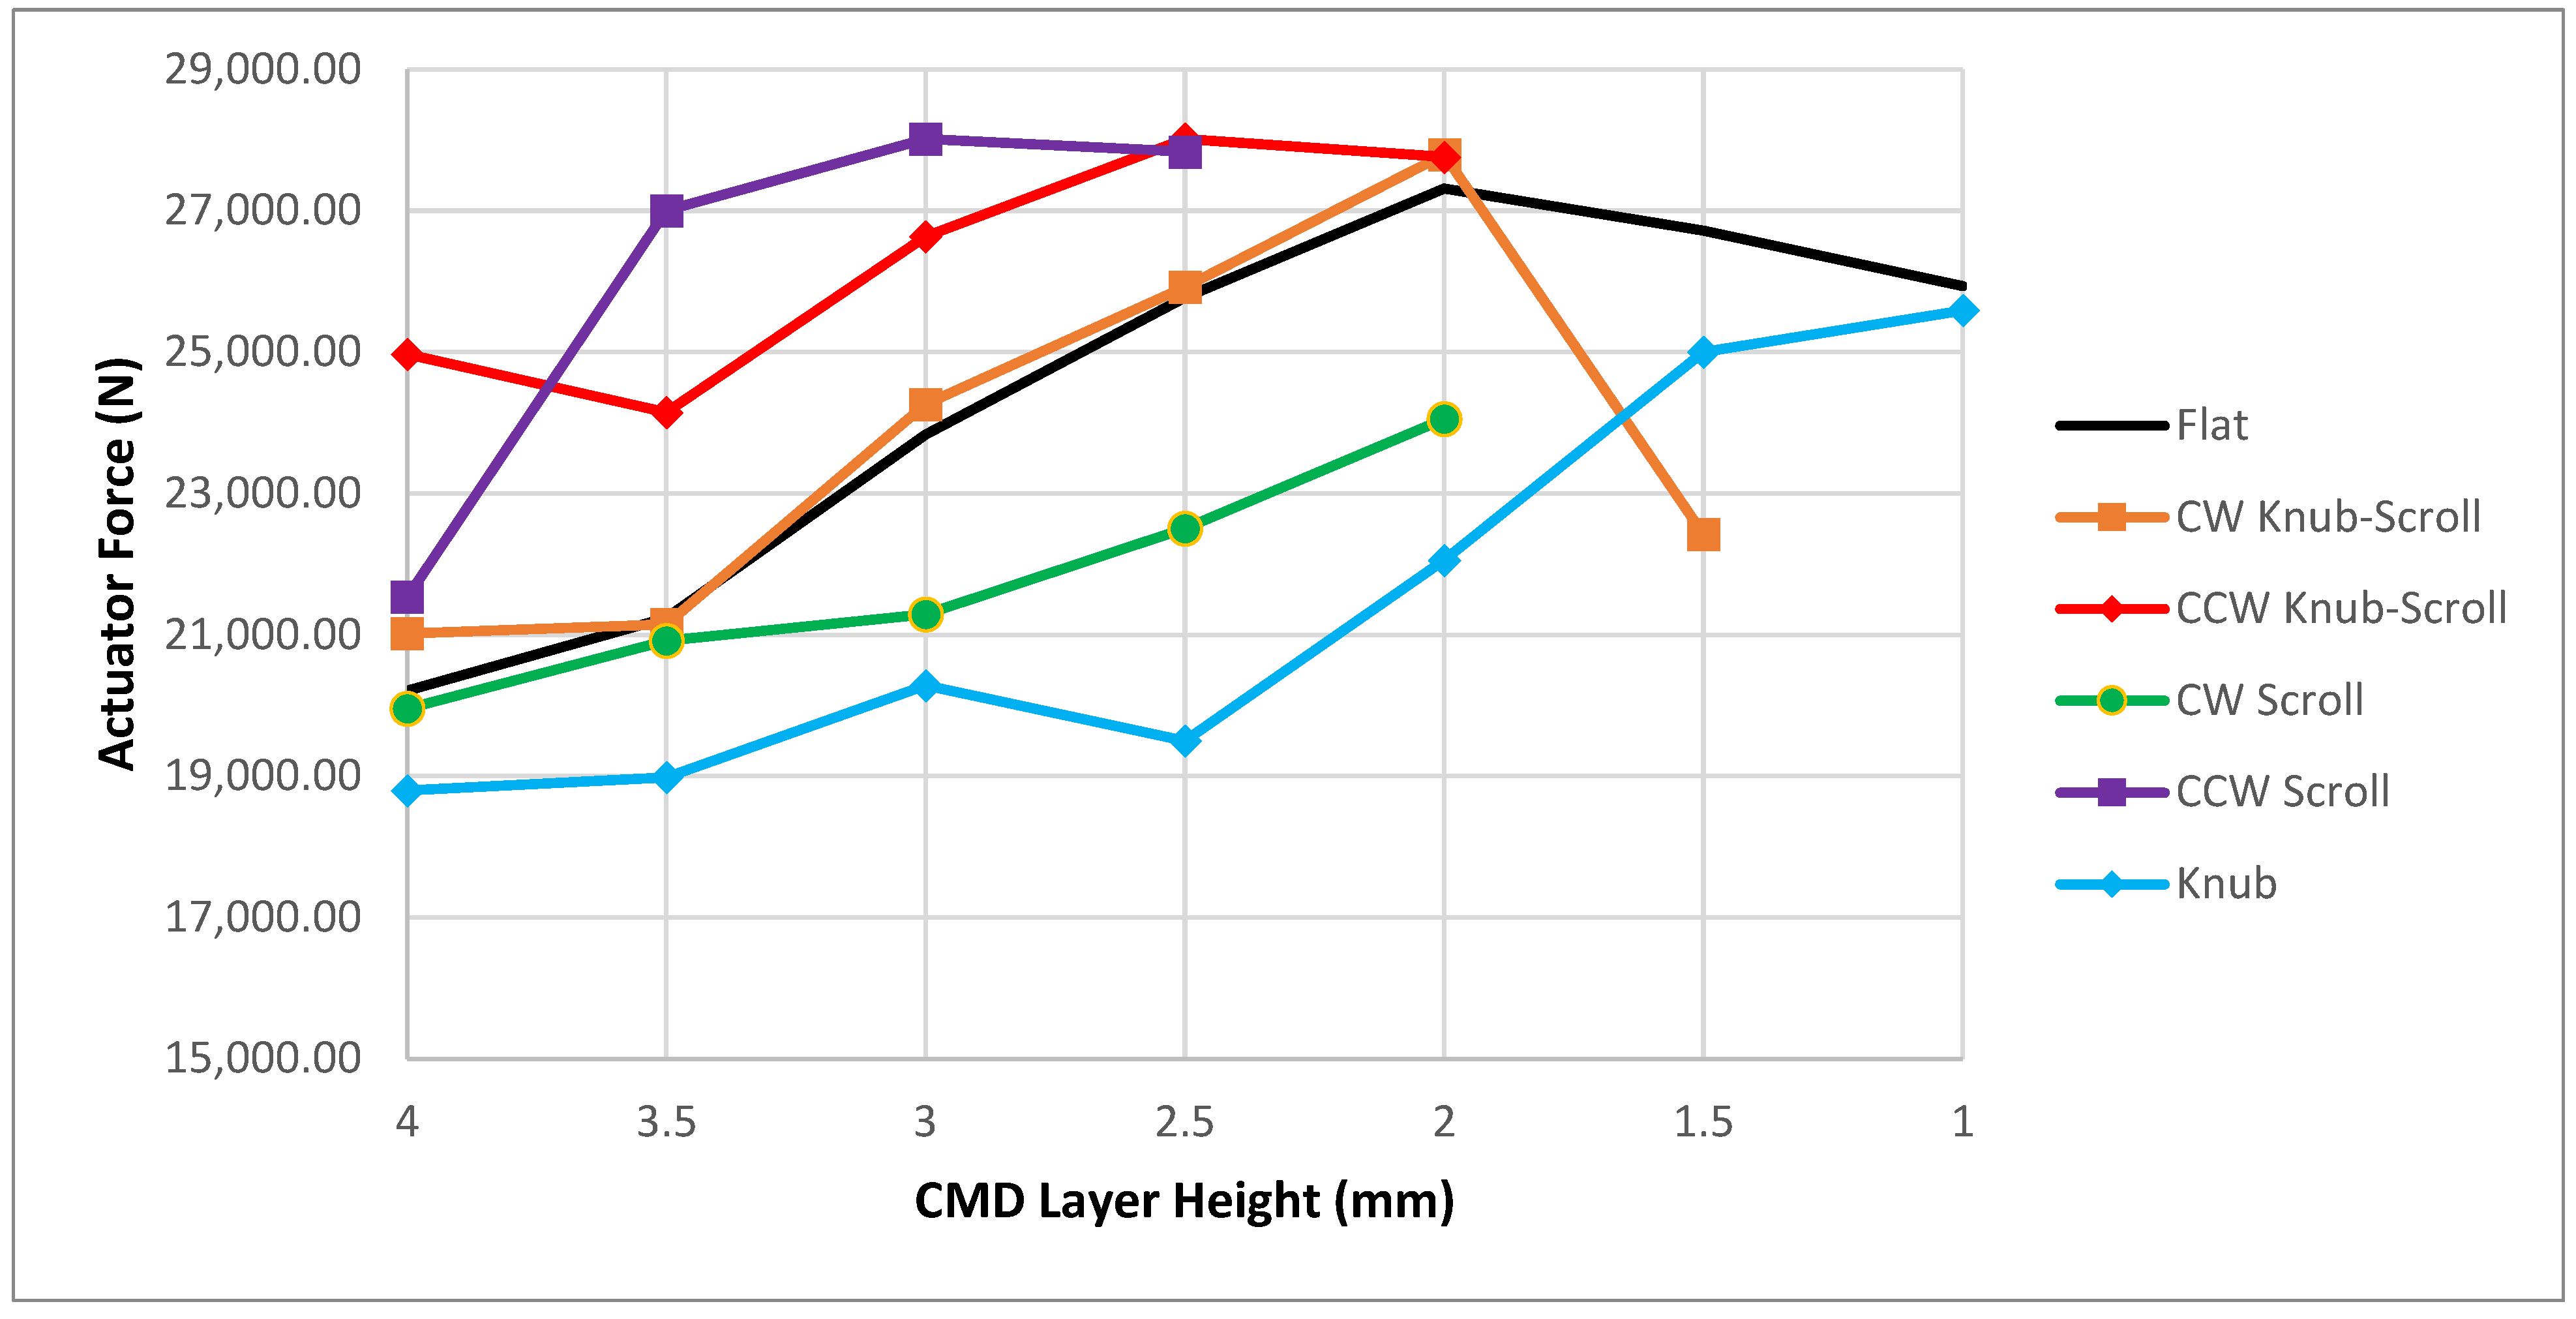
Figure 4.
A plot of the 2-layer average actuator force vs. CMD layer height for the 6 tool types.
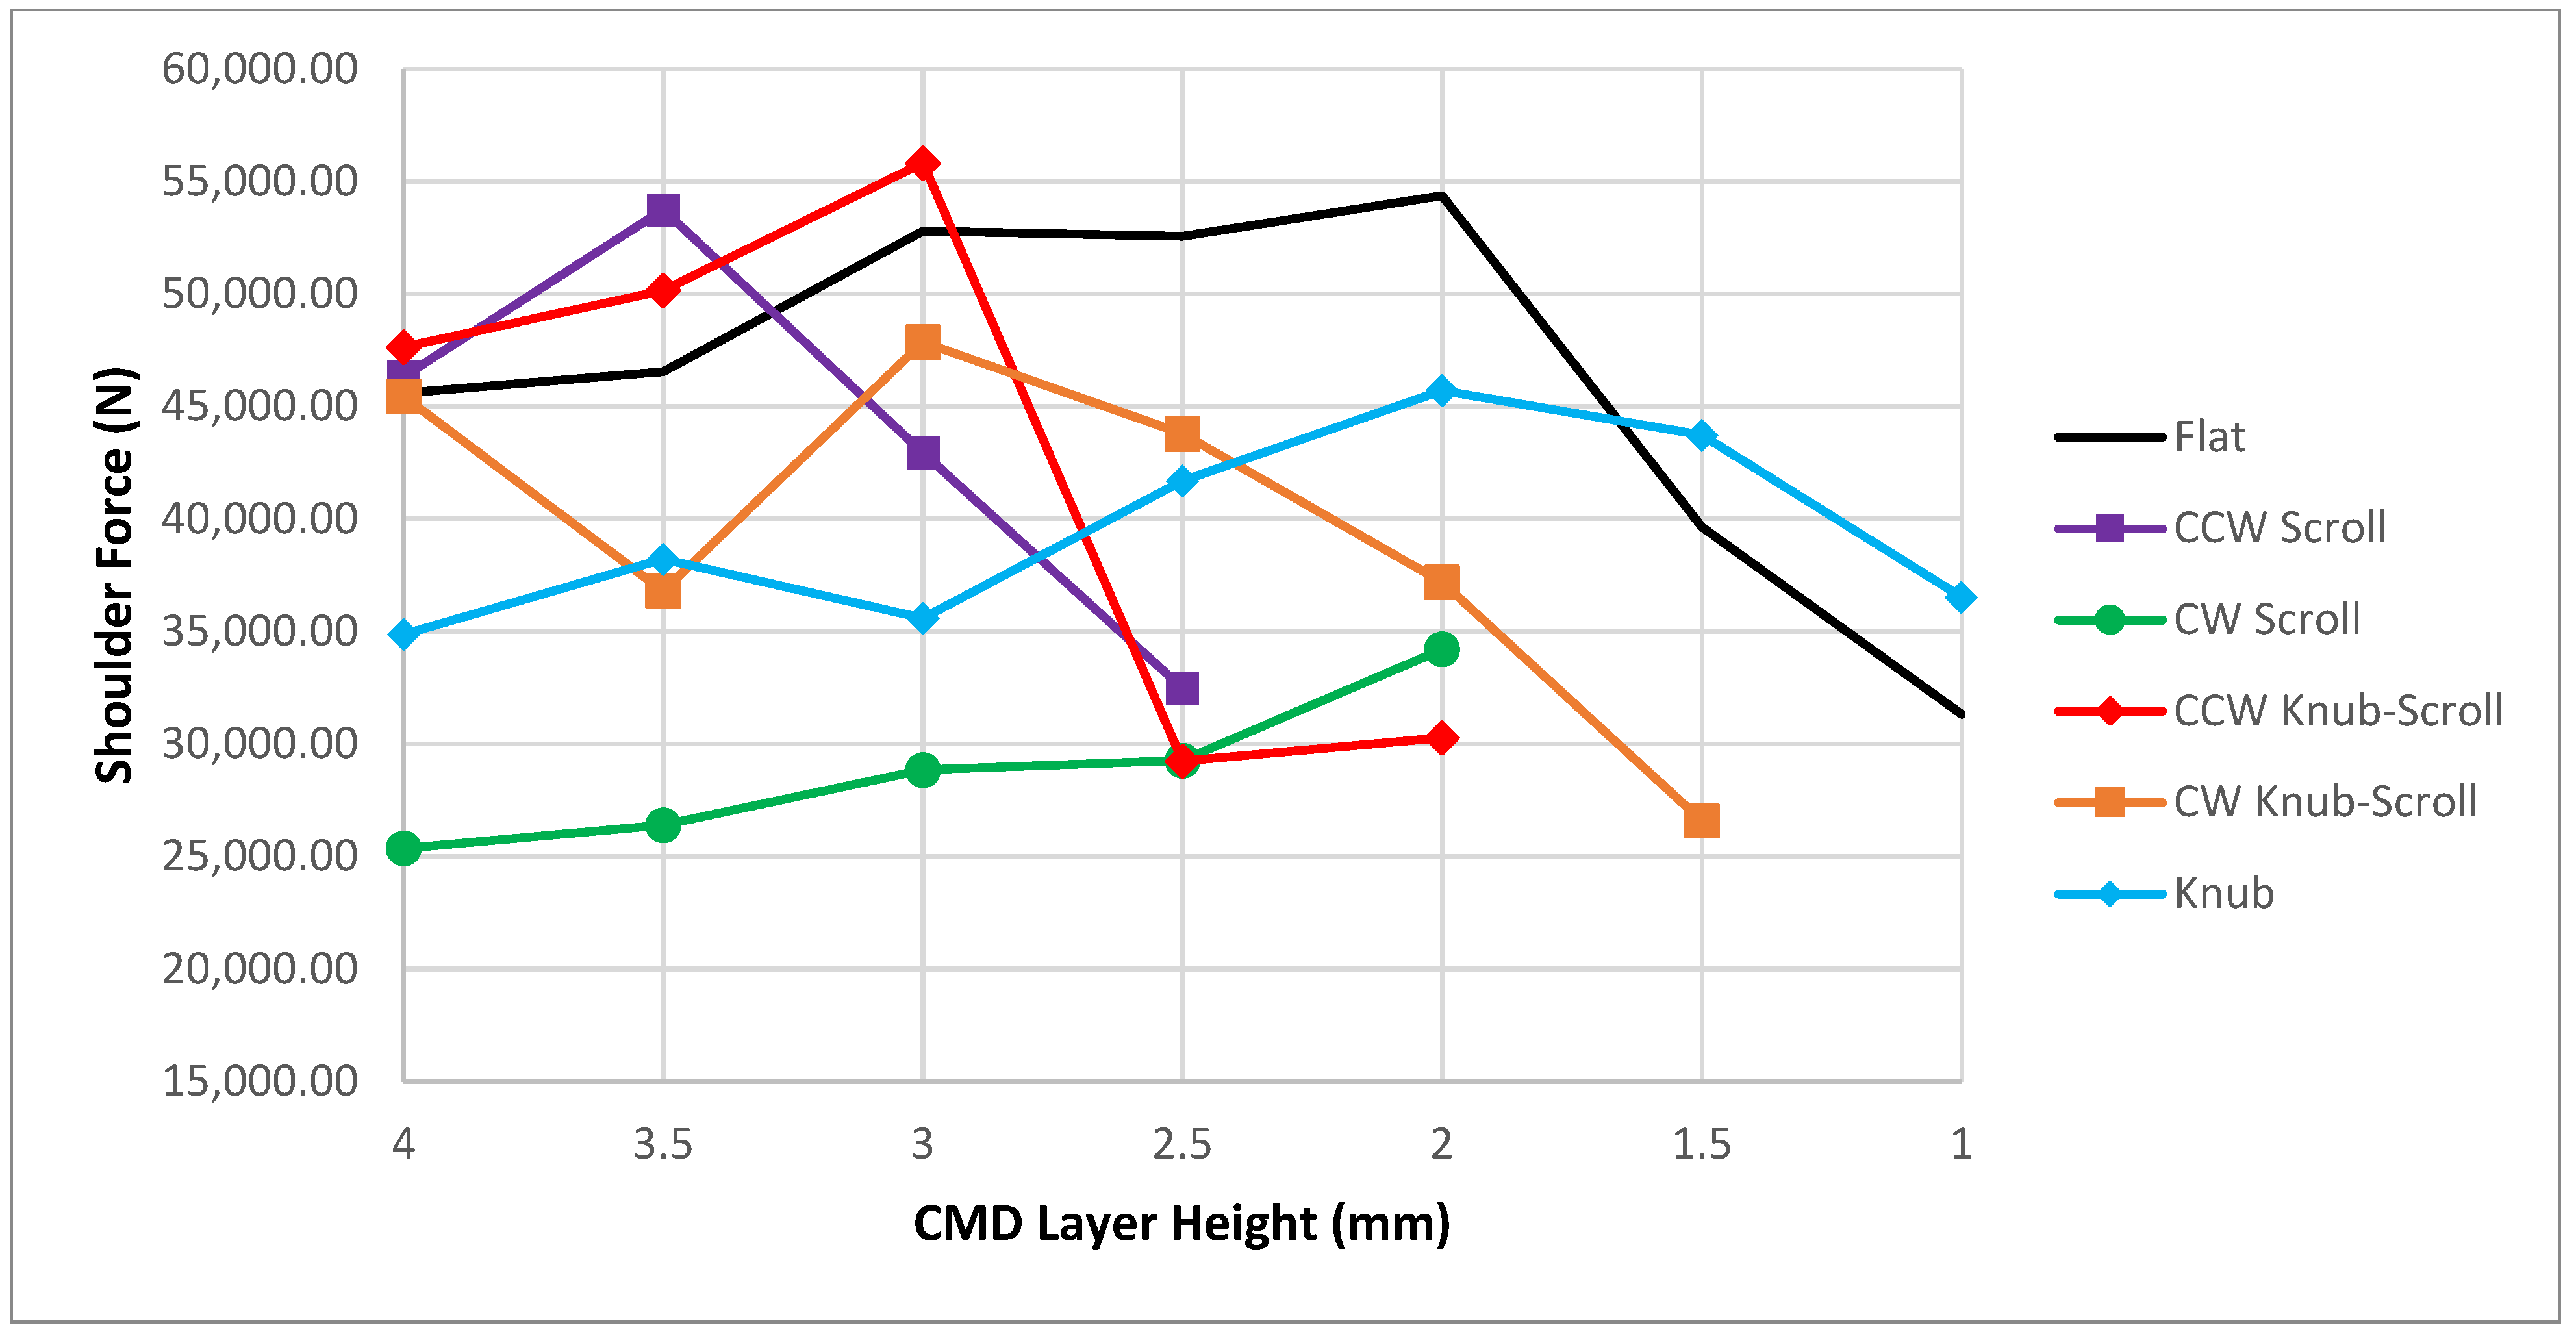
Figure 5.
A plot of the 2-layer average shoulder forces vs. CMD layer height for the 6 tool types.
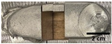
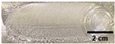
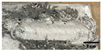
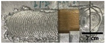
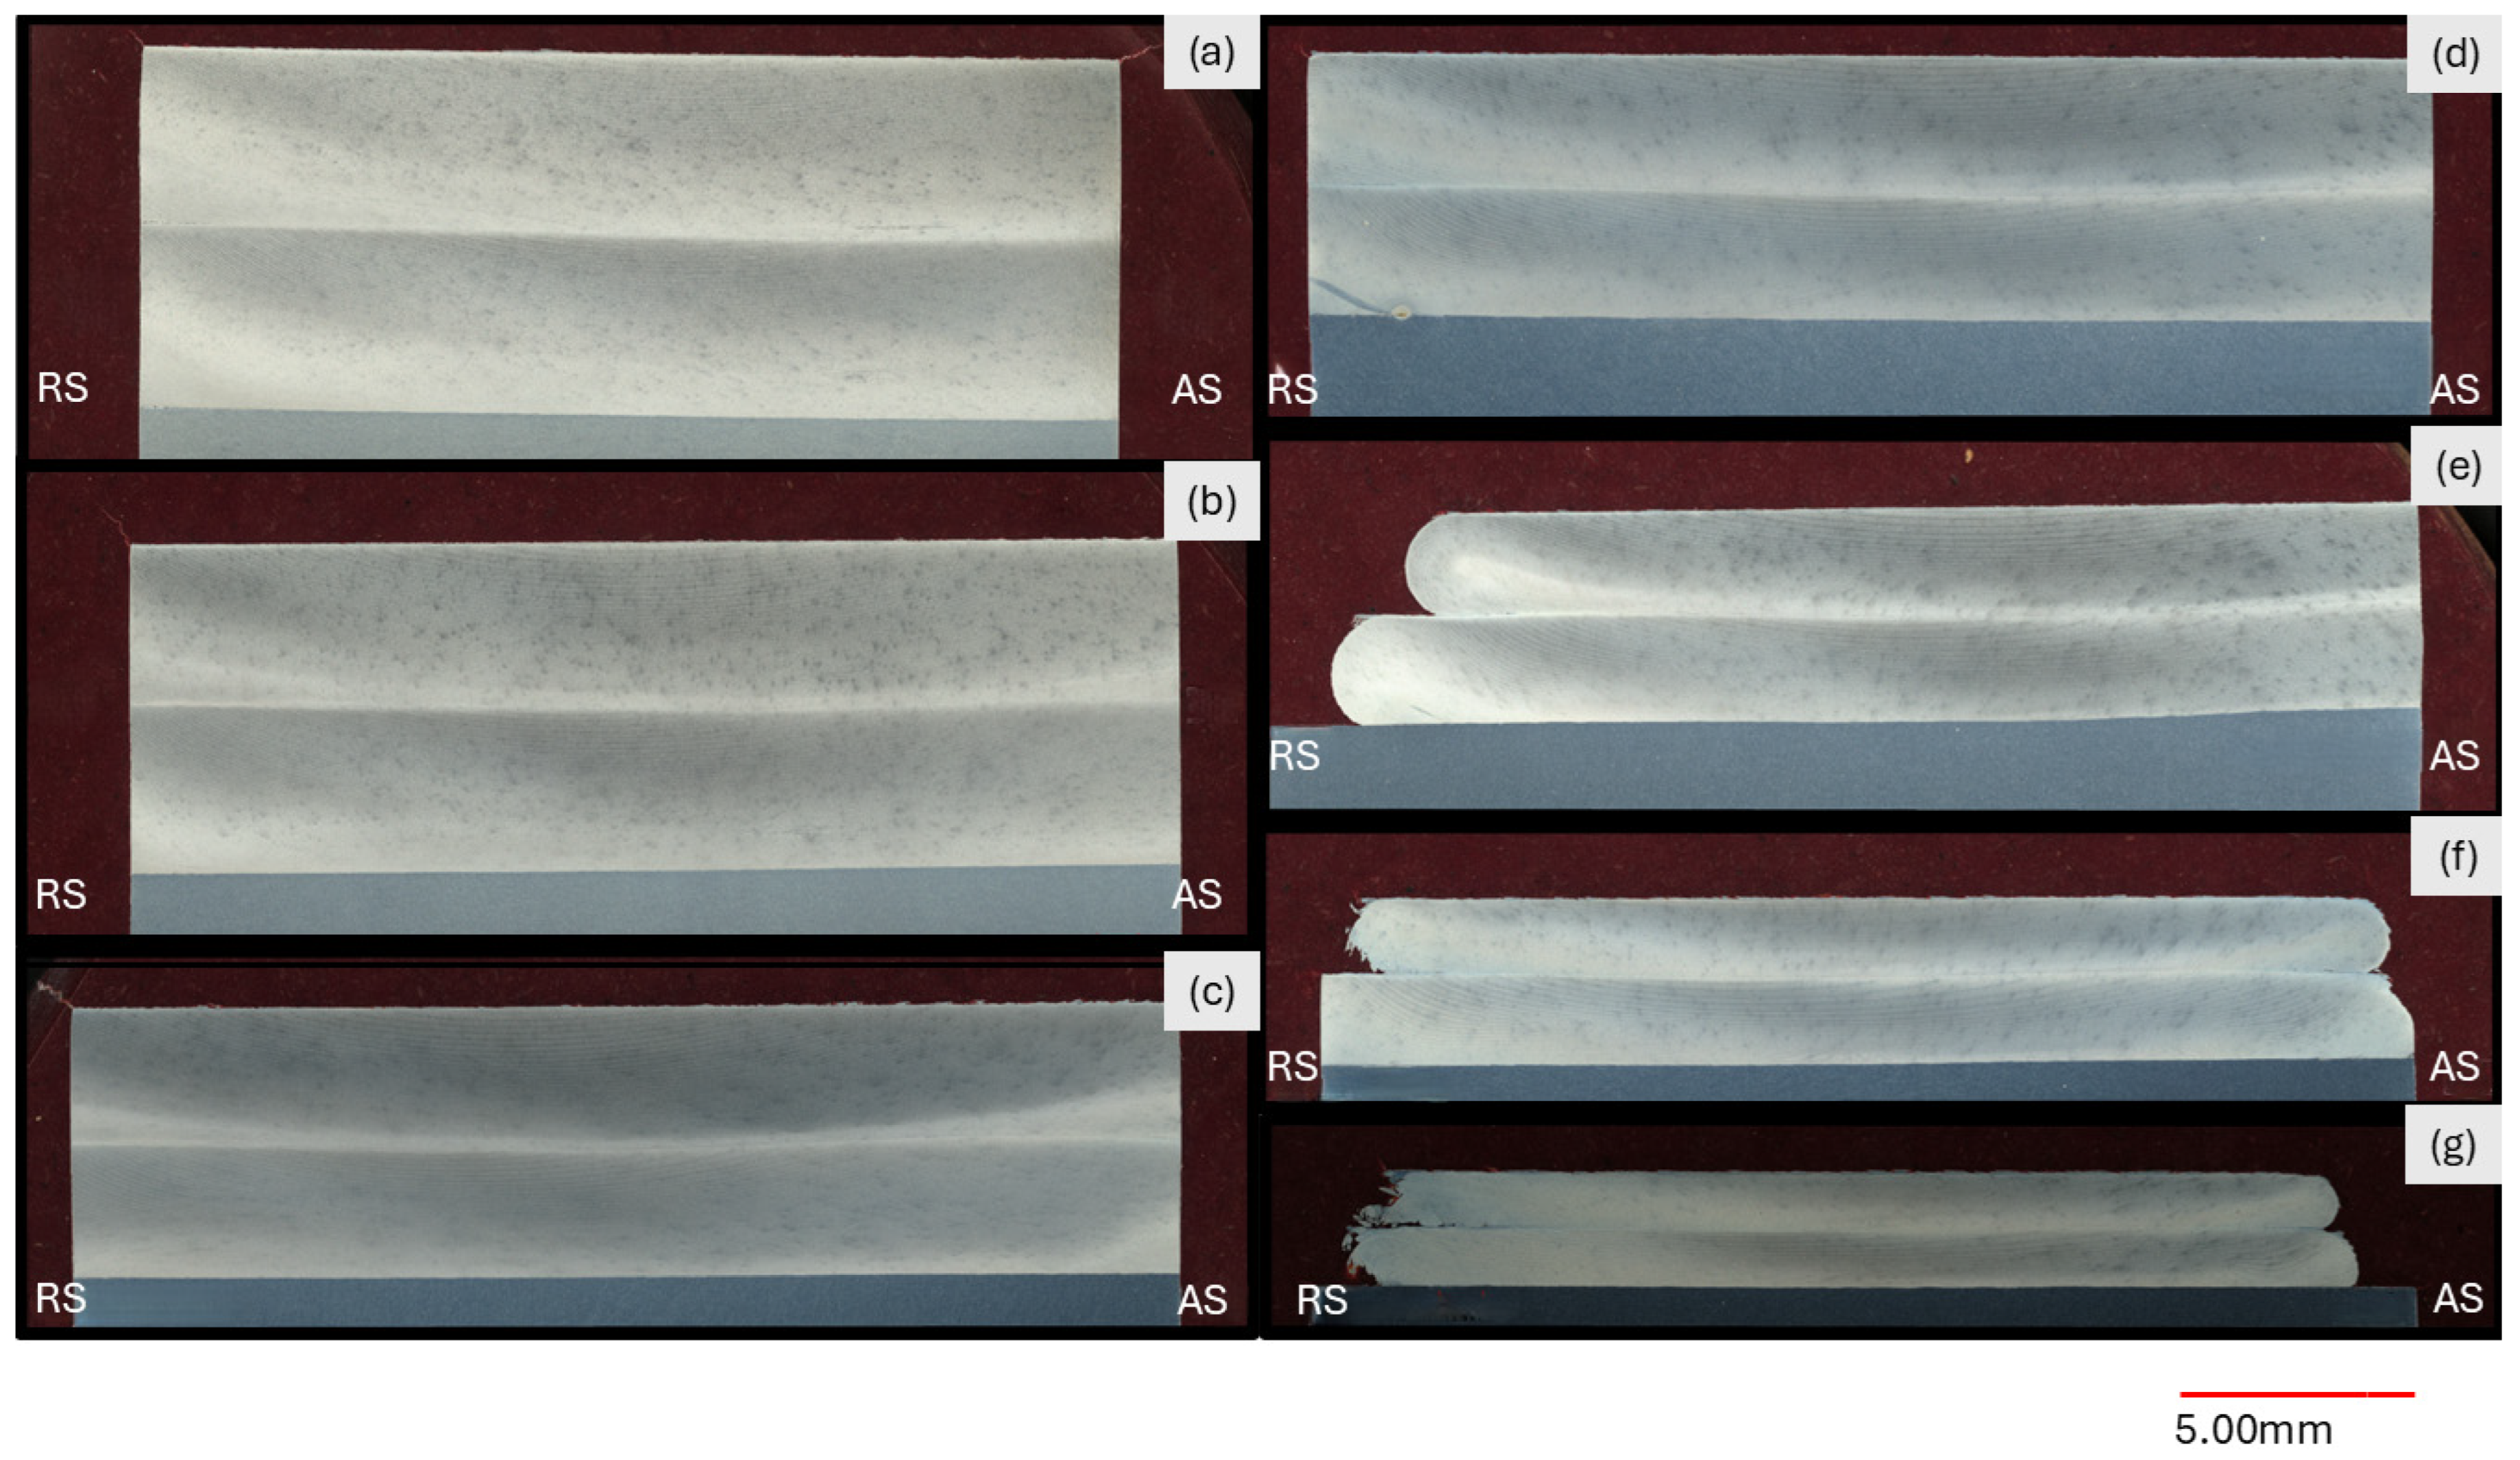
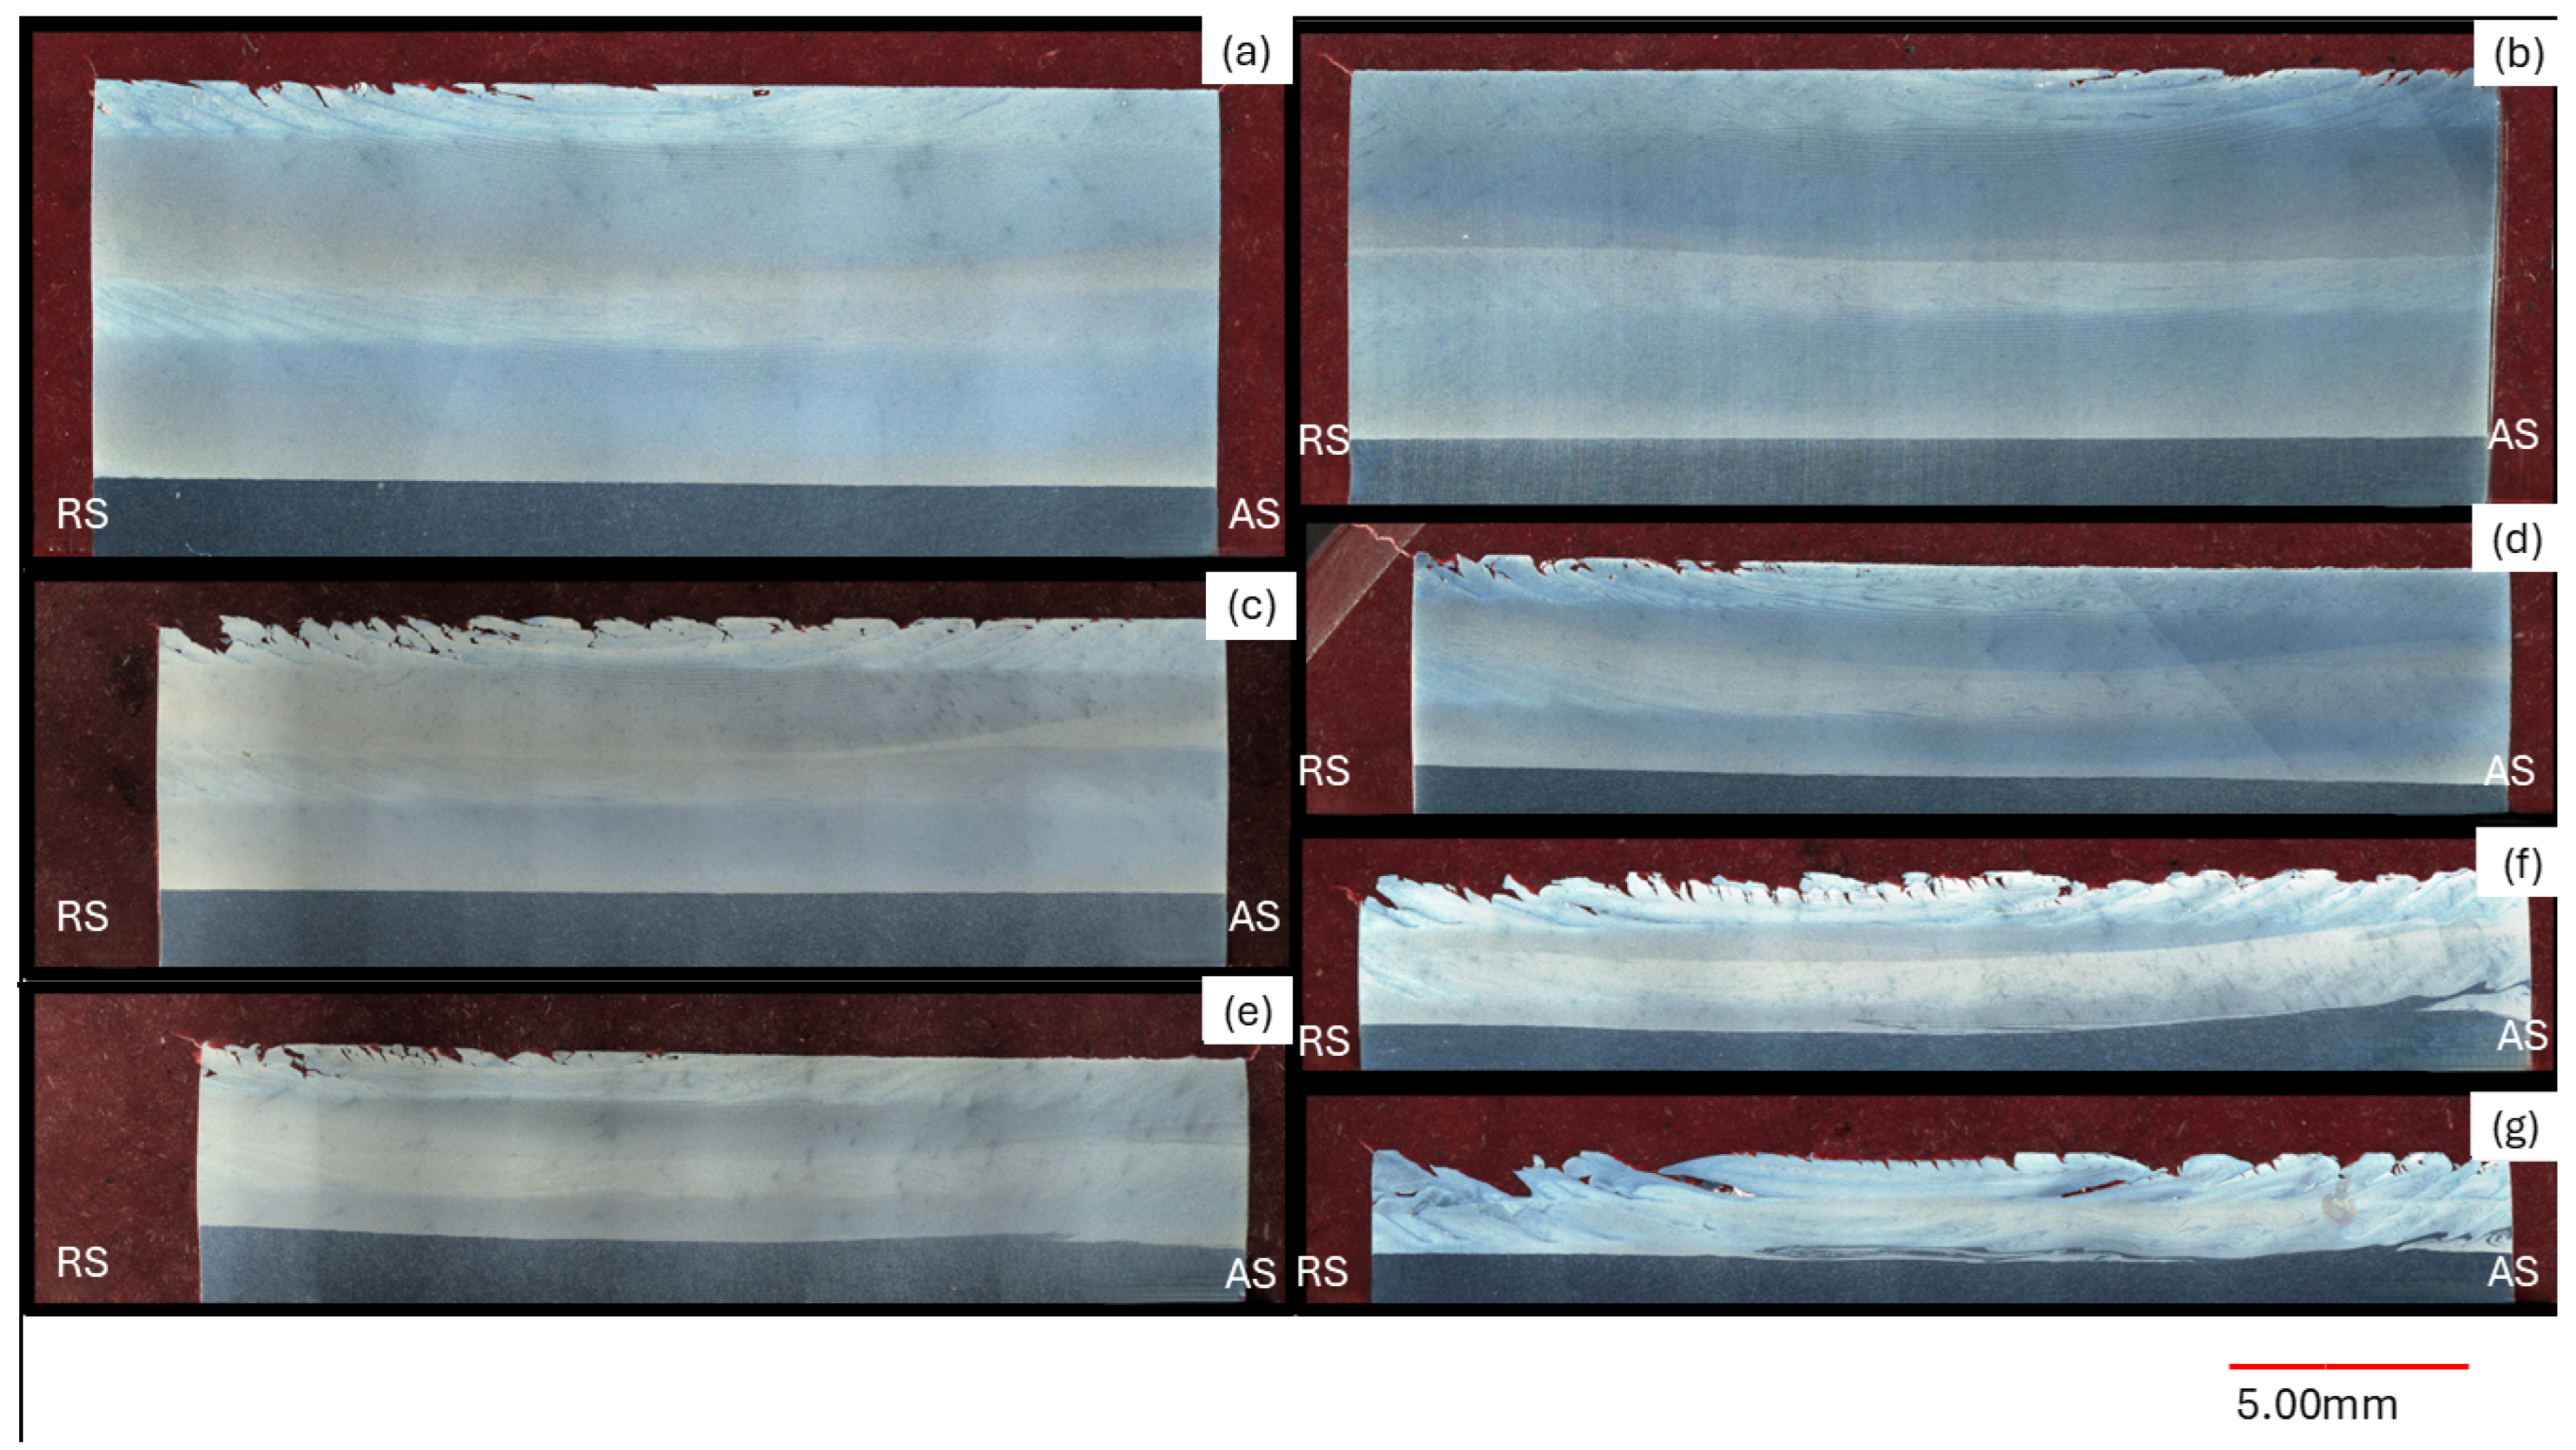
Figure 6.
All the macro cross-sections of depositions made with the flat tool: (a) 4 mm layer height, (b) 3.5 mm layer height, (c) 3 mm layer height, (d) 2.5 mm layer height, (e) 2 mm layer height, (f) 1.5 mm layer height, and (g) 1 mm layer height.
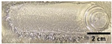
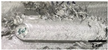
Figure 7.
All the macro cross-sections of depositions made with the knub tool: (a) 4 mm layer height, (b) 3.5 mm layer height, (c) 3 mm layer height, (d) 2.5 mm layer height, (e) 2 mm layer height, (f) 1.5 mm layer height, and (g) 1 mm layer height.
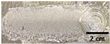
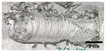
Figure 8.
All the macro cross-sections of depositions made with the CW knub–scroll tool: (a) 4 mm layer height, (b) 3.5 mm layer height, (c) 3 mm layer height, (d) 2.5 mm layer height, (e) 2 mm layer height, and (f) 1.5 mm layer height.
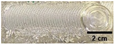
Figure 9.
All the macro cross-sections of depositions made with the CCW knub–scroll tool: (a) 4 mm layer height, (b) 3.5 mm layer height, (c) 3 mm layer height, and (d) 2.5 mm layer height.
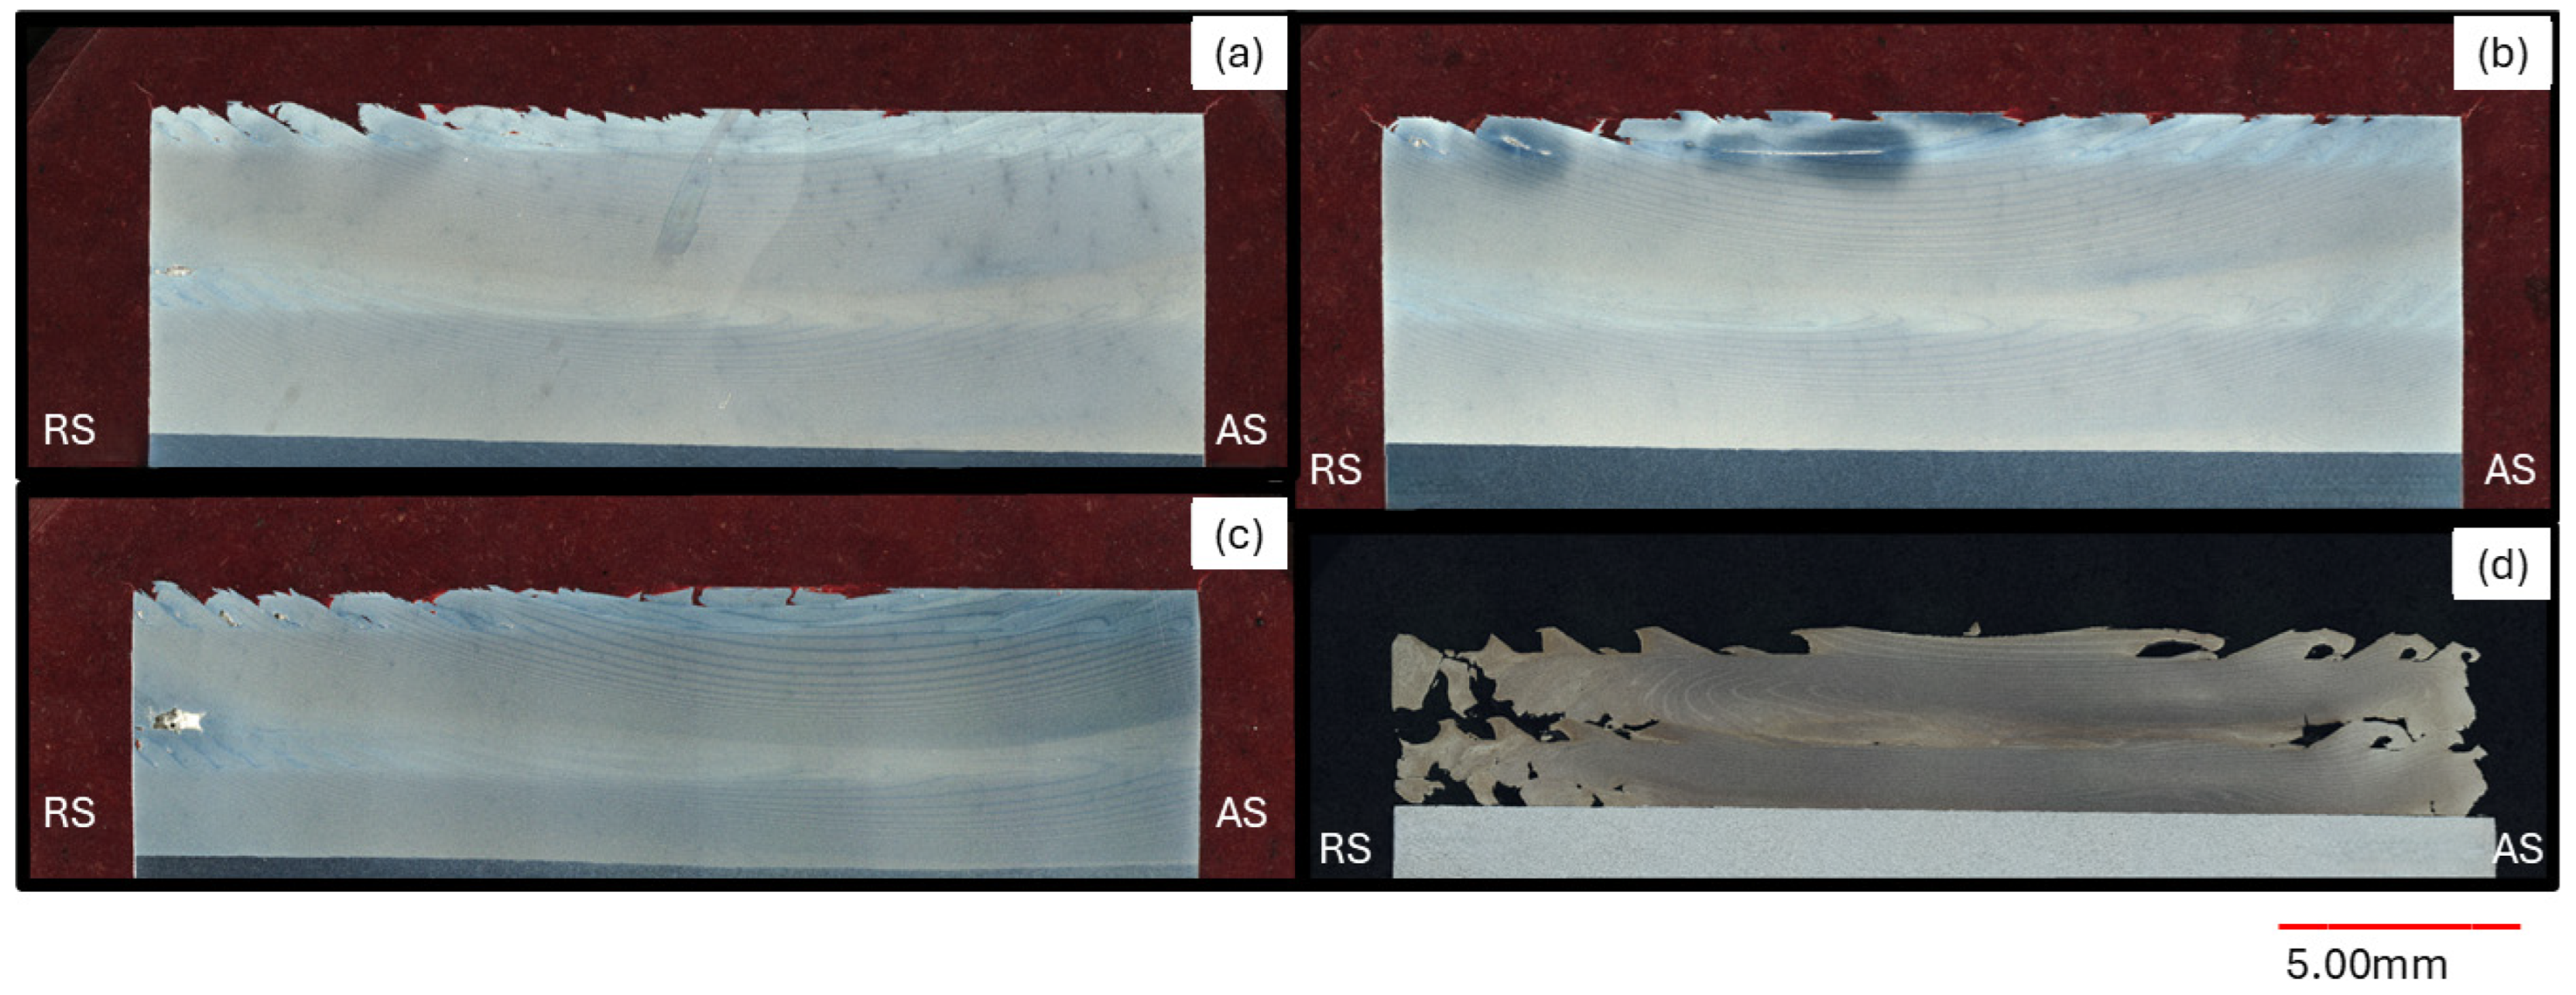
Figure 10.
All the macro cross-sections of depositions made with the CW scroll tool: (a) 4 mm layer height, (b) 3.5 mm layer height, (c) 3 mm layer height, (d) 2.5 mm layer height, and (e) 2.0 mm layer height.
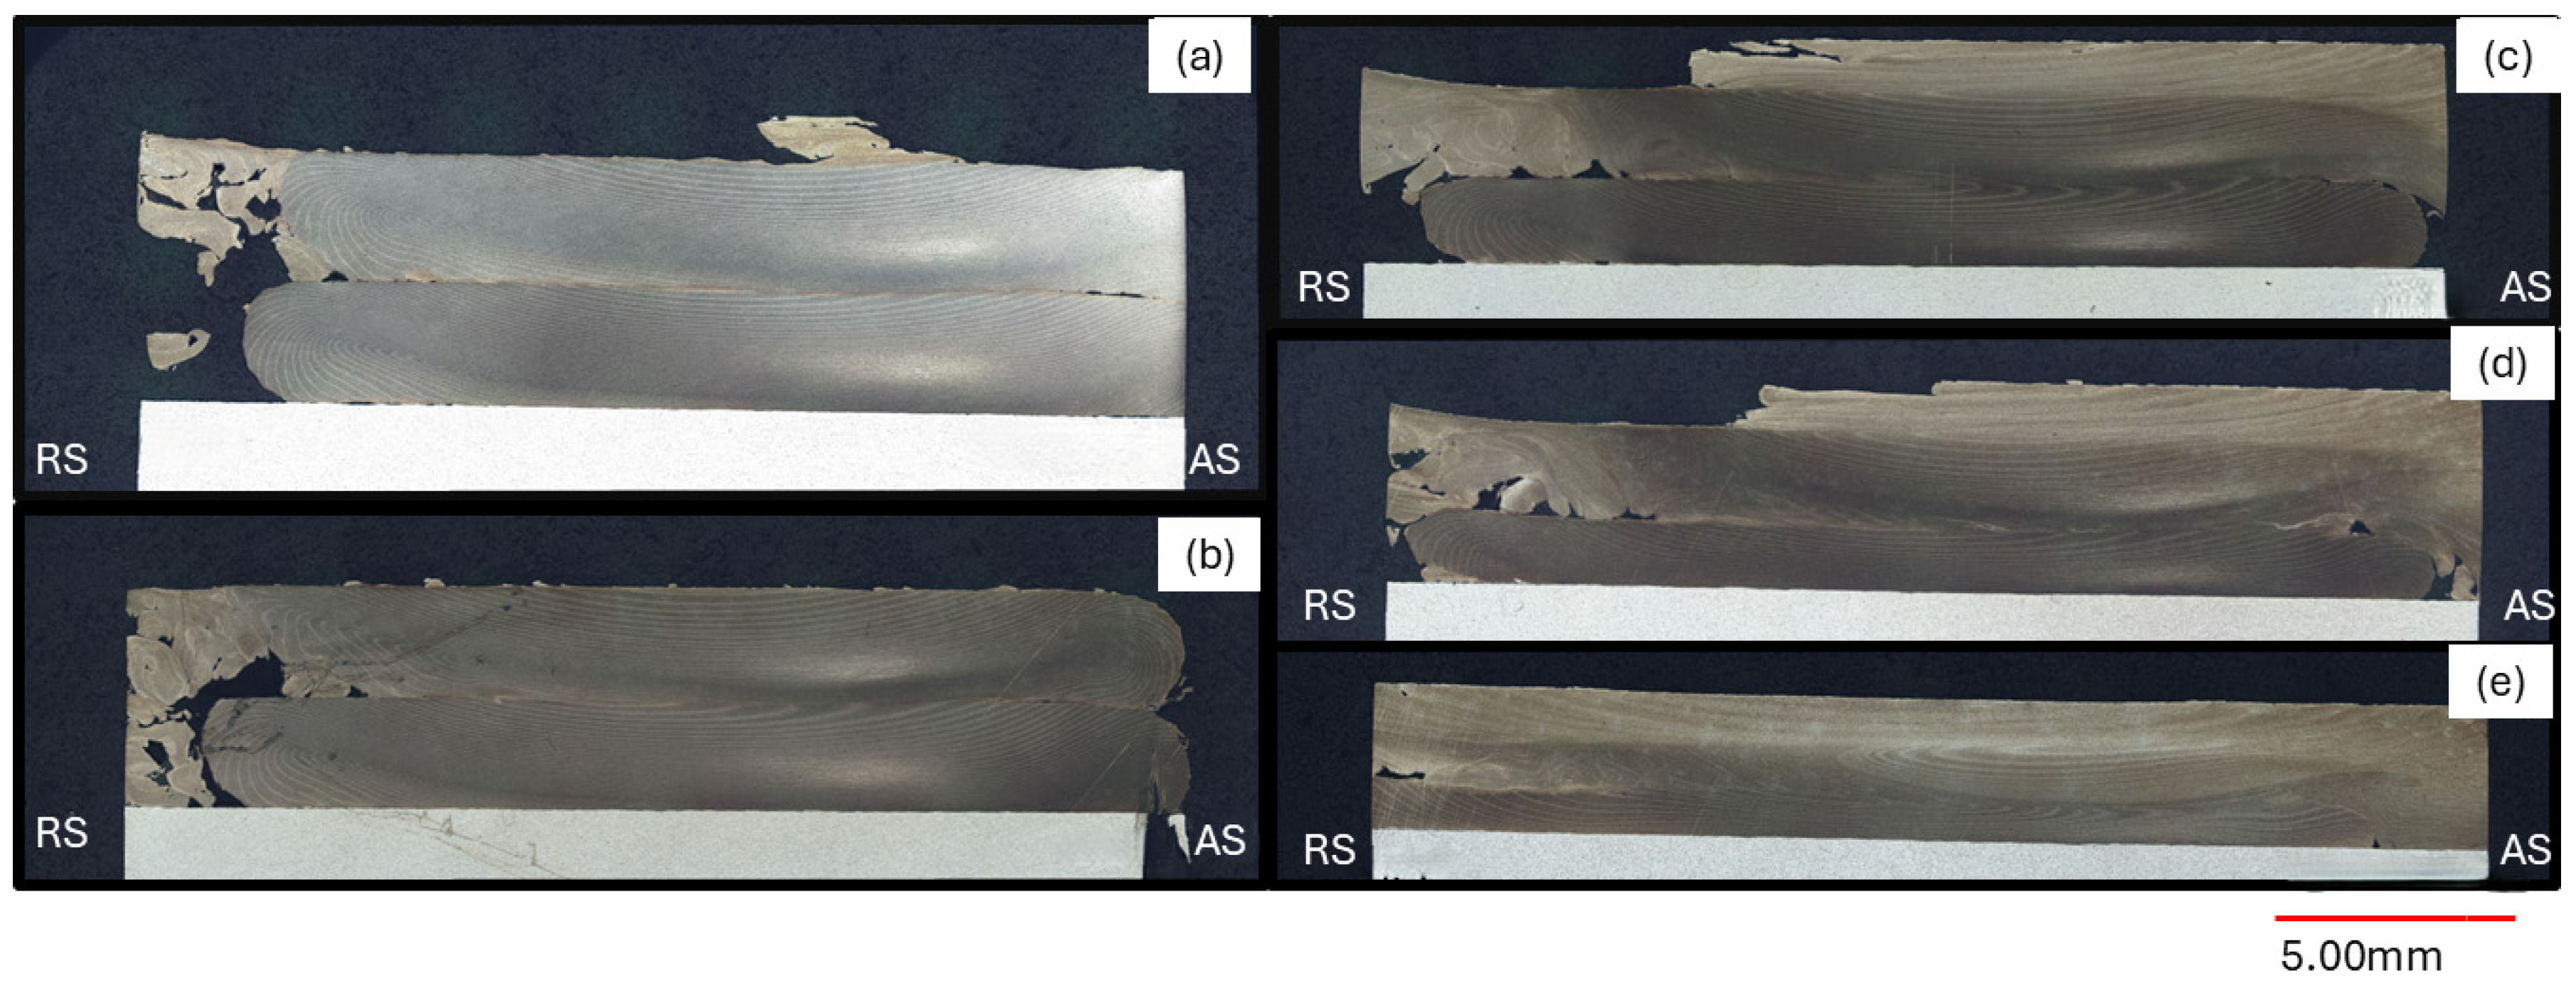
Figure 11.
All the macro cross-sections of depositions made with the CCW scroll tool: (a) 4 mm layer height, (b) 3.5 mm layer height, (c) 3 mm layer height, and (d) 2.5 mm layer height.
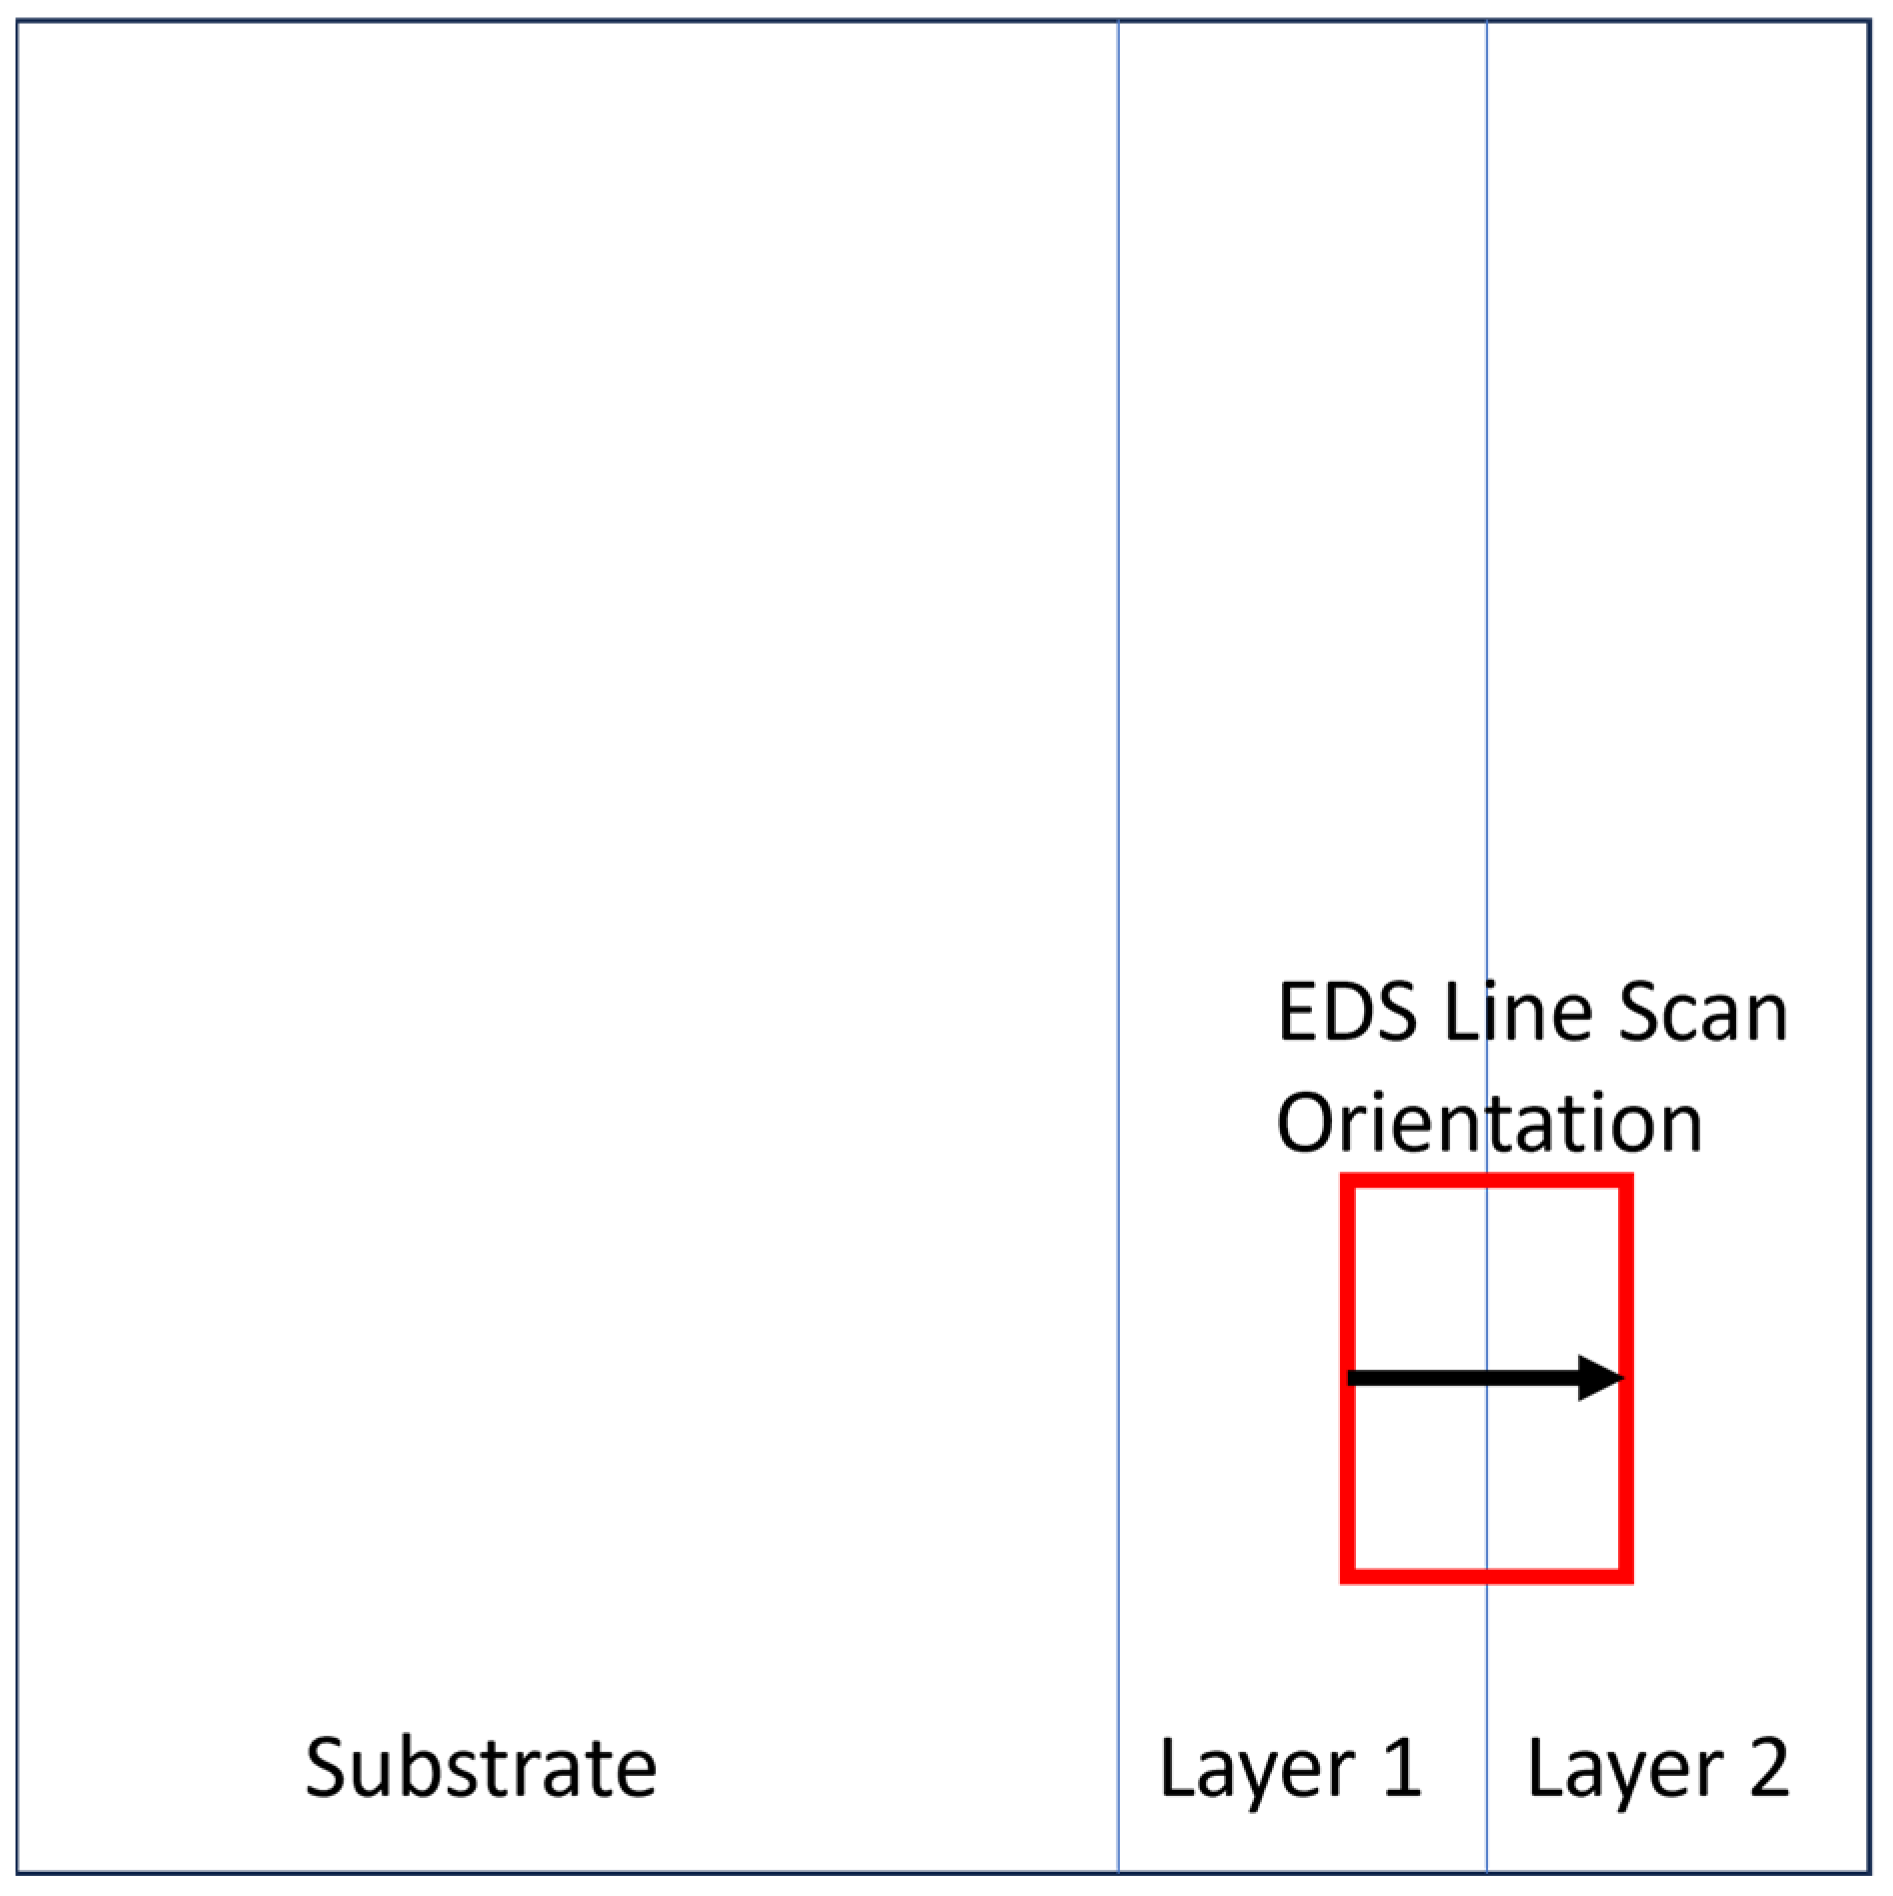
Figure 12.
A graphic depiction of the general orientation of samples and direction of scan during EDS scans.
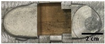
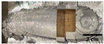
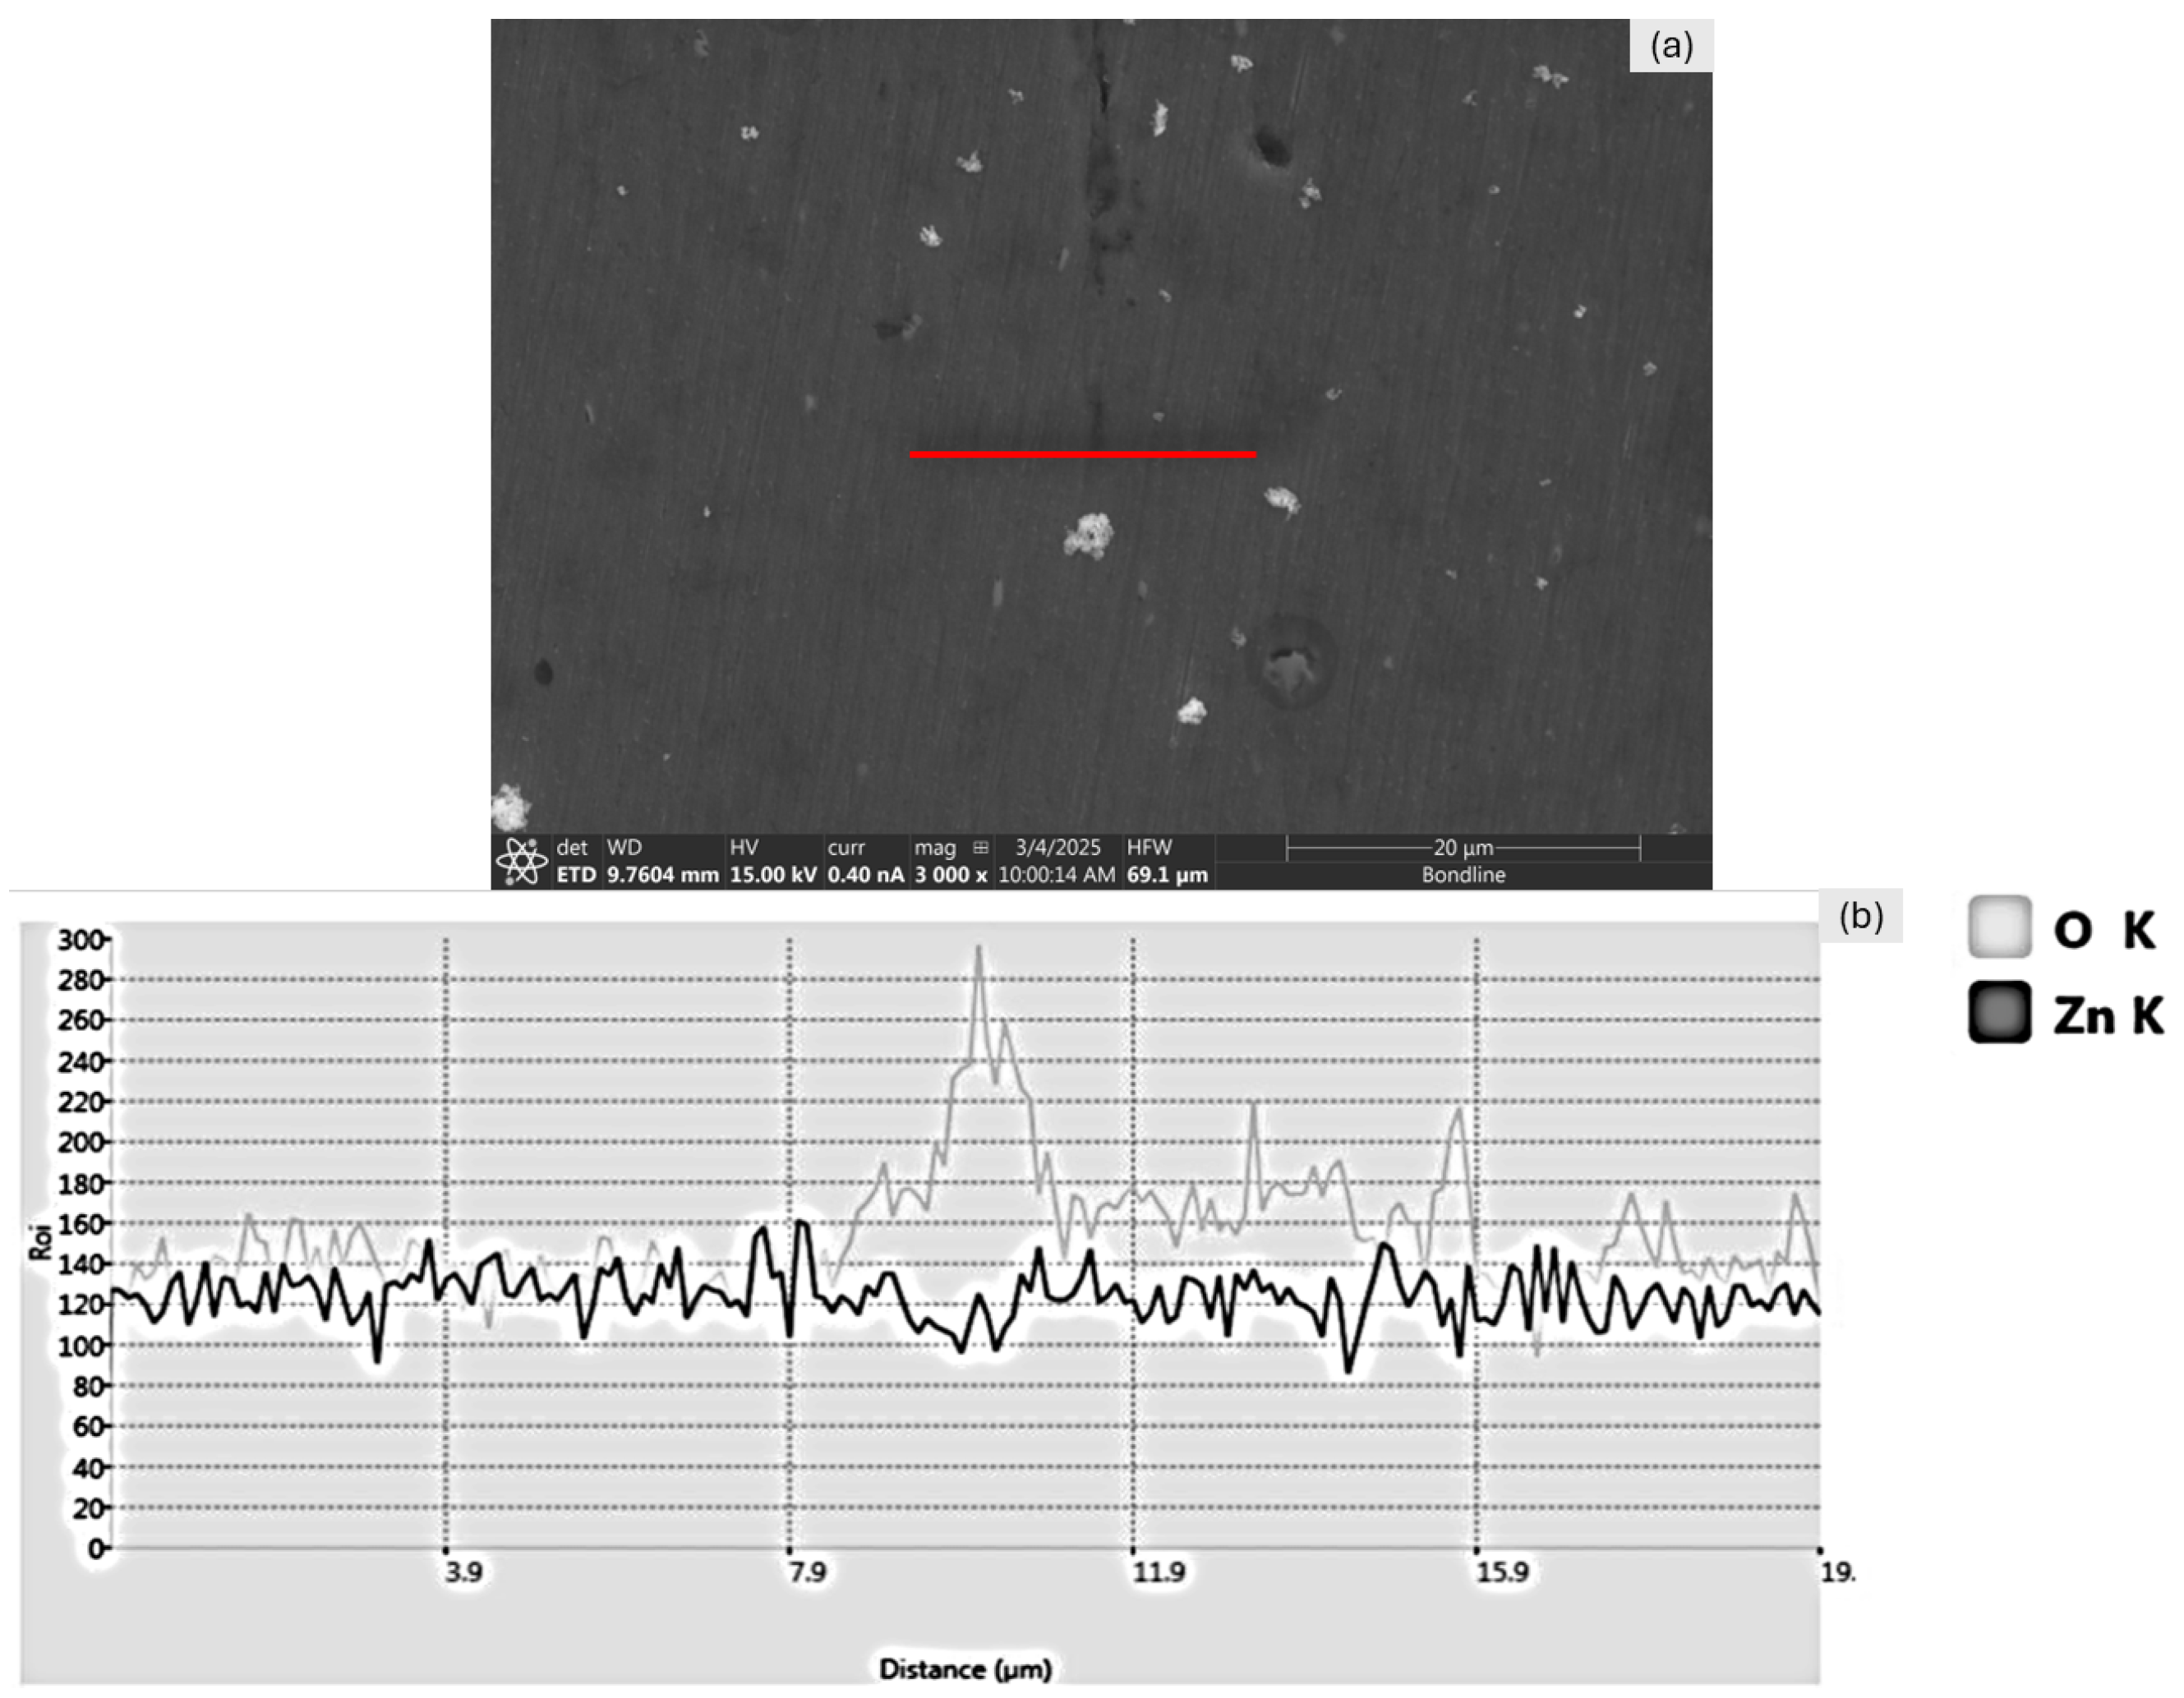
Figure 13.
A figure presenting the EDS scan measuring the oxygen presence along the layer interface of the 2.5 mm flat cross-section. (a) The SEM images of the scanned area with the EDS scan line indicated in red and (b) the same image with the EDS scan overlayed on top.
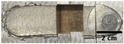
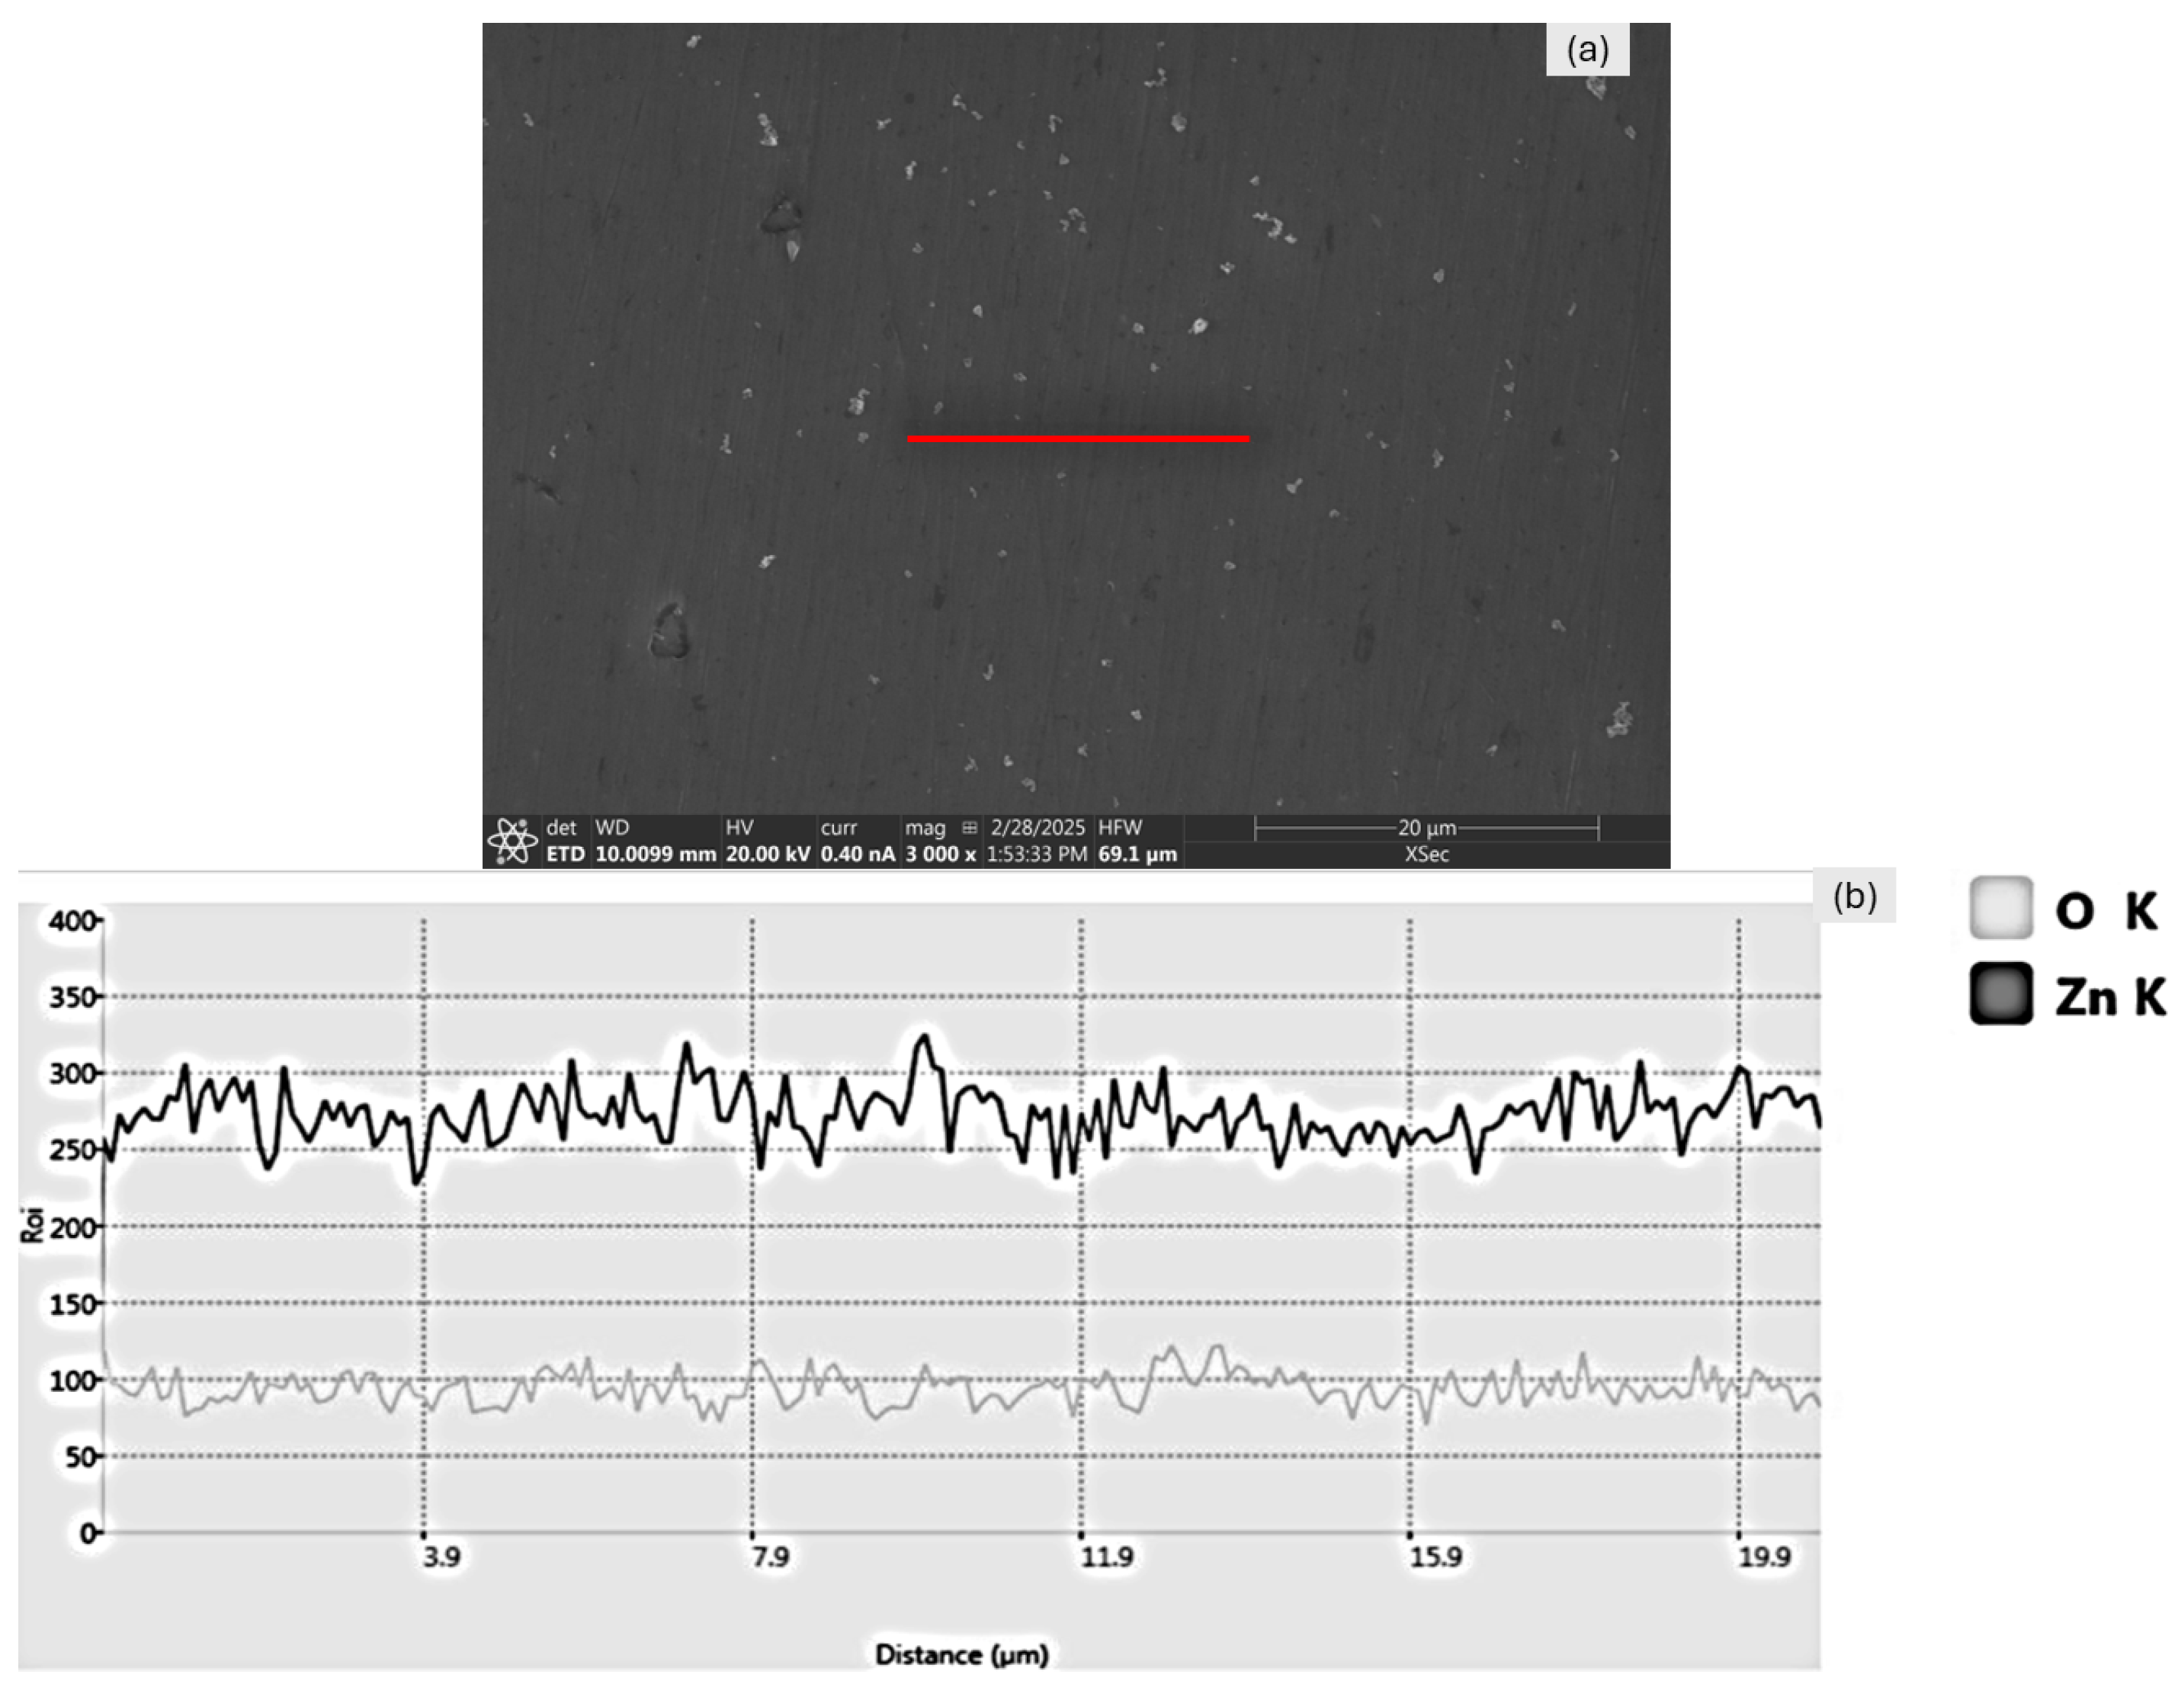
Figure 14.
A figure presenting the EDS scan measuring the oxygen presence along the layer interface of the 2.5 mm knub cross-section. (a) The SEM images of the scanned area with the EDS scan line indicated in red and (b) the same image with the EDS scan overlayed on top.
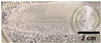
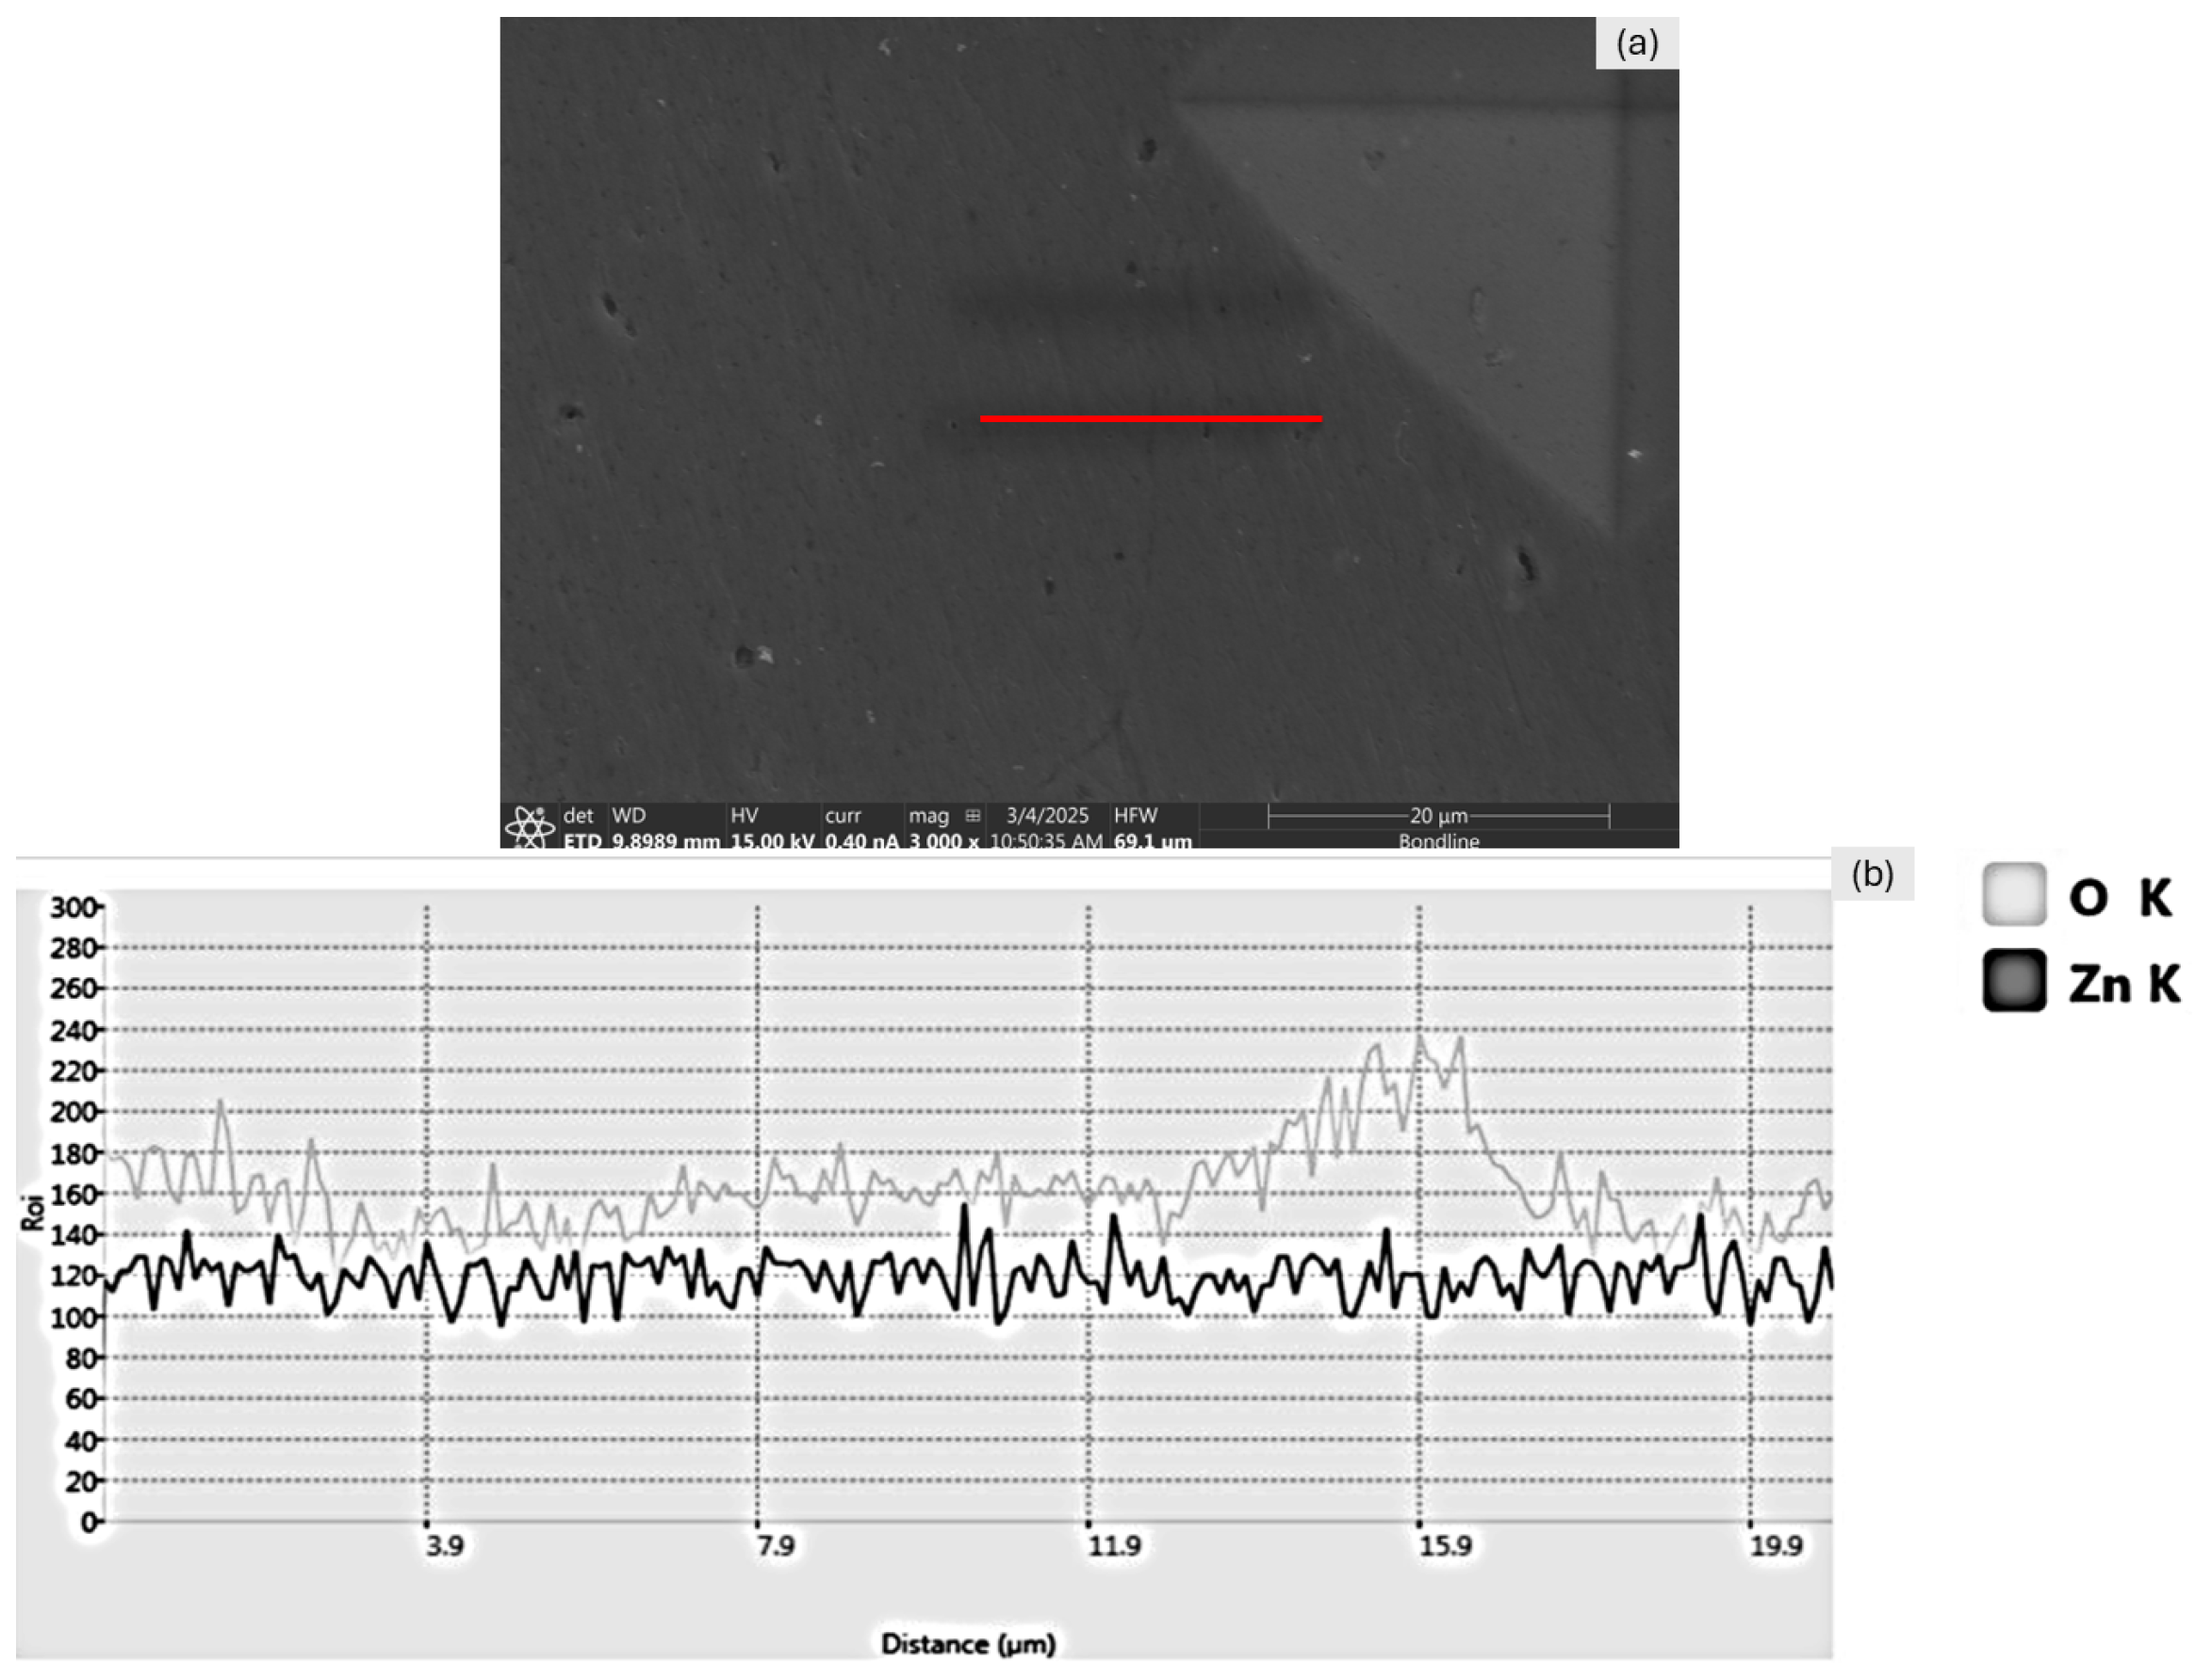
Figure 15.
A figure presenting the EDS scan measuring the oxygen presence along the layer interface of the 2.5 mm CW knub–scroll cross-section; note the fiduciary mark on the right side of the image. (a) The SEM images of the scanned area with the EDS scan line indicated in red and (b) the same image with the EDS scan overlayed on top.
Figure 16.
A figure presenting the EDS scan measuring the oxygen presence along the layer interface of the 2.5 mm CCW knub–scroll cross-section. (a) The SEM images of the scanned area with the EDS scan line indicated in red and (b) the same image with the EDS scan overlayed on top.
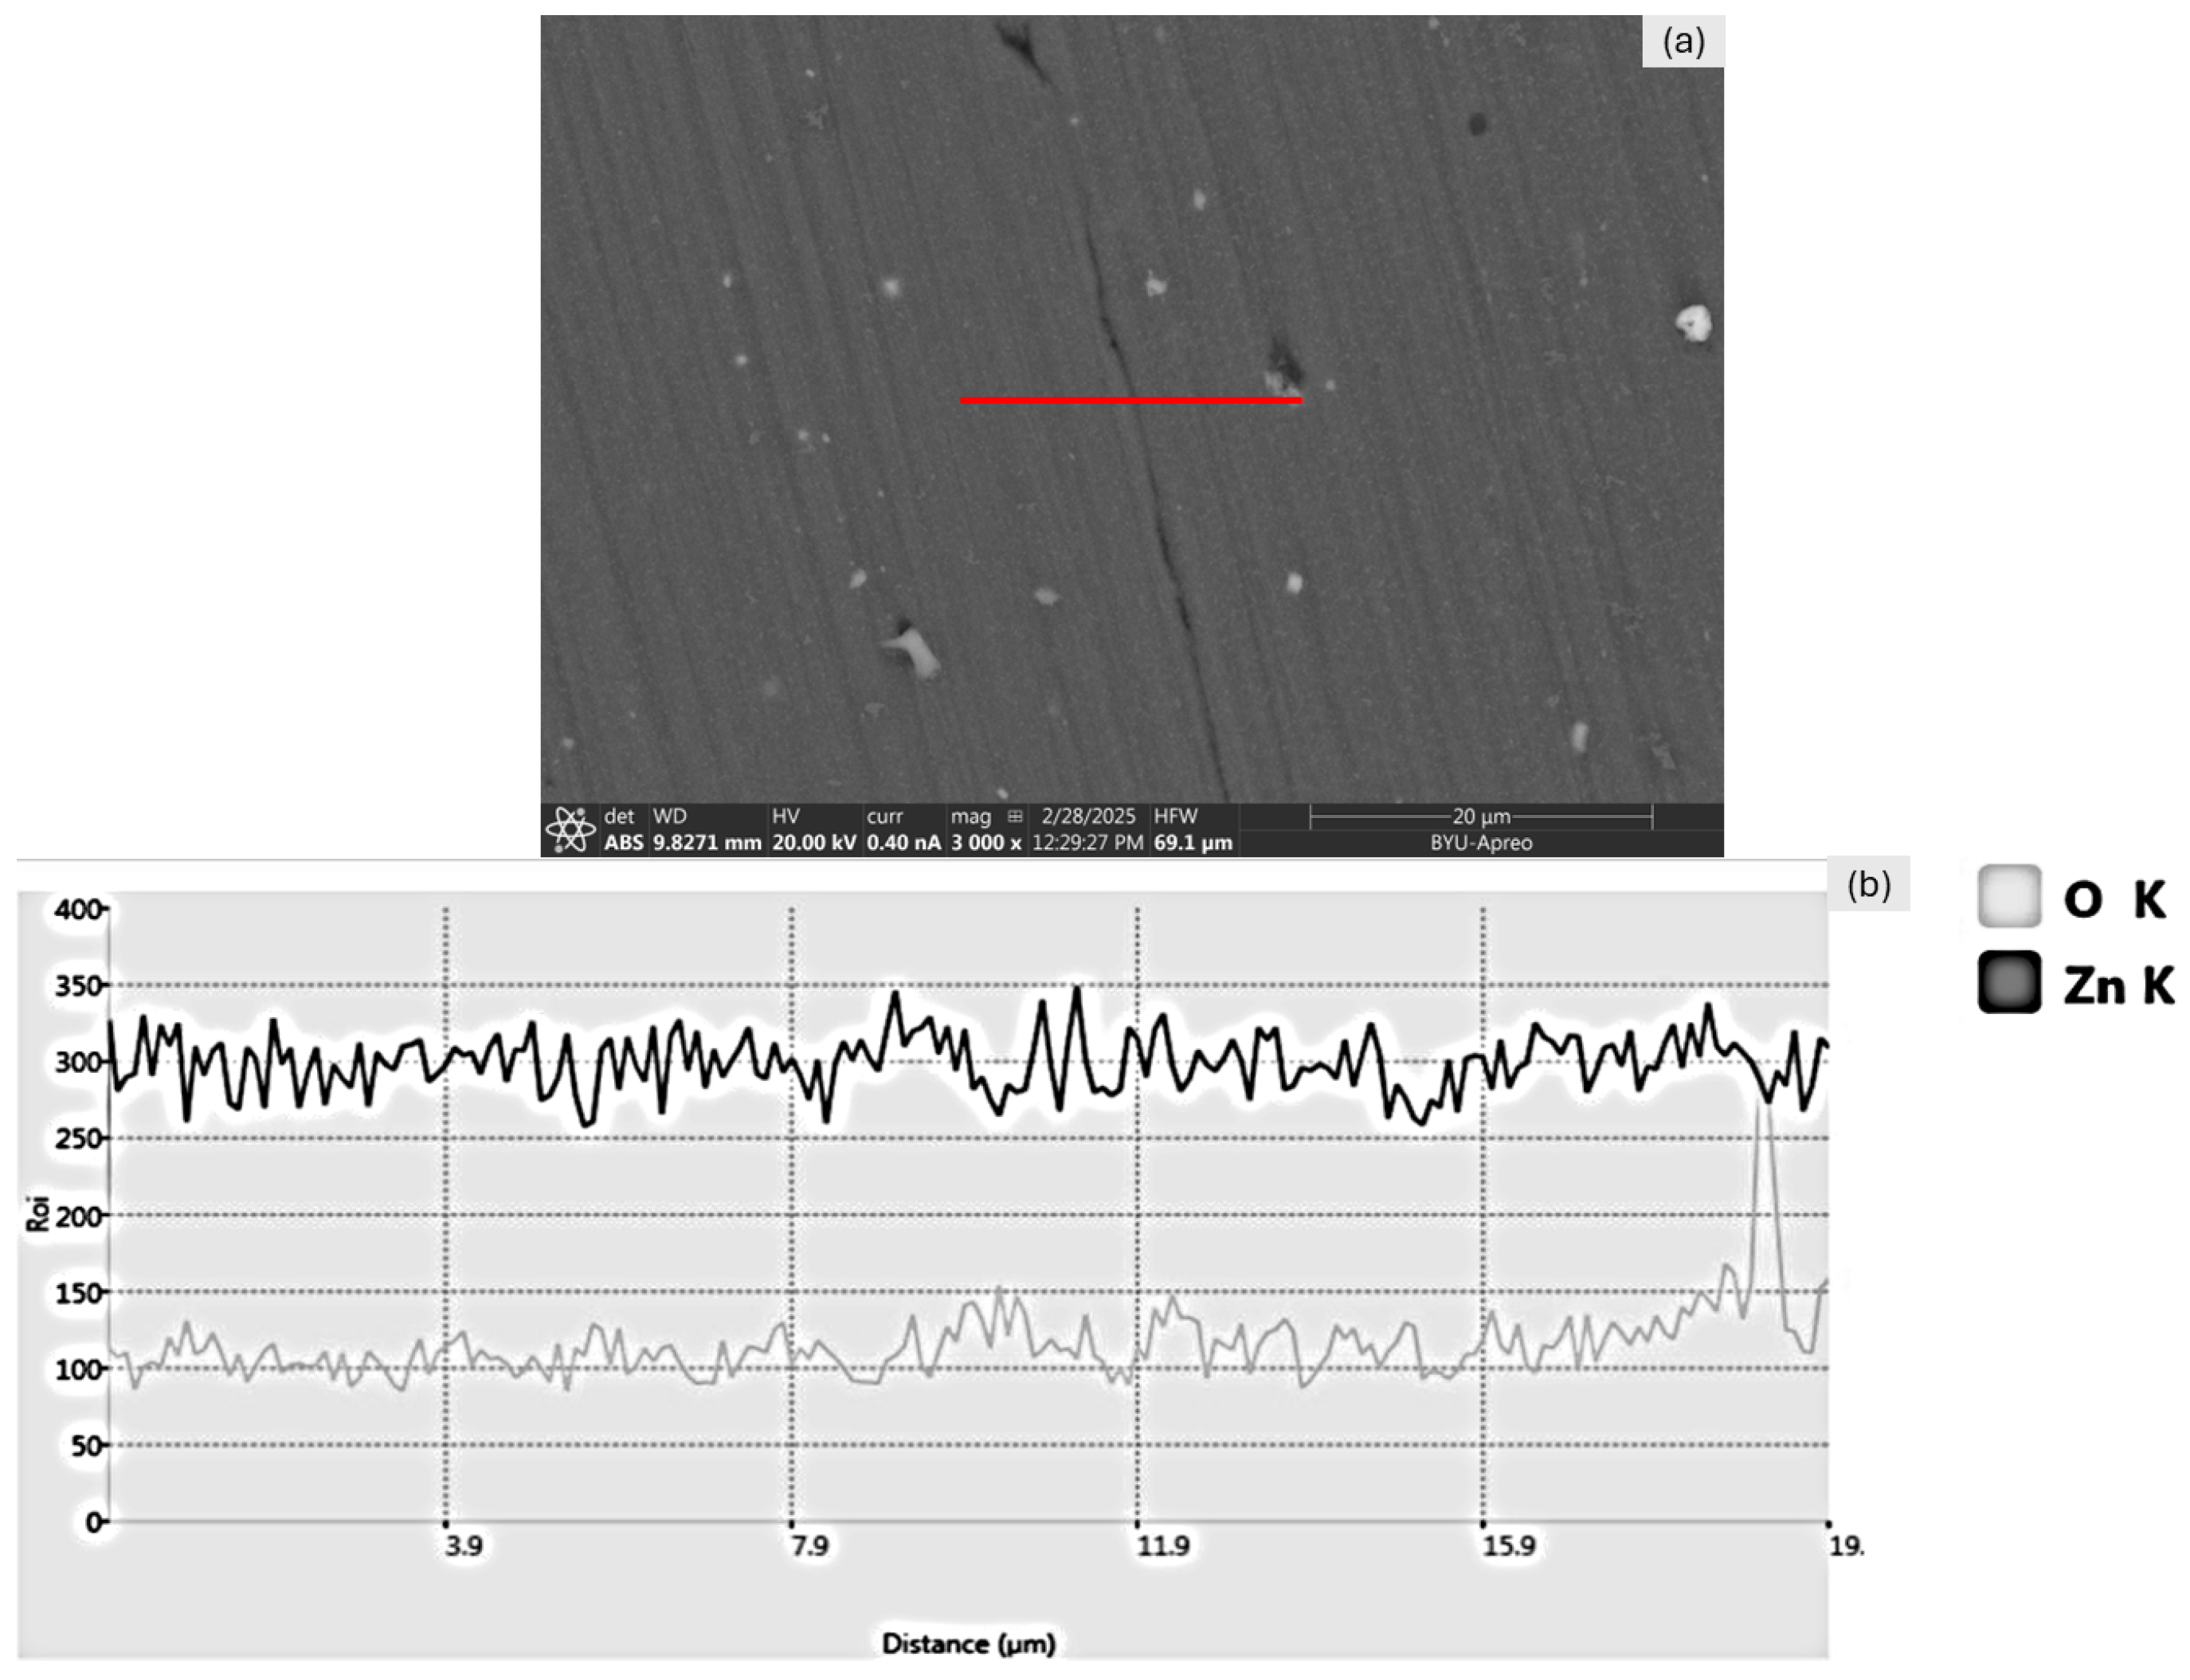
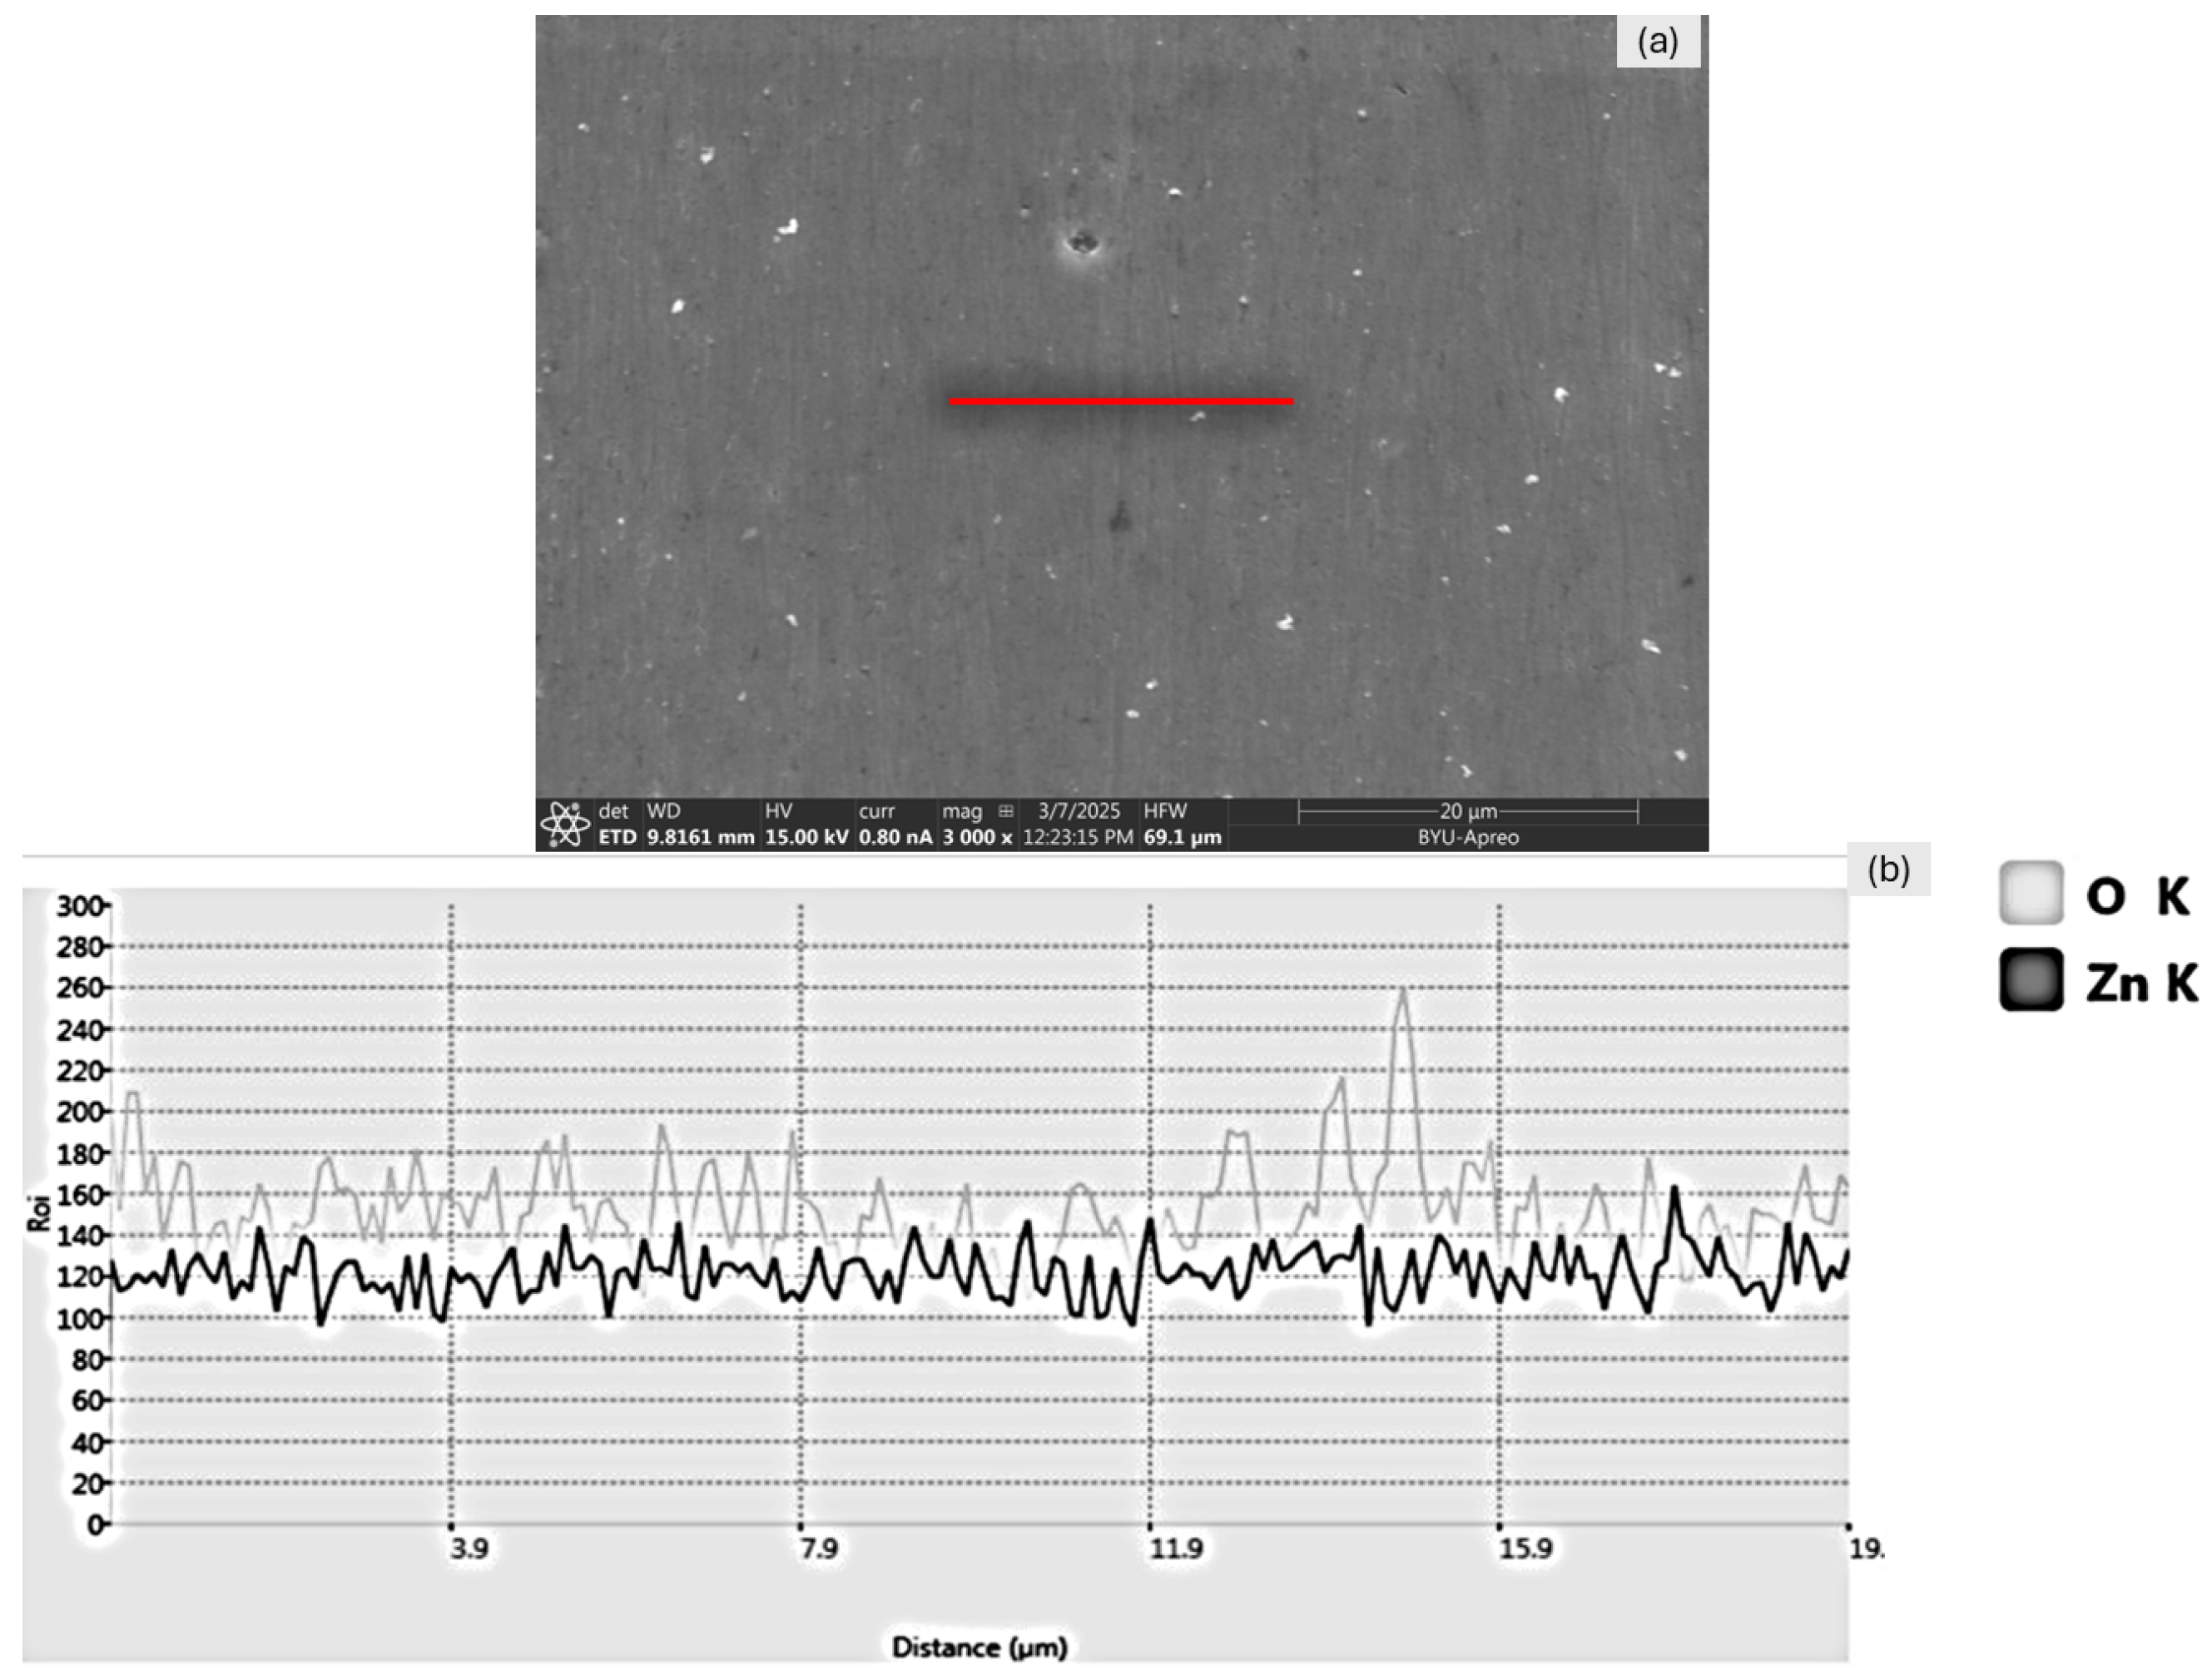
Figure 17.
A figure presenting the EDS scan measuring the oxygen presence along the layer interface of the 2.5 mm CW scroll cross-section. (a) The SEM images of the scanned area with the EDS scan line indicated in red and (b) the same image with the EDS scan overlayed on top.
Figure 18.
A figure presenting the EDS scan measuring the oxygen presence along the layer interface of the 2.5 mm CCW scroll cross-section. (a) The SEM images of the scanned area with the EDS scan line indicated in red and (b) the same image with the EDS scan overlayed on top.
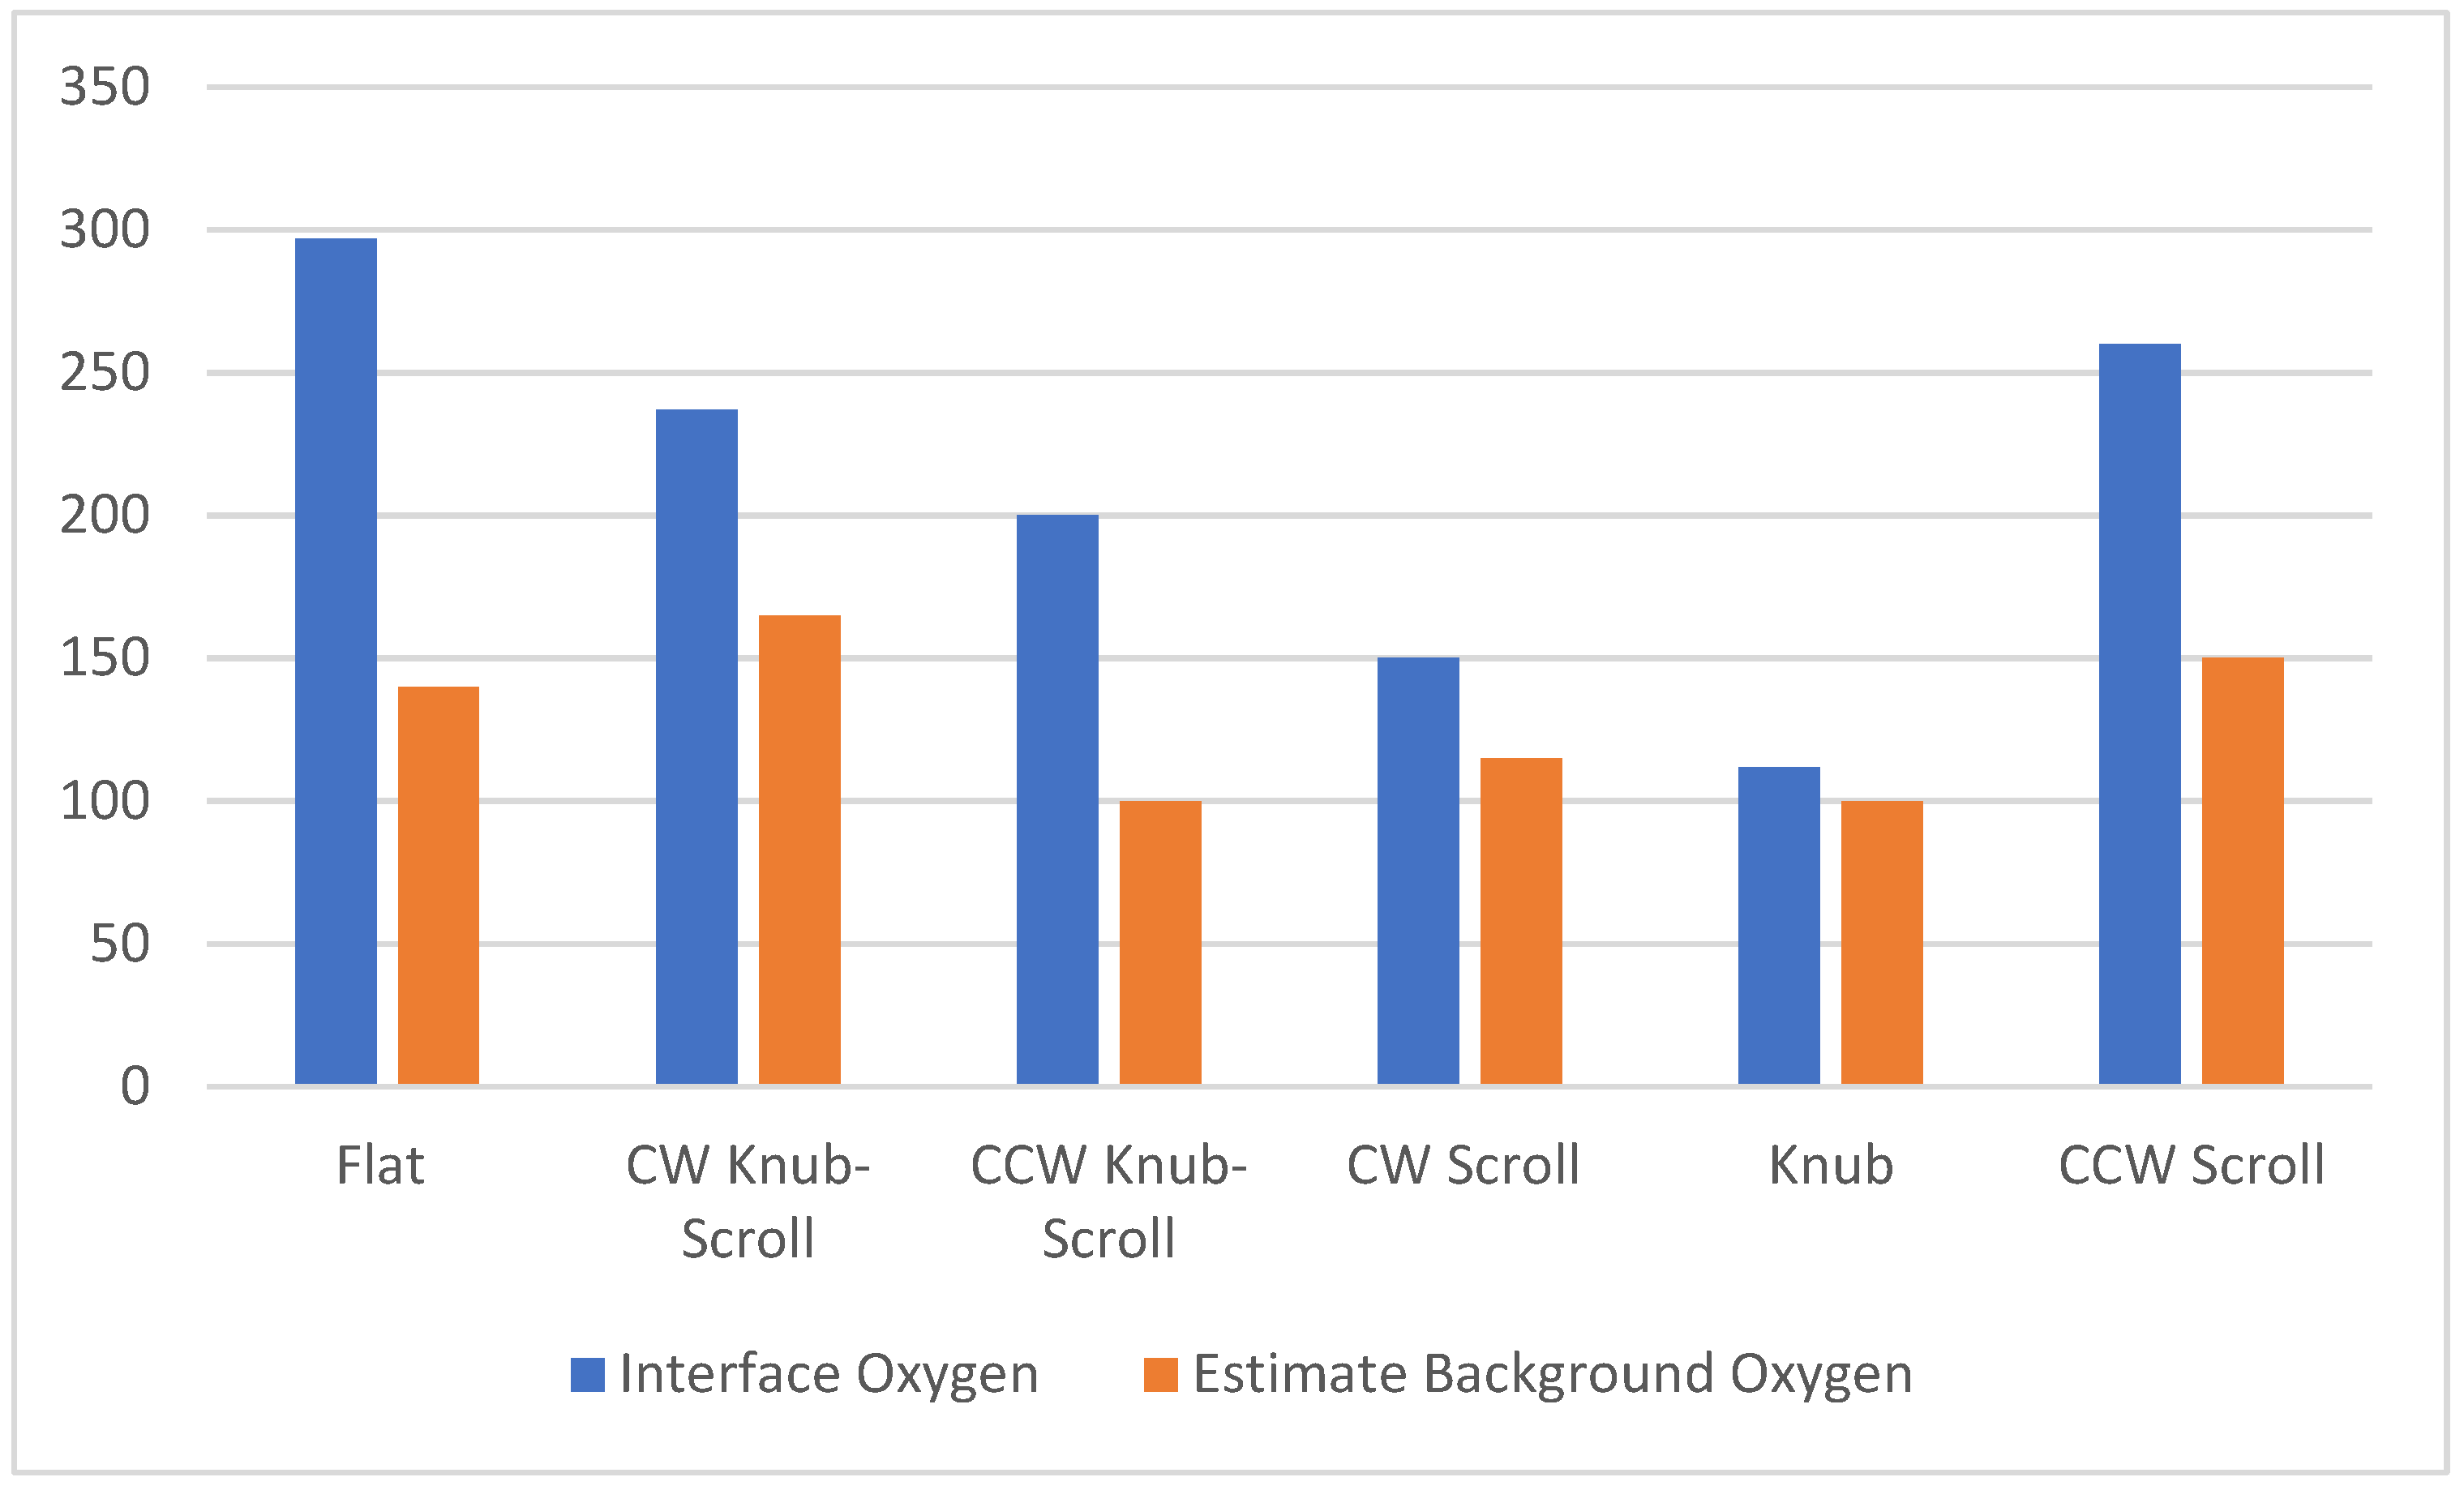
Figure 19.
A bar graph of the interface oxygen count when compared to the approximate background oxygen count.
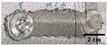
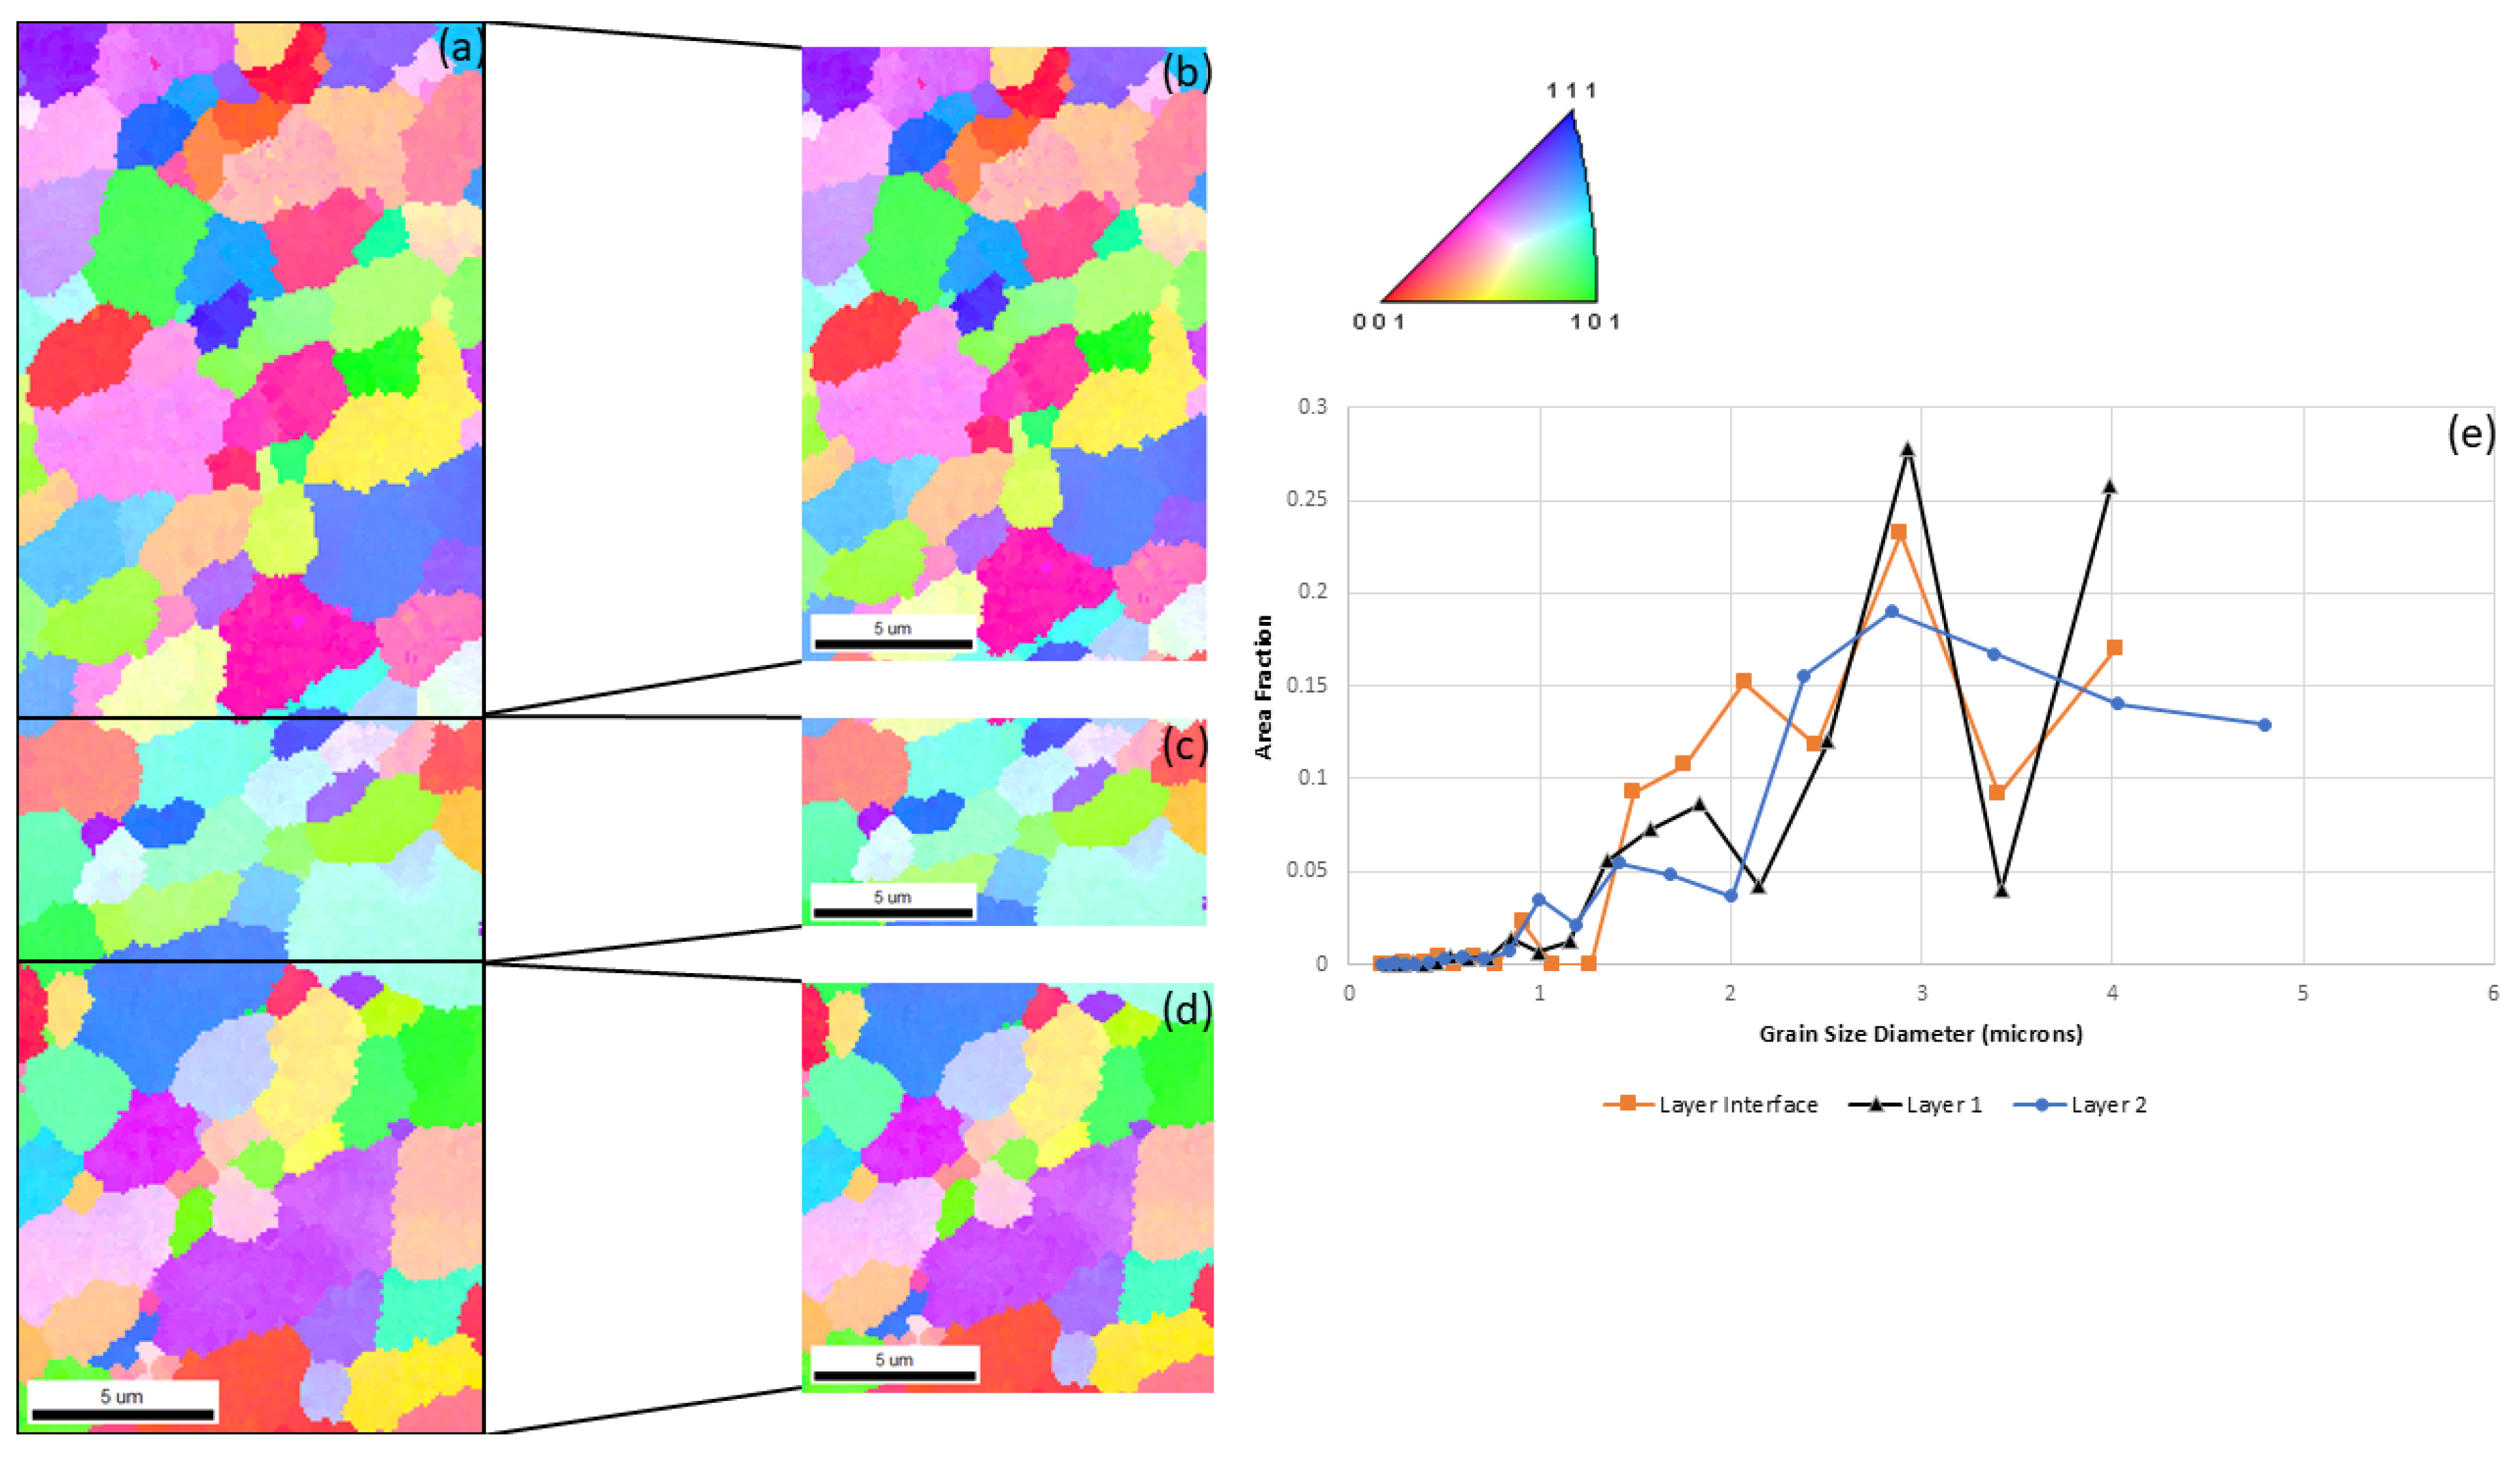
Figure 20.
A figure detailing the IPF and average grain diameters of the flat tool: (a) complete scan, (b) approximate area of layer 1, (c) approximate area of layer interface, (d) approximate area of layer 2, and (e) graph plotting the grain size diameter vs. area fraction.
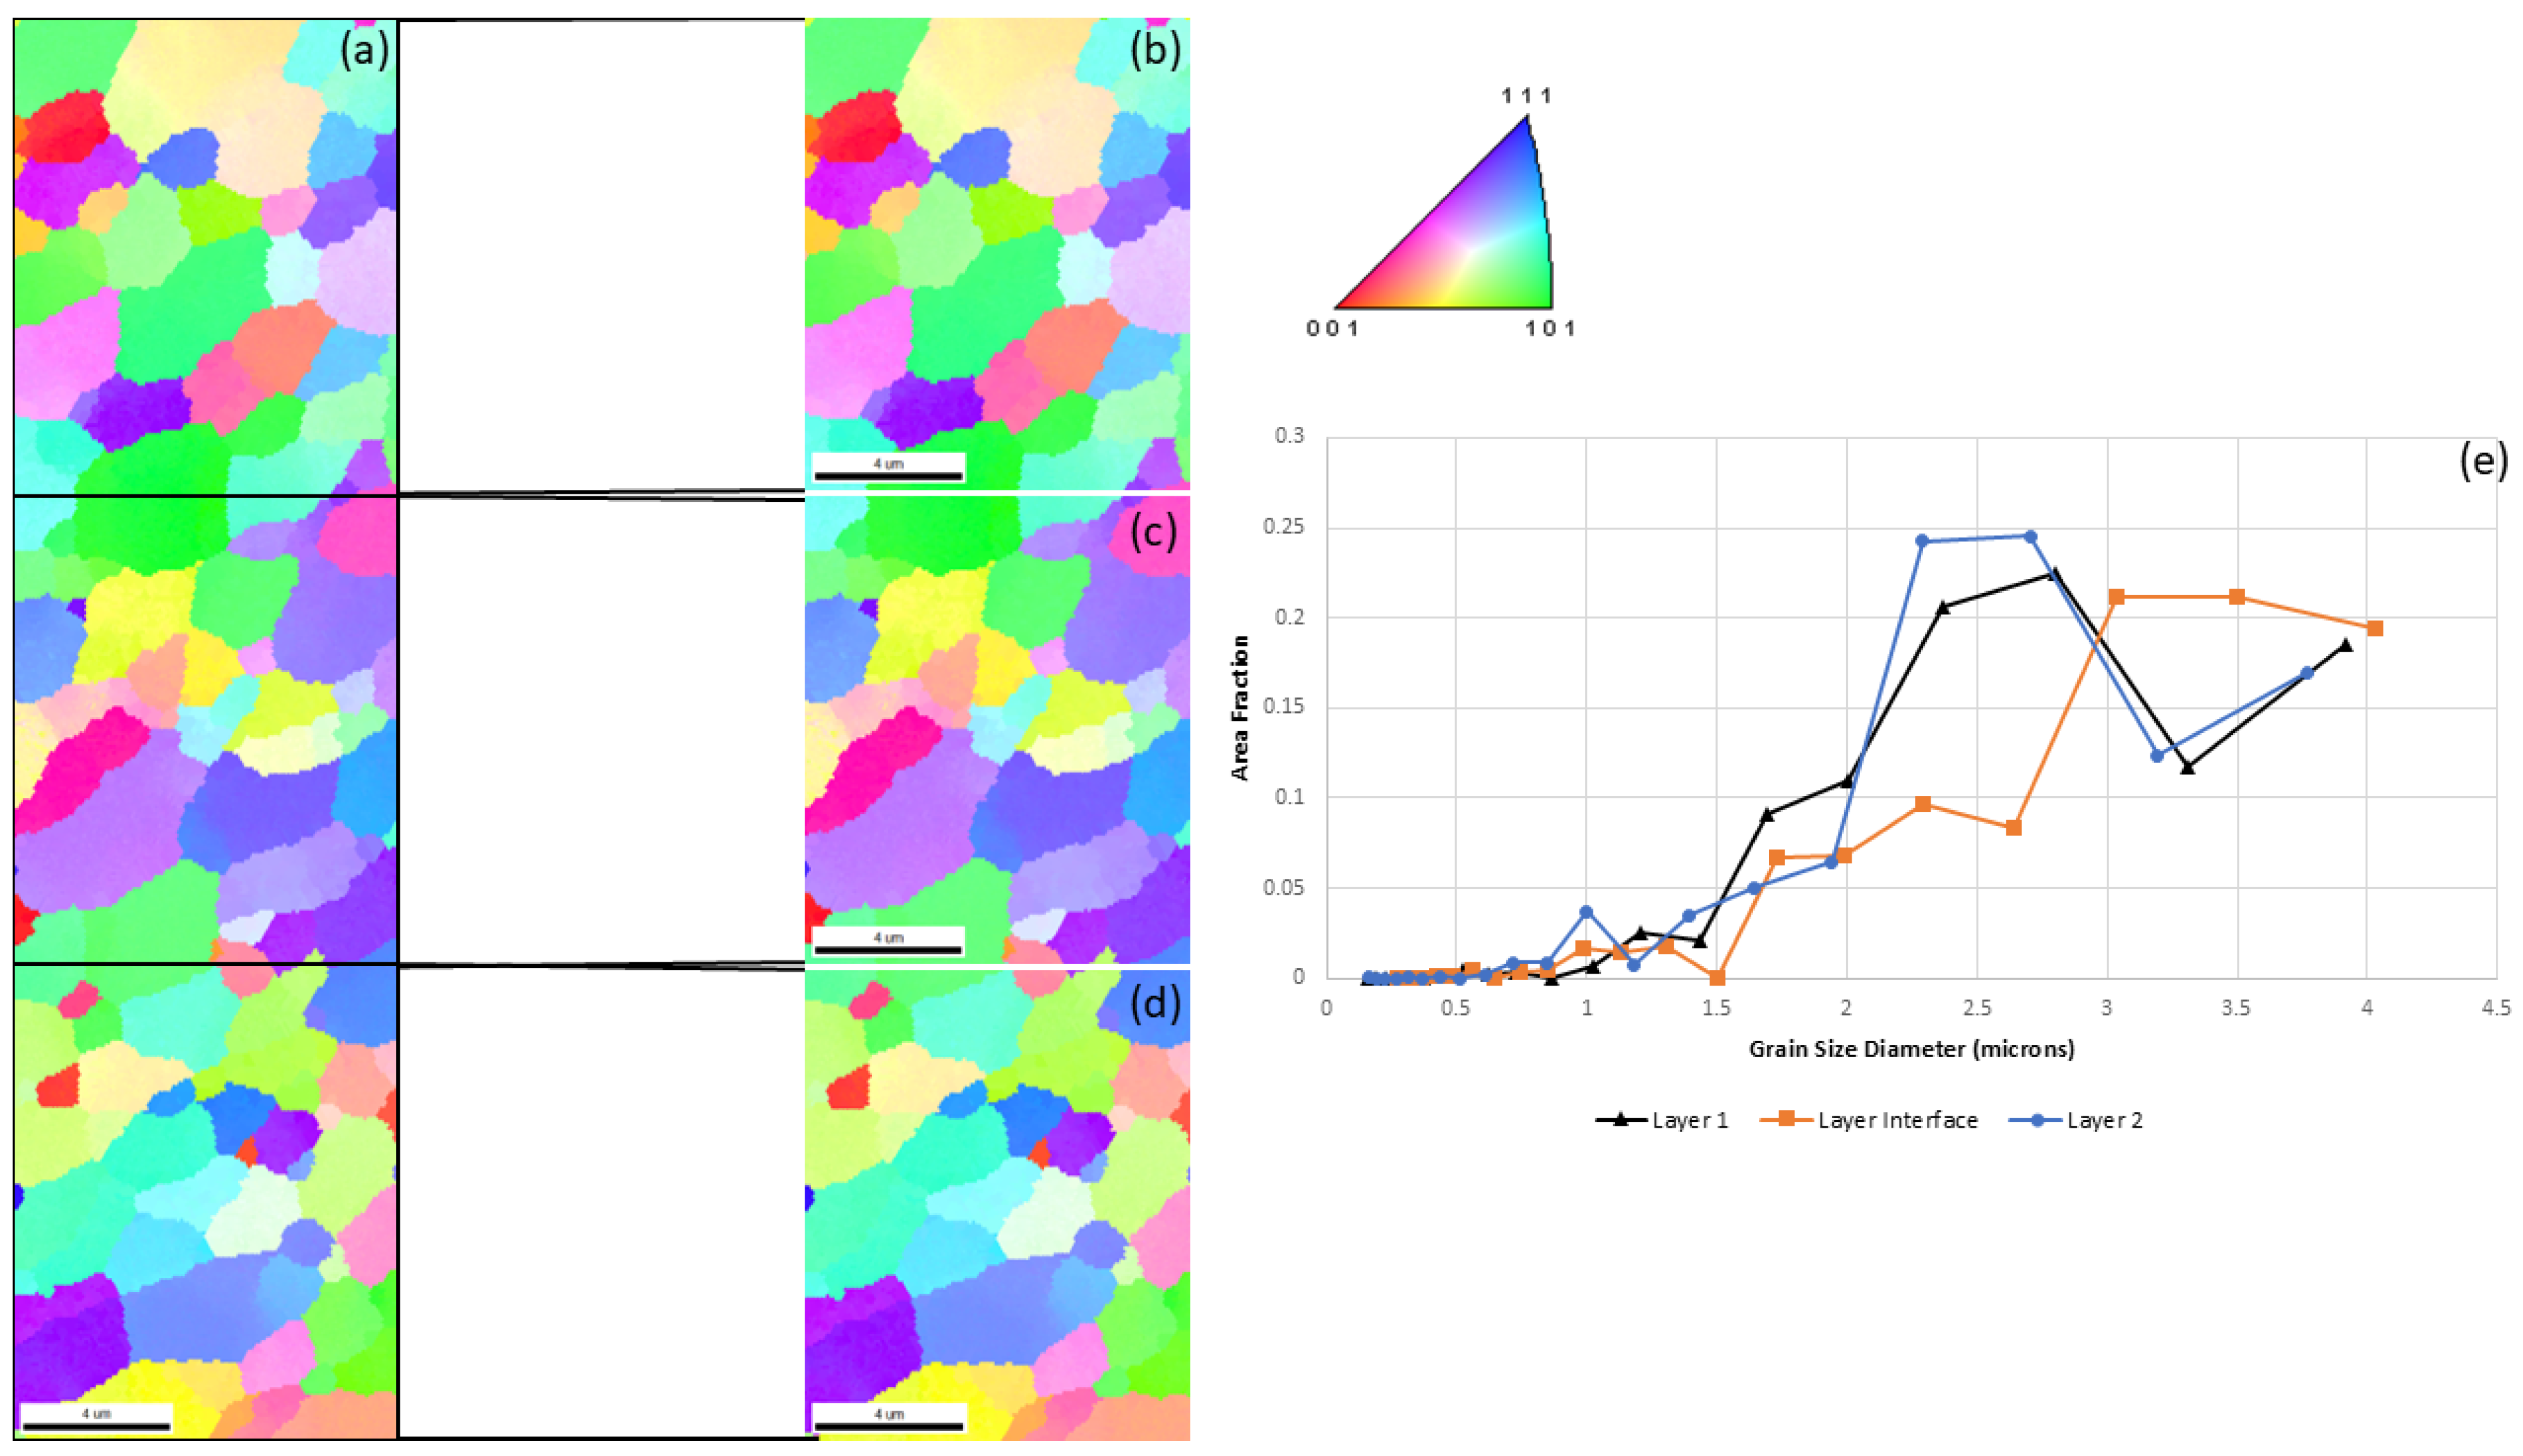
Figure 21.
A figure detailing the IPF and average grain diameters of the knub tool: (a) complete scan, (b) approximate area of layer 1, (c) approximate area of layer interface, (d) approximate area of layer 2, and (e) graph plotting the grain size diameter vs. area fraction.
Table 1.
A table comparing vertical tensile samples of AA7075 gathered with and without graphite compared to the annealed and forged conditions.
| Sample | UTS (MPa) | Elongation at Break (%) | Comparison to Forged UTS | Comparison to Forged Elongation |
|---|
| Graphite No HT Vertical 1 (1 mm layer) | 283.27 | 2.05 | 62.26% | 34.16% |
| T4V No Graphite W/HT (2.67 mm layer) | 386.5 | 2.86 | 84.95% | 47.67% |
| T5V No Graphite W/HT (2.67 mm layer) | 205.06 | 1.47 | 45.07% | 24.5% |
| T3V No Graphite No HT (2.67 mm layer) | 322.96 | 16.28 | 70.98% | 271.33% |
| T6V No Graphite No HT (2.67 mm layer) | 351.34 | 13.7 | 77.22% | 228.33% |
| T7V No Graphite No HT (2.67 mm layer) | 389.7 | 13.3 | 85.65% | 221.67% |
| 7075-O | 228 | 16 | 50.1% | 266.67% |
| 7075-T73Forged (AMS4141) | 455 | 6 | 100% | 100% |
Table 2.
A table comparing horizontal tensile samples of AA7075 gathered with and without graphite compared to the annealed and forged conditions.
| Sample | UTS (MPa) | Elongation at Break (%) | Comparison to Forged UTS | Comparison to Forged Elongation |
|---|
| Graphite No HT Horizontal 1 (1 mm layer) | 373.6 | 17.53 | 82.1% | 292.17% |
| T1H No Graphite No HT (2.67 mm layer) | 446.1 | 21.1 | 98.04% | 351.67% |
| T3H No Graphite W/HT (2.67 mm layer) | 591.58 | 11.13 | 130.02% | 185.5% |
| T5H No Graphite W/HT (2.67 mm layer) | 502.65 | 10.32 | 110.47% | 172% |
| 7075-O | 228 | 16 | 50.1% | 266.67% |
| 7075-T73Forged (AMS4141) | 455 | 6 | 100% | 100% |
Table 3.
A table with the elemental composition of AA 7075-T7.
| Element | Al | Zn | Mg | Cu | Cr | Si | Fe |
|---|
| Wt.% | 86.9–91.4 | 5.6–6.1 | 2.1–2.5 | 1.2–2.0 | 0.18–0.28 | Up to 0.4% | Up to 0.5% |
Table 4.
A table enumerating the feature dimensions of each of the featured tools used as a part of this study.
| Tool | Inner Knub Depth (mm) | Outer Knub Depth (mm) | Inner Scroll Depth (mm) | Outer Scroll Depth (mm) |
|---|
| Knub | 1.088 | 1.075 | N/A | N/A |
| Scroll | N/A | N/A | 1.013 | 1.115 |
| Knub–Scroll | N/A | 1.11 | 0.51 | 0.58 |
Table 6.
A table enumerating the average grain diameters for layer 1, layer 2, and the layer interface for each tool; the relative change between layers 1 and 2 and the layer interface is also considered.
| Tool | Average Grain Diameter Entire Sample (Micron) | Average Grain Diameter Layer 1 (Micron) | Average Grain Diameter Layer Interface (Micron) | Average Grain Diameter Layer 2 (Micron) | Average Layer 1 and Layer 2 Grain Diameter (Micron) | % Change Compared to Interface |
|---|
| Knub | 1.904 | 1.739 | 1.924 | 1.724 | 1.732 | 9.978 |
| Flat | 1.804 | 1.688 | 1.649 | 1.634 | 1.661 | −0.76 |


 and
and 


