Article

Prediction of Reduction Recovery of Iron and Vanadium Oxides in Low-Grade Vanadium–Titanium Magnetite Based on Response Surface Model

1
School of Metallurgical Engineering, Anhui University of Technology, Ma’anshan 243032, China
2
Department of Engineering, University of Leicester, Leicester LE1 7RH, UK
*
Author to whom correspondence should be addressed.
Metals 2025, 15(6), 595; https://doi.org/10.3390/met15060595
Submission received: 22 April 2025 / Revised: 21 May 2025 / Accepted: 22 May 2025 / Published: 27 May 2025

Abstract

In this study, the effects of reduction temperature and time on the reduction rates of iron and vanadium oxides in low-grade vanadium–titanium magnetite (VTM) were investigated. Based on the results of physical experiments, both the response surface method (RSM) and central composite design (CCD) were used to fit the prediction model of the reduction rate of iron and vanadium oxides in low-grade VTM. The results of the RSM prediction model show that under the condition of a sufficient reducing medium, affected by the high-temperature products, such as silicates and magnesium aluminates, the reduction rate of iron and vanadium oxides in low-grade VTM will first increase and then decrease. This indicates that a single factor cannot maximize the reduction efficiency of metal oxides. The results of the RSM prediction model show that the correlation fitting coefficient and correction fitting coefficient of the model are greater than 99% and 98%, respectively. The F-value is 150.05 and 176.19, respectively, and the p-value is less than 0.0001. This indicates that the RSM prediction model has high accuracy and reliability. After parameter optimization of the RSM prediction model, when the reduction temperature is 1446 °C~1498 °C and the reduction time is 43 min~60 min, the maximum reduction rates of iron oxide and vanadium oxide in iron ore can reach 92.93% and 69.20%, respectively. The study of reaction kinetics shows that the reduction processes of iron and vanadium oxides in VTM are controlled by three-dimensional diffusion conditions. The apparent activation energies of the reactions are 86.76 kJ/mol and 90.30 kJ/mol, respectively.

1. Introduction

Vanadium–titanium magnetite (VTM) is a composite ore with multiple valuable elements including iron, vanadium, and titanium, which have a broad utilization value [1,2,3]. The global VTM resources are estimated to be more than 40 billion tons, with reserves of about 15.7 billion tons. Among them, rock-type VTM is mainly distributed in China, Russia, South Africa, Canada, and other countries, while ilmenite placer is mainly distributed in New Zealand, Indonesia, the Philippines, and other Pacific Rim countries [4,5]. China is rich in VTM resources and has a large storage capacity, which currently exceeds 18 billion tons, mainly distributed in Panxi of Sichuan Province, Chengde of Hebei Province, and Chaoyang of Liaoning Province [6,7].
The comprehensive utilization technology of VTM can be divided into two kinds: blast furnace and non-blast furnace. Blast furnace use has the advantages of high production efficiency, large-scale production, etc. At the same time, there are some problems such as high production cost, large energy consumption, and serious environmental pollution [8,9]. The direct reduction method is one of the non-blast furnace smelting processes, which has the advantages of a short production process and low environmental pollution [10,11,12]. At present, many researchers have performed a lot of basic research work on the direct reduction process of VTM. Shi et al. [13] have studied and compared the coal-based direct reduction behavior of different kinds of VTM, and the results showed that the degree of metallization of VTM mainly depends on the composition and particle size of the mineral and that the reduction behavior of sintered VTM particles can be improved by adding common magnetite. Cheng et al. [14] studied the effects of additives on component separation, reduction degree, and reduction temperature of VTM, and the results showed that additives could reduce the reduction temperature and time and improve the recovery of equivalent elements of Fe, V, and Ti. Qin et al. [15] studied the effects of thermodynamics, roasting temperature, phase transformation, and reduction atmosphere on the reduction products in the process of carbothermal reduction of VTM. The results showed that carbothermal reduction was feasible for the reduction and carbonization of VTM, and the reduction atmosphere had no influence when the temperature was higher than 1350 °C. Dishwar et al. [16] studied the effect of basicity on the reduction behavior of iron ore pellets. The research results showed that at 900–1050 °C, the lower the basicity and the higher the activation energy, the better the reduction effect of iron ore pellets. When the smelting temperature was above 1450 °C, the basicity was greater than 0.8, and the smelting time was 30–40 min then the separation of slag iron was favorable. Sarka et al. [17] studied the effect of temperature on carbon-containing pellets, and the results showed that iron oxide was eventually reduced to Fe, while titanium oxide would not be reduced to low-priced titanium oxide. With the increase in reduction temperature, the degree of reduction gradually increases and the residual carbon content gradually decreases. In addition, the apparent rate constant k (T) increased with the increase in reduction temperature, and lnk (T) had a good linear relationship with temperature. It can be seen that the research objects of the above scholars are mainly high-grade VTM. After simple beneficiation and enrichment, the grade of TFe (total iron) in the iron concentrate powder is about 60~67%, the grade of V2O5 is about 0.65~0.85%, and the grade of TiO2 is about 10~15%. The recovery and utilization rate of valuable metal elements in VTM can be greatly improved by a direct reduction process. VTM after direct reduction is sent into an arc furnace for melting, so that Fe and V enter molten steel, and Ti enters molten slag to produce high-titanium slag. Therefore, the combination of the direct reduction process and electric furnace melting technology is expected to further improve the comprehensive utilization efficiency of VTM and realize the efficient separation and extraction of valuable metal elements.
At present, the global steel industry is in a relatively low state as the upstream iron ore raw materials are running at a long-term high level and the downstream finished steel is sold at a low price, which makes the industry profits almost long-term negative; this is the most prominent performance in the Chinese steel industry. Several of the world’s largest producers of iron, vanadium, and titanium products, such as South Africa’s Highveld Steel and Vanadium, the United States vanadium Stratcor, China’s Panzhihua Steel Group, and Precious Metals Australia, etc., have suffered varying degrees of loss. The use of high-grade VTM has further compressed the profits of the abovementioned steel enterprises and increased the loss of enterprises. In order to reverse the loss situation of the above enterprises and reduce the cost of raw materials for smelting production, some enterprises and scholars began to explore the use of low-grade VTM for vanadium extraction and steelmaking production. In addition, with the further development of VTM, the rich reserves are decreasing day by day and the resource situation is becoming increasingly severe. It is of great strategic significance to find a substitute area for mineral resources and further improve the technical level of development and utilization of low-grade VTM resources.
It is found that due to the many factors affecting the recovery and utilization rate of valuable metal elements in low-grade VTM, the method simply explored by experiments has a high cost, a long cycle, and low reliability, and cannot sum up a set of effective and portable intelligent analysis and prediction models. Therefore, the response surface method, which can be used to analyze and fit the experimental results of the recovery rate of valuable metals of low-grade VTM through the regression fitting function relationship of the design test scheme, is selected to find out the key factors affecting the recovery rate, and the result prediction model is designed to solve the defects of research methods caused by multiple orthogonal experiments. Response surface methodology (RSM), also known as the response surface method, seeks optimal process parameters by designing a reasonable test scheme and corresponding test data and analyzing response surfaces and contours. It is a mathematical statistical method using quadratic polynomial regression to fit the corresponding functional relationship [18,19,20]. This method was originally proposed by Box and Wilson [21] for the design of physical tests, and has been widely used in chemical, pharmaceutical, machinery, and other fields [22,23,24]. In the field of metallurgical engineering, this method is mainly used in the extraction and purification of rare metals in hydrometallurgy and the optimization of ore blending during sintering process. However, in the field of pyrometallurgy, there are no reports on the study of the prediction model of the metal oxide reduction recovery rate in iron ore directly using the response surface method.
Based on this, central composite design (CCD), one of the main experimental design methods of RSM, was adopted in this study. Using carbon powder as the reduction medium, the effects of reduction temperature and reduction time on the reduction recovery of iron and vanadium oxides in low-grade VTM were studied. By fitting the laboratory data through the response surface equation, the prediction model of the recovery rate was obtained, the influencing factors were analyzed, and the accuracy of the prediction model was optimized and verified. This can provide a reliability reference for enterprises using low-grade VTM as production raw materials and provide a theoretical model basis for subsequent large-scale popularization and application of low-grade VTM.

2. Experimental Design

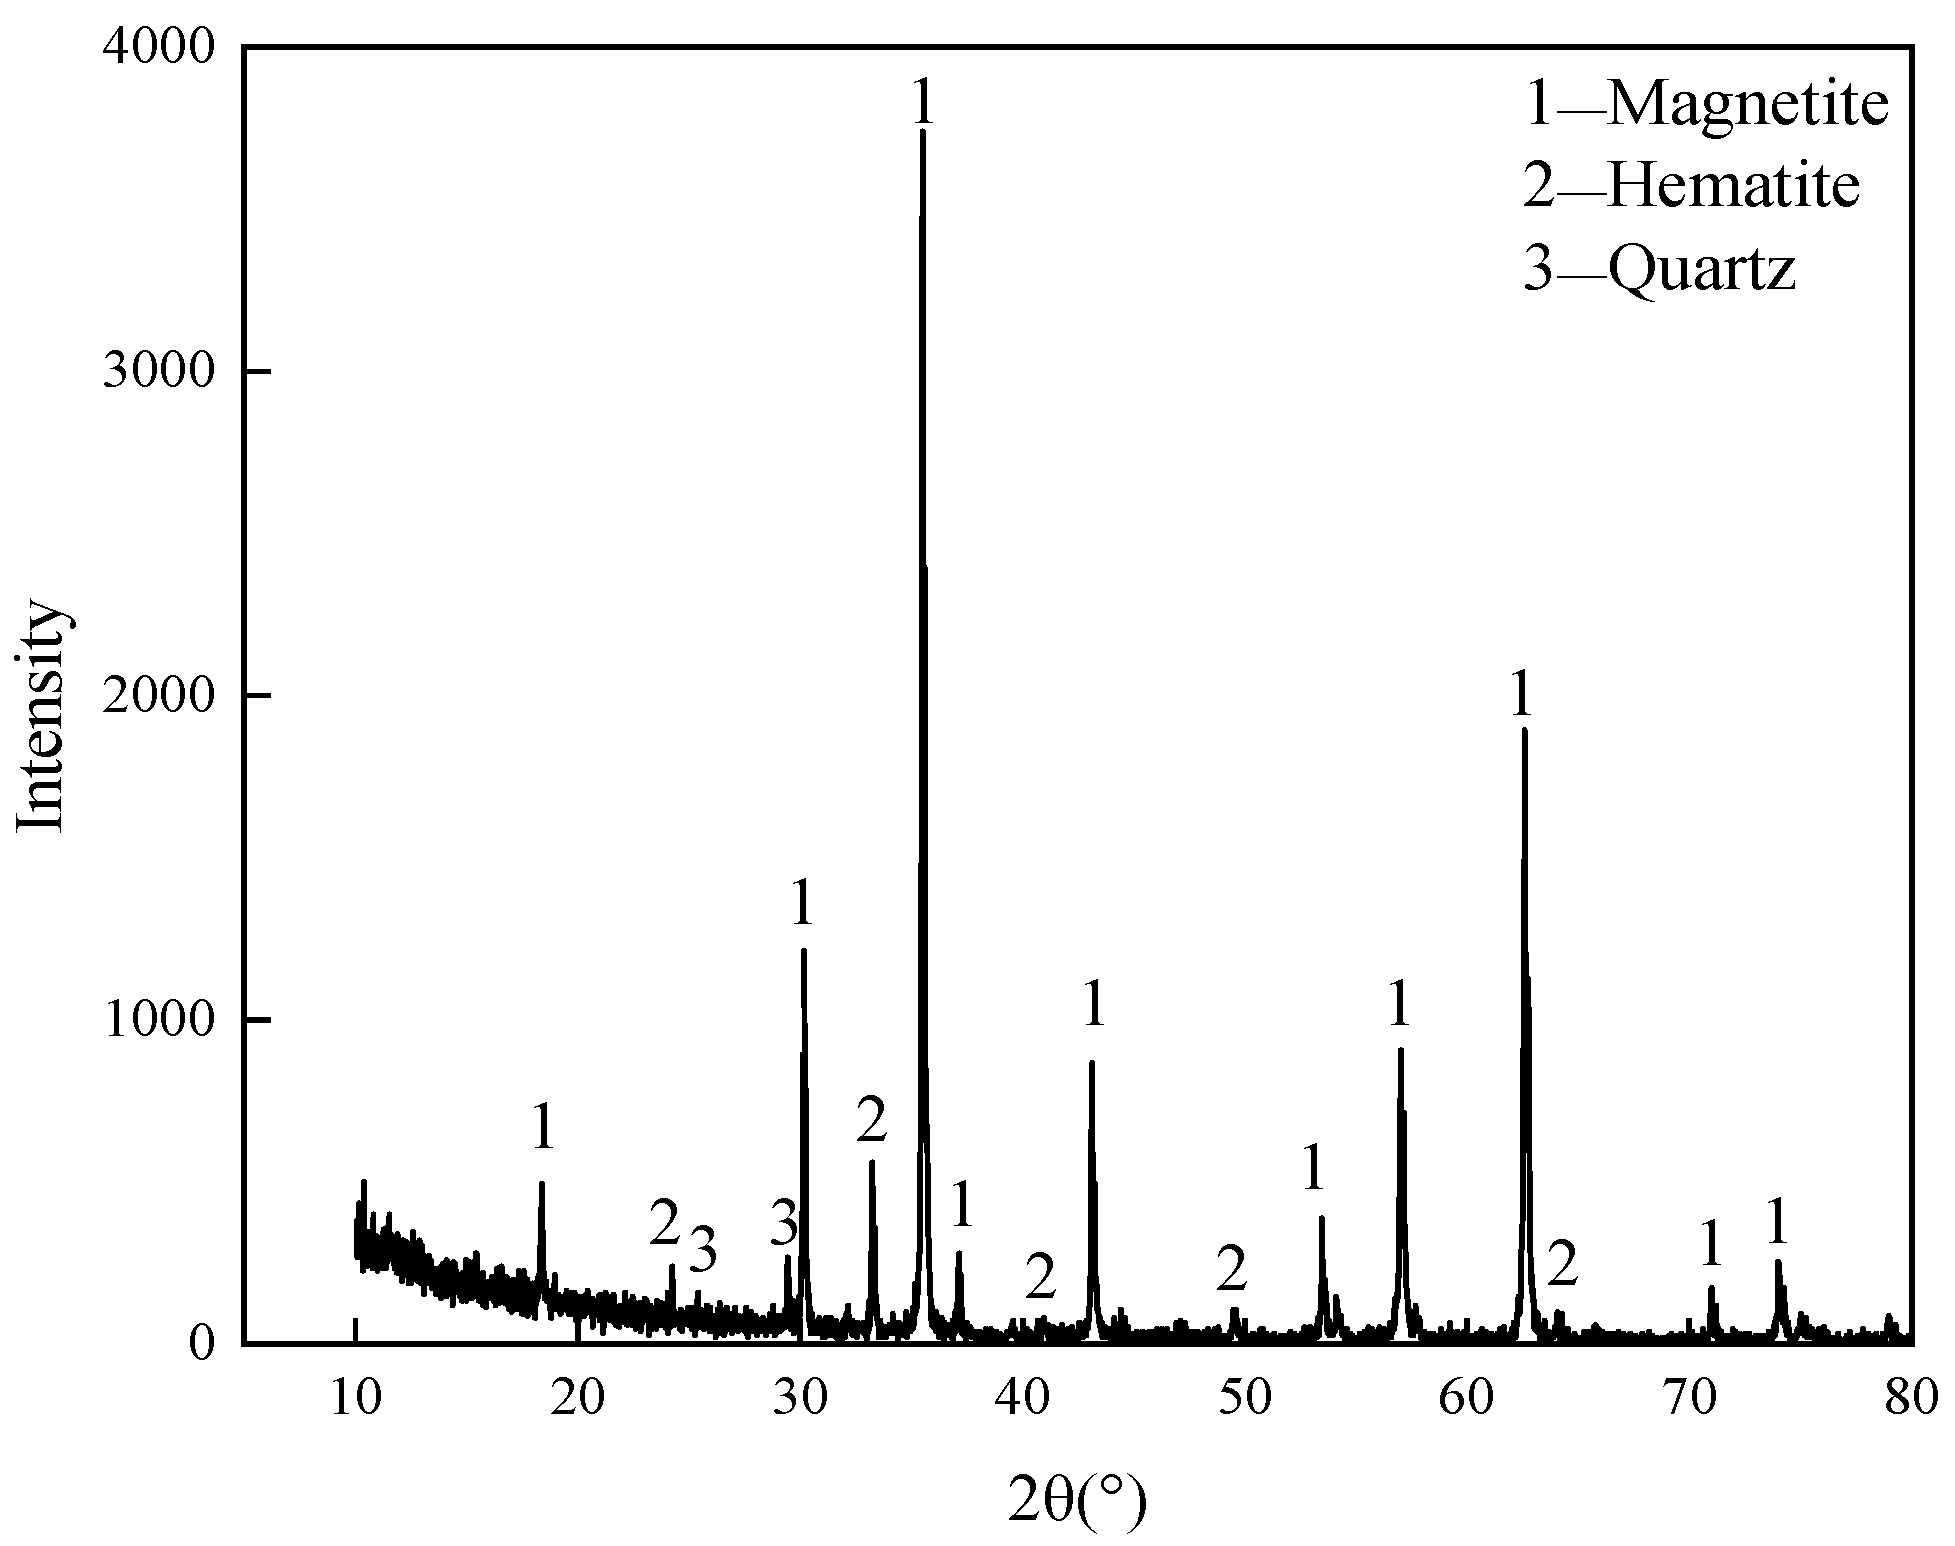
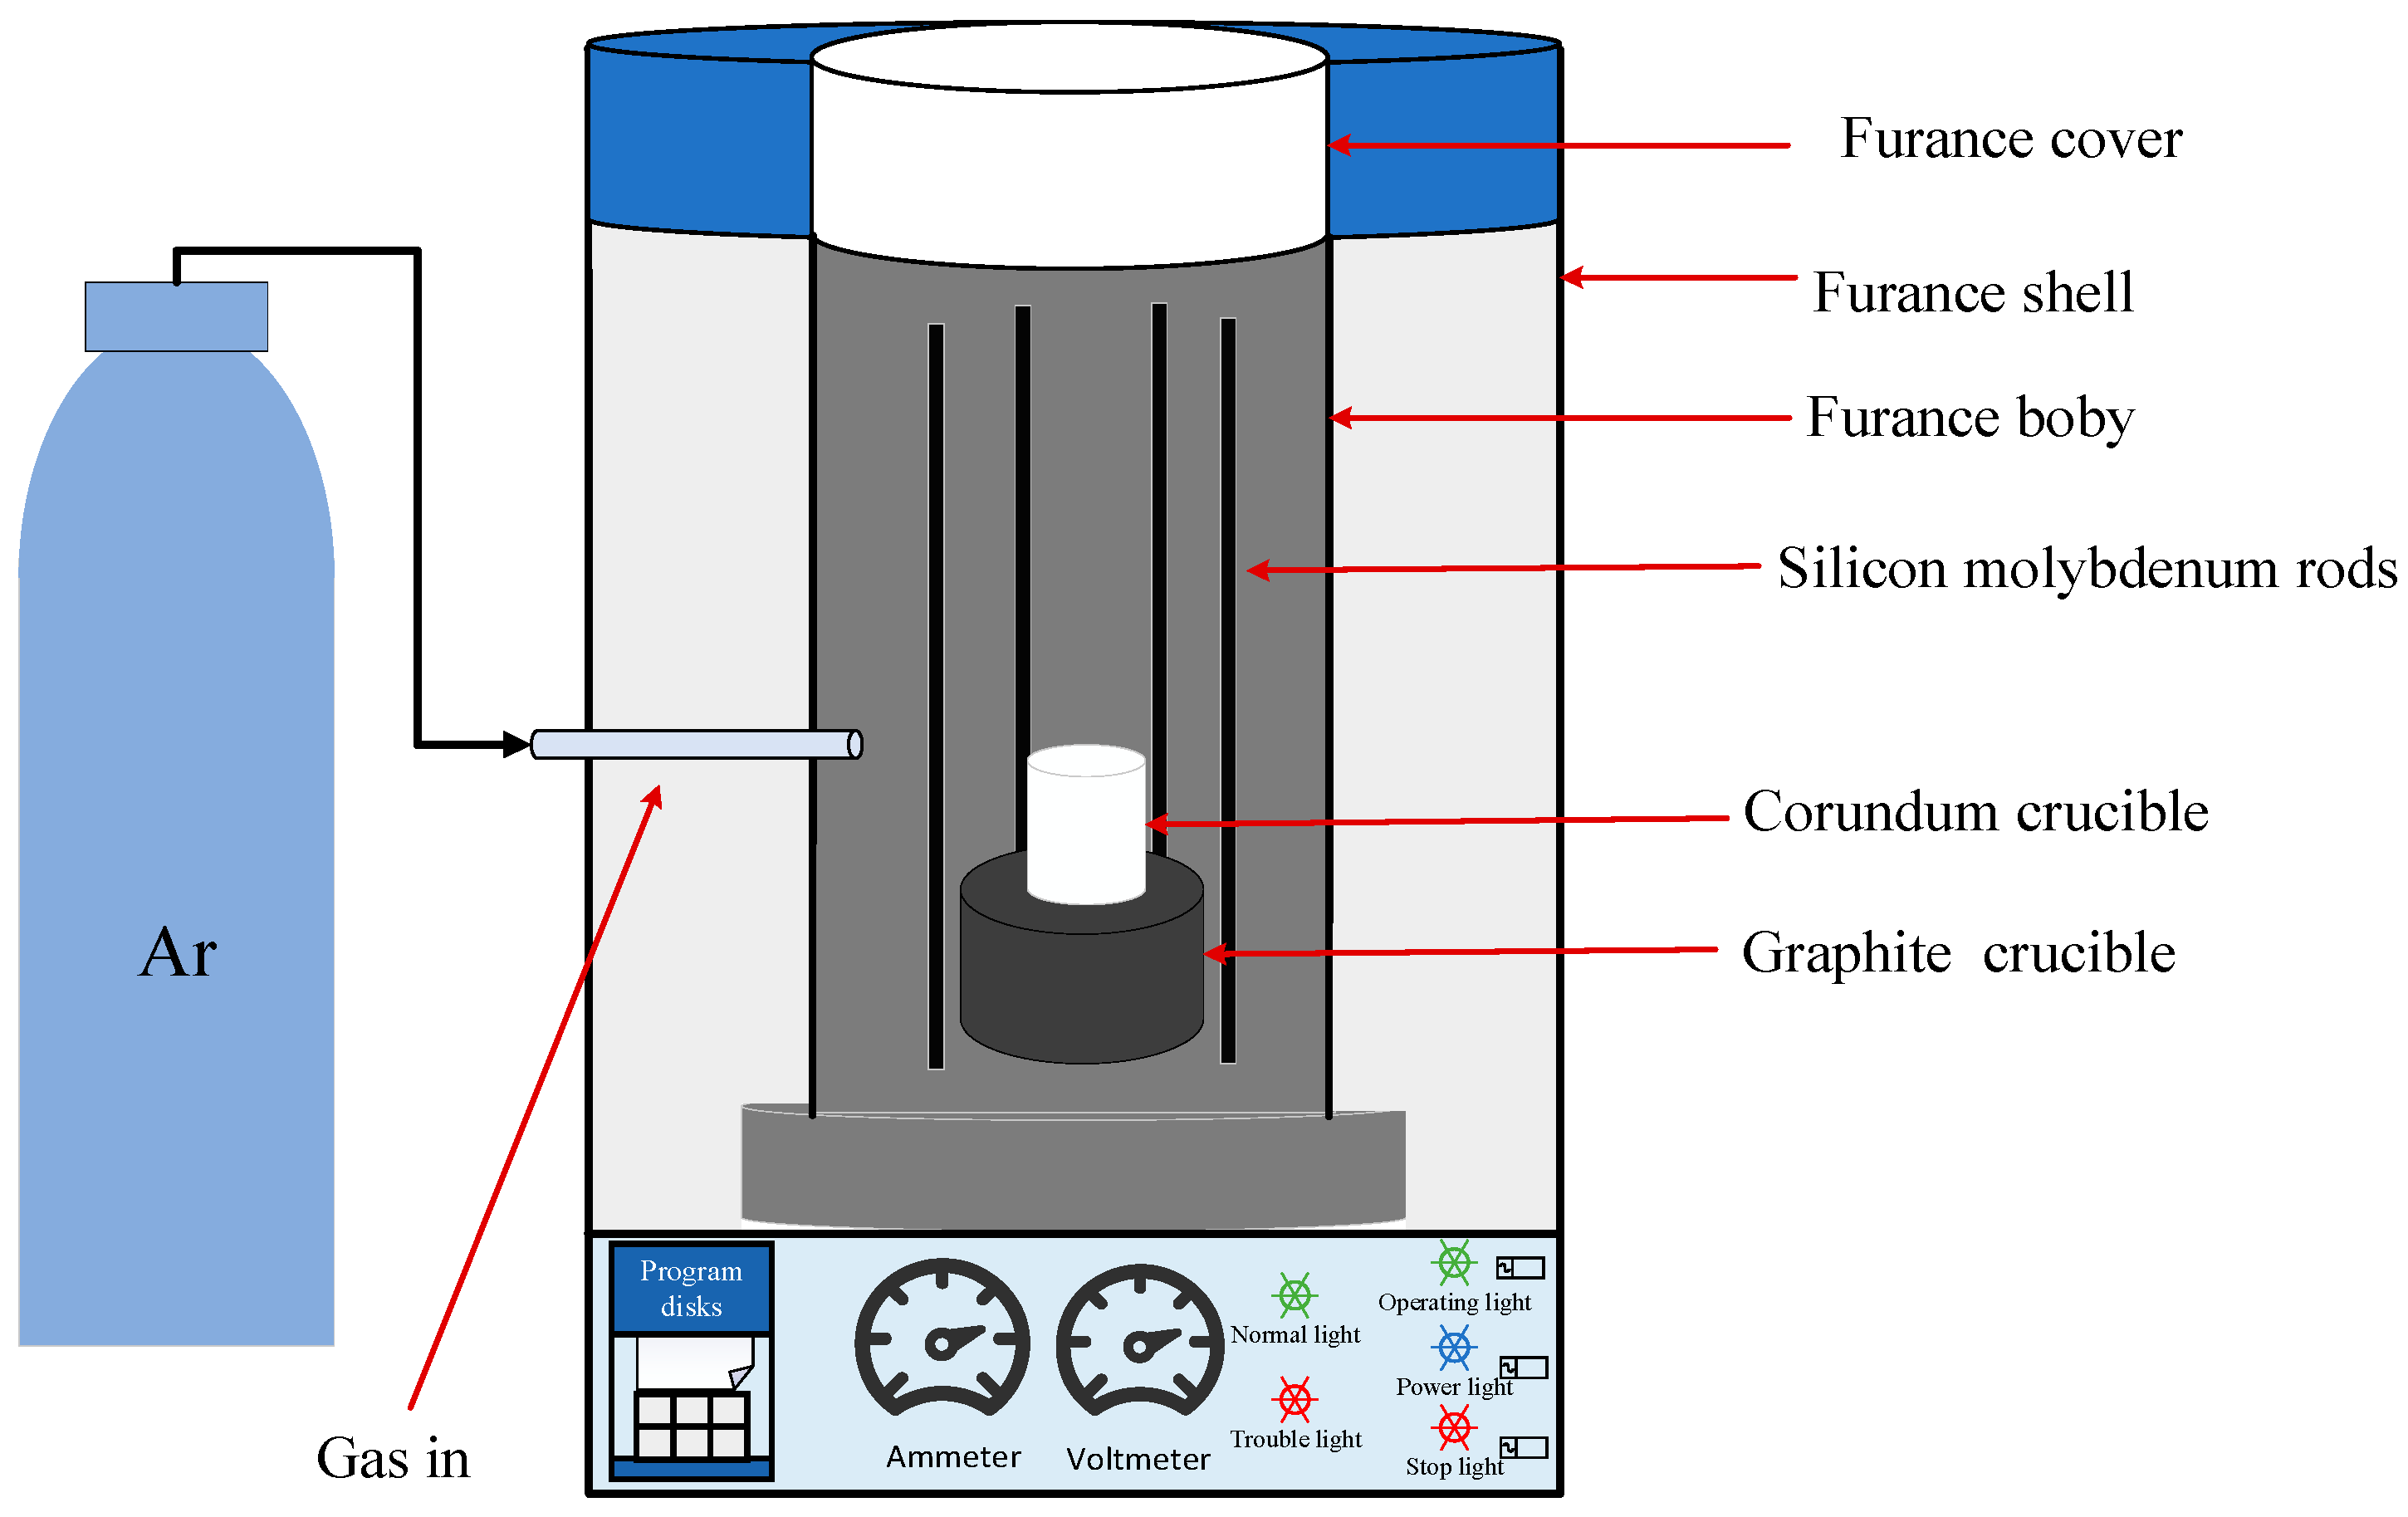
2.1. Experimental Materials and Equipment

The raw material used in this experiment was low-grade VTM mined by a mineral enterprise in China. After beneficiation, iron fine powder with high total iron content was formed, but the content of vanadium and titanium oxides were still relatively low. XRD was used to analyze the mineral composition of enriched VTM iron fine powder, and the result is shown in Figure 1. As can be seen from Figure 1, the main minerals in the concentrate’s products are magnetite and hematite, with a small amount of minerals such as quartz. Its main chemical composition and mineral composition are shown in Table 1. The reducing medium used in the experiment was chemically pure-grade carbon powder. The experimental equipment is a high-heat Muffle furnace, and the experimental reaction process is shown in Figure 2.

2.2. Experimental Method

(1)
Raw material pretreatment: Weigh 100 g of VTM fine powder and place it in a crusher for crushing treatment. Use a standard inspection sieve for screening to ensure that the final particle sizes are all less than 200 mesh (about 74 μm) so as to increase the contact area and reaction efficiency of the subsequent reaction.
(2)
Raw material ratio and mixing: Accurately calculate the amount of reducing medium used based on the stoichiometric relationship in the material reaction equation. Meanwhile, weigh 2% of the iron concentrate powder, 1% of the sodium carboxymethyl cellulose binder, and 5% of pure water. Place all the above raw materials in a stirring container and stir thoroughly to ensure uniform mixing of each component, thereby obtaining a VTM mixture. The specific specifications, manufacturers, and other details of the chemical reagents used in the experiment are detailed in Table 2.
(3)
Briquetting and drying: Transfer the mixed materials to the briquetting mold and maintain pressure at 20 MPa for 3 to 5 min to complete the briquetting process. Subsequently, place the pressing blocks in a constant temperature drying oven, with the temperature set at 105 °C, and dry them for 6 h to fully cure the pressing blocks and enhance their physical strength and stability.
(4)
Reduction reaction: This experiment is conducted under normal pressure conditions, and the reduction process is controlled by adjusting the reduction temperature and reduction time. Select a corundum crucible as the reaction vessel and carefully place the dried and solidified briquettes into the crucible. Turn on the muffle furnace and slowly heat it up to the specified temperature according to the preset program (with the heating rate controlled at 7 °C/min). After the furnace temperature stabilizes, quickly place the crucible containing the sample into the center of the muffle furnace chamber that has been filled with Ar protective gas. The Ar gas flow rate should be controlled at 100–200 mL/min to ensure that the reaction proceeds fully in an inert atmosphere. The reaction duration should be set according to the experimental requirements.
(5)
Cooling and post-treatment: After the reaction is completed, quickly remove the crucible and place it in a cooling device filled with Ar gas. Let it cool naturally to room temperature under a protective atmosphere. After the cooling is completed, completely take the sample out of the crucible. Mechanically crush achieve effective separation of the slag phase and the iron phase. Then, crush and grind the slag phase, and detect its composition. Calculate the reduction rates of iron and vanadium metal oxides in the raw ore, and analyze the characteristics of the reactants under microscopic conditions to enhance the understanding of the reduction reaction process for subsequent component analysis and performance testing.
Response surface methodology (RSM) is a statistical method for optimizing the design and analysis of experiments [25,26]. In this study, reduction temperature (A) and reduction time (B) were selected as two variables for the experimental design of the response surface. The values of the designed variables are shown in Table 3 using the software Design-Expert 13, and the reduction rates of iron and vanadium oxides were taken as the response quantity.

2.3. Experimental Design Based on Response Surface Method

The physics research scheme consists of 13 groups of experiments, of which 5 central points correspond to 5 groups of central experiments and the remaining 8 groups are factorial experiments. The experimental scheme design is shown in Table 4. The experiments were conducted through the experimental methods in Section 2.2. After the VTM was reduced, the main chemical components of the slag are TiO2, SiO2, Al2O3, CaO, and MgO, as well as small amounts of FeO, MnO, and V2O5. Based on the results, the reduction rates of iron and vanadium oxides in VTM under different experimental conditions were obtained, as shown in Table 4.

3. Result and Discussion

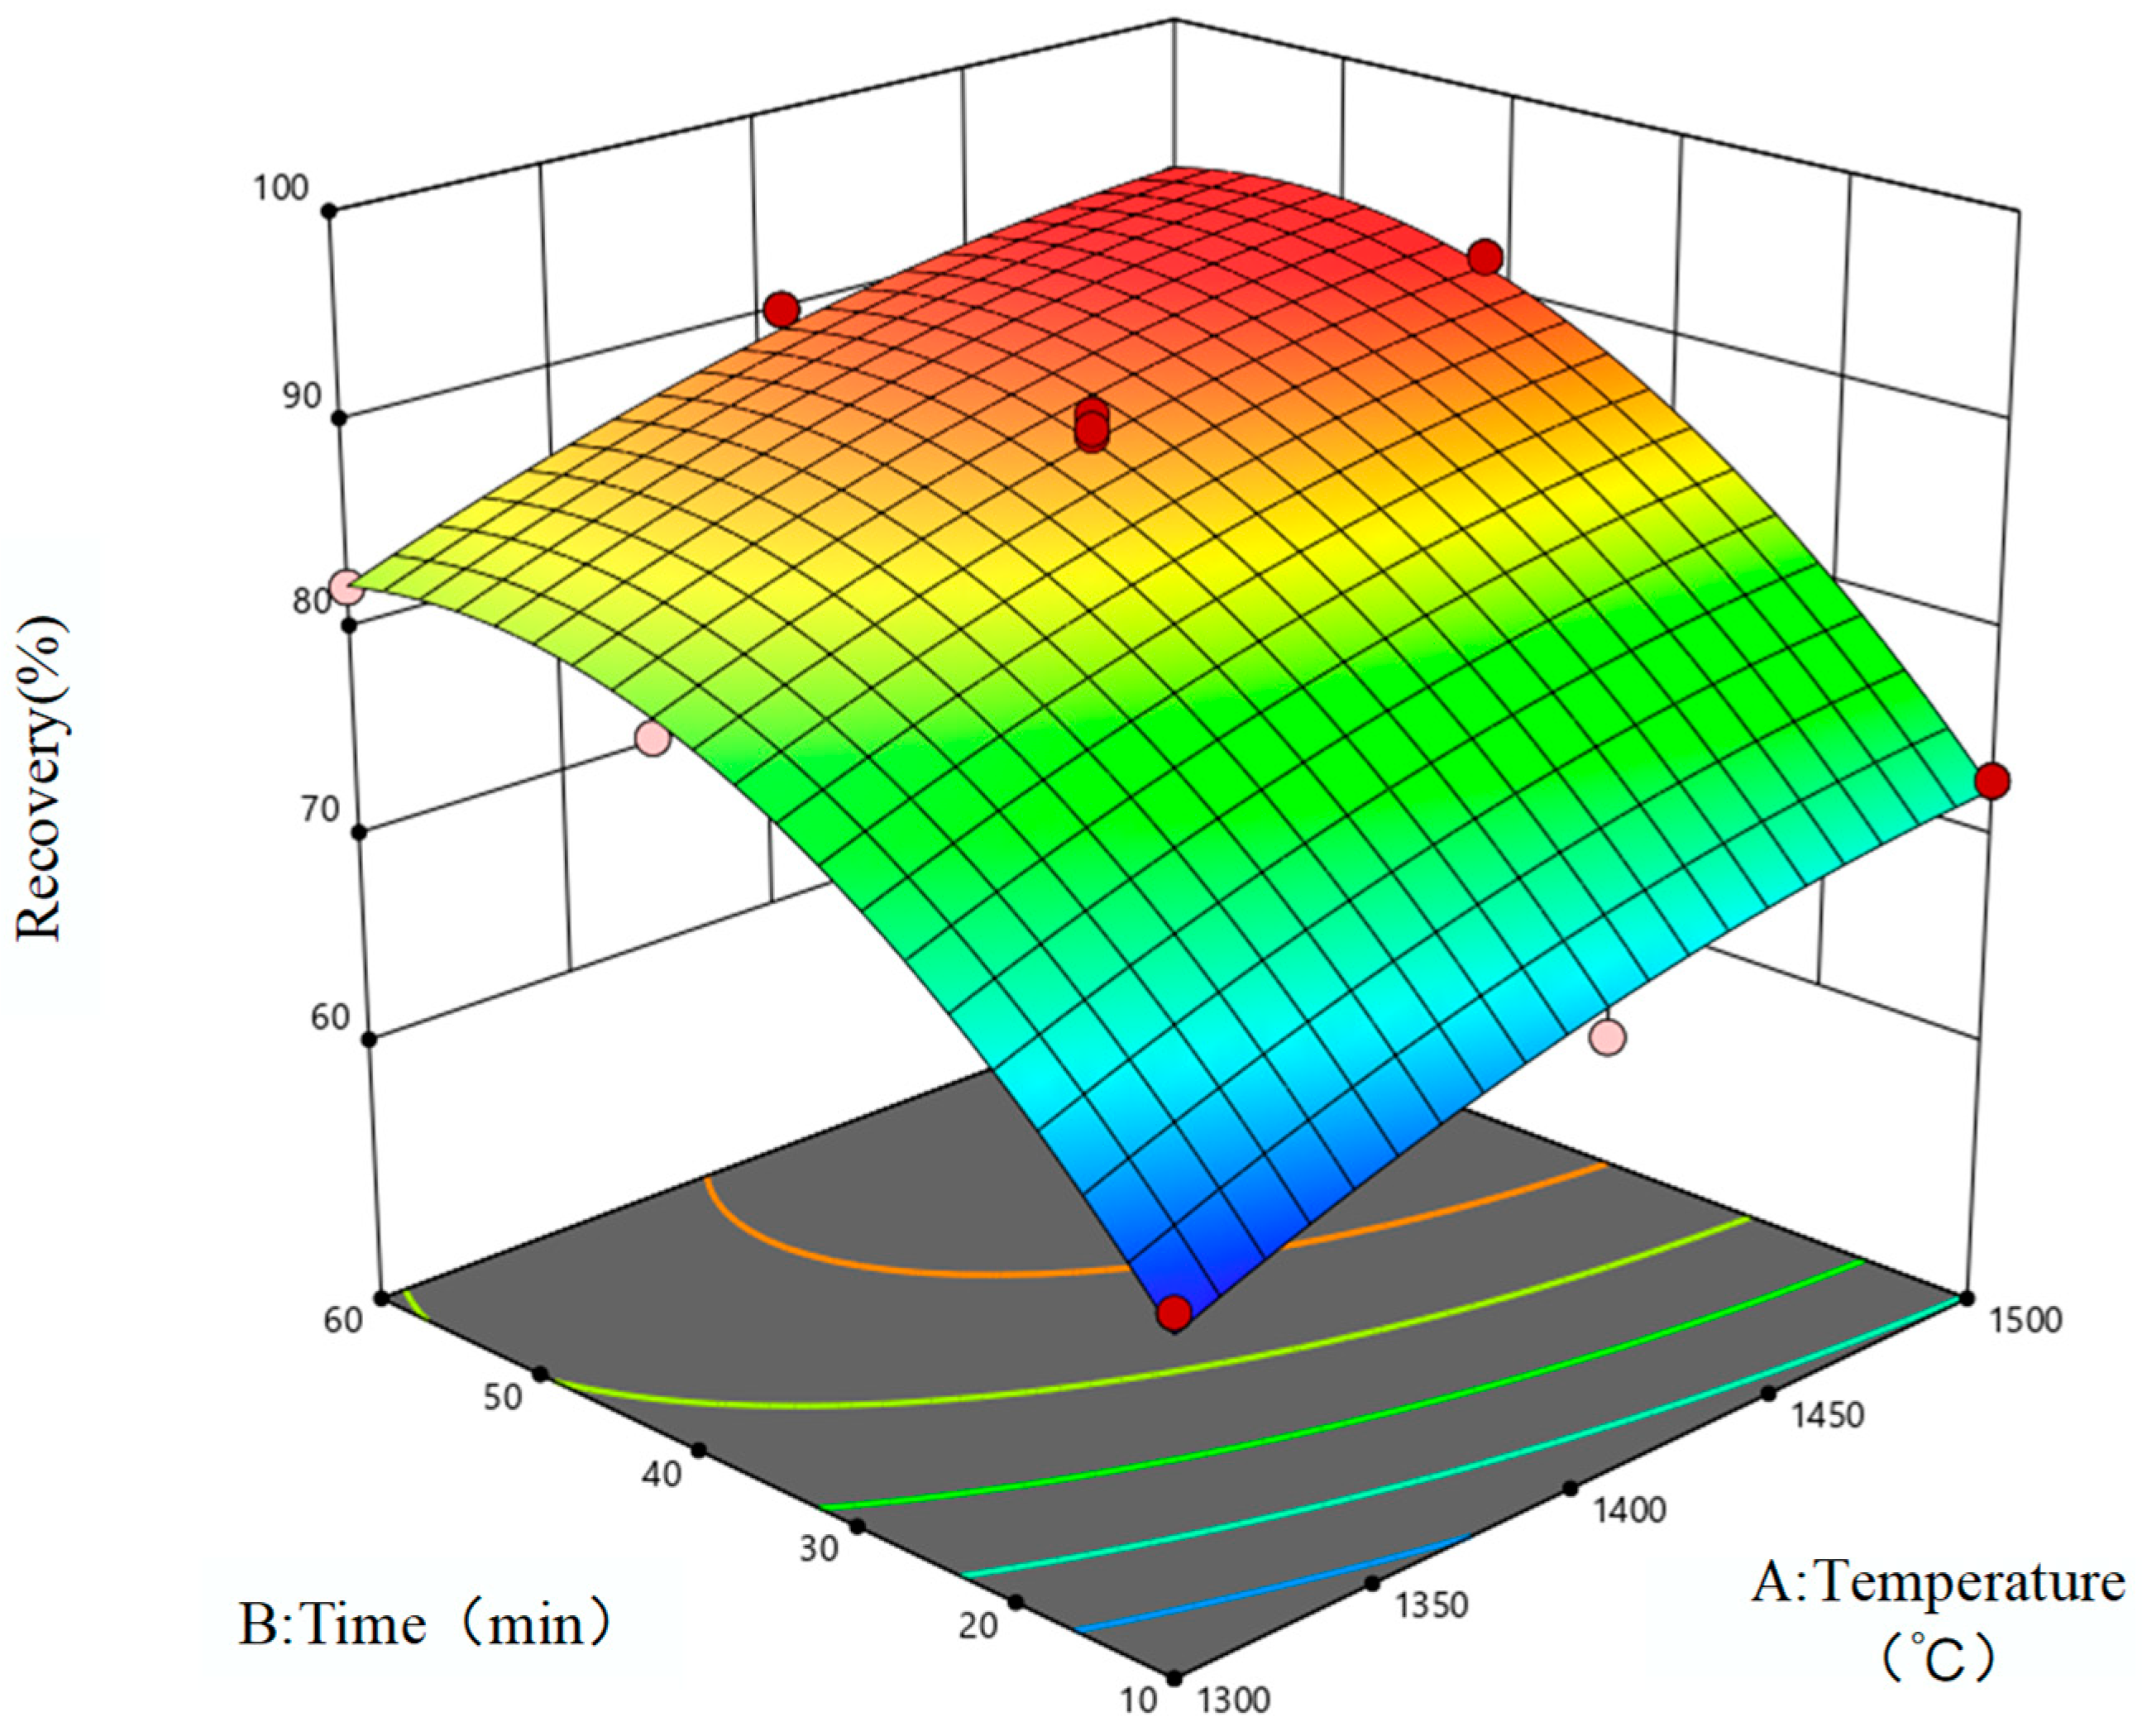
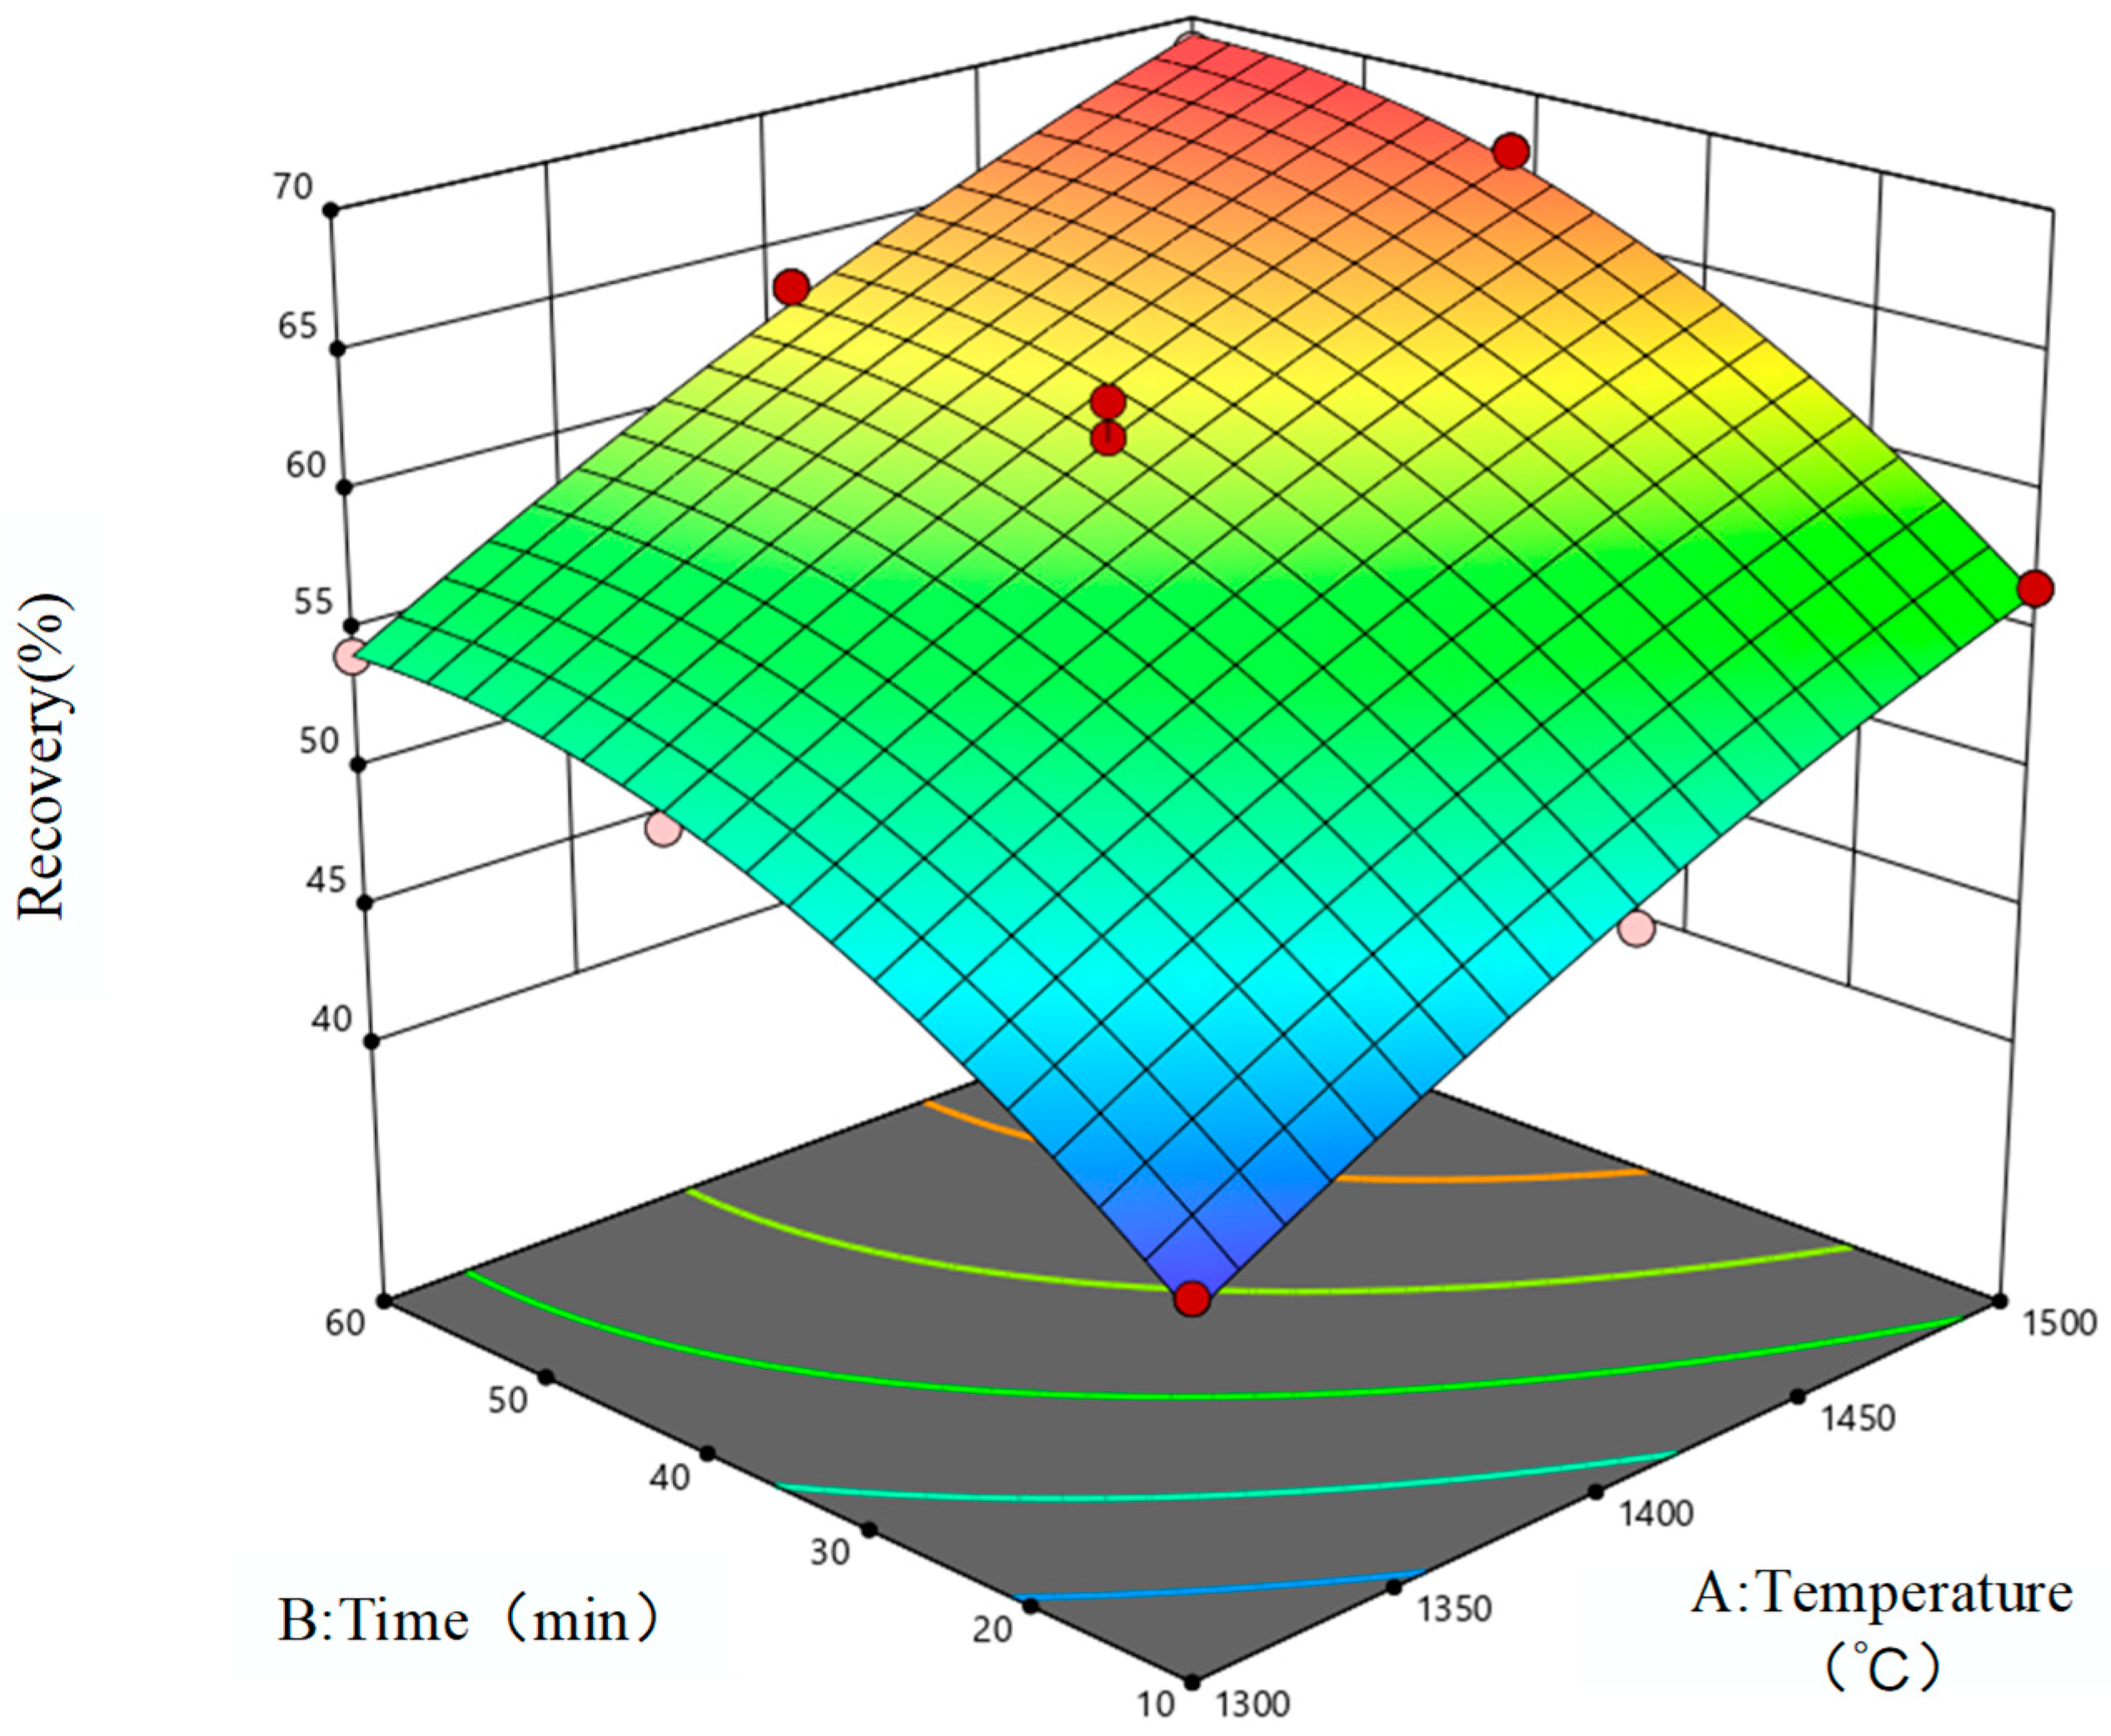
3.1. Response Surface Model

The RSM design model was used to analyze the reduction results of iron oxides and vanadium oxides in VTM. The response parameters studied were the reduction rates of iron oxides and vanadium oxides in the experimental results. The second-order polynomial in software Design-Expert 13 was used to fit and analyze the physical experiment result data. The second-order polynomial equation is shown in Equation (1). In this study, carbon was used as the reducing medium, and reduction temperature and reduction time were the influencing factors. The response models of iron and vanadium oxides were fitted, as shown in Table 5.
Y = β0 + β1A + β2B + β12AB + β11A2 + β22B2
where
  • Y: calculate model response parameters, %;
  • A: reduction temperature, °C;
  • B: reduction time, min.

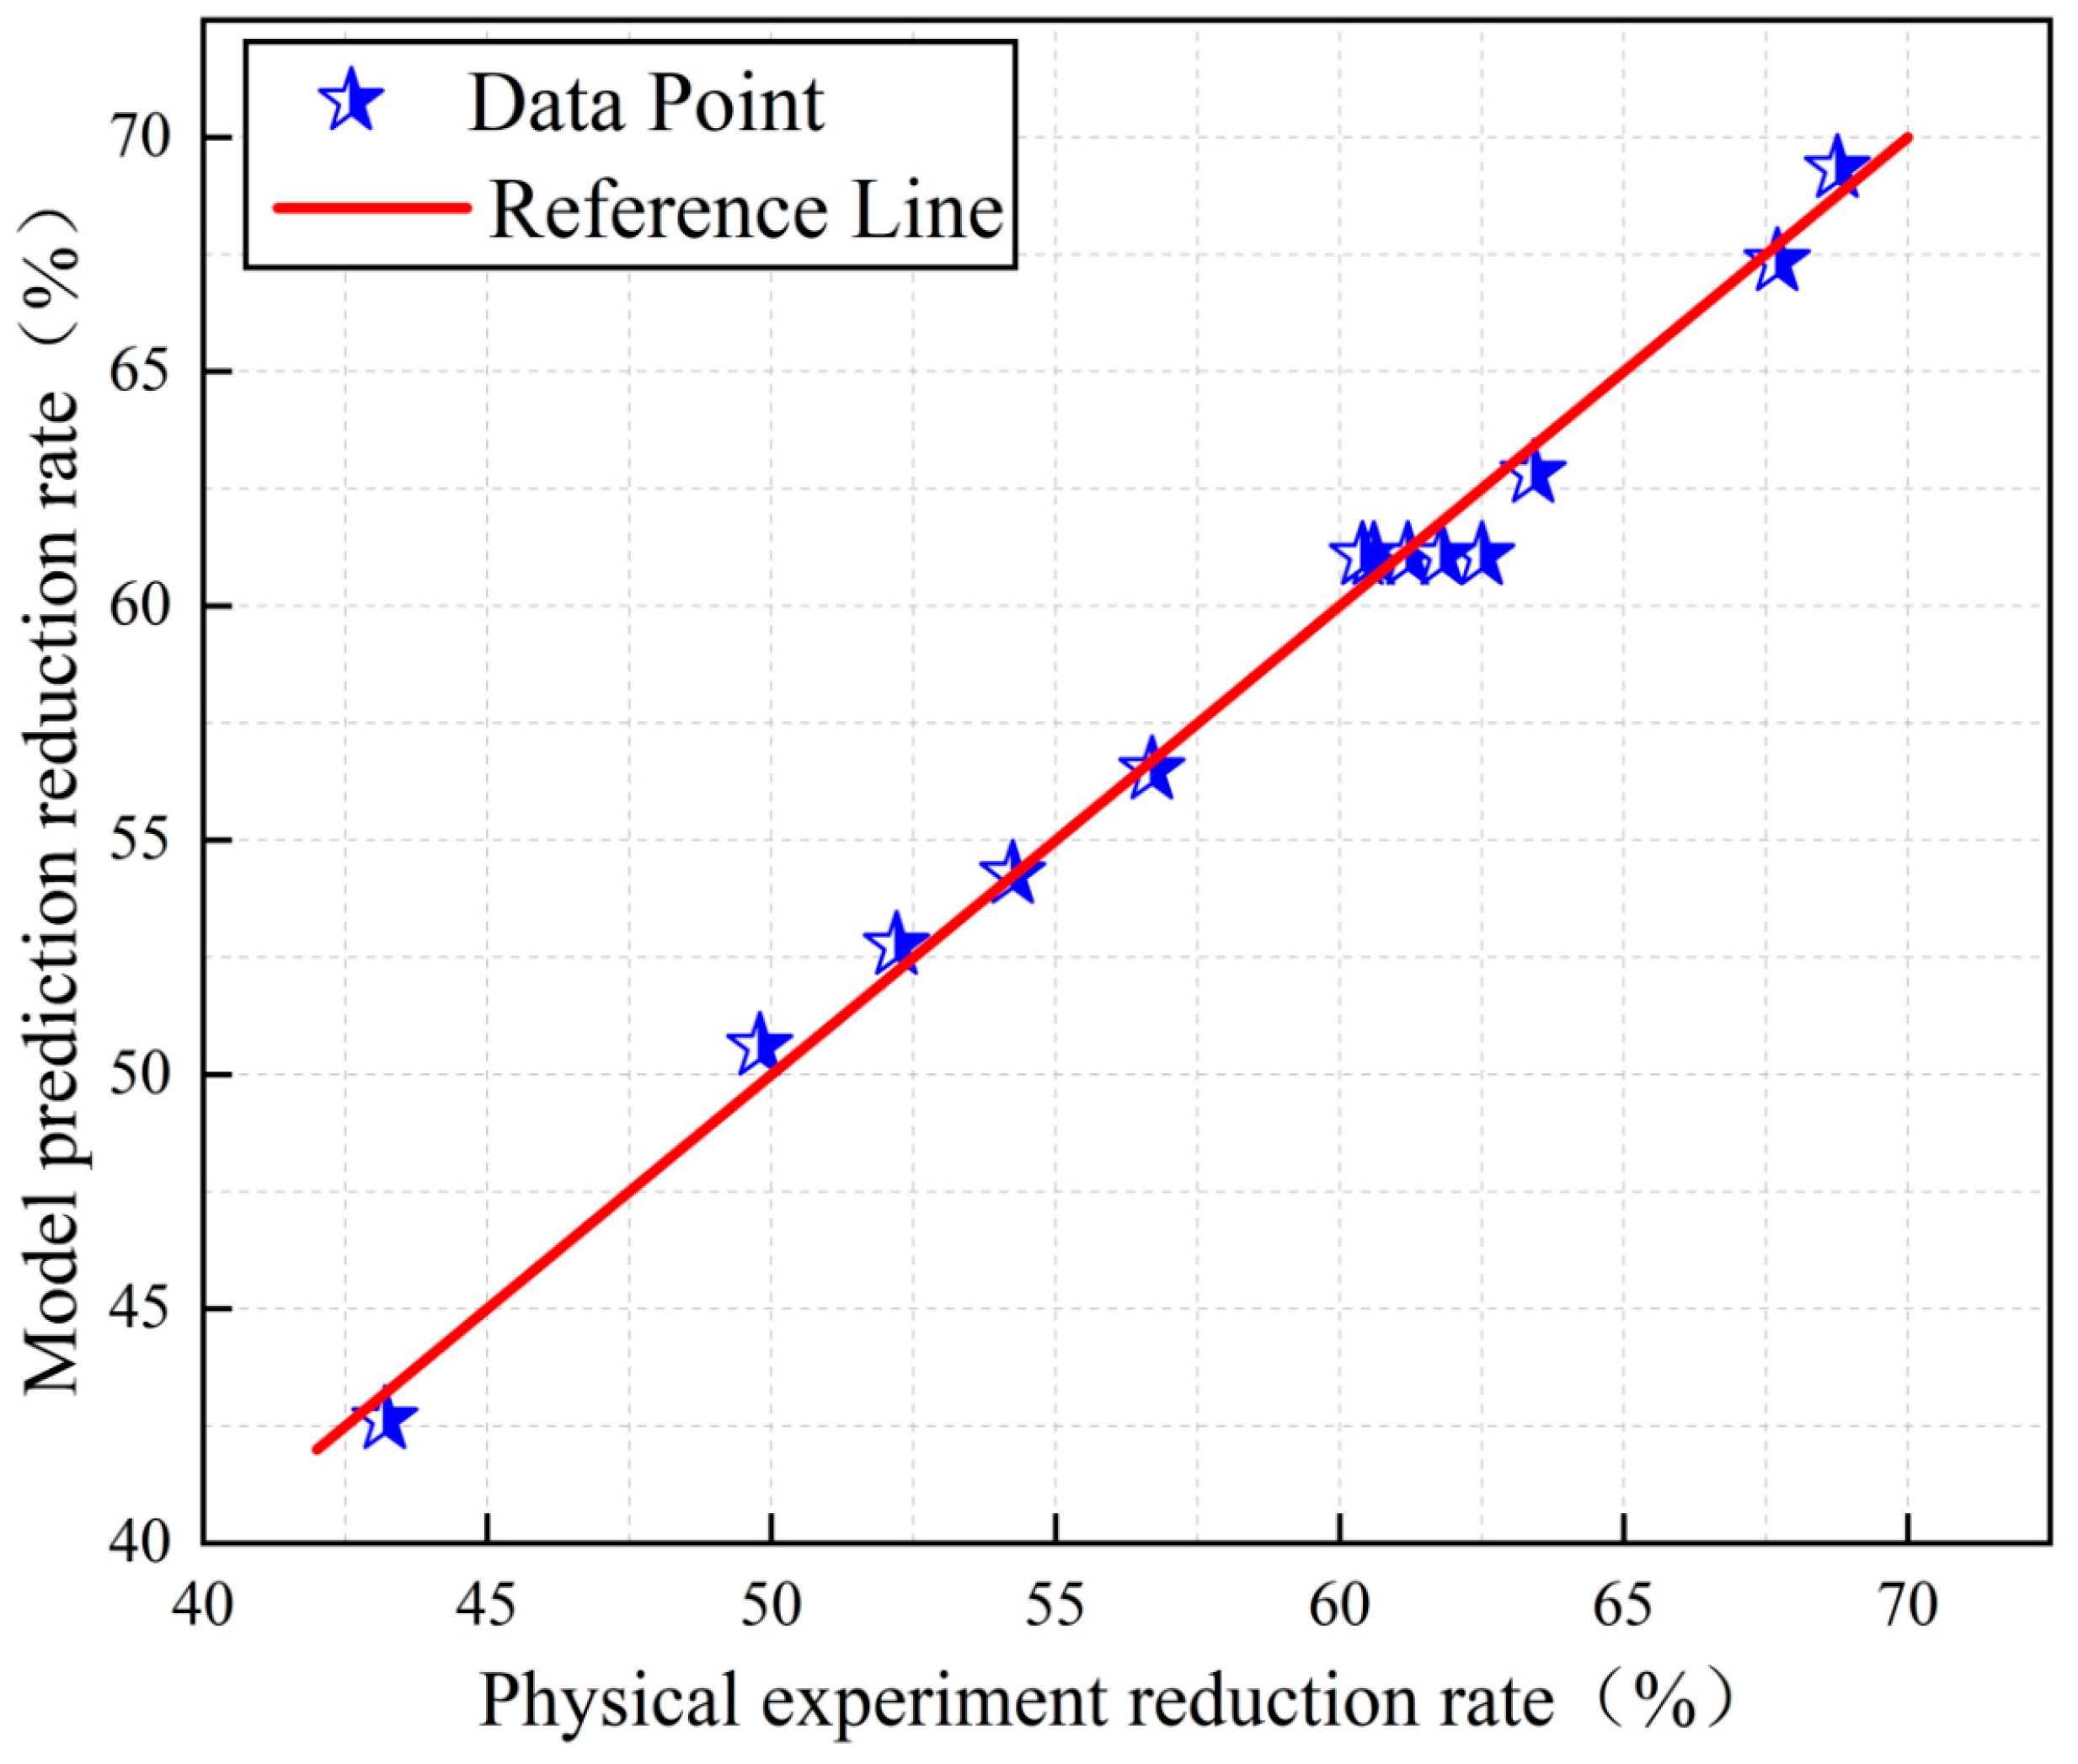
3.2. Response Surface Model Evaluation and Analysis

Table 6 shows the Anova results of the central composite design (CCD) prediction model, including the mean, standard deviation, coefficient of variation (CV), fit (R2), adjusted R2, and predicted R2. It can be seen from the data in the table that the fitting correlation coefficients R2 are all greater than 0.99. When the value of R2 is closer to 1, it indicates that the prediction model fits better and the prediction accuracy is higher [27]. The fitting model of the regression equation in this study can satisfy more than 99% of the response changes, indicating that the experimental data can better reflect the corresponding relationship between the factors and the reduction rate of the predicted results. The adjusted R2 values are all greater than 0.98, indicating that the model can explain more than 98% of the response value variation. The difference between the adjusted R2 values and the predicted R2 values in the table is small, which indicates that the obtained model can better express the actual situation. The coefficient of variation (CV %) is used to represent the degree of dispersion of the data. It can be seen from the data in the table that the coefficients of variation are all less than 1.5, indicating that the fitted model has high accuracy.
In order to ensure that the predicted value given by the final fitting model is accurate enough, it is necessary to analyze and evaluate the fitting model. The reliability of the model and the accuracy of the prediction are proved mainly through analysis of variance and error analysis, and the adaptability of the model in the prediction process is confirmed by the residual distribution. In the analysis of variance, the significance of each parameter in the quadratic equation can be tested. Table 7 shows the analysis results of the RSM model. F-value in the table refers to the ratio of the mean square of the model to the mean square of the residual, and p-value is the probability value related to the F-value of the model, which is used to indicate the probability of obtaining the F-value when the model has no influence on the response surface. In general, when the p-value is less than 0.01, it indicates that the item is highly significant. When the p value is less than 0.05, it indicates that this item is significant; however, when the p value is greater than 0.05, it indicates that this item is not significant. By analyzing the data in Table 7, we can see that the p-values of the response surface model corresponding to reduced iron oxides and vanadium oxides are less than 0.0001, and the F-values are 150.05 and 176.19, respectively. The larger the F-value and the smaller the p-value, the higher the significance of the prediction model. Two prediction models of oxide reduction established in this paper have influence on the response surface, but the influence degree is less than 0.01%. Therefore, the p-value results feedback from the prediction model indicate that the prediction model corresponding to reduced iron oxides and vanadium oxides in this study has a very high reliability. In addition, it can be intuitively seen from Table 7 that the reduction temperature and reduction time have a significant impact on the prediction results of the model, and their p-values are both less than 0.0001. In Table 7, df is the degree of freedom, indicating the number of unrestricted variables in the prediction model. And its value is five, indicating that there are five influencing factors considered in the model.
Figure 3 and Figure 4 show the distribution of the true and predicted values corresponding to iron and vanadium oxides, respectively. The 13 data points in the figure represent 13 experimental data values. As can be seen from the figures, there is a high agreement between the reduction rates of iron and vanadium oxides predicted by the model and the reduction rates obtained by the physical experiment. All data points are distributed on or around the line y = x, indicating that the predicted values are basically consistent with the real values which further proves the applicability of the established model and the accuracy of the prediction results.
The response surface is used to represent the influence of reduction temperature and reduction time on the reduction rate of iron oxides and vanadium oxides in VTM. The two-dimensional contour lines are shown in Figure 5, and the three-dimensional response surfaces are shown in Figure 6 and Figure 7. When the quadratic regression model is used for analysis, the three-dimensional response surface and two-dimensional contour map are known as visualization tools which can intuitively understand the response of each variable as well as the relationship between the variable and the experimental level, and can also accurately capture the interaction between the two test variables. If the contour lines show a regular circle shape, it indicates that there is almost no obvious interaction between the corresponding variables and the correlation degree is negligible. On the contrary, if the contour lines are elliptical, it indicates that there is a more significant interaction relationship between the relevant variables. As can be seen from Figure 5, the contours corresponding to the reduction rates of the two oxides are close to ellipsoid, indicating that there is a significant interaction between reduction temperature and reduction time and that these two factors are crucial to the magnitude of the impact of the reduction rate of metal oxides, which is consistent with the correlation analysis results of the influencing factors in Table 7. Therefore, in order to further improve the reduction rates of metal oxides in low-grade VTM in the actual production process, the reduction temperature and reduction time should be considered as the primary factors.
As can be seen from Figure 6 and Figure 7, the three-dimensional surface is relatively steep, and the reduction rates of iron oxides and vanadium oxides gradually increase with the increase in reduction temperature and reduction time. When the reaction temperature and time were further increased, the reduction rate of iron oxides tended to be stable, and the reduction rate showed a downward trend as the reduction temperature and time continued to increase. It is concluded that the increase in temperature is beneficial to the reduction of iron oxides in VTM with carbon, but with a gradual increase in temperature the effect of promoting reduction will be weakened due to some obstructing effects. This hindrance is reflected in the fact that high temperature causes SiO2 and iron oxides in VTM to form fayalite and other substances. At a high temperature, fayalite will form a liquid-phase diaphragm layer on the surface of the mineral which hinders the maximum process of the reduction reaction. In addition, with the extension of reduction time iron oxides are gradually consumed, and a large amount of reducing agents are consumed in the early stage resulting in a lower concentration of reducing agents. Therefore, with the progress of the reduction reaction, the reduction rates of metal oxides in VTM grow slowly in the later stage and even have a trend of decline. Reasonable control of reduction temperature and reduction time is of great benefit to improving the reduction economy.
It can be clearly seen from Figure 7 that in the VTM system adopted in this study the reduction rate of vanadium oxides is significantly lower than that of iron oxides. This is mainly due to the following two factors: first, the content of vanadium oxides in VTM is much lower than that of iron oxides; second, compared with vanadium oxides, the reactivity between iron oxides and the reducing medium carbon is higher, which makes the reduction rate of vanadium oxides relatively slow. With the advancement of the reduction process, the temperature continues to rise, the time continues to increase, the concentration of reducing agent gradually decreases, the reaction is basically completed, and the system gradually tends to a stable state.

3.3. Model Optimization

According to the above adaptability and accuracy evaluation and analysis of the prediction model, it is concluded that the prediction model can well predict the reduction recovery rates of metal oxides in iron fine powder. However, due to the different affinity between various metal elements and oxygen elements in iron fine powder, it shows that the ability and amount of oxygen absorption of the reducing medium are different when the reducing medium is reduced by a sufficient amount. Therefore, under the same reduction temperature and reduction time, the reduction recovery rates of iron and vanadium are different. In order to maximize the reduction rates of both metal elements under the same influence factors, it is necessary to optimize the variable parameters of the final fitting model. The two variable parameters corresponding to the maximum reduction rate of iron and vanadium metal oxides were fitted to ensure the maximum reduction recovery of metal oxides within the range of the two variable parameters. The range of the two variable parameters and the optimal value of metal oxides reduction recovery rate were selected as the maximum value, and a maximum value that could not be reached in the test was set to ensure the accuracy of the optimization results. The results show that when the reduction temperature is 1446 °C~1498 °C and the reduction time is 43 min~60 min, the maximum reduction rate of iron oxides in iron ore can reach 92.93%, while the maximum reduction rate of vanadium oxides can reach 69.20%. These two variable parameters are the best operating conditions for maximizing the reduction recovery of iron and vanadium oxides at the same time. The response surface method provides theoretical data support for the actual industrial production.

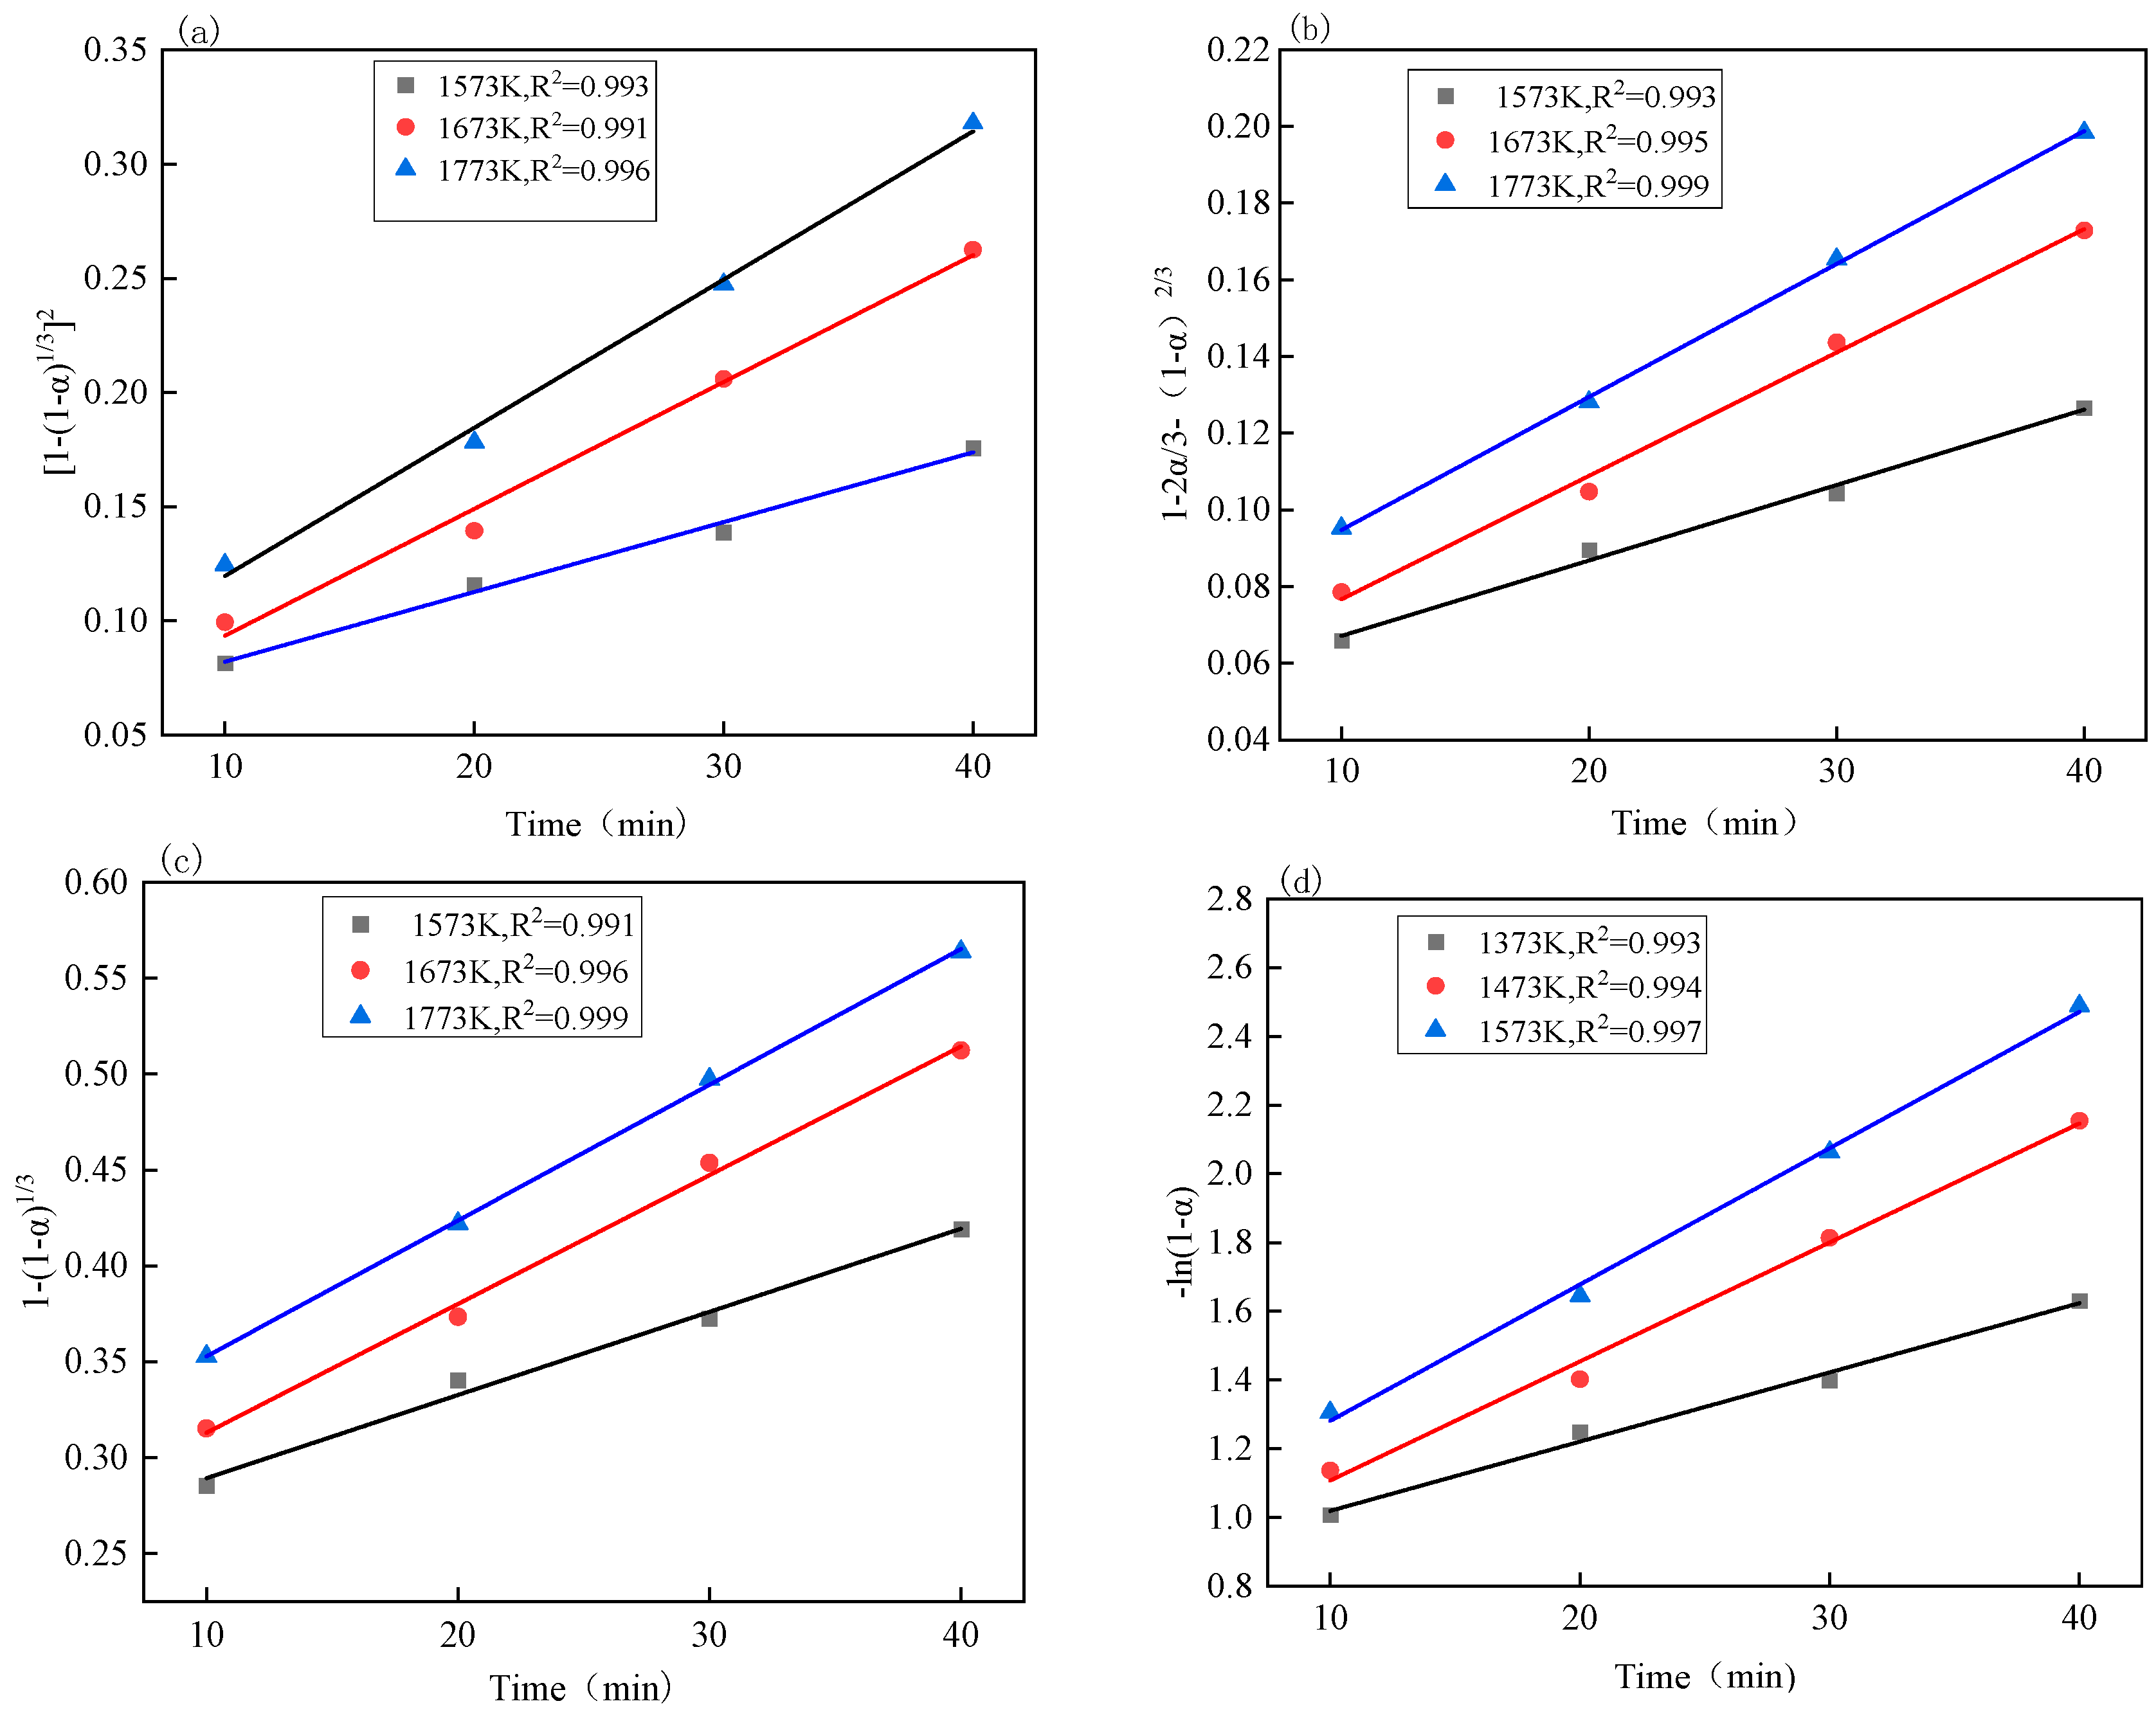
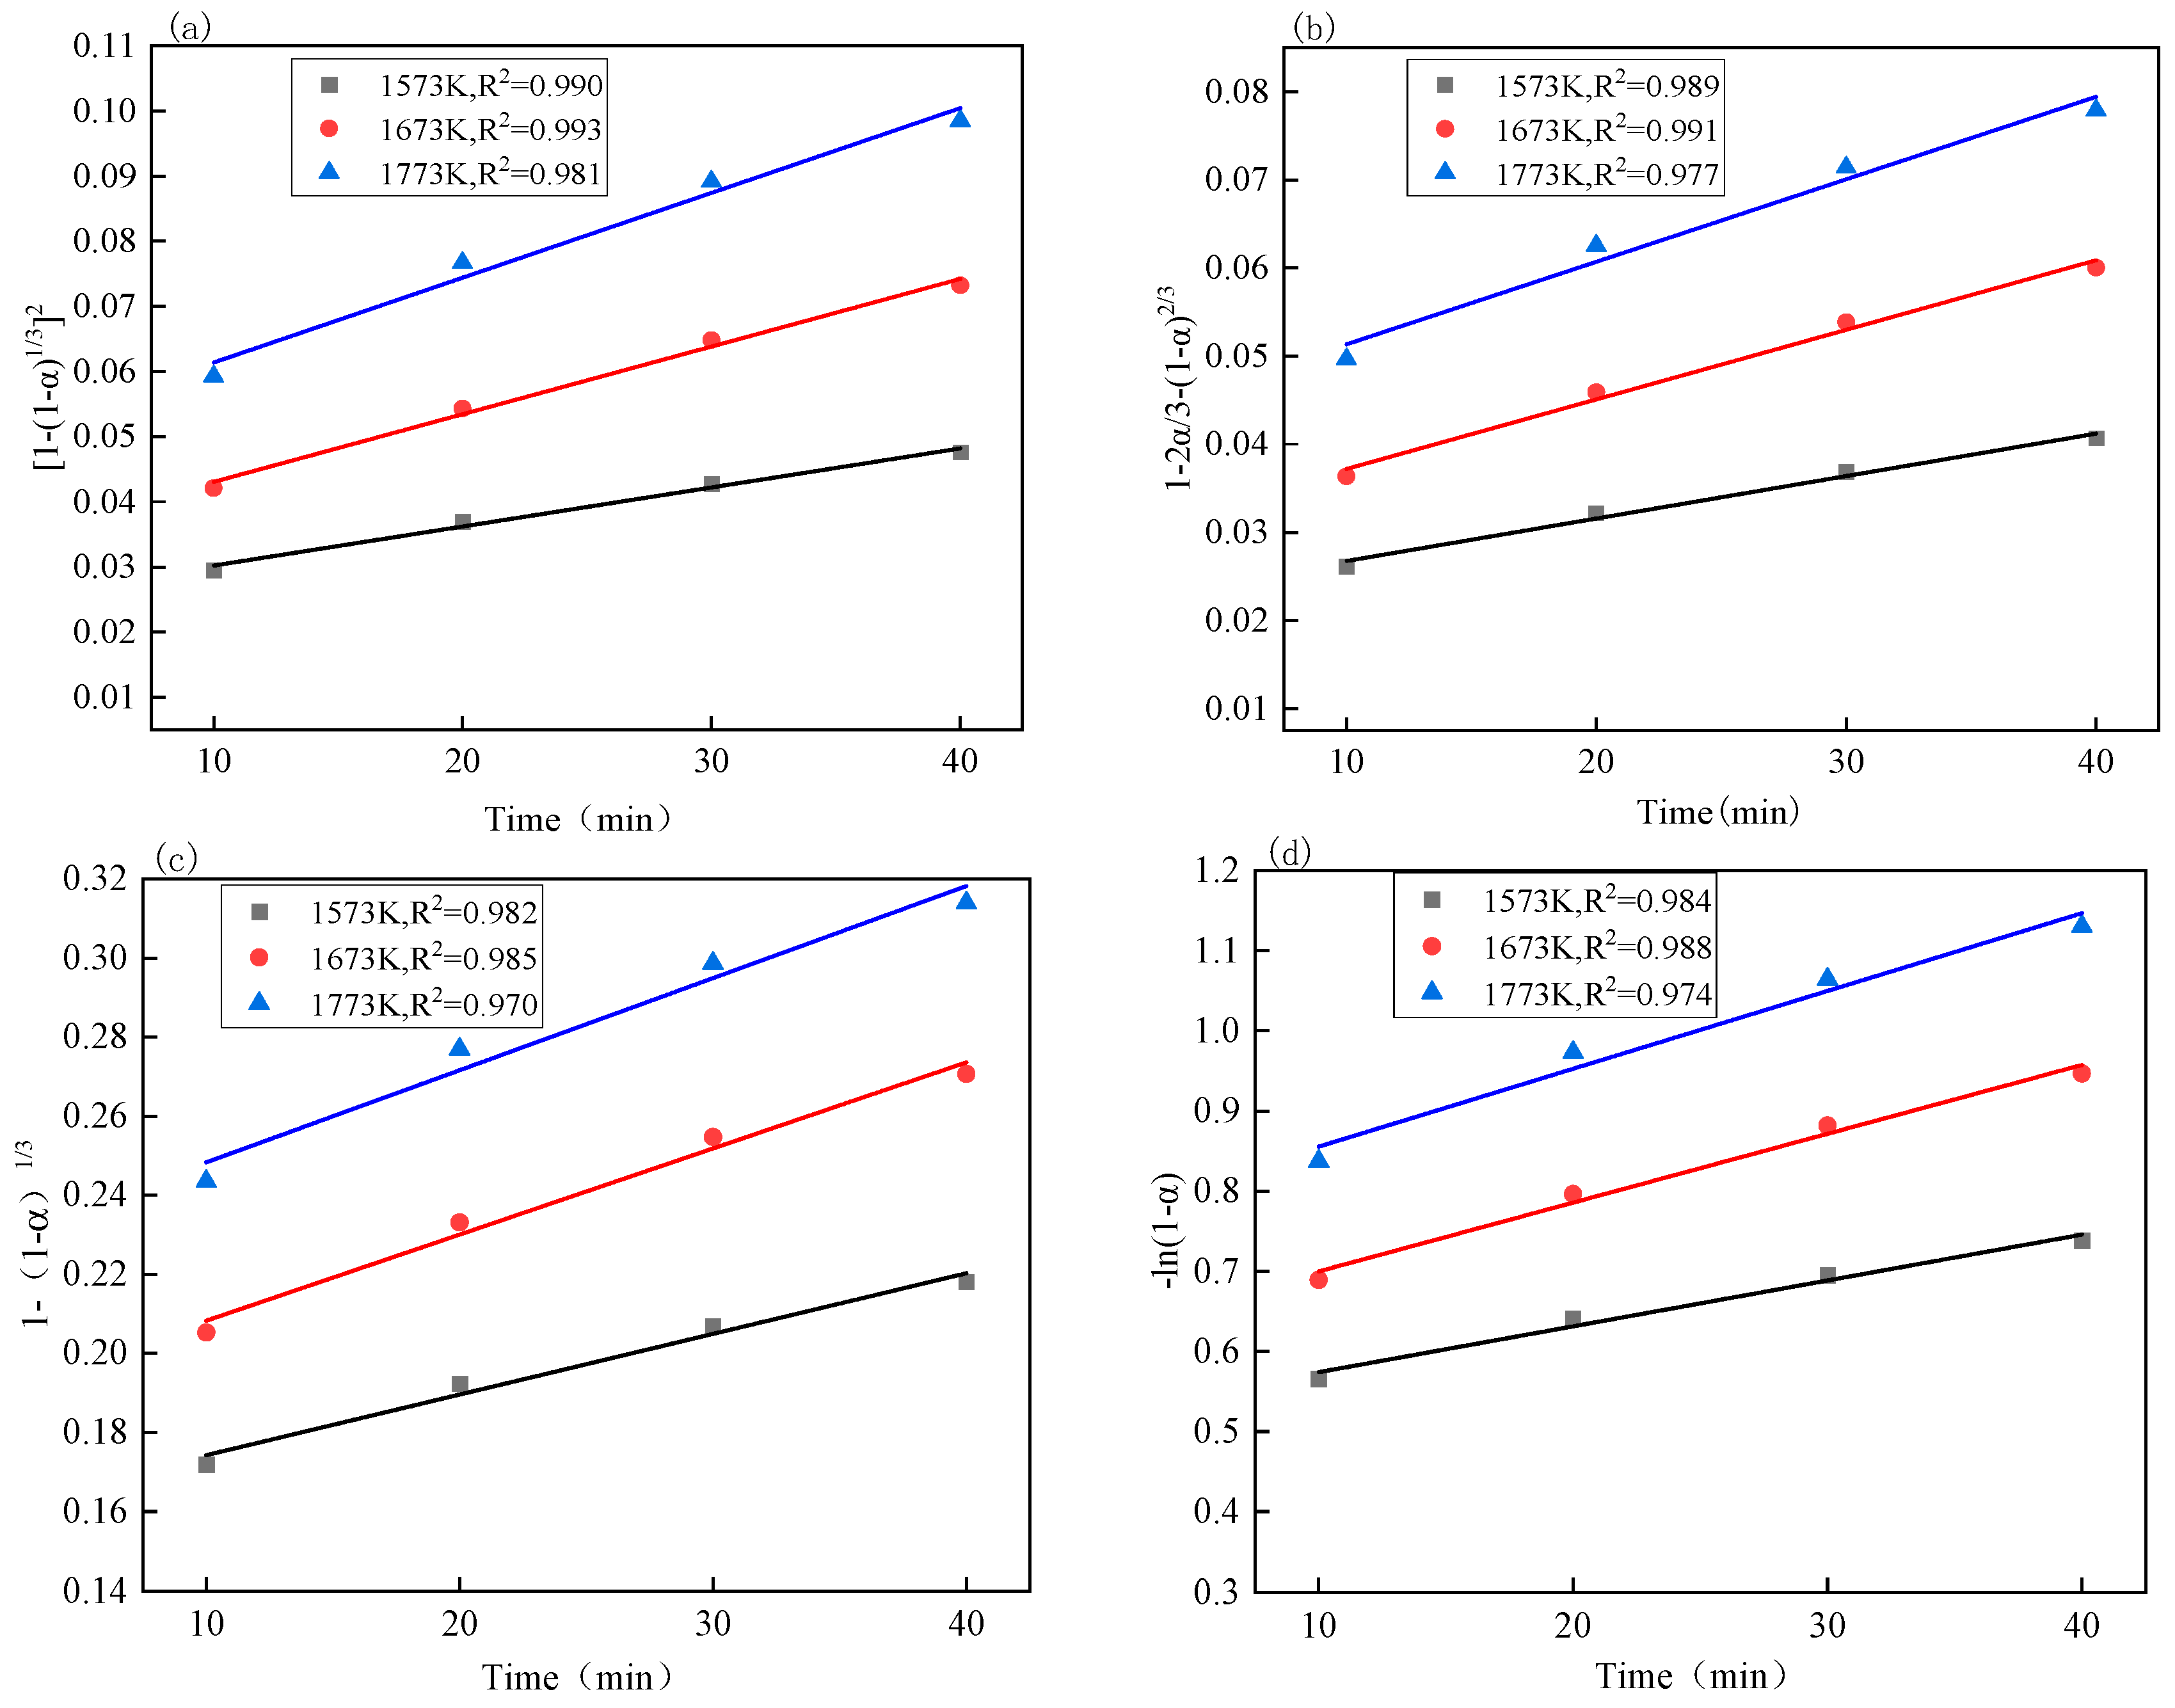
3.4. Reaction Kinetics Analysis

This section mainly explores the reduction reaction kinetics of iron and vanadium oxides in VTM under the conditions of carbon as the reducing agent, a reduction temperature of 1573 K, 1673 K, and 1773 K, and a reduction time of 10–40 min. The reduction rates corresponding to each reduction temperature and each reduction time are obtained by the above prediction model. In this section, the influence of reduction time and temperature parameters on the accuracy of the model prediction of the reduction recovery rates are further expounded through the analysis of the kinetic conditions of the reduction reaction.
The reduction reaction of vanadium–titanium magnetite belongs to the heterogeneous reaction, and its reduction reaction kinetics belongs to the category of heterogeneous reaction kinetics [28,29]. The kinetic analysis of this process is conducted, and the kinetic Equation (2) is as follows:
G α = 0 α d α f α = 0 t k T = k T t
where
  • f α : reaction mechanism function;
  • G α : the integral form of the reaction mechanism function;
  • t : reaction time, s ;
  • k T : reaction rate constant, s 1 .
At present, there have been many achievements in previous studies on reaction mechanism functions, such as the phase-boundary reaction, diffusion model, chemical reaction model, etc. Here are the common kinetic reaction mechanism function models [30,31,32,33,34], as shown in Table 8. Through calculation, the relationship between each kinetic equation and temperature under different reaction temperature conditions was obtained, as shown in Figure 8 and Figure 9, and the reaction rate constant k of the kinetic equations was obtained through fitting [35,36,37].
In order to further determine the controlling link of the reduction process of iron and vanadium oxides, the apparent activation energy of the reduction process is calculated according to the Arrhenius formula [38,39,40]. The relationship between the reduction reaction rate and the reduction reaction temperature is shown in Equations (3) and (4). This is done through linear fitting and the results are shown in Figure 10. The apparent activation energy E can be obtained according to the slope of the image, and the apparent activation energy corresponding to each kinetic equation is shown in Table 9 below. Equations (3) and (4) are as follows:
k T = A exp E R T
by deformation:
ln k T = E / R T + ln A
where
  • A: pre-exponential factor, s−1;
  • E: apparent activation energy, kJ/mol;
  • R: standard molar gas constant, 8.314 J/(mol·K);
  • T: temperature, K.
By comparing Figure 10, it can be seen that the fitting effect of the above four kinetic equations is good, and that the R2 is greater than 0.99 when the temperature is 1573 K~1773 K. It can be seen from Table 9 that the apparent activation energy corresponding to the equation 1 ( 1 α ) 1 / 3 2 is larger than that of the equation 1 ( 2 α / 3 ) ( 1 α ) 2 / 3 , 1 ( 1 α ) 1 / 3 , and ln ( 1 α ) and that according to the principle that the higher activation energy should be the control link of the entire reduction process, the reduction process of iron oxides is more consistent with the equation 1 ( 1 α ) 1 / 3 2 , which shows that the diffusion in the gas is the control link.
Combined with Figure 10 and Table 9, it can be seen that the reduction process of vanadium oxides has a better fitting effect in the kinetic equation 1 ( 1 α ) 1 / 3 2 and the apparent activation energy is the largest. Therefore, the reduction process of vanadium oxides in VTM is controlled by diffusion in the gas body, which conforms to the equation 1 ( 1 α ) 1 / 3 2 .
According to the above analysis, it can be seen that in the reduction process the reduction mechanism of iron oxides and vanadium oxides in VTM is that iron oxides and vanadium oxides first react with carbon to produce a large amount of CO, and CO continues to react with metal oxides to produce CO2 through diffusion. Since the reduction processes of iron oxides and vanadium oxides in VTM are both controlled by gas diffusion, with the progress of the reduction reaction the bond layer generated by the reaction will hinder the diffusion rate of the reaction, which also verifies the conclusion that the response surface model predicts that the reduction rate will first increase and then decrease. Therefore, it can be seen that the results of the reduction rate prediction based on the response surface model are also in line with previous research rules and results, which also shows the applicability and reliability of the response surface prediction model.

3.5. Analysis of Microscopic Characteristics of Reactive Slag

Based on the results of the physical experiments, the microscopic characteristics of the samples obtained after the experiments were analyzed so as to find the main reasons for the response surface model to predict the first rise and then fall of iron and vanadium oxides reduction. Figure 11 shows the SEM microstructure of iron concentrate powder after beneficiation of low-grade VTM. It can be seen that the shape characteristics of various minerals in the iron fine powder are different, and irregular shapes such as blocky and powdery particles appear. EDS stratification shows that the main components of iron fine powder in VTM are iron and oxygen, that the total iron content reaches 65.9%, and that there are trace titanium and vanadium elements, which is basically consistent with the previous XRD analysis results.
Under the condition of a reaction temperature of 1773 K and a reaction time of 40 min, the same quality VTM iron fine powder was used to react with a sufficient amount of reducing agent carbon, and the slag after the same amount of the reaction was taken for SEM detection. The EDS scanning results are shown in Figure 12. It can be seen from Figure 12 that there are still particles in the molten slag after the reaction, but the particle size is much smaller than that of the original iron fine powder. The energy spectrum shows that the particles are composed of Si, Ca, O, and Al. This shows that the reduction medium carbon powder reacts fully with the metal oxides in the iron fine powder, but because of the reaction between Si, Ca, Al, O, and other elements at high temperature the high-melting-point silicate or magnesium aluminate is wrapped in the original iron fine powder particles, resulting in the reduction trend of at first a rise and then a decline in the whole reduction cycle. Therefore, in the actual production process, the reducing medium should be fully in contact with the iron powder to improve the cycle reduction efficiency. EDS stratification also showed that Fe, Ti, V, and O elements still existed in the reactive slag and that these metal oxides were not completely reduced in the state of a sufficient reducing medium. This also indicated that simply increasing the reaction temperature, delaying the reaction time, and ensuring sufficient reducing medium could not further improve the reduction efficiency of metal oxides, and even showed a downward trend. This also verifies the accuracy of the response surface model to predict the reduction rate. The slag stratification test also shows that when the mass fraction of titanium element per unit area is high, the mass fraction of iron element is often high, which is because the existence of titanium element will improve the stability of adjacent oxygen atoms and increase the difficulty of reduction. Therefore, high-titanium–vanadium titanium magnetite often has an adverse effect on the reduction process of iron oxides, resulting in unsatisfactory results of Ti-Fe separation.

4. Conclusions

(1) The prediction model of reduction rates of iron and vanadium oxides in low-grade VTM were obtained using the response surface method. The evaluation results of the response surface prediction model show that the correlation fitting coefficient and adjusted fitting coefficient of the model are greater than 99% and 98%, respectively, indicating that the response surface model has high accuracy. The analysis of variance shows that the F value in the prediction model of iron oxides reduction rate and vanadium oxides reduction rate is 150.05 and 176.19, respectively, while the p value is less than 0.0001, which proves the reliability of the model. The real and predicted values corresponding to the reduction rates of iron and vanadium oxides meet the linear relationship, which further proves the applicability of the model, and the response surface results prove that the reduction temperature and reduction time have significant effects on the reduction rates.
(2) Through the parameter optimization of the response surface prediction model, it is concluded that when the reduction temperature is 1446 °C~1498 °C and the reduction time is 43 min~60 min, the maximum reduction rate of iron oxides in iron ore can reach 92.93% while the maximum reduction rate of vanadium oxides can reach 69.20%. These two variable parameters are the best operating conditions for maximizing the reduction recovery of iron and vanadium oxides at the same time.
(3) The kinetic analysis shows that the kinetic models of the reaction of iron and vanadium oxides in VTM at the temperature of 1573 K–1773 K is a three-dimensional diffusion model, and the corresponding kinetic equation is as follows: 1 ( 1 α ) 1 / 3 2 . The apparent activation energies of iron and vanadium oxides are 86.76 kJ/mol and 90.30 kJ/mol, respectively.
(4) The response surface model predicted that the reduction rate of iron and vanadium oxides would first increase and then decrease. The microscopic analysis of molten slag after the reaction found that although the reducing medium reacted fully with metal oxides in iron fine powder, the original iron fine powder particles were wrapped by silicate or magnesium aluminate with a high melting point, which is formed between Si, Ca, Al, O, and other elements at high temperature. This results in the trend that the reduction rises first and then falls over the whole reduction cycle. This shows that simply increasing the reaction temperature, delaying the reaction time, and ensuring sufficient reduction medium cannot maximize the reduction efficiency of metal oxides, and can even cause a downward trend.

Author Contributions

A.D.: Writing-review and editing, and funding acquisition. X.J.: Writing—original draft, methodology, formal analysis, and software. H.W.: Writing—original draft, methodology, formal analysis, and software. All authors have read and agreed to the published version of the manuscript.

Funding

The authors would like to express their appreciation to the National Natural Science Foundation of China (No. 52074001) and the University Natural Science Research Project of Anhui Province (KJ2020ZD25).

Data Availability Statement

The original contributions presented in this study are included in the article. Further inquiries can be directed to the corresponding author.

Conflicts of Interest

The authors declare that they have no known competing financial interests or personal relationships that could have appeared to influence the work reported in this paper.

References

  1. Zagainov, S.A.; Smirnov, L.A.; Zazhigaev, P.A.; Mironov, K.V.; Forshev, A.A. Improvement of Technology for Processing Vanadium-Containing Titanomagnetites. Steel Transl. 2021, 50, 882–887. [Google Scholar] [CrossRef]
  2. Zhang, L.H.; Yang, S.T.; Tang, W.D.; Yang, H.; Xue, X.X. Effect of coke breeze content on sintering mechanism and metallurgical properties of high-chromium vanadium-titanium magnetite. Ironmak. Steelmak. 2019, 47, 1–7. [Google Scholar] [CrossRef]
  3. Kurniawan, K.; Lee, H.; Bae, M.; Jong, W.C.; Sookyung, K. Intensified extraction of vanadium from vanadium-bearing titanomagnetite (VTM) concentrate via one-stage leaching and solvent extraction using acidic organophosphorus extractant. Miner. Eng. 2024, 217, 108961. [Google Scholar] [CrossRef]
  4. Ou, Y.; Sun, Y.S.; Yu, J.W.; Li, Y.J. Research status and development prospect of utilization of vanadium-titanium magnetite. J. Iron. Steel Res. 2021, 33, 267–278. [Google Scholar] [CrossRef]
  5. Wang, X.Y.; Zhao, H.Q.; Qi, Y.H.; Wang, F. Research and development for direct reduction of vanadium-bearing titanomagnetite. China. Metall. 2024, 34, 1–8+51. [Google Scholar] [CrossRef]
  6. Zhang, S.; Zong, Y.B.; Huang, Y.; Lei, D.; Zhang, J.L.; Gan, X.; Wang, Z.Y.; Zhang, S.S.; Lu, P.Y. Investigation of Basicity on Compressive Strength and Oxidation Induration Mechanism of Vanadium–Titanium Magnetite Pellets. Steel Res. Int. 2024, 95, 2400461. [Google Scholar] [CrossRef]
  7. Zhao, W.; Chu, M.S.; Liu, Z.G.; Wang, H.T.; Tang, J.; Ying, Z.W. High-Temperature Interactions Between Vanadium-Titanium Magnetite Carbon Composite Hot Briquettes and Pellets Under Simulated Blast Furnace Conditions. Metall. Mater. Trans. B 2019, 50, 1878–1895. [Google Scholar] [CrossRef]
  8. Gao, Y.J.; Liu, R.; Yan, G.S.; Tian, P.; Liu, Y.T.; Lan, C.C.; Lv, C. Analysing the HIsmelt process for smelting vanadium–titanium magnetite. Ironmak. Steelmak. 2023, 50, 1645–1651. [Google Scholar] [CrossRef]
  9. Liu, S.S.; Guo, Y.F.; Qiu, G.Z.; Jiang, T.; Cheng, F. Solid-state reduction kinetics and mechanism of pre-oxidized vanadium-titanium magnetite concentrate. Trans. Nonferrous Met. Soc. China 2014, 24, 3372–3377. [Google Scholar] [CrossRef]
  10. Chen, F.; Li, H.; Guo, Y.F.; Liu, K.; Wang, S.; Yang, L.Z.; Wen, Y.K.; Zheng, M. Reduction disintegration behavior and crystallographic transformation of vanadium–titanium magnetite pellets during hydrogen-based reduction. J. Mater. Res. Technol. 2025, 34, 152–163. [Google Scholar] [CrossRef]
  11. Shi, Q.; Tang, J.; Chu, M.S. Optimal Process Parameters for Direct Carbothermal Reduction of Vanadium–Titanium Magnetite in a Rotary Kiln. Steel Res. Int. 2023, 94, 1–12. [Google Scholar] [CrossRef]
  12. Zhan, R.N.; Guo, Z.Q.; Zhu, D.Q.; Pan, J.; Yang, C.C.; Huang, X.Z. Co-disposal of zinc-containing slag and dust based on coal-based rotary kiln direct reduction method. J. Iron. Steel Res. 2023, 35, 219–231. [Google Scholar] [CrossRef]
  13. Shi, Y.; Zhu, D.Q.; Pan, J.; Guo, Z.Q.; Lu, S.H.; Xue, Y.X. Investigation into the coal-based direct reduction behaviors of various vanadium titanomagnetite pellets. J. Mater. Res. Technol. 2022, 19, 243–262. [Google Scholar] [CrossRef]
  14. Cheng, G.J.; Liu, J.X.; Liu, Z.G.; Chu, M.S.; Xue, X.X. Non-isothermal reduction mechanism and kinetics of high chromium vanadium-titanium magnetite pellets. Ironmak. Steelmak. 2015, 42, 17–26. [Google Scholar] [CrossRef]
  15. Qin, J.; Wang, Y.; You, Z.X.; Wen, L.Y.; Lv, X.Y. Carbonization and nitridation of vanadium-bearing titanomagnetite during carbothermal reduction with coal. J. Mater. Res. Technol. 2020, 9, 4272–4282. [Google Scholar] [CrossRef]
  16. Dishwar, R.K.; Mandal, A.K.; Sinha, O.P. Studies on reduction behaviour of highly fluxed iron ore pellets for application in steelmaking. Mater. Today Proc. 2021, 46, 1471–1475. [Google Scholar] [CrossRef]
  17. Sarkar, B.K.; Dastidar, M.G.; Dey, R.; Das, G.C. A study on isothermal reduction kinetics of titaniferous magnetite ore using coke dust, an industrial waste. Can. Metall. Q. 2019, 58, 299–307. [Google Scholar] [CrossRef]
  18. Kumar, A.; Ramadas, H.; Kumar, S.C.; Nath, A.K. Laser polishing of additive manufactured stainless-steel parts by line focused beam: A response surface method for improving surface finish. J. Manuf. Process. 2025, 133, 1310–1328. [Google Scholar] [CrossRef]
  19. Belouettar, K.; Louar, A.M. Experimental investigation of the influence of electrical discharge machining process parameters using response surface methodology. Int. J. Adv. Manuf. Technol. 2024, 135, 5287–5299. [Google Scholar] [CrossRef]
  20. Wang, Z.M.; Lu, W.B. Machining accuracy reliability optimization of three-axis CNC machine tools using doubly-weighted vector projection response surface method. Int. J. Adv. Manuf. Technol. 2024, 132, 1019–1030. [Google Scholar] [CrossRef]
  21. Box, G.E.P.; Wilson, K.B. On the experimental attainment of optimum conditions. J. R. Stat. Soc. 1951, 13, 270–310. [Google Scholar] [CrossRef]
  22. Gullón, B.; Gullón, P.; Lú-Chau, T.A.; Moreiraet, M.T.; Lema, J.M.; Eibes, C. Optimization of sol-vent extraction of antioxidants from eucalyptus globulus leavesby response surface methodology: Characterization and assess-ment of their bioactive properties. Ind. Crop. Prod. 2017, 108, 649–659. [Google Scholar] [CrossRef]
  23. Rajendran, C.; Sonar, T.; Ivanov, M.; Kumar, P.S.; Amarnath, V.; Loknandham, R. Optimization of friction stir spot welding parameters for joining dissimilar AZ31B magnesium alloy and AA6061 aluminium alloy using response surface methodology. Int. J. Interact. Des. Manuf. (IJIDeM) 2023, 19, 115–126. [Google Scholar] [CrossRef]
  24. Alexandre, E.M.C.; Araújo, P.; Duarte, M.F.; Freitas, V.D.; Pintado, M.; Saraiva, J.A. Experimental design, modeling, and optimization of high-pressure-assisted extraction of bioactive compounds from pomegranate peel. Food Bioprocess Technol. 2017, 10, 886–900. [Google Scholar] [CrossRef]
  25. Lu, X.H.; Wang, F.R.; Wang, X.X.; Lu, Y.J.; Si, L.K. A surface roughness prediction model using response surface methodology in micro-milling Inconel 718. Int. J. Mach. Mach. Mater. 2017, 19, 230–245. [Google Scholar] [CrossRef]
  26. Teferi, T.F.; Kolhe, P.K.; Tsegaw, A.A.; Fetoba, O.S. Optimization of SiC reinforced Al7039/Cu composites for enhanced thermal conductivity and hardness via response surface methodology. Mater. Res. Express 2025, 12, 015501. [Google Scholar] [CrossRef]
  27. Li, L.; Zhang, Q.; He, Q.; Hu, X.B. Application of Response Surface Methodology in Experiment Design and Optimization. Res. Explor. Lab. 2015, 34, 41–45. [Google Scholar] [CrossRef]
  28. Han, W.J.; Zhu, Y.M.; Li, W.B.; Liu, J.; Han, Y.X. Hydrogen reduction kinetics and microstructure evolution of Hainan Shilu iron ore during hydrogen-based ore phase transformation. J. Iron. Steel Res. Int. 2022, 34, 1352–1360. [Google Scholar] [CrossRef]
  29. Cheng, G.J.; Han, T.; Song, H.L.; Gao, M.L.; Yang, H.; Xue, X.X. Enhancing Reduction Separation and Efficient Recovery of Iron, Vanadium, and Titanium for Ultra-High-Titanium Magnetite. Metall. Mater. Trans. B 2024, 55, 287–300. [Google Scholar] [CrossRef]
  30. Yu, S.; Mao, R.; Wang, F.; Yao, H.W. Kinetics and reduction mechanism of high-basicity electric arc furnace dust by carbothermal reduction. J. Iron. Steel Res. Int. 2024, 36, 256–264. [Google Scholar] [CrossRef]
  31. Li, W.; Fu, G.Q.; Chu, M.S.; Zhu, M.Y. Oxidation induration process and kinetics of Hongge vanadium titanium-bearing magnetite pellets. Ironmak. Steelmak. 2017, 44, 294–303. [Google Scholar] [CrossRef]
  32. Pan, J.; Duan, Z.; Zhu, D.Q.; Guo, Z.Q.; Yang, C.C.; Cou, J.L. Kinetics of coal-based direct reduction of stainless steel dust pellets. J. Iron. Steel Res. Int. 2022, 34, 1067–1077. [Google Scholar] [CrossRef]
  33. Zhao, W.; Wang, H.T.; Liu, Z.G.; Chu, M.S.; Ying, M.W.; Tang, J. Investigation of Reduction Mechanism and Kinetics of Vanadium Titanomagnetite Carbon Composite Hot Briquette at 1173–1373K. Steel Res. Int. 2017, 88, 1600306. [Google Scholar] [CrossRef]
  34. Zhao, W.; Chu, M.S.; Wang, H.T.; Liu, Z.G.; Tang, J.; Ying, Z.W. Volumetric Shrinkage Characteristics and Kinetics Analysis of Vanadium Titanomagnetite Carbon Composite Hot Briquette during Isothermal Reduction. ISIJ Int. 2018, 58, 823–832. [Google Scholar] [CrossRef]
  35. Bao, J.W.; Chu, M.S.; Tang, J.; Zhang, L.F. Isothermal Reduction Kinetics of the Mixture of Iron Carbon Agglomerates and Sinter: Regular Article. ISIJ Int. 2024, 64, 988–999. [Google Scholar] [CrossRef]
  36. Elzohiery, M.; Sohn, Y.H.; Mohassab, Y. Kinetics of Hydrogen Reduction of Magnetite Concentrate Particles in Solid State Relevant to Flash Ironmaking. Steel Res. Int. 2017, 88, 290–303. [Google Scholar] [CrossRef]
  37. Zhang, A.; Monaghan, J.B.; Longbottom, J.R.; Nusheh, M.; Bumby, C.W. Reduction Kinetics of Oxidized New Zealand Ironsand Pellets in H2 at Temperatures up to 1443K. Metall. Mater. Trans. B 2020, 51, 492–504. [Google Scholar] [CrossRef]
  38. Mohamed, E.; Deqiu, F.; Yousef, M.; Sohn, H.Y. Kinetics of hydrogen reduction of magnetite concentrate particles at 1623–1873 K relevant to flash ironmaking. Ironmak. Steelmak. 2021, 48, 485–492. [Google Scholar] [CrossRef]
  39. Yang, S.T.; Zhou, M.; Xue, X.X.; Jiang, T.; Sun, C.Y. Isothermal Reduction Kinetics of Chromium-Bearing Vanadium–Titanium Sinter Reduced with CO Gas at 1173K. JOM 2019, 71, 2812–2820. [Google Scholar] [CrossRef]
  40. Bai, Y.Y.; Ding, X.Y.; Qi, Y.H.; Ju, T.H.; Liu, J.S. Non-isothermal kinetics of mullite with Fe prepared by Sol-Gel method. J. Iron. Steel Res. Int. 2022, 34, 317–325. [Google Scholar] [CrossRef]
Figure 1. X-ray diffraction analysis results of VTM.
Metals 15 00595 g001
Figure 2. Schematic diagram of the experimental setup.
Metals 15 00595 g002
Figure 3. Distribution diagram of true and predicted iron oxide reduction rate.
Metals 15 00595 g003
Figure 4. Distribution diagram of the true and predicted values of vanadium oxides.
Metals 15 00595 g004
Figure 5. (a) Two-dimensional contours of iron oxides; (b) two-dimensional contours of vanadium oxides.
Metals 15 00595 g005
Figure 6. Iron oxide reduction response surface.
Metals 15 00595 g006
Figure 7. Vanadium oxide reduction response surface.
Metals 15 00595 g007
Figure 8. The relationship between the kinetic equations of iron oxides at different temperatures and the reduction time: (a) the relationship between [1 − (1 − α)1/3]2 and the reduction time; (b) the relationship between 1 − 2α/3 − (1 − α)2/3 and reduction time; (c) the relationship between 1 − (1 − α)1/3 and the reduction time; the relationship between (d) −ln(1 − α) and the reduction time.
Metals 15 00595 g008
Figure 9. The relationship between the kinetic equations of vanadium oxides at different temperatures and the reduction time: (a) the relationship between [1 − (1 − α)1/3]2 and the reduction time; (b) the relationship between 1 − 2α/3 − (1 − α)2/3 and the reduction time; (c) the relationship between 1 − (1 − α)1/3 and the reduction time; the relationship between (d) −ln(1 − α) and the reduction time.
Metals 15 00595 g009
Figure 10. Relationship between ln(k) and 1/T in different kinetic equations: (a) iron oxide; (b) vanadium oxide.
Metals 15 00595 g010
Figure 11. SEM microstructure of vanadium–titanium magnetite iron concentrate powder.
Metals 15 00595 g011
Figure 12. The reducing medium is carbon: EDS stratification diagram of slag after reaction of Fe-fine vanadium–titanium magnetite with sufficient amount of different reducing media.
Metals 15 00595 g012
Table 1. Chemical and mineral composition of VTM.
Chemical
Component
TFeFeOV2O5TiO2CaOMgOSiO2Al2O3MnOMagnetiteHematiteQuartz
Content/%67.0726.180.3620.5570.7150.8282.061.240.30690.532.810.46
Table 2. List of experimental chemical reagents.
Name of Experimental ReagentProducerReagent StatusReagent Code
CaOSinopharm Group Chemical Reagent Co., Ltd., Shanghai, ChinaPowder form10005928
Sodium carboxymethyl cellulose30036328
CC134372500
Table 3. Design table of factors and levels for the response surface experimental design.
FactorsUnitLower LimitUpper Limit
Reduction temperature°C13001500
Reduction timemin1060
Table 4. The CCD experimental design scheme.
NumberExperimental VariableReduction Rate of Fe
(%)
Reduction Rate of V (%)
Reduction Temperature (°C)Reduction Time
(min)
113001063.543.2
215001072.956.7
313006082.354.2
415006091.468.7
513004080.452.2
615004091.767.7
714001067.949.8
814006090.163.4
914004088.461.2
1014004087.660.8
1114004089.462.5
1214004088.760.4
1314004086.960.6
Table 5. Response model.
Reducing MediumResponse ParameterPrediction Model Expression
CIron oxide reduction rate86.41 + 4.97A + 9.93B − 0.0043AB − 1.83A2 − 7.16B2
Vanadium oxide reduction rate59.97 + 7.23A + 6.12B + 0.2984AB − 1.02A2 − 3.27B2
Table 6. Anova analysis of the designed FCCCD based on the response variable.
Reducing MediumResponse ParameterMeanStandard DeviationCV %R2Adjusted R2Predicted R2
CIron oxide reduction rate83.171.181.420.99080.98420.9331
Vanadium oxide reduction rate58.580.83561.430.99210.98650.9572
Table 7. Regression coefficients of the analysis of variance and the RSM model.
ResponseSourceSum of SquaredfMean SquareF-Valuep-Value
C-FeModel1043.785208.76150.05<0.0001
A-Temperature147.151147.15150.77<0.0001
B-Time591.231591.23424.97<0.0001
AB0.000110.00010.00010.9944
A29.2319.236.630.0367
B2128.271128.2792.20<0.0001
Residual9.7471.39
Lack of fit5.9631.992.100.2427
Pure error3.7840.9450
C-VModel616.415123.28176.19<0.0001
A-Temperature311.741311.74445.52<0.0001
B-Time224.731224.73321.16<0.0001
AB0.360810.36080.51560.4960
A22.8612.864.090.0827
B226.73126.7338.200.0005
Residual4.9070.6997
Lack of fit2.1030.69940.99910.4793
Pure error2.8040.7000
Table 8. Common kinetic reaction mechanism functions.
NumberFunction NameReaction MechanismIntegral FormDifferential Form
1Jander equationThree-dimensional diffusion 1 ( 1 α ) 1 / 3 2 3 2 ( 1 α ) 2 / 3 [ 1 ( 1 α ) 1 / 3 ] 1
2G-B equationThree-dimensional diffusion 1 ( 2 α / 3 ) ( 1 α ) 2 / 3 ( 3 / 2 ) [ ( 1 α ) 1 / 3 1 ] 1
3Shrink ball (volume)Interfacial reaction 1 ( 1 α ) 1 / 3 3 ( 1 α ) 2 / 3
4First-order reactionGasification reaction ln ( 1 α ) ( 1 α )
Table 9. The apparent activation energy corresponding to different kinetic equations.
Kinetic EquationIron Oxide: Apparent Activation Energy (kJ/mol)Vanadium Oxide: Apparent Activation Energy (kJ/mol)
1 ( 1 α ) 1 / 3 2 86.7690.30
1 ( 2 α / 3 ) ( 1 α ) 2 / 3 65.3878.08
1 ( 1 α ) 1 / 3 66.3450.28
ln ( 1 α ) 80.5462.35
Disclaimer/Publisher’s Note: The statements, opinions and data contained in all publications are solely those of the individual author(s) and contributor(s) and not of MDPI and/or the editor(s). MDPI and/or the editor(s) disclaim responsibility for any injury to people or property resulting from any ideas, methods, instructions or products referred to in the content.

