Article

Design Optimization of Key Structural Parameters for Tension Measuring Rollers in Temper Mill Units

1
National Engineering Research Center for Equipment and Technology of Cold Strip Rolling, Yanshan University, Qinhuangdao 066004, China
2
College of Mechanical Engineering and Automation, University of Science and Technology Liaoning, Anshan 114051, China
3
Shenzhen Research Institute, Yanshan University, Shenzhen 518000, China
*
Author to whom correspondence should be addressed.
Metals 2025, 15(6), 593; https://doi.org/10.3390/met15060593
Submission received: 30 April 2025 / Revised: 21 May 2025 / Accepted: 23 May 2025 / Published: 26 May 2025

Abstract

:
During the temper rolling process, scratch defects on the lower surface of the steel strip caused by the tension measuring roller are a critical issue that affects the resulting product quality. Previous research has been limited to analyzing the mechanism and influencing factors of scratch generation, and has lacked a systematic design solution for analyzing and addressing scratch defects. This study deeply analyzed the mechanism of scratch formation, and it was determined that the fundamental cause lies in the relative sliding between the steel strip and the tension measuring roller. Specifically, the driving torque of the steel strip on the tension measuring roller is insufficient to overcome its total rotational resistance torque. This study identified the strip wrap angle, roller sleeve outer diameter, and wall thickness as key structural parameters that influence this torque balance. In optimizing the structural parameters of the tension measuring roller, this research had two main goals: eliminating scratch defects and avoiding strip warpage defects. To achieve this, a strip warpage calculation model and a scratch verification model were established. These were combined with structural connection safety verification. Based on these analyses, the optimal structural parameter combination was determined. This combination includes a roller sleeve outer diameter of 500 mm, a roller sleeve wall thickness of 20 mm, and a wrap angle of 30°. The consistent results that were obtained from theoretical analysis, finite element simulation, and actual production trials demonstrate that the optimized structural parameters of the tension measuring roller can effectively prevent relative sliding between the steel strip and the tension measuring roller, completely eliminating scratch defects on the lower surface of the steel strip and significantly improving product quality. This provides a reliable solution for the scratch problem in temper rolling. This solution also reduces scrap rate and production costs. Furthermore, it meets the strict surface quality demands of high-end applications. This leads to improved production efficiency and customer satisfaction. Ultimately, this method enhances product competitiveness and promotes industry technological progress.

1. Introduction

The temper rolling mill unit is an important piece of equipment in steel production lines that is primarily used for the cold processing of steel strips to improve their surface quality, shape, and mechanical properties [1]. A typical temper rolling mill unit usually includes key equipment such as an uncoiler, a leveler, a temper mill, a tension roller, and a coiler [2]. Among these, the temper mill is the core piece of equipment, as it applies pressure and a certain elongation to the steel strip through one or more pairs of rolls to achieve strip leveling. The tension roller is responsible for real-time measurement and control of the strip tension at the mill entry and exit, and is a key component in ensuring a stable rolling process and the product’s quality [3]. The entire unit coordinates the work of each piece of equipment through an automated control system to achieve efficient and precise steel strip temper rolling.
During the temper rolling process, precise control of the steel strip tension at the mill entry and exit is required, as the magnitude of tension directly affects the rolling stability [4]. Furthermore, tension control is one of the important means of ensuring uniform strip thickness and a good shape (flatness), and appropriate tension can prevent the occurrence of strip deviation, slipping, wrinkling, and strip breaking defects [5], effectively guaranteeing product quality. As shown in Figure 1a, tension measuring rollers are arranged at both the entry and exit of the temper mill in certain units. The tension signals measured by the tension measuring rollers are fed back to the control system in real-time, and the control system adjusts parameters such as the motor speed and current based on the feedback values, thereby precisely controlling the actual strip tension and maintaining it at the set target value [6].
As illustrated in Figure 1b, during the production process of the temper rolling unit, scratch defects on the lower surface of the steel strip frequently occur at the exit of the temper mill, resulting in significant economic losses. Following on-site production tracking, it was observed that no scratch defects were present between the temper mill and the #2 tension measuring roller, but that scratches clearly appeared after passing the #2 tension measuring roller. This indicated that the scratch defects were generated by the tension measuring roller. Given that the scratches appeared on the lower surface of the steel strip, it was determined that the defects were caused by friction between the ② roller of the #2 tension measuring roller and the steel strip. Consequently, there was an urgent need to analyze the reasons why the tension measuring roller caused scratches on the steel strip and to optimize the structure of the ② roller of the #2 tension measuring roller.
Although previous research has focused on steel strip scratching during cold rolling and explored the influence of parameters such as the lubrication, temperature, and roughness to establish related prediction models and control methods [7,8,9], these studies primarily target the cold rolling process. Their influencing parameters and scratching mechanisms are significantly different from those of temper mills and cannot be directly applied to solve the scratching problem encountered in this study. Furthermore, while some studies have utilized computer vision and AI technology for steel strip surface defect detection [10,11], they have not further explored defect governance technologies. Currently, research specifically addressing the structural design of tension rollers and their relationship with steel strip scratching is lacking.
This study posits that the fundamental cause of steel strip scratching is the relative sliding between the steel strip and the tension roller, meaning that there is a velocity inconsistency between the two. As a passive roller, the tension roller is driven to rotate by the steel strip. Relative sliding occurs when the driving force of the steel strip on the tension roller is insufficient to maintain the same speed for both. This relative sliding can be mitigated by increasing the friction force between the steel strip and the tension roller or by reducing the tension roller’s rotational inertia. The friction force between the steel strip and the tension roller mainly depends on three factors: the friction coefficient between the steel strip and the tension roller, the tension of the steel strip, and the wrap angle of the steel strip on the tension roller. Although the strip speed also affects the friction force, the unit studied herein has certain procedures for speed setting, so this paper does not study it.
Due to the limitations of existing research, specifically the absence of studies on tension roller structural design and its link to strip scratching, this study deems it essential to conduct thorough research into how tension rollers cause strip scratching. This involves analyzing how the structural parameters of the tension roller impact strip scratching [12] in order to optimize the tension roller’s structure and effectively address steel strip scratch defects.
To gain a deeper understanding of the mechanism behind steel strip scratch defects, we first need to clarify the interaction between the steel strip and the tension roller. During the temper rolling process, the tension roller acts as a passive roller, and its rotation is entirely driven by the contacting steel strip. Ideally, the steel strip and the tension roller should maintain synchronous movement, meaning that their linear velocities are consistent, to ensure accurate tension measurement and avoid surface damage.
However, research has found that the fundamental cause of steel strip scratching is the relative sliding between the steel strip and the tension roller, which means that there is a velocity inconsistency between the steel strip and the tension roller. As the tension roller is a passive roller and is driven to rotate by the steel strip, relative sliding occurs when the driving torque generated by the steel strip on the tension roller is insufficient to overcome the total rotational resistance torque of the tension roller, leading to a situation where the steel strip’s speed is faster than the tension roller’s rotational speed [13]. It is this relative sliding that causes the scratch defects on the lower surface of the steel strip. To prevent or reduce this relative sliding, we can analyze it from two perspectives: increasing the friction force between the steel strip and the tension roller or reducing the tension roller’s rotational inertia [14].
The friction force between the steel strip and the tension roller is the source of the driving force that makes the tension roller rotate, and it depends on three factors: the friction coefficient between the steel strip and the tension roller, the tension of the steel strip, and the wrap angle of the steel strip on the tension roller [15]. Firstly, the friction coefficient between the steel strip and the tension measuring roller is determined by their surface roughness. The surface roughness of the steel strip is a specific parameter [16] which is a product performance requirement and cannot be altered. The roughness of the tension measuring roller is related to the surface treatment process of the roller sleeve, and its roughness also continuously decreases during its service life [17], thus it is not feasible to increase the friction by improving the friction coefficient. Secondly, the tension of the steel strip is a process parameter in temper rolling which is coordinated with other parameters such as the rolling force for production; therefore, it cannot be adjusted [18]. Finally, only the wrap angle between the steel strip and the tension measuring roller can be adjusted. It is evident that increasing the wrap angle can increase the friction, while decreasing the wrap angle reduces the friction [19].
As shown in Figure 2, the moment of inertia of the tension measuring roller needs to be determined from its structure. The tension measuring roller primarily consists of two parts: the roller sleeve and the shaft end. The shaft end needs to be compatible with the parameters of equipment such as the bearings and bearing seats. Modifying the shaft end structure would involve numerous associated pieces of equipment; thus, optimization can be focused on the structure of the roller sleeve [20]. The structural parameters of the roller sleeve include its length, outer diameter, and wall thickness. Among these, the length is a fixed parameter of the unit, and is related to product specifications. Therefore, the outer diameter and wall thickness of the roller sleeve can be considered as parameters for optimization. It should be noted that the outer diameter of the roller sleeve is also the outer diameter of the tension measuring roller, and if the outer diameter of the roller sleeve is changed, the diameter of the shaft end should also be changed accordingly. Evidently, increasing the diameter of the roller sleeve will increase the moment of inertia of the tension measuring roller, while decreasing the diameter will reduce its moment of inertia. Similarly, increasing the wall thickness of the roller sleeve will increase the moment of inertia of the tension measuring roller, while decreasing the wall thickness will reduce its moment of inertia [21].
In summary, the structural design optimization of the tension measuring roller can be carried out based on three parameters: the wrap angle between the steel strip and the tension measuring roller, the wall thickness of the roller sleeve of the tension measuring roller, and the outer diameter of the roller sleeve of the tension measuring roller.
Based on on-site production experience and the structural parameters of tension measuring rollers in similar units, two optimized values were selected for comparison with the existing value of each of the three parameters. The surface morphology treatment and material grades of the tension measuring roller are as follows: The roller shell material is 42CrMo forged steel that is heat treated and tempered to a hardness ranging from s31 to 41. The shaft head material is 45# forged steel that is heat treated and tempered to a hardness ranging from Hs31 to 40. The surface hardening treatment results in a hardness greater than Hs80 and a hardened layer depth between 2 and 3 mm. The surface is textured by blasting with JS6001-70# corundum grit. The surface is chrome-plated with Cr, with a chrome-plating layer thickness of between 0.05 and 0.10 mm. The roller surface roughness Ra is between 2.5 and 3 um, with peak removal treatment, and the Rz is less than 12.5 um. According to the preceding analysis, considering the reduction in the tension measuring roller’s moment of inertia and the increase in the driving force of the steel strip on the tension measuring roller, the optimized values for the three parameters are presented in Table 1.
Building upon this, two aspects need to be considered: firstly, ensuring that the optimized set of structural parameters can eliminate scratch defects and, secondly, ensuring that the optimized set of structural parameters does not introduce new defects in the steel strip.
Specifically, changes in the outer diameter of the roller sleeve will affect the curvature of the steel strip on the tension measuring roller, which will in turn influence the elongation of the upper and lower surfaces of the steel strip, potentially leading to strip warpage defects [22]. Therefore, warpage defects must be considered when optimizing the roller sleeve’s outer diameter. Simultaneously, the outer diameter of the roller sleeve also affects the moment of inertia of the tension measuring roller, thus influencing the occurrence of scratch defects.
Regarding the wall thickness of the roller sleeve, it primarily affects the moment of inertia. However, due to the interference fit relationship between the roller sleeve and the shaft end, the wall thickness of the roller sleeve also influences the magnitude of the contact force in the interference area [23], which in turn affects the safety of the contact between the roller sleeve and the shaft end during acceleration and deceleration of the tension measuring roller [24]. Particularly during emergency stops of the unit, when the angular acceleration is large, it is necessary to verify whether the interference force is sufficient to ensure the connection safety of the roller sleeve and the shaft end.
Furthermore, the wrap angle primarily affects the magnitude of the driving force of the steel strip on the tension measuring roller. It is necessary to verify whether changing the wrap angle can ensure that no relative sliding occurs between the steel strip and the tension measuring roller [25], which thereby ensures that steel strip scratch defects do not occur.
Addressing temper rolling mill scratch defects will have a significant economic impact and strategic importance. It can significantly reduce scrap rates and rework costs, increase product added value and market competitiveness, reduce customer claims and complaints, and improve production efficiency and equipment utilization, while also optimizing the process flow and promoting technological innovation and knowledge accumulation; thereby, it has the potential to bring considerable economic benefits and long-term development advantages to enterprises. In this study, a systematic analysis was conducted on the influence of different tension measuring roller structural parameters on product quality and production safety, with the optimal structural parameter combination ultimately being selected. Furthermore, finite element simulation verification and production trials were performed, confirming the effectiveness of the optimized structural parameters in ensuring product quality and production safety.

2. Optimization of Tension Measuring Roller Diameter and Warpage Verification

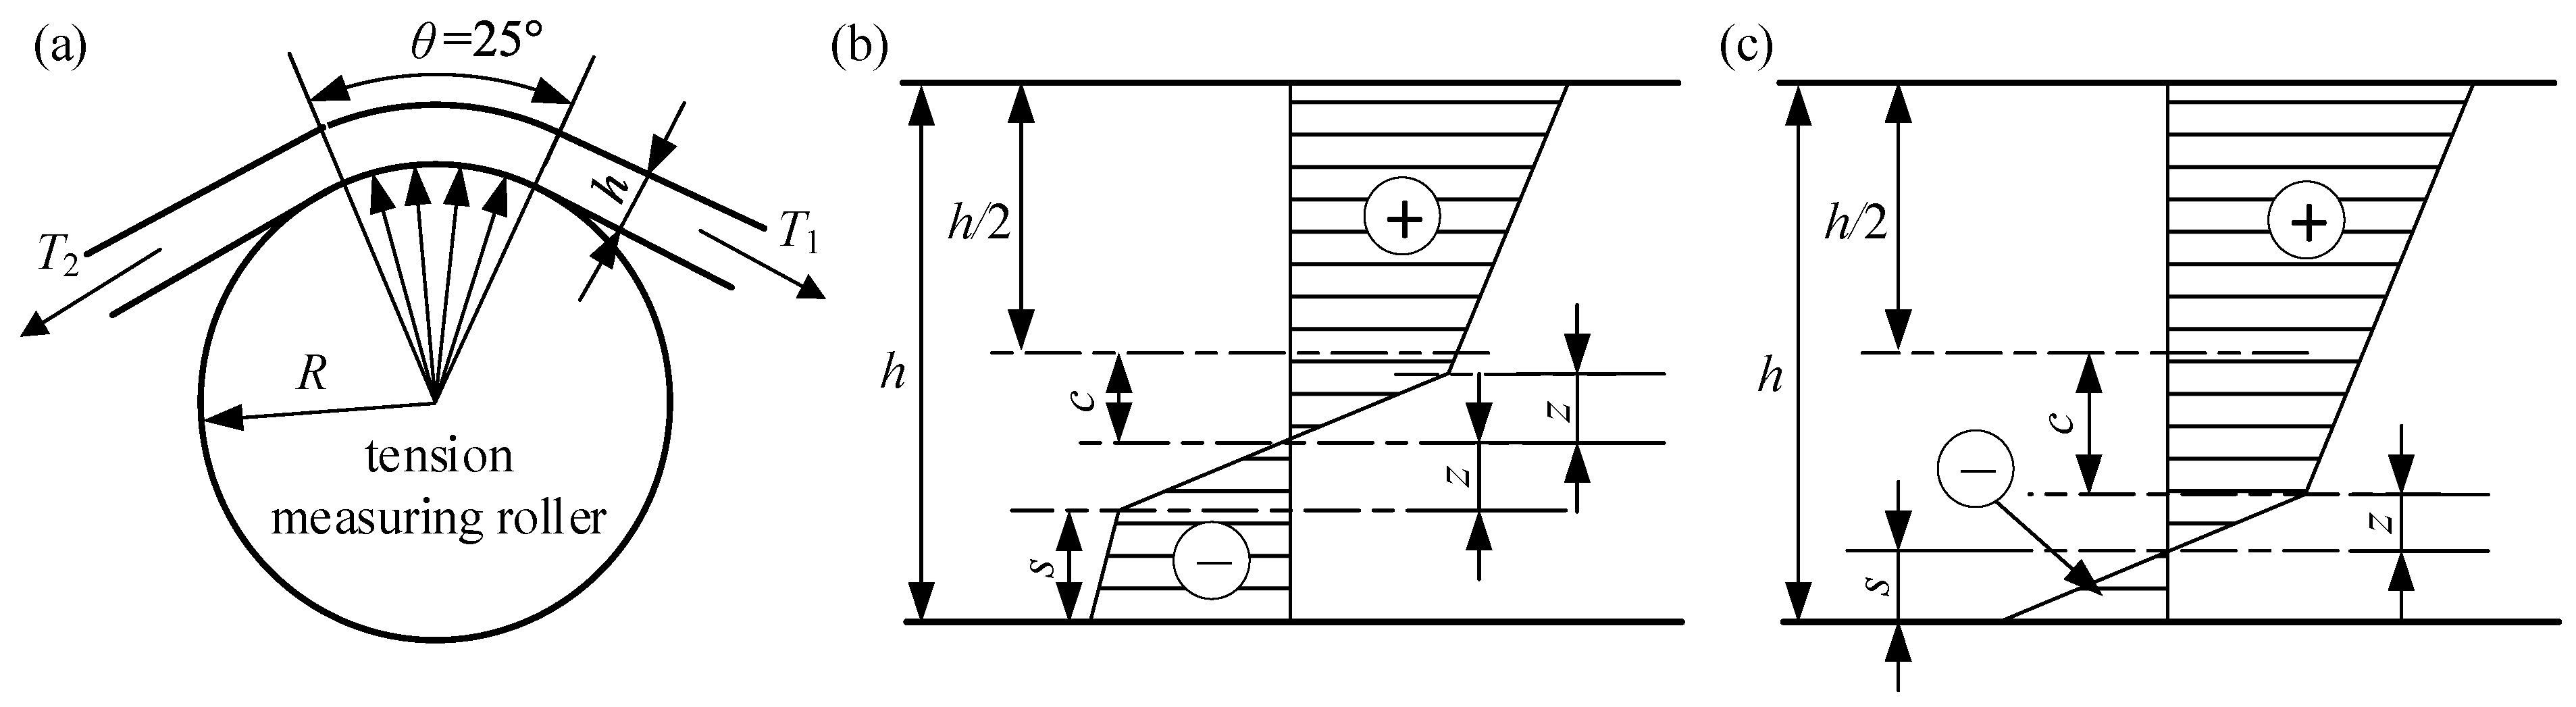
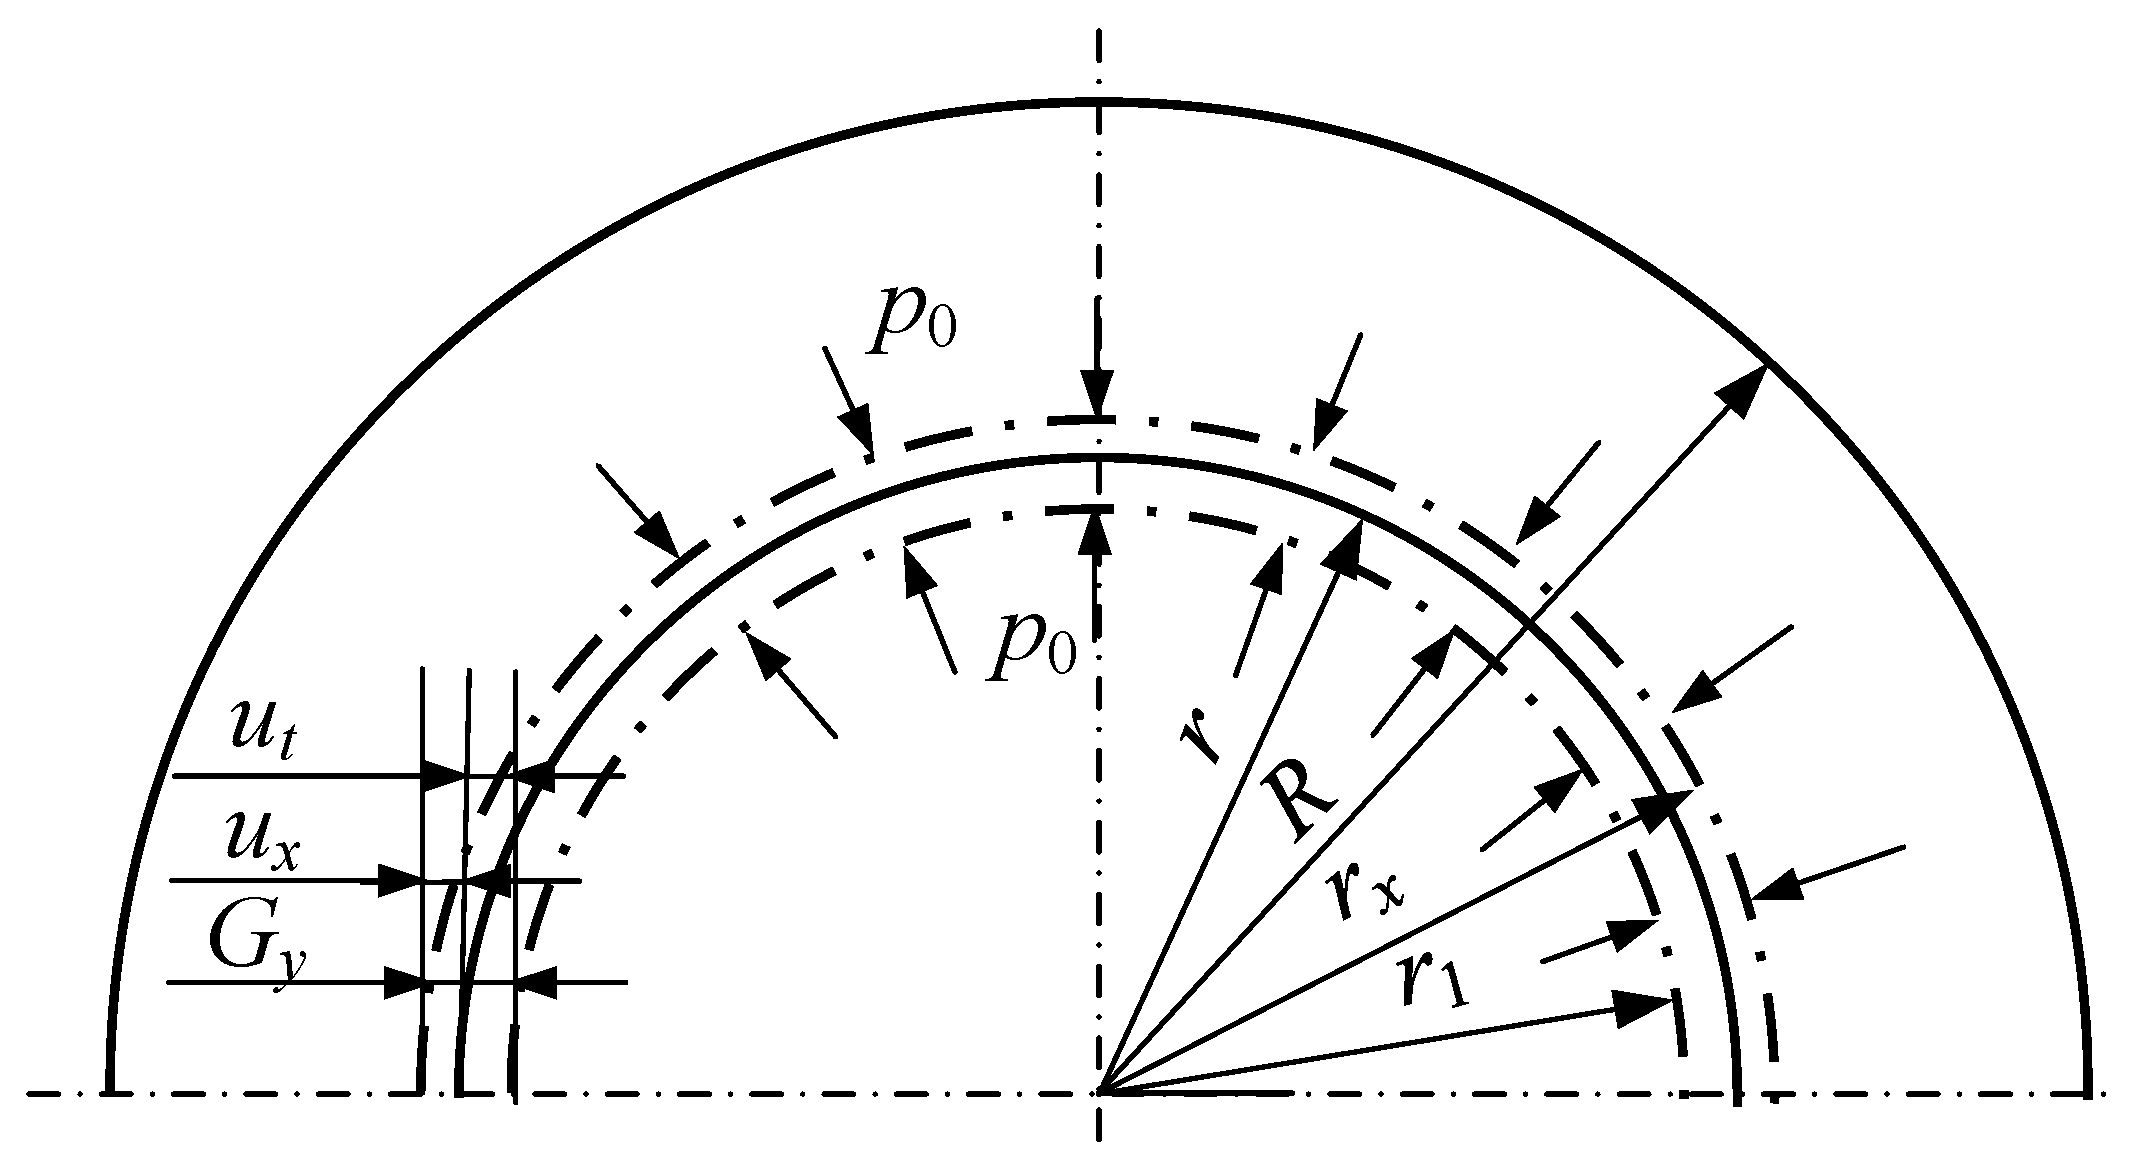
2.1. Warpage Calculation Model

Taking the wrap angle of the steel strip that used on-site, 25°, as an example, a schematic diagram illustrating the positional relationship between the ② roller of the #2 tension measuring roller and the steel strip is shown in Figure 3a.
As shown in Figure 3b, during the process of passing through the tension measuring roller, the steel strip no longer undergoes pure bending deformation. Under the action of tension, the neutral layer of the steel strip will shift. At this point, the neutral layer no longer coincides with the center line of the steel strip, and the amount of neutral-layer shift is related to the magnitude of tension. As shown in Figure 3c, with the increase in tension, the tensile deformation area on the upper surface of the steel strip increases, while the compressive deformation area on the lower surface decreases. When the tension increases to a certain value, the type of plastic deformation of the steel strip changes from double-sided deformation to single-sided plastic deformation.
Based on the linear strain hardening material model, we apply the following conditions: (1) the tension measuring roller is considered as an ideal cylinder, neglecting the micro-morphology and possible deformation of its surface; (2) the model primarily considers the stress distribution along the length direction of the steel strip, neglecting the influence of transverse stress. Furthermore, the boundary conditions of the model are defined as follows: the steel strip is bent over the tension measuring roller, and its shape is constrained by the arc of the roller; the tension distributions at the inlet and outlet of the strip are a constant set value. The difference in fiber plastic strain between the upper and lower surfaces of the steel strip under the above two types of deformation is analyzed. Under the action of tension, the offset distance between the middle layer and the neutral layer of the steel strip is c, the thickness of the elastic layer is 2z, and the force–balance relationship of the steel strip is:
σ F h = σ s z + s h ( z + s ) 1 + x z 1 E 1 E d x
where σ F —the average tension on the steel strip surface; h—the steel strip thickness; z—half of the elastic layer thickness; σ s —the yield strength of the steel strip; E—the elastic modulus of the steel strip; and E1—the strain hardening modulus of the steel strip.
The neutral-layer offset amount c of the steel strip is as follows:
c = σ F h σ s × 2 4 ( 1 E / E 1 ) + h E / E 1
The plastic elongation of the upper surface ε u of the steel strip is as follows:
ε u = h 2 + c z R
where R—the radius of the roller sleeve.
The plastic elongation of the lower surface ε d of the steel strip is as follows:
ε d = h 2 c z R
Then, the difference in elongation between the upper and lower surfaces ε is as follows:
ε = ε u ε d = h 2 z R
From the formula for the difference in elongation between the upper and lower surfaces, it can be seen that, in the case of double-sided plastic deformation of the steel strip passing through the tension measuring roller, the difference in elongation between its upper and lower surfaces is independent of the magnitude of tension. At this time, the warpage amount of the steel strip has no significant relationship with the set tension value.
When the tension reaches a certain value, the lower surface of the steel strip will no longer undergo plastic deformation, but only elastic deformation. In this case, if the tension value continues to increase, the plastic zone on the upper surface will increase while the elastic zone on the lower surface will decrease [26], as shown in Figure 3c. When the steel strip below the neutral layer is experiencing elastic deformation, the steel strip deformation adheres to a single-sided plastic deformation model. The critical tension value when the lower surface layer of the steel strip changes from plastic deformation to elastic deformation is calculated as follows:
σ F = σ s ( 1 E / E 1 ) 2 R σ s 2 ( 1 E / E 1 ) h E + E h E / E 1 2 R σ s E / E 1 c + s = h 2 s = z = R σ s E c = R σ F σ s 2 z ( 1 E / E 1 ) + h E / E 1 σ F h z σ s 2 z ( 1 E / E 1 ) + h E / E 1 + z = h 2
When the tension is σ F > σ F , according to the stress balance relationship, the following is true:
σ F h = σ s s z x z d x + z h x 1 + x z 1 E / E 1 d x
Then, the neutral-layer offset amount c is as follows:
c = h 2 s = h 2 h E / E 1 + ( 1 E / E 1 ) z + 2 h z ( 1 E / E 1 ) 1 σ F σ s + h 2 E / E 1 1 E / E 1
The difference in elongation between the upper and lower surfaces ε is as follows:
ε = ε u ε d = ε u = h + 2 c 2 z 2 R
Summarizing the above formulas, the relative elongation between the upper and lower surfaces of the steel strip under the action of the tension measuring roller can be expressed as follows:
ε = h 2 z R σ F σ F h + 2 e 2 z 2 R σ F > σ F
From the above formula, it can be seen that the factors that affect the critical stress primarily include the yield strength of the steel strip σs, the thickness of the steel strip h, and the radius of the roller sleeve ρ.
Furthermore, due to the presence of friction, the tension measured by the tension measuring roller is less than the actual tension of the steel strip [27]. Generally, the magnitude of the friction equivalent tension of the steel strip is as follows:
T f = T 1 T 2 = T 2 e μ θ T 2
where θ—the steel strip wrap angle; μ—the friction coefficient (for steel rollers under dry friction or low lubrication conditions, the range is 0.1~0.15 [28]); T 1 —the exit tension of the strip; T 2 —the entry tension of the strip; T f —the friction force generated by the strip on the tension roller.
Therefore, the actual equivalent tension of the steel strip at the tension measuring roller is σ F h = T f + T 2 .
A schematic diagram illustrating the geometric warpage relationship of the steel strip is shown in Figure 4:
Based on the geometric relationship, the warpage amount δ for a steel strip of length l can be calculated as follows:
δ = 1 cos α r d 1 + r d 2 2 α = 90 l ε r d 2 r d 1 π r d 1 = 90 l α π h 2 r d 2 = r d 1 + h
where δ —the warpage amount of the steel strip; l—the length of the steel strip; r d 1 and r d 2 —the curling radii of the upper and lower surfaces of the steel strip, respectively.

2.2. Warpage Verification of Steel Strip

The factors that influence the warpage amount of the steel strip include the steel strip thickness, tension, and wrap angle. The different yield strengths of various steel grades also affect the degree of warpage [29]. Therefore, for the three roller sleeve outer diameter control groups, three steel grades with different strengths, namely DQ-IF, 590DP, and CQ, were selected for calculation, and the corresponding steel strip thicknesses and different tensions were chosen for comparative analysis.

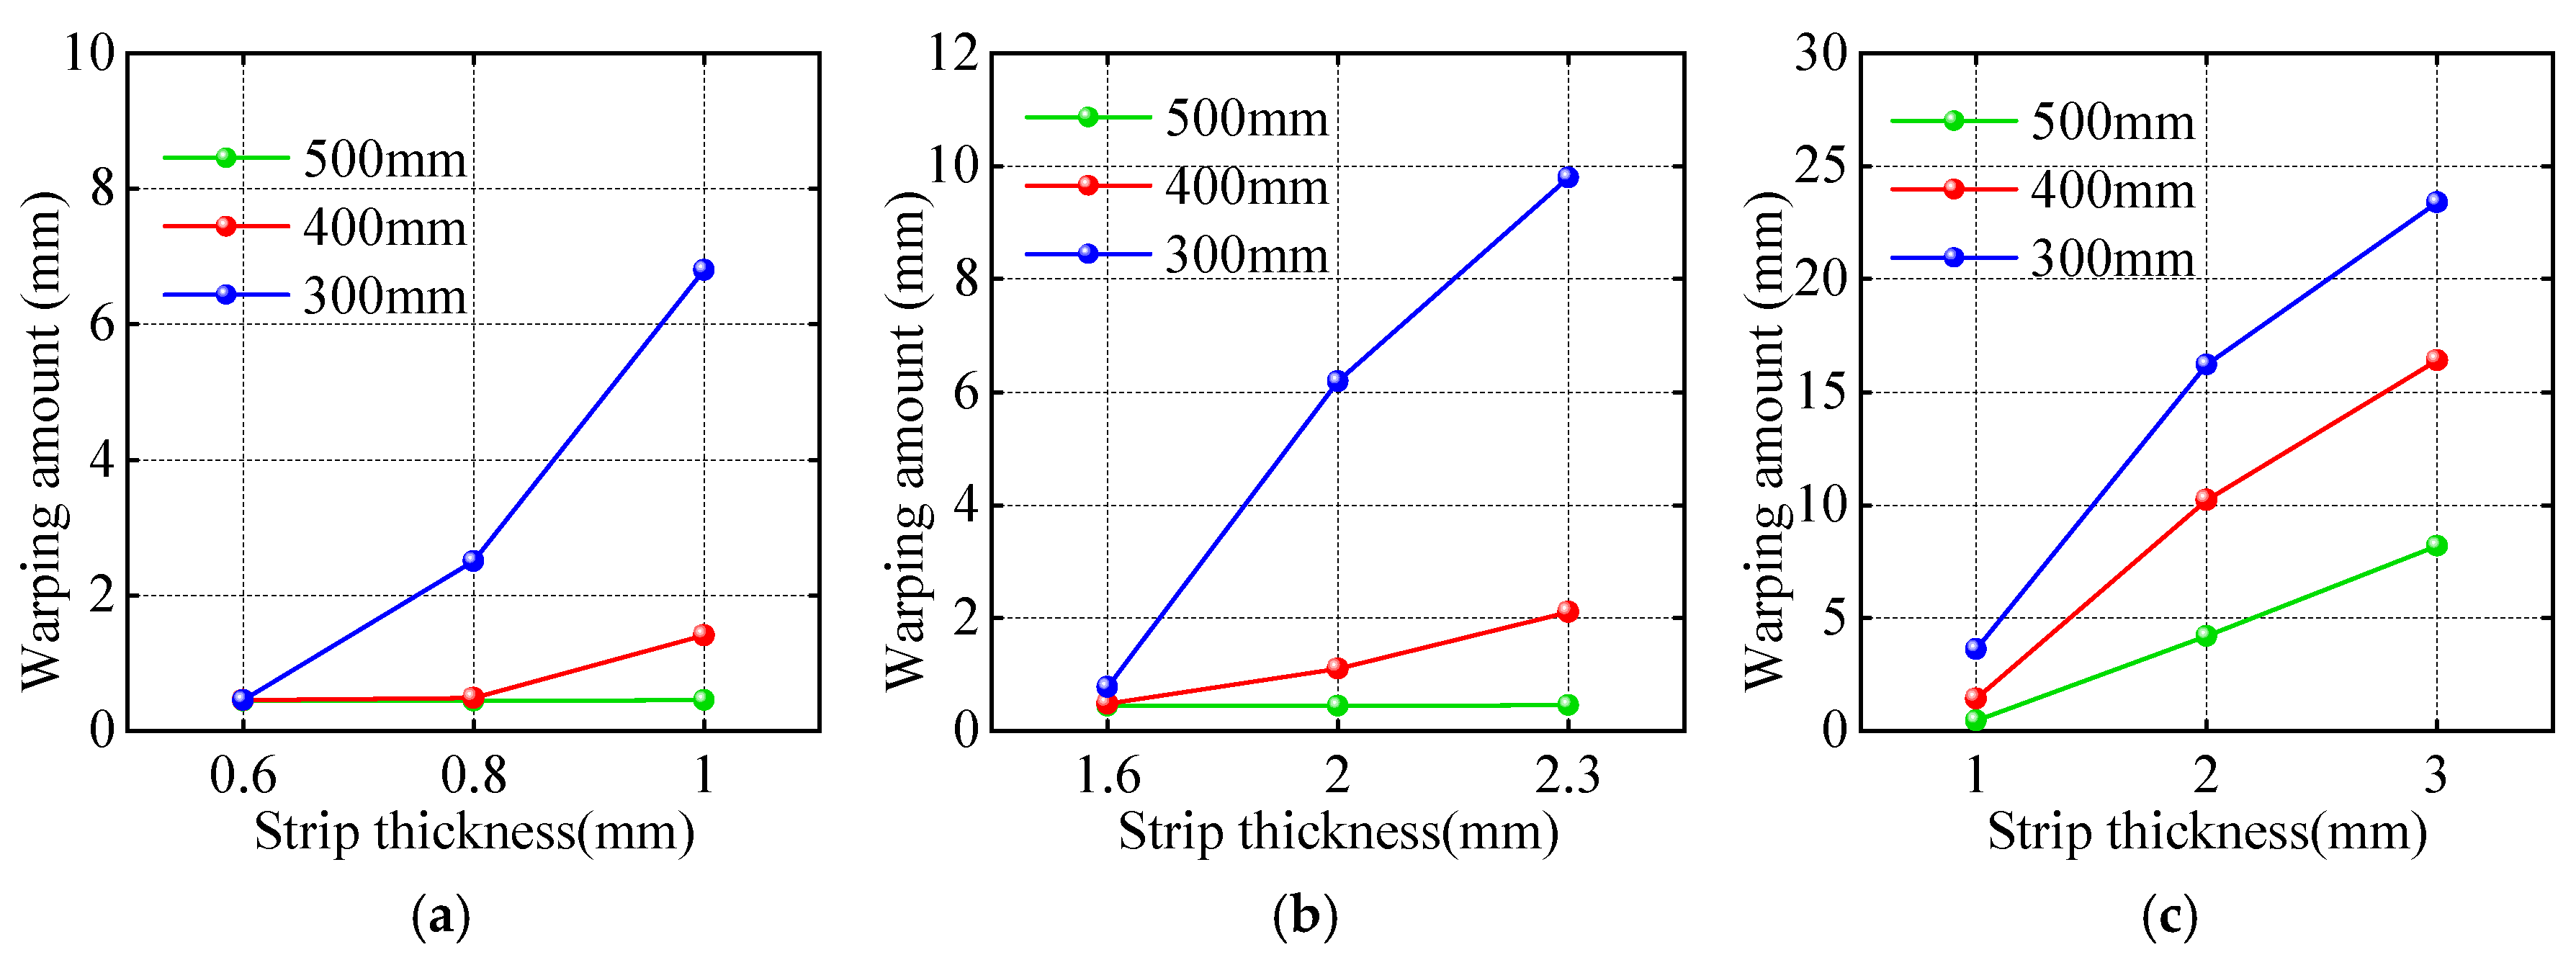
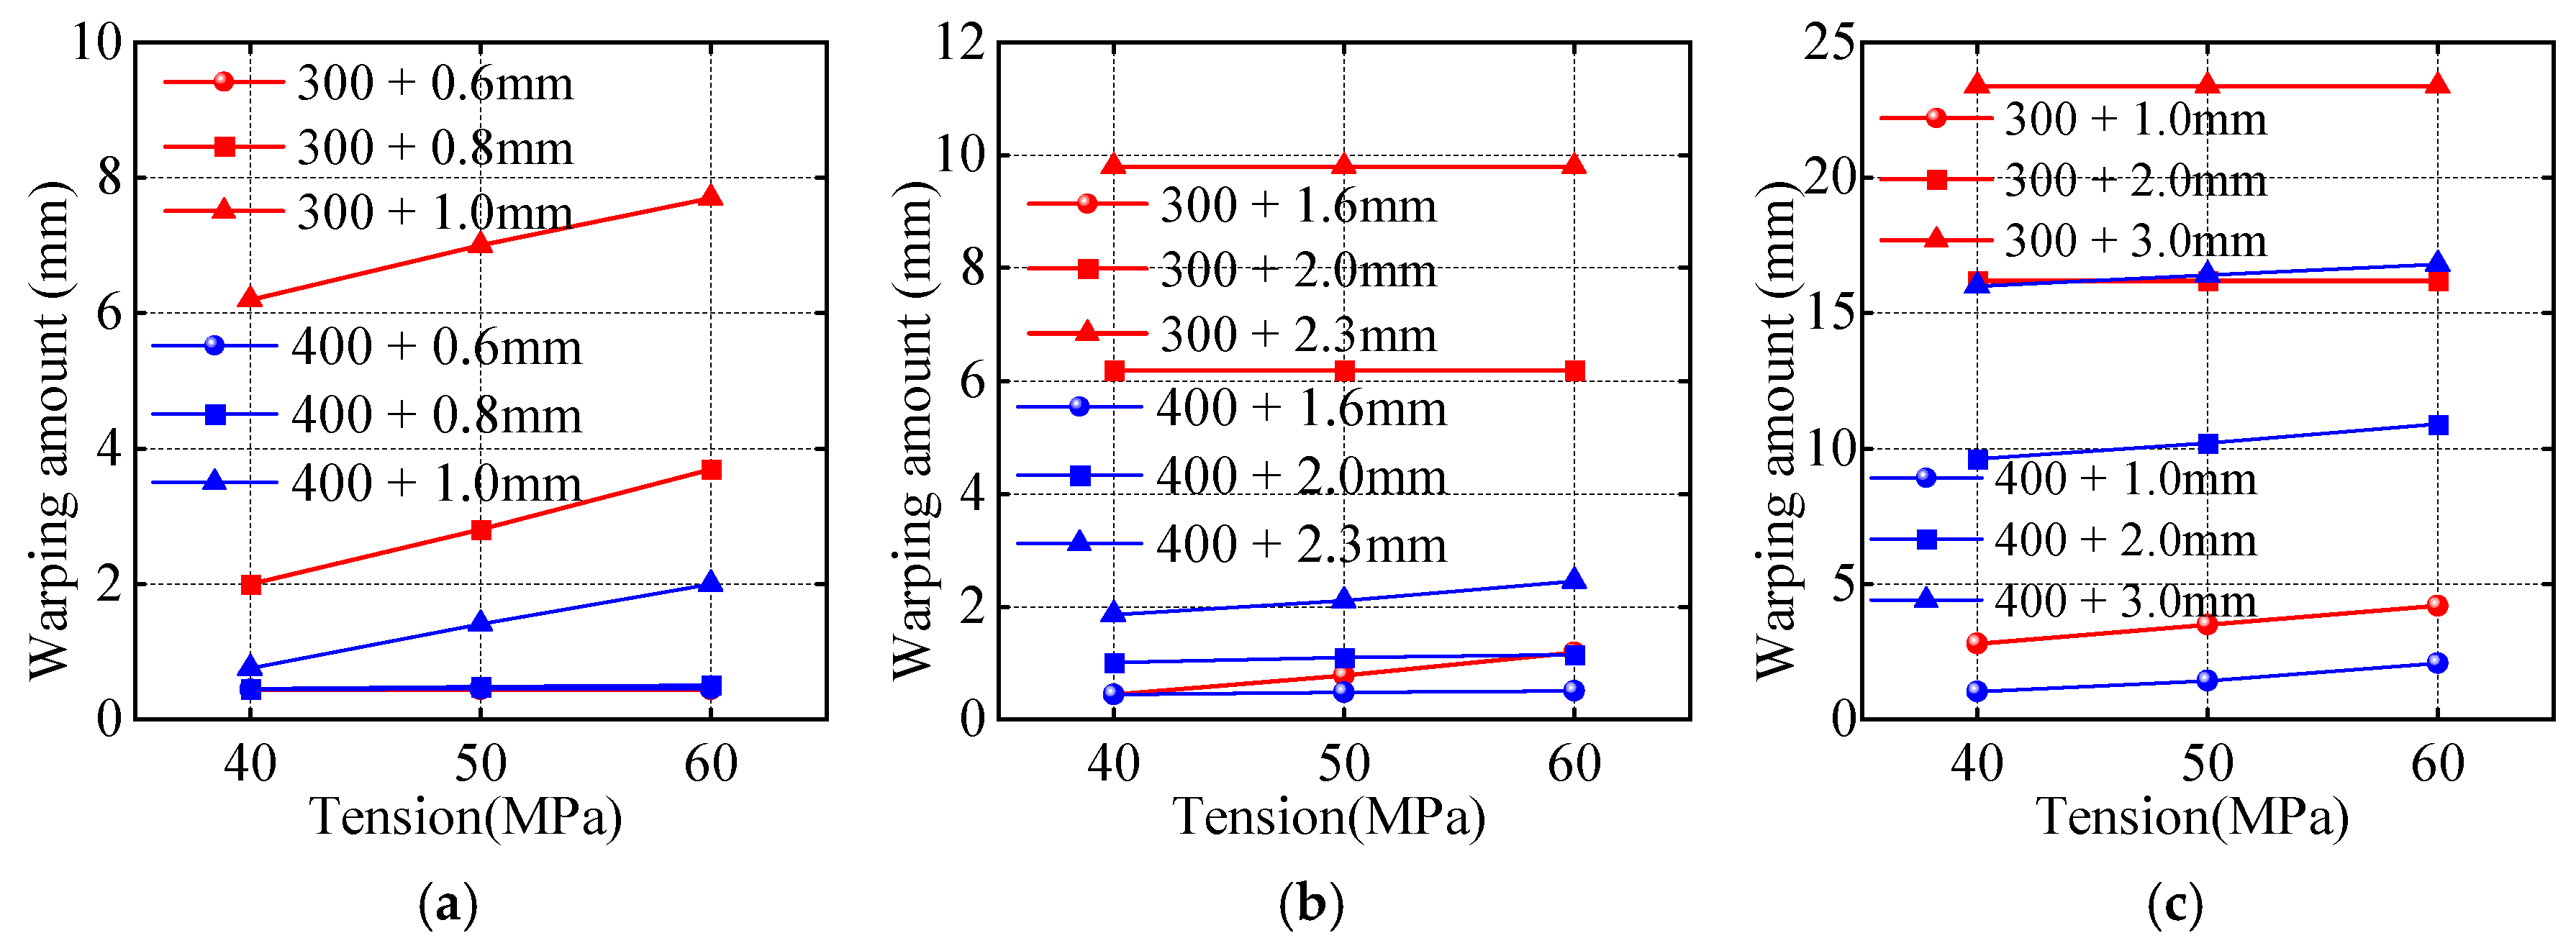
2.2.1. Warpage Amount for Different Steel Grades and Thicknesses

Prior to this, a comparative calculation of the warpage amount before and after the optimization of the tension measuring roller structure was performed. The outer diameters of the roller sleeve were 500 mm, 400 mm, and 300 mm. Three steel grades, DQ-IF, 590DP, and CQ, were selected, and the warpage amount was calculated for steel strips made with these three steel grades with different thicknesses under a tension of 50 MPa. DQ-IF represents a drawing quality interstitial free steel, known for its excellent formability and deep drawing capabilities, which is commonly used in applications that require high ductility. CQ denotes commercial quality steel, a basic low-carbon steel characterized by good plasticity and weldability, which suitable for general purposes and simple forming operations. Lastly, 590DP is a dual-phase steel with a tensile strength of 590 MPa which belongs to the category of advanced high-strength steels (AHSSs). This grade offers a combination of high strength and good ductility, making it suitable for structural components where both properties are essential. Among these steels, the yield strength of DQ-IF steel is 150 MPa and its tensile strength is 300 MPa; the yield strength of CQ steel is 200 MPa and its tensile strength is 350 MPa; the yield strength of 590DP steel is 350 MPa and its tensile strength is 590 MPa. The steel strip thickness range was based on the actual thickness range of the unit. With a steel strip length of 1000 mm, the calculation results for the warpage amount of all control groups are shown in Figure 5.
From Figure 5, it can be seen that, when the roller sleeve outer diameter is 500 mm or 400 mm, the warpage of both DQ-IF and 590DP steel grades fluctuates by about 1 mm and 1.5 mm, respectively, with a small fluctuation range that can be considered as no warpage occurring. However, the warpage of the 300 mm roller sleeve outer diameter increases by about 6 mm and 9 mm, respectively, with an increasing thickness for each steel grade, which is a larger increase. However, from the thickness range perspective, the limit thickness was reached for each steel grade, and the ratio of warpage–strip length for each thickness was less than 1%. For CQ steel, comparing different roller sleeve outer diameters, the strip warpage increases by 7.5 mm, 15 mm, and 20 mm, respectively, with an increasing thickness for different roller sleeve thicknesses. The 500 mm outer diameter still maintains a warpage ratio of less than 1%, but the 300 mm roller sleeve outer diameter reaches a maximum of 23 mm and the 400 mm roller sleeve outer diameter reaches a maximum of 16 mm, all of which are clearly unacceptable warpage amounts. Therefore, in the subsequent control groups, the warpage of the 300 mm and 400 mm roller sleeve outer diameters under different parameters will be focused on.

2.2.2. Warpage Amount for Different Tensions

This section selects three steel grades, DQ-IF, 590DP, and CQ, and analyzes the influence of two tension values, 40 MPa and 60 MPa, in comparison to the 50 MPa baseline, on the warpage amount that is observed using different steel grades, thicknesses, and roller sleeve outer diameters.
From Figure 6a, it can be seen that the greater the strip thickness and the greater the tension, the more prone the roller sleeve is to warpage defects. Within the thickness and tension ranges for DQ-IF steel, regardless of whether the roller sleeve outer diameter is 300 mm or 400 mm, the maximum change in warpage for the three specifications is 1.5 mm, indicating that significant warpage will not occur. From Figure 6b, it can be seen that, when the strip thickness exceeds 2.0 mm, at this tension, if the strip warpage does not change, then the tension will not affect the strip warpage; similarly, within the thickness and tension ranges for 590DP steel, significant warpage will not occur for both 300 mm and 400 mm roller sleeve outer diameters. From Figure 6c, it can be seen that CQ steel has lower strength but a larger thickness range. When the strip thickness is 1.0 mm, the warpage does not change, and warpage basically does not occur. When the strip thickness is greater than 2 mm, the ratio of warpage–strip length is greater than 1%, indicating that significant warpage has occurred. However, under the influence of gravity, the performance of this warpage should be lower than the calculated value. Further, neither the 300 mm nor the 400 mm roller sleeve outer diameter can meet the production requirements for CQ steel. Therefore, considering that the steel strip should not exhibit warpage defects, the outer diameter selected for the roller sleeve can only be 500 mm.

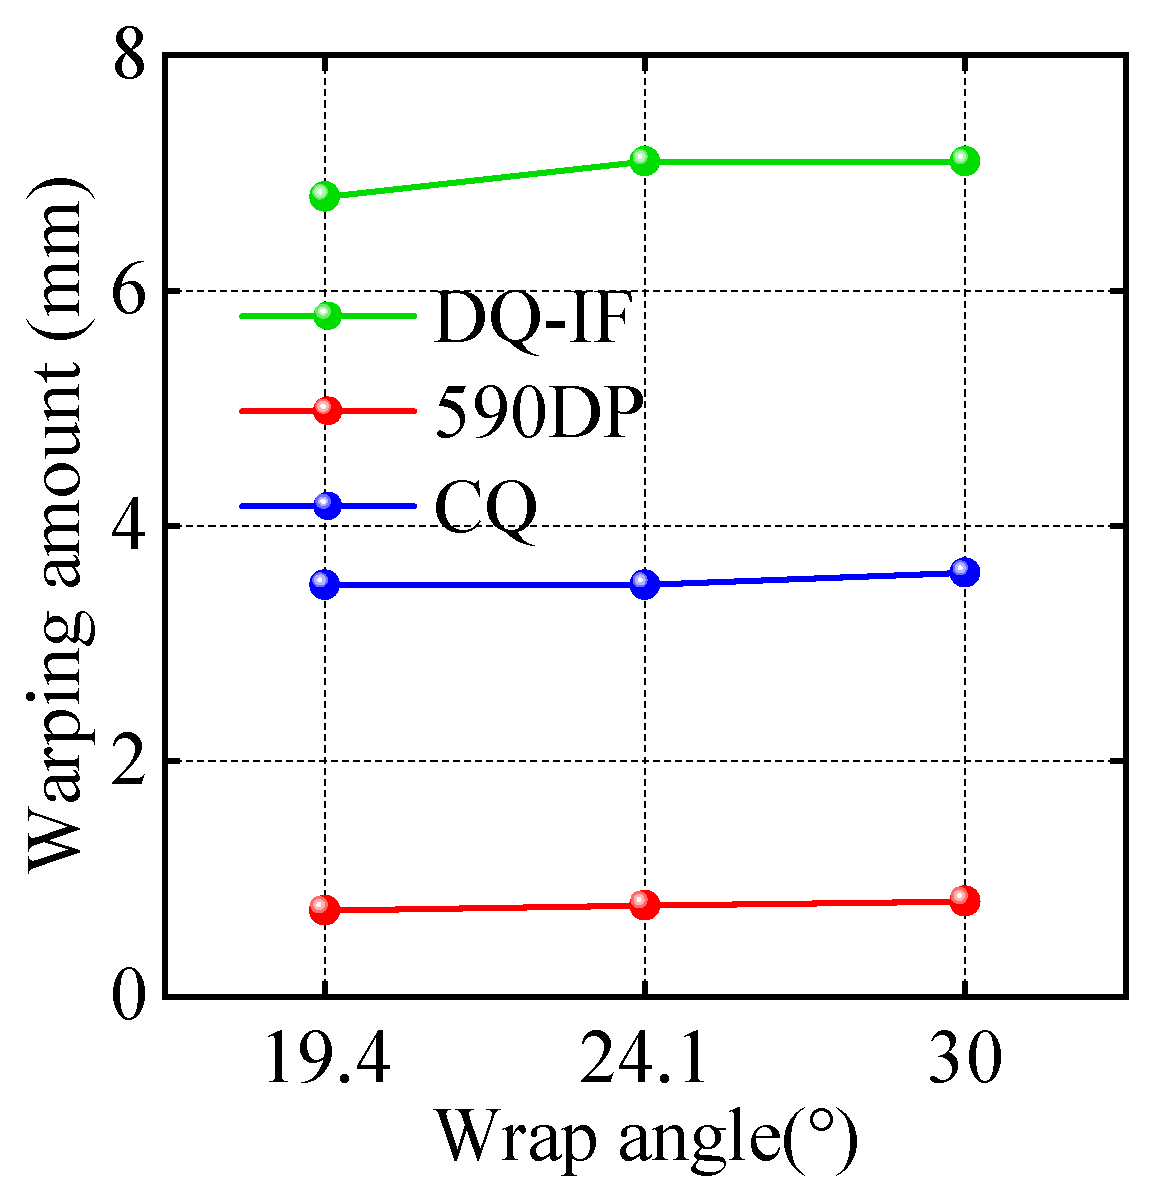
2.2.3. Warpage Amount for Different Wrap Angles

Next, the influence of the wrap angle on the steel strip warpage is analyzed. To minimize the influence of other factors on the results, combining the conclusions from the previous two sections, a roller sleeve outer diameter of 500 mm, which ensures no warpage defects occur, is used. Additionally, for the calculations to verify the maximum warpage at different wrap angles, the thickness levels with the least impact on warpage for each steel grade are selected: 1.0 mm for DQ-IF steel, 1.6 mm for 590DP steel, and 3.0 mm for CQ steel.
From Figure 7, it can be seen that the influence trend of the wrap angle on the warpage amount of the steel strip is such that increasing the wrap angle slightly increases the warpage amount, but the degree of influence is not significant. Therefore, the main factors that influence the warpage amount during the process of the steel strip passing through the tension measuring roller are the asymmetric elongation of the upper and lower surfaces caused by the steel strip thickness, roller sleeve outer diameter, etc., while the steel strip wrap angle primarily increases the friction between the steel strip and the tension measuring roller, and its influence on the warpage amount is far less than the aforementioned factors. Consequently, after verifying the structural parameters of the tension measuring roller in this section, it was confirmed that the optimized values for roller sleeve outer diameters of 300 mm and 400 mm cannot satisfy the condition of no warpage defects.

2.3. Summary of This Section

This section, through calculation verification, systematically analyzes the influence of the roller sleeve outer diameter, steel strip thickness, tension, and wrap angle on the amount of steel strip warpage. The research results indicate that the roller sleeve outer diameter is the structural parameter that most critically affects the degree of steel strip warpage. A roller sleeve outer diameter of 500 mm can effectively keep the warpage within an acceptable range under different steel grades and thicknesses, while roller sleeve outer diameters of 300 mm and 400 mm can cause unacceptable severe warpage when processing some steel grades and thicknesses. The steel strip thickness and tension also affect the warpage, but their influence is less significant than that of the roller sleeve outer diameter, and the warpage fluctuation caused by these factors is limited under a 500 mm roller sleeve outer diameter. The influence of the wrap angle on the amount of steel strip warpage is weak, and its main function is to increase the friction. Therefore, to avoid steel strip warpage defects, a roller sleeve outer diameter of 500 mm should be prioritized.

3. Optimization of Tension Measuring Roller Sleeve Wall Thickness and Wrap Angle, and Scratch Verification

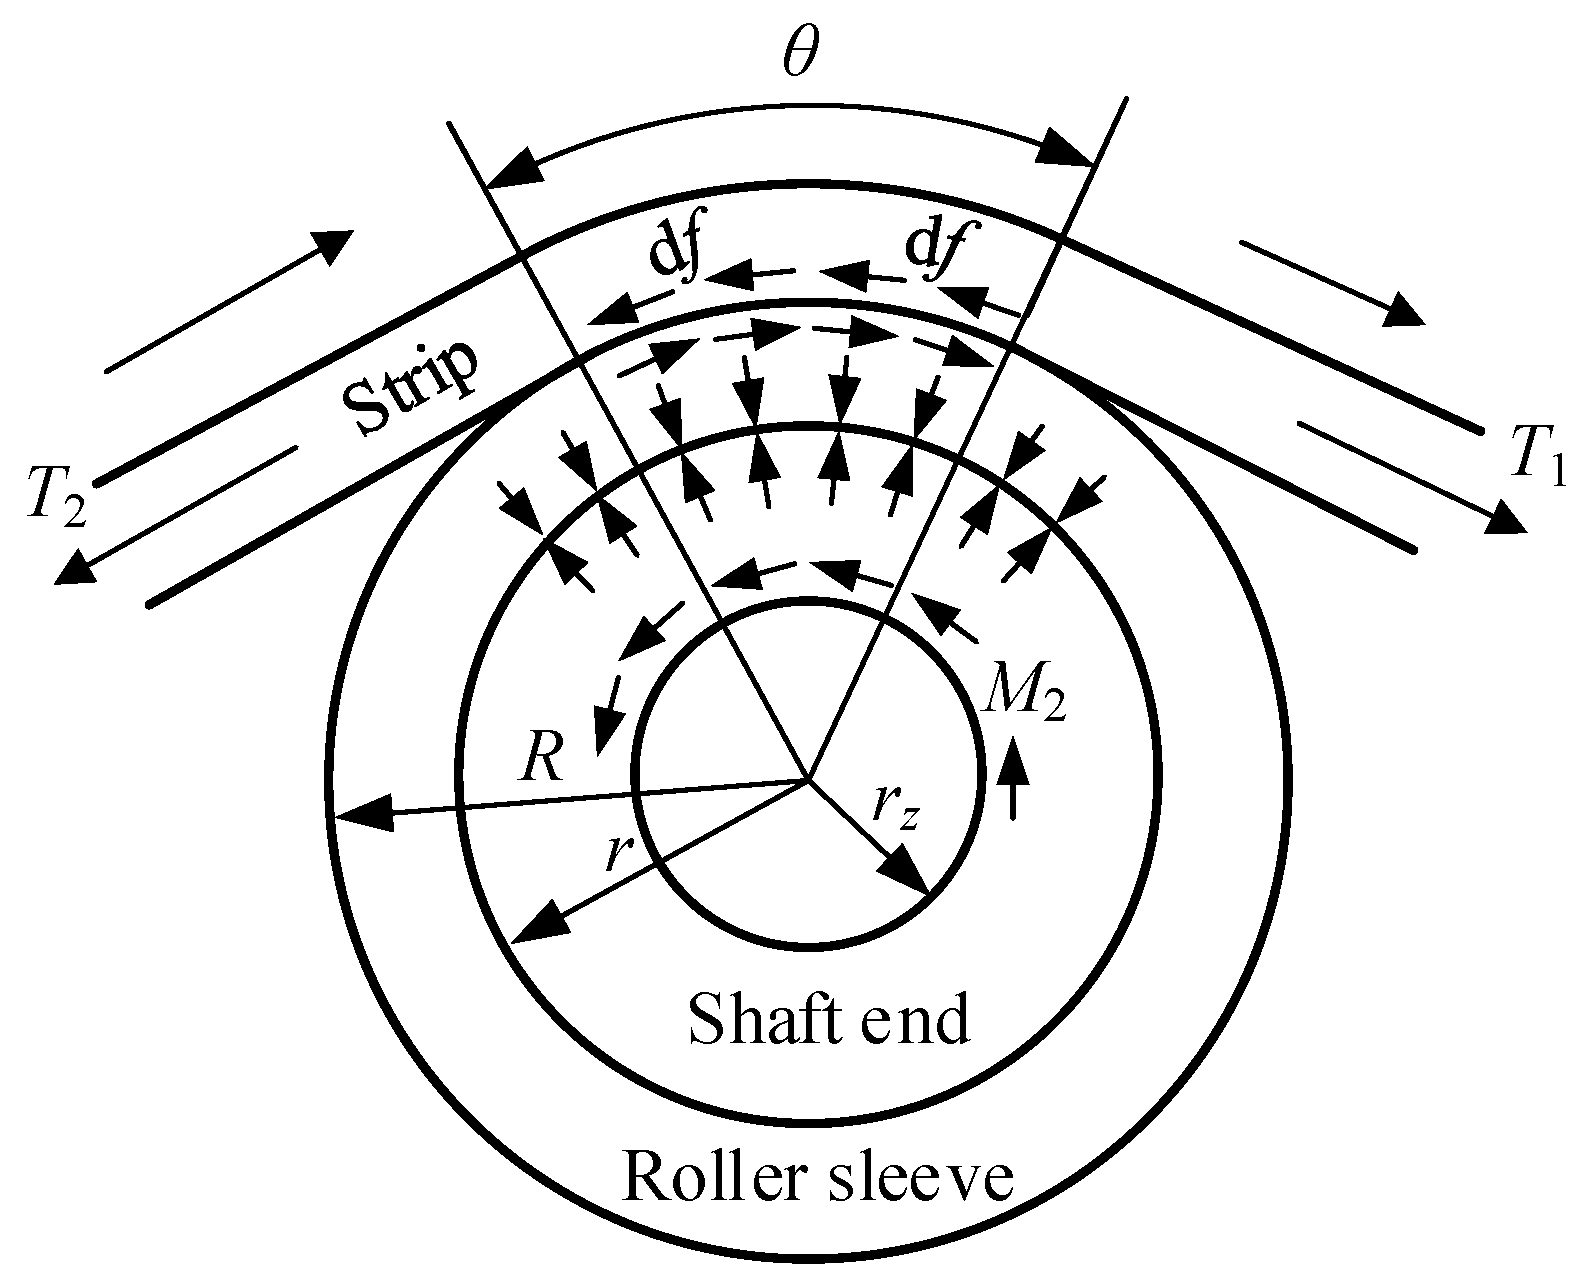
3.1. Force Analysis of the Tension Measuring Roller

The tension roller is essentially a cylinder. As the steel strip passes over the tension roller, it forms a wrap angle around a portion of the roller’s circumference. This geometric model of “a belt or rope wrapped around a cylinder” perfectly matches the application scenario of the Euler–Eytelwein formula. Due to the presence of friction, the tension of the steel strip entering the tension roller and that when it is leaving the tension roller are usually different. The steel strip driving the tension roller to rotate needs to overcome the roller’s rotational resistance, and this energy consumption is reflected in the difference in tension before and after passing through the roller. The Euler–Eytelwein formula quantitatively describes the relationship between this tension difference, the friction, and the wrap angle; thus, the Euler formula is chosen to calculate the friction force.
When the strip wraps around the tension measuring roller, friction exists between the steel strip and the tension measuring roller. This causes a difference in tension between the strip’s entry and exit, meaning that friction is the reason for this change in tension [30]. Since the friction force is not uniformly distributed on the contact surface, it is actually the result of the friction force being integrated over the contact surface. Therefore, the friction force between the steel strip and the tension measuring roller can be calculated using Euler’s formula [31], as shown in Equation (13).
T 1 = T 2 e μ θ
The tension measuring roller is an idler roller and needs to always maintain synchronous operation with the steel strip. Its rotation is entirely driven by the friction force generated by the steel strip on the roller surface. Simultaneously, the tension of the steel strip can cause the roller to bend and deform. Excessive roller bending will lead to undesirable changes in the shape of the steel strip. From the perspective of roller rigidity, increasing the diameter of the tension measuring roller can improve its rigidity, but at the same time, this also increases the moment of inertia of the tension measuring roller, which is bound to lead to an increase in the inertial force of the roller’s rotation. This increases the risk of slipping and makes process prone to scratch defects [32]. Therefore, the design of the tension measuring roller’s rotating body should both ensure a certain rigidity and be as light as possible. Most tension measuring roller sleeves are made into hollow rollers, and the deviation in the center of the roller’s mass is controlled within a certain accuracy, meaning that the dynamic balance performance should be good. Understanding the normal operating state of the tension roller requires considering the balance of torques. Under ideal steady-state synchronous operation conditions (i.e., without relative sliding), the driving torque generated by the steel strip on the tension roller should be equal to the total resistance torque experienced by the tension roller. This total resistance torque mainly includes the inherent rolling resistance torque formed by the bearing and seal friction pairs, among others. In actual dynamic processes, such as changes in the steel strip’s speed or tension, the inertial torque of the tension roller’s rotation also needs to be considered. Since the tension roller is driven to rotate by the driving force of the steel strip, it needs to continuously provide torque to overcome the inertial force of the tension roller and the inherent rolling resistance formed by the bearing and seal friction pairs. This means that, to maintain synchronous operation and avoid relative sliding (i.e., to prevent scratch defects), the driving torque generated by the steel strip on the tension roller must be greater than the total resistance torque experienced by the tension roller (including static resistance torque and dynamic inertial torque). Only when the driving torque is continuously greater than the resistance torque can the tension roller maintain normal operation, and at this time, scratch defects will not occur.
In analyzing the relationship between the steel strip and the tension measuring roller, it is found that there is a friction force Tf between the steel strip and the roller sleeve as well as an interference force between the roller sleeve and the shaft end, and the shaft end is also subjected to the resistance M2 from the bearing seal friction pair, as shown in Figure 8:
As a result, the driving torque of the tension measuring roller generated by the friction force is as follows:
M D = R T f = R 0 θ f d θ
where f—the friction force per unit wrap angle in the direction of the steel strip’s wrap angle.
The tension roller can be regarded as a hollow cylinder with inner and outer radii of r and R, respectively, and the moment of inertia I about its central axis is given by the following formula:
I = 1 2 m ( R 2 + r 2 )
The mass m of the cylinder can be calculated from its density ρ and volume V.
m = ρ V
The volume of the cylinder can be calculated from its length L and cross-sectional area. The cross-sectional area is an annulus, from which the formula for the volume of the cylinder can be obtained:
V = L π ( R 2 r 2 )
The moment of inertia of the tension measuring roller sleeve is:
J 1 = 1 2 ρ π L ( R 2 r 2 ) ( R 2 + r 2 )
where L —the length of the tension measuring roller sleeve; and ρ —the density of the roller sleeve.
As shown in Figure 2, the shaft end of the tension measuring roller can be regarded as a composite body composed of several cylinders and cavities. Its moment of inertia J 2 can be calculated using Equation (19):
J 2 = m x 1 r x 1 2 + m x 2 r x 2 2 + m x 3 r x 3 2
where m x i —the mass of the i-th section of the shaft end; and r x i —the radius of the i-th section of the shaft end.
The inertial force M 1 generated by the roller sleeve of the tension measuring roller during acceleration and deceleration is as follows:
M 1 = J 1 α n R = 1 2 R ρ π ( R 2 r 2 ) L ( R 2 + r 2 ) α n
where α n —the linear acceleration.
Due to friction resistance generated by the bearings, seals, lubricating oil, etc., the bearing friction resistance torque M 2 is equal to the following:
M 2 = μ ( P 0 + G ) r
where P 0 —the radial load of the steel strip, μ —the comprehensive friction resistance coefficient, G —the weight of the rotating body of the tension measuring roller itself, and r —the approximate radius of the bearing seal friction pair.
When M D > M 1 + M 2 , the tension measuring roller will not slip relative to the steel strip; otherwise, slipping will occur, leading to scratch defects. When the steel strip moves at a constant speed, the acceleration of the tension measuring roller is zero, and M 1 is also zero. At this time, M D and M 2 remain constant. As long as M D > M 2 , the steel strip will not slip; otherwise, slipping will occur, resulting in scratch defects. When the rolling mill accelerates over a short period of time, the tension of the steel strip decreases, and the tension measuring roller speed is in an increasing state, with a positive acceleration M 1 > 0 . Coupled with the resistance torque generated by bearings and other friction pairs, the rotational resistance torque of the tension measuring roller is relatively large at this moment. By verifying this stage, it is possible to ensure that the structural parameters of the tension measuring roller satisfy the condition of no scratch defects. When the rolling mill decelerates, the acceleration is negative, the tension of the steel strip increases from small to large, M D > M 1 + M 2 , and the tension measuring roller will not slip.

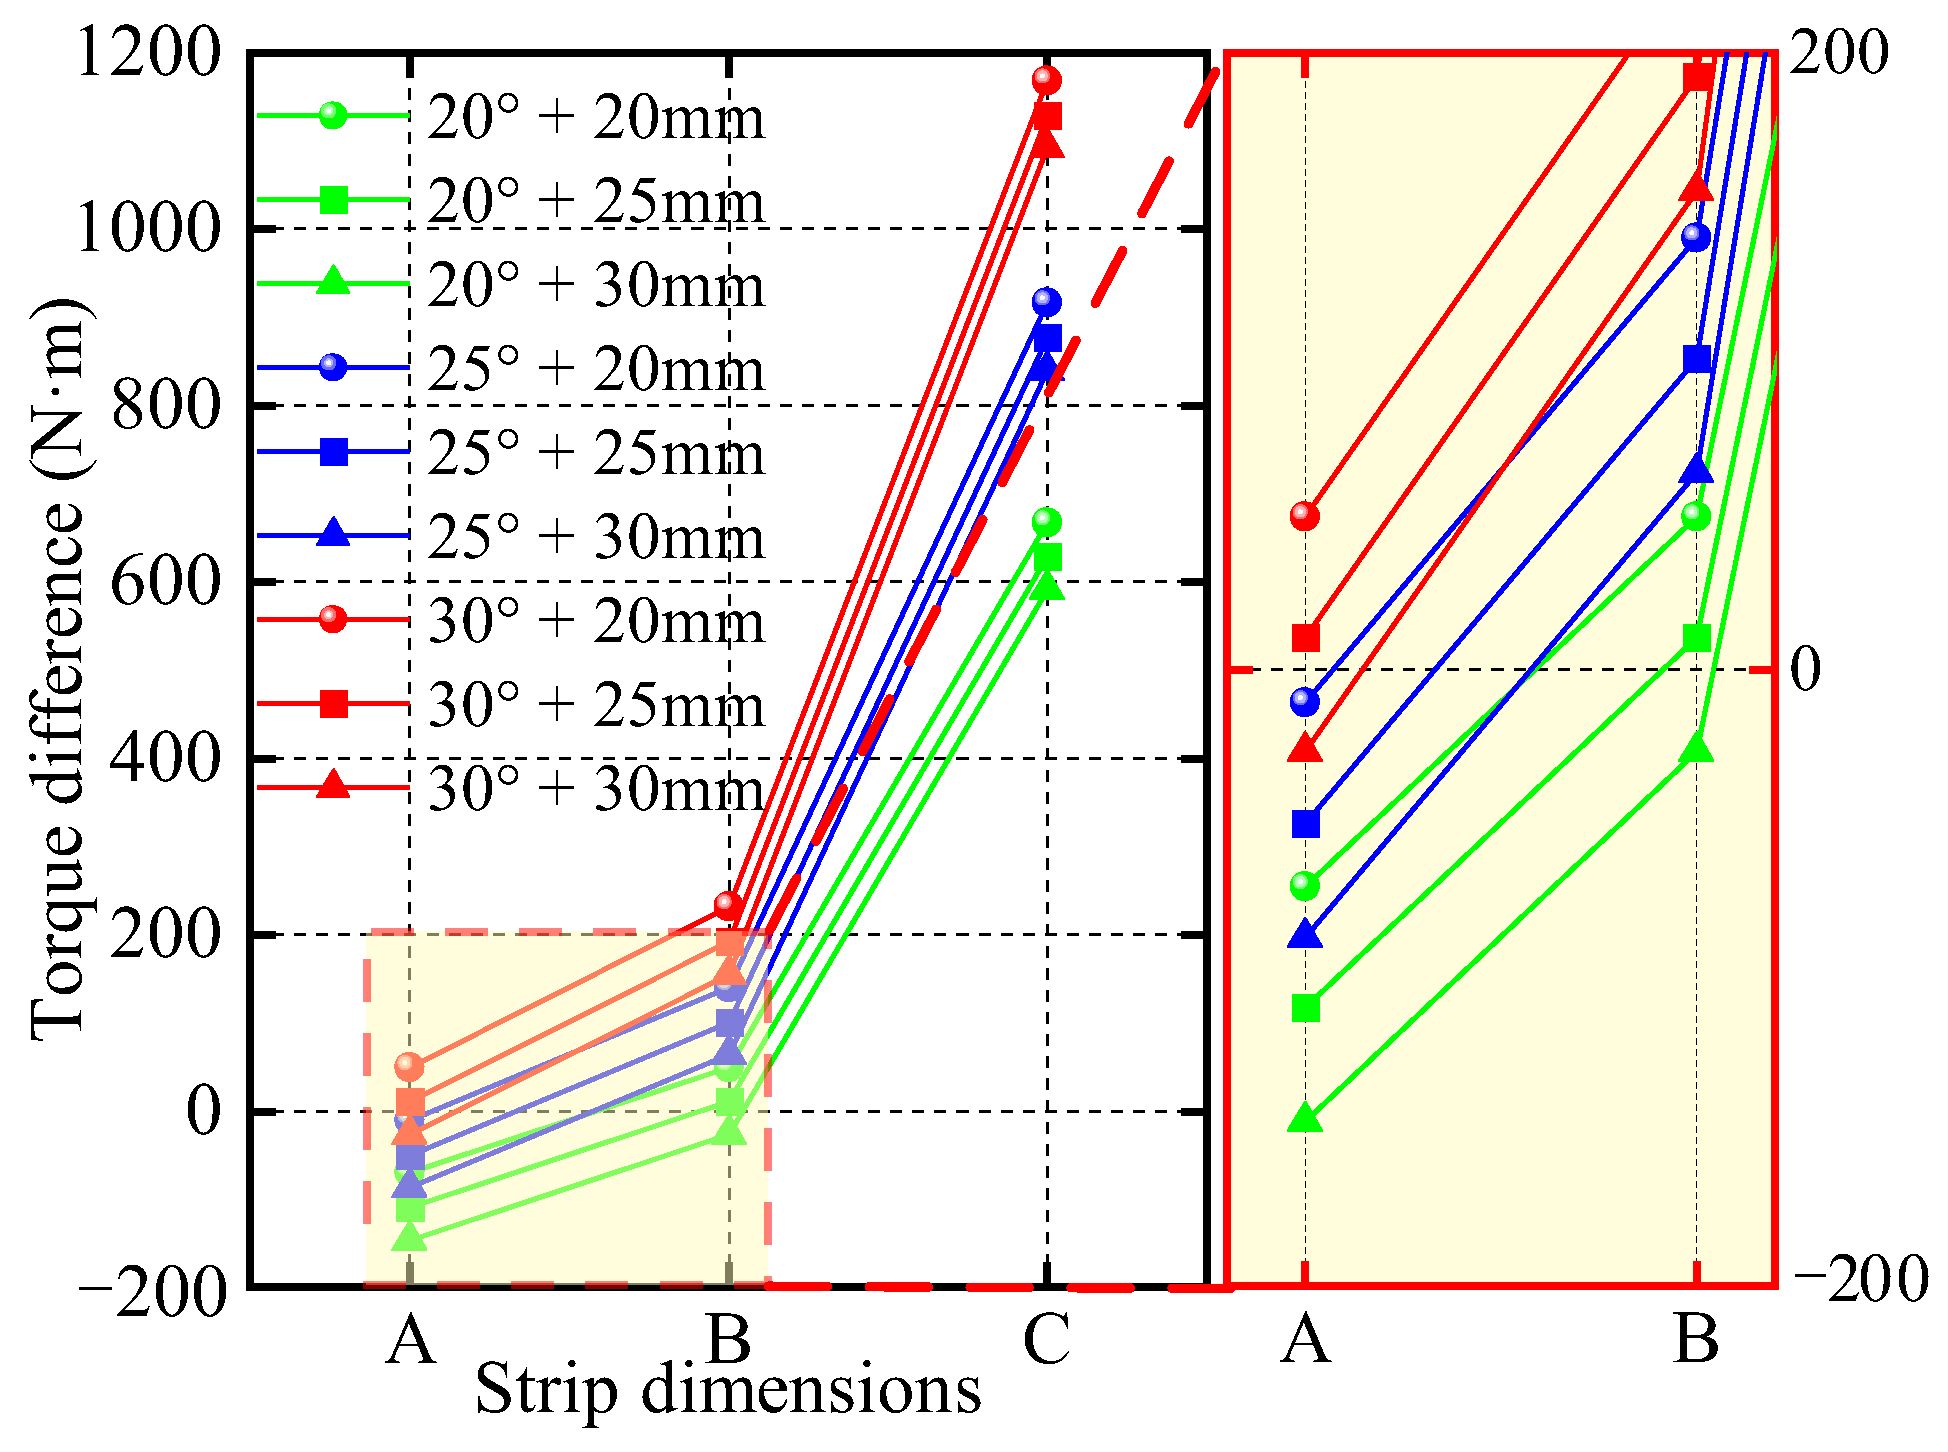
3.2. Scratch Verification of Steel Strip

The material density of the tension measuring roller analyzed in this paper is 7.85   g / c m 3 , and the linear acceleration of the steel strip is α n = 0.5   m / s 2 .
The primary purpose of the verification in this section is to prevent the occurrence of scratch defects. Therefore, three types of steel strips that are prone to scratch defects were selected as the verification objects, and their specific parameters are listed in Table 2.
Taking the roller sleeve wall thickness and steel strip specification as variables, the verification results for a wrap angle of 20° are shown in Table 3.
The verification results at a wrap angle of 25° are shown in Table 4.
The verification results at a wrap angle of 30° are shown in Table 5.
It should be noted that, after the optimization of the structural parameters of the tension measuring roller, it should be ensured that no scratch defects occur on the steel strip. Therefore, a scratch safety factor S h 1 must be given, such that M D > S h 1 M 2 . Based on production experience, the safety factor in this paper is determined to be S h 1 = 1.3 . The difference between the driving torque and the resistance torque M D S h 1 M 2 is compared for all control groups, as shown in Figure 9.
From the analysis results shown in Figure 9, it is concluded that only the combination of a roller sleeve wall thickness and wrap angle of 30° + 20 mm and 30° + 25 mm satisfies the requirements. These two combinations of structural parameters can ensure that no scratch defects occur on steel strips of all specifications while retaining a certain driving force margin to avoid special circumstances. It should be noted that these two sets of structural parameters were obtained under the condition that the roller sleeve outer diameter was 500 mm.

3.3. Summary of This Section

This section analyzed the tension roller settings to prevent steel strip scratches. We aimed to find the best settings to stop scratches. First, we explained how the roller works. We highlighted that the steel strip’s pull must be stronger than the roller’s total resistance. This resistance comes from static friction (like bearings) and movement inertia. We used calculations to determine how the roller size, roller thickness, strip type, tension, and wrap angle affect these forces. We tested three types of steel strips that often get scratched (A, B, and C). We looked at different wrap angles (20°, 25°, 30°) and roller thicknesses (20 mm, 25 mm, 30 mm). We calculated the pulling force and the total resistance, then we compared them. The results showed that, with a 500 mm roller diameter, only a 30° wrap angle with a 20 mm or 25 mm thickness worked well. This combination provided enough pulling force, even with a safety margin, and will ensure no scratches happen during changes in speed. Other settings did not provide enough force for some steel strips, risking scratches. Therefore, to stop steel strip scratches and be safe during speed changes, the best roller settings are a 500 mm diameter, a 30° wrap angle, and a 20 mm or 25 mm roller thickness.

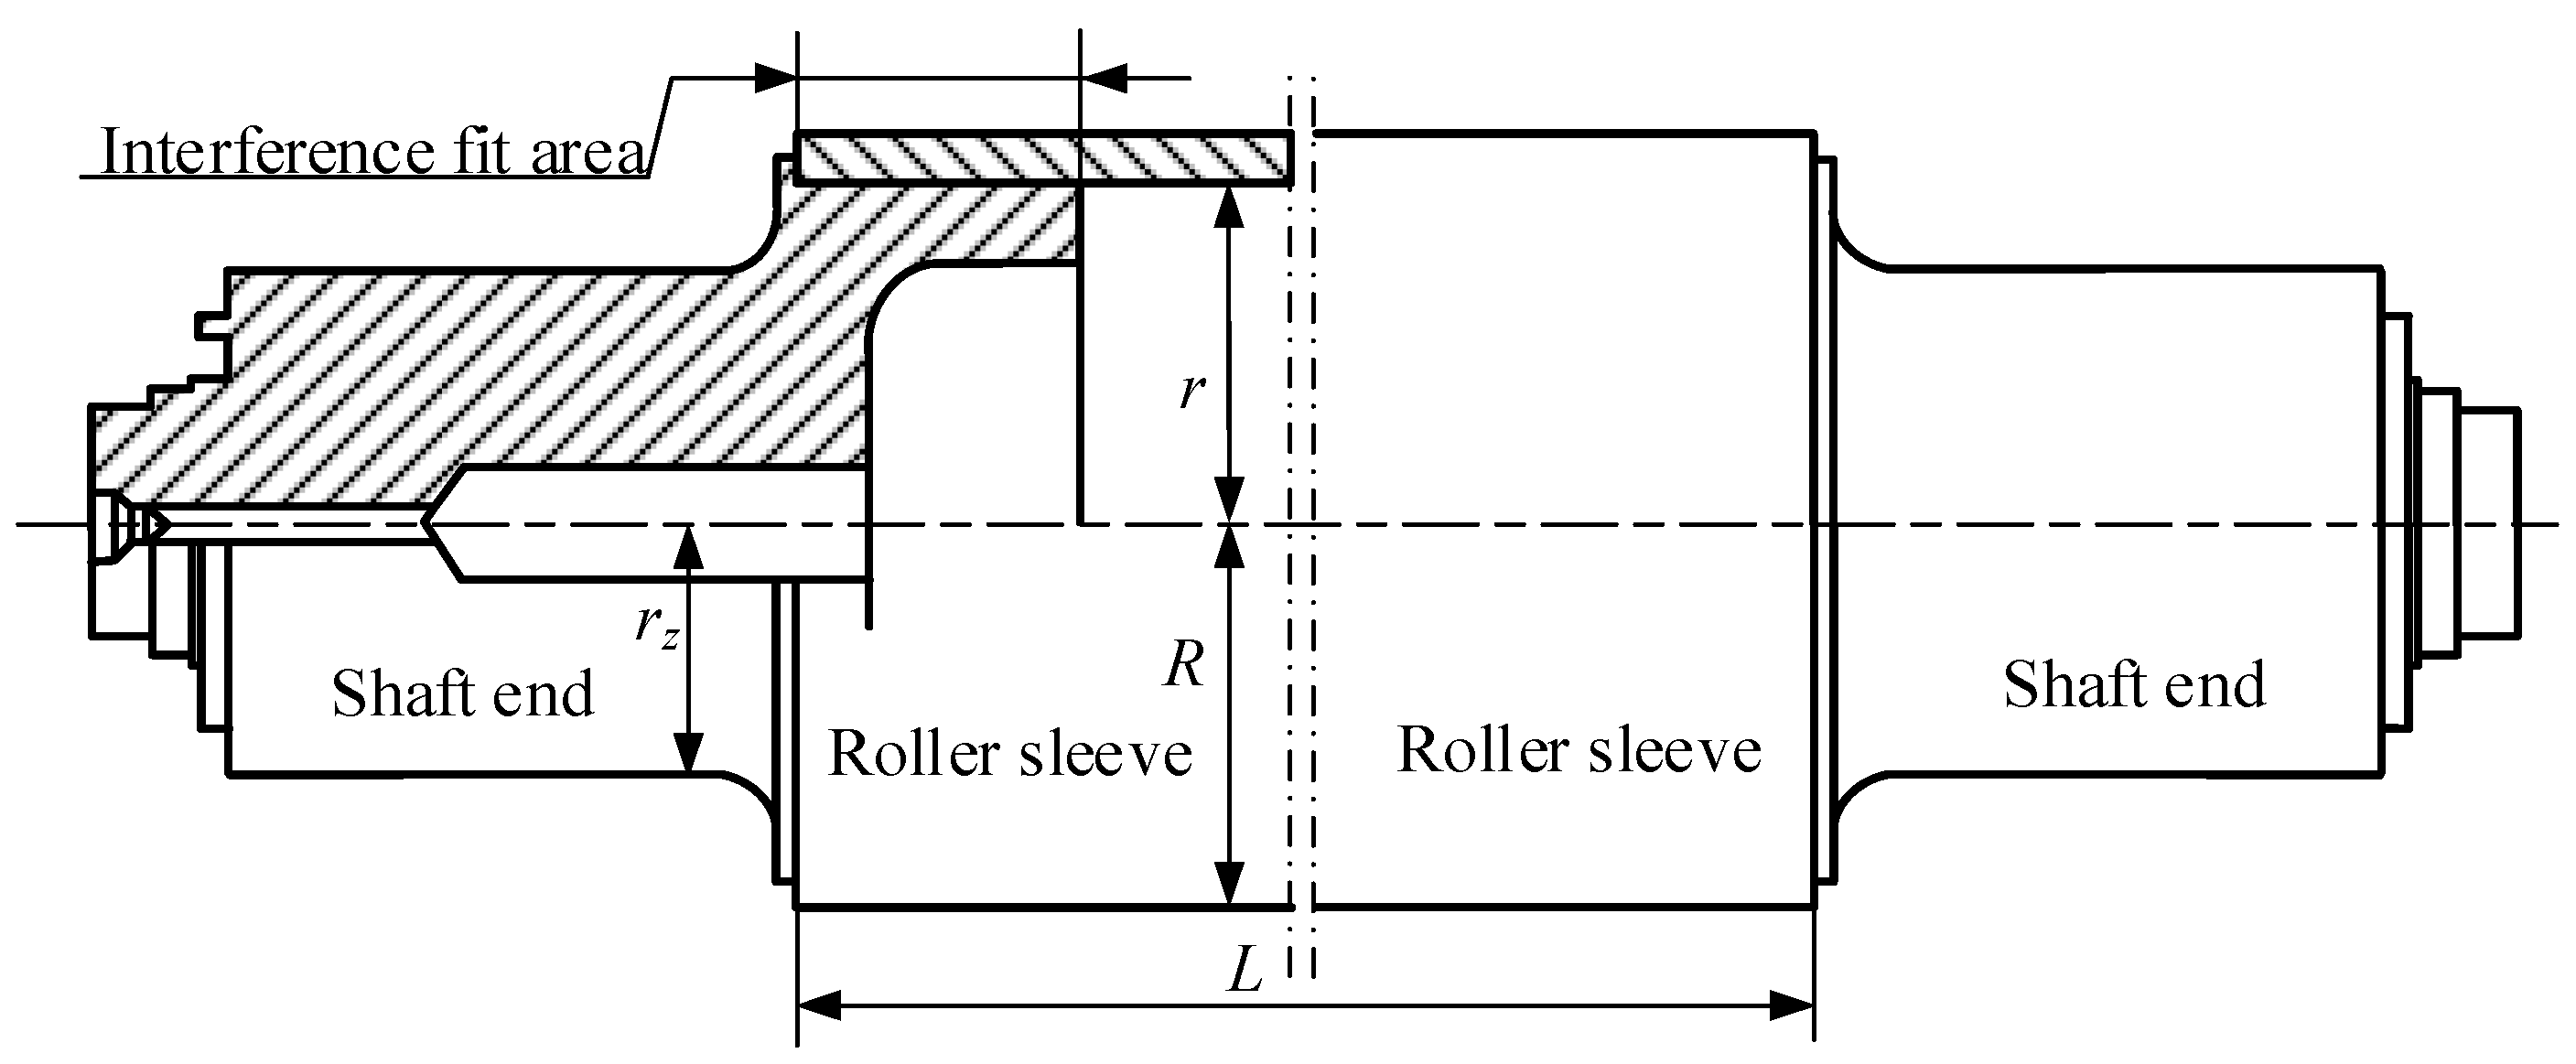
4. Verification of the Connection Safety of Tension Measuring Roller Sleeve and Shaft End

4.1. Stress and Deformation of Roller Sleeve and Shaft End

From Figure 2, which shows the fit relationship between the shaft end and the roller sleeve of the tension measuring roller, it can be seen that the roller sleeve and the shaft end are connected by an interference fit. It should be noted that the interference fit model in this section utilizes the following boundary conditions: Continuity of the interference fit surfaces: in the interference fit region, the inner surface of the roller sleeve and the outer surface of the shaft end must remain in contact after deformation, and the radial displacement is continuous. In the interference fit region, a radial contact pressure exists between the inner surface of the roller sleeve and the outer surface of the shaft end due to the mutual extrusion caused by the interference amount.
The stress and deformation in the interference area of the roller sleeve and the shaft end are shown in Figure 10.
For the roller sleeve, the radial pressure generated by the interference fit is clearly applied to the inner wall. Under the action of the radial pressure, which is the interference force, the deformation of the roller sleeve in the interference area is given by Equation (22).
u t = p 0 r 1 2 E ( R 2 r 1 2 ) ( 1 + ν ) R 2 r 1 + ( 1 2 ν ) r 1
where u t —the deformation amount of the roller sleeve under the action of the interference force; p 0 —the interference force after assembly of the roller sleeve and the shaft end; r 1 —the machining inner radius of the roller sleeve; E —the elastic modulus; and ν —the Poisson’s ratio.
Similarly, the surface of the shaft end is subjected to a circumferentially uniform load. Using the stress–deformation relationship of a shaft under a circumferentially uniform load, Equation (23) can be obtained [33].
u x = 1 ν E p 0 r x
where u x —the deformation amount of the shaft end under the action of the interference force; and r x —the machining radius of the interference area of the shaft end.
From the geometric relationship of deformation, it is not difficult to see that the relationship between the deformation of the roller sleeve and the shaft end, as well as the original interference amount, can be expressed as Equation (24). From Equation (24), the magnitude of the interference force can be derived, as shown in Equation (25).
G y = u t + u x = r x r 1
where G y —the interference amount after assembly of the roller sleeve and the shaft end.
p 0 = r x r 1 r 1 2 E ( R 2 r 1 2 ) ( 1 + ν ) R 2 r 1 + ( 1 2 ν ) r 1 + 1 ν E r x

4.2. Verification of the Connection Safety

Relative sliding may occur in the interference area between the roller sleeve and the shaft end under extreme working conditions. This is caused by the friction torque in the interference area being unable to counteract the driving torque and inertial torque. During acceleration and emergency stops of the tension measuring roller, the torque between the roller sleeve and the shaft end parameters may be large, potentially leading to poor contact between the shaft end and the roller sleeve [34]. Therefore, it is necessary to verify the connection safety of the optimized tension measuring roller sleeve wall thickness and the shaft end during starting and braking processes under the influence of different steel strip tensions, steel strip speeds, and other process parameters to avoid loosening. Under the condition of emergency stopping of the unit, the roller sleeve is subjected to the resistance torque from the steel strip and its own inertia torque. The torque–bearing relationship in the interference area during emergency stops is given by Equation (26):
M a = M b + J t β
where M a —the emergency stop torque in the interference area; M b —the torque of the steel strip on the roller sleeve; J t —the moment of inertia of the roller sleeve; β —the emergency stop angular acceleration.
Since the interference force is not uniformly distributed along the interference area, when torque is being transmitted, the torque borne by the interference area is calculated using the method of discretizing elements. The maximum torque that the interference area can bear is as follows:
M c = i = m n μ π d i 2 L i p i 2
where μ —the friction coefficient between the roller sleeve and the shaft end; d i —the diameter of the i-th element of the interference area; L i —the engagement length of the i-th element of the interference area; and p i —the interference force between the shaft end and the roller sleeve of the i-th element.
The initial interference force between the shaft end and the roller sleeve of the tension measuring roller is obtained using Equation (25). Considering that the interference force between the shaft end and the roller sleeve of the tension measuring roller will be unevenly distributed, the torque borne by the interference area is calculated by discretizing elements to make the calculation results more accurate.
To ensure that no relative sliding occurs between the roller sleeve and the shaft end during emergency stops, i.e., M c > M a , and to retain a certain safety margin, a relative sliding safety factor is proposed. The calculation of the relative sliding safety factor S h is given by Equation (28):
S h = M c M a
The connection safety of the roller sleeve and the shaft end was verified separately for roller sleeve wall thicknesses of 20 mm and 25 mm, as follows.
For a roller sleeve wall thickness of 20 mm, the machining inner radius of the roller sleeve is r 1 = 230   mm , the machining outer radius of the roller sleeve is R = 250   mm , and the machining radius of the interference area of the shaft end is r x = 231   mm . From Equation (25), p 0 = 80.30   MPa can be obtained, and then by substituting this value into Equation (27), M c = 76,727.49   N · m can be obtained.
In the emergency stop state of this unit, the emergency stop angular acceleration β of the roller sleeve is 120 m / s 2 . The diameter of the interference area is d = 462   mm , and the length is L = 190   mm . Taking the maximum driving torque M b = 1979.73   N · m from Section 3 as the torque of the steel strip on the roller sleeve and substituting it into Equation (26), M a = 5421.33   N · m can be obtained. From this, the relative sliding safety factor can be calculated as S h = M c M a = 14.15 .
For a roller sleeve wall thickness of 25 mm, the machining inner radius of the roller sleeve is r 1 = 225   mm , the machining outer radius of the roller sleeve is R = 250   mm , and the machining radius of the interference area of the shaft end is r x = 226   mm . From Equation (25), p 0 = 100.89   MPa can be obtained, and by substituting this value into Equation (27), M c = 96,409.81   N · m can be obtained.
In the emergency stop state of this unit, the emergency stop angular acceleration β of the roller sleeve is 120 m / s 2 . The diameter of the interference area is d = 452   mm , and the length is L = 190   mm . Taking the maximum driving torque M b = 1979.73   N · m from Section 3 as the torque of the steel strip on the roller sleeve and substituting it into Equation (26), M a = 6154.53   N · m can be obtained. From this, the relative sliding safety factor can be calculated as S h = M c M a = 14.99 .
From the above calculation results, it can be seen that both roller sleeve wall thicknesses of 20 mm and 25 mm satisfy the safety requirements. The corresponding safety factor falls within the reasonable range for engineering design. Therefore, to avoid abnormal conditions during the emergency stop process, the calculated results are considered reasonable. It should be noted that the roller sleeve outer diameter used in this section is 500 mm, and the wrap angle is 30°.

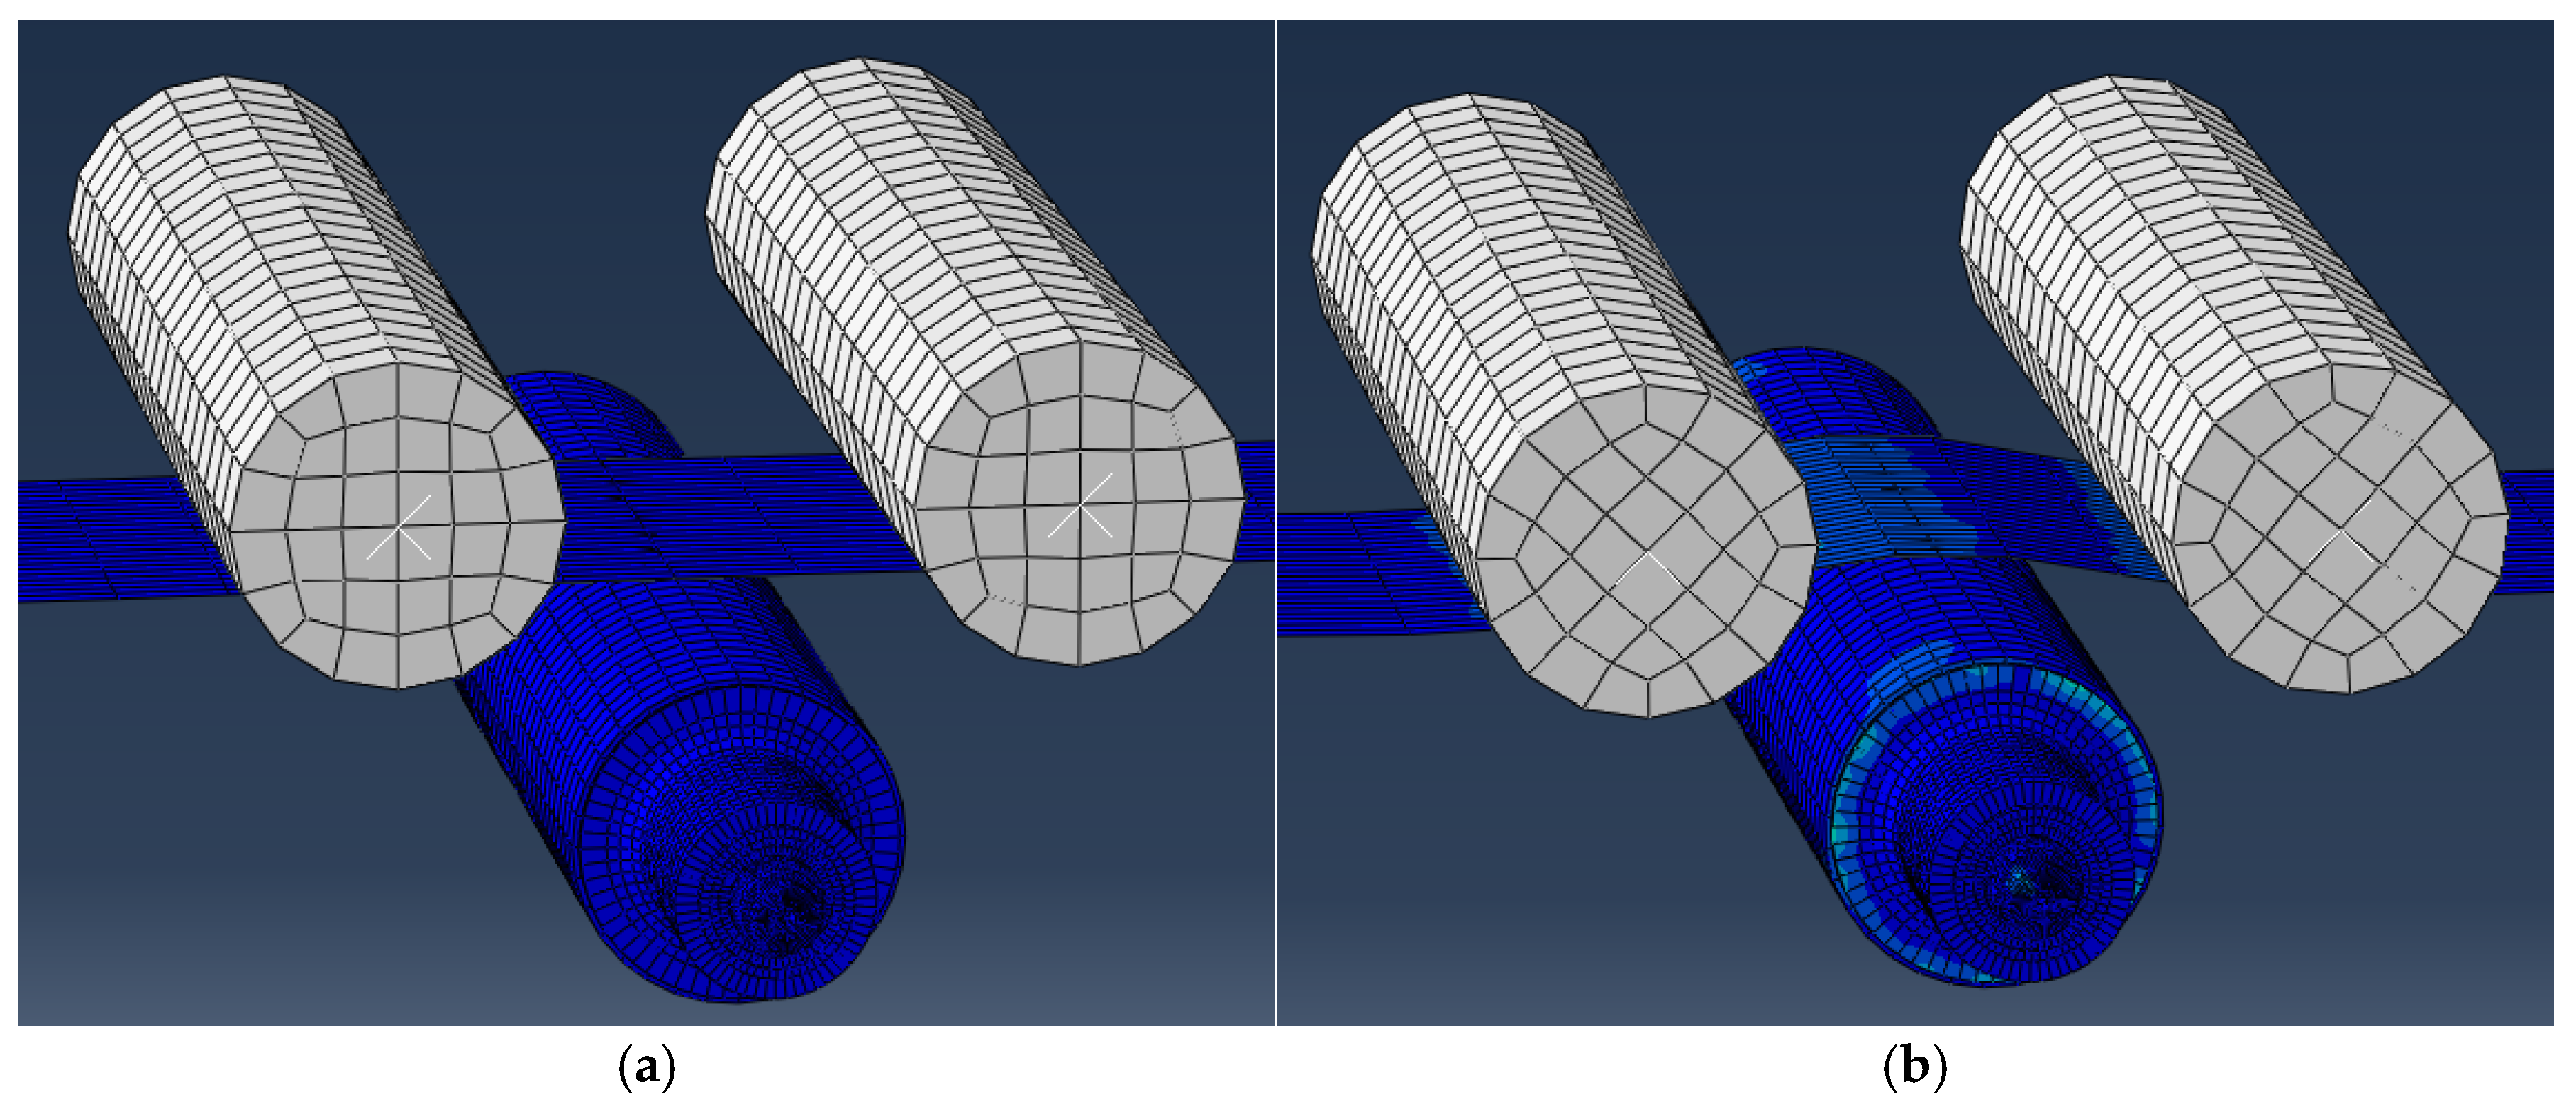
5. Verification by Finite Element Simulation

To analyze the stress distribution on the roller surface caused by the steel strip during the working process of the tension measuring roller, and to analyze the roller surface under different steel strip tensions after optimizing the roller sleeve wall thickness of the tension measuring roller, a model of the tension measuring roller was established using SolidWorks 2024 software, as shown in Figure 11. The three-dimensional model simplifies the overly complex stepped structure of the shaft end, and its dimensions and interaction relationships can be obtained from Figure 2 and Figure 8.
In the Abaqus 2024 software, we set the material properties of the roller sleeve and shaft head materials (42CrMo forged steel, 45# forged steel) as follows: yield strengths of 400 MPa and 600 MPa, respectively, an elastic modulus of 209,000 MPa, and a Poisson’s ratio of 0.3. The outer diameter of the roller sleeve was set to 500 mm, the wrap angle was set to 30°, and a simulation dynamic analysis of the tension measuring roller was performed at a steel strip speed of 130 m/min (the actual production speed of the unit). It should be noted that the tension magnitude used in the simulation process was 35.28 kN, which is consistent with the data used in Table 2. The SolidWorks models of the steel strip and the ①, ②, and ③ tension measuring rollers were imported one by one, and meshes were generated for each. In the mesh partitioning, the global seed approximate global size was set to 200, the maximum deviation factor was 0.1, and the minimum size control–global size ratio was 0.1. Three-dimensional hexahedral elements were employed to discretize the model’s geometry. Hexahedral elements were chosen due to their ability to provide accurate results with a lower number of degrees of freedom than tetrahedral elements, particularly in regions with relatively uniform stress gradients. Reduced integration elements were used to improve the computational efficiency and avoid shear locking issues. Furthermore, the model geometry used in this study was relatively regular, and the mesh distribution was relatively uniform. Considering the relatively regular geometry and the uniform mesh distribution in the critical regions, the influence of mesh density on the key simulation results was limited.
To verify whether slipping occurred between the steel strip and the tension measuring roller, tension was applied to the steel strip and constraints were applied to ensure that it moved tangentially along the tension roller. The tension roller was constrained to rotate about its central axis, and its axial position was fixed. The contact was defined between the steel strip and the tension roller, and Coulomb’s friction law was applied to describe the friction behavior of the contact surface, with the friction coefficient being set to 0.1. As shown in Figure 12a, the torque frictions were taken as the research object, and the simulation results are shown in Figure 12b. After entering the post-processing module for result analysis, the numerical curves of the total tangential force (CFSM) and the total normal force (CFNM) on the contact surface between the steel strip and the ② tension measuring roller were output.
From the analysis in Section 3.2, it is known that steel strip of specification A is more prone to scratch defects. Therefore, a simulation analysis was performed on a steel strip with dimensions of 0.5 × 900 mm using roller sleeve wall thicknesses of 20 mm and 25 mm, separately, to obtain the CFSM and CFNM curves for different roller sleeve wall thicknesses, as shown in Figure 13. According to Coulomb’s friction law, under stable contact, the tangential force (CFSM) should fluctuate near the limit of maximum static friction, i.e., CFSM ≈ μ × CFNM. If slipping occurs between the steel strip and the tension measuring roller, leading to scratch defects, the relationship at this time should be CFSM > μ × CFNM.
From the results shown in Figure 13a, it can be seen that the CFSM repeatedly exceeds μ × CFNM at a roller sleeve wall thickness of 25 mm, which means that the tangential force of the steel strip on the tension measuring roller repeatedly exceeds the limit of maximum static friction. At this time, multiple instances of slipping occurred between the steel strip and the roller sleeve, making scratch defects highly probable. From the results in Figure 13b, it can be seen that the CFSM fluctuates stably near μ × CFNM at a roller sleeve wall thickness of 20 mm, which means that the tangential force of the steel strip on the tension measuring roller is stable near the limit of maximum static friction. At this time, no slipping occurred between the steel strip and the roller sleeve, meaning steel strip scratch defects will not occur in this scenario.

6. Production Trials of the Unit

The parameters after multiple verifications were as follows: a roller sleeve outer diameter of 500 mm, roller sleeve wall thickness of 20 mm, and a wrap angle of 30°. The optimized structural parameters of the tension measuring roller were applied to the unit, and the production status of steel strips of multiple steel grades and specifications was statistically analyzed, as shown in Figure 14. Figure 14 shows that no scratch defects appeared on the surface of the steel strip when either vertical inspection or horizontal inspection was conducted. The results indicate that the optimized structural parameters are suitable for all products of this unit, and that problem of scratch defects on the steel strip has been completely eliminated.

7. Conclusions

This study addressed the issue of frequently occurring scratch defects on the lower surface of steel strips caused by the tension measuring roller during the production process of temper rolling units. The mechanism of scratch formation was deeply analyzed, and the structural parameters of the tension measuring roller were optimized. The following conclusions were drawn:
(1)
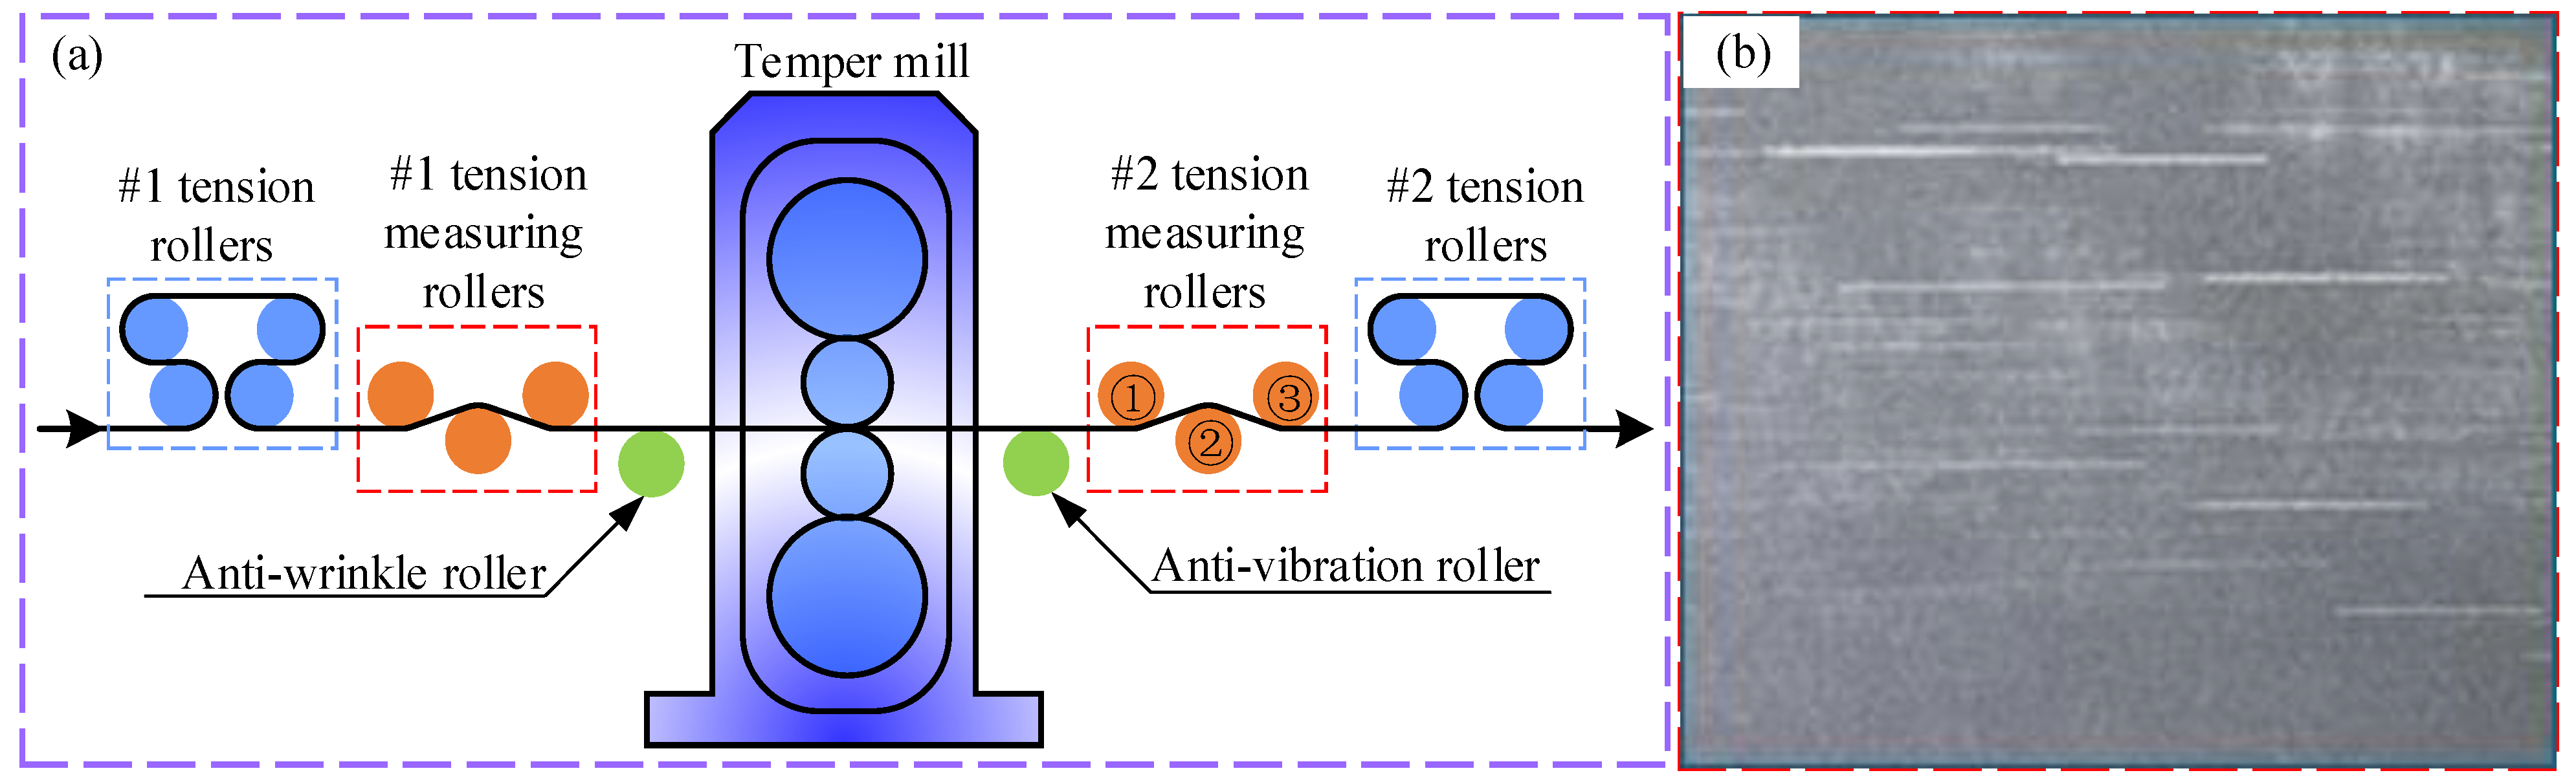
It was confirmed by this research that the steel strip scratch defects caused by the tension measuring roller in temper rolling are due to relative sliding between the steel strip and the tension measuring roller. The fundamental reason for this is that the driving torque of the steel strip on the tension measuring roller is insufficient to overcome its total rotational resistance torque. The steel strip wrap angle, tension measuring roller sleeve outer diameter, and wall thickness are key structural parameters that influence this torque balance.
(2)
The structural parameters of the tension roller were optimized and verified to achieve the ideal warpage, scratching, and connection safety based on theoretical calculations and finite element analysis. By establishing corresponding mechanical models and simulation models, the influence of parameters such as the roller sleeve outer diameter, roller sleeve thickness, and steel strip wrap angle on the amount of steel strip warpage, the driving torque, and the stress on the connection parts was systematically evaluated. In the warpage verification, the results showed that, when the roller sleeve outer diameter was 500 mm, the warpage of the DQ-IF and 590DP steel grades fluctuated from around 1 mm to 1.5 mm, which is far less than 1% of the steel strip length, while 300 mm and 400 mm roller sleeve outer diameters led to warpage as high as 23 mm and 16 mm for some thicknesses, far exceeding the acceptable range. In the scratching verification, by comparing the difference between the driving torque and the total resistance torque, it was found that, under the conditions of a roller sleeve outer diameter of 500 mm and a wrap angle of 30°, when the roller sleeve thickness was 20 mm or 25 mm, the torque difference was positive and retained a certain margin, meeting the safety requirement for no scratching. Finally, comprehensively considering the verification results from all aspects, the optimal solution was determined to be a combination of a roller sleeve outer diameter of 500 mm, a roller sleeve thickness of 20 mm, and a wrap angle of 30°, and this solution satisfies the structural connection safety requirements. In the connection safety verification, the calculation results showed that the relative sliding safety factor met the requirements for both 20 mm and 25 mm roller sleeve thicknesses.
(3)
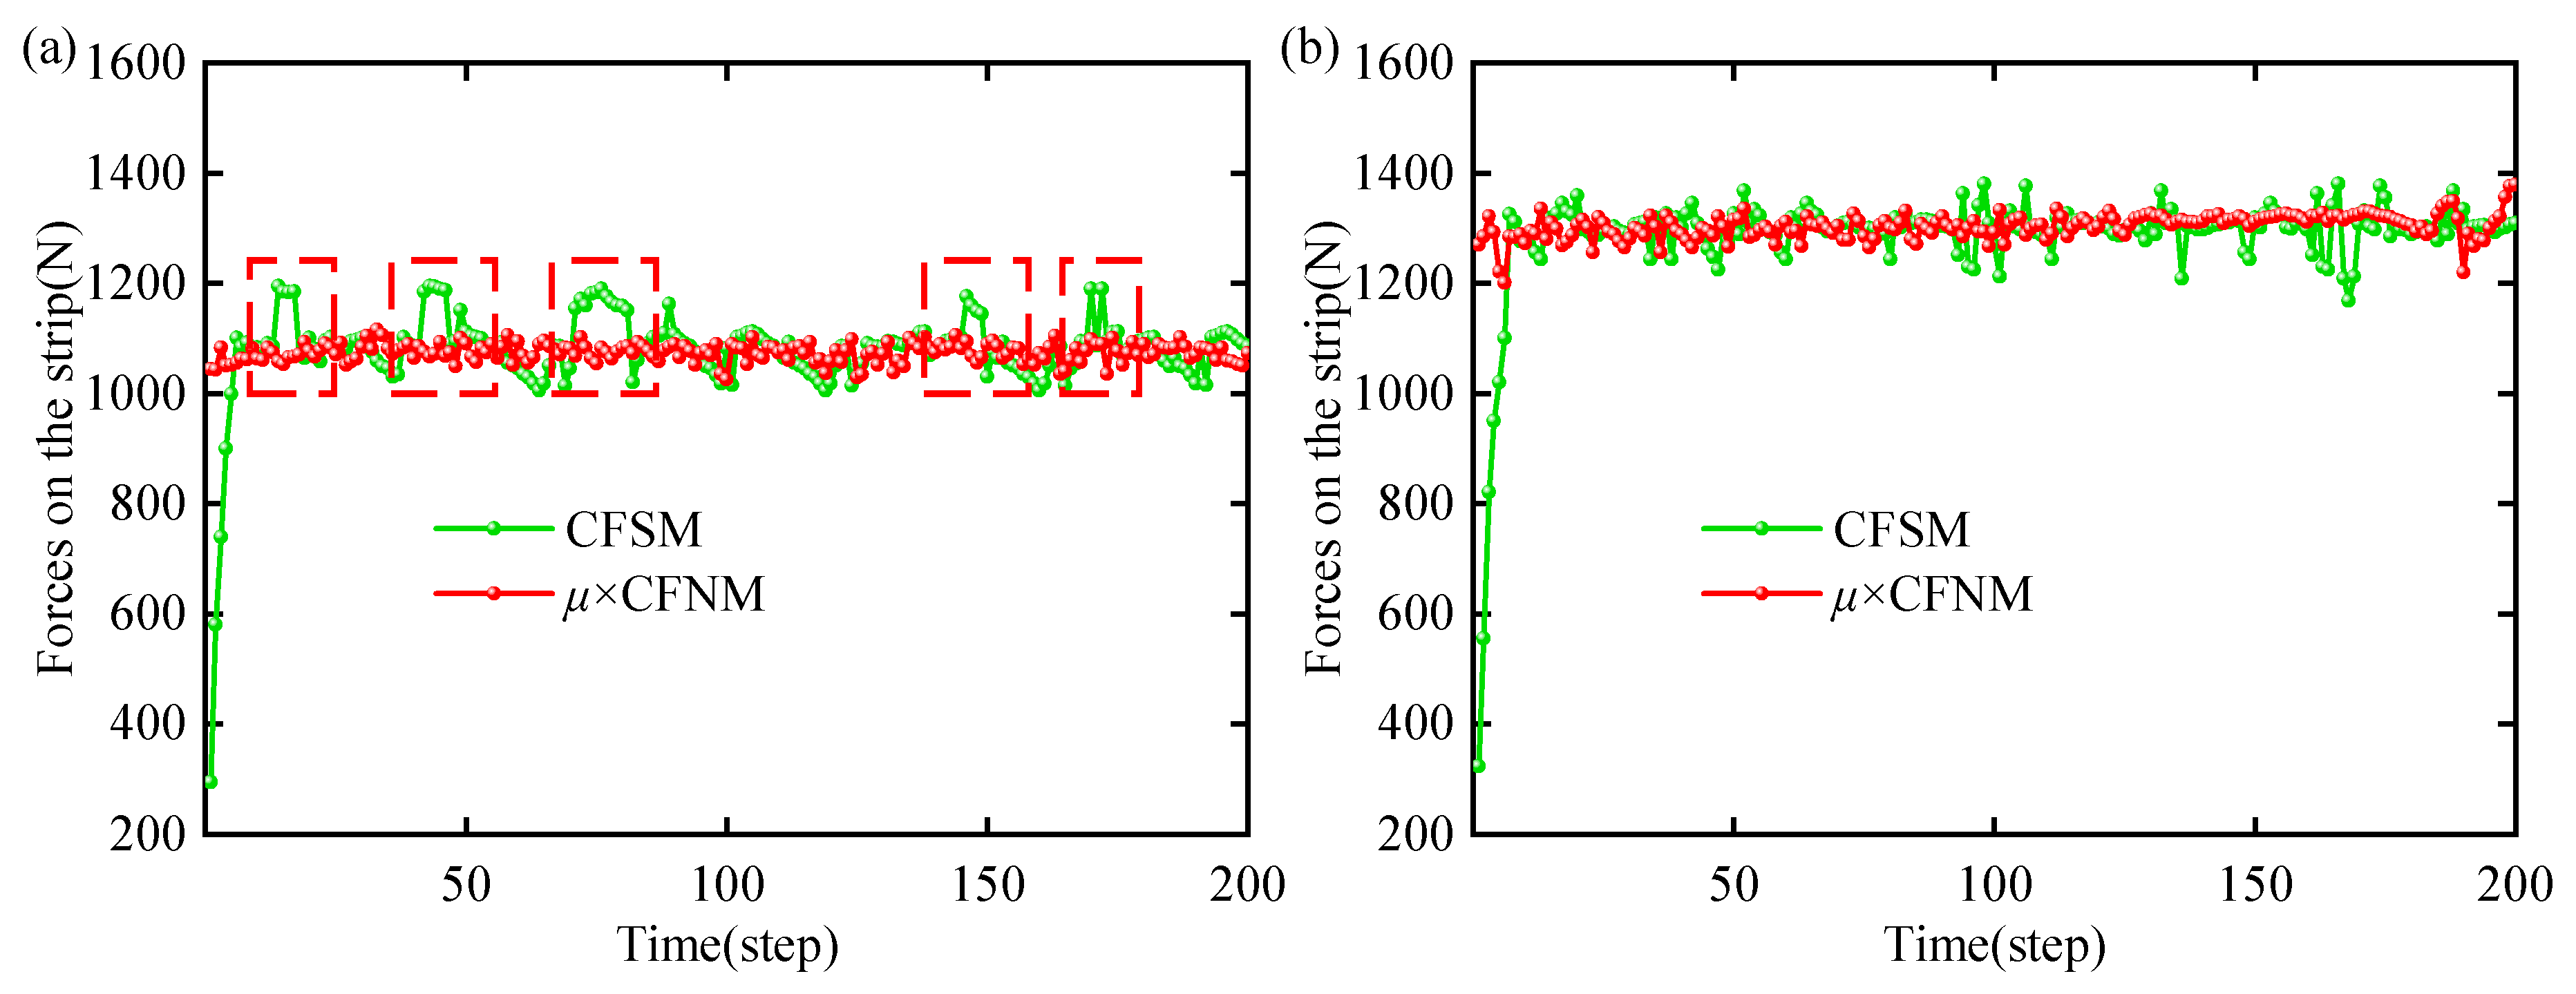
The results of theoretical analysis, finite element simulation, and actual production tests consistently indicated that the optimized tension roller structural parameters can effectively prevent relative sliding between the steel strip and the tension roller, completely eliminating scratch defects on the lower surface of the steel strip. The finite element simulation results show that, when using the optimized parameter combination of a roller sleeve outer diameter of 500 mm, a roller sleeve thickness of 20 mm, and a wrap angle of 30°, the total tangential force (CFSM) on the contact surface between the steel strip and the roller sleeve fluctuates stably around the limit of the maximum static friction force (μ × CFNM), and that there is no situation where the CFSM is consistently greater than μ × CFNM, confirming that no slipping occurred. The actual production tests, after adopting the optimized solution, involved vertical and horizontal inspections on steel strips of multiple steel grades and specifications, and the results showed that scratch defects no longer appeared on the steel strip surfaces, indicating that the scratching problem was completely resolved. The tension roller structural optimization scheme proposed in this study has achieved success in actual industrial applications, indicating that is provides a reliable technical approach to solving the scratching problem in temper rolling.
(4)
In the theoretical analysis and simulation modeling process of this study, some parameters were simplified, and the complexity of the actual production environment may have a certain impact on the results. For example, the friction coefficient may change with factors such as the temperature and lubrication state, while it may have been assumed as a constant in this model. Furthermore, this study mainly conducted detailed verification for specific steel grades and specifications. When extending the optimized solution to other steel grades and a wider range of thicknesses, further verification and adaptive adjustments are needed. Future research can consider introducing more complex models to more comprehensively consider various influencing factors in the actual production environment, which would thereby further enhance the universality and robustness of the optimized solution.

Author Contributions

Conceptualization, J.Z. (Ji Zhang) and Z.W.; methodology, S.Z.; software, S.Z.; formal analysis, J.Z. (Ji Zhang) and J.Z. (Jiahao Zhu); data curation, Z.W. and J.Z. (Jiahao Zhu); writing—original draft preparation, J.Z. (Ji Zhang); writing—review and editing, Z.B.; funding acquisition, Z.B. All authors have read and agreed to the published version of the manuscript.

Funding

This research was funded by Hebei Natural Science Foundation (E2024203125); Science Research Project of Hebei Education Department (CXY2023012); S&T Program of Hebei (23280101Z); S&T Program of Hebei (22281001Z).

Data Availability Statement

The original contributions presented in the study are included in the. article: further inquiries can be directed to the corresponding author.

Conflicts of Interest

The authors declare no conflicts of interest.

References

  1. Li, X.; Schulte, C.; Abel, D.; Teller, M.; Hirt, G.; Lohmar, J. Modeling and exploiting the strip tension influence on surface imprinting during temper rolling of cold-rolled steel. Adv. Ind. Manuf. Eng. 2021, 3, 100045. [Google Scholar] [CrossRef]
  2. Ogarkov, N.N.; Yu Zvyagina, E. Influence of disturbances in temper mills on work roll surface reproduction onto temper-rolled strips. Metallurgist 2025, 68, 1455–1461. [Google Scholar] [CrossRef]
  3. Xu, D.; Yang, Q.; Wang, X.; He, H.; Sun, Y.; Li, W. An experimental investigation of steel surface topography transfer by cold rolling. Micromachines 2020, 11, 916. [Google Scholar] [CrossRef] [PubMed]
  4. Li, R.; Zhang, Q.; Zhang, X.; Yu, M.; Wang, B. Control method for steel strip roughness in two-stand temper mill rolling. Chin. J. Mech. Eng. 2015, 28, 573–579. [Google Scholar] [CrossRef]
  5. Wang, R.; Bai, Z.H.; Du, J.C.; Wang, Y.X.; Cui, Y.Y.; Guo, Z.S.; Song, Z.F. Comprehensive tension setting optimisation technique for a cold rolled strip during continuous annealing. Ironmak. Steelmak. 2018, 45, 523–527. [Google Scholar] [CrossRef]
  6. Wang, D.C.; Liu, H.M.; Liu, J. Research and development trend of shape control for cold rolling strip. Chin. J. Mech. Eng. 2017, 30, 1248–1261. [Google Scholar] [CrossRef]
  7. Li, C.S.; Chen, J.S.; Han, W.L.; Li, Y.Y.; Fu, B. Thermal Scratch on Surface of SUS430 Stainless Steel Strip in Cold Rolling Process. J. Iron Steel Res. Int. 2014, 21, 282–286. [Google Scholar] [CrossRef]
  8. Chen, J.S.; Li, C.S. Prediction and control of thermal scratch defect on surface of strip in tandem cold rolling. J. Iron Steel Res. Int. 2015, 22, 106–114. [Google Scholar] [CrossRef]
  9. Kenmochi, K.; Yarita, I.; Abe, H.; Fukuhara, A.; Komatu, T.; Kaito, H. Effect of micro-defects on the surface brightness of cold-rolled stainless-steel strip. J. Mater. Process. Technol. 1997, 69, 106–111. [Google Scholar] [CrossRef]
  10. Lu, J.; Zhu, M.; Ma, X.; Wu, K. Steel strip surface defect detection method based on improved YOLOv5s. Biomimetics 2024, 9, 28. [Google Scholar] [CrossRef]
  11. Tang, B.; Chen, L.; Sun, W.; Lin, Z.K. Review of surface defect detection of steel products based on machine vision. IET Image Process. 2023, 17, 303–322. [Google Scholar] [CrossRef]
  12. Song, S.H.; Sul, S.K. A new tension controller for continuous strip processing line. IEEE Trans. Ind. Appl. 2000, 36, 633–639. [Google Scholar] [CrossRef]
  13. Sutcliffe, M.P.F.; Rayner, P.J. Experimental measurements of load and strip profile in thin strip rolling. Int. J. Mech. Sci. 1998, 40, 887–899. [Google Scholar] [CrossRef]
  14. Hrabovský, L.; Nenička, P.; Fries, J. Laboratory machine verification of force transmission provided by friction acting on the drive drum of a conveyor belt. Machines 2023, 11, 544. [Google Scholar] [CrossRef]
  15. Coubrough, G.J.; Alinger, M.J.; Van Tyne, C.J. Angle of contact between sheet and die during stretch–bend deformation as determined on the bending-under-tension friction test system. J. Mater. Process. Technol. 2002, 130, 69–75. [Google Scholar] [CrossRef]
  16. Kumar, S.; Edachery, V.; Velpula, S.; Govindaraju, A.; Choudhury, S.K.; Kailas, S.V. Influence of surface roughness, friction coefficient, and wrap angle on clinching joint strength and its correlation with belt friction phenomenon. Proc. Inst. Mech. Eng. Part J J. Eng. Tribol. 2022, 236, 326–337. [Google Scholar] [CrossRef]
  17. Horng, J.H.; Lin, J.F.; Li, K.Y. Effect of surface roughness on steel roller scuffing. Wear 1995, 184, 203–212. [Google Scholar] [CrossRef]
  18. Whitworth, D.P.D.; Harrison, M.C. Tension variations in pliable material in production machinery. Appl. Math. Model. 1983, 7, 189–196. [Google Scholar] [CrossRef]
  19. Xu, X.M.; Zhang, W.X.; Ding, X.L.; Zhang, M.; Wei, S.H. Design and analysis of a novel tension control method for winding machine. Chin. J. Mech. Eng. 2018, 31, 101. [Google Scholar] [CrossRef]
  20. Noh, J.; Lee, Y.; Kim, M.; Lee, C. Control of Fluctuational Tension in Roll-to-Roll Manufacturing Systems under Acceleration and Deceleration Conditions. Int. J. Precis. Eng. Manuf. Green Technol. 2025, 1, 1–16. [Google Scholar] [CrossRef]
  21. Hwang, J.K.; Kim, S.J.; Kim, K.J. Influence of Roll Diameter on Material Deformation and Properties during Wire Flat Rolling. Appl. Sci. 2021, 11, 8381. [Google Scholar] [CrossRef]
  22. Li, B.; Li, P.; Zhou, R.; Feng, X.Q.; Zhou, K. Contact mechanics in tribological and contact damage-related problems: A review. Tribol. Int. 2022, 171, 107534. [Google Scholar] [CrossRef]
  23. Ning, K.; Wang, J.; Li, P.; Xiang, D.; Hou, D. Multi-objective intelligent cooperative design for interference fit of the conical sleeve. J. Mech. Sci. Technol. 2021, 35, 3569–3578. [Google Scholar] [CrossRef]
  24. Ma, L.; Ma, Z.; Jia, W.; Lv, Y.; Jiang, Y.; Xu, H.; Liu, P. Research and verification on neutral layer offset of bar in two-roll straightening process. Int. J. Adv. Manuf. Technol. 2015, 79, 1519–1529. [Google Scholar] [CrossRef]
  25. Jiang, Z.Y.; Tieu, A.K. Elastic–plastic finite element method simulation of thin strip with tension in cold rolling. J. Mater. Process. Technol. 2002, 130, 511–515. [Google Scholar] [CrossRef]
  26. Xiao, H.; Ren, Z.; Liu, X. New mechanism describing the limiting producible thickness in ultra-thin strip rolling. Int. J. Mech. Sci. 2017, 133, 788–793. [Google Scholar] [CrossRef]
  27. Kasai, D.; Komori, A.; Ishii, A.; Yamada, K.; Ogawa, S. Strip warpage behavior and mechanism in single roll driven rolling. ISIJ Int. 2016, 56, 1815–1824. [Google Scholar] [CrossRef]
  28. Nakahara, T.; Baek, K.S.; Chen, H.; Ishida, M. Relationship between surface oxide layer and transient traction characteristics for two steel rollers under unlubricated and water lubricated conditions. Wear 2011, 271, 25–31. [Google Scholar] [CrossRef]
  29. Bayoumi, L.S.; Lee, Y. Effect of interstand tension on roll load, torque and workpiece deformation in the rod rolling process. J. Mater. Process. Technol. 2004, 145, 7–13. [Google Scholar] [CrossRef]
  30. Hashimoto, H. Friction characteristics between paper and steel roller under mixed lubrication. Proc. Inst. Mech. Eng. Part J J. Eng. Tribol. 2012, 226, 1127–1140. [Google Scholar] [CrossRef]
  31. Marconnet, P.; Pottier, B.; Rasolofondraibe, L.; Dron, J.P.; Kerroumi, S. Measuring load distribution on the outer raceways of rotating machines. Mech. Syst. Signal Process. 2016, 66, 582–596. [Google Scholar] [CrossRef]
  32. Biron, G.; Vadean, A.; Tudose, L. Optimal design of interference fit assemblies subjected to fatigue loads: A sequential approximate multi-objective optimization approach. Struct. Multidiscip. Optim. 2013, 47, 441–451. [Google Scholar] [CrossRef]
  33. Wu, H.M.; Liu, H.M.; Yu, B.Q.; Yang, L.P. Determination of interference fit value on entire roller embedded shapemeter roll. J. Cent. South Univ. 2014, 21, 4503–4508. [Google Scholar] [CrossRef]
  34. Park, Y. Correlation analysis between coiling tension and the sleeve’s hoop stress. Mech. Ind. 2024, 25, 33. [Google Scholar] [CrossRef]
Figure 1. Temper mill unit layout and steel strip scratch defects: (a) temper mill unit layout; (b) steel strip scratch defects.
Metals 15 00593 g001
Figure 2. Schematic diagram of tension measuring roller structure.
Metals 15 00593 g002
Figure 3. Positional relationship and stress distribution of tension measuring roller and steel strip: (a) positional relationship between tension measuring roller and steel strip; (b) stress diagram of double-sided plastic deformation; (c) stress diagram of single-sided plastic deformation.
Metals 15 00593 g003
Figure 4. Schematic diagram of steel strip warpage geometric relationship.
Metals 15 00593 g004
Figure 5. Influence of different steel grades and steel strip thicknesses on warpage amount: (a) DQ-IF steel grade; (b) 590DP steel grade; (c) CQ steel grade.
Metals 15 00593 g005
Figure 6. Influence of different tensions on warpage amount: (a) DQ-IF steel grade; (b) 590DP steel grade; (c) CQ steel grade.
Metals 15 00593 g006
Figure 7. Influence of different wrap angles on warpage amount.
Metals 15 00593 g007
Figure 8. Schematic diagram of cross-sectional force analysis of tension measuring roller shaft end area.
Metals 15 00593 g008
Figure 9. Torque difference for different structural parameters and steel strip specifications.
Metals 15 00593 g009
Figure 10. Stress and deformation in the interference area of roller sleeve and shaft end.
Metals 15 00593 g010
Figure 11. Three-dimensional assembly drawing of tension measuring roller.
Metals 15 00593 g011
Figure 12. Finite element simulation process. (a) ② Tension roller and steel strip; (b) schematic diagram of simulation results.
Metals 15 00593 g012
Figure 13. Statistical results of steel strip force. (a) Simulation results for 25 mm roller sleeve thickness; (b) simulation results for 20 mm roller sleeve thickness. The red dotted squares means that the tangential force of the steel strip on the tension measuring roller repeatedly exceeds the limit of maximum static friction.
Metals 15 00593 g013
Figure 14. Steel strip surface quality inspection after optimization of tension measuring roller structural parameters: (a) vertical inspection of steel strip surface quality; (b) horizontal inspection of steel strip surface quality.
Metals 15 00593 g014
Table 1. Proposed optimized structural parameter values of the tension measuring roller.
ParameterExisting ValueOptimized Value 1Optimized Value 2
Roller Sleeve Outer Diameter (mm)500400300
Roller Sleeve Wall Thickness (mm)302520
Steel Strip Wrap Angle (°)202530
Table 2. Steel strip parameters.
Steel Strip CodeABC
Steel GradeDQ-IFDQ-IFCQ
Steel Strip Specification (mm)0.5 × 9000.7 × 13002.0 × 1600
Entry Tension T2 (kN)35.2853.51147.39
Table 3. Scratch verification of steel strips of various specifications at a wrap angle of 20°.
Steel Strip CodeRoller Sleeve Wall Thickness (mm)Exit Tension T1 (kN)Radial Load P0 (kN)Inertial Torque (N·m)Bearing Seal Resistance Torque (N·m)Total Resistance Torque (N·m)Driving Torque (N·m)
A2036.524.1174.4120.5294.9313.2
2536.525.3198.8126.2325.1313.2
3036.526.4221.6131.9353.5313.2
B2055.430.5174.4152.7327.1475.0
2555.431.7198.8158.4357.3475.0
3055.432.8221.6164.1385.7475.0
C20152.663.7174.4318.6493.01308.3
25152.664.9198.8324.4523.21308.3
30152.666.0221.6330.0551.71308.3
Table 4. Scratch verification of steel strips of various specifications at a wrap angle of 25°.
Steel Strip CodeRoller Sleeve Wall Thickness (mm)Exit Tension T1 (kN)Radial Load P0 (kN)Inertial Torque (N·m)Bearing Seal Resistance Torque (N·m)Total Resistance Torque (N·m)Driving Torque (N·m)
A2036.927.2174.4136.2310.6393.2
2536.928.4198.8141.9340.8393.2
3036.929.5221.6147.6369.2393.2
B2055.935.3174.4176.5350.9596.3
2555.926.5198.8198.8381.1596.3
3055.927.6221.6221.6409.6596.3
C20154.076.8174.4384.2558.71642.5
25154.078.0198.8390.0588.81642.5
30154.079.1221.6395.7617.31642.5
Table 5. Scratch verification of steel strips of various specifications at a wrap angle of 30°.
Steel Strip CodeRoller Sleeve Wall Thickness (mm)Exit Tension T1 (kN)Radial Load P0 (kN)Inertial Torque (N·m)Bearing Seal Resistance Torque (N·m)Total Resistance Torque (N·m)Driving Torque (N·m)
A2037.230.4174.4151.9326.3473.9
2537.231.5198.8157.6356.5473.9
3037.232.7221.6163.3384.9473.9
B2056.440.1174.4200.3374.7718.7
2556.441.2198.8206.1404.9718.7
3056.442.4221.6211.7433.4718.7
C20155.390.0174.4449.8624.31979.7
25155.391.1198.8455.6654.41979.7
30155.392.3221.6461.3682.91979.7
Disclaimer/Publisher’s Note: The statements, opinions and data contained in all publications are solely those of the individual author(s) and contributor(s) and not of MDPI and/or the editor(s). MDPI and/or the editor(s) disclaim responsibility for any injury to people or property resulting from any ideas, methods, instructions or products referred to in the content.

