Article

High-Speed Bearing Reliability: Analysis of Tapered Roller Bearing Performance and Cage Fracture Mechanisms

1
School of Mechatronic Engineering and Automation, Shanghai University, Shanghai 200444, China
2
School of Materials Science and Engineering, Shanghai Jiao Tong University, Shanghai 200240, China
3
School of Materials Science and Engineering, Tianjin University, Tianjin 300350, China
4
Department of Engineering and Computer Science, New York University Shanghai, Shanghai 200124, China
*
Author to whom correspondence should be addressed.
Metals 2025, 15(6), 592; https://doi.org/10.3390/met15060592
Submission received: 26 March 2025 / Revised: 20 May 2025 / Accepted: 20 May 2025 / Published: 26 May 2025

Abstract

This investigation examines the fracture mechanisms of 31,311 tapered roller bearing cages using finite element analysis (FEA) and the Gurson–Tvergaard–Needleman (GTN) damage model. Static, dynamic, modal, and harmonic response analyses identify critical stress concentrations at the contact interface between the rolling elements and the outer ring, with maximum deformation occurring in the inner ring. Modal analysis excludes resonance as a potential failure cause. Crack initiation and propagation studies reveal that cracks predominantly form at the pocket bridge corners, propagating circumferentially. The propagation angle increases under circumferential and coupled loading conditions while remaining constant under longitudinal loading. Based on the GTN model, this study is the first to examine the crack propagation and fracture toughness of the cage under various loading conditions. The results indicate that longitudinal loading (Load II) yields the highest fracture toughness, significantly surpassing those under circumferential (Load I) and coupled loading (Load III). Load II exhibits the strongest crack growth resistance, with a peak CTODc of 0.598 mm, attributed to plastic strain accumulation. Fracture toughness decreases with crack depth, as CTODc declines by 66.5%, 20.1%, and 58.4% for Loads I, II, and III, respectively. Crack deflection angles show the greatest variation under Load I (35% increase), while Loads II and III demonstrate minimal sensitivity (<10% change). The optimization of the bearing cage pocket hole fillet radius from 0 mm to 0.75 mm demonstrates a maximum stress concentration reduction of 38.2% across different load conditions. This work introduces a novel methodology for predicting cage fracture behavior and optimizing design, offering valuable insights to enhance the reliability and longevity of systems in high-speed, high-load applications.

1. Introduction

Rolling bearings are essential mechanical components widely employed in rotating machinery across the aerospace, wind power, and transportation industries [1]. With increasing demands for higher rotational speeds and greater load capacities in modern equipment, ensuring bearing reliability under extreme operating conditions has become a critical engineering challenge [2,3]. Among the various bearing components, the cage is particularly susceptible to fracture failure, posing substantial risks to mechanical systems [4,5]. Analysis of industrial failure cases reveals three principal consequences of bearing cage fractures [6,7,8,9]: (1) complete bearing seizure, leading to system failure and operational delays; (2) secondary damage to adjacent components, increasing maintenance costs; and (3) potential safety hazards, particularly in critical applications. These failures predominantly arise from stress concentrations at the corners of the cage pockets. However, the underlying fracture mechanism is a complex interplay of mechanical loads, material defects, and lubrication conditions, making it a complex and multifactorial issue to resolve.
The main causes of bearing cage fracture include the following: (1) insufficient lubrication, leading to adhesive wear and abnormal loads on the cage; (2) creep phenomena resulting from inadequate interference fits, causing load shifts and positional deviations; (3) abnormal loads due to misalignment or improper installation, which increase frictional heat and induce spalling; (4) material defects such as cracks, inclusions, or riveting flaws; (5) the ingress of hard foreign particles, accelerating wear; (6) direct cage wear from abrasive contaminants; (7) obstruction by foreign particles in the raceway; (8) vibration-induced fatigue cracking; and (9) excessive rotational speed exceeding the cage’s design limits. These factors collectively exacerbate cage degradation and increase the likelihood of fracture [8,9,10,11,12,13,14].
In response to growing performance demands in industrial applications, research on bearing cages has expanded significantly. Current studies focus on failure mechanisms, material and manufacturing innovations, dynamic behavior, lubrication performance, and fault diagnosis. Wang et al. [15] established a rigid–flexible coupling model in ADAMS, showing that axial force and guide clearance critically influence cage dynamics. Xiao et al. [16] linked cage fracture in a wind turbine to improper spacer installation through metallographic and fracture analysis. You et al. [17] combined laser sensing and simulation to demonstrate that cage trajectory stability initially increases then decreases with rotational speed, and deflection error inversely correlates with stability. These studies inform cage design, diagnosis, and optimization. Chen et al. [18] used molecular dynamics to investigate lubricant flow in porous polyimide retainers, finding that centrifugal force overcomes capillary effects and that larger pores and higher speeds enhance lubricant supply. High-performance polymers and composite coatings have improved wear and fatigue resistance. Zhang et al. [19] used FDM to fabricate PEEK-based self-lubricating cages; post-treatment, the 50% porogen sample showed optimal mechanical and tribological properties. Dynamic and lubrication analyses via simulation and experiments have optimized lubrication strategies. Li et al. [20] modeled a bearing with a fractured cage, revealing erratic ball motion, increased vibration, and aggravated wear. Wang et al. [21] introduced a cylindrical pocket texture and used volume fraction and multi-reference models to demonstrate improved oil retention, pressure distribution, and lubrication. Bearing cage failures typically initiate at roller end contacts or pocket corners and are strongly affected by load, lubrication, and material properties [22,23].
Despite these advances, challenges remain in accurately predicting cage failure. Existing studies emphasize wear and deformation while often neglecting fracture mechanics. Common life models, such as ISO 281 [24] and the Harris–Palmgren method, rely on empirical or simplified stress assumptions, failing to capture localized stress gradients or micromechanical damage processes. High-speed dynamic effects are frequently oversimplified, limiting their application to modern systems.
To address these limitations, this study adopts the GTN model—a micromechanics-based framework for ductile fracture prediction. The GTN model incorporates (1) void nucleation at defects, (2) stress-driven void growth, and (3) void coalescence into macrocracks. Unlike empirical methods, it captures damage evolution directly, improving predictive accuracy for failure initiation and progression [25,26].
In addition to modeling, surface morphology and microstructure analyses offer key insights into failure mechanisms. They reveal cracks, voids, grain boundaries, and phase distributions, identifying stress concentrations, corrosion sites, and fatigue origins. Perna et al. [27] correlated surface roughness with fracture mechanisms in Ti-48Al-2Cr-2Nb alloys using tensile/fatigue tests and confocal microscopy, showing that roughness varies with temperature and microstructure—an approach applicable to bearing failures. Ren et al. [28] investigated rolling contact fatigue (RCF) in bearing steel through 3D crack reconstruction and mixed-mode finite element analysis. Cracks initiating at 15–30° showed the highest propagation rates, clarifying differences between micro-pitting and spalling.
These experimental approaches elucidate failure behavior under service conditions. However, the GTN model provides a cost-effective, physics-based alternative capable of simulating crack initiation and propagation under varied and complex loading, especially where experiments are infeasible. Its integration of material damage evolution enhances reliability in high-speed bearing design.
In this study, we present an integrated methodology that combines multibody dynamics simulation with GTN-based fracture analysis. This approach enables (1) the precise identification of stress concentration sites through transient dynamic analysis, (2) the quantitative prediction of crack initiation and propagation paths, and (3) the data-driven optimization of cage geometry. The proposed methodology was experimentally validated using accelerated life tests under representative operating conditions [25,26].
This study focuses on the 31,311 tapered roller bearing used in gearboxes. A dynamic model of the tapered roller bearing was developed using finite element analysis to conduct comprehensive dynamic, modal, and harmonic response analyses of the cage, eliminating the effects of resonance. A crack was introduced at the crack initiation site, identified at the location of maximum stress, and the GTN-based fracture model was employed to investigate the fracture mechanism and predict crack propagation. This research provides a methodological framework for the analysis and prediction of cage fractures, offering valuable insights for improving the reliability of bearing systems in demanding industrial applications.
Given the challenges of monitoring crack propagation during high-speed bearing operations, predictive analysis emerges as a crucial tool. The methodology developed in this study offers valuable insights for bearing failure analysis, cage fracture investigation, and cage parameter optimization. This work primarily introduces a fracture mechanics-based approach to predict cage fracture behavior, leveraging the GTN meso-damage model. The complete methodological framework employed in this study is illustrated in Figure 1, providing a visual representation of the integrated approach from finite element analysis to crack propagation prediction and optimization. The significance of this work contributes not only to fundamental understanding but also to practical applications. These advances are particularly valuable for next-generation bearing systems requiring enhanced reliability and extended operational longevity.

2. Modal Analysis Theory and GTN Microscopic Damage Model

2.1. Modal Analysis Theory
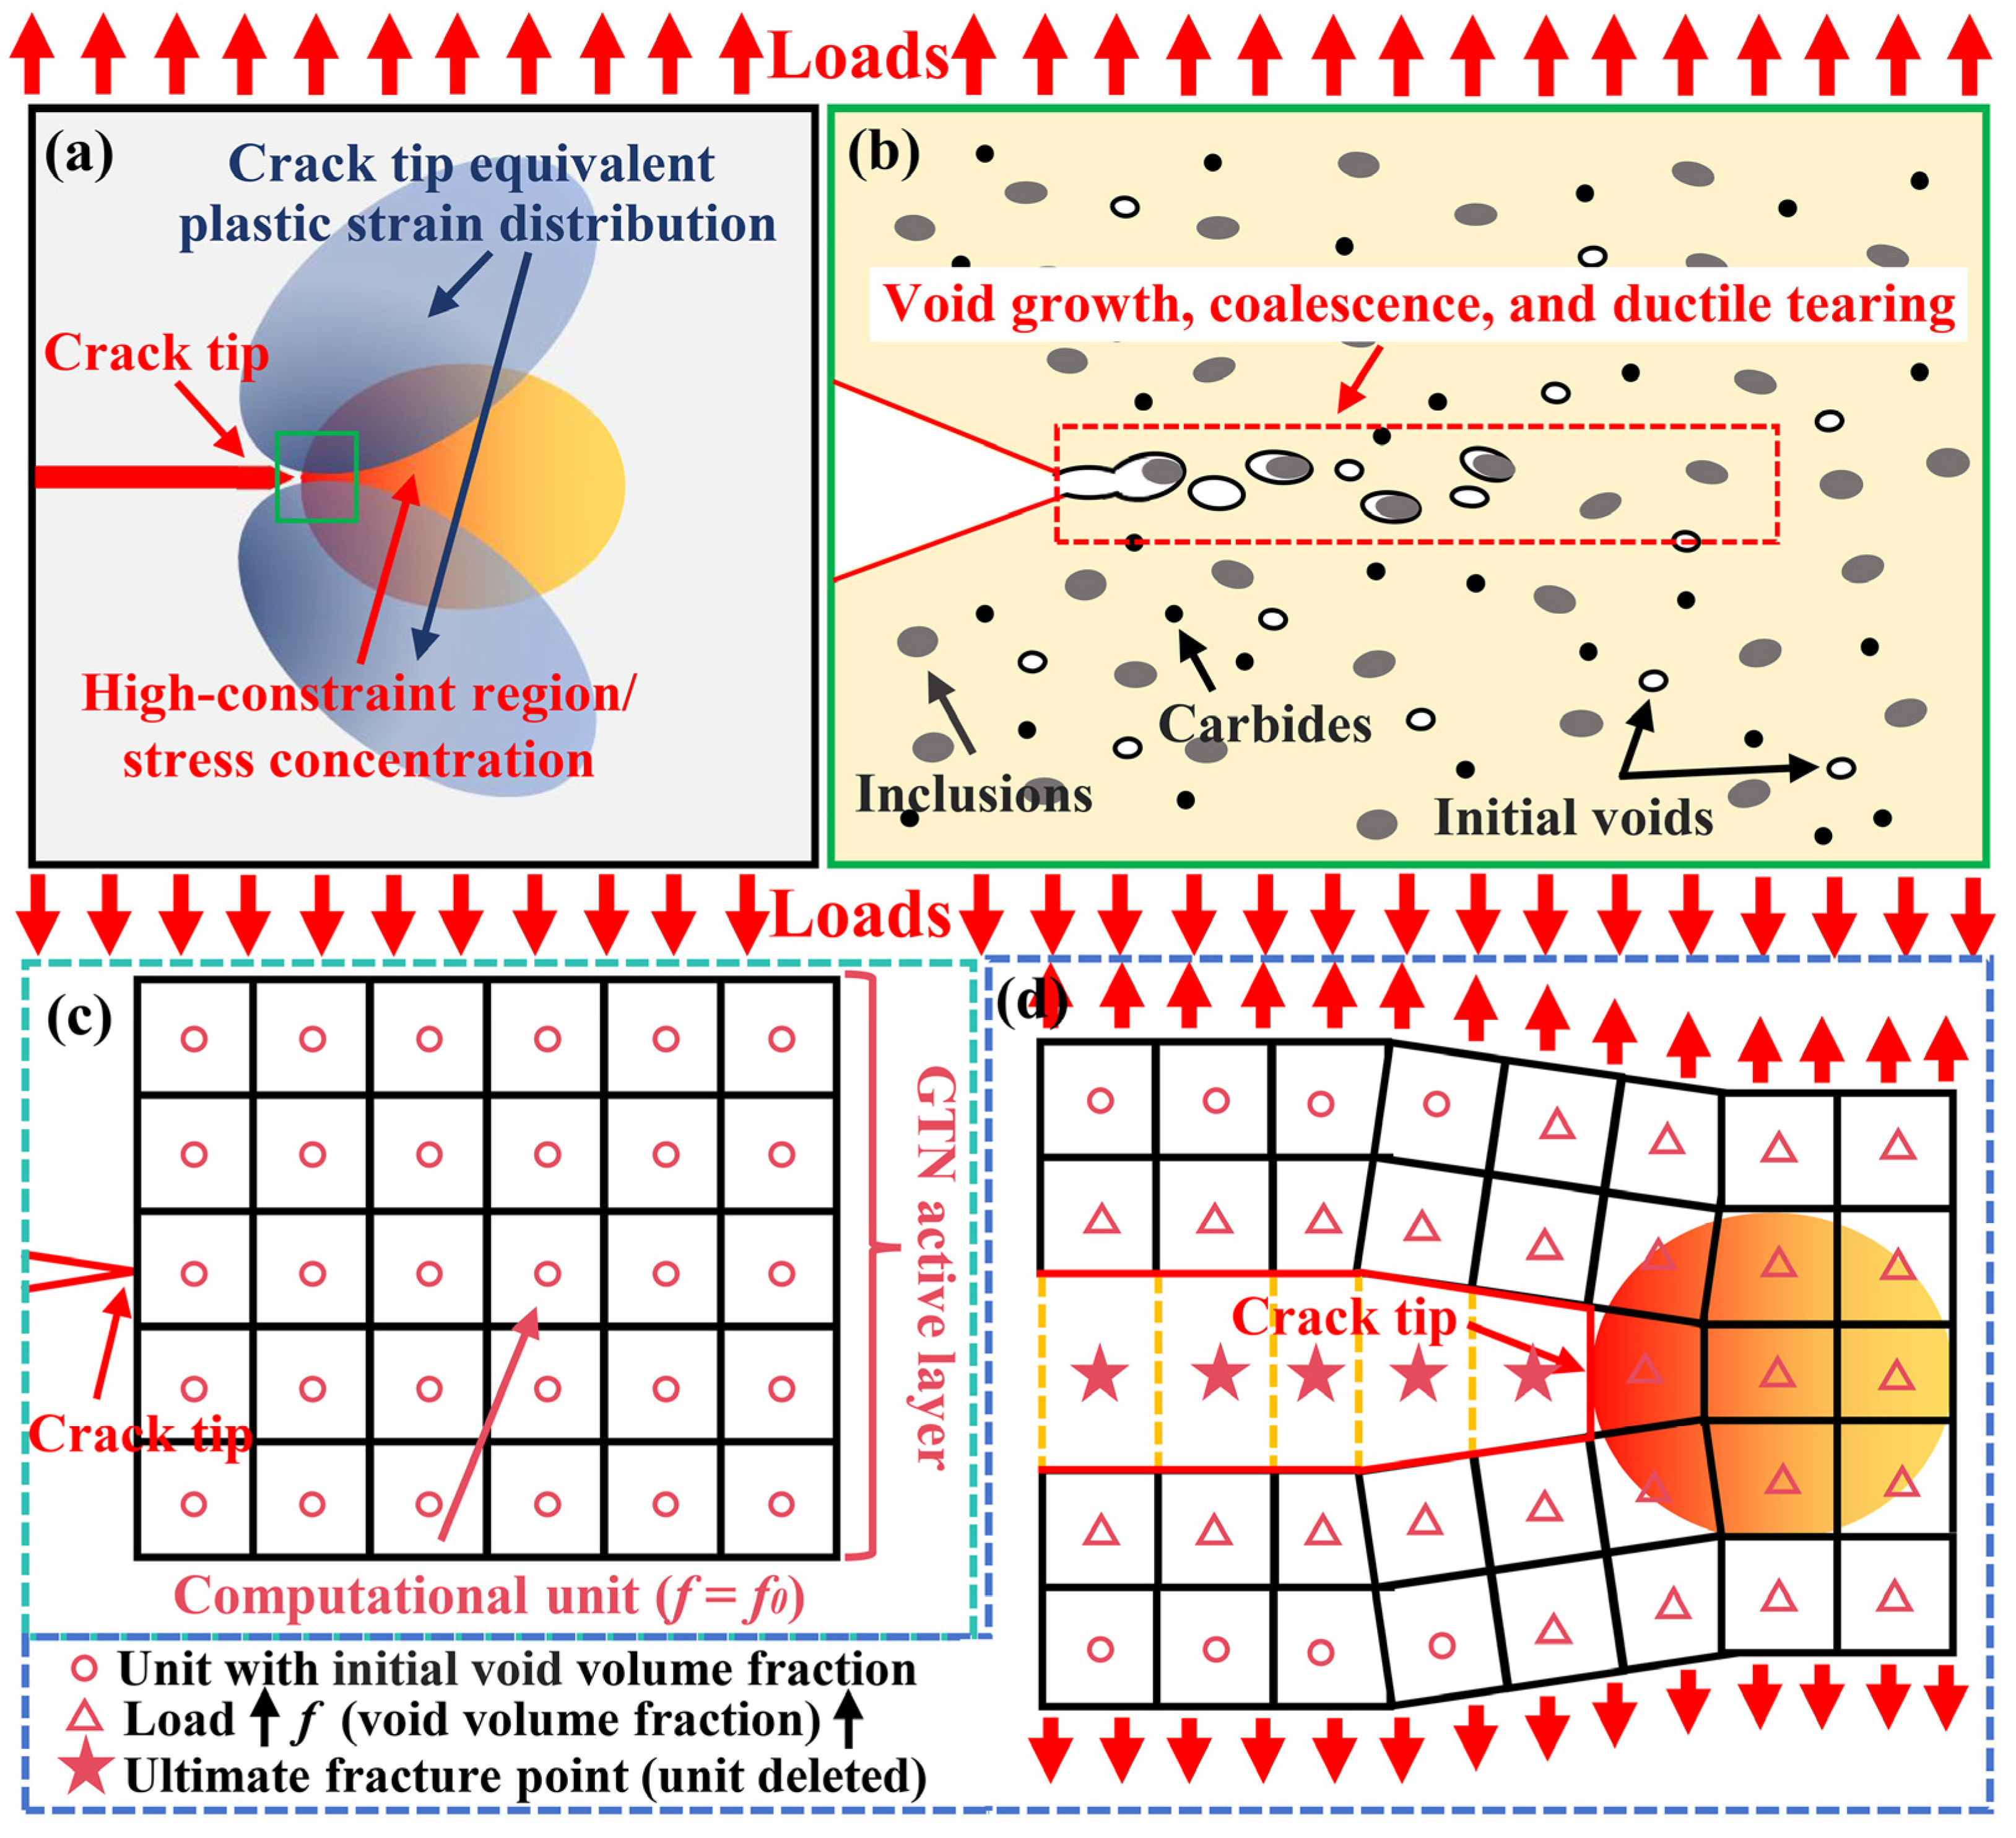
For analytical purposes, bearings can be modeled as continuous solid structures consisting of distinct interconnected components. According to the theory of dynamics, the bearing system can be equivalent to a discrete system with N degrees of freedom. The undamped vibration differential equation of the system is established as follows [29,30]:
M u ¨ + K u = 0
In the formula, M is the mass matrix, u ¨ is the acceleration vector, K is the stiffness matrix, and u is the displacement vector.
u = φ i cos ω i t
In the formula, φi is the i-th order vibration mode of the system, ωi is the i-th order natural circular frequency of the system, and t is time.
According to the vibration mechanics of mechanical systems, the amplitude φi of each node cannot be completely zero when the system is in free vibration. Equation (3) is the characteristic equation of the free vibration of the system [29]:
K ω i M = 0
The i-th order natural circular frequency ωi and natural frequency fi are established in Equation (4):
ω i = K / M ,   f i = ω i / 2 π

2.2. GTN Model

The meso-damage mechanics theory delineates the fracture process into three distinct stages: nucleation, growth, and coalescence of micro-voids [31,32]. Homogeneous materials are composed of a matrix of ductile material and micro-voids, which are prone to form at grain boundaries, interfaces between second-phase particles, and inclusions within the matrix. As stress increases, the volume of the micro-voids expands until it reaches a critical void volume fraction, leading to the formation of localized shear bands with adjacent voids, thereby causing void coalescence and the initiation of microcracks. These cracks propagate continuously, culminating in ductile fracture [31]. In finite element simulation, the propagation of cracks is represented by the failure of element meshes, as illustrated in Figure 2. Herein, Figure 2a schematically illustrates the stress concentration at the crack tip and the distribution of equivalent plastic strain. Under the combined effects of stress concentration and high constraint, the region ahead of the crack tip undergoes distinct void growth and coalescence processes, eventually leading to crack propagation, as depicted in Figure 2b. In the simulation, the initial state incorporates a predefined void volume fraction in the crack tip meshes. The void volume fraction progressively increases under applied loads, with element deletion occurring upon reaching the failure criterion, thereby enabling crack advancement, as demonstrated in Figure 2c,d.
Fracture mechanics assumes that cracks originate from the root of the bearing fatigue notch [33,34]. Starting from a short crack, the initial crack length is considered.
Gurson considered a unit model containing holes. Equation (5) is the state equation of material stress and hole volume fraction at the yield moment [26]:
ψ σ m , σ e q , σ ¯ , f = σ e q 2 σ ¯ 2 + 2 q 1 f cosh 3 q 2 σ m 2 σ f 1 q 3 f 2 = 0
In the formula, σm is the mean stress, σeq is the Mises equivalent stress, σ   ¯ is the equivalent stress of the matrix material, f is the volume fraction of pores in the material, and q1, q2, and q3 are the modified damage parameters. f is defined in Equation (6) [33]:
f = f   f f c f c + f f c f u f c f F f c   f c f f F f F   f f F
In the formula, fc is the critical volume fraction of pore aggregation, fu represents the volume fraction of pores with a zero load limit, and fF is the volume fraction of failed pores. When plastic deformation occurs, the volume fraction of pores in the material increases due to the combination of void growth and nucleation. The rate of change is calculated by Equation (7) [32]:
df = df growth + df nucleation
The growth process of the pores is a result of the incompressibility of the matrix material. The rate of change during the growth process can be described by Equation (8) [32]:
df nucleation = 1 f d ε p : I
where εp is the plastic strain tensor, and I is the second-order unit tensor. The function of the average stress rate, flow stress rate, and equivalent plastic strain rate is described by Equation (9) [33,34]:
df nucleation = A 1 d ε p + A 2 d σ m + d σ f
where A1 and A2 are the intensity factors that control the nucleation of the pores. The GTN model can reflect the stress field at the crack tip, accurately simulate the crack initiation and stable propagation behavior, and accurately describe the dynamic ductile tearing process of the material, and it has good applicability [35,36].

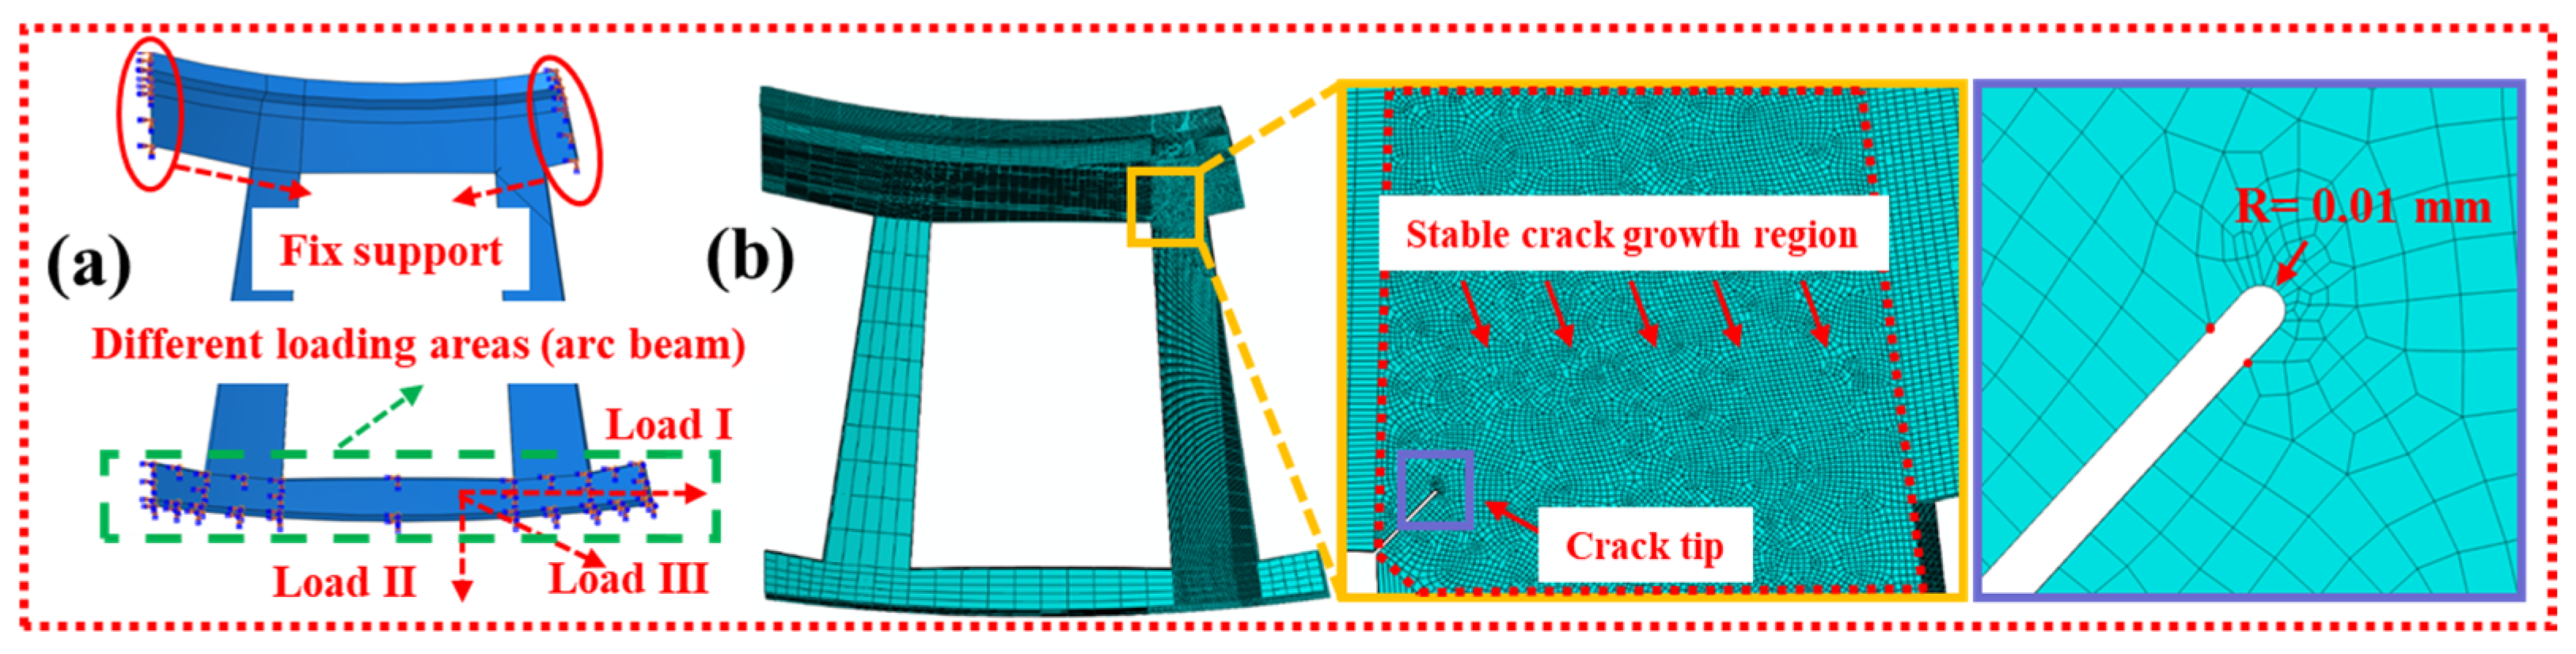
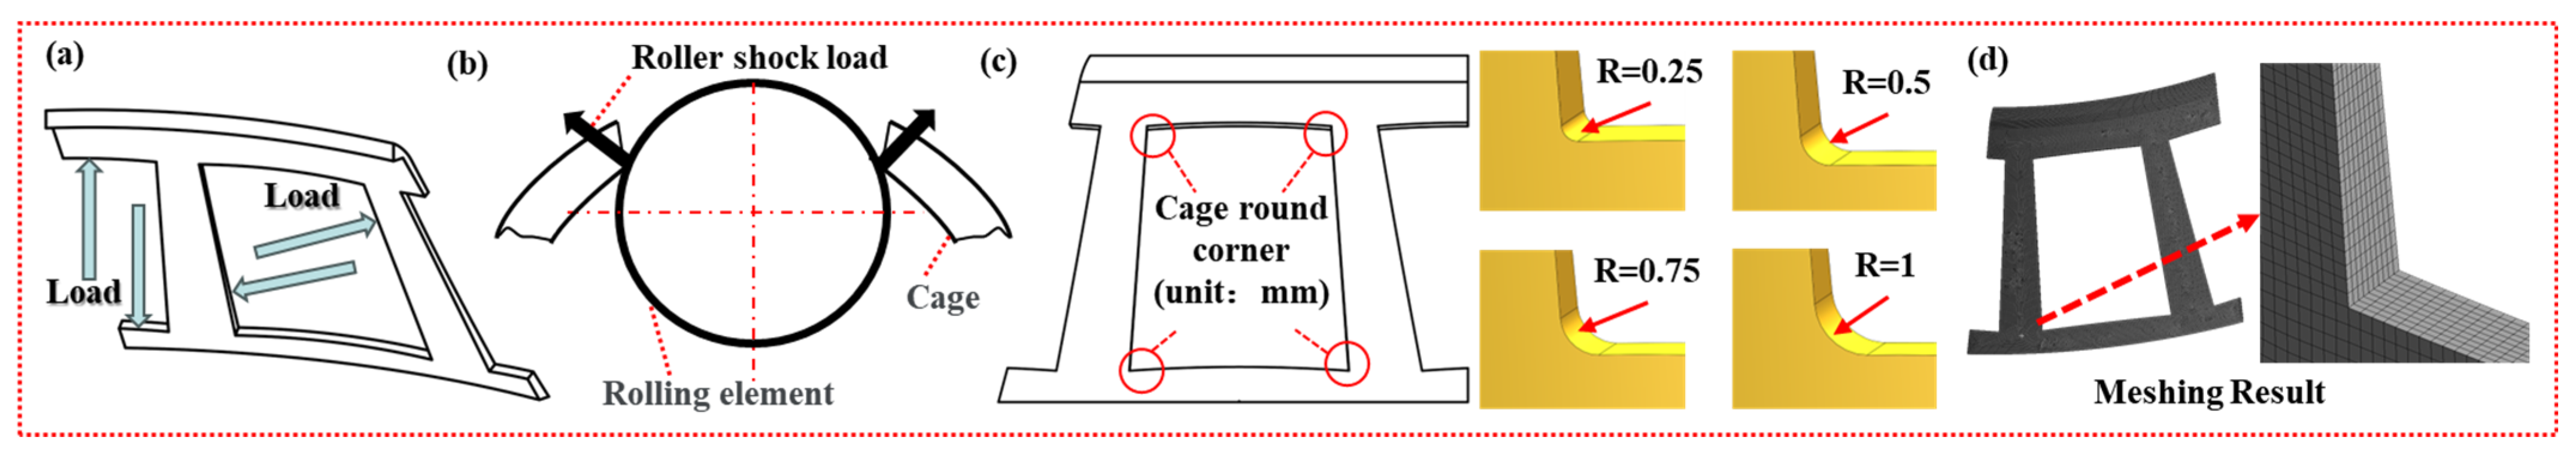
3. Finite Element Model, Material Properties, and Preprocessing

3.1. Bearing Model and Material Properties

The primary focus of this study is the 31,311 tapered roller bearing utilized in a specific type of gearbox. The bearing model and the two-dimensional diagram of the bearing geometric parameters are shown in Figure 3 [37]. The fundamental parameters of the bearing are detailed in Table 1 [38], and the material properties of the bearing are presented in Table 2 [38]. Additionally, the material properties of the cage are summarized in Table 3 [7,39]. The GTN parameters of the cage are presented in Table 4 [26,33,39]. The fatigue properties of the bearing materials include a fatigue strength coefficient of 1340 MPa and a fatigue strength exponent of −0.087 for the GCr15 bearing steel, with a threshold stress intensity factor range (ΔKth) of 6 MPa·m(1/2) and Paris law constants C = 3.5 × 10⁻¹² and m = 3.2 for crack propagation assessment. For the 10# steel cage material, the fatigue limit is 180 MPa at 107 cycles, with a fatigue ratio (fatigue limit/tensile strength) of 0.44.

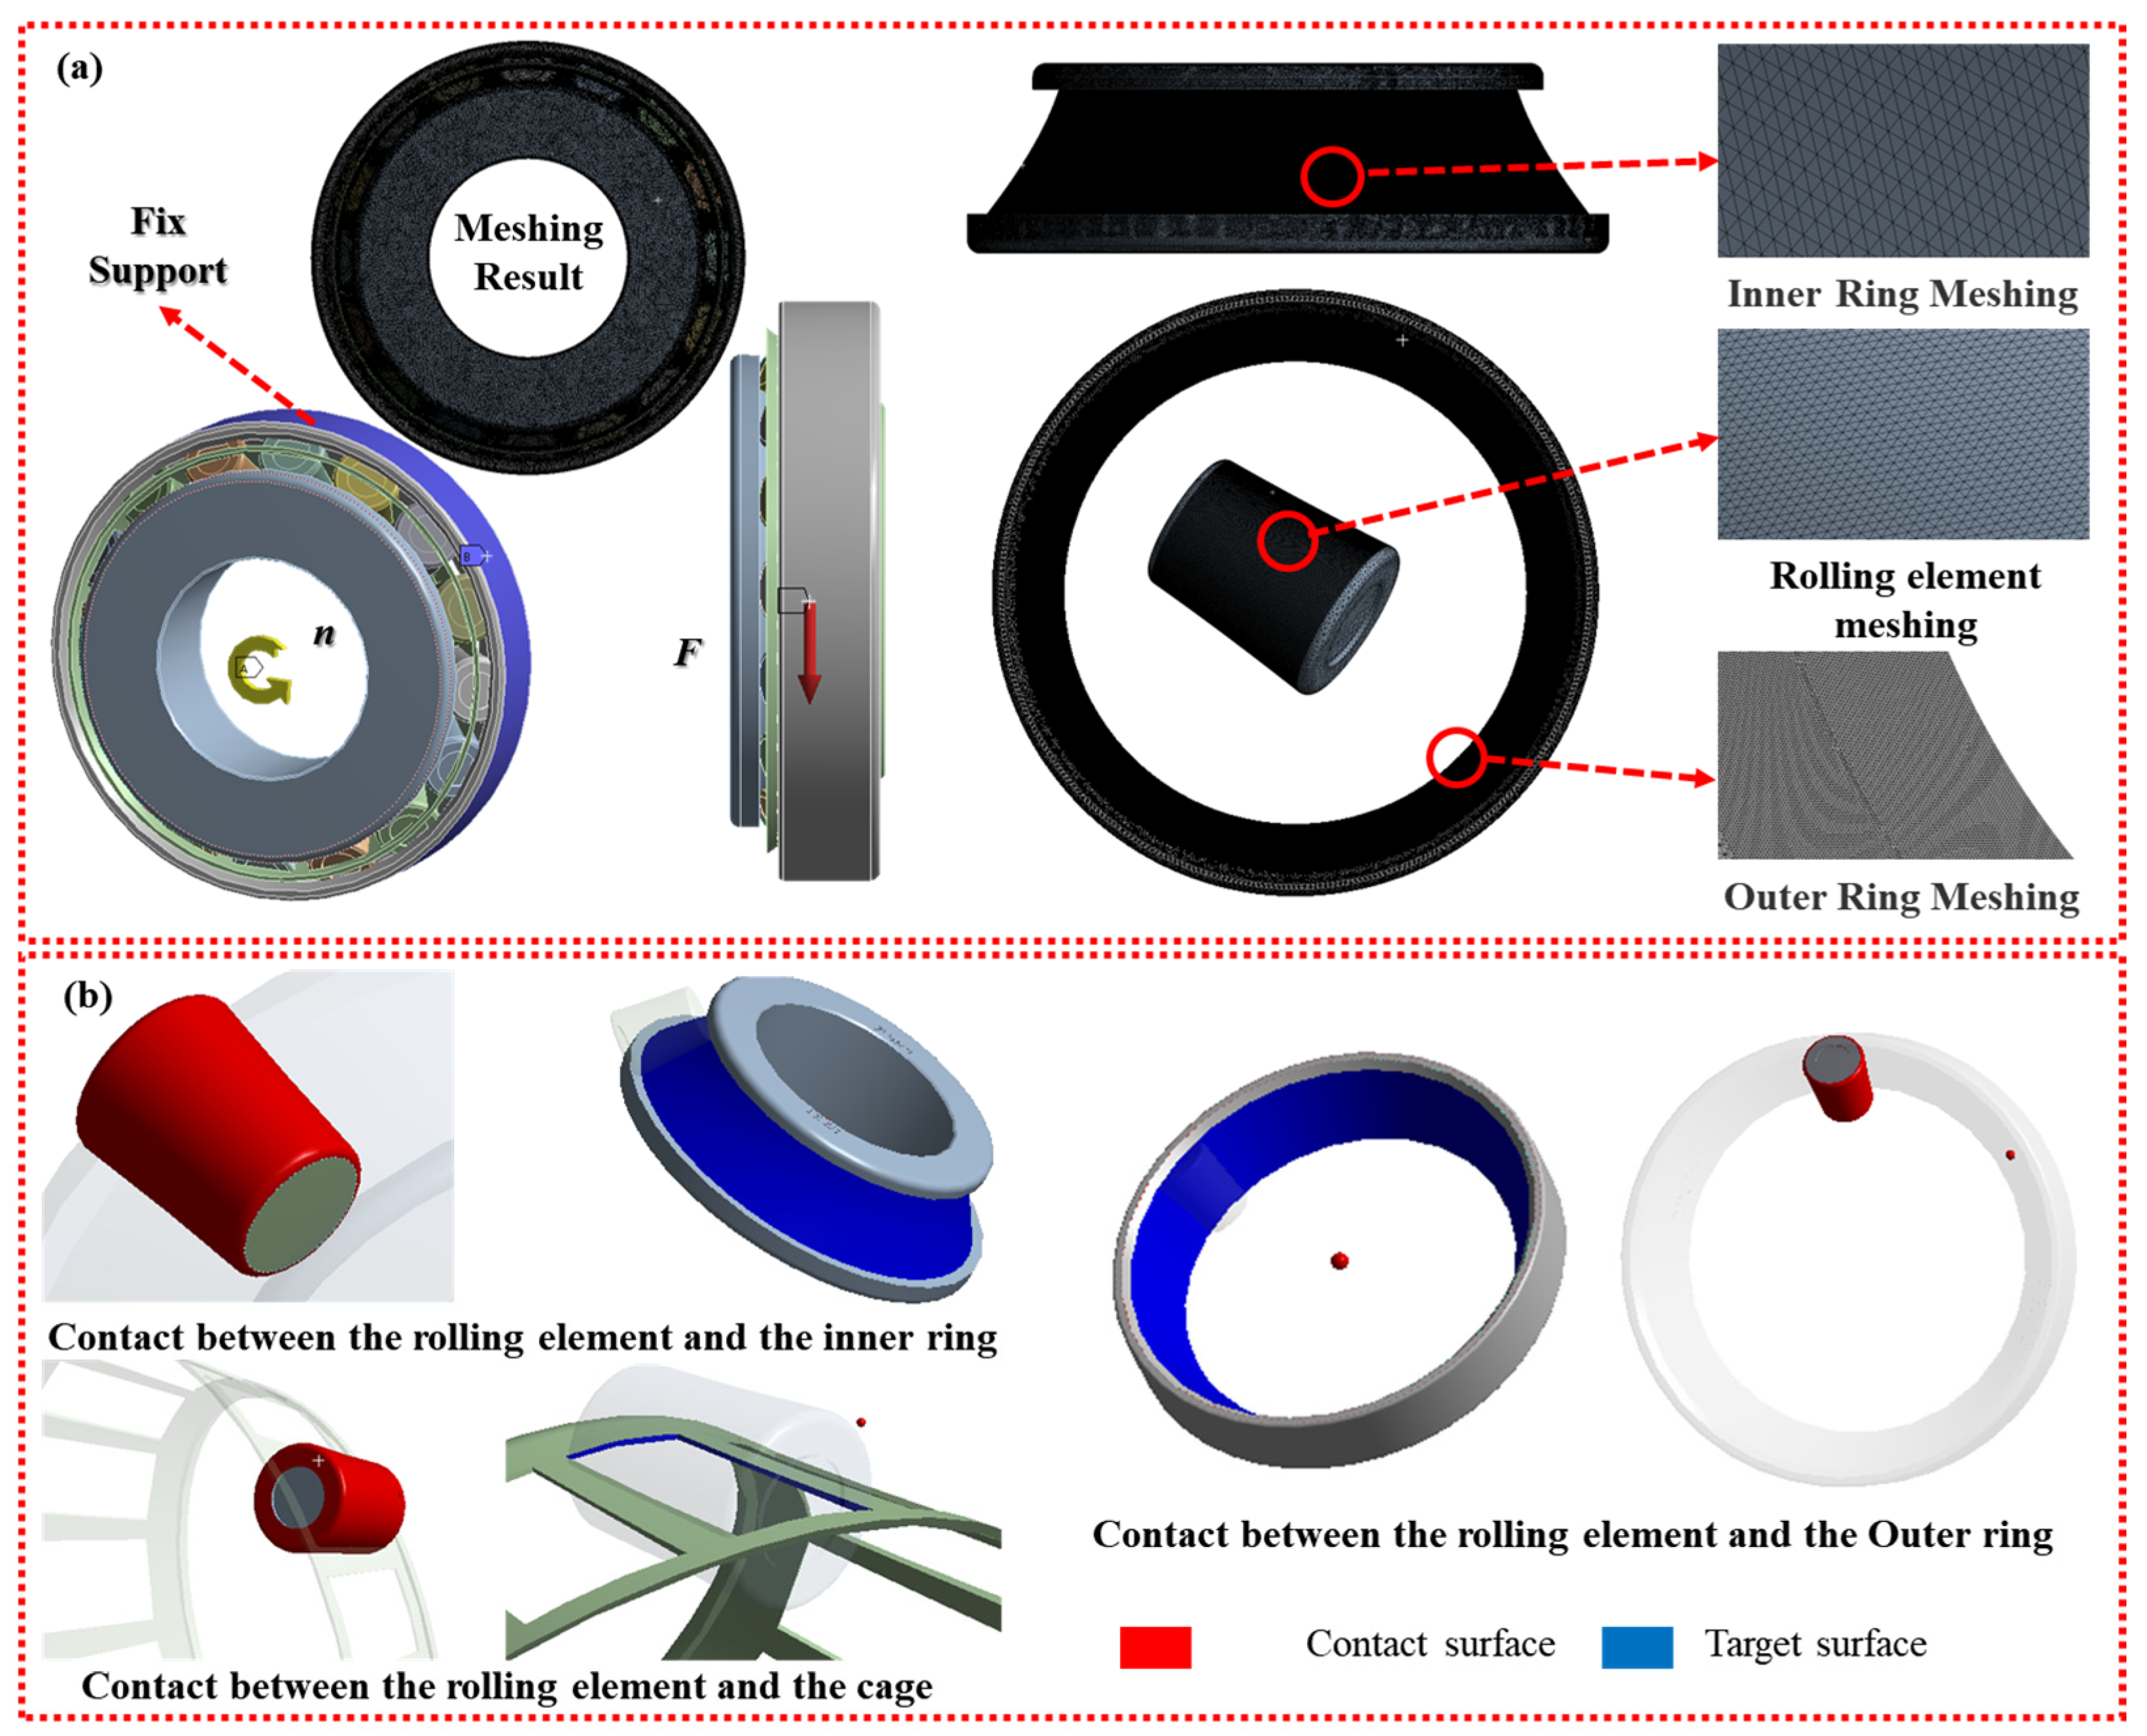
3.2. Finite Element Preprocessing

A finite element model of a tapered roller bearing with a cage was developed and analyzed using ANSYS Workbench 2019. The model was subjected to boundary conditions: the outer surface of the outer ring was fixed, the inner ring was assigned a rotational speed (n), and a radial load (F) was applied through a uniformly distributed pressure over the inner ring’s surface. This approach simulates realistic load transfer in gearbox applications and avoids artificial stress concentrations caused by point loading. The boundary conditions and loading scheme are illustrated in Figure 4a. The mesh was generated using the “Multizone” method, resulting in 3,287,519 elements and 1,908,079 nodes. High mesh quality was prioritized to ensure computational convergence and solution accuracy. The element size was set to 0.5 mm for the inner and outer rings, while a finer size of 0.1 mm was applied to contact surfaces. In the meshing settings, the “Hard” behavior option was selected, and the mesh smoothing quality was set to high. The final mesh is shown in Figure 4a.
Rolling elements were modeled in contact with the inner ring, outer ring, and cage. These contacts were defined as frictional, with a coefficient of 0.08 [40], simulating boundary lubrication conditions typical for steel-on-steel interfaces using moderate-to high-viscosity mineral oil. A penalty-based contact formulation was employed. Full hydrodynamic effects were omitted to reduce computational costs; the selected friction coefficient captures the averaged behavior under mixed lubrication regimes. In the unloaded state, a radial clearance of 0.015 mm, corresponding to the normal class for the 31,311 bearing, was assigned between the rollers and the outer ring raceway. While actual tapered roller bearings utilize more complex roller geometries with profiled ends to reduce stress concentrations, this study adopted a simplified roller geometry to focus on the fundamental stress distribution patterns. In real-world applications, rollers incorporate crowning and end relief to avoid the stress concentrations observed in our simulations. This simplification may lead to higher localized stresses compared to optimized commercial bearings. This clearance influences the load zone angle and the number of rollers engaged under load, approximately 40% of the total roller complement. The raceway surfaces of the rings and the cage’s end faces and circumferential surfaces were designated as target surfaces, while roller surfaces were defined as contact surfaces, as shown in Figure 4b.
Before the main analysis, a mesh sensitivity study was performed to determine the optimal element size that balances accuracy and computational efficiency. Element sizes ranging from 0.05 mm to 1.0 mm were tested, with convergence achieved near 0.5 mm. The “Multizone” technique was selected for its ability to generate predominantly hexahedral elements by decomposing complex geometries into sweep regions. This method enhances stress accuracy in contact areas and reduces computational costs. The final mesh configuration achieved an average element quality of 0.85 (on a scale where 1.0 indicates an ideal element), supporting reliable stress predictions in critical regions.

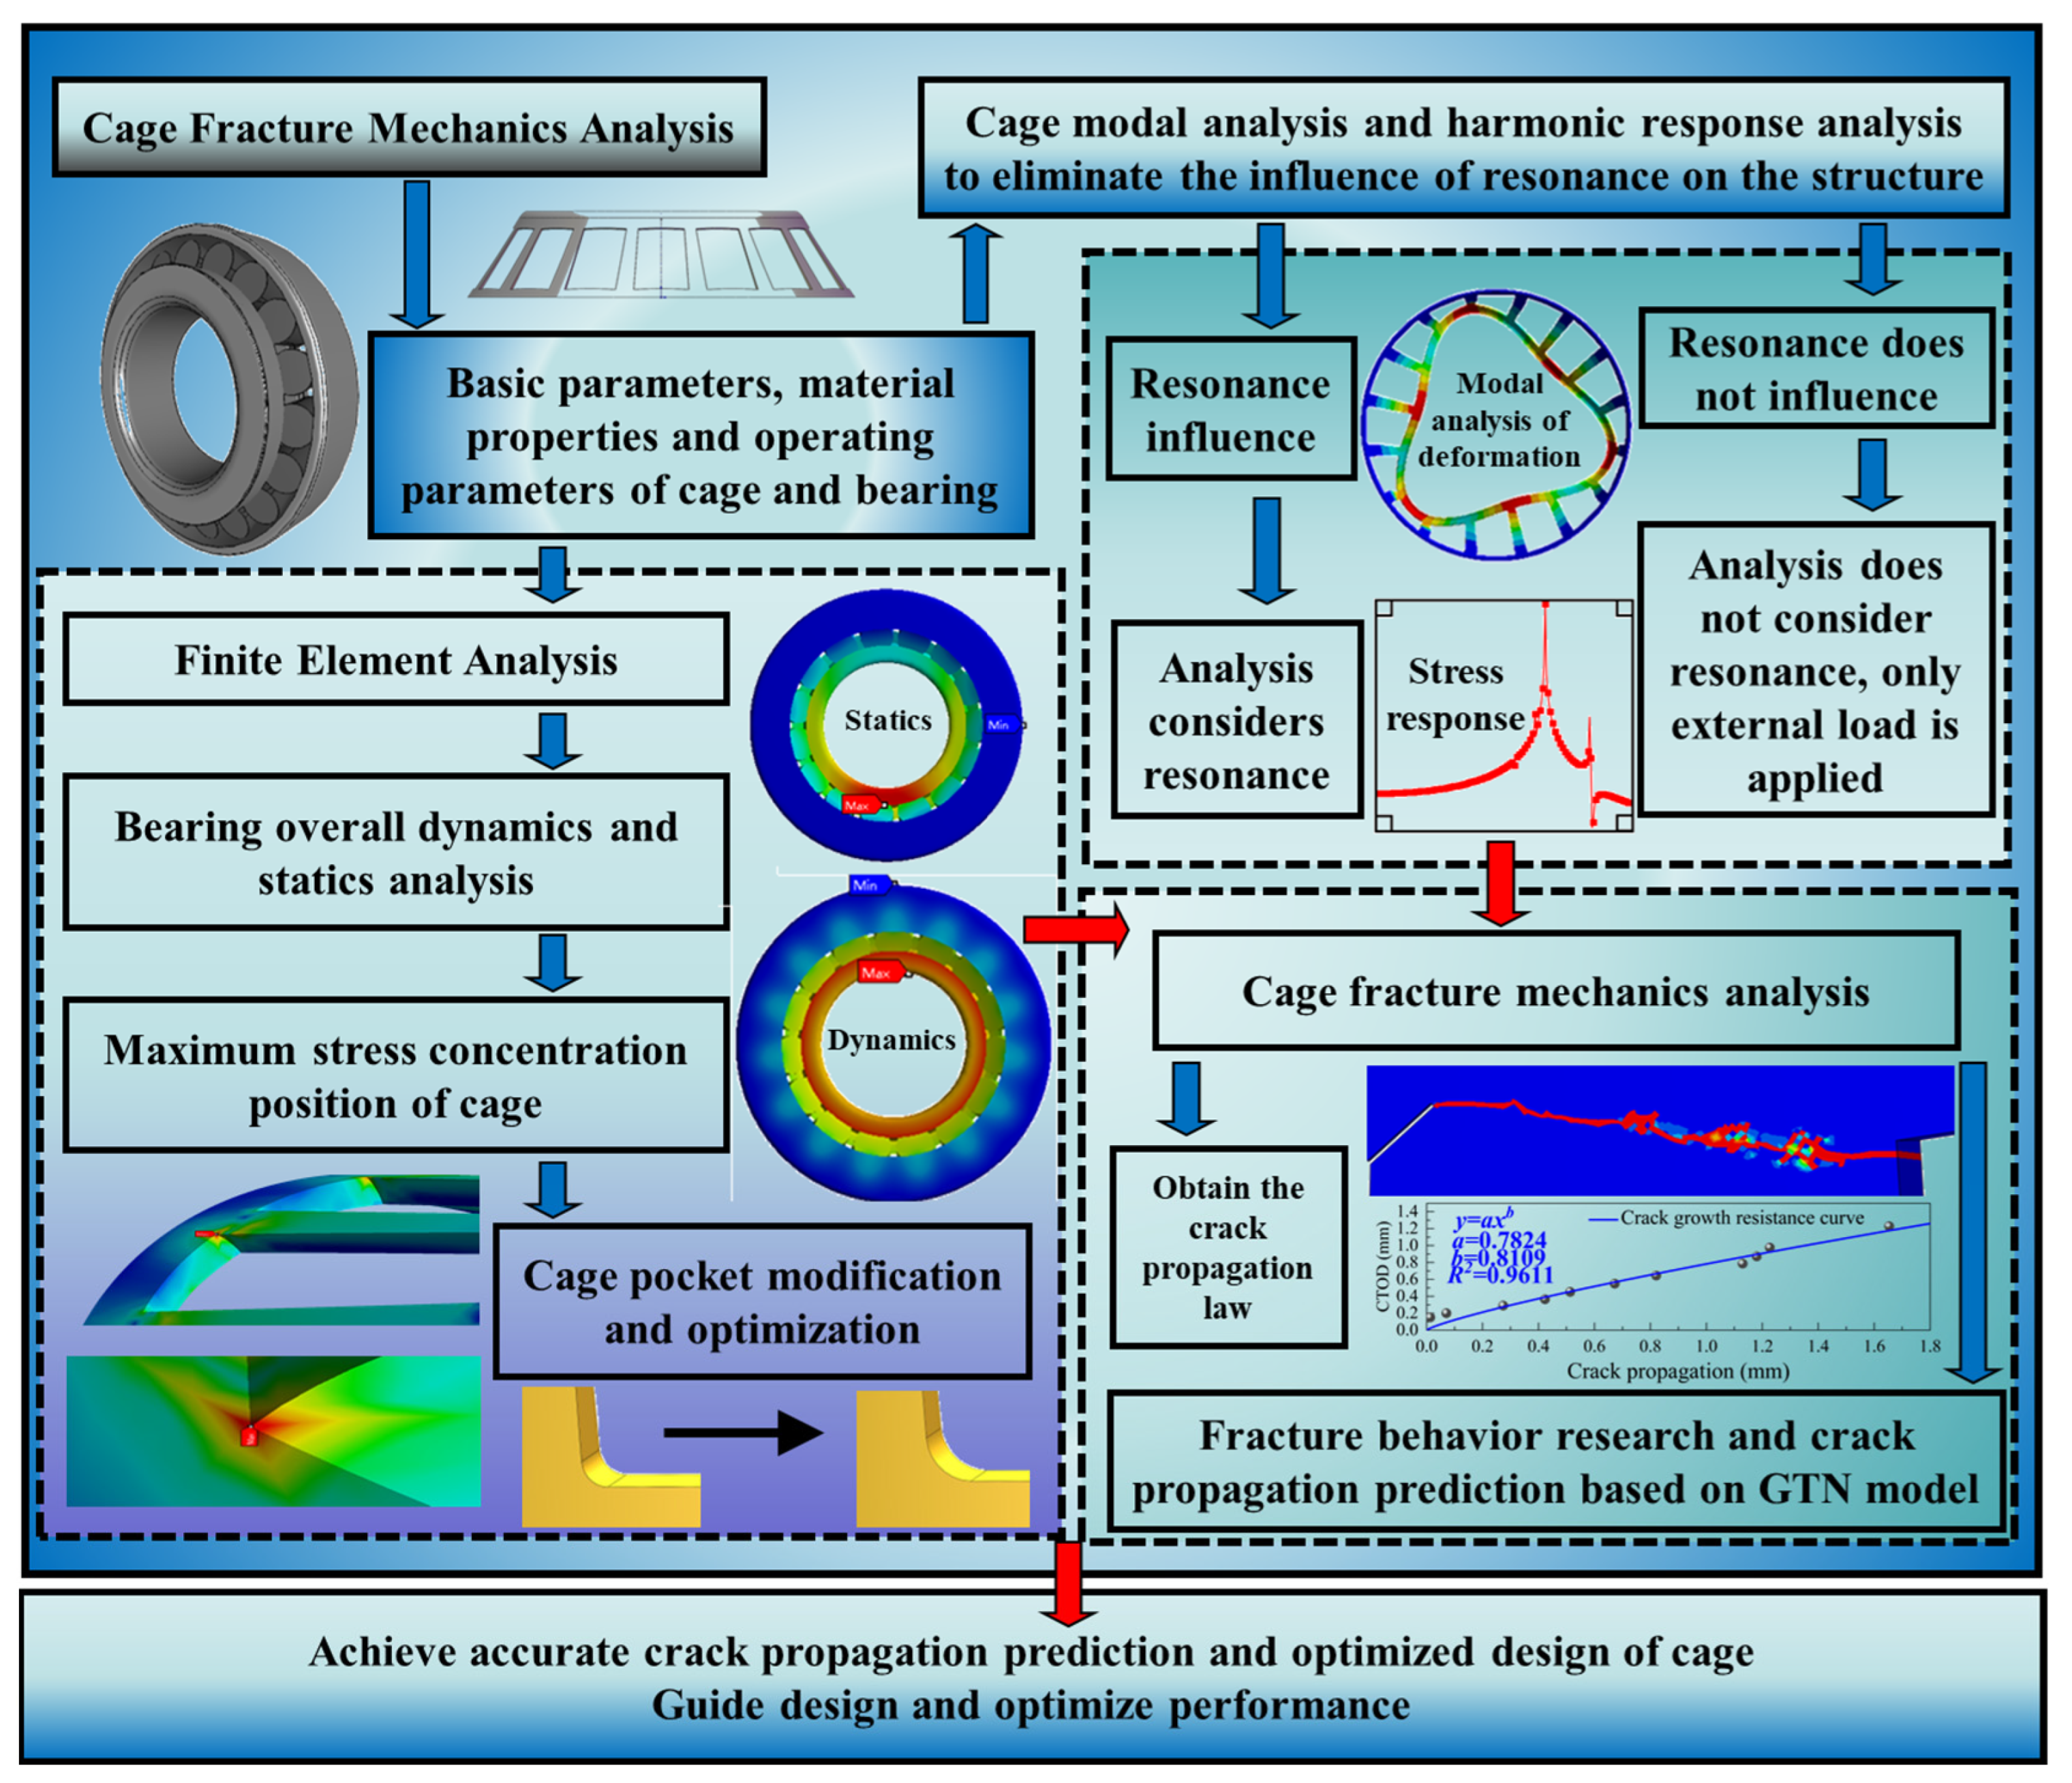
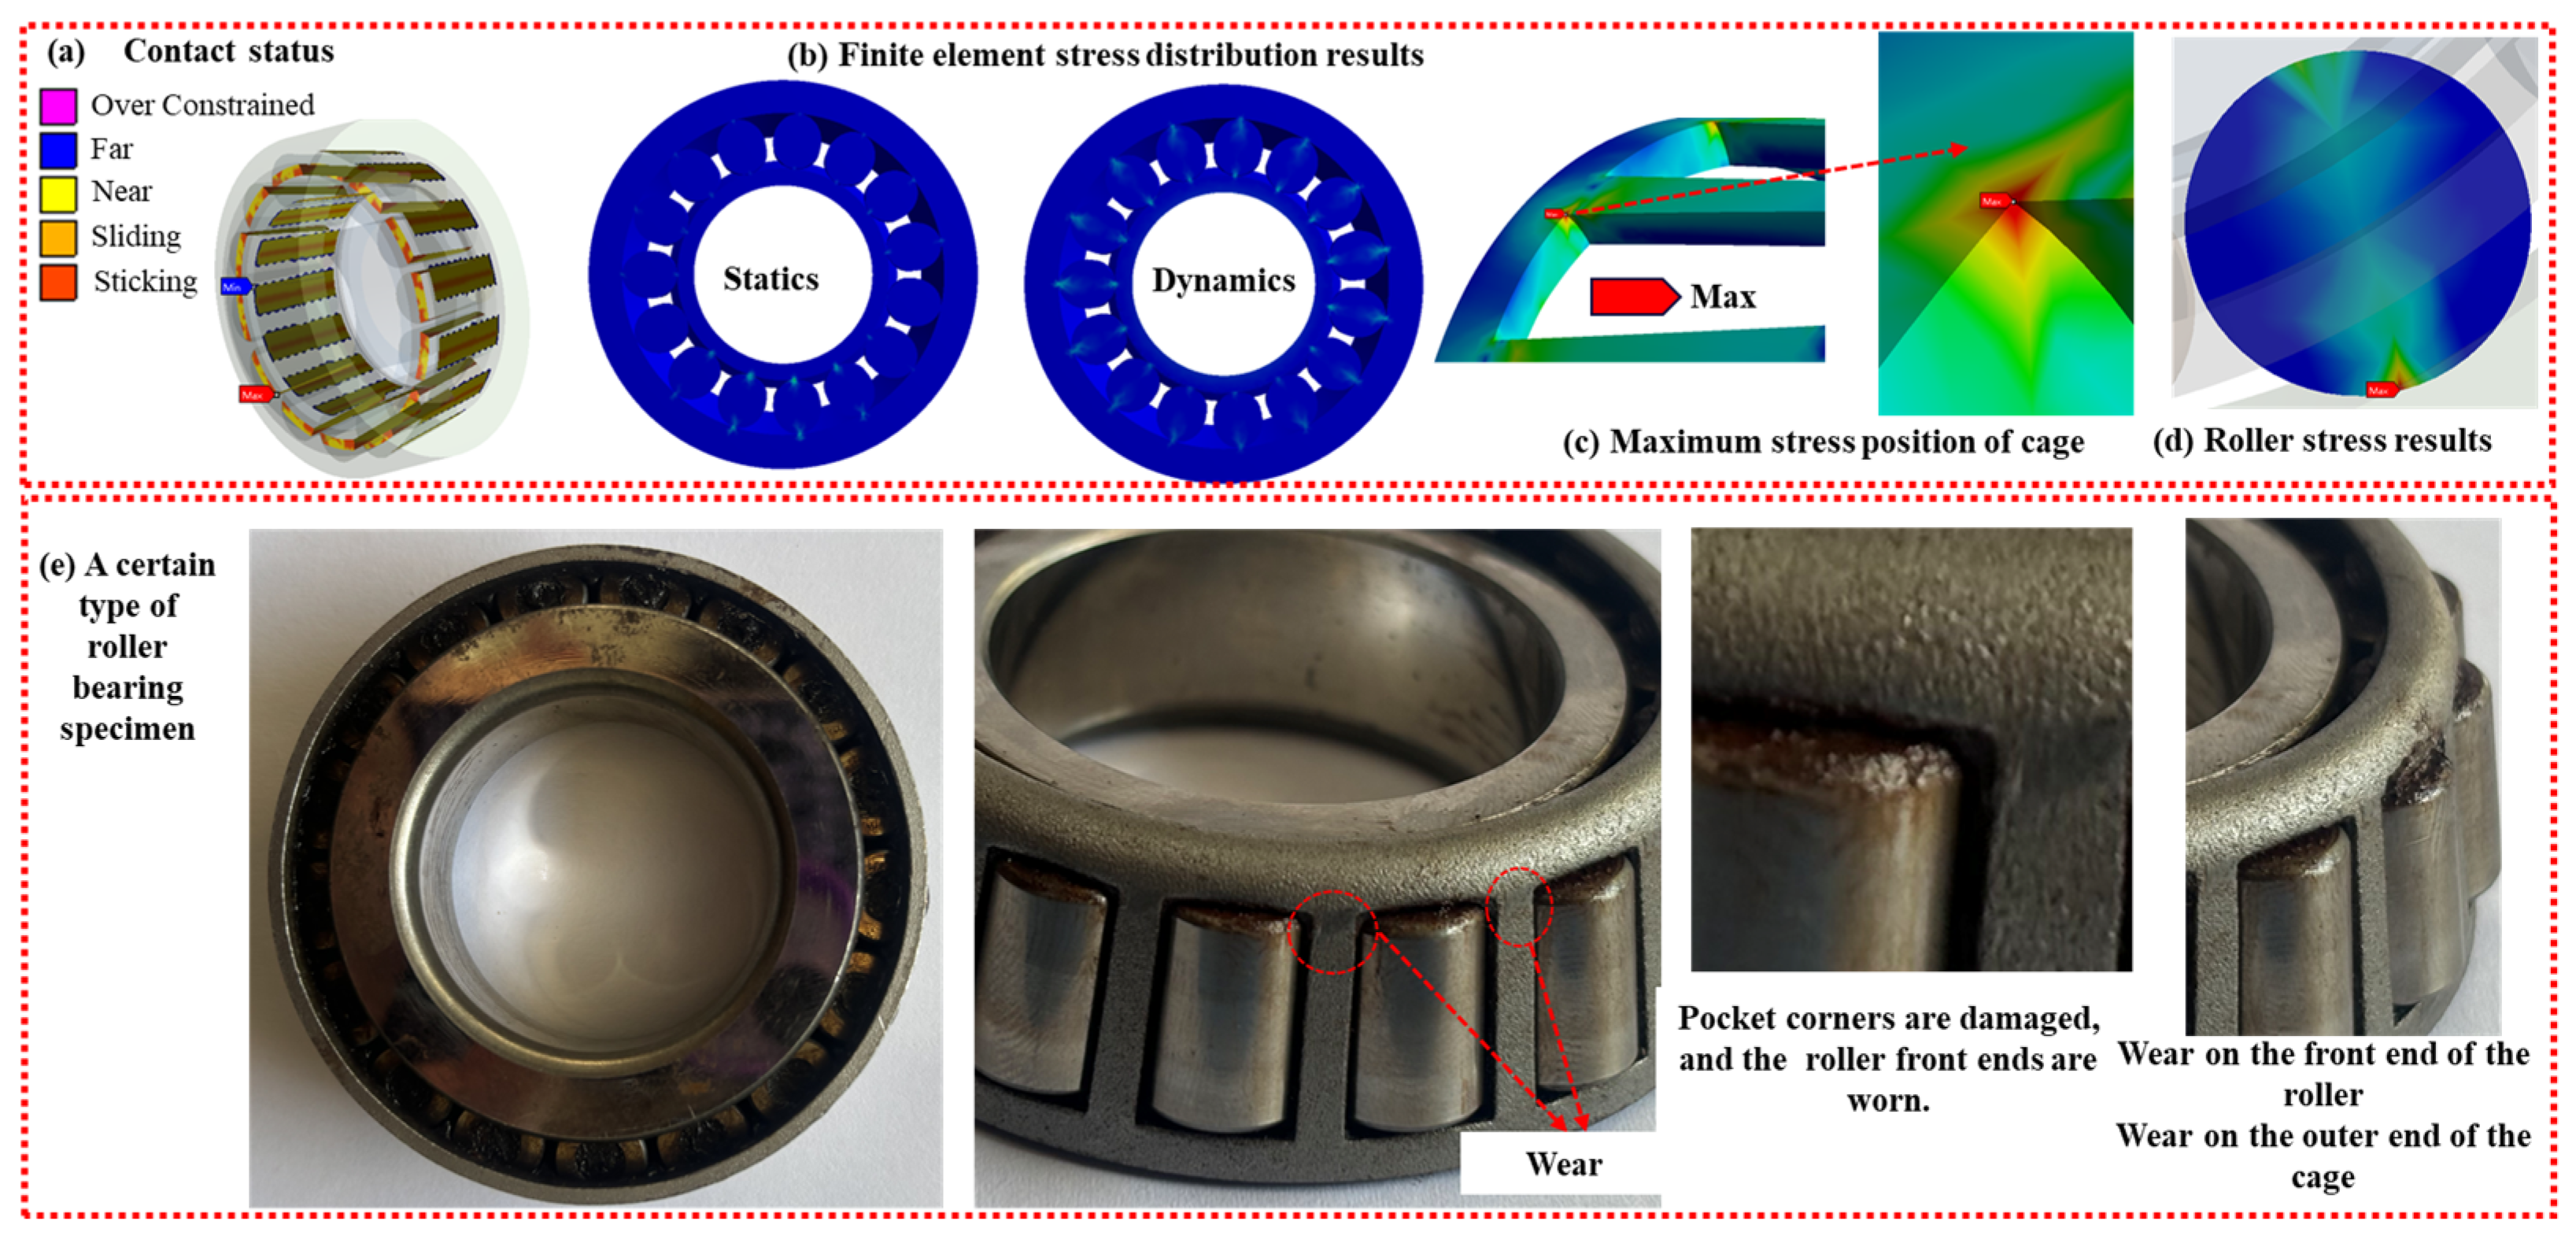
4. Bearing Static, Dynamic Analysis, and Verification

The computational analysis of tapered roller bearings in ANSYS Workbench begins by constructing an accurate 3D model that includes all the critical components (rollers, inner/outer rings, and cage) along with proper material definitions. For static analysis, fixed constraints are applied to the outer ring, while radial loads are imposed on the inner ring’s bore surface. Special attention is given to the frictional contact formulation between the rolling elements and raceways (typically modeled using asymmetric contact algorithms) to ensure solution convergence. The meshed model is solved to obtain Hertzian contact stresses and deformation fields.
The same boundary conditions are maintained for dynamic simulations using the Transient Structural module, but variable radial loading is introduced. Numerical stabilization techniques (Weak Springs and Inertia Relief) are employed, along with sufficiently minimal time steps, to accurately resolve transient dynamic responses and contact interactions.
The finite element analysis of the bearing was performed under varying operational conditions, specifically radial loads of F (F = 500 N, 1000 N, and 1500 N). The selected loads represent typical operating conditions for specifically analyzing cage behavior rather than extreme loads that would induce complete bearing failure. The ratio of dynamic-to-static load capacity (2.3:1, ISO 281 [24]) and a fatigue safety factor of 1.33 (at F = 1500 N) demonstrate the bearing’s robustness under cyclic gearbox loads. The static analysis yielded the total deformation, as illustrated in Figure 5a, and the equivalent stress, depicted in Figure 5b. Correspondingly, the dynamic analysis also provided the total deformation, shown in Figure 5c, and the equivalent stress, presented in Figure 5d. The load condition of F (F = 1500 N) was identified as representative of the actual operational scenario for a specific gearbox.
The static analysis results, as seen in Figure 5a,b, indicate that at F = 500 N, the tapered roller bearing exhibits a maximum total deformation of 0.00062456 mm and a maximum equivalent stress of 44.688 MPa. When load F is increased to 1500 N, the maximum total deformation escalates to 0.001487 mm and the maximum equivalent stress surges to 106.4 MPa. The dynamic results, presented in Figure 5c,d, reveal that at F = 500 N, the maximum total deformation of the tapered roller bearing is 0.004527 mm and the maximum equivalent stress is 213.11 MPa. Under the increased load of F = 1500 N, the maximum total deformation further increases to 0.0080839 mm and the maximum equivalent stress reaches 420.63 MPa.
Both static and dynamic analyses of the tapered roller bearing reveal that an increase in the radial load F leads to a proportional rise in the maximum total deformation and the maximum equivalent stress within the bearing. Notably, the maximum deformation consistently occurs on the inner ring, while the maximum equivalent stress is localized at the contact interface between the inner ring and the rolling elements.
Finite element analysis under a radial load of 1500 N provides detailed insights into the bearing’s contact state and stress distribution, highlighting the location of maximum stress on the cage and the forces acting on the rollers. These findings, alongside a comparative analysis of a specific roller bearing specimen, are presented in Figure 6. A comparison of contact reference velocities is illustrated in Figure 7.
The inner and outer raceways of the bearing, together with the rolling elements, sustain loads through mutual contact interactions. Contact is established between the rolling elements and both the inner and outer raceways as well as the cage. As illustrated in Figure 6a, the contact state results demonstrate that the rollers are in contact with both the inner and outer rings and the cage, which is consistent with the actual contact conditions observed during bearing operation.
From Figure 6b, it is apparent that the stress distribution profile derived from the static analysis aligns with the load distribution of bearings subjected to radial loads, as referenced in studies [7,40]. Similarly, the stress distribution profile obtained from the dynamic analysis corresponds to the load distribution of bearings under radial loads, as discussed in references [7,40]. Figure 6c indicates that the location of maximum stress on the cage is situated at the transition corner of the pocket bridge, in agreement with the description provided in reference [41] (when the roller contacts the cage, the maximum equivalent stress occurs at the transition of the bridge side beam of the cage). From Figure 6c,e, it is evident that stress concentration and wear damage manifest at the corner of the cage pocket bridge under actual operating conditions, corroborating the simulation results. From Figure 6d,e, it is observed that the location of maximum stress in the finite element results is located at the front end of the roller, and the wear damage is identified at the front end of the roller in the bearing specimen, thereby confirming the consistency between the specimen and the simulation results.
As illustrated in the velocity contour plot of the bearing assembly, cage, and rollers (Figure 7), the maximum linear velocity of the bearing is observed on the outer circumferential surface of the large end of the inner ring. This simulation result aligns closely with previous findings reported in reference [42]. During actual operation, the rollers undergo rotational motion [43]. The simulation further reveals that the linear velocities at the contact points between the rollers and the inner and outer rings are unequal, inducing roller rotation due to the velocity differential, a phenomenon consistent with real-world observations.
In conclusion, the tapered roller bearing model and the finite element analysis demonstrate a high degree of accuracy. The analysis precisely identifies the location of maximum stress on the cage, providing a robust foundation for subsequent fracture mechanics investigations at this critical site. It should be noted that the simplified roller geometry in this study omits the end reliefs and optimized profiles typically used in commercial bearings to prevent edge stress concentration. Consequently, the calculated stresses at the roller–raceway contact points are likely higher than those in real-world applications. However, these simplifications do not substantially affect the study’s primary focus—cage fracture mechanics.

5. Fracture Analysis of Cage Failure

This section presents a comprehensive analysis of the bearing cage from two complementary perspectives: dynamic behavior characterization and fracture mechanics modeling. Each approach provides unique insights into potential failure mechanisms.

5.1. Dynamic Characterization: Modal and Harmonic Response Analysis

Considering the cage failure mode, a fracture analysis was conducted from two perspectives: modal analysis and structural analysis. Modal analysis was performed to exclude the possibility of failure induced by resonance [28,29]. A detailed model of the cage was established and imported into finite element software (ANSYS Workbench 2109), with the results of the modal analysis presented in Figure 8.
As shown in Figure 8a, the total deformation across different modal orders is relatively small, with minimal variation in the maximum deformation values between modes. Figure 8b presents theoretical calculations based on the modal theory outlined in Section 2.1, considering the bearing’s maximum operating speed of 4300 r/min under sufficient lubrication conditions. The results indicate that the rotational frequency of the cage relative to the outer ring is 185.3 Hz, while the rotational frequency relative to the inner ring is 499.02 Hz—both substantially lower than the 8th-order natural frequency of 3370 Hz.
Furthermore, as illustrated in Figure 8c, the stress and deformation response amplitudes peak at 2660 Hz, aligning closely with the 4th and 5th natural frequencies shown in Figure 8b. This agreement validates the reliability of the modal and harmonic response analysis methods [30]. The maximum stress response amplitude of the cage is 3.6712 MPa—well below the material’s yield strength of 205 MPa—while the maximum deformation response amplitude remains similarly low. Both response amplitudes occur at 2660 Hz, suggesting that operating conditions at this frequency should be avoided. However, as 2660 Hz is far greater than the cage’s rotational frequencies relative to the inner and outer rings (499.02 Hz and 185.3 Hz, respectively), it can be conclusively determined that resonance is not responsible for the cage’s failure.
This analysis effectively excludes the resonance-induced structural failure of the cage. Consequently, the fracture analysis focuses solely on external loads. Future investigations will extend to consider not only individual loads but also the effects of coupled loads. Having eliminated resonance as a primary failure mechanism through modal analysis, we now focus on investigating fracture behavior under external loading conditions. The following fracture mechanics analysis identifies critical crack propagation patterns and quantifies the material’s resistance to fracture under various loading scenarios.

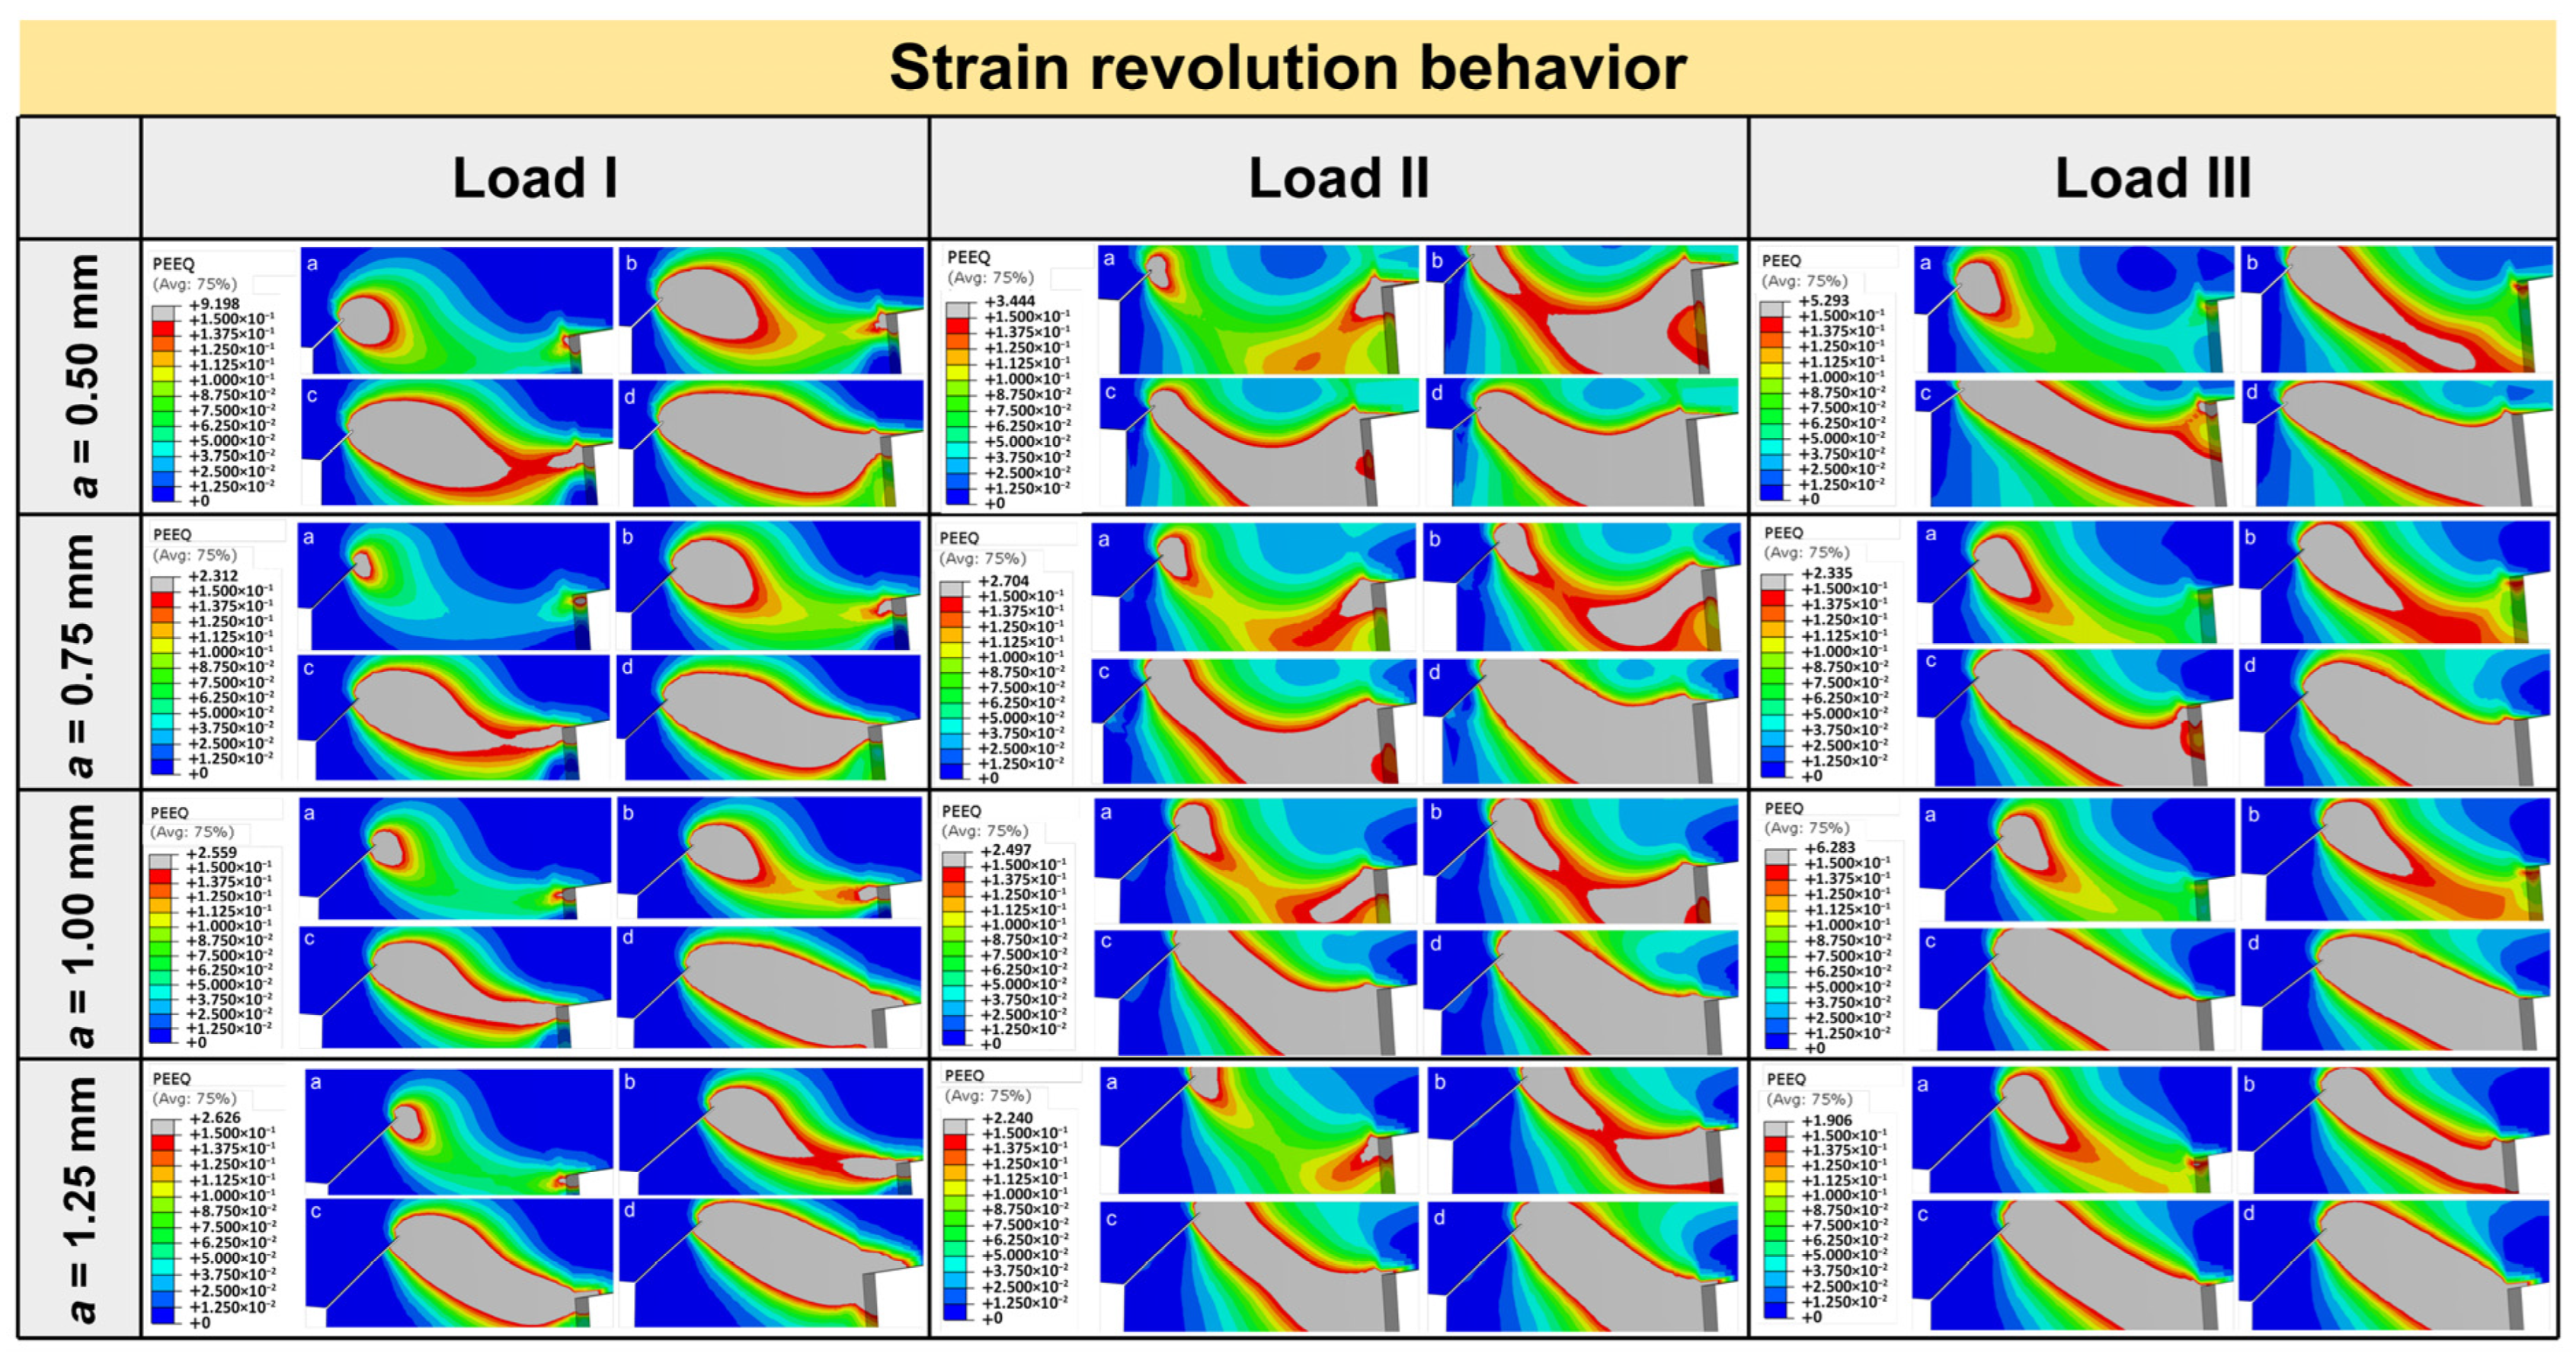
5.2. Fracture Mechanics Analysis: Cage Crack Growth Behavior

This study employs the GTN meso-damage theoretical model integrated into Abaqus 2019 software to analyze crack propagation behavior in the retainer. The GTN model demonstrates capabilities in accurately capturing stress fields at crack tips, effectively simulating crack initiation and stable propagation processes, while precisely characterizing dynamic crack growth resistance curves. The analysis reveals that maximum stress concentration occurs at the transition angle of the pocket hole beam. Under loading conditions, this critical region exhibits high susceptibility to crack initiation, potentially leading to structural fracture of the retainer. This section investigates crack propagation behavior in the pocket hole structure under various loading configurations. A pre-existing crack was introduced at the maximum stress location of the pocket hole.
Figure 9 illustrates the finite element boundary conditions, mesh configuration, and crack arrangement, where Load I (circumferential load), Load II (longitudinal downward load), and Load III (coupled load) represent distinct loading modes. The steady-state crack growth zone employs a refined regular brick-type stacked mesh to ensure simulation accuracy in crack propagation analysis. A root radius of 0.01 mm was implemented at the crack tip to characterize crack blunting behavior and enhance computational convergence. Subsequent calculations considered crack depths of 0.5 mm, 0.75 mm, 1.0 mm, and 1.25 mm, respectively.
In the GTN model calculations, elements are deleted when their effective void volume fraction reaches critical values, with the accumulated deletion path of these elements representing the crack propagation paths. Figure 10 and Figure 11 illustrate the crack extension paths and equivalent plastic strain evolution under an orthogonal experimental design considering varying initial crack lengths and loading types, respectively.
As shown in Figure 10, under Load I, the crack propagation path primarily extends from the initial crack tip to the opposite corner of the cage. Although shear stresses at the opposite corner induce partial mesh failure and generate secondary cracks, these secondary cracks exhibit negligible further propagation, prompting subsequent analysis to focus solely on the primary crack behavior. Under Load II, the final crack path deviates from the corner, with secondary cracks emerging only at larger initial crack depths (a = 1.25 mm). Notably, these secondary cracks do not propagate inward into the cage. Crack propagation patterns under Load III resemble those under Load II, with key distinctions manifested in crack deflection angles and resistance curve characteristics, which will be systematically analyzed in subsequent discussions.
Figure 11 illustrates the evolution of equivalent plastic strain near the crack, where the contour boundaries of equivalent plastic strain are uniformly set at 0.2 for comparative analysis. The locations of strain concentration zones indirectly reflect potential crack propagation patterns, showing good agreement with the crack paths in Figure 10. Under Load I, the equivalent plastic strain concentration emerges along the trajectory from the crack tip to the opposite corner. While strain localization occurs at the corner, its magnitude remains relatively stable despite increasing loads. For Load II, the strain concentration at the opposite corner exhibits higher intensity than that in Load I and progressively amplifies with loading, thereby effectively releasing energy through plastic deformation at this location and enhancing resistance to primary crack propagation. Such a phenomenon will be quantitatively analyzed through subsequent resistance curves. In contrast, under Load III, the strain concentration zone propagates continuously from the primary crack tip toward the opposite side, with negligible strain accumulation at the corner and no convergence of dual strain concentration zones, as observed under Loads I and II.
Figure 12a presents crack growth resistance curves calculated using the GTN model under varying loading conditions and initial crack lengths. Following the methodology detailed in [31,33,34], fracture toughness values were determined using a 0.2 mm crack growth offset line, with all resistance curves exhibiting distinct exponential distribution characteristics. The results demonstrate the progressive weakening of crack growth resistance and decreasing fracture toughness with increasing crack depth. Notably, Load II exhibits the strongest crack growth resistance, followed by Load I and Load III. This difference is attributed primarily to significant plastic strain accumulation at the side edge corners in Load II, where enhanced energy dissipation through plastic deformation reinforces resistance against main crack propagation. Figure 12b presents a comparative analysis of crack deflection angles from Figure 10, demonstrating that Load I exhibits the highest sensitivity in the deflection angle to variations in the initial crack depth. The deflection angle increases markedly from 48.12° to 66.35° (an increase of over 35%) with crack deepening. In comparison, Loads II and III show relatively insensitive deflection angle responses to crack depth changes (variations below 10%). Figure 12c illustrates the geometric correlation between the measured CTOD (crack tip opening displacement, CTODm) and the critical CTOD (CTODc) established in prior studies [33] on deflected growing cracks, validating the necessity for geometric relationship-based CTOD value correction. Figure 12d compares CTODm derived from resistance curves with geometrically corrected CTODc. The results indicate significantly higher CTODm values under Load II (peak: 1.495 mm) than under Load I (0.577 mm) and Load III (0.489 mm). Due to the larger crack deflection angle in Load II, geometric correction substantially reduces CTODc relative to CTODm. Nevertheless, corrected CTODc values under Load II (peak: 0.598 mm) remain notably higher than those under Load I (0.358 mm) and Load III (0.226 mm), demonstrating superior crack growth resistance in the retainer structure under Load II. Both Loads I and III exhibit CTODc values below 0.5 mm, indicating weak fracture resistance. Notably, this study confirms the progressive degradation of fracture toughness with increasing crack depth: CTODc decreases from 0.385 mm to 0.129 mm (66.5% reduction) for Load I, from 0.598 mm to 0.478 mm (20.1% reduction) for Load II, and from 0.226 mm to 0.094 mm (58.4% reduction) for Load III.
During the service of the bearing, high-speed rotation makes the real-time monitoring of crack initiation and propagation in the cage extremely challenging. To compare the actual crack propagation behavior with the finite element calculation results and validate the accuracy of the simulation model and crack propagation path, the fracture morphology of a physical specimen of the tapered roller bearing cage from a specific gearbox was compared with the finite element analysis results, as shown in Figure 13. Additionally, the crack propagation path of a failed cage from the gearbox was analyzed using SEM (Scanning Electron Microscope, JSM 6300 LV, Tokyo, Japan), as illustrated in Figure 14.
As shown in Figure 13 and Figure 14, the failure mode is characterized by crack coalescence and penetration from the pocket region to the opposite corner. The fracture morphology of the specimen aligns closely with the crack propagation path predicted by the GTN finite element analysis (Figure 13c). SEM analysis reveals that the crack propagation path follows a distinctive zigzag pattern. These findings confirm that the GTN meso-damage model accurately captures the fracture behavior of the actual cage structure.
The fracture behavior observed in this study reveals several critical insights for practical bearing design considerations. The predominance of circumferential crack propagation indicates that cage designs should incorporate reinforcement features along this direction, particularly at pocket bridge corners where the stress concentration is highest. The significant difference in fracture resistance under varying loading conditions (longitudinal versus circumferential) suggests that bearing arrangements that preferentially direct loads longitudinally through the cage structure could substantially improve durability. Furthermore, the observed relationship between crack depth and fracture toughness underscores the importance of early detection of surface defects before they reach critical depths, where resistance to propagation diminishes rapidly. For high-speed applications, these findings point toward the potential benefits of implementing design features such as oriented reinforcement ribs, stress-distributing fillets, and strategic material distribution to counteract the specific fracture patterns identified through the GTN-based simulations.

6. Cage Pocket Fillet Analysis and Optimized Design

Modal Analysis and Harmonic Response Analysis of the Cage

The corners at the large and small ends of the cage pocket are prone to significant stress concentrations, leading to fracture failure. The fillet radius of the pocket has a certain influence on the stress concentration in the cage.
The cage analysis was conducted under different loads and varying fillet radii. The applied loads were 100 N, 200 N, 300 N, 400 N, and 500 N, as illustrated in Figure 14a and Figure 15b. Models with different pocket fillet radii were established, specifically R = 0 mm, R = 0.25 mm, R = 0.5 mm, R = 0.75 mm, and R = 1 mm, as shown in Figure 15c.
The models were imported into ANSYS Workbench for finite element analysis. Figure 16 presents the mesh generation, boundary conditions, and stress distribution under varying loads and pocket fillet radii. The correlation between load, pocket fillet radius, and equivalent stress is depicted in Figure 17.
As shown in Figure 16 and Table 5, the stress at the pocket corner increases, and the stress concentration zone expands in the direction above the loading axis, which correlates with the previously observed crack propagation path. From Figure 16c–f, taking load F = 100 N as an example, the maximum equivalent stresses for fillet radii of R = 0 mm, 0.25 mm, and 0.5 mm are 65.989 MPa, 52.566 MPa, and 43.561 MPa, respectively, indicating a variation of up to 33%. The maximum equivalent stress consistently occurs at the corner of the pocket bridge. Table 4 further demonstrates that as load F and fillet radius R increase, the equivalent stress also rises.
As illustrated in Figure 16 and Figure 17, the machined fillet radius, R, must fall within a specific range to optimize performance. While increasing the pocket fillet radius can effectively reduce stress concentrations, a radius exceeding 1 mm results in an equivalent stress increase. Therefore, it is crucial to maintain an appropriate fillet radius during the machining process. An optimal fillet radius, ranging from 0.6 mm to 1 mm, exists within which the stress concentration is minimized.
The machining precision of the pocket fillet radius significantly influences stress concentrations. In practical engineering applications, limitations in manufacturing precision and the constraints of stamping processes make it difficult to consistently achieve fillet radii of R = 0.25 mm or R = 0.5 mm. Consequently, the actual machined fillet radius often exceeds the design specifications. Nevertheless, with an acceptable machining tolerance, improving machining precision remains an effective strategy to mitigate stress concentration.

7. Conclusions

This study investigates the fracture behavior of the 31,311 tapered roller bearing used in gearboxes, employing finite element analysis for static and dynamic evaluations of the bearing and modal analysis of the cage. The GTN (Gurson–Tvergaard–Needleman) meso-damage model was utilized to explore the cage’s fracture mechanics, and optimization of the fillet radius parameters of the cage pocket bridge was also conducted. The key findings are as follows:
(1)
The maximum deformation location is on the inner ring, while the maximum equivalent stress location is at the contact area between the rolling elements and the inner ring.
(2)
Under the bearing maximum operational speed, calculations demonstrate that the resonance-induced failure of the cage can be ruled out for this tapered roller bearing configuration. Future work should incorporate more realistic roller profiles with appropriate end reliefs and optimized contact geometry to eliminate artificial stress concentrations and produce more accurate absolute stress values. While the current study’s simplified geometry may overestimate absolute stress values, the relative stress distributions and identified failure mechanisms remain valid.
(3)
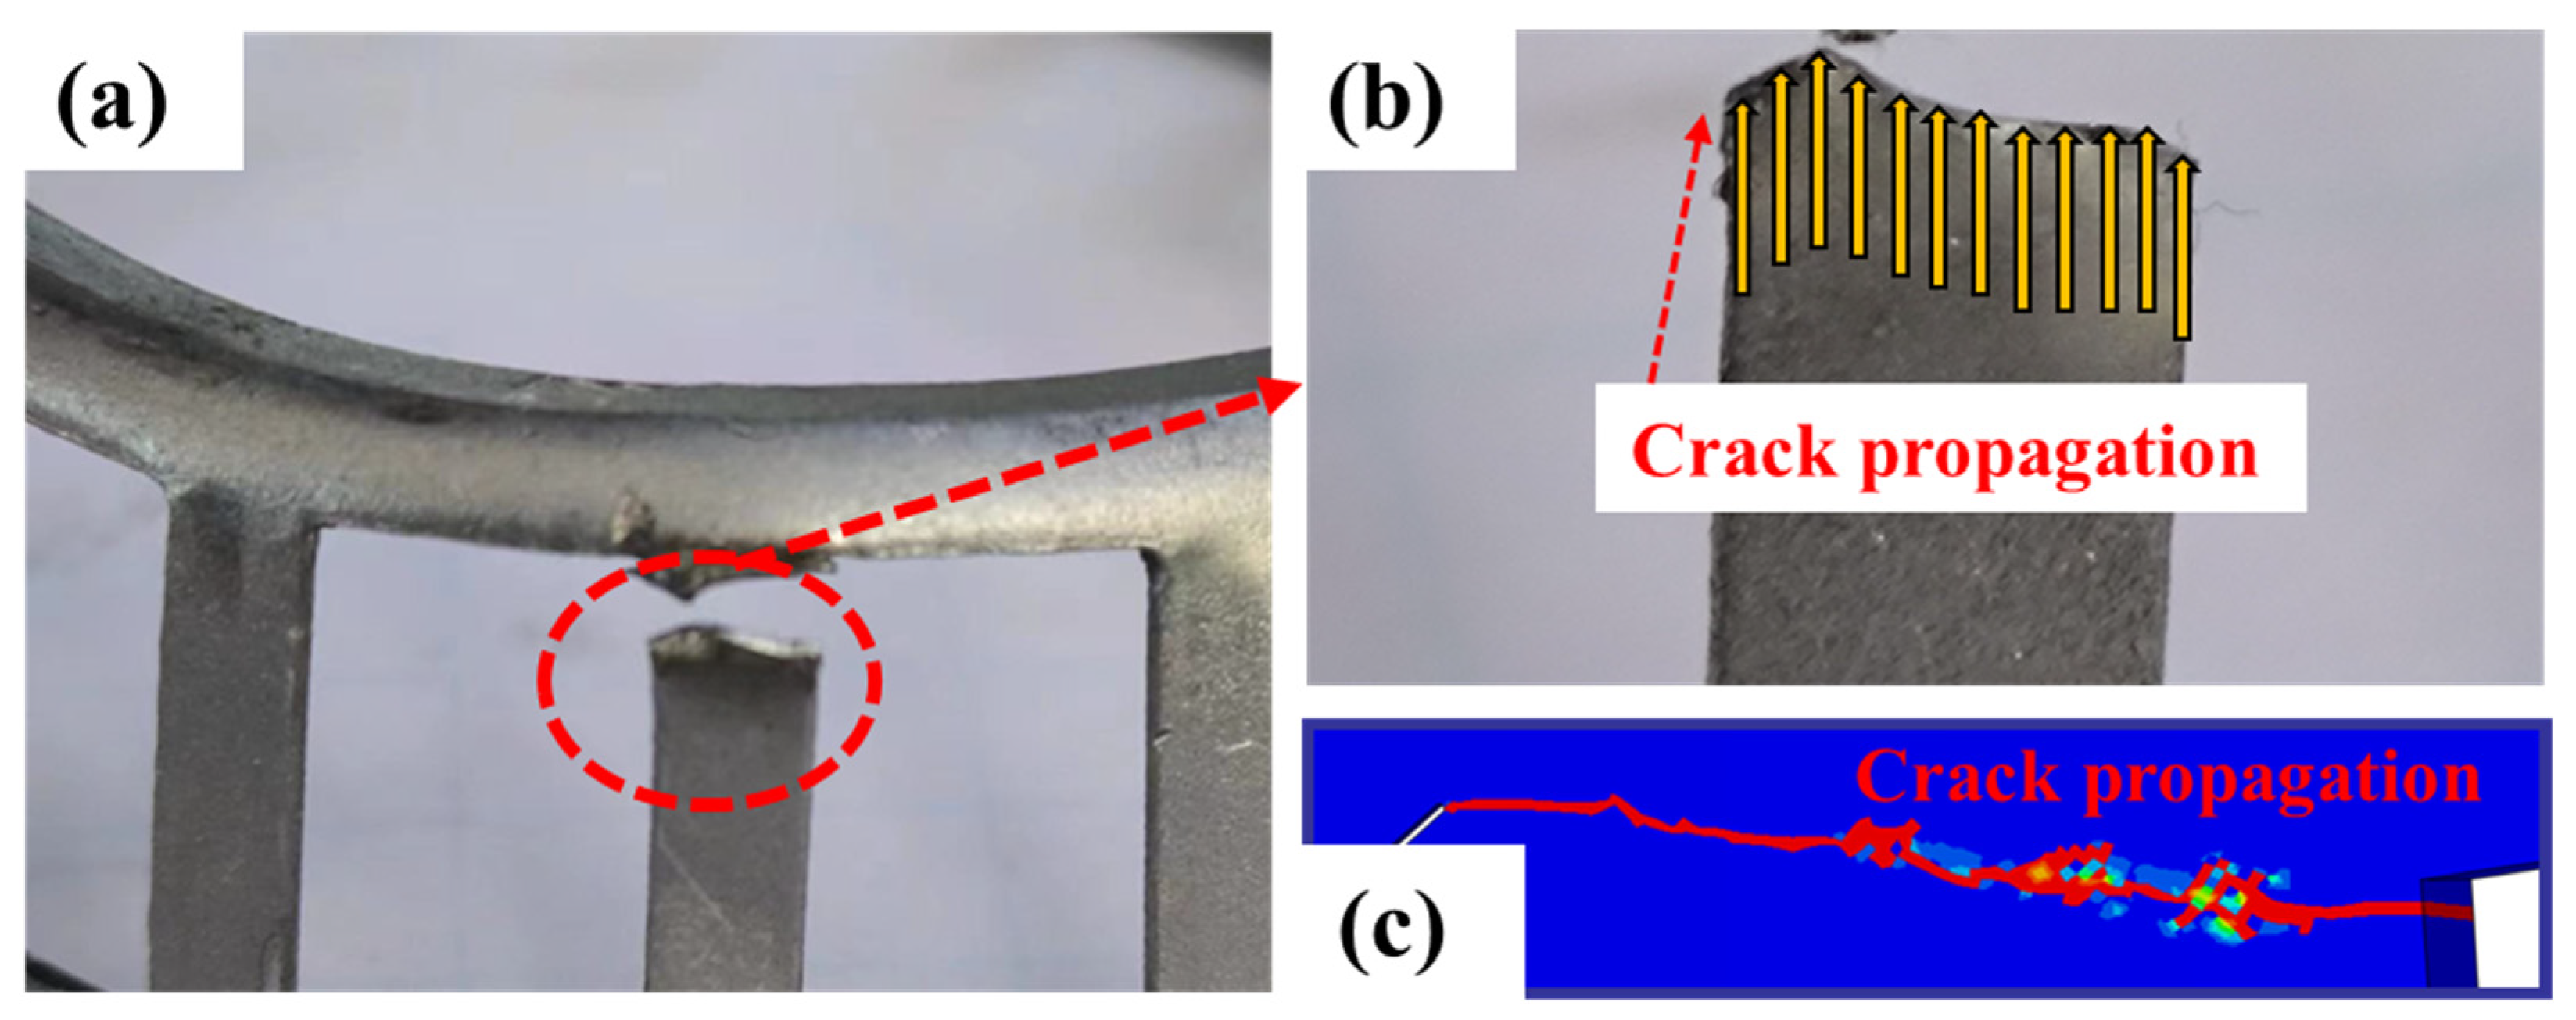
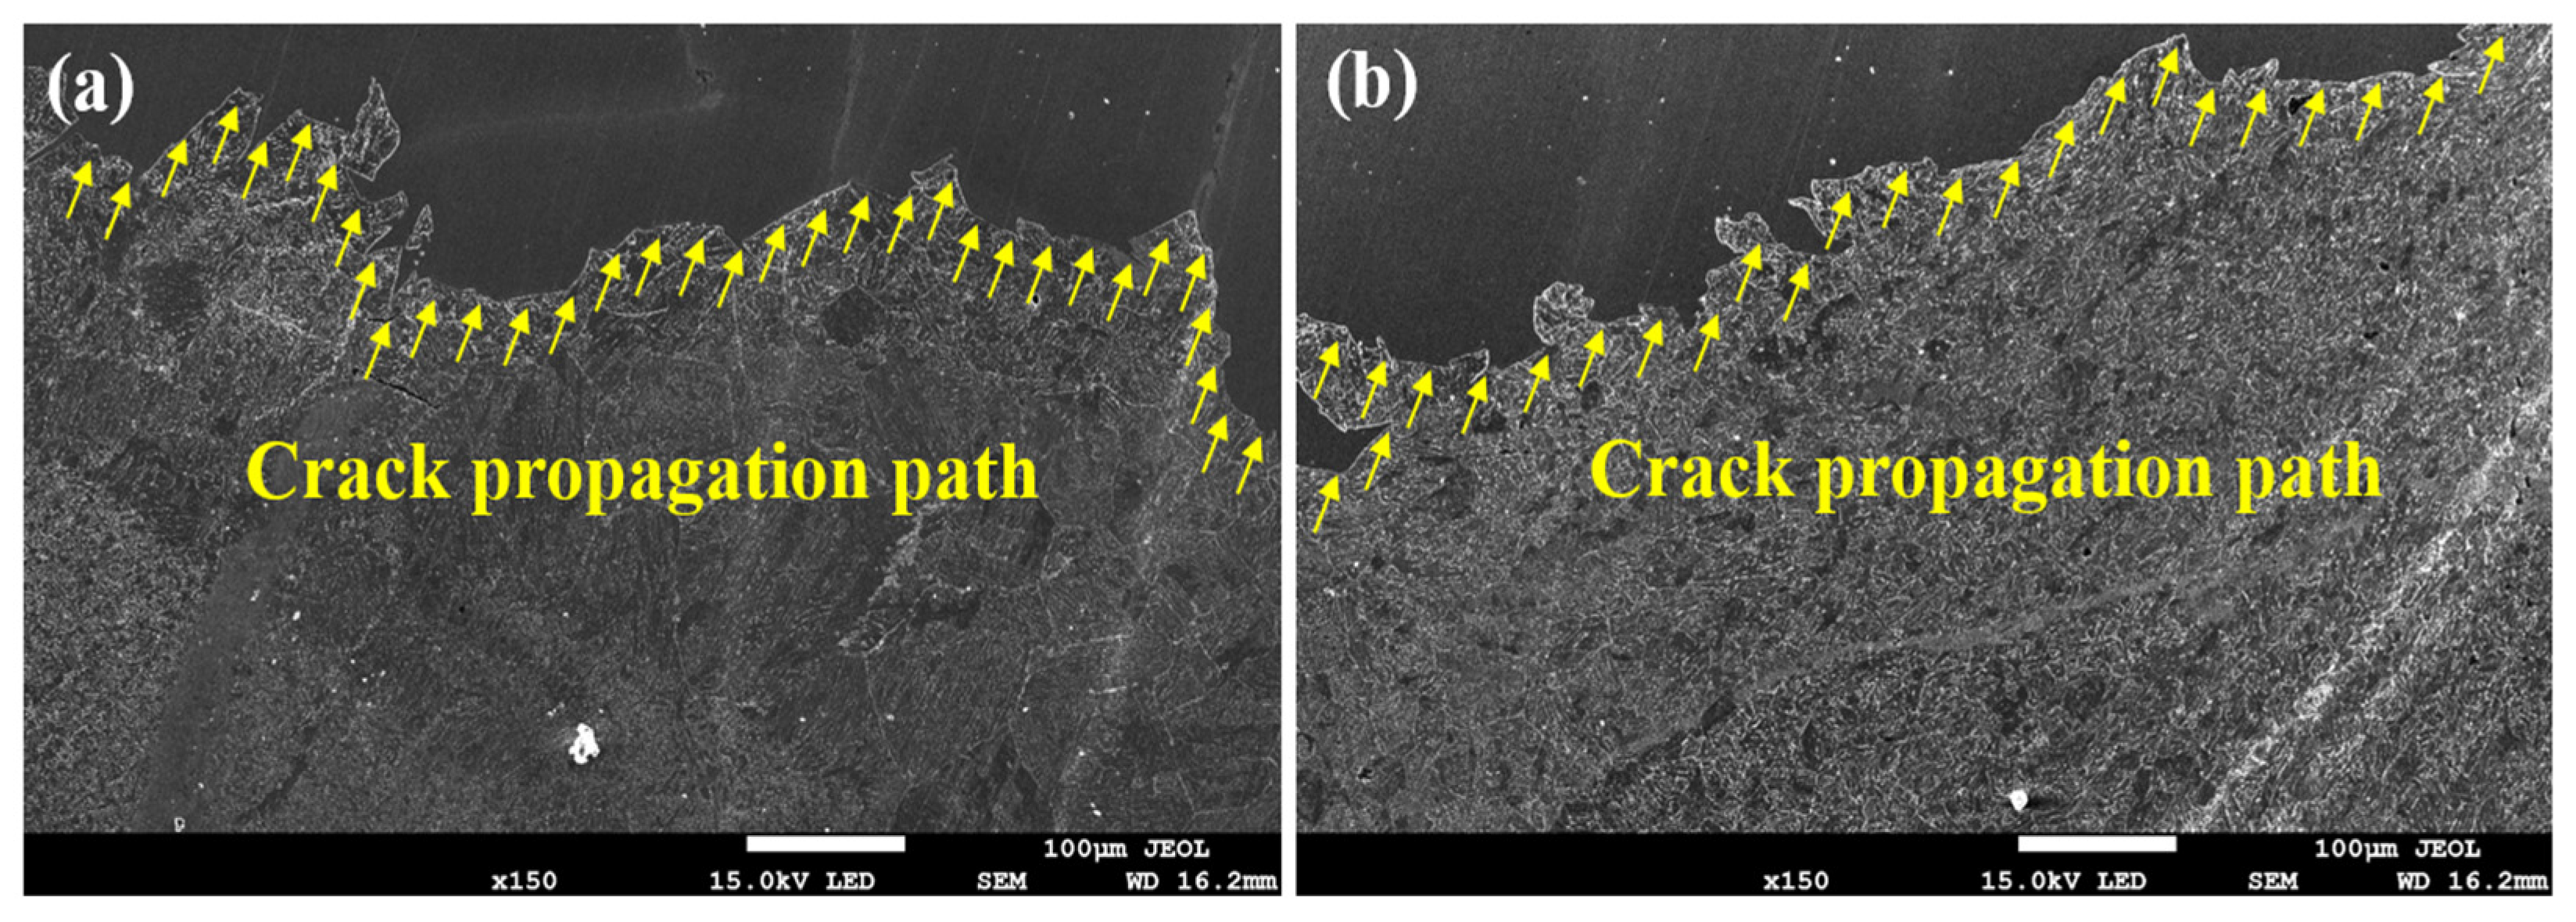
Crack propagation in the cage predominantly follows a circumferential direction, with crack initiation occurring at the corners of adjacent pocket bridges. These cracks ultimately coalesce, leading to structural failure.
(4)
Longitudinal loading (Load II) provides superior fracture toughness and crack growth resistance (peak CTODc: 0.598 mm) due to enhanced plastic strain accumulation, outperforming circumferential (Load I) and coupled loading (Load III).
(5)
Fracture toughness decreases with crack depth (CTODc reductions of 66.5%, 20.1%, and 58.4% for Loads I, II, and III, respectively), while crack deflection angles exhibit significant variability only under Load I (35% increase), indicating load-dependent failure mechanisms.
(6)
Enhancing the machining precision of the pocket bridge fillet radius effectively reduces stress concentrations, thereby improving the bearing’s durability and extending its service life.
The current findings highlight several critical research directions to deepen the understanding of cage fracture mechanisms. First, extensive experimental validation under a broader range of operating conditions—including ultra-high rotational speeds (>15,000 rpm), transient loading scenarios, and mixed lubrication regimes—is imperative to verify and further refine the GTN-based predictive model. Second, material innovation represents a promising frontier, particularly through the development and characterization of next-generation cage materials, such as carbon fiber-reinforced thermoplastics and nickel-based superalloys, which may offer enhanced fracture resistance and thermal stability. A particularly significant challenge lies in developing a coupled tribological–fracture mechanics framework that accurately accounts for lubricant film dynamics, surface roughness effects, and their collective influence on crack initiation and propagation. The integration of machine learning techniques with the current methodology could revolutionize predictive maintenance capabilities through the real-time processing of multi-sensor data streams, enabling the early detection of incipient failures. Most critically, the thermo-mechanical behavior under extreme operating conditions demands focused investigation, as the interplay between frictional heating, thermal expansion, and stress redistribution may dominate failure mechanisms in high-performance applications. These research directions, pursued collectively, would not only extend fundamental knowledge but also enable transformative improvements in bearing reliability and service life for demanding industrial applications.

Author Contributions

Conceptualization, H.L. and Q.L.; methodology, Q.L.; software, Q.L., J.N. and M.Y.; validation, H.L. and Q.L.; formal analysis, Q.L.; investigation, H.L. and Q.L.; resources, H.L.; data curation, J.N. and M.Y.; writing—original draft preparation, Q.L. and J.N.; writing—review and editing, H.L. and J.N.; visualization, J.N.; supervision, H.L.; project administration, J.N.; funding acquisition, H.L. and Q.L. All authors have read and agreed to the published version of the manuscript.

Funding

This research was funded by the Shanghai Alliance Program (USD 69,400.00, Grant No. LM201805, Shanghai Educational Development Foundation, Shanghai, China) and the Postgraduate Research Innovation Project of Tianjin (USD 15,000.00, Grant No. 2022SKY075, Tianjin University, Tianjin, China).

Data Availability Statement

The original contributions presented in this study are included in the article. Further inquiries can be directed to the corresponding author.

Acknowledgments

We would also like to express our sincere gratitude to Wenbin Gao for his invaluable guidance and support throughout this study.

Conflicts of Interest

The authors declare that they have no known competing financial interests or personal relationships that could have appeared to influence the work reported in this paper.

References

  1. Tedric, A.H.; Michael, N. Advanced Concepts of Bearing Technology, 5th ed.; CRC Press: Boca Raton, FL, USA, 2018; pp. 1–20. [Google Scholar]
  2. Zhang, J.; Fang, B.; Hong, J. Effect of preload on ball-raceway contact state and fatigue life of angular contact ball bearing. Tribol. Int. 2017, 114, 365. [Google Scholar] [CrossRef]
  3. Hua, R.; Zhu, L. Contact stress FEM analysis of deep groove ball bearing based on ANSYS Workbench. Appl. Mech. Mater. 2014, 574, 21. [Google Scholar]
  4. Zhang, Y.; Shu, T.; Ding, R. Bearing life prediction based on SPSS and grey prediction model. IOP Conf. Ser. Earth Environ. Sci. 2021, 634, 012054. [Google Scholar] [CrossRef]
  5. Xu, D.; Zhu, Q.; Zhang, Y. Review of research on detection of bearing subsurface white corrosion defects. Meas. Test. Technol. 2023, 50, 16. [Google Scholar]
  6. Nahm, S.H.; Jeon, S.K.; Kim, D.K.; Suh, M.S.; Suh, C.M. Very-High-Cycle Fatigue Behaviors for Bearing Steel Microstructural Transformation. Crystals 2024, 14, 1040. [Google Scholar] [CrossRef]
  7. Sharma, A.; Upadhyay, N.; Kankar, P. Nonlinear dynamic investigations on rolling element bearings: A review. Adv. Mech. Eng. 2018, 10, 168781401876414. [Google Scholar] [CrossRef]
  8. Liu, Y.; Zhang, Z. Skidding research of a high-speed cylindrical roller bearing with beveled cage pockets. Ind. Lubr. Tribol. 2020, 72, 969. [Google Scholar] [CrossRef]
  9. Zheng, J.; Hu, Y. Study on crack propagation of a bearing inner-ring under cyclic loading. Appl. Mech. Mater. 2016, 851, 317. [Google Scholar] [CrossRef]
  10. Mu, W.; Chen, C. Crystallization of High-Performance Metallic Materials. Crystals 2025, 15, 147. [Google Scholar] [CrossRef]
  11. Kadin, Y.; Dop, J.; Schaake, R. Modeling of fatigue/creep in polymer cage of large size bearing. Adv. Sci. Technol. 2025, 18, 1583. [Google Scholar]
  12. Takeshima, K.; Mutoh, K.; Imanishi, K. Mechanisms of cage noise generation in machine tool bearings. Front. Mech. Eng. 2025, 10, 1469546. [Google Scholar] [CrossRef]
  13. Feng, X.; Zhu, P.; Wang, W. Lubricant seepage behavior of porous polyimide cage materials under sliding contact loading. Tribol. Int. 2025, 204, 110470. [Google Scholar] [CrossRef]
  14. Zeng, G.; Liang, Z.; Zhao, C. Study on the mass imbalance macro-micro friction and wear characteristics of high-speed angular contact ball bearing cages. Tribol. Int. 2025, 204, 110491. [Google Scholar] [CrossRef]
  15. Wang, Y.J.; Wang, H.Y.; Yan, J.X.; Wang, B.; Wen, B.G. Cage dynamic analysis of four-point contact ball bearing for high-speed railway traction motor. J. Phys. Conf. Ser. 2024, 2890, 012064. [Google Scholar] [CrossRef]
  16. Xiao, L.F.; Zheng, Z.B.; Tan, Y.S.; Yang, Z.J.; Zhang, J.W.; Zhou, N.; Yan, J.M.; Li, J.J.; Chen, J.; Wu, Y.X.; et al. Causes and analysis of failure of bearing cage at non-driven end of wind turbine generator. Eng. Fail. Anal. 2025, 167, 108991. [Google Scholar] [CrossRef]
  17. You, J.Y.; Ma, X.Q.; Liu, C.Y.; Zuo, M.J.; Jin, D.L.; Zhang, H. Measurement and dynamic analysis of the centroid trajectories of angular-contact ball bearing cages. Lubricants 2024, 12, 379. [Google Scholar] [CrossRef]
  18. Chen, W.B.; Wang, C.; Zhou, G.; Liu, F.B.; Wang, W.Z.; Zhu, P.Z. Molecular Dynamics Simulations of Lubricant Supply in Porous Polyimide Bearing Retainers. Lubricants 2024, 12, 343. [Google Scholar] [CrossRef]
  19. Zhang, Z.; Zhang, H.; Wang, J.; Qin, S.; Duan, X.; Duan, M. Study on mechanics and high temperature tribological properties of porous bearing cage material. J. Reinf. Plast. Compos. 2024, 43, 1165. [Google Scholar] [CrossRef]
  20. Li, H.; Liu, H.; Liu, Y. On the dynamic characteristics of ball bearing with cage broken. Ind. Lubr. Tribol. 2020, 72, 881. [Google Scholar] [CrossRef]
  21. Wang, B.X.; Fang, W.B.; Yan, R.X.; Qian, S.K. Investigation of oil-air two-phase flow inside angular contact ball bearing with textured cage. J. Shanghai Jiaotong Univ. (Sci.) 2024, 10, 1. [Google Scholar] [CrossRef]
  22. Chen, H.; Liu, Y.; Liang, H. The cage instability of angular contact ball bearing under high-speed conditions. Mech. Mach. Theory 2024, 197, 105646. [Google Scholar] [CrossRef]
  23. Su, B.; Li, H.; Zhang, G. Study on cage stability of solid-lubricated angular contact ball bearings in an ultra-low temperature environment. Lubricants 2024, 12, 124. [Google Scholar] [CrossRef]
  24. ISO 281:2007; Rolling Bearings-Dynamic Load Ratings and Rating Life. International Organization for Standardization: Geneva, Switzerland, 2007.
  25. Gurson, A.L. Continuum theory of ductile rupture by void nucleation and growth: Part I-Yield criteria and flow rules for porous ductile media. J. Eng. Mater. Technol. 1977, 99, 297. [Google Scholar] [CrossRef]
  26. Tu, H. The Gurson-Tvergaard-Needleman (GTN) Model. In Numerical Simulation and Experimental Investigation of the Fracture Behaviour of an Electron Beam Welded Steel Joint; Springer: Cham, Switzerland, 2018; pp. 75–95. [Google Scholar]
  27. Perna, A.S.; Savio, L.; Coppola, M.; Scherillo, F. Investigating Fracture Behavior in Titanium Aluminides: Surface Roughness as an Indicator of Fracture Mechanisms in Ti-48Al-2Cr-2Nb Alloys. Metals 2025, 15, 49. [Google Scholar] [CrossRef]
  28. Ren, Z.D.; Li, B.Z.; Zhou, Q.Z. Rolling contact fatigue crack propagation on contact surface and subsurface in mixed mode I+II+III fracture. Wear 2022, 506–507, 204459. [Google Scholar] [CrossRef]
  29. Fu, Z.; Hua, H. Modal Analysis Theory and Application; Shanghai Jiao Tong University Press: Shanghai, China, 2000; pp. 12–80. [Google Scholar]
  30. Wang, X.; Tan, Y.; Deng, Y. Modal and harmonic response analysis on the irregular arm based on ANSYS Workbench. Mech. Res. Appl. 2024, 37, 108. [Google Scholar]
  31. Liang, H.; Zhan, R.; Wang, D.P.; Deng, C.Y.; Guo, B.C.; Xu, X.H. Fatigue crack growth under overload/underload in different strength structural steels. J. Constr. Steel Res. 2022, 192, 107213. [Google Scholar] [CrossRef]
  32. Maziar, K.; Moslemi, H.; Javad, M. Fracture prediction of AA6061-T6 sheet in bending process using Gurson-Tvergaard-Needleman model. Proc. Inst. Mech. Eng. Part L J. Mater. Des. Appl. 2023, 237, 2506. [Google Scholar]
  33. Ning, J.A.; Deng, C.Y.; Dai, L.S.; Liu, Q.; Gong, B.M.; Guo, B.C.; Wang, Y.J. Fracture behavior analysis of X80 girth welds considering misaligned and variable-wall-thickness geometric features via modified single-edge notched tensile (MSENT) specimens. Eng. Fract. Mech. 2025, 317, 110910. [Google Scholar] [CrossRef]
  34. Liang, H.; Wang, D.P.; Deng, C.Y.; Zhan, R. Fatigue crack growth acceleration in S355 steel under a single and periodic underload. Int. J. Fatigue 2022, 158, 106744. [Google Scholar] [CrossRef]
  35. Hu, W.T.; Gong, B.M.; Chang, Q.; Zhao, Z.F.; Dai, L.S.; Liu, Y. Strain fracture behaviors and crack equivalence of X80 welded joints with non-sharp notches at weld root. Int. J. Pressure Vessels Piping. 2025, 2214, 105414. [Google Scholar] [CrossRef]
  36. Ning, J.A.; Deng, C.Y.; Wang, Y.J.; Gong, B.M.; Guo, B.C.; Zhao, N.; Dai, L.S. Stress state analysis of root notch for X80 girth welds with variable wall thickness and misalignment geometric features. Int. J. Pressure Vessels Piping. 2023, 206, 105064. [Google Scholar] [CrossRef]
  37. Harris, T.; Michael, N. Rolling Bearing Analysis; Taylor & Francis: New York, NY, USA, 2006; pp. 33–140. [Google Scholar]
  38. Cheng, D.X. Bearing. In Mechanical Design Handbook, 6th ed.; China Machine Press: Beijing, China, 2004; Volume 3, pp. 1–193. [Google Scholar]
  39. Tvergaard, V.; Needleman, A. Analysis of the cup-cone fracture in a round tensile bar. Acta Metall. 1984, 32, 157. [Google Scholar] [CrossRef]
  40. Hung, N. Computational Design of Rolling Bearings; Springer: Shanghai, China, 2016; pp. 18–100. [Google Scholar]
  41. Huang, Y. Research on Fatigue Life of High-Speed Train Axle-Box Bearing Under Fluctuant Impact Load. Master’s Thesis, Henan University of Science and Technology, Luoyang, China, 2017; pp. 12–70. [Google Scholar]
  42. Song, B. Analysis of Mechanical Properties and Fatigue Life of Tapered Roller Bearings. Ph.D. Thesis, Xi’an University Technology, Shannxi, China, 2018; pp. 16–60. [Google Scholar]
  43. Hung, N. Numerische Auslegung von Wälzlagern; Springer: Asperg, Germany, 2017; pp. 10–110. [Google Scholar]
Figure 1. Cage fracture mechanics analysis methodological framework.
Metals 15 00592 g001
Figure 2. Schematic showing the crack tip (a) stress/equivalent plastic strain distribution, (b) void growth, coalescence, and ductile tearing (c,d) model for ductile crack growth computational cells.
Metals 15 00592 g002
Figure 3. Bearing model and geometric parameters.
Metals 15 00592 g003
Figure 4. Preprocessing (a) loads, and constraint (b) meshing results.
Metals 15 00592 g004
Figure 5. Finite element analysis results: (a) static total deformation, (b) static equivalent stress, (c) dynamic total deformation, (d) dynamic equivalent stress.
Metals 15 00592 g005
Figure 6. (a) Contact state, (b) finite element stress distribution, (c) location of maximum stress in the cage structure, (d) roller force distribution, (e) comparative analysis of a certain type of roller bearing specimen (F = 1500 N).
Metals 15 00592 g006
Figure 7. Comparison of contact reference velocities.
Metals 15 00592 g007
Figure 8. (a) Total deformation, (b) natural frequency, (c) x-axis harmonic response curve.
Metals 15 00592 g008
Figure 9. (a) Bearing cage boundary conditions and load applications; (b) meshing results and crack tip settings.
Metals 15 00592 g009
Figure 10. Study of the crack propagation behavior of the cage under different initial crack lengths (a = 0.50, 0.75, 1.00, and 1.25 mm) and load levels (Load I, II, and III). Crack growth stages represent: (a) crack initiation, (b) crack growth, (c) crack convergence, and (d) final fracture with crack deflection angle marked (The deleted meshes reveal the crack propagation path).
Metals 15 00592 g010
Figure 11. Strain evolution behavior of the cage under different initial crack lengths (a = 0.50, 0.75, 1.00, and 1.25 mm) and load levels (Load I, II, and III). Different strain development stages during crack propagation: (a) crack initiation (b) crack propagation, (c) crack convergence, and (d) final fracture.
Metals 15 00592 g011
Figure 12. Strain revolution behavior of the cage: (a) crack growth resistance curves, (b) crack deflection angles, (c) critical crack tip opening displacement, (d) CTOD.
Metals 15 00592 g012
Figure 13. A type of transmission tapered roller bearing cage specimen, (a,b) fracture morphology, (c) crack propagation simulation path (Load I, a = 0.5 mm).
Metals 15 00592 g013
Figure 14. SEM results of the crack propagation path of the fractured cage in a type of gearbox; (a) the front of the crack propagation path, (b) the end of the crack propagation path.
Metals 15 00592 g014
Figure 15. Model and preprocessing: (a) constraint load, (b) cage force, (c) fillet parameters, (d) mesh division.
Metals 15 00592 g015
Figure 16. Stress analysis results for different loads and pocket fillets: (a) mesh division, (b) boundary and loading, (cf) stress analysis results.
Metals 15 00592 g016
Figure 17. Relationship between the cage fillet and maximum equivalent stress: (a) relationship between maximum equivalent stress, load and R, (b) relationship between maximum equivalent stress and R.
Metals 15 00592 g017
Table 1. Bearing basic parameters.
ParameterValue
Inner diameter d/mm55
Outer diameter D/mm120
Inner ring width B/mm29
Outer ring width C/mm21
Ring diameter d1/mm90.2
Roller’s big end diameter/mm7
Roller radius/mm3.5
Roller length/mm25
Rated dynamic load (Cr)Approximately 245 kN (dynamic load capacity, 1 million revolutions at 90% reliability)
Rated static load (Cor)Approximately 305 kN
Limiting speed (oil lubrication)Approximately 3000 rpm (reduced by approximately 20~30% when grease lubrication is used)
Fatigue lifeBased on load and lubrication conditions, usually up to tens of thousands of hours
Table 2. Bearing material properties (the inner and outer rings are made of the same material as the rollers).
MaterialElastic ModulusPoisson’s
Ratio
DensityYield StrengthTensile Strength
GCr15208 GPa0.37.85 g/cm3518.42 MPa861.3 MPa
Table 3. Bearing cage material properties.
MaterialElastic ModulusPoisson’s
Ratio
DensityYield StrengthTensile Strength
10#Steel.206 GPa0.37.9 g/cm3205 MPa410 MPa
Table 4. GTN parameters of the cage.
q1q2q3εnfcfFf0Sn
Value1.51.02.250.30.20.20.00050.1
Table 5. Maximum equivalent stress (MPa) in the cage structure under varying radial loads (F) and cage pocket fillet radii (R).
R = 0 mmR = 0.25 mmR = 0.5 mmR = 0.75 mmR = 1.0 mm
Load F = 500 N272.08262.08217.8203.84204.53
Load F = 400 N214.37210.27174.24163.07163.63
Load F = 300 N164.9157.7130.68123.3122.72
Load F = 200 N123.67105.1387.12281.53680.035
Load F = 100 N65.98952.56643.56140.76839.489
Disclaimer/Publisher’s Note: The statements, opinions and data contained in all publications are solely those of the individual author(s) and contributor(s) and not of MDPI and/or the editor(s). MDPI and/or the editor(s) disclaim responsibility for any injury to people or property resulting from any ideas, methods, instructions or products referred to in the content.

