3.1. Microstructural Analysis
Figure 2 features SEM images of Cu-5% Cr powders at different ball-milling durations. As shown in
Figure 2a, during the initial stage of ball milling, the powder surface is rough, with large and unevenly distributed particles. With an increase in ball-milling time to 20 h, the frequency and duration of collisions between the balls and powder particles increase, leading to increased brittleness and a higher propensity for fracture [
29]. As the ball milling progresses, work hardening causes the powder to become increasingly brittle. The continuous collisions and impacts result in particle fragmentation, gradually reducing the particle size (as illustrated in
Figure 2b) [
30]. Throughout this process, dislocations and lattice distortions accumulate within the powder. As ball-milling time increases, the intensity of collisions and impacts significantly intensifies, transforming the powder into multi-layered flaky particles under vigorous impacts, accompanied by cold welding between particles [
31]. Although the particles have been significantly refined, unlike the multi-layered and ductile powders observed in
Figure 2c, the particle size is notably reduced, and the grain refinement process is closely associated with particle fracture and cold welding [
29,
32]. As ball-milling time further extends, the powder particles undergo repeated deformation, cold welding, work hardening, and fracture. At 45 h of ball milling, a balance between welding and fracture is achieved, with an increased welding rate, a tendency for the average particle size to decrease, smaller and smoother powder particles, and a more homogeneous distribution (as presented in
Figure 2d). Additionally,
Figure 2d,e show that C5 powder exhibits a more uniform particle distribution and less agglomeration compared to A5 powder. The A5 powder may not have undergone complete mechanical alloying, resulting in larger particles and some degree of aggregation. To verify whether the Cu and Cr powders are fully mechanically alloyed, XRD analysis was conducted on the powders at various ball-milling durations.
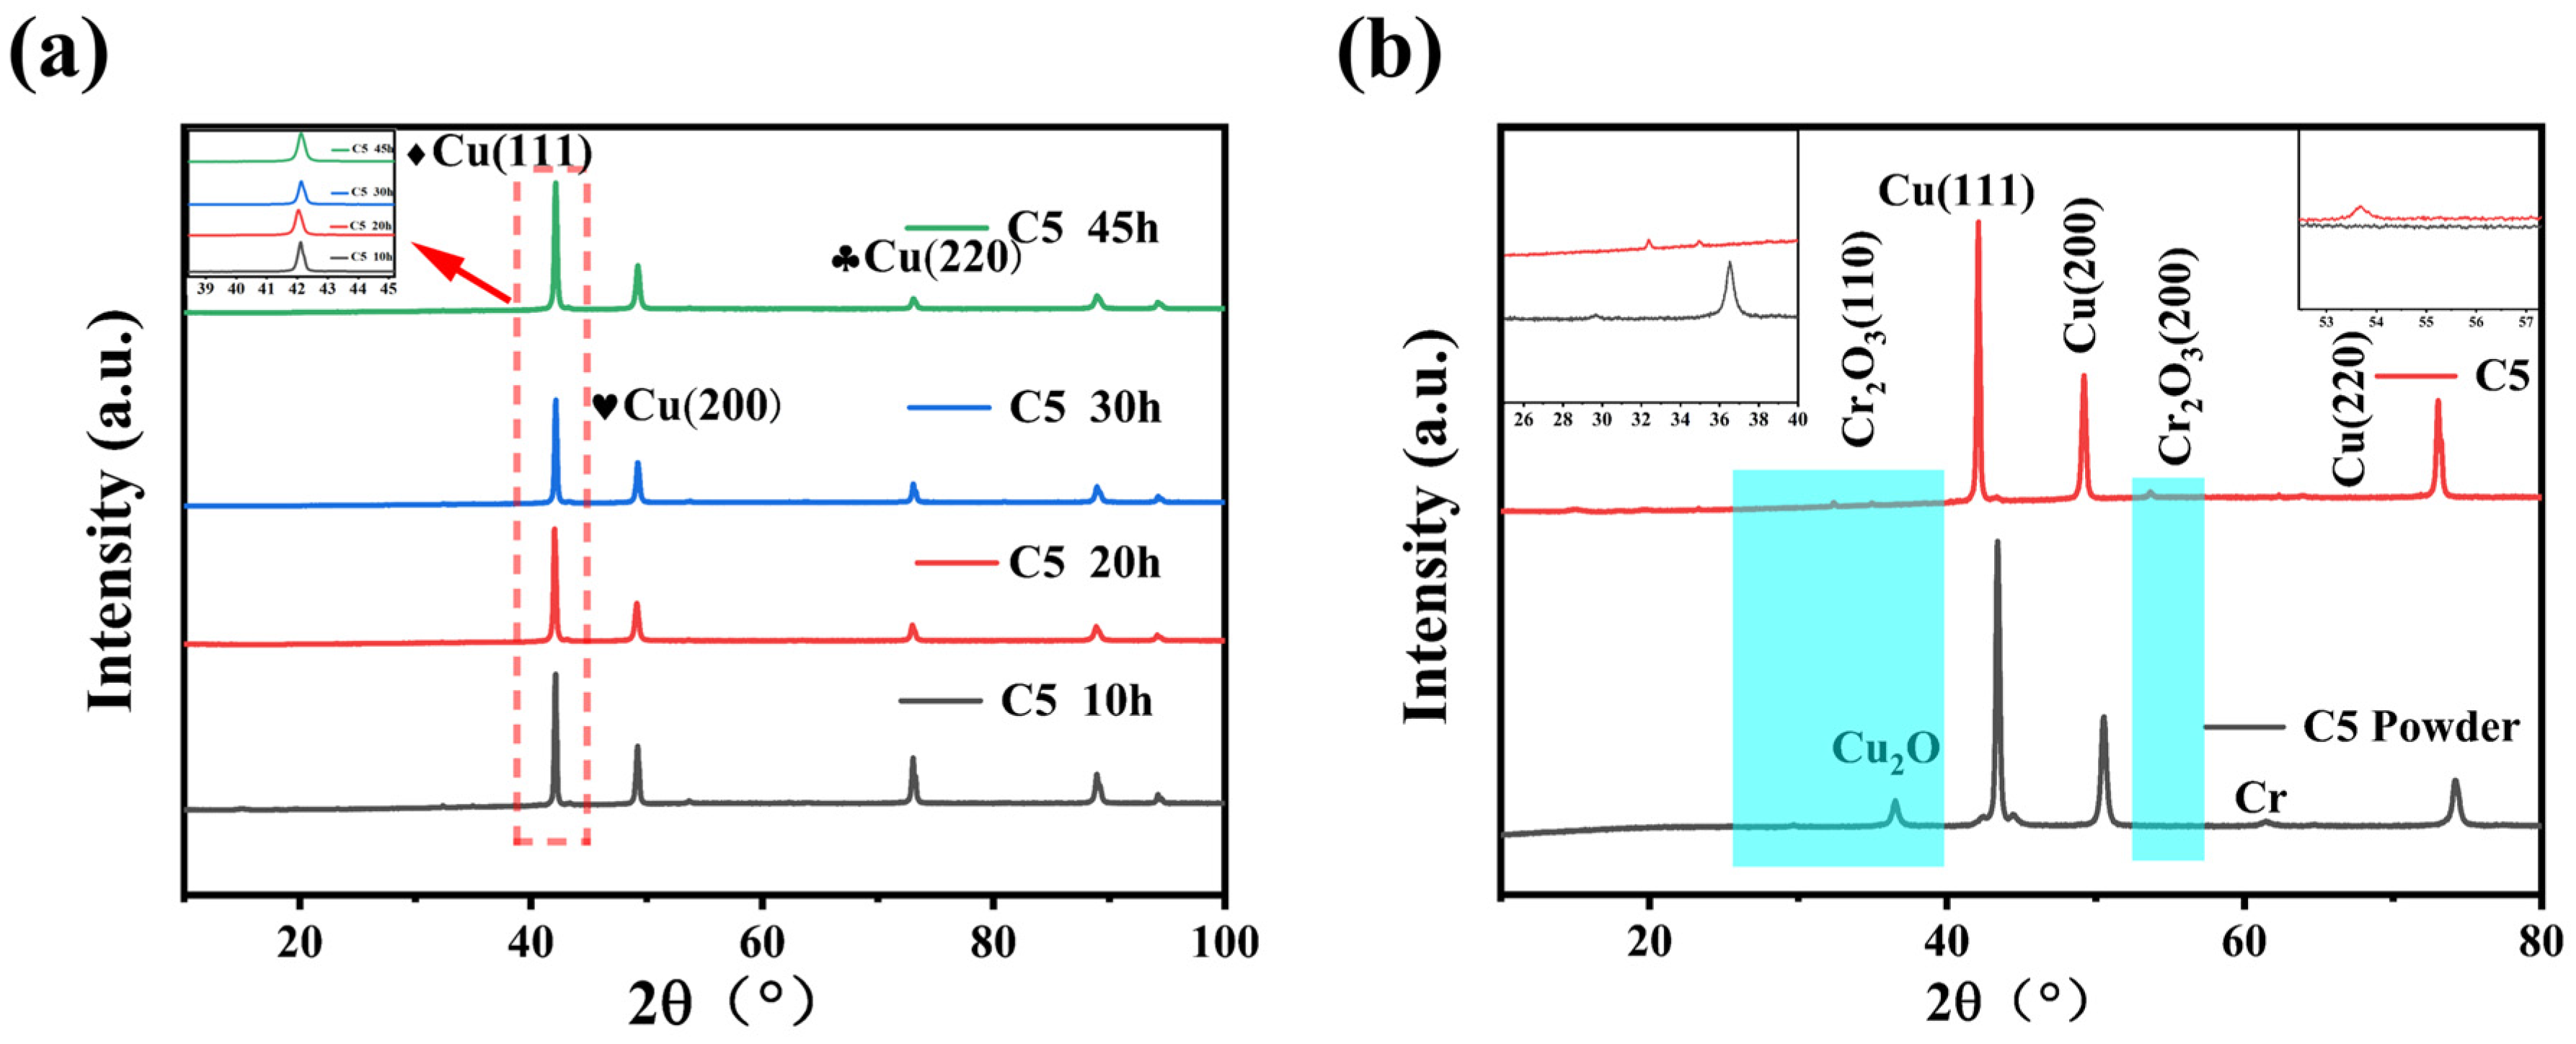
Figure 3a shows the XRD patterns of Cu-5 wt% Cr mixed powders after ball milling for 10 h, 20 h, 30 h, and 45 h. In the Cu-5 wt% Cr powder mixture, due to the low Cr content, the primary diffraction peaks originate from pure copper. As the ball-milling time increases, the intensity of the diffraction peaks gradually decreases, indicating a reduction in grain size and refinement of the crystal structure. This is attributed to the increased grain boundaries and grain refinement caused by the mechanical energy input during ball milling. The width of the diffraction peaks broadens, which results from both the reduced grain size and increased lattice strain. After 45 h of ball milling, the main diffraction peak angle slightly shifts to the left (i.e., 2θ decreases), indicating an increase in the Cu lattice parameter. This aligns with the dissolution process of Cr atoms, whose larger atomic radius causes lattice expansion. Between 20 h and 45 h, significant changes occur in the diffraction peaks, particularly near the (111) crystal plane, suggesting that Cr elements gradually dissolve into the Cu matrix and may start forming solid solutions. After 45 h of ball milling, the intensity of the diffraction peaks weakens and the peak width increases, indicating an increased proportion of Cu-Cr solid solutions in the alloy system. However, these changes may also be related to grain refinement, lattice strain, and other structural modifications, implying that the ball-milling energy is approaching saturation and the formation of solid solutions may still be in a non-equilibrium or metastable state. According to Bragg’s law, the main diffraction peak angle of Cu alloys is slightly smaller than that of pure Cu. Due to the small difference in atomic radius between Cu and Cr, the peak shift is minimal. Therefore, the 2θ angle of the (111) diffraction peak of the Cu-5 wt% Cr powder alloy after 45 h of ball milling is 43.21°, slightly lower than 43.45° for pure Cu. If a small amount of oxygen or Cr atoms (with a larger atomic radius) dissolve into the Cu lattice, the lattice parameter may increase significantly, causing a leftward shift in the diffraction peak [
33]. Another possibility is that ball milling may introduce stacking faults in the Cu lattice, leading to effects opposite to those caused by the dissolution of larger atoms [
34]. The experimental results further confirm the accumulation effect of mechanical energy during ball milling, indicating that extending the ball-milling time promotes the formation of Cu-Cr solid solutions. After 45 h of ball milling, the accumulated mechanical energy is sufficient to drive the generation of Cu-Cr solid solutions. This conclusion is consistent with the findings of Aguilar et al., highlighting the critical role of continuous mechanical energy accumulation in the formation of Cu-Cr solid solutions [
35]. As the ball-milling time increases, oxidation may occur (e.g., of Cu or Cr), leading to the formation of minor oxides. Although oxidation can affect the lattice structure, no new distinct peaks (such as those characteristic of CuO or Cr
2O
3) are observed in the spectrum, indicating that oxidation is minimal and has not significantly impacted the main crystal structure. The experimental results verify that the leftward peak shift trend is consistent with theoretical analysis, confirming that Cr atom dissolution leads to lattice expansion, in agreement with Bragg’s law and the physical properties of Cu-Cr alloys.
Figure 3b shows the XRD patterns of the Cu-5%Cr composite material, comparing the diffraction characteristics of the powder state (C5 powder curve) and the sintered bulk state (C5), with key crystal-plane peaks labeled. After internal oxidation treatment, a significant shift in the diffraction angle of Cu is observed, indicating that Cr has reacted with O to form Cr
2O
3 particles, which precipitate from the Cu lattice and distribute at the grain boundaries. Additionally, the width of the Cu(111) diffraction peak slightly broadens before oxidation, while the Cu
2O diffraction peak appears after ball milling (prior to oxidation). Notably, after oxidation, the Cu(111) peak width significantly narrows, the Cu
2O peak disappears, and no Cr
2O
3 diffraction peak is detected. The experimental results demonstrate that the internal oxidation process occurs during the sintering stage rather than the ball-milling stage. During sintering, Cr precipitates from the Cu solid solution and reacts with Cu
2O to form fine Cr
2O
3 particles. Due to the small size and low content of these Cr
2O
3 particles, their diffraction peak is difficult to observe in the XRD pattern. However, by comparing magnified images of local regions before and after oxidation, the Cr
2O
3 (024) diffraction peak can be clearly identified in the XRD pattern of the bulk material post sintering. The appearance of this Cr
2O
3 peak confirms that Cr undergoes internal oxidation during sintering, forming the reinforcing-phase Cr
2O
3. This peak does not appear in the powder sample, further confirming that the internal oxidation reaction primarily occurs during the sintering process.
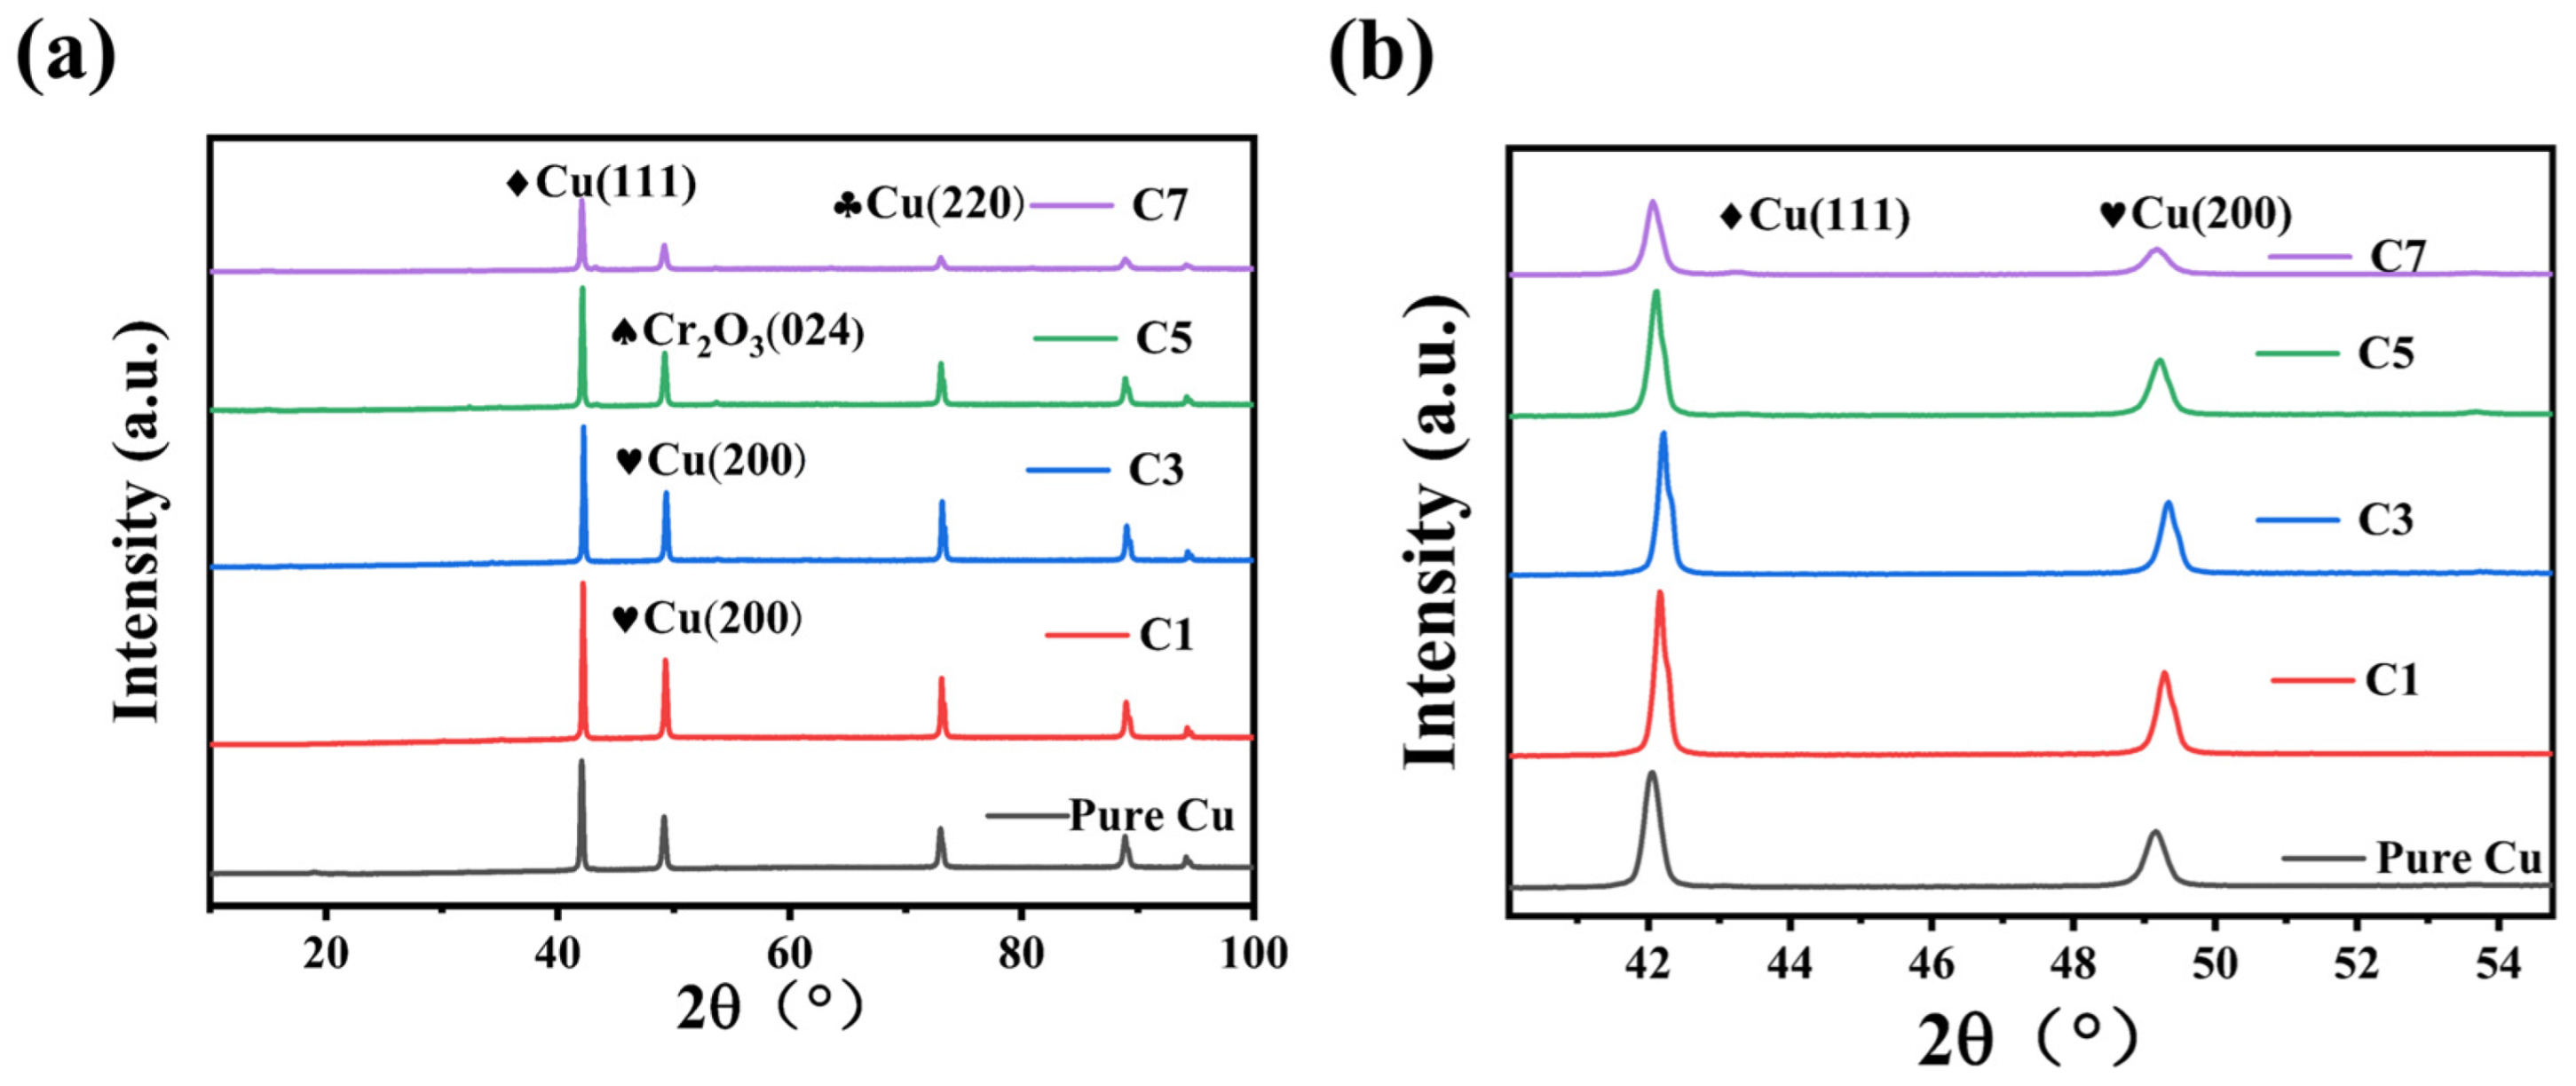
Figure 4 presents the XRD patterns of pure Cu and Cu-Cr composites (C1, C3, C5, C7) after internal oxidation. The primary diffraction peaks correspond to the characteristic peaks of Cu, while no distinct Cr peaks are observed due to the low Cr content. In
Figure 4b, the diffraction angle of Cu in the C1, C3, C5, and C7 alloy powders shifts to the right after internal oxidation. This indicates that Cr in the Cu-Cr alloy reacts with O to form Cr
2O
3 particles, which precipitate from the Cu lattice. The lattice constant of Cu decreases to 0.3615 nm, leading to an increase in the diffraction angle [
36]. The lattice distortion caused by Cr solid solution in the Cu lattice is minimal, resulting in a subtle shift in the Cu peak after internal oxidation. The internal oxidation behavior can be confirmed by the shift in the Cu diffraction angle, consistent with the results reported in other literature [
37]. In
Figure 4a, the XRD pattern of pure Cu primarily exhibits characteristic diffraction peaks at the (111), (200), and (220) crystal planes. These peaks are intense and have a narrow FWHM, indicating a well-ordered crystal structure with large grain size and no presence of other phases. For the Cu-Cr composites (C1, C3, C5, C7), the characteristic Cu peaks at (111), (200), and (220) are retained. As the Cr content increases, the intensity of the Cu diffraction peaks gradually decreases, and the FWHM slightly broadens, suggesting a reduction in grain size, likely due to lattice distortion and particle refinement induced by ball milling. In composites with Cr content of C3 and higher, the characteristic peak of the Cr
2O
3 (024) crystal plane appears, indicating the formation of Cr
2O
3 particles within the composites. The intensity of the Cr
2O
3 peak progressively increases from C3 to C7, indicating that higher Cr content leads to more Cr
2O
3 particles.
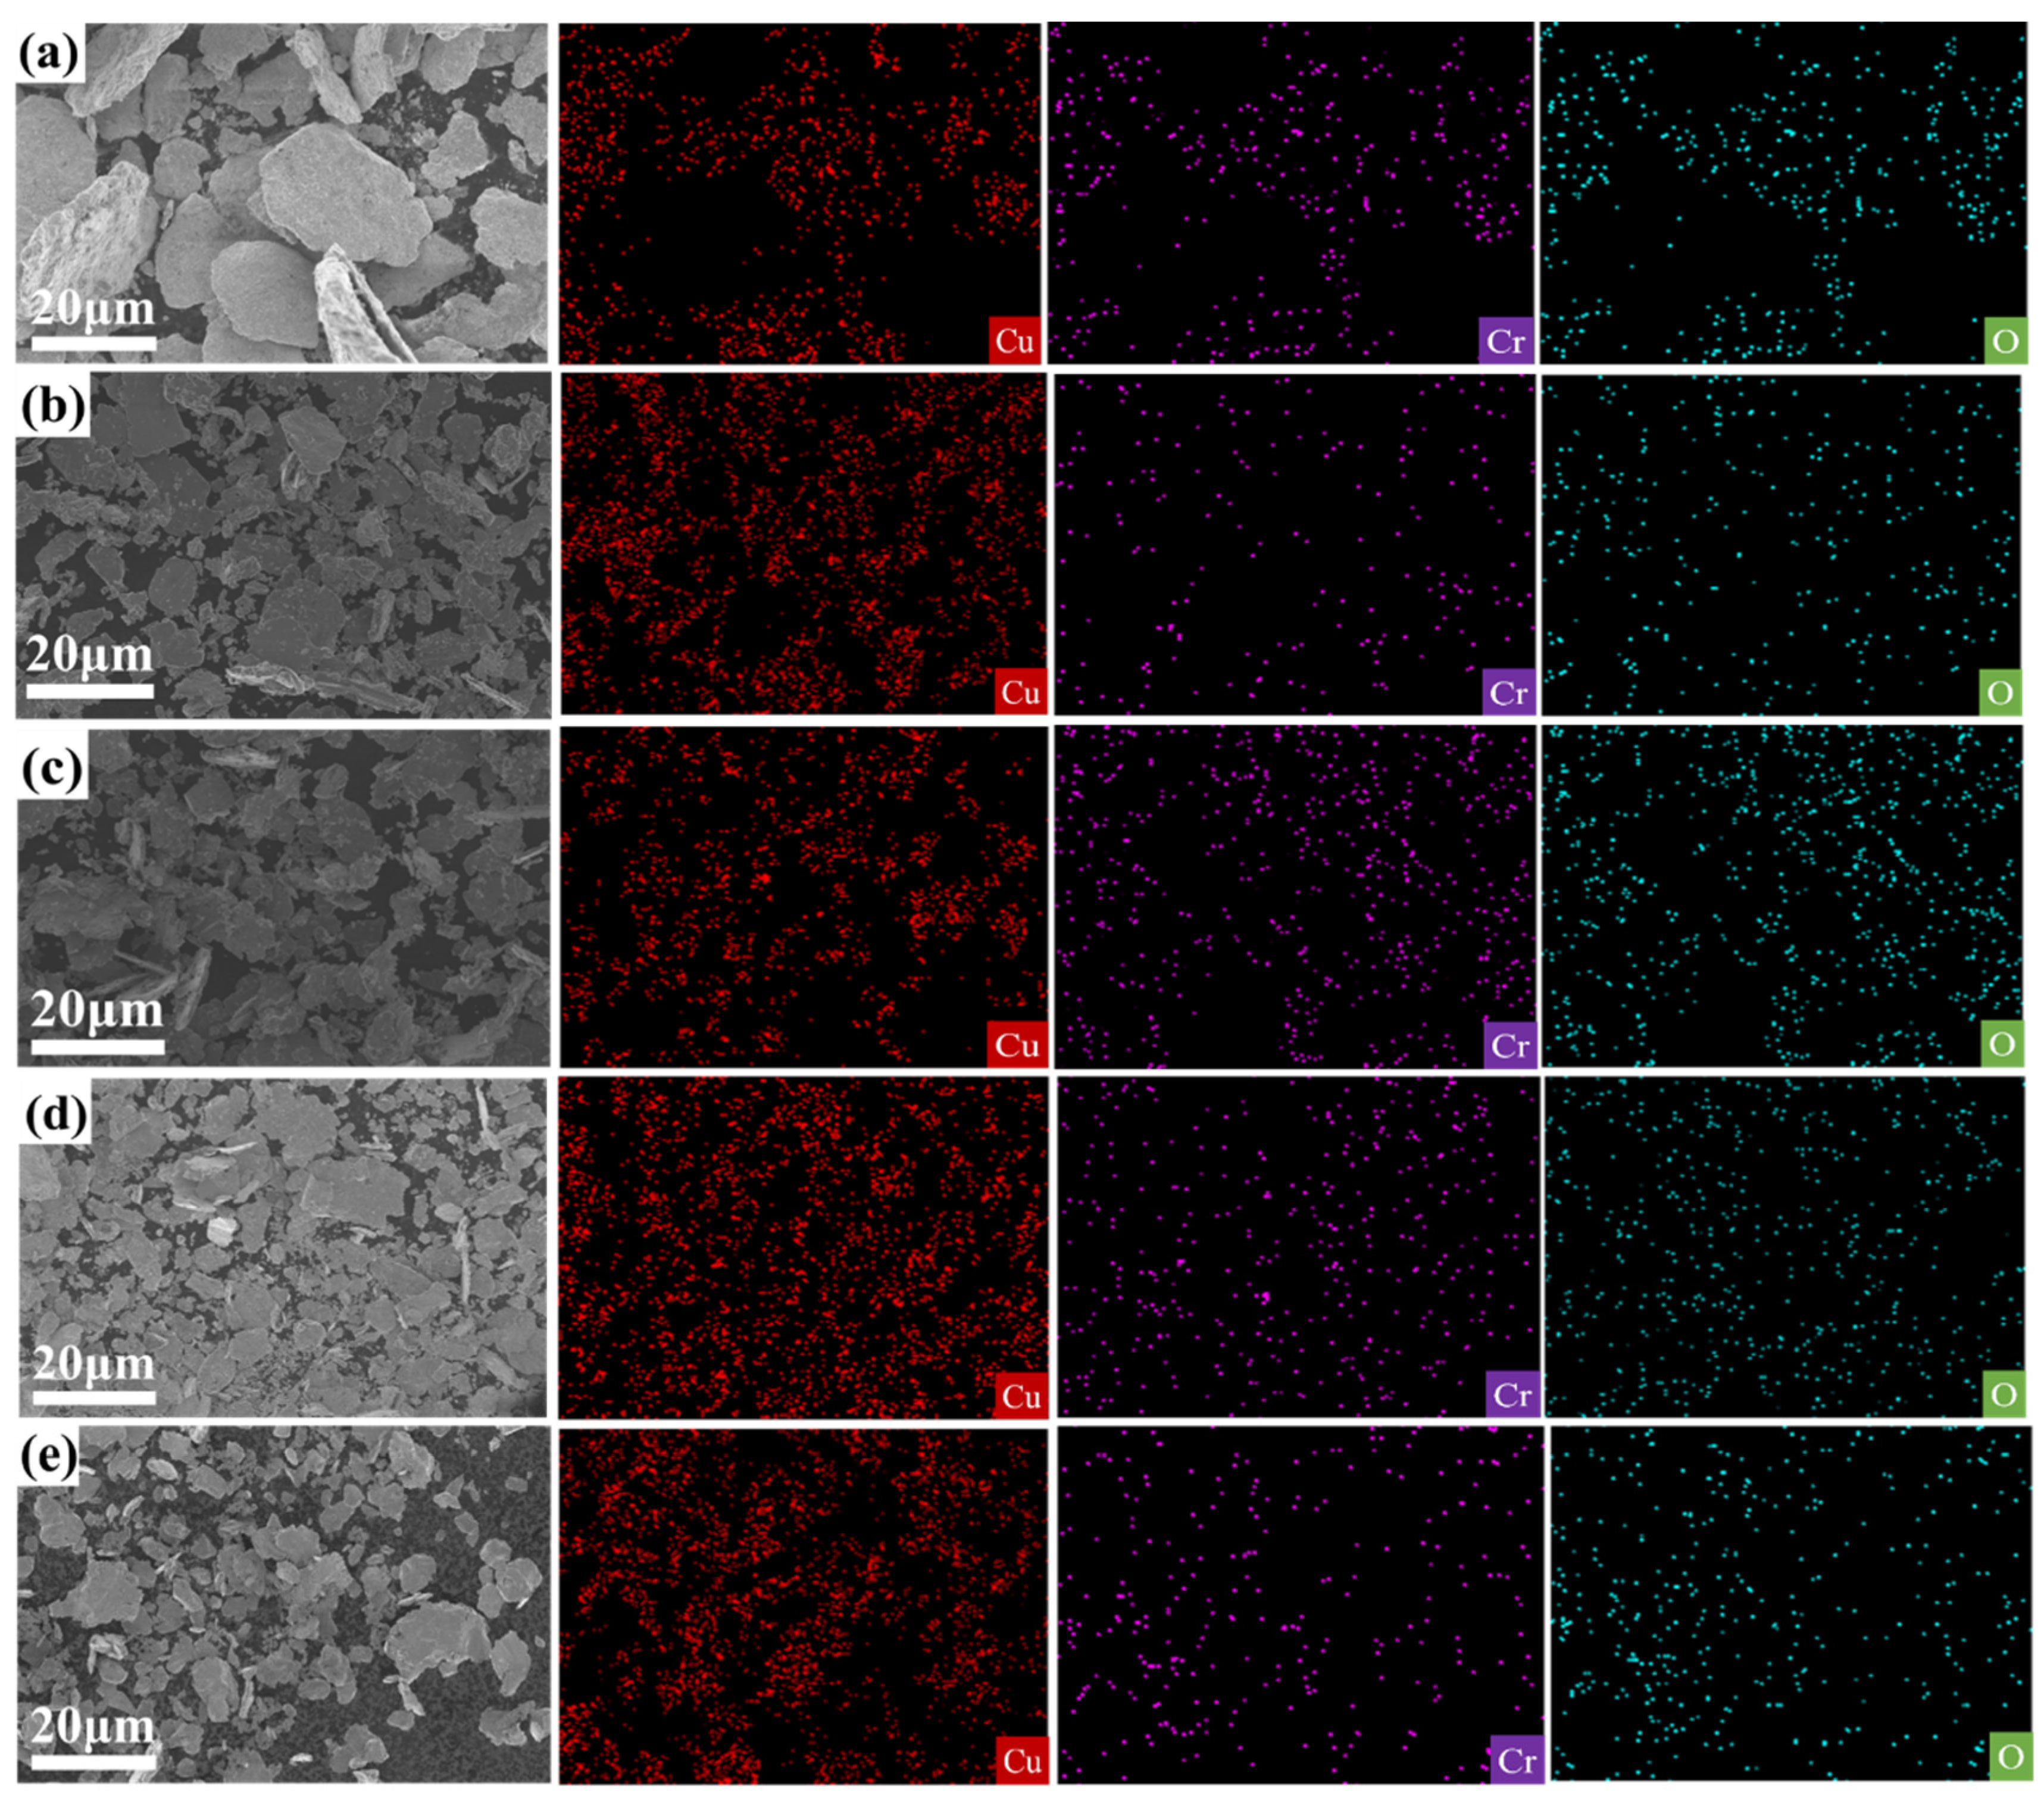
Figure 5 presents the SEM images of powders with varying Cr contents and the theoretical Cr
2O
3 content generated by internal oxidation of 5% Cr, compared to powders with externally added Cr
2O
3 (
Figure 5e). As the Cr content increases, the powder particles become finer, and the particle size distribution becomes more uniform. However, the dispersion of the externally added Cr
2O
3 powder is suboptimal due to poor wettability between Cr
2O
3 and the Cu matrix, which hinders effective bonding with Cu particles. Notably, the sample with 5 wt% Cr content (
Figure 5c) exhibits significantly smaller particle sizes compared to other samples, indicating superior dispersion. Further analysis reveals that when the Cr content deviates from 5 wt% (such as 1 wt%, 3 wt%, and 7 wt%), the particle size increases (
Figure 2d), suggesting that the external addition of Cr
2O
3 promotes particle agglomeration, reduces dispersion, and adversely affects the dispersion of Cu particles.
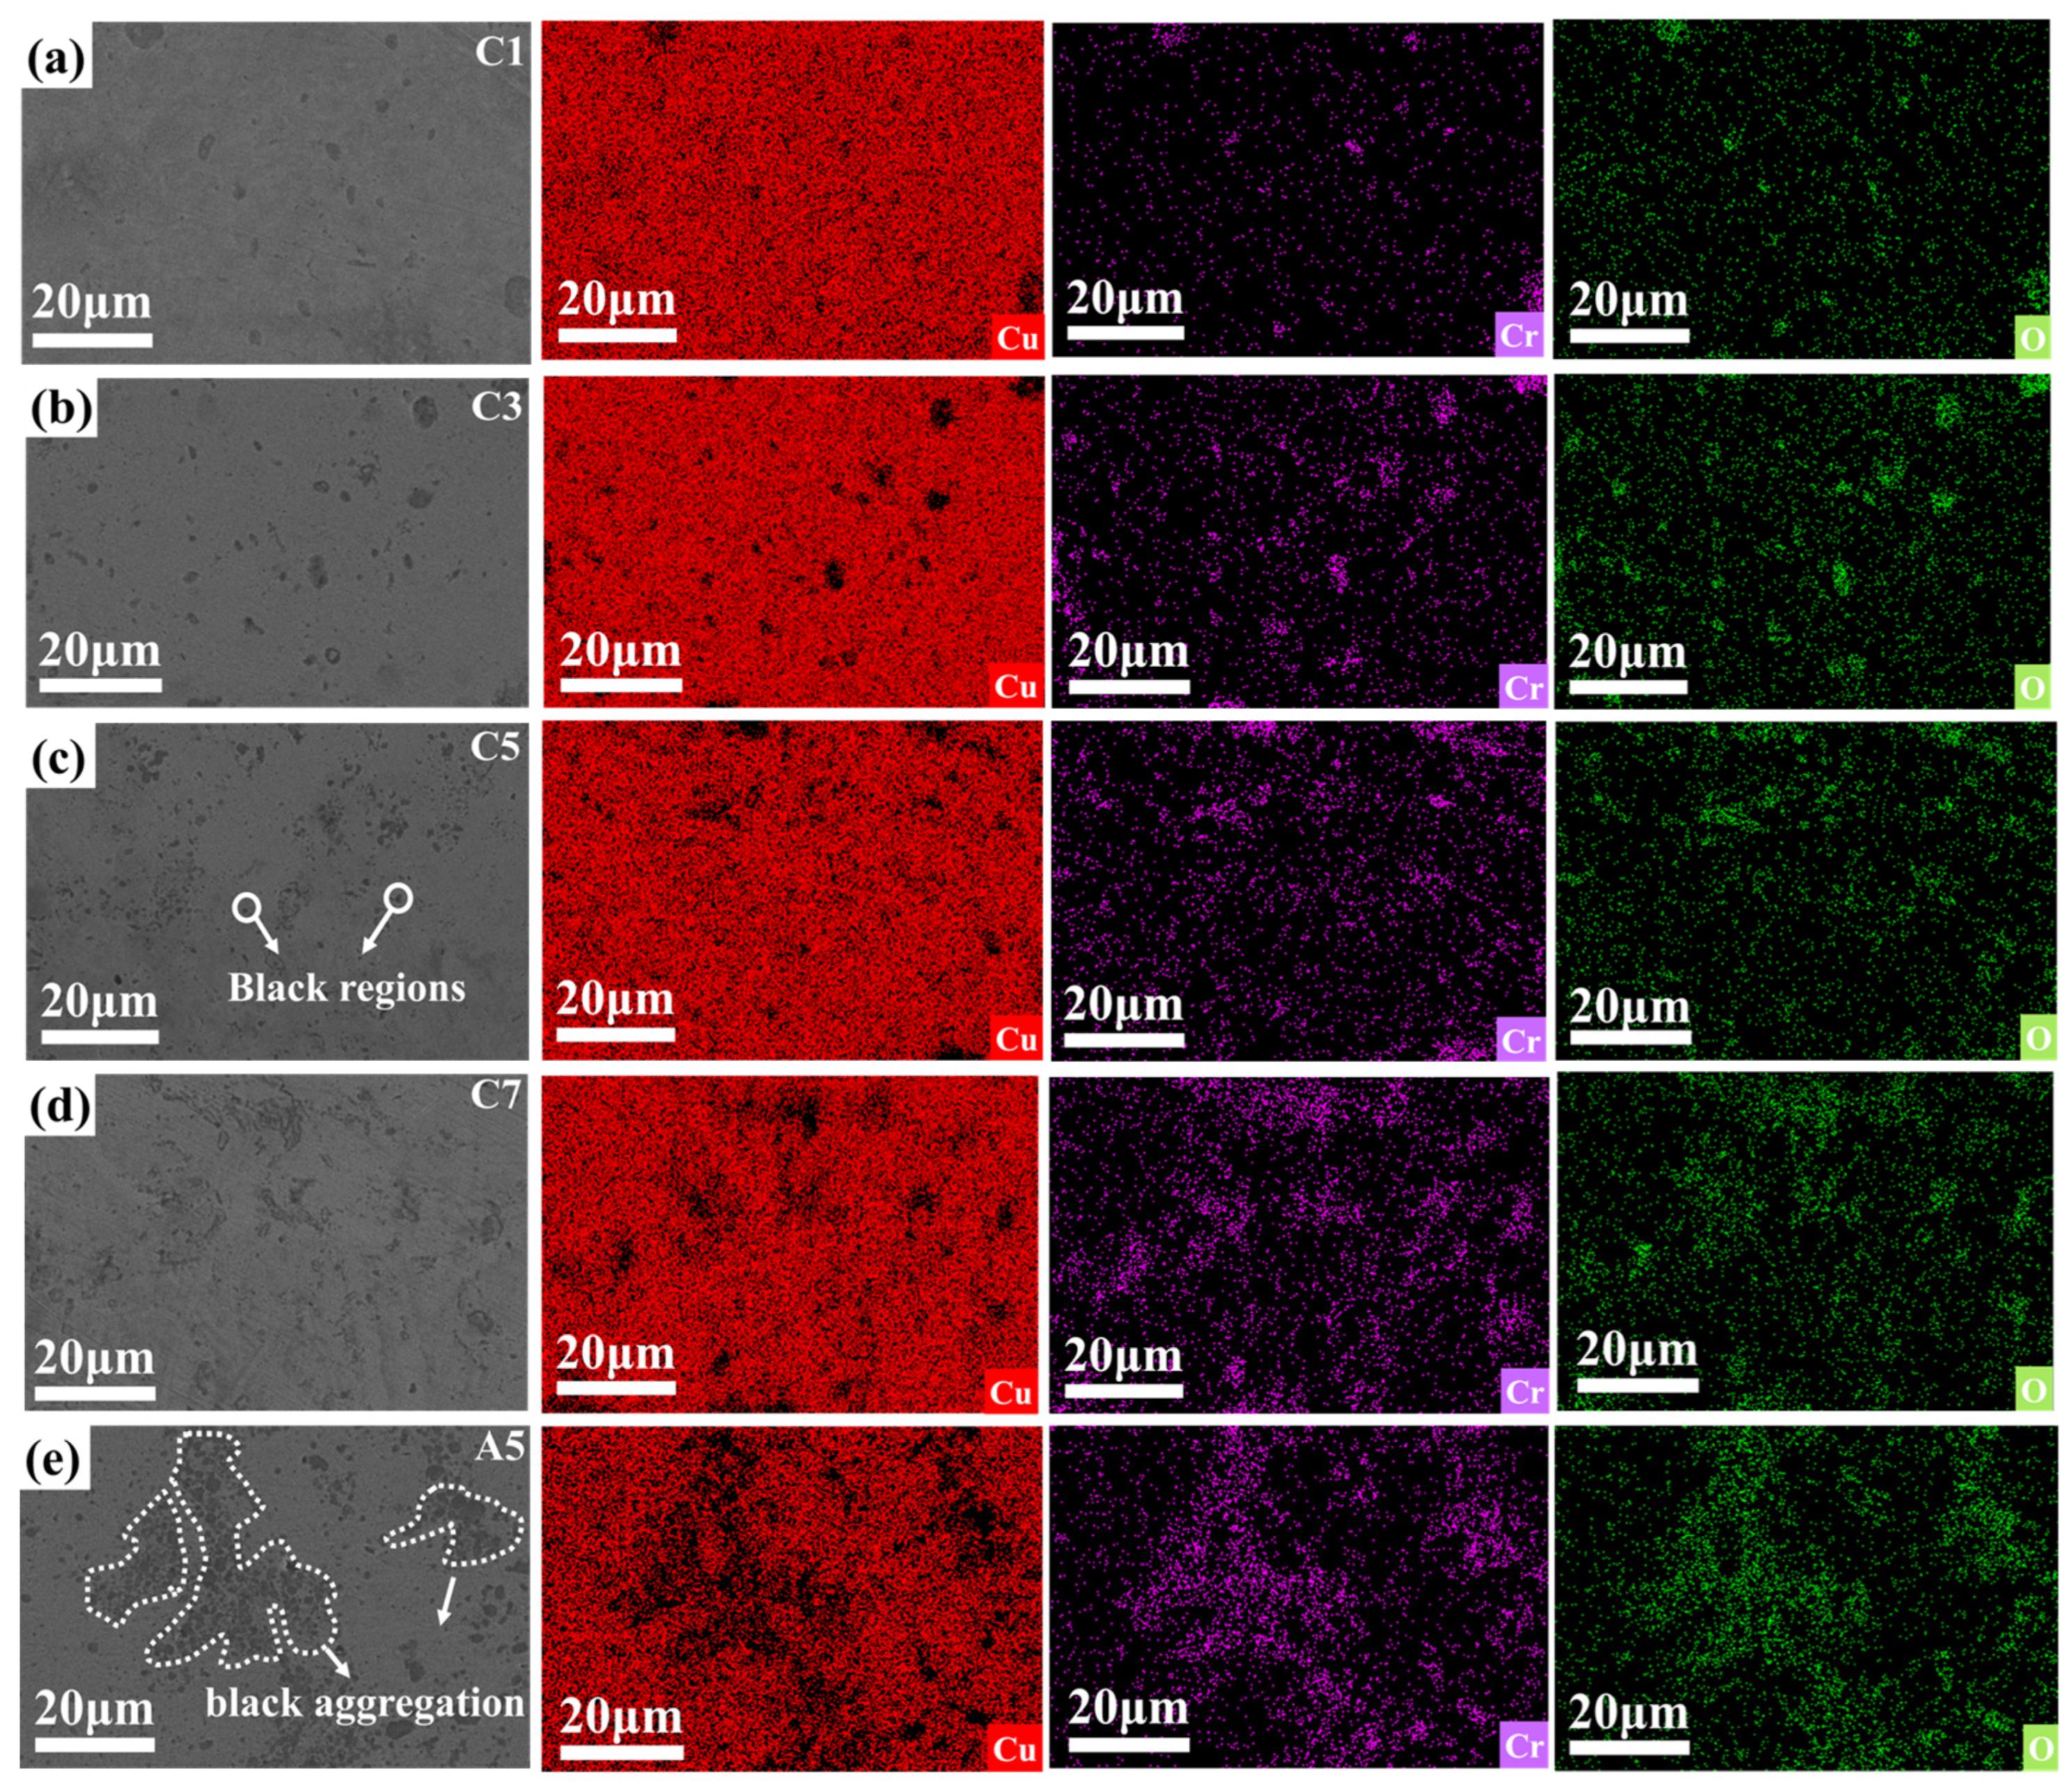
Figure 5a–d presents the SEM images and EDS mappings of Cu
2O/Cu-Cr composites with varying Cr contents. It can be discerned from
Figure 5a–d that the Cr and O elements are homogeneously distributed within the copper matrix, signifying that the Cr
2O
3 particles produced via internal oxidation are uniformly dispersed in the Cu
2O/Cu-Cr composites (as depicted in
Figure 5a–d). As the Cr content escalates from 1 wt% to 7 wt%, the black regions gradually augment and exhibit a denser distribution, indicating that the increase in Cr content exerts an influence on the microstructure of the samples [
38]. Specifically, in the SEM images of the C5 (Cu
2O/Cu-5wt% Cr) and C7 (Cu
2O/Cu-7wt% Cr) composites (as illustrated in
Figure 5c,d), distinct black areas emerge, whereas the Cu
2O/Cu-Cr composites with a Cr content lower than 5 wt% (as shown in
Figure 5a,b) do not display evident black areas. To further investigate the composition of the black areas, in conjunction with the elemental analysis outcomes of the black areas in the Cu
2O/Cu-Cr composites, it is discovered that these black areas are primarily composed of aggregated chromium oxide particles. In the C5 and C7 composites, the chromium oxide particles are uniformly distributed. The variation in Cr content gives rise to significant disparities in the microstructure of the Cu
2O/Cu-Cr composites, and this microstructural alteration might impact the overall properties of the composites. Particularly in the presence of externally added Cr
2O
3, the black areas within the copper matrix significantly enlarge and present obvious particle aggregation, which might be associated with material-phase transformation, uneven element distribution, or precipitated particles.
Compared with C5 and A5, in
Figure 5c, Cr is relatively dispersed. In
Figure 5e, the distribution of Cr is more extensive and dense, indicating the aggregation of chromium oxide particles. The black spots observed by scanning electron microscopy (SEM) are chromium-containing oxide microparticles with a diameter of approximately 1 μm. To further explore the distribution of oxide particles within the composite material, an in-depth study of the microstructure of the Cu-Cr
2O
3 composite material was conducted using transmission electron microscopy (TEM). The elemental composition of the composite material was qualitatively analyzed by an energy-dispersive X-ray spectrometer (EDS, Bruker) equipped on the TEM, as shown in
Figure 6.
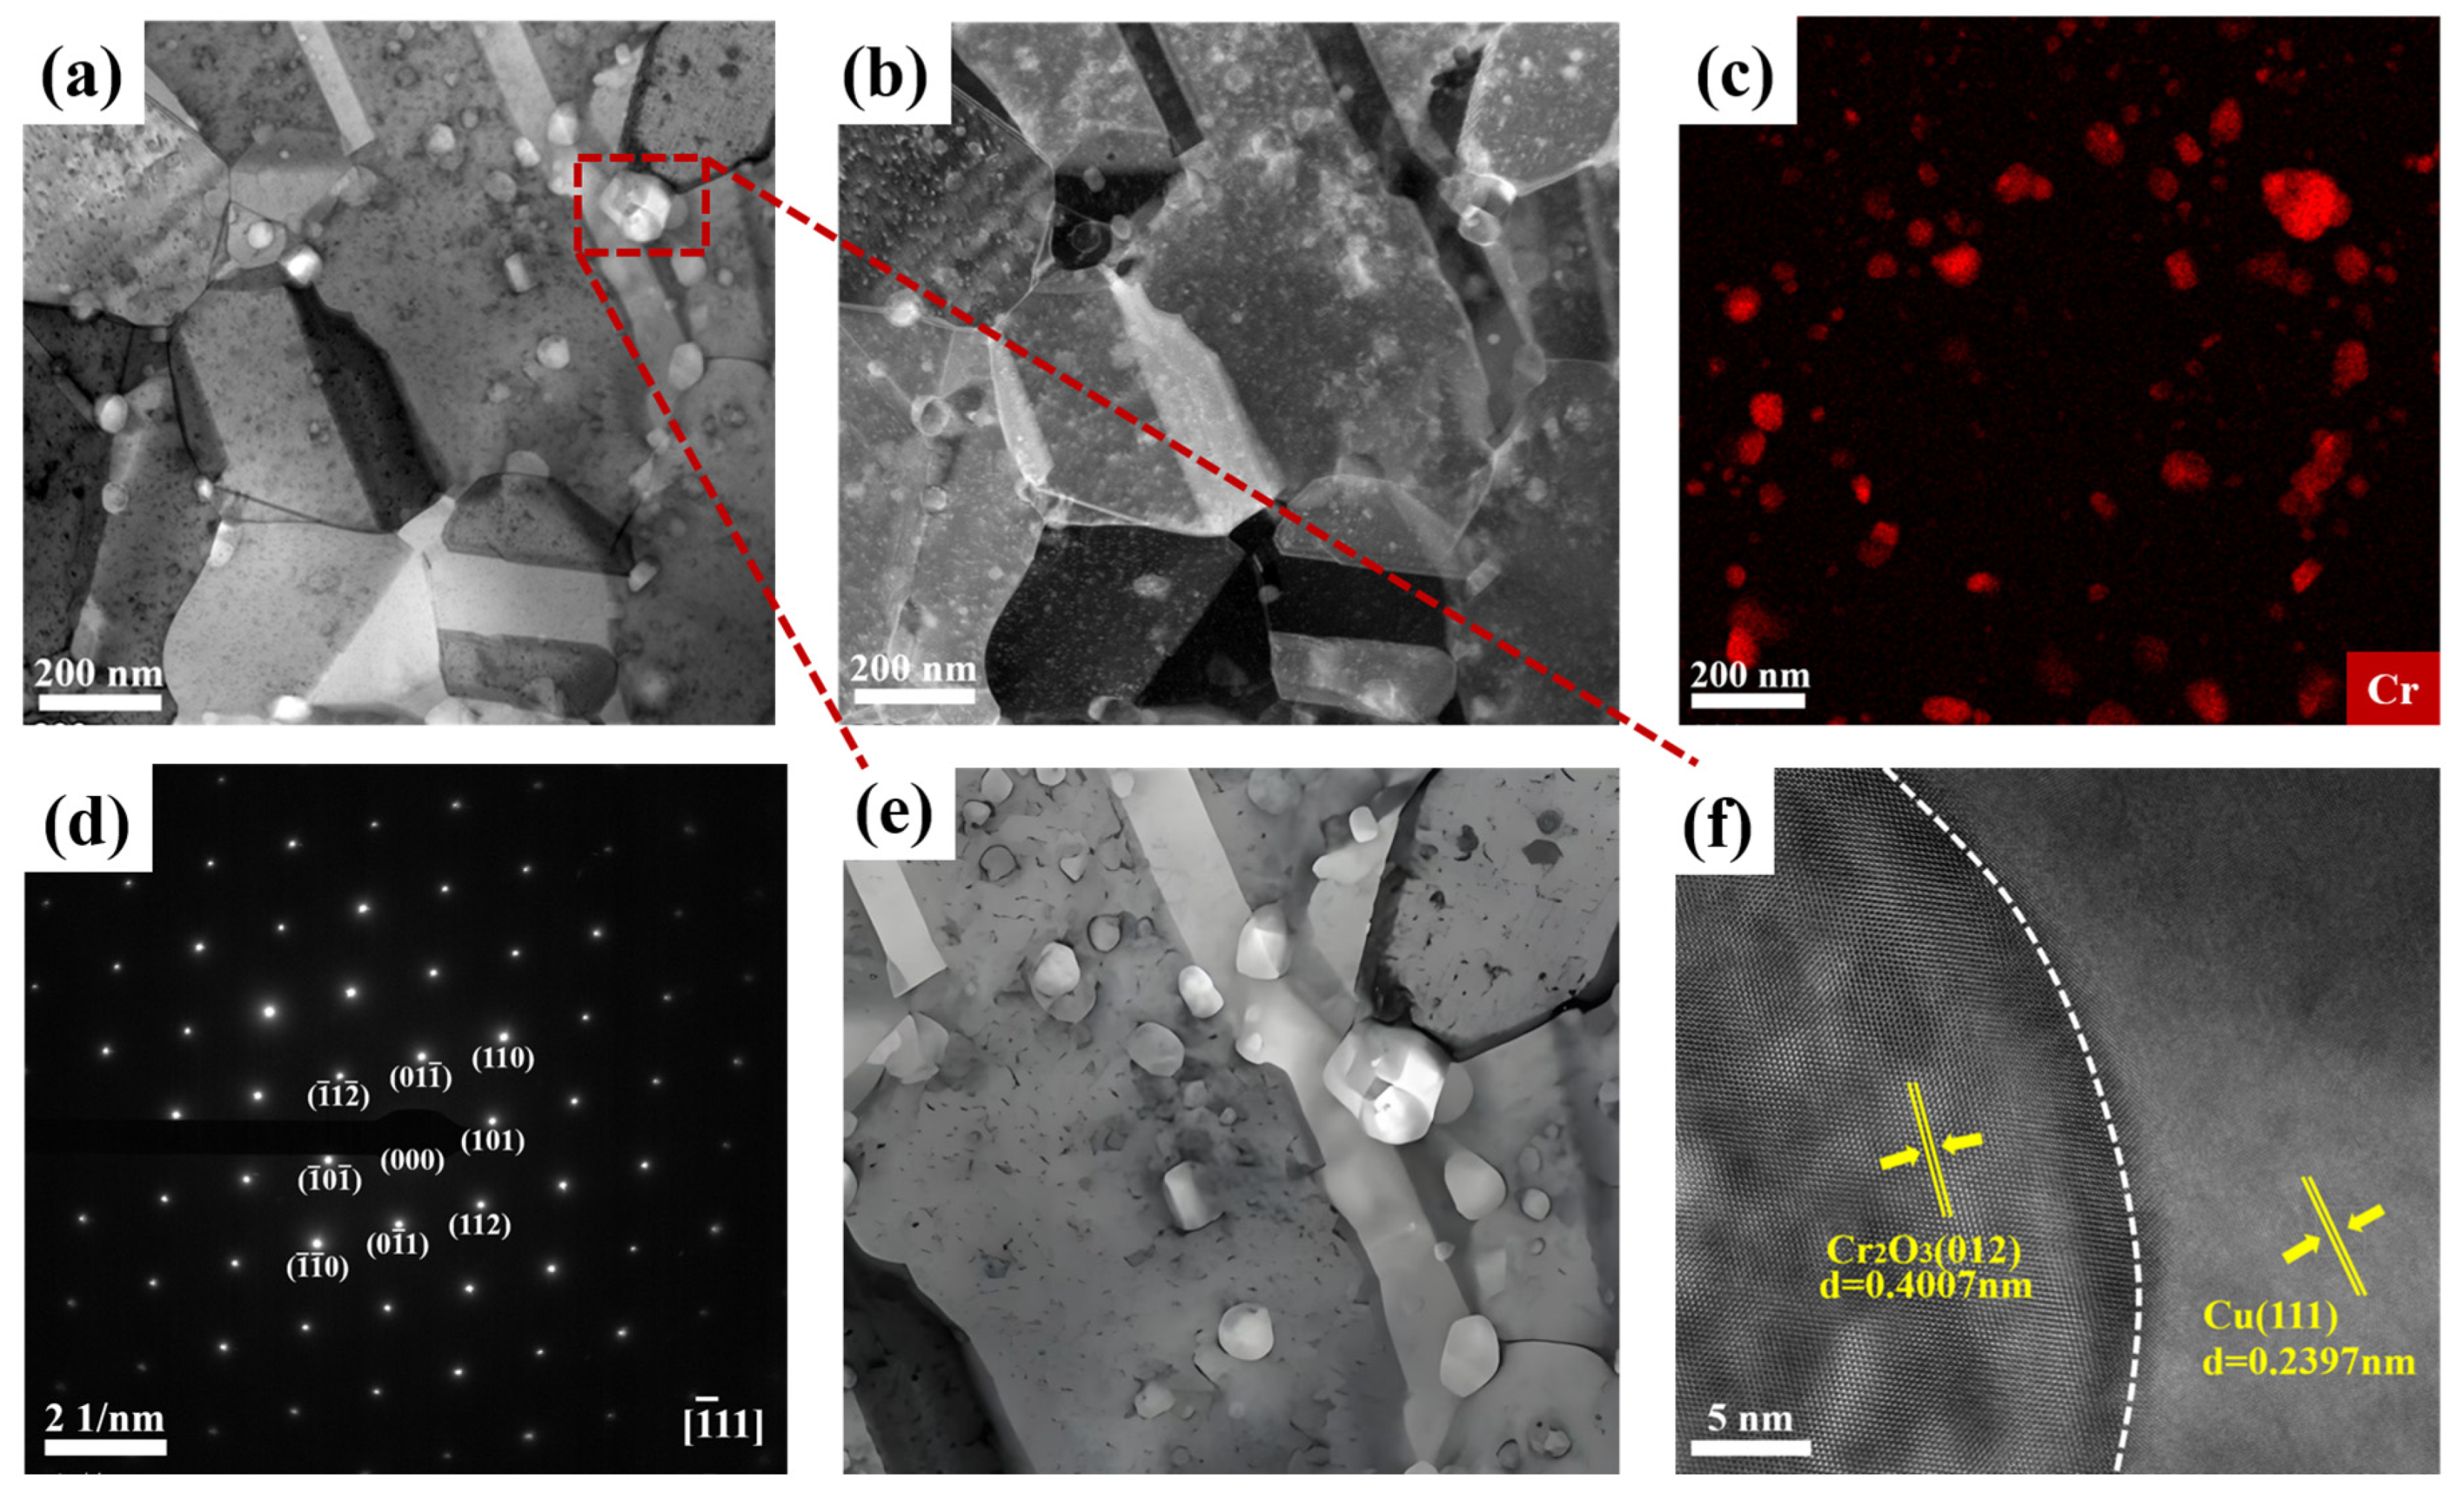
Figure 6a,b presents the bright-field and dark-field transmission electron microscopy (TEM) images of the sintered Cr
2O
3/Cu samples, along with elemental analysis.
Figure 6a shows the uniform dispersion of Cr
2O
3 particles in the Cu matrix, with uniformly refined particle sizes and clear grain boundaries, indicating a regular distribution of grains and grain boundaries.
Figure 6c demonstrates the uniform distribution of Cr elements in the Cu matrix, indicating that the distribution of Cr in the sample is relatively uniform, confirming the successful dispersion of Cr
2O
3 particles during the preparation process. Additionally, through the magnification of the selected area electron diffraction (SAED) in the region of
Figure 6a,d,e were obtained.
Figure 6d displays the SAED pattern from the boxed region in (a); further confirming the existence of the Cr
2O
3 crystal structure. The clear diffraction spots indicate that the material has a good crystal structure without obvious crystal defects or amorphization.
Figure 6e is a TEM image of the sample at a higher magnification, showing the macroscopic morphology of the large particles. From the figure, it can be seen that the Cr
2O
3 particles are nearly spherical, with a smooth surface and a hexagonal close-packed (HCP) crystal structure [
39]. The average size of the Cr
2O
3 particles in
Figure 6a,b is approximately 50 nm. HRTEM observations were carried out on the interface bonding area in
Figure 6e, uncovering a tight interface bonding between the Cr
2O
3 particles and the Cu matrix, indicating a robust interfacial bonding force between the two phases.
Figure 6f is a high-resolution TEM (HRTEM) image, depicting the microstructure of the crystal. From the figure, distinct lattice fringes can be clearly observed, with the marked lattice spacings of 0.4007 nm and 0.239 nm corresponding, respectively, to the interplanar spacings of Cr
2O
3 and Cu. This indicates that the Cr
2O
3 particles have been successfully embedded in the Cu matrix with satisfactory interface bonding. The clarity of the lattice fringes implies a high crystal quality of the material, without significant crystal defects.
The interplanar spacing of the Cu matrix is 0.239 nm, corresponding to the Cu (111) plane, while that of the Cr
2O
3 nanoparticles amounts to 0.4007 nm, corresponding to the Cr
2O
3 (012) plane. The mismatch parameter δ can be computed by the following formula: δ = (aα − aβ)/aα, where aα and aβ represent the lattice constants of the two phases, respectively. The calculated δ value is −0.677, suggesting a tensile mismatch between Cu (111) and Cr
2O
3 (012) particles. The greater the δ mismatch parameter is, the more severe the mismatch at the interface between the two phases becomes, the higher the interfacial energy is, and the stronger the inhibition of dislocation movement at this interface is. Considering the considerable mismatch at this interface, it implies that this interface can effectively impede dislocation slip. With the increase in the second-phase Cr
2O
3, the Cr
2O
3 particles are capable of hindering dislocation slip, thereby enhancing the yield strength and tensile strength of the material [
33].
The clarity of the lattice fringes indicates a superior crystal quality of the material, with no significant crystal defects.
Figure 6 comprehensively presents the microstructural characteristics of the Cr
2O
3/Cu composite material, ranging from particle distribution to crystal structure. The TEM and SEM images distinctly reveal the uniformity of the material, crystal quality, and interface bonding quality. The EDS analysis and HRTEM further verify the uniform distribution and embedded state of the Cr
2O
3 particles in the matrix. These results provide robust experimental support for the optimization of the preparation process and performance research of the Cr
2O
3/Cu composite materials.
3.2. Mechanical and Electrical Properties of Cr2O3/Cu Composites
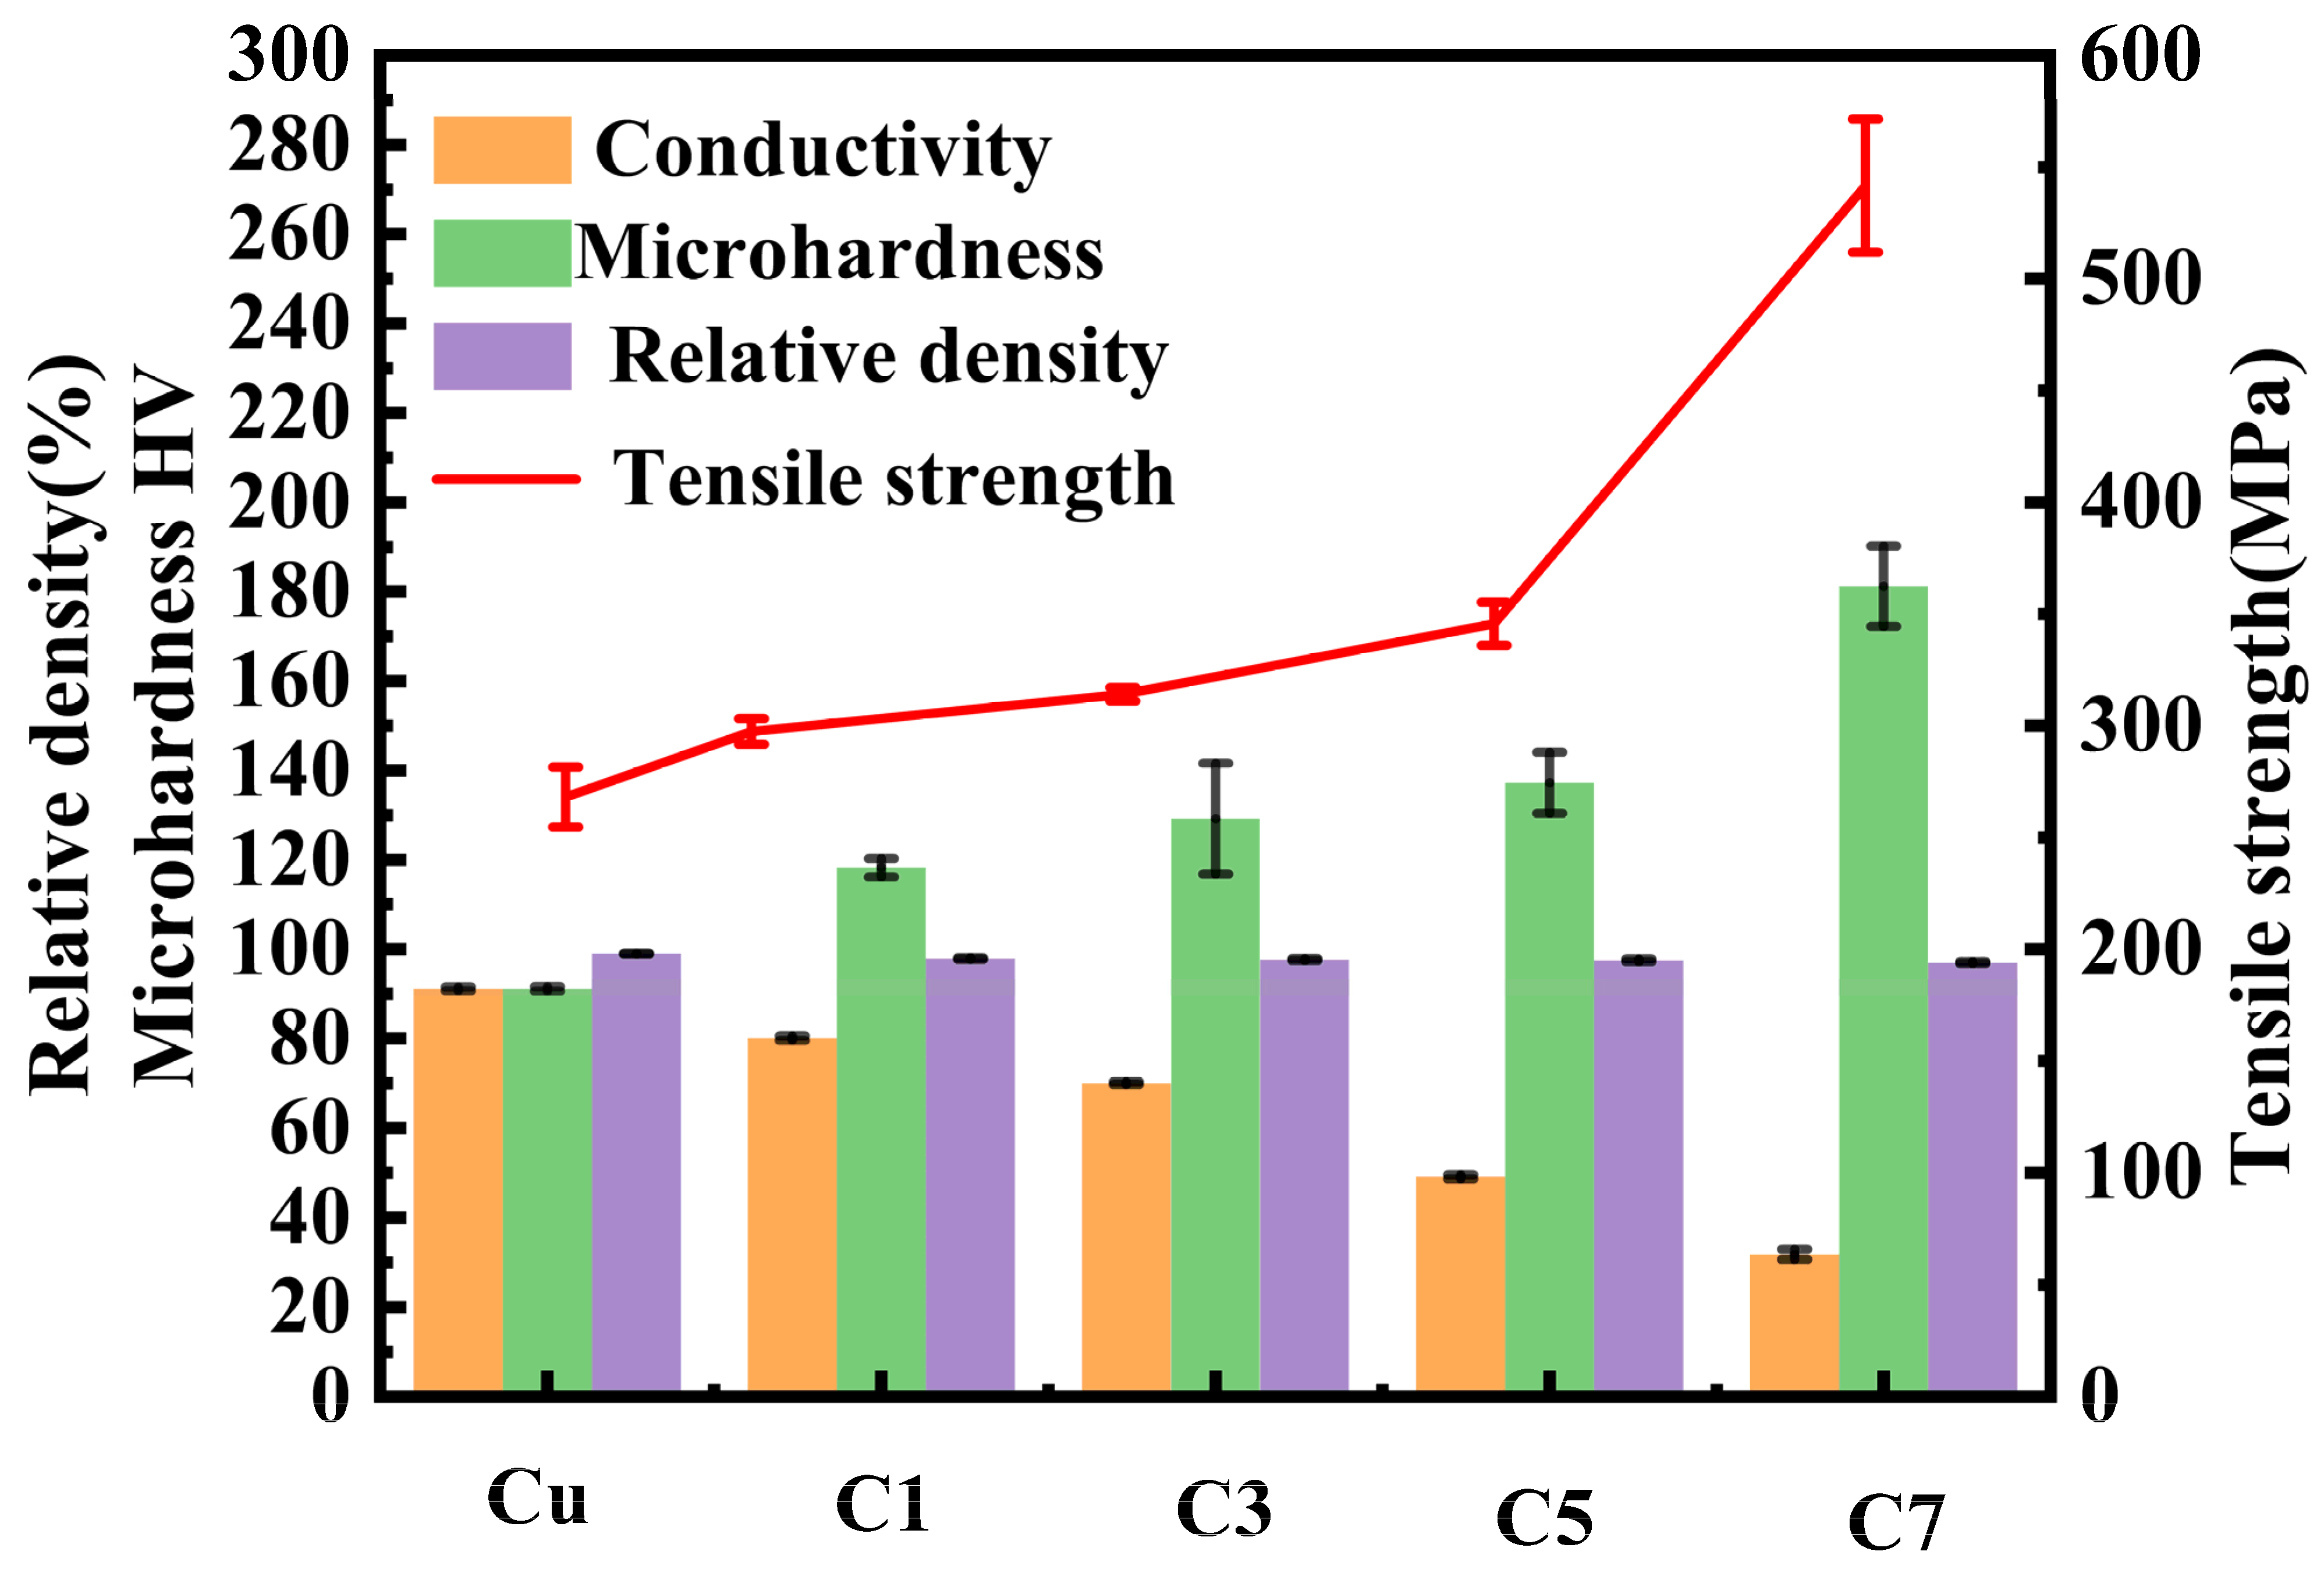
Figure 7 illustrates the hardness, electrical conductivity, and density of Cr
2O
3/Cu composites.
Table 2 provides detailed data on the density, electrical conductivity, and hardness of pure copper and sintered specimens C1, C3, C5, and C7 with varying Cr contents. As shown in the data, all samples exhibit densities exceeding 97% after sintering, indicating successful densification through HP sintering. With increasing Cr content, the internal oxidation process generates more Cr
2O
3 particles, which significantly enhances dispersion strengthening. Consequently, the hardness and strength of the sintered samples are markedly improved compared to pure Cu, highlighting the dispersion strengthening effect of Cr
2O
3 particles. Specifically, the hardness increases from 91.15 N/mm
2 for C1 to 137.25 HV for C7, demonstrating that higher Cr content leads to a greater amount of reinforcing-phase formation. The Cr
2O
3 particles generated during internal oxidation gradually refine and disperse uniformly, effectively hindering dislocation movement and enhancing material hardness and strength [
33]. Although the mechanical properties improve, electrical conductivity decreases significantly from 91.1% IACS for C1 to 31.85% IACS for C7. This reduction in electrical conductivity can be attributed to the increased number of grain boundaries and the higher concentration of Cr
2O
3 particles generated by internal oxidation as Cr content rises. These factors enhance mechanical properties but impede electron mobility, thereby reducing electrical conductivity.
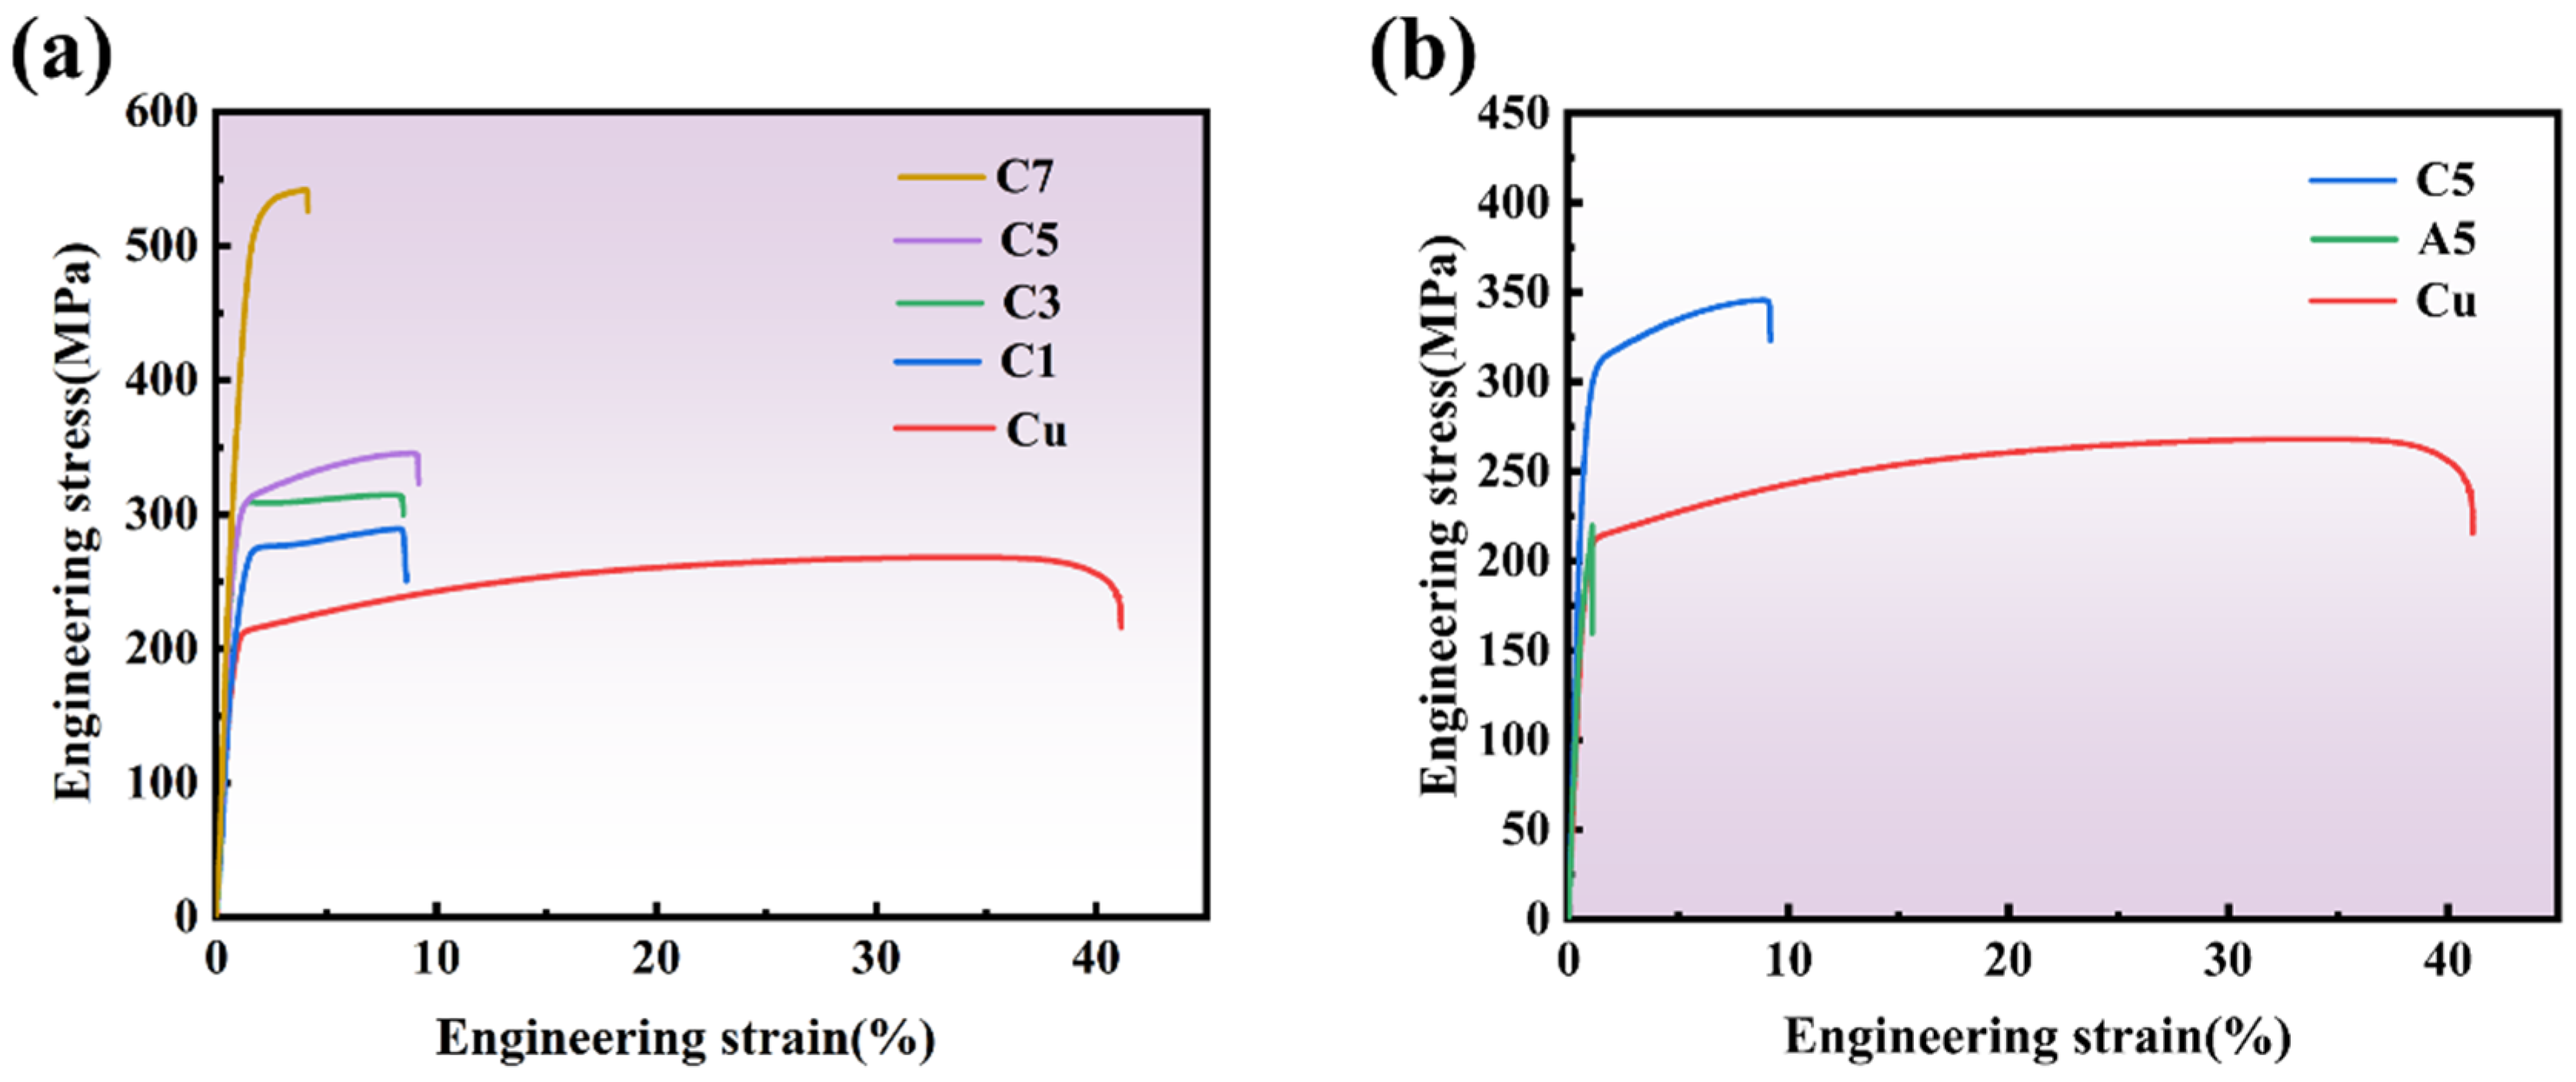
Figure 8a presents the tensile stress–strain curves of pure Cu at room temperature, the Cr
2O
3/Cu composites fabricated by the internal oxidation method, and the Cr
2O
3/Cu composites prepared by the external addition method as shown in
Figure 8b. The results demonstrate that the ultimate tensile strength of pure copper is 268 MPa, with an elongation of 42.4%. The tensile strength of the Cr
2O
3/Cu composites is conspicuously higher than that of pure Cu. With the increase in the formation of Cr
2O
3, the tensile strength of pure copper rises from 268 MPa to 355 MPa for C5, but the elongation declines. This strengthening effect is primarily ascribed to the precipitation behavior of Cr elements during the internal oxidation process. This is because of the incoordinate deformation between Cr
2O
3 particles and the copper matrix, resulting in an enhancement of the tensile strength of the composites while sacrificing the elongation [
40]. It can be known from
Figure 6 that the TEM observation clearly reveals that Cr elements form fine Cr
2O
3 particles in the Cu matrix. With the increase in the formation of Cr
2O
3 particles, the tensile strength of the material is significantly enhanced, mainly for the following two reasons: (1) The dispersed Cr
2O
3 particles pin the dislocations. According to the dislocation theory, Cr
2O
3 particles possess good hardness and high-temperature stability. During the deformation process, when dislocations encounter Cr
2O
3 particles, they will bend and be obstructed. As the external stress increases, dislocation loops will form around the Cr
2O
3 particles. Under the stress, the dislocation loops become new dislocation sources, generating more dislocations and increasing the dislocation density, thereby improving the strength and hardness of the material. Additionally, when dislocation lines bypass the dislocation loops, they need to overcome the resistance of the particles and the reverse stress of the dislocation loops, increasing the work performed by the external force and enhancing the resistance to dislocation movement, thereby strengthening the tensile strength of the composite material [
41]. (2) The Cr
2O
3 particles hinder grain-boundary migration, refine grains, and enhance the mechanical properties of the composite material. Specifically, they slow down the grain-boundary migration rate and increase the matrix strength. The finer and more uniformly dispersed the particles are, the greater the resistance to grain-boundary migration becomes. Nanoscale Cr
2O
3 particles are uniformly distributed within the copper matrix. During sintering, these hard Cr
2O
3 particles inhibit grain growth in the copper matrix, leading to finer grains. Although the tensile strength of the composite material has been improved, the influence of different preparation methods on its performance still requires further investigation.
Figure 8b shows the tensile stress–strain curves of pure Cu, A5, and C5 samples. Pure copper exhibits typical ductile metal characteristics, with a fracture strain exceeding 40%, demonstrating excellent plastic deformation capacity. In contrast, the A5 composite material, prepared by the external addition method, shows a significant increase in tensile strength to approximately 220 MPa, but the fracture strain drops below 10%, indicating a marked decrease in plasticity. This reduction in plasticity may be attributed to uneven particle distribution or poor interface bonding. The C5 composite material, fabricated by the internal oxidation method, achieves a higher tensile strength approaching 350 MPa, while maintaining better plasticity compared to A5 but lower than pure copper. This suggests that the internal oxidation method provides a superior balance between strength and plasticity. In the A5 composite material, the Cr
2O
3 particles prepared by the external addition method may exhibit agglomeration or insufficient bonding with the Cu matrix, resulting in limited strengthening effects and increased brittleness. These issues could be related to uneven particle distribution during ball milling or sintering. In contrast, the C5 material prepared by the internal oxidation method features smaller and more uniformly distributed Cr
2O
3 particles, which effectively impede dislocation movement and significantly enhance strength. Additionally, the tighter interface bonding between Cr
2O
3 particles and the Cu matrix improves the plasticity of the C5 material compared to A5. Overall,
Figure 8b clearly illustrates the balance between strength and plasticity. Pure copper demonstrates the best ductility but the lowest strength; the A5 material significantly increases tensile strength through the addition of Cr
2O
3 particles, but at the expense of plasticity; the C5 material achieves an optimal balance between strength and plasticity due to more uniform particle distribution, smaller particle size, and tighter interface bonding. A comparative analysis of
Figure 8a,b reveals that the C5 material prepared by the internal oxidation method achieves a better balance between strength and plasticity, showcasing outstanding performance as a high-strength structural material. Compared to the external addition method, the Cr
2O
3 particles prepared by the internal oxidation method have a more uniform distribution, smaller particle size, and tighter interface bonding, which not only significantly enhances material strength but also retains ductility to some extent. Therefore, the internal oxidation method demonstrates superior comprehensive performance.
Figure 8b further confirms that the strength of the C5 material is higher than that of A5, and its plasticity performance is better than that of A5. Although the A5 material prepared by the external addition method has elevated strength, its plasticity has decreased significantly due to uneven particle distribution and interface bonding issues.
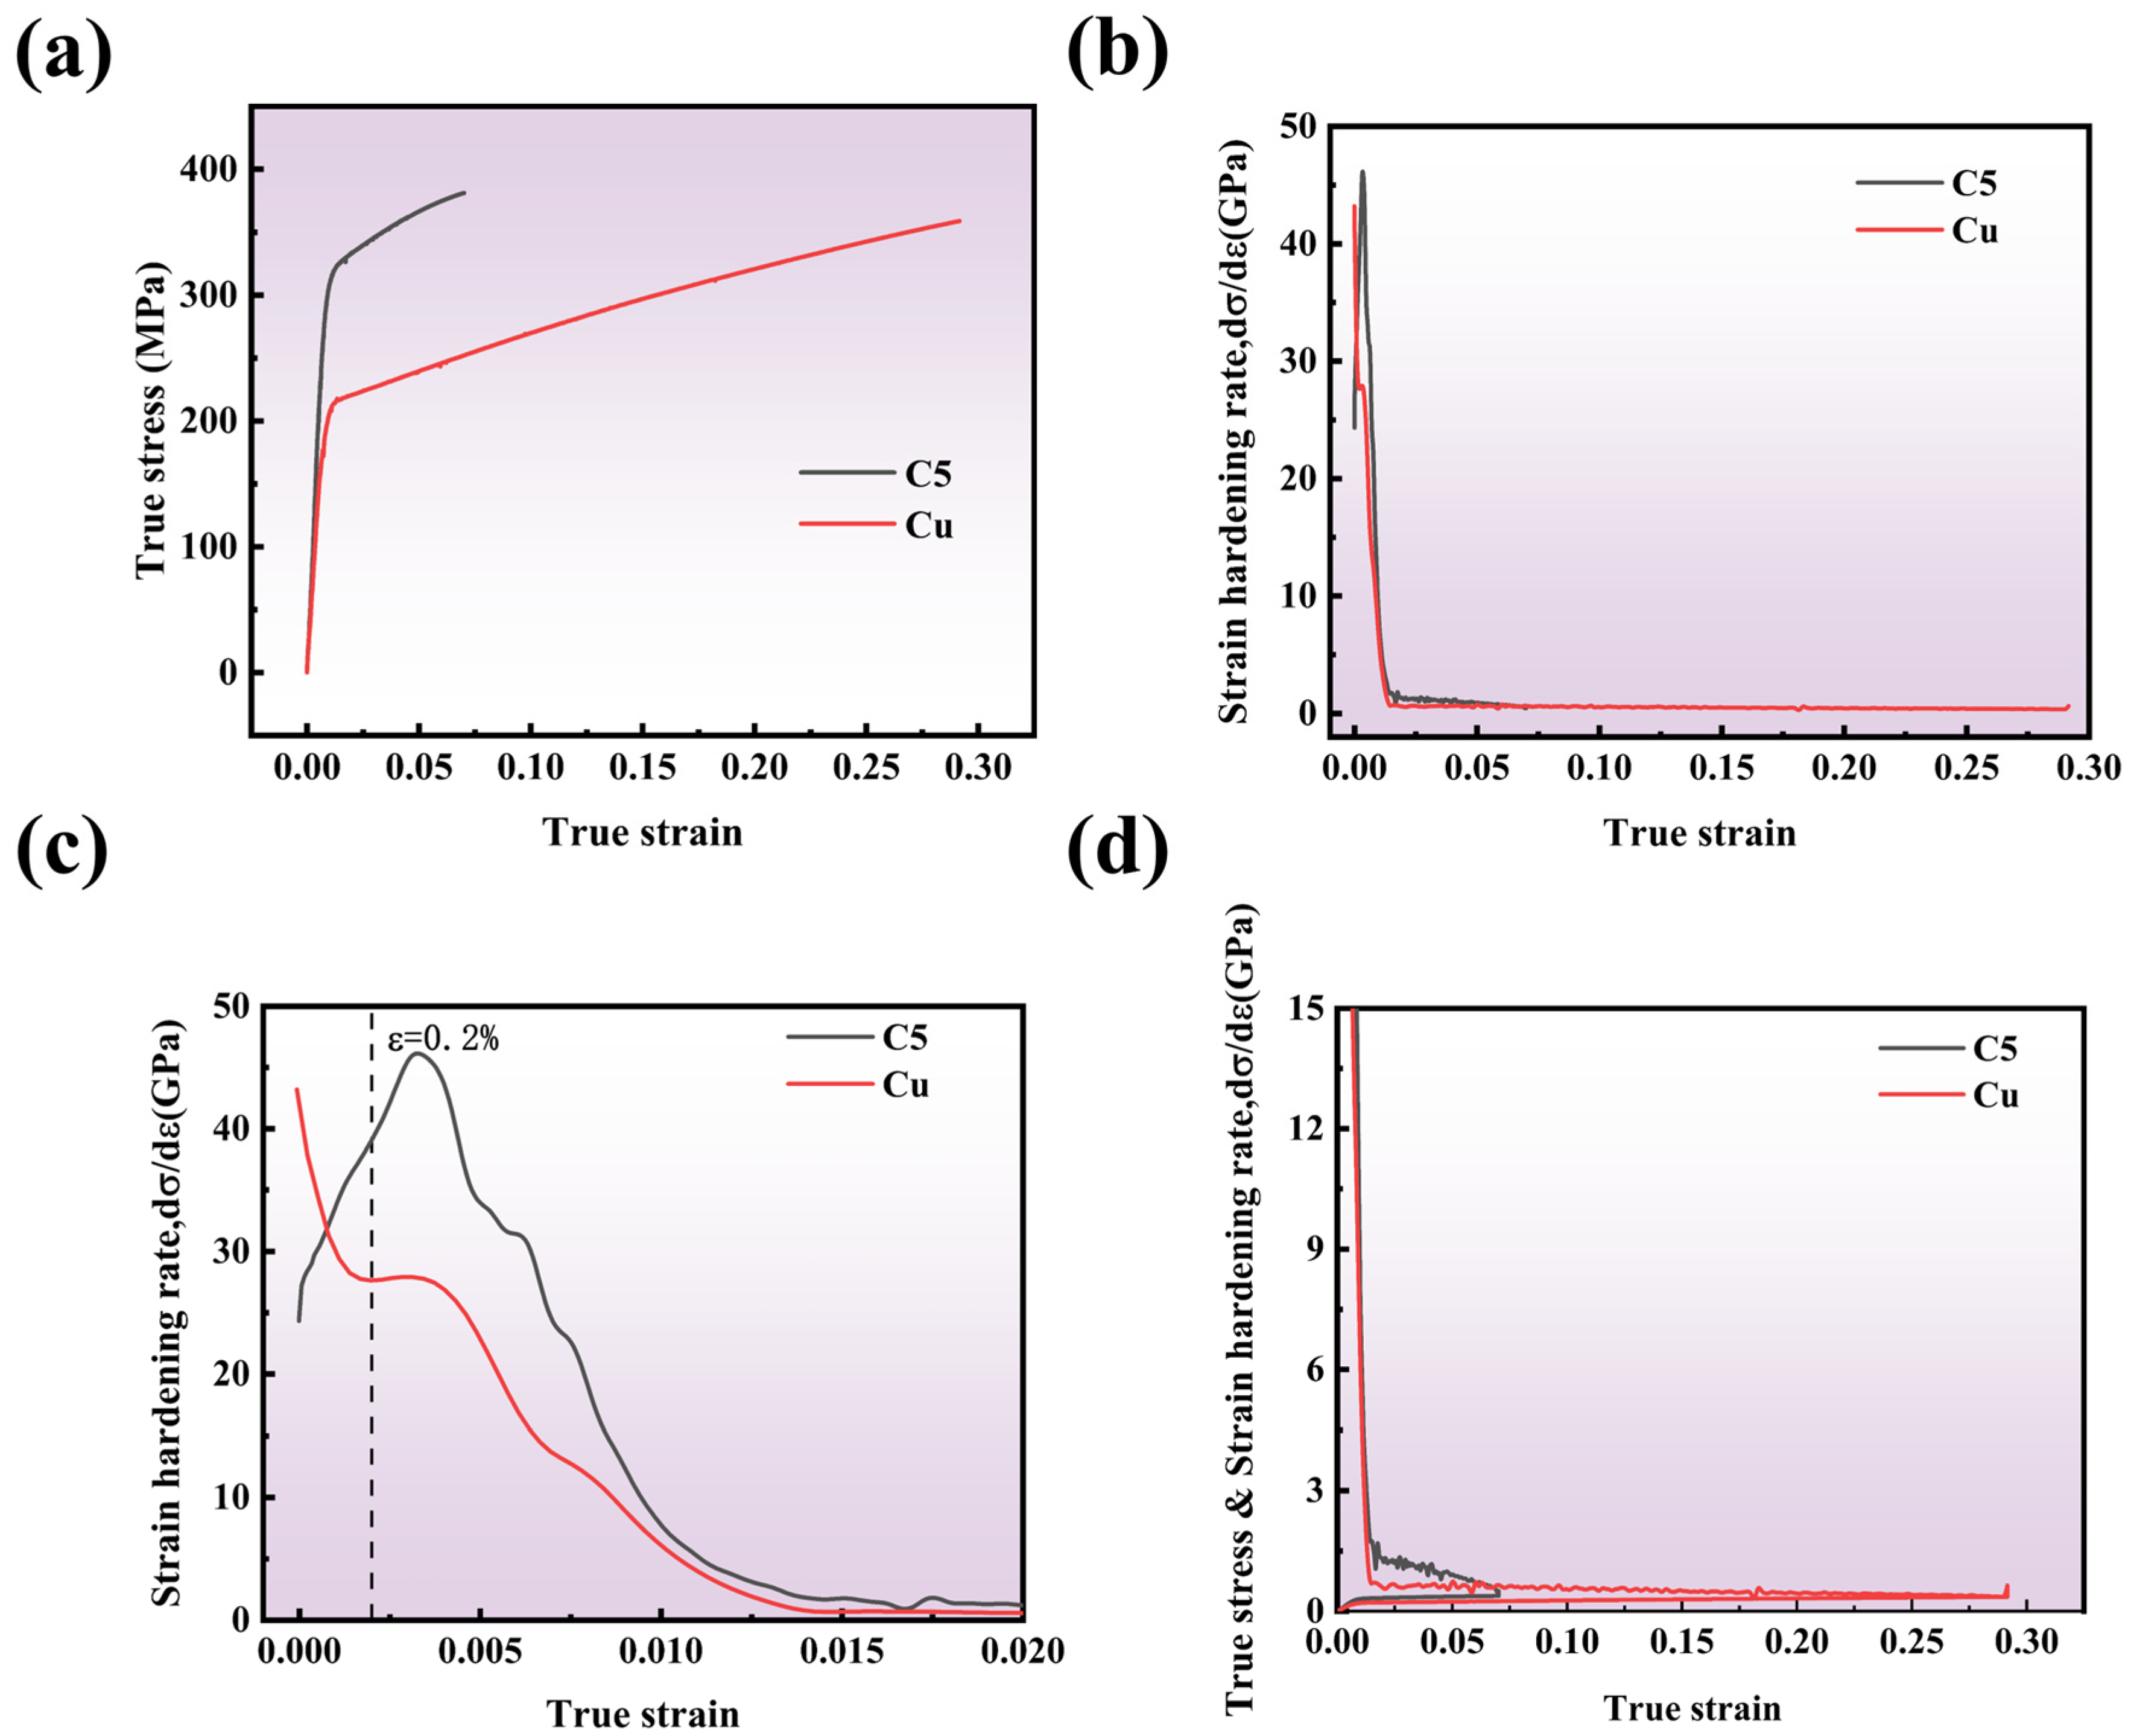
The strain hardening rate of a material is defined as the derivative of true stress with respect to true strain. This parameter provides insight into the material’s ability to resist external loads during plastic deformation. When the strain hardening rate equals the true stress, the elongation is referred to as the uniform elongation. As shown in
Figure 9a, the addition of Cr to Cu results in a significant increase in yield strength, while the elongation decreases.
Figure 9b illustrates the strain hardening rate curves for both materials. To further analyze the variations in strain-hardening behavior,
Figure 9b is divided at a true strain of 0.02, as depicted in
Figure 9c,d.
Figure 9c presents the initial deformation behavior of Cu and C5. It can be observed that after yielding, the strain-hardening rate of C5 initially increases before rapidly decreasing. In contrast, the strain-hardening rate of Cu remains relatively stable after yielding, followed by a gradual decline. The post-yield increase in the strain hardening rate of C5 contributes significantly to its enhanced yield strength. Additionally, the strain-hardening rate of C5 consistently exceeds that of Cu, indicating superior strain-hardening capability. This phenomenon can be attributed to Cr precipitates at the grain boundaries of Cu, which pin dislocations and hinder their movement. Consequently, the presence of Cr restricts plastic deformation in Cu, leading to precipitation strengthening and an increase in the overall strength and work-hardening capacity of C5.
As shown in
Figure 9d, despite the higher initial work-hardening rate of C5, it exhibits a rapid decline in this rate during later stages of deformation, resulting in necking and reduced elongation. In contrast, Cu, unaffected by dispersed Cr, demonstrates a lower but more consistent work-hardening rate, which gradually decreases over time, thereby maintaining higher elongation.
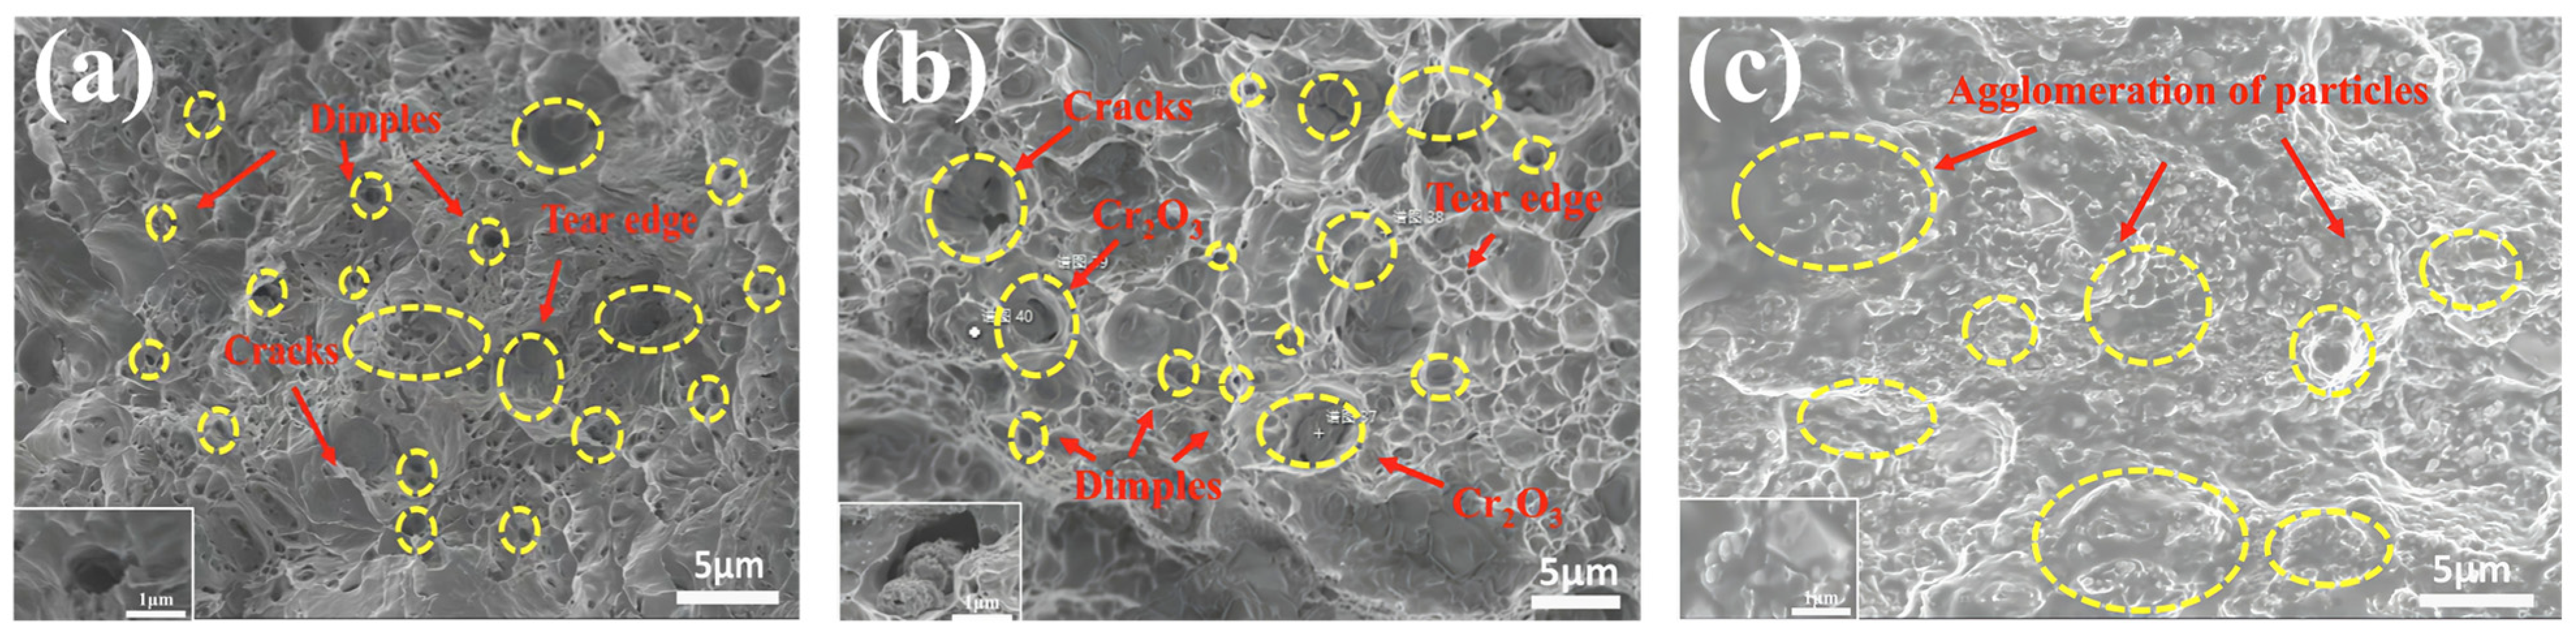
Figure 10 presents a comparative analysis of the tensile fracture morphologies of pure Cu and two Cr
2O
3/Cu composites, C5 and A5, prepared using different fabrication processes. The examination of fracture features provides insights into the influence mechanisms of various preparation methods on the mechanical properties of the materials. In
Figure 10a, the fracture surface of pure copper exhibits characteristic ductile fracture morphology, characterized by a large number of deep and uniformly distributed dimples. This microstructure indicates that pure copper undergoes substantial plastic deformation before fracture, leading to the formation of typical microvoid coalescence features [
42].
Figure 10b reveals that the fracture surface exhibits obvious dimples and partial cracks, indicating a certain degree of ductility. The presence of Cr
2O
3 particles in the fracture zone suggests their involvement in crack initiation and propagation. The interfaces between the particles and the matrix may serve as crack initiation sites. Compared to pure copper, the C5 composite material fabricated via internal oxidation demonstrates an optimized balance between strength and plasticity. While the size of the dimples has decreased, evidence of plastic deformation is still observable. This indicates that the internal oxidation method enhances material strength while partially retaining its plasticity.
Figure 10c shows that the fracture surface of the A5 composite material prepared by the external addition method is predominantly characterized by particle agglomeration and crack concentration regions, indicative of typical brittle fracture behavior. SEM observations reveal significant agglomeration of Cr
2O
3 particles. The agglomerated distribution of particles leads to stress concentration, accelerating crack initiation and propagation, ultimately resulting in material fracture. The reduction in dimple features suggests a weakened plastic deformation capability. Combined with the EDS analysis in
Figure 5b, it is evident that there is pronounced elemental segregation in the particle agglomeration areas, confirming that the external addition method results in uneven particle distribution and poor interfacial bonding [
43]. In contrast, the C5 material, fabricated via the internal oxidation method, exhibits a more uniform distribution of Cr
2O
3 particles. The fracture surface reveals an optimized balance between strength and plasticity. Conversely, the A5 material, prepared using the external addition method, shows a significant reduction in ductility due to pronounced particle agglomeration and poor interfacial bonding [
41]. Through comparison, it is discovered that the primary advantage of the internal oxidation method resides in achieving the nanoscale dispersion of Cr
2O
3 particles and favorable interface bonding. This microstructure characteristic not only enables the reinforcing phase to effectively bear stress, effectively enhancing the strength of the matrix, but also retains a certain degree of plasticity. Nevertheless, as the external addition method relies on mechanical mixing, which has limitations and cannot completely avoid defects such as particle agglomeration and inadequate interface bonding; as such, the strength and toughness of the composite material are thus reduced. The refinement and uniform distribution of dimples further indicate that the internal oxidation method significantly improves the interface bonding performance between the particles and the matrix, thereby enhancing the fracture toughness of the material. This provides a solid theoretical basis for optimizing the preparation process of metal matrix composites.


