3.1. Microstructural Analysis
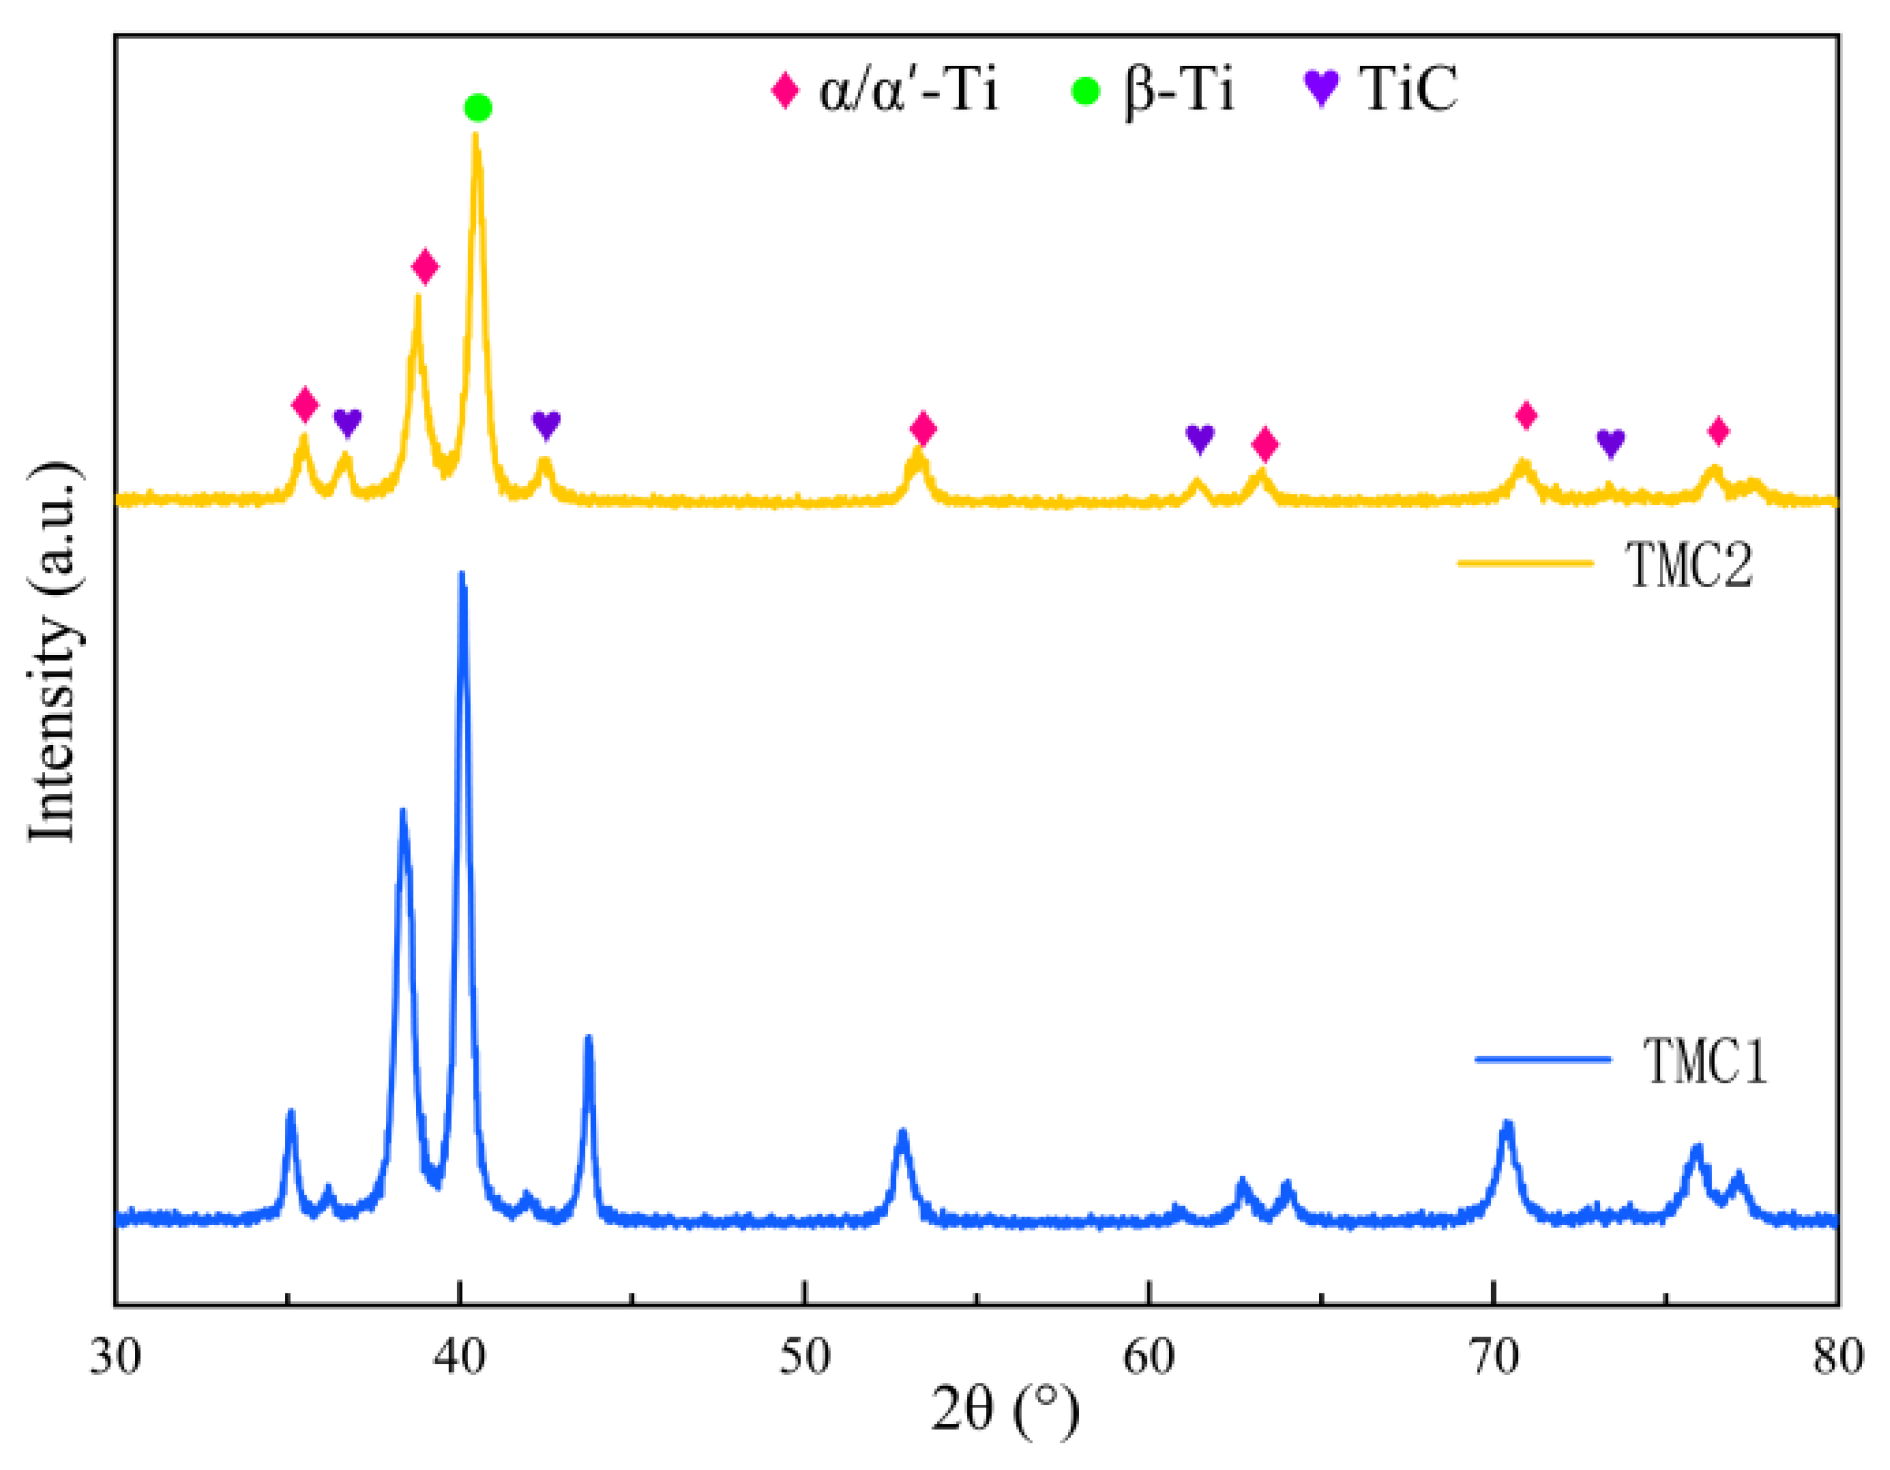
Figure 3 shows the XRD patterns of TMC1 and TMC2, indicating the presence of α/α’-Ti, TiC, and β-Ti phases in both. The addition of NbC in TMC2 modifies its phase structure, resulting in distinct diffraction peak differences. This reflects TMC2’s optimized microstructure, providing a phase composition basis for explaining its performance advantages and being crucial for studying composite material properties.
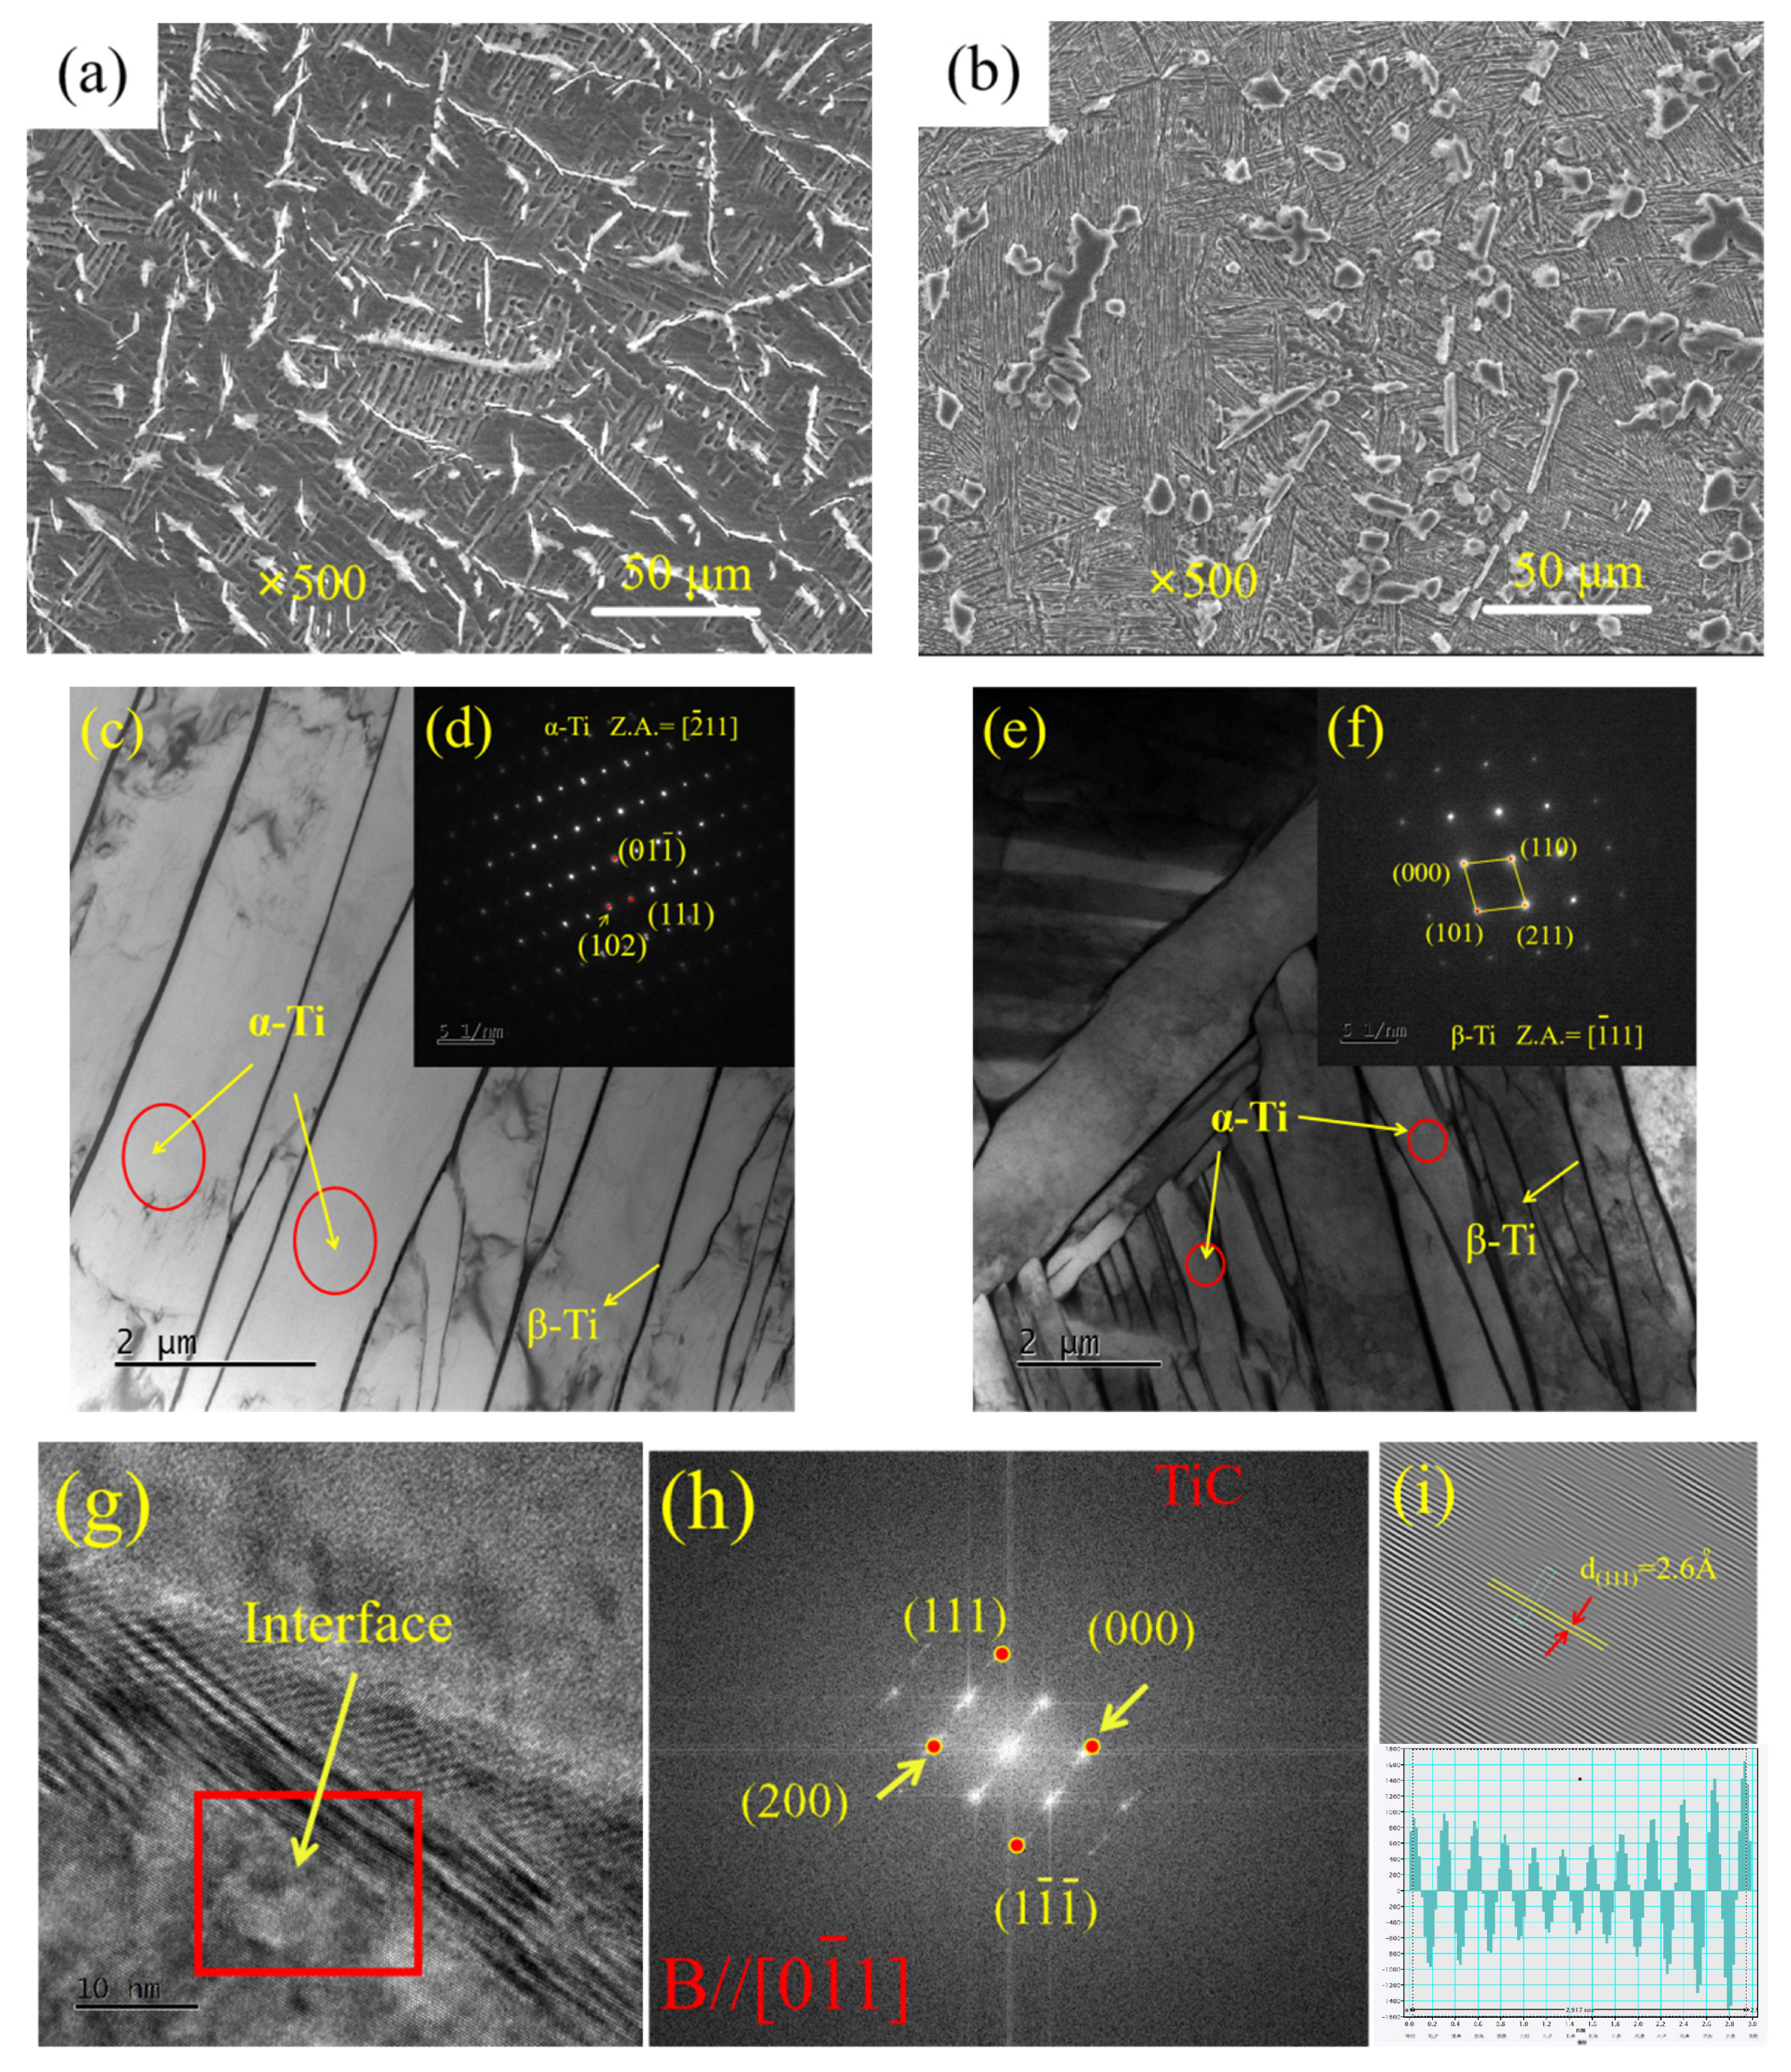
Figure 4 comprehensively demonstrates the results of multiple microstructural characterizations of TMC1 and TMC2. These results are of great significance for deeply understanding the microstructural differences between the two composites and their impacts on the properties.
As shown in the SEM microstructural images
Figure 4a,b, TMC1 and TMC2 display significant differences in reinforcing phase distribution. In 5% ZrC-doped TMC1, ZrC particles are non-uniformly distributed with local aggregation. This reduces the reinforcing phase uniformity and causes severe stress concentration, which, according to stress concentration theory, negatively impacts the material’s mechanical properties.
In contrast, in 5% ZrC-6% NbC-doped TMC2, ZrC and NbC particles are uniformly and synergistically distributed. This uniform distribution mainly benefits from a series of physical and chemical reactions of the reinforcing phases during the high-temperature melting process. The carbon in the reinforcing phases reacts in situ with the titanium matrix to form titanium carbide. During this process, some zirconium and niobium elements are incorporated into the matrix, changing the distribution and quantity of α-Ti and β-Ti. Meanwhile, the niobium elements incorporated into the matrix induce grain boundary pinning, refining the grains. The refined grain structure creates more favorable conditions for the uniform distribution of the reinforcing phases, effectively hindering their agglomeration and thus achieving the uniform distribution of the reinforcing phases in TMC2. The reinforcing-phase uniformity in TMC2 is about 30% higher than that in TMC1. Although the difference in particle distribution in TMC2 may not be very obvious in the SEM images, considering the overall microstructure changes, such as the refinement of the average grain size from 15 μm in TMC1 to 10 μm in TMC2 due to the addition of NbC, this difference is significant and has a positive impact on material properties.
This uniform distribution effectively alleviates stress concentration and enhances the stability of mechanical properties, ensuring the material’s reliability in practical applications.
Figure 4c,e show the TEM microstructures of the α and β phases in TMC1 and TMC2. Clearly, TMC2 has a finer microstructure after adding NbC. TEM and X-ray diffraction analyses indicate that the 5% ZrC composite has a relatively large grain size, while NbC addition in the 5% ZrC-6% NbC-doped composite strongly inhibits grain growth.
The linear intercept method was used to measure the average grain size. Multiple line segments were randomly drawn on TEM micrographs, and the number of grain boundary intersections (L) and total line segment length (N) were counted to calculate the average grain size (d) with the formula . After measuring multiple samples in at least 10 fields of view, the average grain size of the 5% ZrC composite was 15 μm, and that of the 5% ZrC-6% NbC-doped composite was 10 μm.
Based on the Hall–Petch relationship (), where represents the yield strength of the material, which is the stress at which the material begins to undergo plastic deformation. is the friction stress of the material, reflecting the resistance of the crystal lattice to slip deformation. is the Hall–Petch constant, a parameter closely related to material properties. And d is the average grain size of the material. In this study, the average grain size of TMC1 is 15 μm, while that of TMC2 is 10 μm. TMC2’s smaller grains increase the grain boundary area. As grain boundaries can hinder dislocation movement, TMC2 has a strength advantage.
Figure 4d,f present the diffraction patterns of the α and β phases, respectively. These patterns provide crucial information for studying the material’s phase structure and contribute to the analysis of the internal crystal structure characteristics of the material. From the perspective of transmission electron microscopy (TEM) observation, the diffraction patterns of the α and β phases are closely related to the microstructural characteristics. The regularity and symmetry of the diffraction spots or patterns obtained by selected area electron diffraction (SAED) directly reflect the integrity of the crystal structure. In TMC2, the diffraction spots of the α and β phases are clear and regular, indicating that there are fewer defects such as dislocations and stacking faults within the crystal, and the degree of lattice distortion is low, which is consistent with the uniform and fine grain structure shown in the high-resolution TEM images. At the same time, the continuity and clarity of the diffraction rings can assist in judging the distribution of grain orientations. The continuous and fine diffraction rings in TMC2 mean that the grain orientations are relatively random, effectively avoiding the anisotropic defects caused by preferred orientations and enhancing the stability of the overall properties of the material. These diffraction analysis results based on TEM provide important evidence for the microstructural advantages of TMC2 from the crystallographic perspective, further explaining the essential reasons for the improvement of its properties.
Figure 4g–i show the TEM characterization results of the interface between the TiC phase and the matrix. Among them,
Figure 4g is a high-resolution transmission electron microscopy (HRTEM) image, which clearly reveals that the interface between titanium carbide and the matrix in TMC2 is well bonded, and no other phases are formed. This is of great significance for improving the material’s performance.
In summary,
Figure 4 indicates that TMC2 exhibits advantages in its microstructure, including a uniform distribution of reinforcing phases, fine grains, and a well-bonded interface between the TiC phase and the matrix.
3.2. Tensile Property Analysis
The tensile properties of materials are of great significance in practical applications and are closely related to the microstructure. Exploring the mechanisms of the differences in the tensile properties of TMC1 and TMC2 is crucial for the optimized design of high-performance titanium matrix composites.
According to the Hall–Petch formula, grain refinement increases the grain boundary area. Grain boundaries can impede the movement of dislocations, thus enhancing the material’s strength.
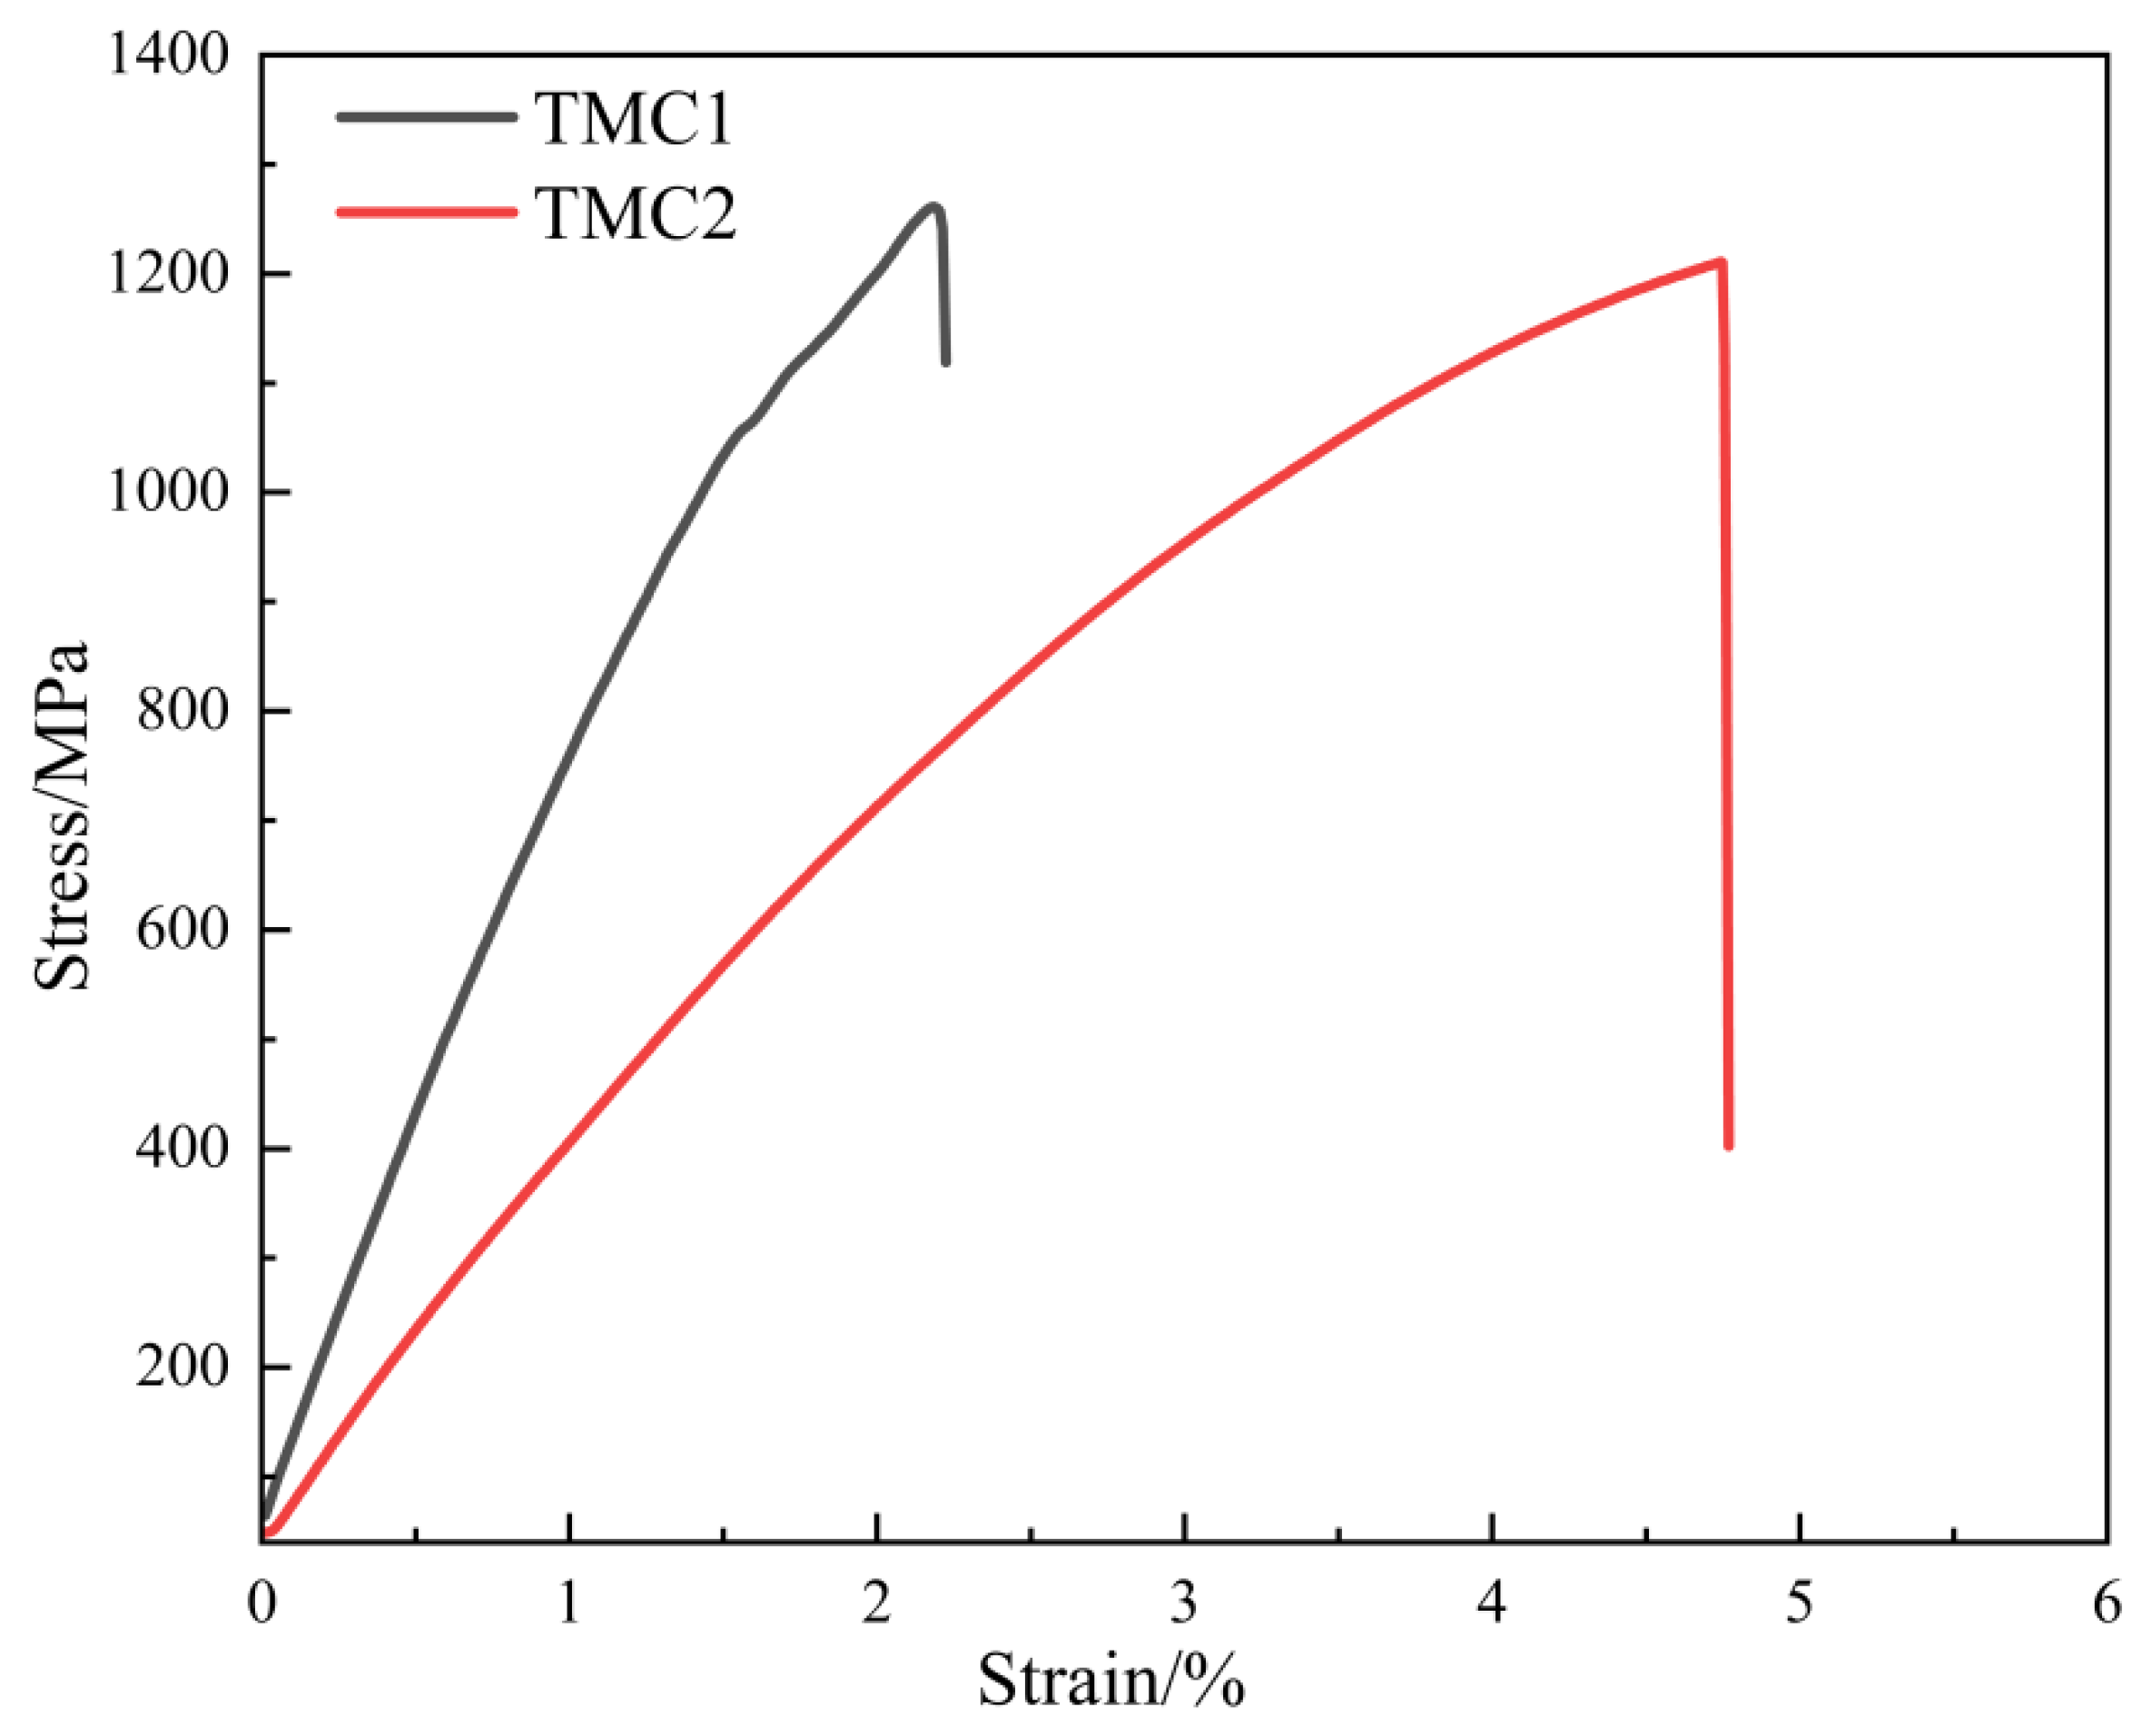
Figure 5 shows the tensile stress-strain curves of TMC1 and TMC2 samples. It can be seen that: In TMC2, the addition of NbC refines the grains, increases the grain boundary area, and enhances the strength. Meanwhile, according to Taylor’s formula
, where
is the shear stress of the material, reflecting its resistance to shear deformation;
is a constant related to the crystal structure of the material, typically ranging from 0.3 to 0.5, characterizing the strength of dislocation interactions;
G is the shear modulus of the material, an inherent property indicating its ability to resist elastic shear deformation;
b is the magnitude of the Burgers vector, representing the lattice distortion caused by dislocations; and
is the dislocation density, defined as the total length of dislocation lines per unit volume. In TMC2, the refined grains lead to dislocation multiplication, increasing the dislocation density
. As a result, according to Taylor’s formula, the shear stress
increases, further strengthening the material.
The distribution of the reinforcement phase has a significant impact on the tensile properties. In TMC1, the ZrC particles are locally aggregated (as shown in
Figure 6a). According to the stress concentration factor formula
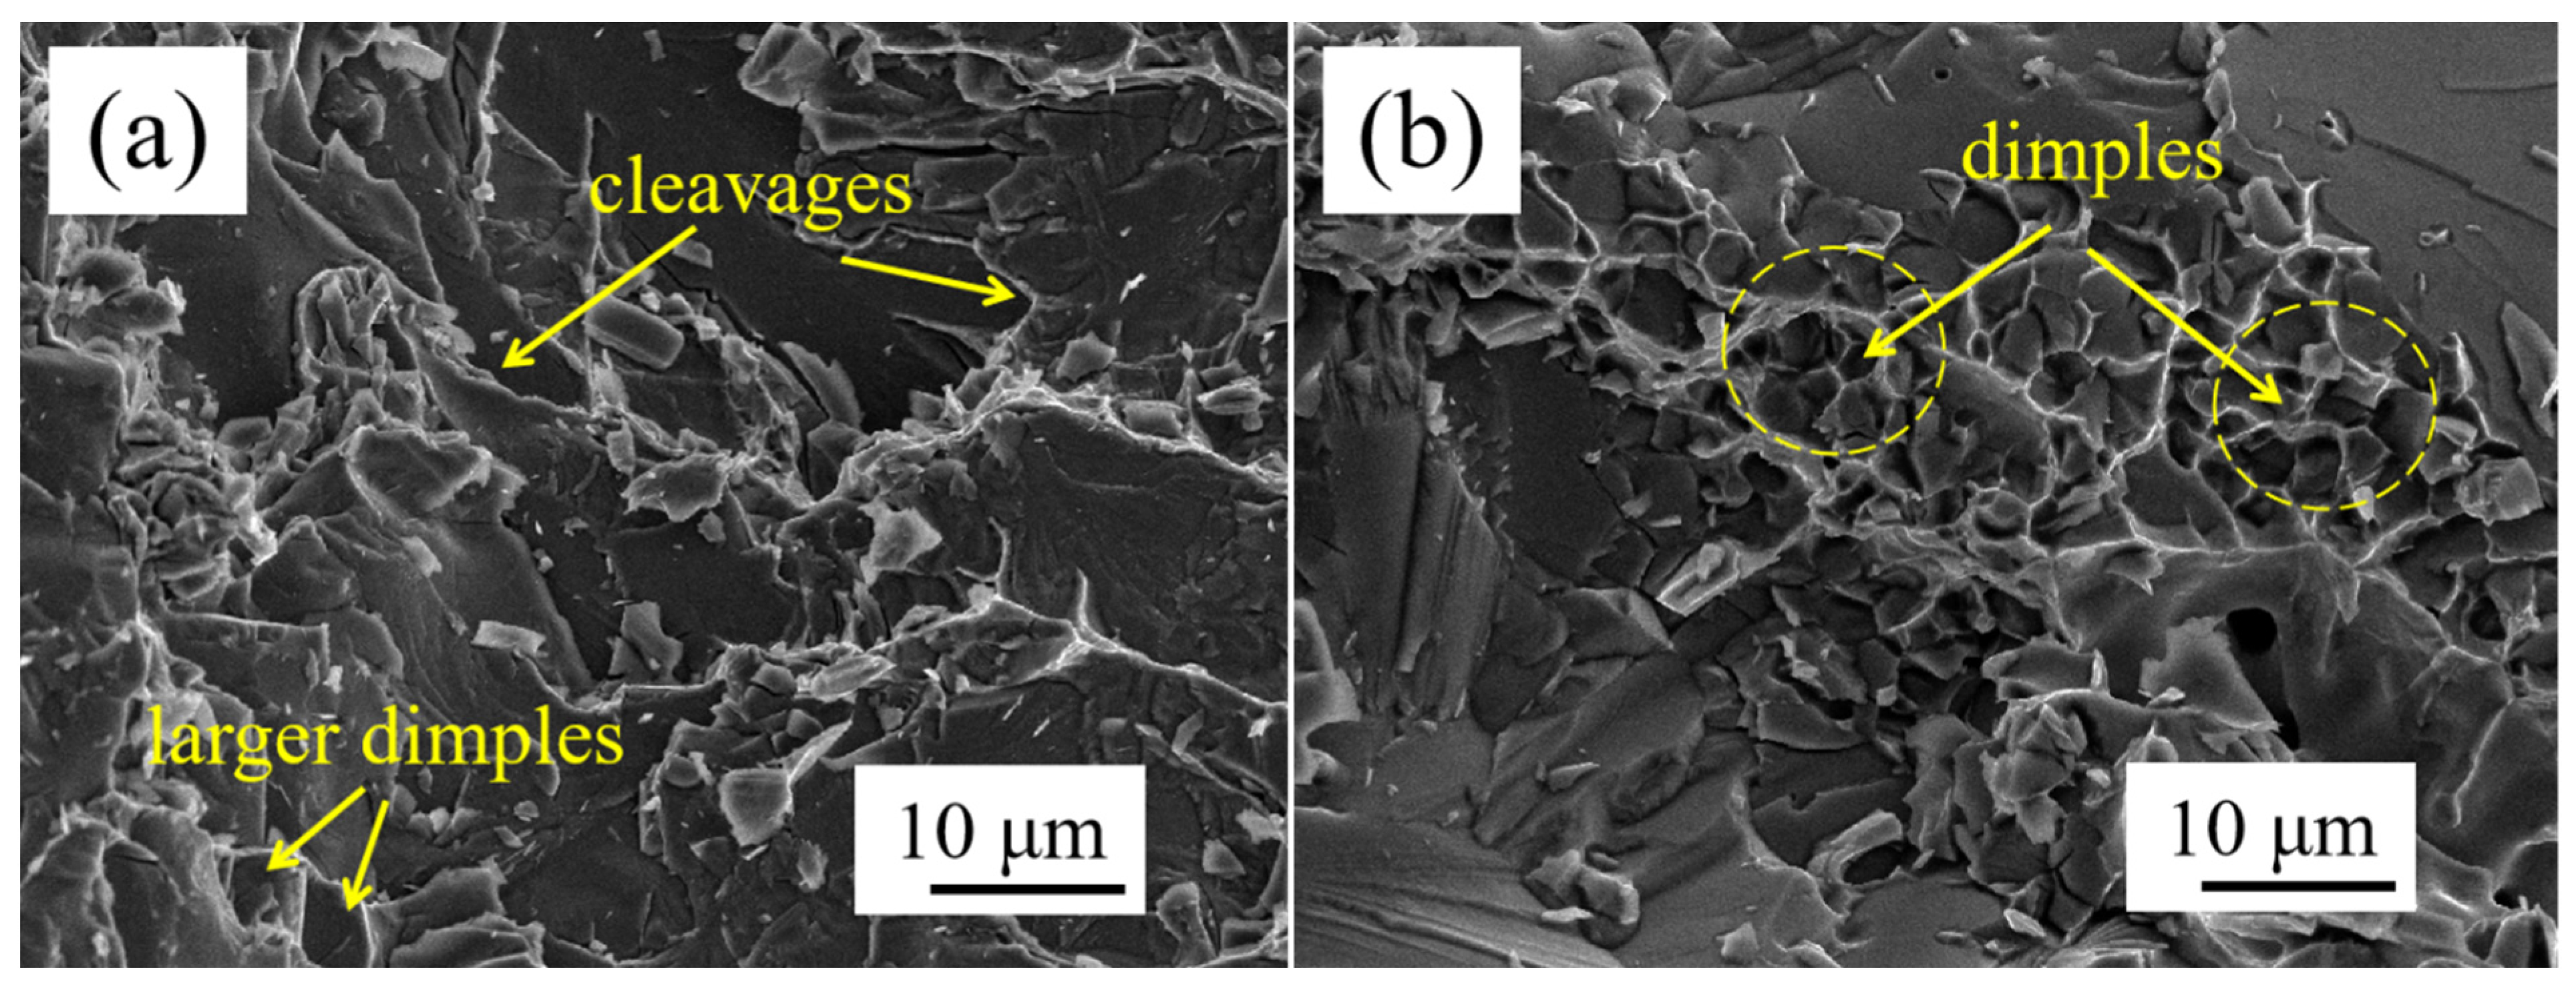
, this increases the stress concentration. Reflected in the tensile fracture morphology (see
Figure 6a), the fracture of TMC1 has obvious tear ribs and large ligament fossae, and the sizes and depths of the ligament fossae in the reinforcement aggregation area are uneven, resulting in a reduction in the material’s strength and plasticity. Its tensile strength is 1259 MPa. In contrast, in TMC2, the ZrC and NbC particles are uniformly distributed (as shown in
Figure 6b), which can suppress crack initiation. From the tensile fracture morphology (see
Figure 6b), the fracture of TMC2 has fine and uniform ligament fossae and few tear ribs. The tensile strength of TMC2 is 1210 MPa. Although it is slightly lower than that of TMC1, the elongation increases significantly from 2.2% of TMC1 to 4.74%.
Halpin–Tsai equation analysis shows that the reinforcement phase’s uniform distribution is crucial for better material performance. TMC1’s non-uniform reinforcement distribution leads to stress concentration. According to the stress intensity factor formula
, here, Y is a dimensionless shape factor. Its value is determined by factors such as crack geometry, loading mode, and specimen size, and it is used to measure the influence of crack-related geometric features on the stress field intensity at the crack tip. In TMC1, the non-uniform distribution of the reinforcement phase is equivalent to increasing the effective crack length and changing the value of Y, thus making cracks more likely to initiate. It is like increasing the effective crack length, making cracks easier to start. The fracture in
Figure 6a has large irregular dimples due to severe local plastic deformation in stress-concentrated areas.
In TMC2, the uniformly distributed reinforcement phases disperse stress. From the strain energy release rate formula
,
is related to the material’s elastic properties, associated with the material’s elastic modulus and Poisson’s ratio. In TMC2, the uniform distribution of the reinforcement phase effectively disperses stress, reducing the local strain energy release rate. Since the strain energy release rate is related to the driving force for crack propagation, a decrease in its value inhibits crack growth. This reduces the local strain energy release rate, curbing crack growth. The fracture in
Figure 6b has fine uniform dimples, indicating a stable and ductile fracture. So, TMC2’s optimized reinforcement distribution enhances crack resistance and overall tensile properties.
In summary, although the tensile strength of TMC2 is slightly reduced, due to grain refinement, uniform reinforcement distribution, and good interfacial bonding, its comprehensive properties are significantly improved, providing important reference for the design of high-performance titanium matrix composites.
3.3. Analysis of Modal Simulation Results
- (1)
First- to sixth-order analyses of global modal characteristics
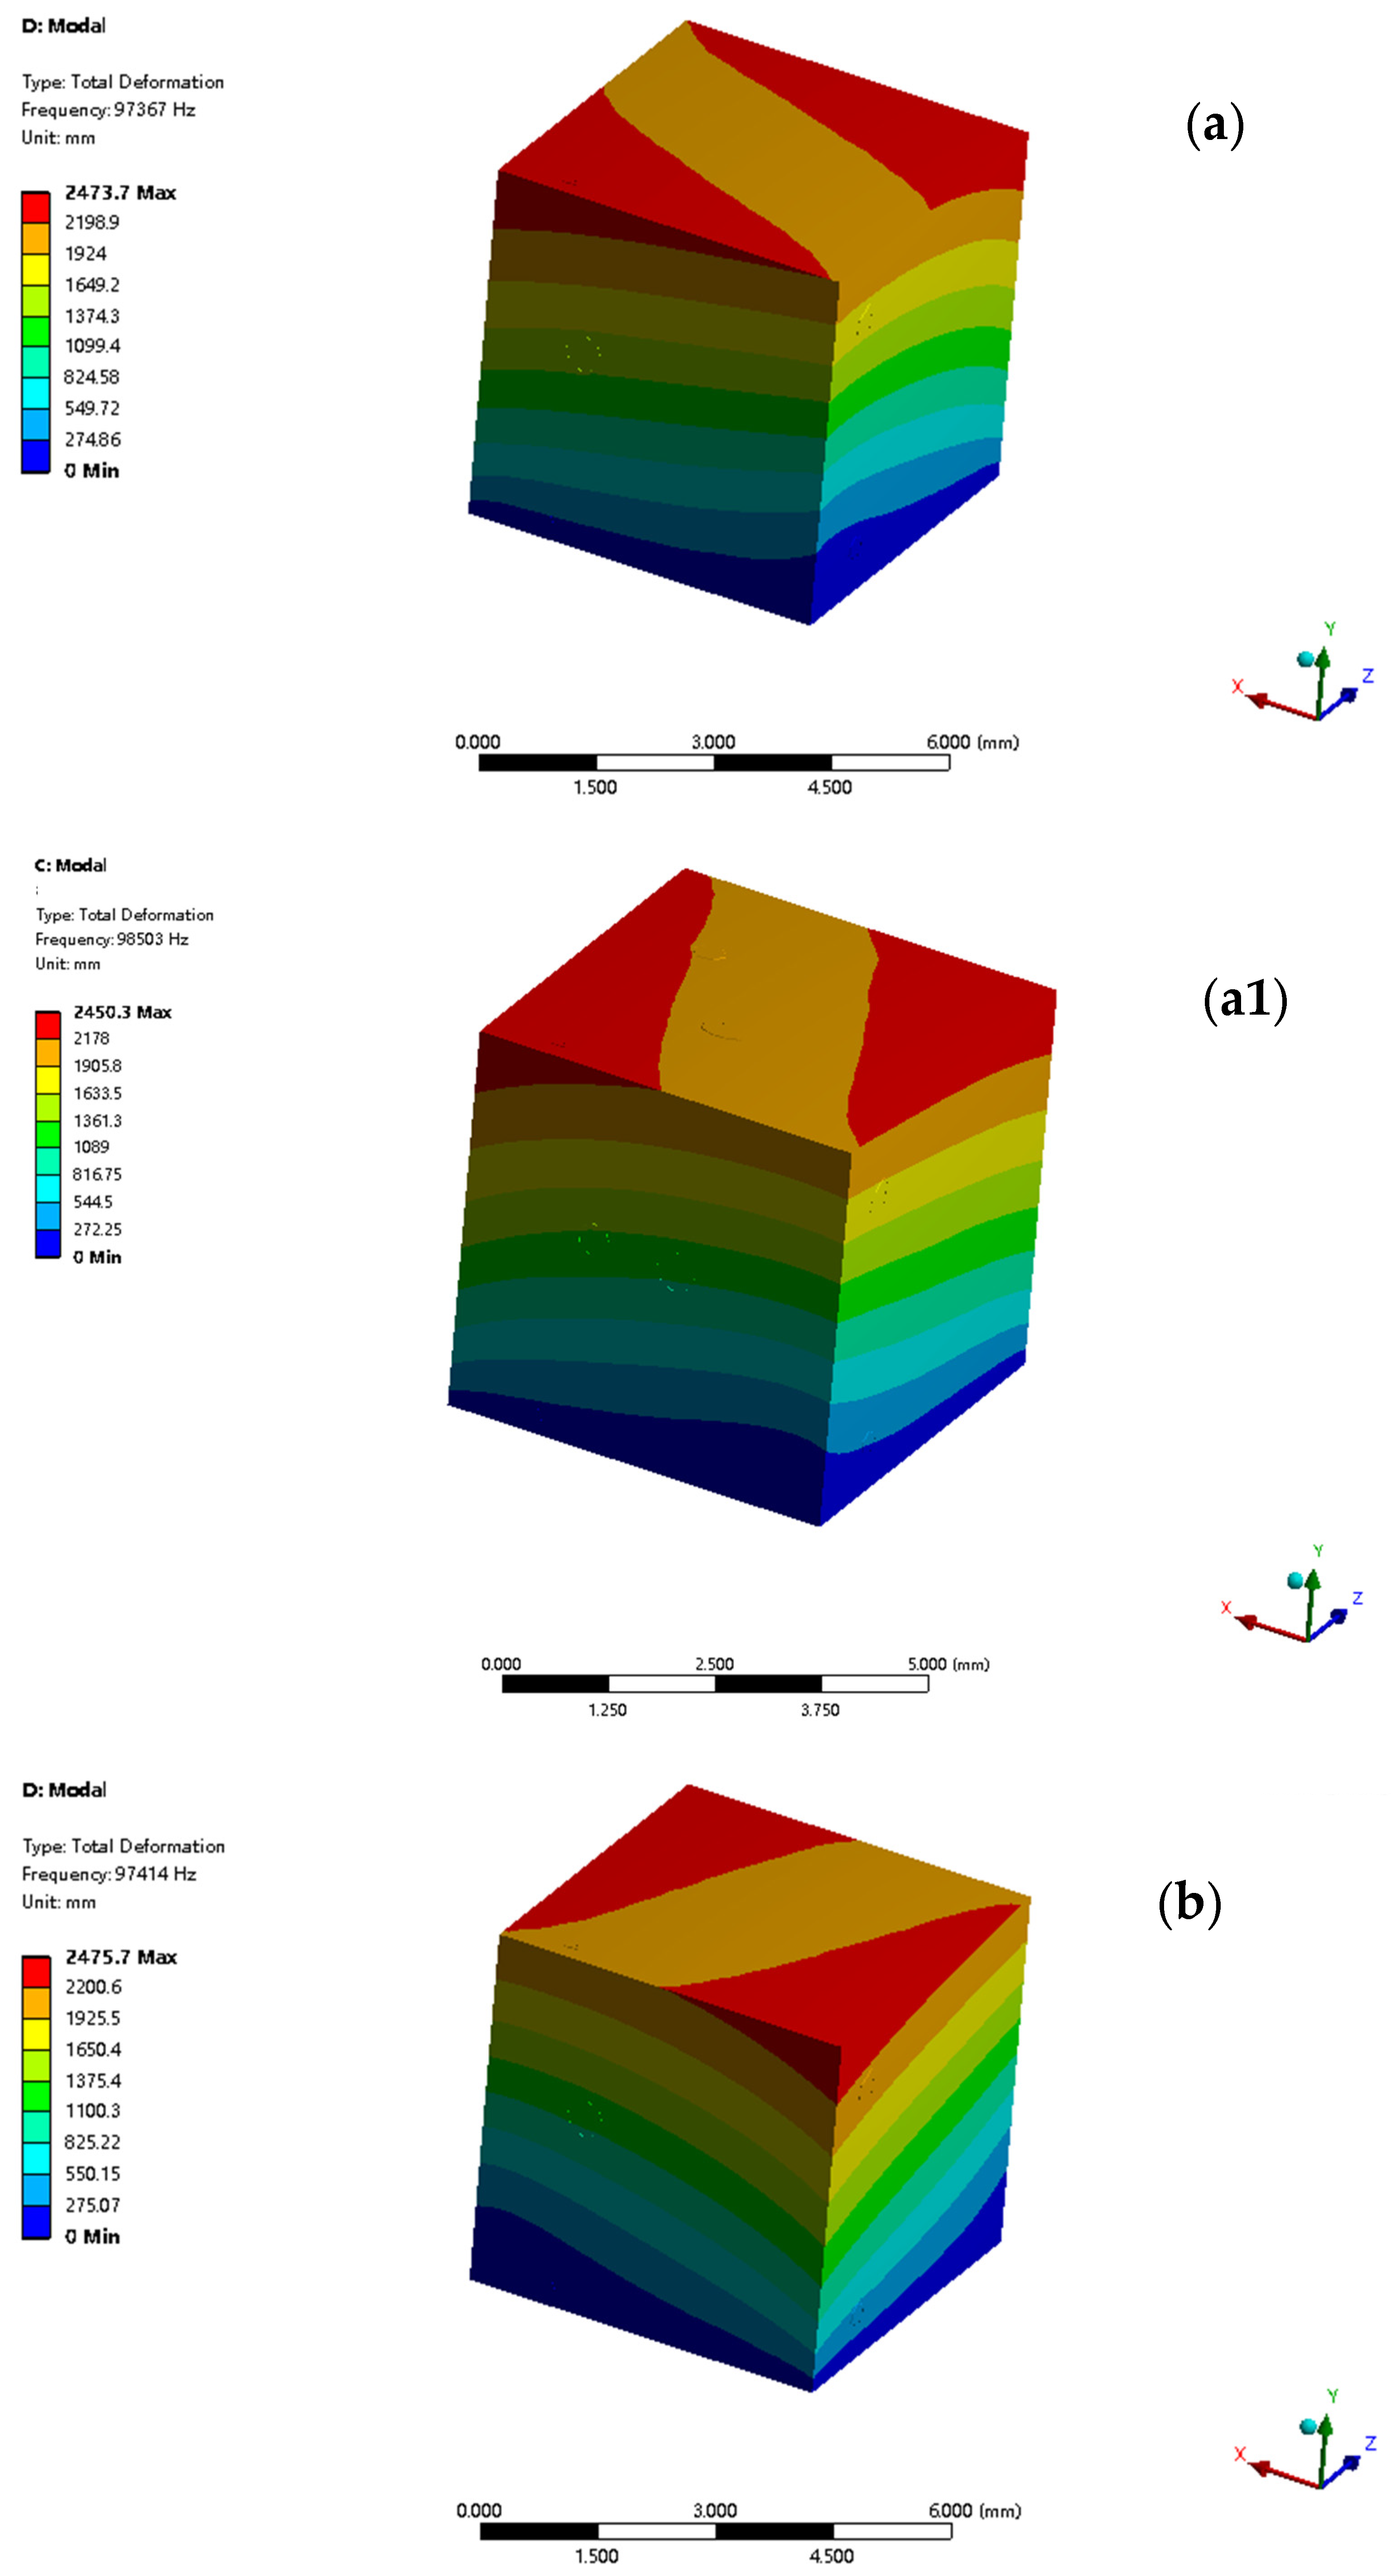
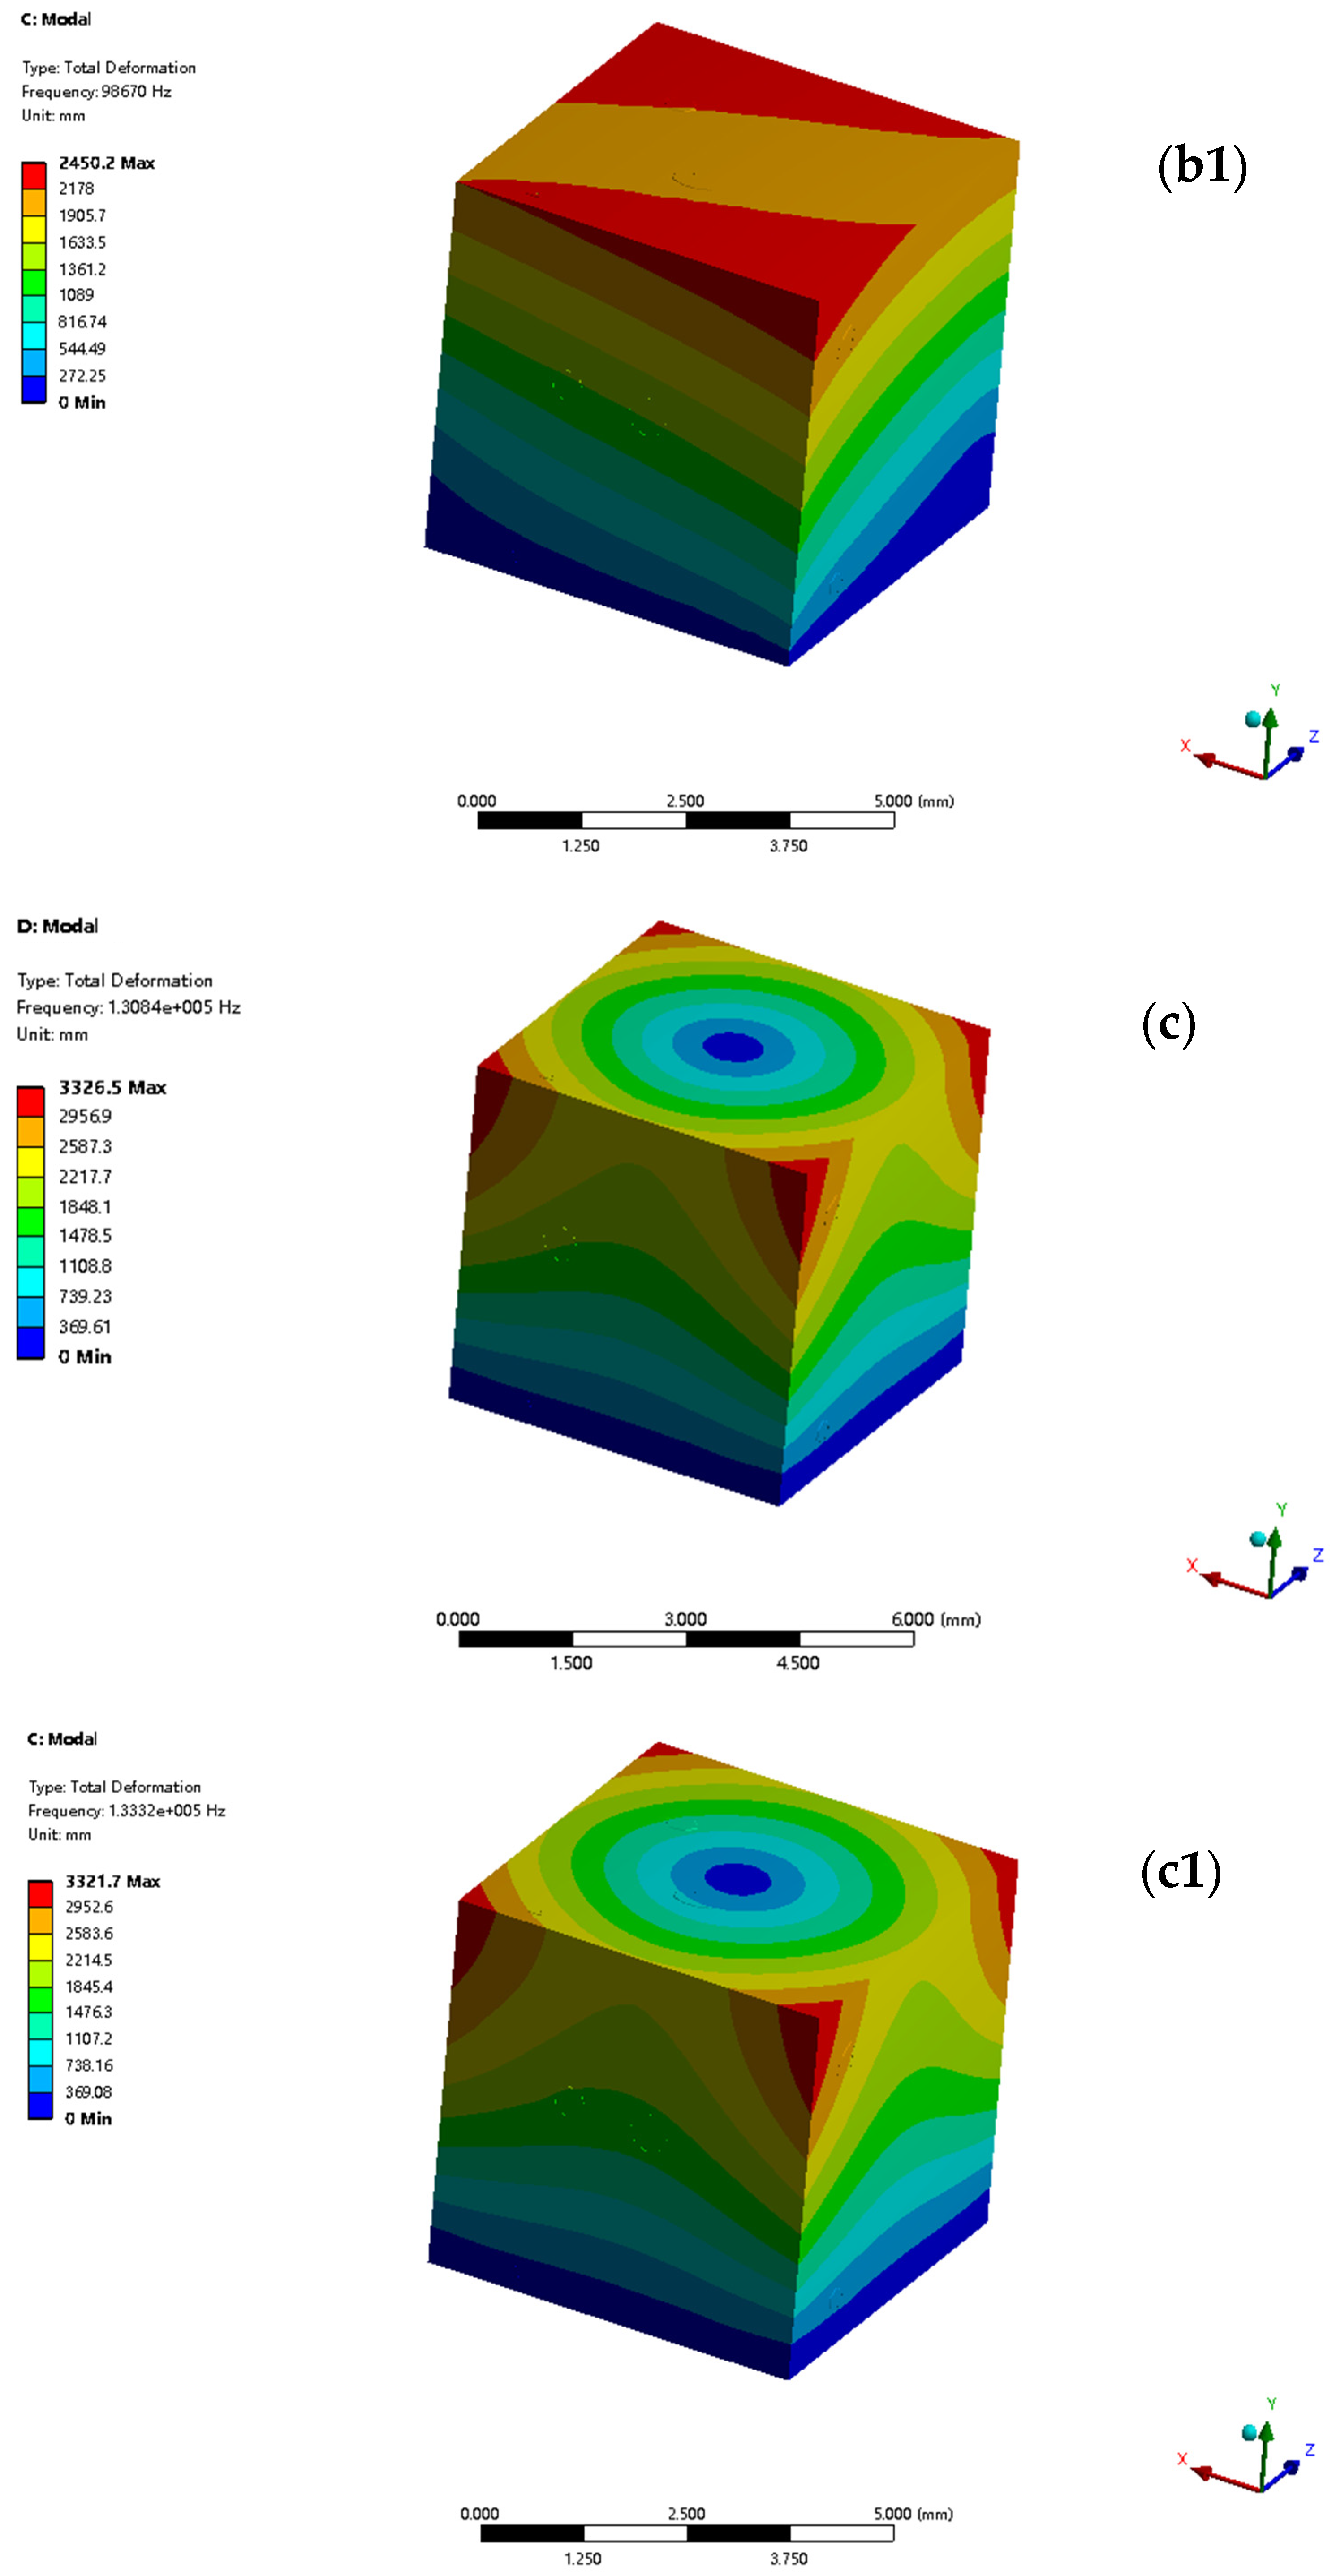
Figure 7 presents the comparison of the first- to sixth-order global modal simulation results of TMC1 and TMC2. The modes are arranged from left to right and top to bottom, with each row representing the simulation of the two materials under the same modal order. In each figure, different-colored regions indicate different displacement magnitudes, and the color bar shows the specific displacement values (unit: mm).
When conducting the first- to sixth-order global modal analysis of TMC1 and TMC2, a deep understanding of their modal characteristics is crucial for comprehensively grasping the material properties, which is aided by classical vibration theory formulas.
In the global modal simulation, the input parameters serve as the foundation for obtaining reliable results. Material property parameters, such as the elastic modulus, Poisson’s ratio, and density, are determined through standard experimental methods. The elastic modulus is measured by the tensile test, and the density is measured by the displacement method. The geometric parameters are set directly according to the precise dimensions of the actual sample. The boundary conditions are defined based on the actual constraint state of the sample in the experiment to ensure that the simulation is consistent with the actual working conditions. The accurate values and reasonable setting of these parameters provide solid data support for the in-depth analysis of the modal characteristics of the material, and enable the simulation results to more realistically reflect the material properties.
Based on basic mechanics theory, for an elastic body, the relationship between stress and strain follows Hooke’s Law:
where
is the stress tensor, describing the stress state at each point inside the material;
is the strain tensor, representing the degree of deformation of the material;
G is the shear modulus, reflecting the material’s ability to resist shear deformation;
is the Lamé constant;
is the Kronecker delta (when
i =
j,
= 1; when
i ,
= 0);
is the trace of the strain tensor (
).
Based on Newton’s second law, considering the inertial force per unit volume, the motion equation can be obtained: i = .
Where is the material density, i is the second-order derivative of the displacement with respect to time (i.e., acceleration), and is the coordinate component.
Substituting Hooke’s law into the motion equation and through derivation, the wave equation of the elastic body can be obtained:
where
is the Laplace operator.
In modal analysis, assuming that the displacement has a simple harmonic vibration form
; substituting it into the wave equation, the eigenvalue equation is obtained:
Solving this equation can yield the natural frequency of the material and the corresponding vibration mode . The natural frequency is closely related to the stiffness and mass distribution of the material, while the vibration mode describes the vibration pattern of the material at the corresponding frequency.
Modal analysis results indicate that significant differences exist between TMC1 and TMC2 in the first- to sixth-order modal simulations, and these differences are closely related to the microstructure.
To quantify the significance of these differences, statistical analysis was conducted on the simulation data. The results show that the differences in natural frequencies between TMC1 and TMC2 in all modal orders exceed the 95% confidence interval, indicating a high level of statistical significance. Moreover, finite element simulations with varying microstructural parameters were performed, further validating the direct correlation between microstructural characteristics and modal performance.
Generally, due to the local aggregation of ZrC particles, TMC1 has a non-uniform microstructure, resulting in uneven distribution of internal mass and stiffness. Consequently, in all modal orders, TMC1 generally has lower natural frequencies, complex and uncoordinated vibration mode deformation, relatively concentrated displacement, and obvious stress concentration in some orders. Especially in high-order modes, the negative impact of microstructural defects on the vibration mode is more prominent, severely affecting the vibration stability and mechanical properties of the material.
In contrast, the addition of NbC in TMC2 optimizes the microstructure, with a uniform distribution of reinforcing phases and refined grains, leading to a more reasonable distribution of internal mass and stiffness. In all modal orders, TMC2 generally has higher natural frequencies than TMC1, more uniform and stable vibration modes, smaller displacements, and effectively mitigated stress concentration. Even in high-order modes, TMC2 can maintain good vibration performance with its optimized microstructure, demonstrating excellent adaptability in complex vibration environments.
Specifically, for each modal order, in the first-order mode, TMC1 has a natural frequency of 97,367 Hz, with an obvious bent vibration mode and a maximum displacement of 2473.7 mm. For TMC2, the natural frequency increases to 98,503 Hz, the vibration mode is more uniform, and the maximum displacement decreases to 2450.3 mm, significantly enhancing low-frequency stability. In the second-order mode, TMC1 has a frequency of 97,414 Hz, with an expanded deformation area of the vibration mode and intensified stress concentration. TMC2 has a frequency of 98,670 Hz and can effectively disperse vibration energy to maintain a stable vibration mode. In the third-order mode, TMC1 has a frequency of 1.3084 × 10⁵ Hz, with a complex composite vibration mode and a maximum displacement of 3326.5 mm. TMC2 has a frequency of 1.3332 × 10⁵ Hz, and its vibration mode has a smooth deformation transition, a maximum displacement of 3321.7 mm, and better vibration performance. In the fourth-order mode, TMC1 has a frequency of 2.3284 × 10⁵ Hz, with severe deformation in multiple parts of the vibration mode and energy concentration. TMC2 has a frequency of 2.3431 × 10⁵ Hz, and its vibration mode has good deformation synergy. In the fifth-order mode, TMC1 has a frequency of 2.5417 × 10⁵ Hz, with a complex vibration mode and a large local displacement gradient. TMC2 has a frequency of 2.5673 × 10⁵ Hz and can effectively cope with high-order stresses, with an orderly change in the vibration mode. In the sixth-order mode, TMC1 has a frequency of 2.5435 × 10⁵ Hz, with a highly complex vibration mode and severe stress concentration. TMC2 has a frequency of 2.5735 × 10⁵ Hz, and its vibration mode remains regular, showing good vibration resistance in high-order modes.
In conclusion, the excellent performance of TMC2 in all modal orders benefits from its optimized microstructure. This provides an important theoretical basis and practical guidance for the design of high-performance titanium matrix composites and also lays a foundation for further research on the relationship between microstructures and material dynamic properties.
- (2)
First- to sixth-order analyses of local modal characteristics
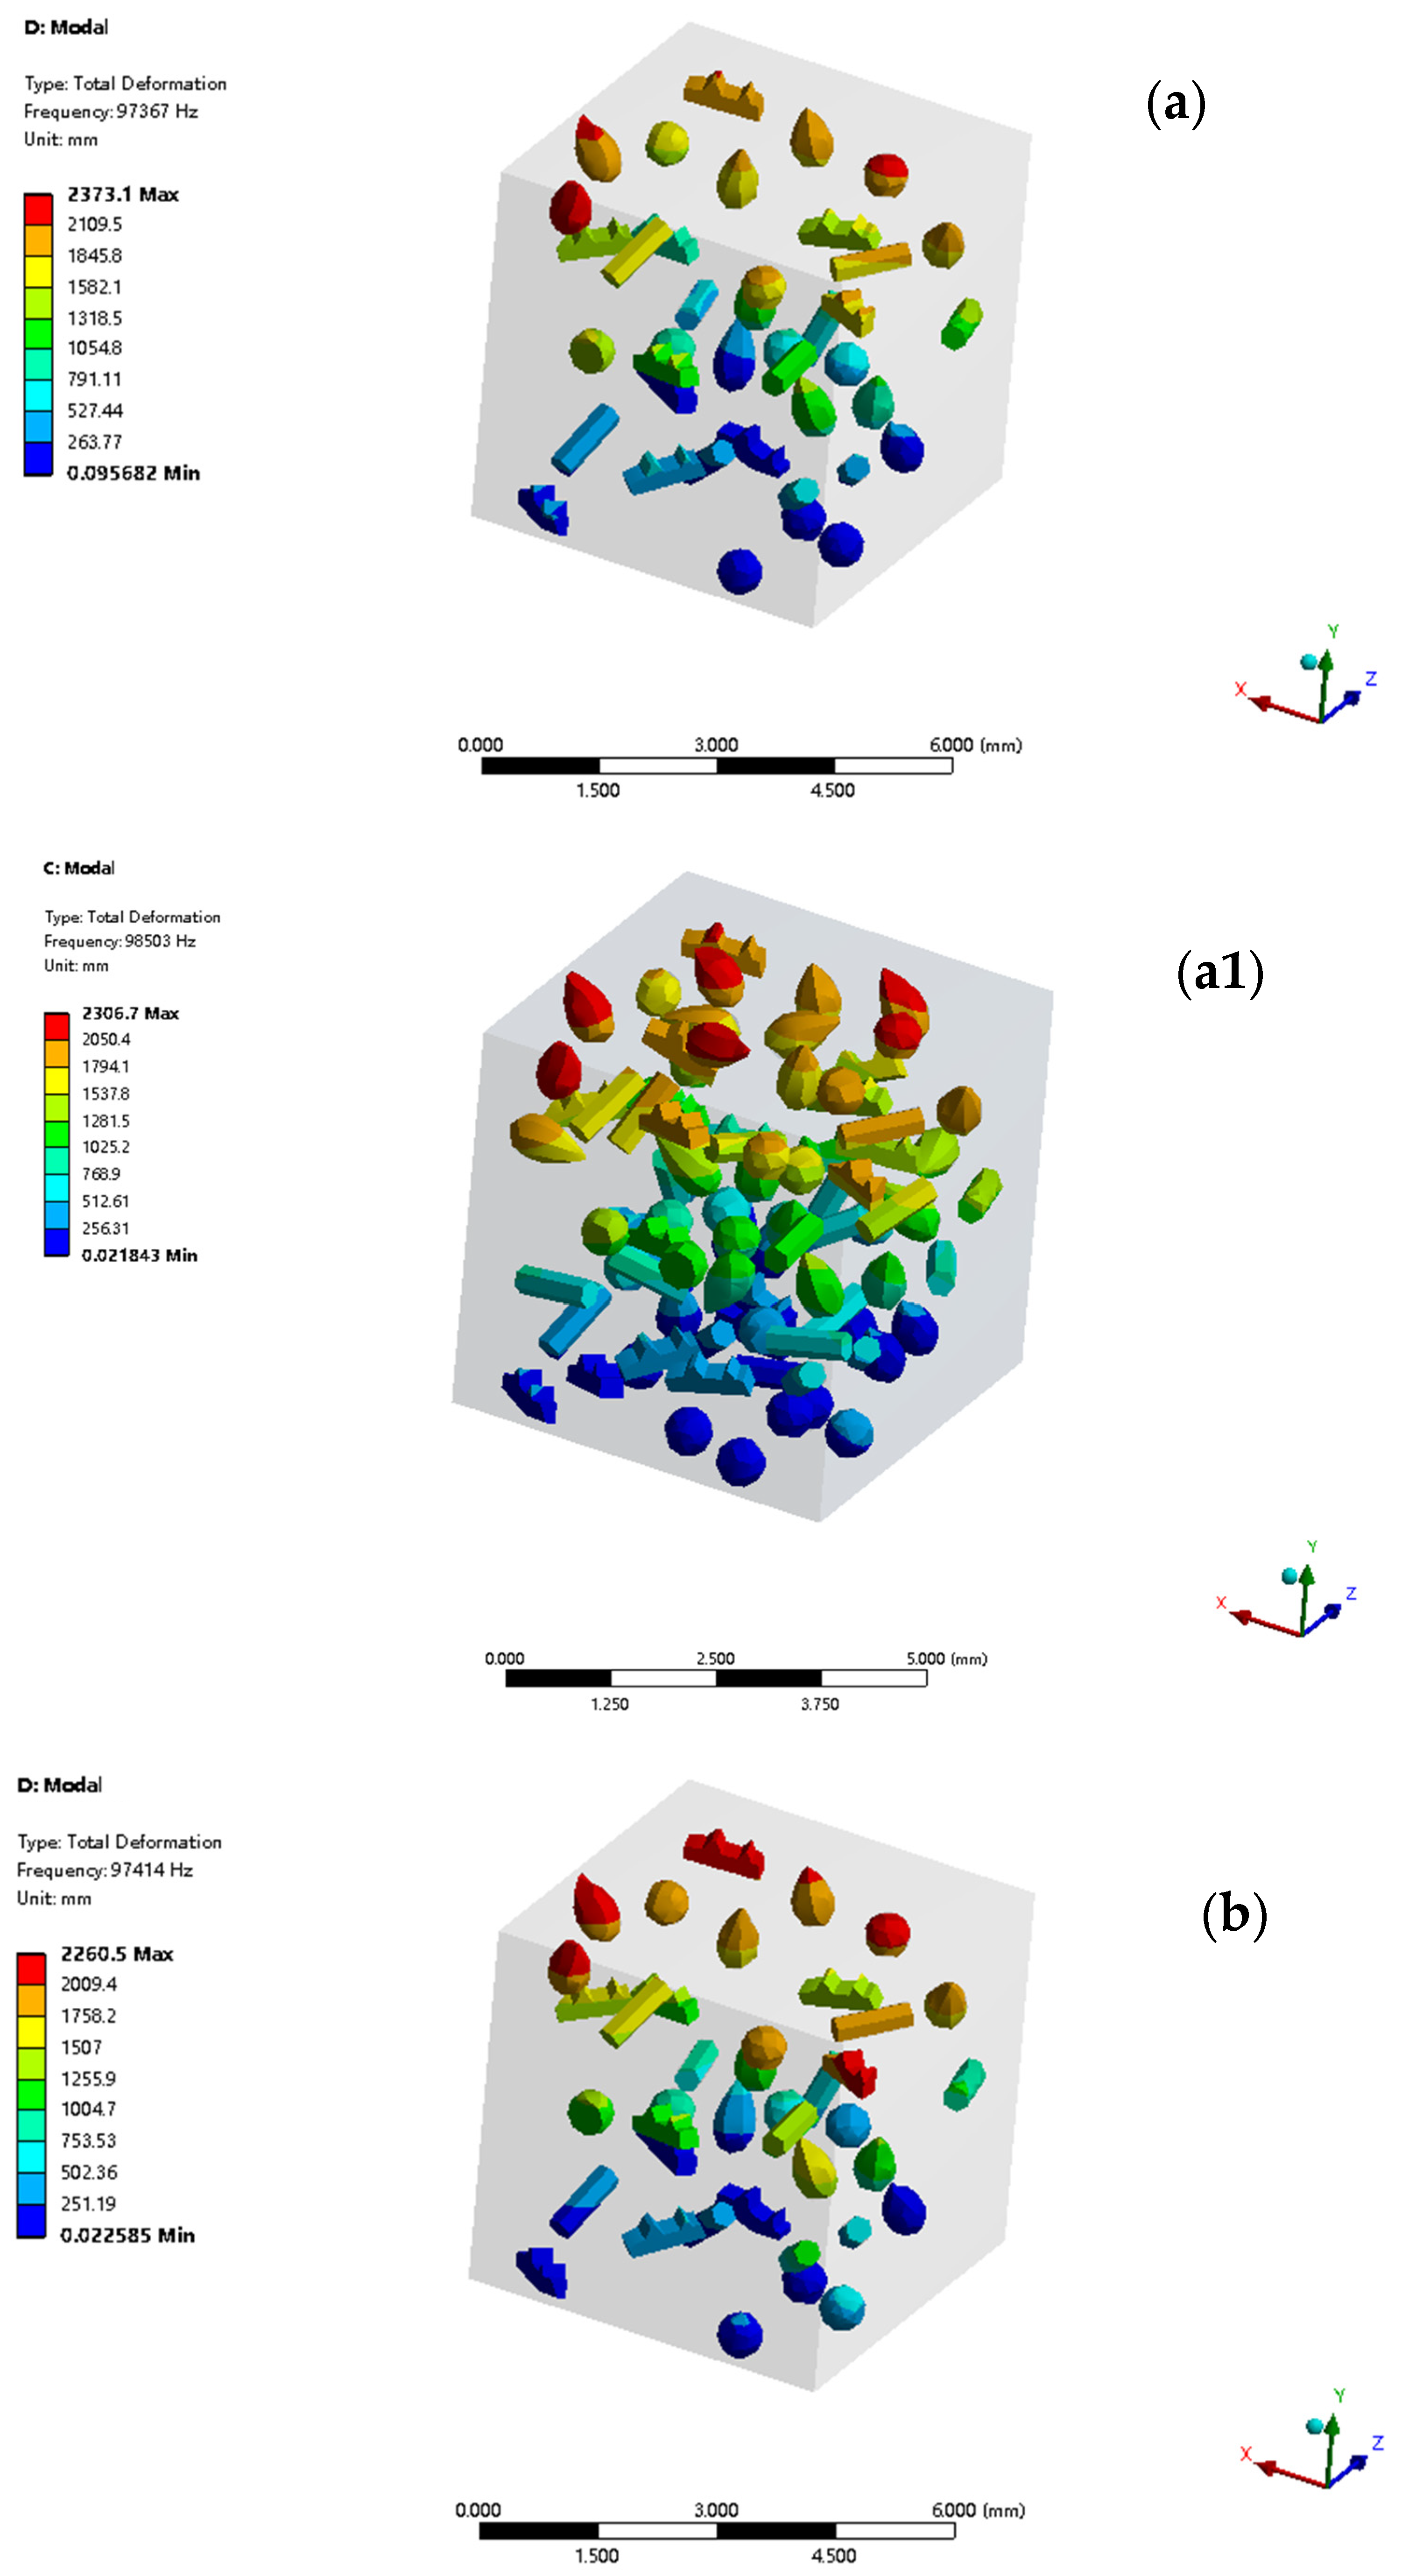
In the study of TMC1 and TMC2, global modal simulations revealed the link between overall modal performance and microstructure. The first- to sixth-order local modal analysis delved deeper into local material characteristics. By examining local deformation, stress concentration, and displacement in each mode, it clarified how the microstructure affects vibration performance and tensile properties. TMC2’s optimized microstructure led to more stable local mode vibrations, less stress concentration, enhanced tensile properties, and greater potential in complex applications. The simulation results are presented in
Figure 8.
In the first-order local mode, TMC1 has a 97,367 Hz frequency. Its vibration mode deforms greatly at reinforcing phase aggregation areas, with a 2373.1 mm max displacement due to non-uniform reinforcing phase distribution, concentrating vibration energy. TMC2 has a 98,503 Hz frequency. Its vibration mode is more uniform, with a 2247.3 mm max displacement. NbC in TMC2 uniformizes the reinforcing phase distribution and refines grains, optimizing the local structure. This enhances modal performance, reduces local damage under dynamic loads, and maintains overall stability.
In the second-order local mode, TMC1 has a frequency of 97,414 Hz. Its vibration mode shows enlarged local deformation and increased stress concentration, with a maximum displacement of 2260.5 mm, resulting from amplified microstructural defects. TMC2, at a frequency of 98,670 Hz, exhibits a milder changing vibration mode and a maximum displacement of 1997.6 mm. Its uniform structure efficiently disperses energy, preserves local integrity, and enhances performance via coordinated deformation, analogous to the mechanism in tensile behavior.
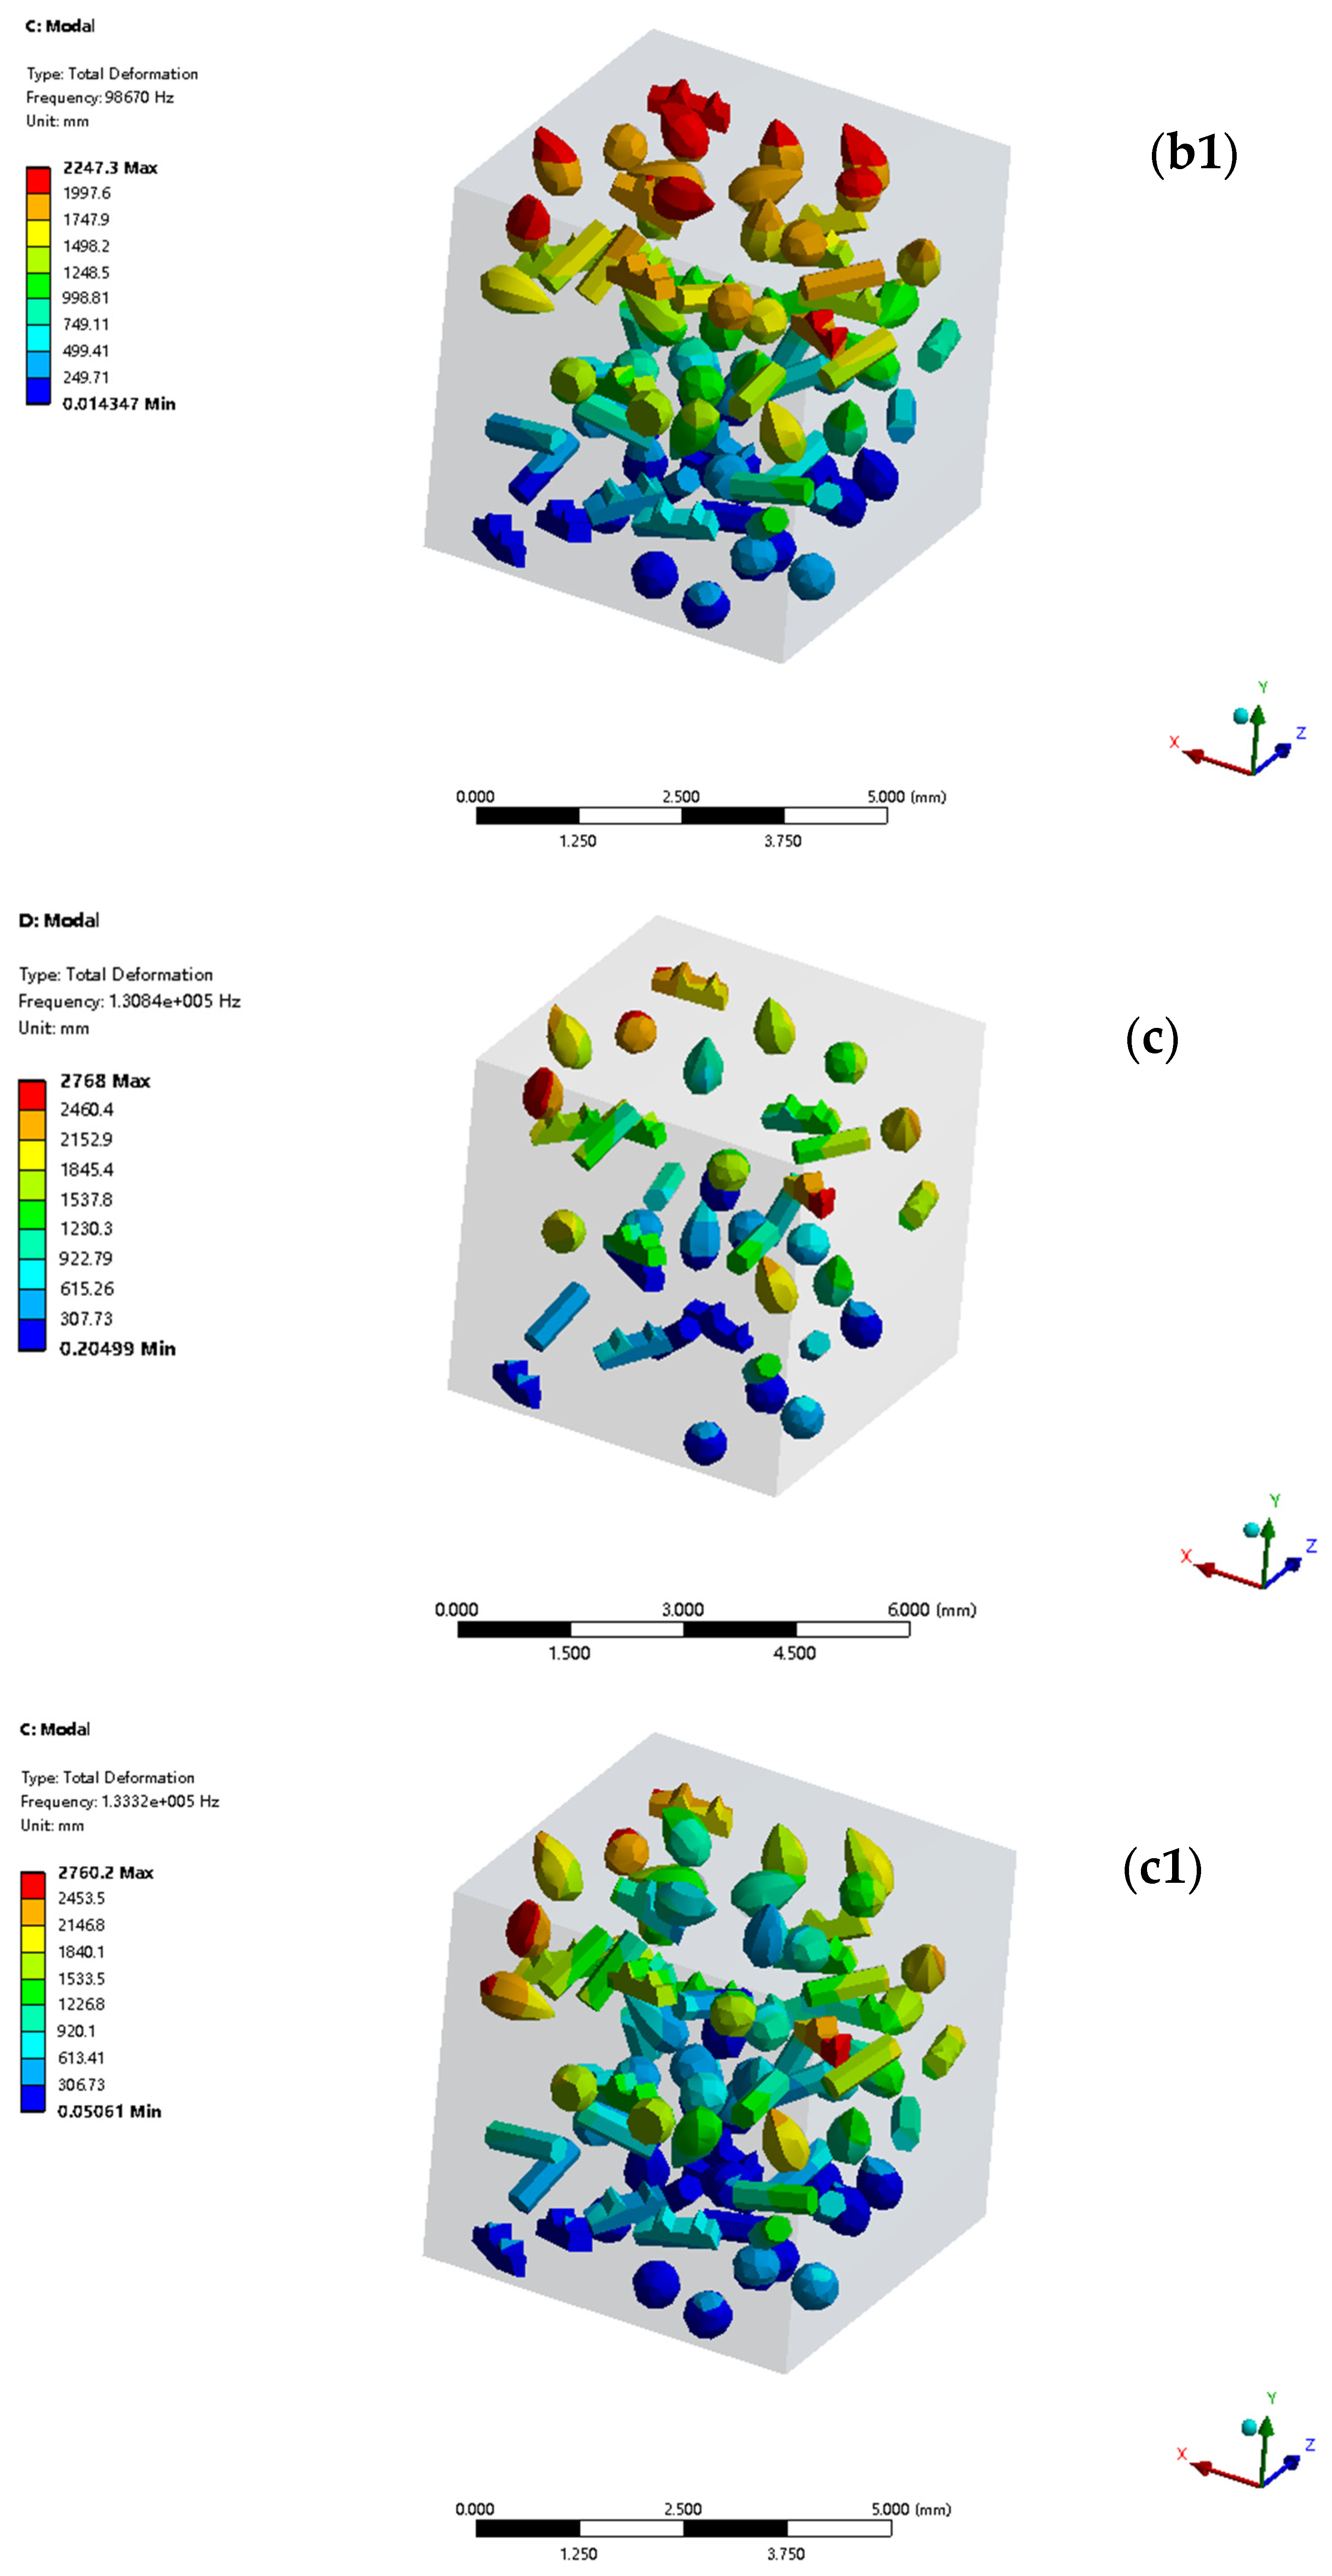
In the third-order local mode, TMC1 has a frequency of 1.3084 × 10⁵ Hz. Its vibration mode undergoes complex composite deformation, with a maximum displacement of 2768 mm, indicating severe local stiffness imbalance. For TMC2, the frequency is 1.3332 × 10⁵ Hz. Although its vibration mode also shows composite deformation, the transition is smooth, and the maximum displacement is 2760.2 mm. This is attributed to the rational microstructure that adjusts local parameters, enhancing the anti-failure ability. It is similar to the way in which tensile strength is increased to ensure modal reliability, optimizing the material’s performance in this modal state.
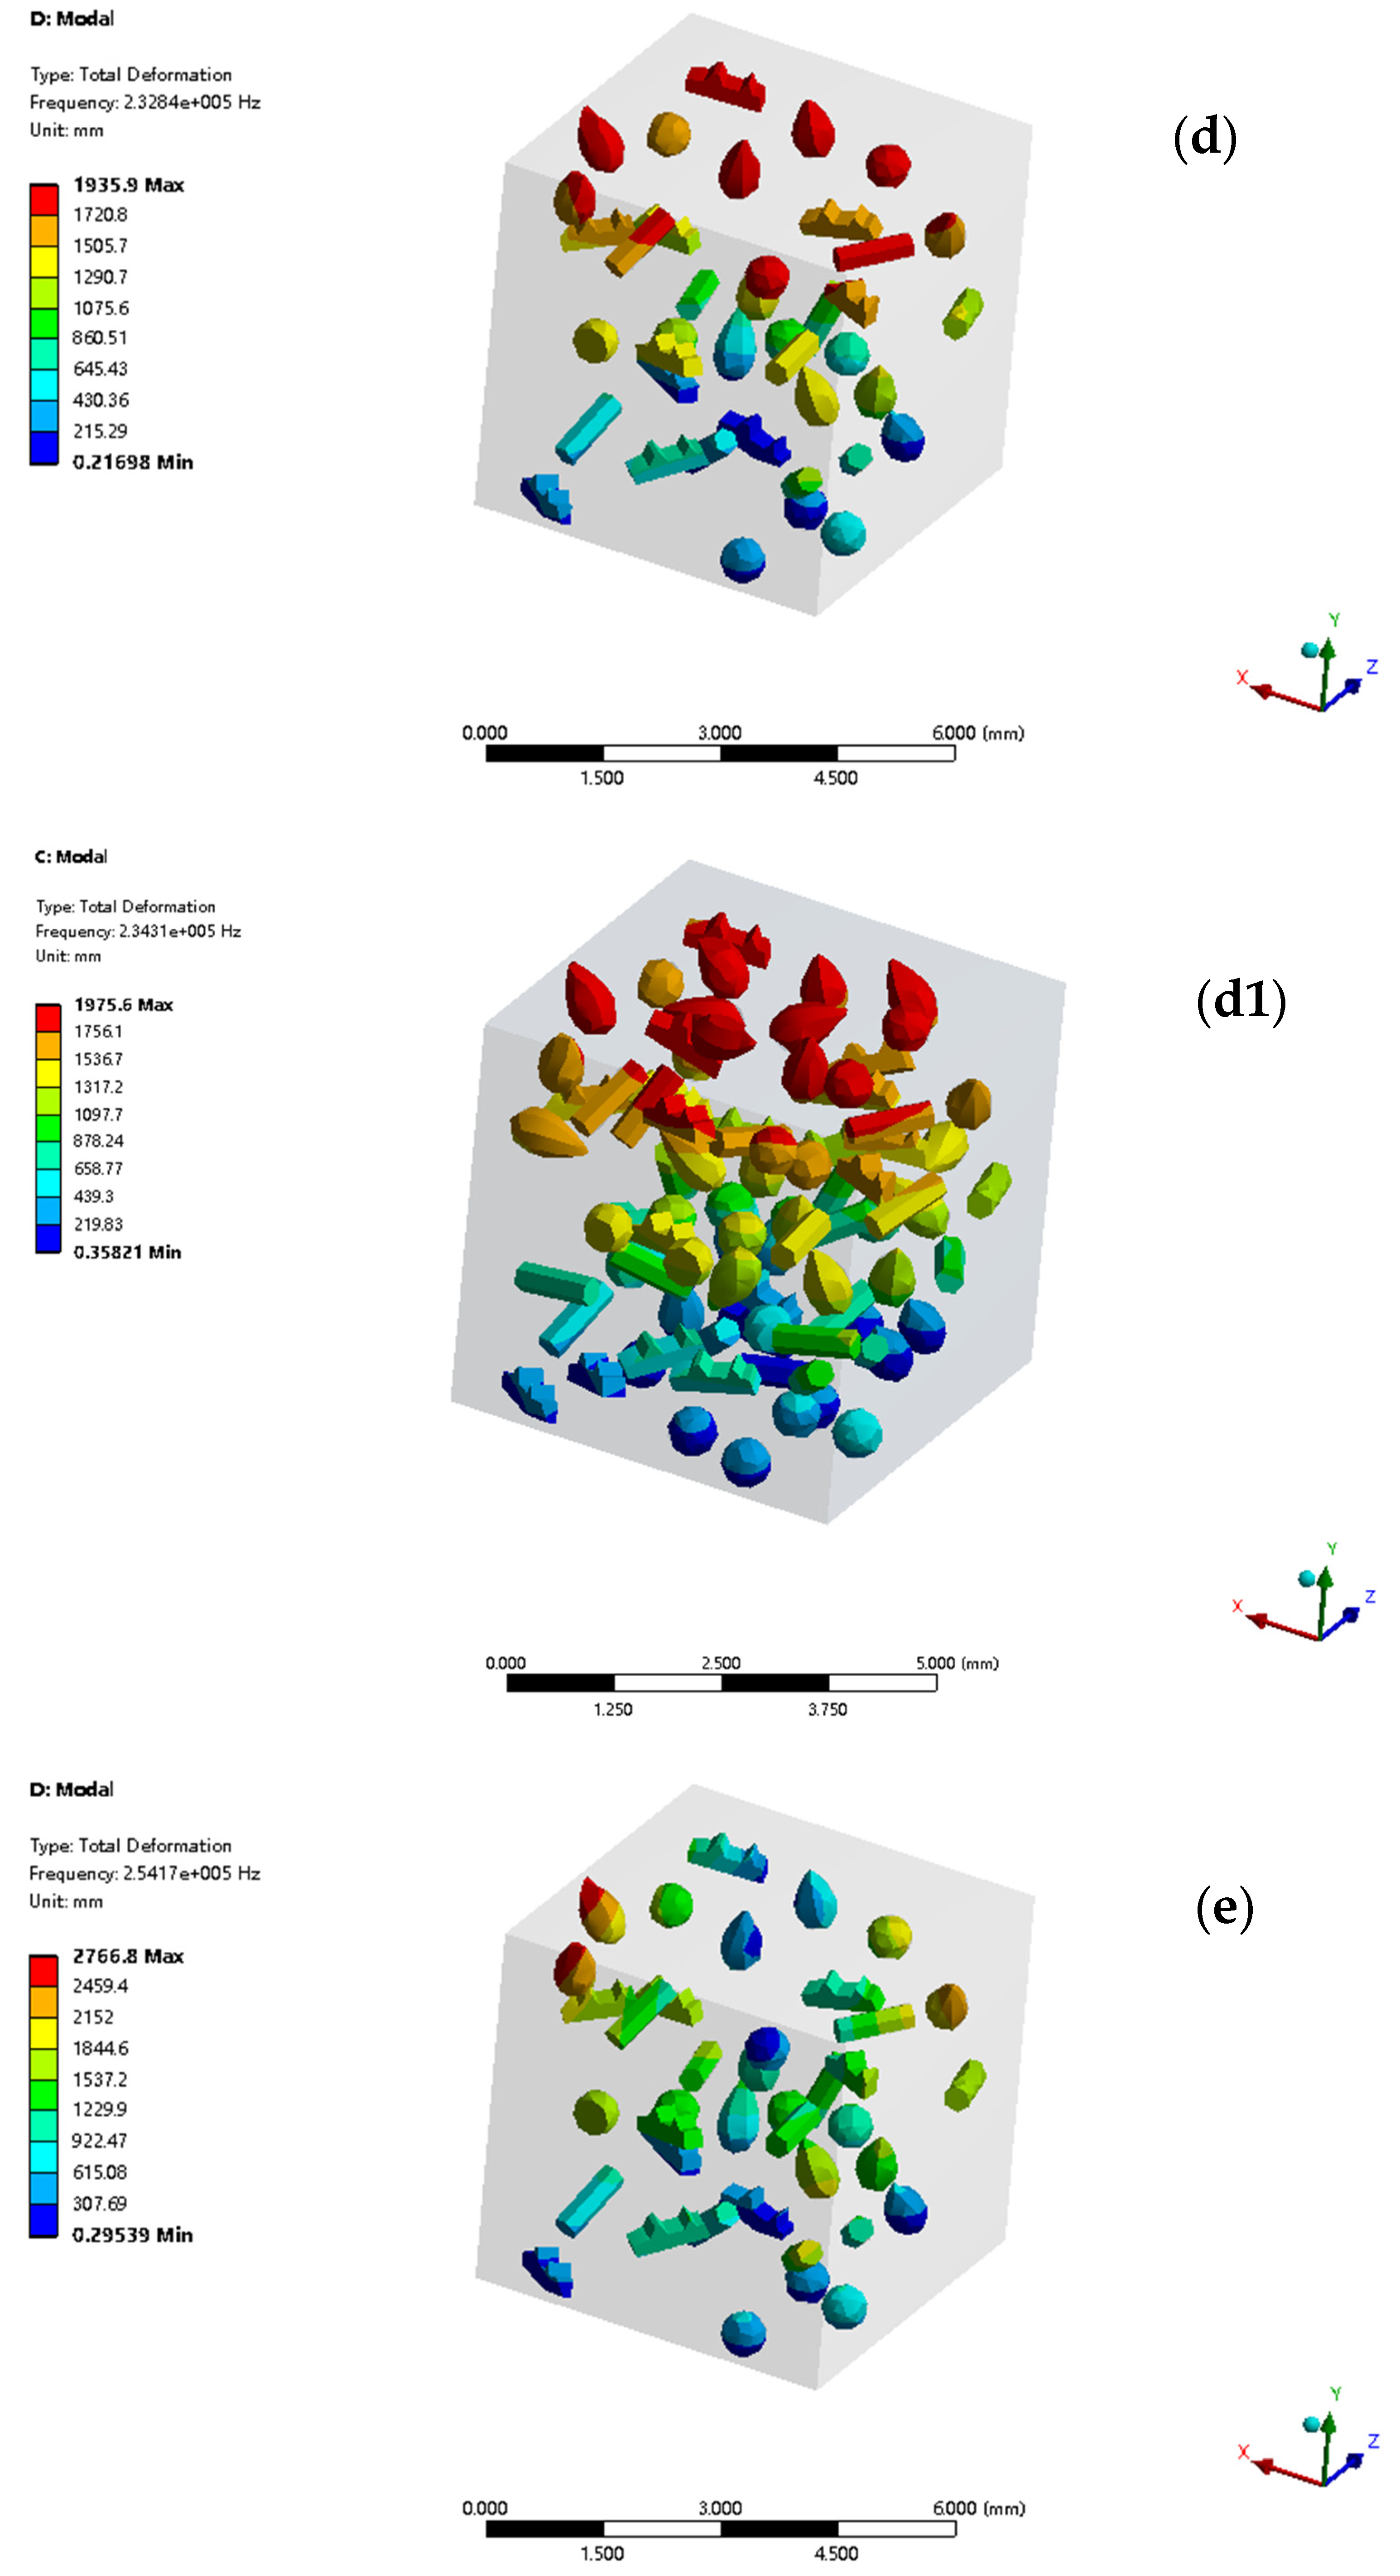
In the fourth-order local mode, TMC1’s frequency is 2.3284 × 10⁵ Hz. Its vibration mode has intense multi-part deformation and energy concentration, with a 1935.9-mm max displacement, indicating microstructure-related issues. TMC2, at 2.3431 × 10⁵ Hz, has a vibration mode with good deformation synergy and a 1756.1 mm max displacement. Its uniform structure aids energy transfer and dissipation, maintaining local stability and boosting overall performance with its tensile property advantages.
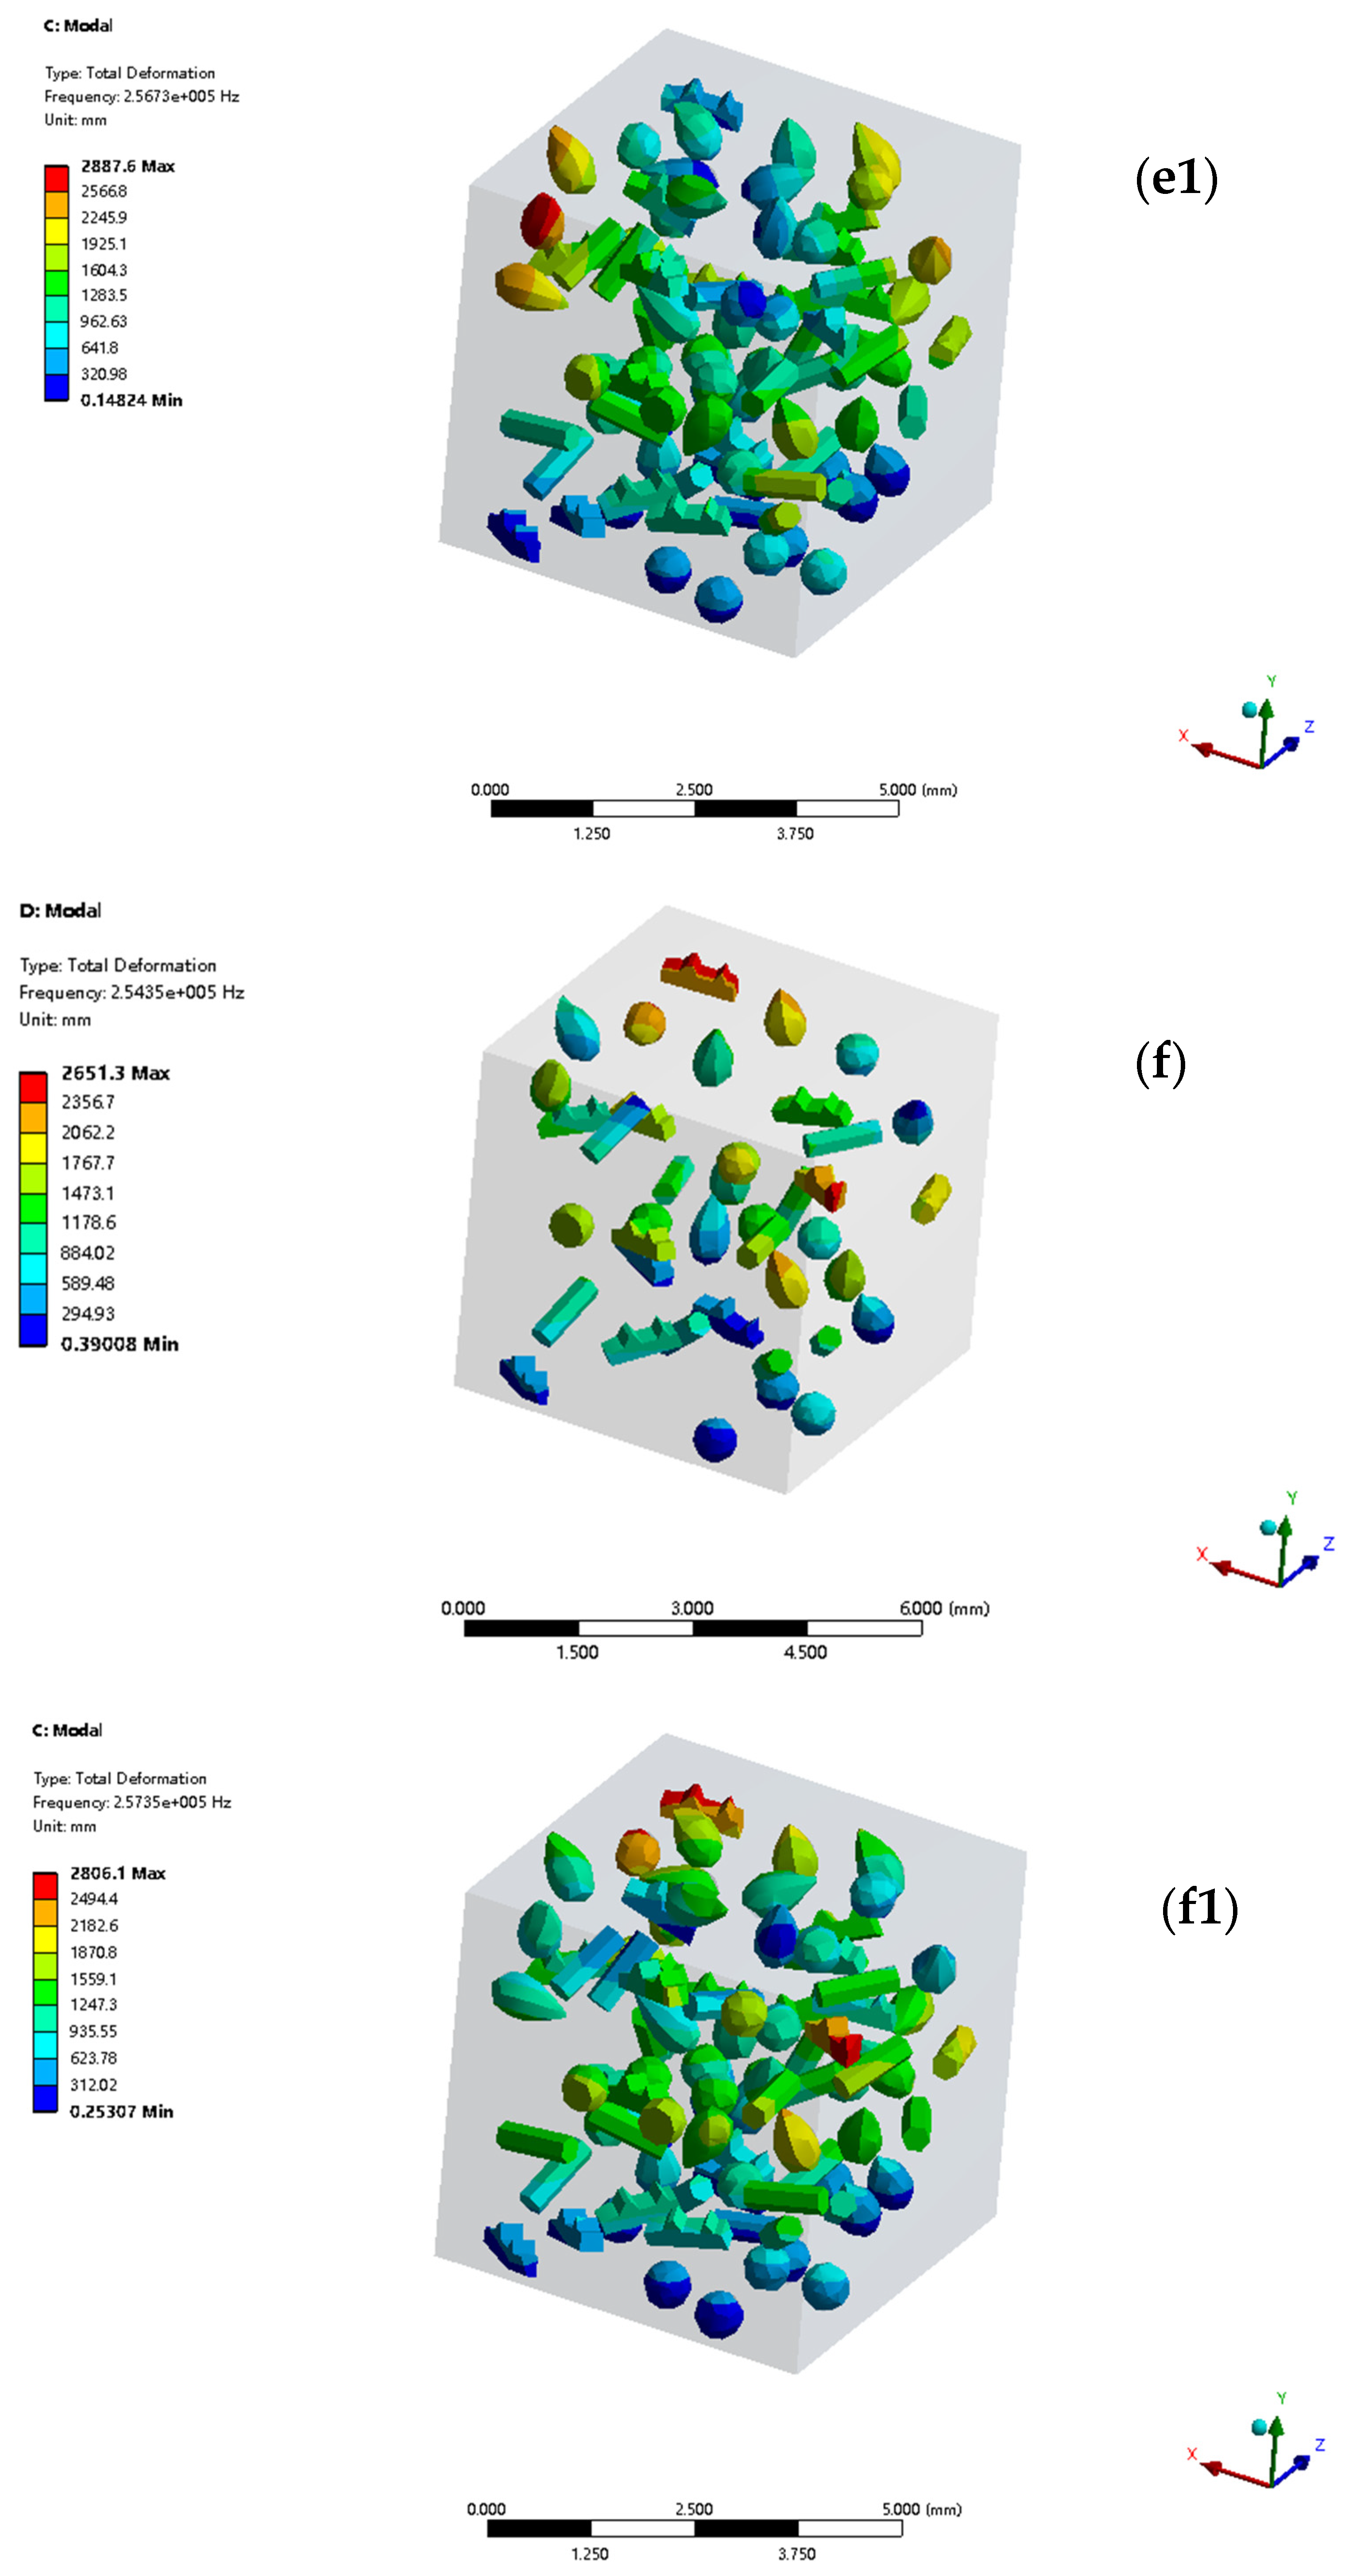
In the fifth-order mode, TMC1 (frequency 2.5417 × 10⁵ Hz) exhibits large local displacement gradients and poor stability, with a 2766.8 mm max displacement. TMC2 (frequency 2.5673 × 10⁵ Hz) features a stable vibration mode, resists high-order stresses, and has a 2887.6 mm max displacement. TMC2’s optimized microstructure, maintaining performance in late-stage tension, shows clear high-order mode advantages and complex condition potential.
In the sixth-order mode, TMC1 with a frequency of 2.5435 × 10⁵ Hz has severe local stress concentration and faces failure. TMC2, at 2.5735 × 10⁵ Hz, has a regular vibration mode and a maximum displacement of 2806.1 mm. Its microstructure suppresses vibration-induced damage in high-order modes, ensures performance, and collaborates with overall modal and tensile properties to enhance serviceability, providing a basis for material design and application.
First- to sixth-order local modal simulations show that TMC1, with non-uniform reinforcing phase distribution, has severe deformation, stress concentration, and large displacement problems. Conversely, TMC2, featuring uniform reinforcing phase distribution and refined grains, has better modal performance, higher stability, and potential for complex condition applications.


