Abstract
In aerospace applications, titanium matrix composites (TMCs) must balance high strength, thermal stability, and vibration resistance. This study investigates the microstructural evolution and multi-property correlations in single-phase ZrC-reinforced (TMC1) and dual-phase ZrC-NbC-co-reinforced (TMC2) TMCs via SEM/TEM, XRD, tensile testing, and ANSYS simulations. The in situ reaction (Ti + ZrC/NbC → TiC + Zr/Nb) and NbC-induced grain boundary pinning drive microstructural optimization in TMC2, achieving 30% higher reinforcement homogeneity and 5 μm grain refinement from 15 μm to 10 μm. TMC2’s tensile strength reaches 1210 MPa, a 15% increase over TMC1, with an elongation at a break of 4.74%, 2.2 times that of TMC1. This performance stems from synergistic Hall–Petch strengthening and nano-TiC dispersion strengthening. Modal simulations show TMC2 exhibits a first-mode natural frequency of 98.5 kHz, 1.1% higher than TMC1’s 97.4 kHz, with maximum displacement reduced by 2.3%. These improvements correlate with TMC2’s elevated elastic modulus (125 GPa vs. 110 GPa) and uniform mass/stiffness distribution. The ZrC-NbC synergy establishes a microstructural framework for the concurrent enhancement of static and dynamic properties, offering critical insights for a high-performance TMC design in extreme environments.
1. Introduction
In the ongoing innovation of materials science, particle-reinforced titanium matrix composites, with outstanding comprehensive properties, are crucial in many high-end technology fields [1,2,3]. They are key to industry development [4,5], drawing the interest of global researchers and remaining highly popular [6,7]. Recently, this field has seen fruitful results, especially remarkable progress in single reinforcement phase systems [8,9].
Currently, most research focuses on single reinforcement phase systems. Their reinforcement mechanisms are clear, with fewer variables and lower complexity in composition design and preparation process control. This enables researchers to precisely manipulate the process and optimize material properties [10,11]. Numerous global research teams have conducted extensive systematic studies on diverse single reinforcement phase systems. Notable advancements have been achieved in investigating the relationship between microstructures and properties, and optimizing preparation processes [12,13,14]. These accomplishments have not only enhanced the comprehension of the internal mechanisms within materials but have also promoted innovation in preparation processes. Consequently, the properties of particle-reinforced titanium matrix composites have been improved, establishing a robust basis for their practical applications [8,15,16].
At present, the research on titanium matrix composites with single reinforcement phases, such as those involving SiC and Al2O3 systems, has yielded diverse breakthroughs [17,18]. Researchers accurately regulate the content of the reinforcement phase, refine powder metallurgy and casting processes, and integrate advanced microscopic characterization with mechanical testing to investigate how microstructural evolution impacts the material properties [19]. By meticulously adjusting process parameters, the density of the material rises, internal flaws decline, and the stability and uniformity of properties are enhanced, demonstrating potential applications in aerospace, automotive, and other sectors [20,21].
Notably, ZrC-reinforced titanium matrix composites have achieved remarkable outcomes. Employing interdisciplinary approaches, research teams conduct multi-scale analyses of the microstructure using advanced techniques, thereby elucidating the intrinsic correlations between the microstructure and the properties [22]. In the studies of mechanical properties, in-depth analysis of tensile properties and the establishment of models provide robust theoretical backing for the optimization and application of the materials [23,24].
With the swift progress of modern technology, industries are increasingly demanding materials with more rigorous property requirements. These materials are evolving towards a combination of extreme lightness, extremely high strength, and multifunctional integration [25]. In the aerospace field, aircraft must retain structural integrity under harsh conditions. This calls for materials that are lightweight, possess high strength, and can withstand high temperatures [26,27]. Regarding automotive manufacturing, materials should have high strength, good plasticity, excellent corrosion resistance, and the ability to adapt to complex service environments to achieve energy-saving goals and ensure safety.
Although single reinforcement phase systems have improved material properties to some degree, their limitations are evident. As comprehensive property requirements become more complex, a single reinforcement phase can no longer fully meet these demands.
As a result, composite systems with multiple components working synergistically to reinforce materials have become a crucial area of research in materials science. Titanium matrix composites reinforced with ZrC and NbC show great promise. ZrC has a high melting point, high hardness, and excellent chemical stability [28,29]. NbC, on the other hand, provides strength at elevated temperatures and oxidation resistance. The compatibility of the crystal structures of ZrC, NbC, and the titanium matrix enables synergistic effects. ZrC increases the hardness and wear resistance of the composite, while NbC improves its performance at elevated temperatures and optimizes the microstructure [30,31]. When ZrC and NbC are melted at high temperatures, they react to form TiC. This reaction refines the grains, enhances the material’s strength, and improves its overall performance. A large number of theoretical and experimental studies have confirmed this synergistic potential.
However, the research on titanium matrix composites reinforced synergistically by ZrC and NbC is still in its initial stage and faces major challenges. The distribution pattern of ZrC and NbC in the titanium matrix when they act synergistically remains unknown. Moreover, the impact of preparation parameters on microstructure evolution has yet to be explored, yet this knowledge is crucial for optimizing material properties. The synergistic reinforcement mechanism and the quantitative relationship between microstructures and mechanical properties are not well understood, which hinders the precise control of material properties. There is also a shortage of research on service performance; property changes and failure mechanisms under complex conditions have not been studied, threatening the practical applications of these composites.
This study centers on comparing single-phase (ZrC)- and two-phase (ZrC and NbC)-reinforced titanium matrix composites (hereinafter referred to as TMCs, and, regarding the two components, they are named TMC1 and TMC2, respectively). For a long time, the lack of research on the correlations between microstructures, mechanical properties, and modal characteristics in particle-reinforced titanium matrix composites has restricted our understanding. This research aims to fill this gap through experiments and theoretical analysis. It seeks to establish connections among these aspects, improve the relevant theory, and offer a foundation for future research and property adjustment, thereby promoting the development of this composite material.
Our research uses an approach that integrates multiple dimensions and spans different scales. At the micro-level, SEM, TEM, and XRD are utilized to analyze the microstructure. Precision equipment is employed to acquire and analyze tensile data under complex conditions. ANSYS software 2020R1 is used for modal studies to reveal how the microstructure impacts dynamic performance. By combining these methods, a new research paradigm is established, breaking through traditional limitations.
The research findings are highly innovative and significant. They pioneer new perspectives in studying particle-reinforced titanium matrix composites. By revealing previously unknown connections between microstructural features and material performance, these results break through traditional research limitations. This not only enriches materials science theory but also provides a novel basis for material design. The innovative approach used in this research can guide the development of high performance materials, meeting the strict demands of emerging high-end technologies and promoting the progress of related industries.
2. Preparation and Characterization of TMCs
2.1. Experimental Materials
In the construction of the material system for this study, the titanium matrix composites (TMCs) used had primary-grade titanium sponge with a purity of 99.9% as the core of the matrix. Regarding the selection of the reinforcing phases, ZrC and NbC powders were emphasized and introduced. The underlying mechanism is that, in a high-temperature melting environment, Ti atoms react chemically with ZrC and NbC powders following the reaction pathways of Ti + NbC == TiC + Nb (β-phase) and Ti + ZrC == TiC + Zr (α-phase). These reactions promote the formation of TiC. Meanwhile, Zr and Nb elements are incorporated into the matrix structure of the composite material in the forms of α-phase and β-phase, respectively, thus enabling effective regulation of the properties of the titanium alloy.
In this study, titanium sponge with a diameter of approximately 2 mm was selected as the matrix of the composite material, which can provide a stable and high-quality foundation. The ZrC and NbC powders have a purity of 99.9% and a particle size of 1 μm. The characteristics of high purity and small particle size ensure the high efficiency and uniformity of the reaction, laying a foundation for the fine-tuning of the microstructure of the composite material. The SEM morphologies of the ZrC and NbC powders shown in Figure 1 clearly present the particle morphology and size distribution, providing a microscopic basis for exploring their behaviors in the composite material.
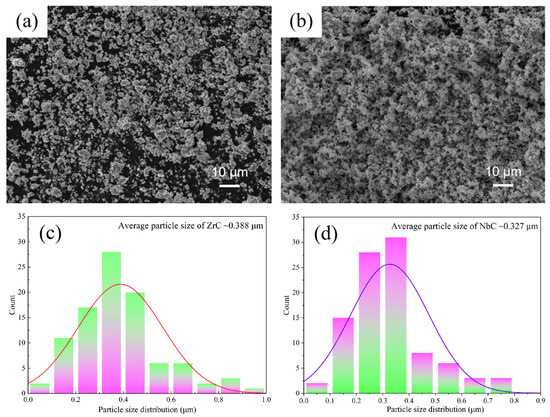
Figure 1.
Morphology and particle-size distribution of ZrC powder (a,c); morphology and particle-size distribution of NbC powder (b,d).
In this study, a QK20-006-type vacuum arc melting furnace (Zhengzhou CY Scientific Instruments Co., Ltd., Zhengzhou, China) was used to prepare two types of titanium matrix composites, TMC1 and TMC2, through in situ reaction preparation technology (among them, TMC1 is a pure titanium-based composite containing 5 wt% ZrC, and TMC2 is a pure titanium-based composite containing 5 wt% ZrC and 6 wt% NbC). Primary-grade titanium sponge with a purity of 99.9% was selected as the matrix, and the ZrC and NbC powders also had a purity of 99.9% with a particle size of 1 μm.
Prior to the experiment, all raw materials, including top-quality titanium sponge, highly pure ZrC and NbC powders, underwent ultrasonic cleaning and drying. This removed surface impurities and moisture, maintaining the high purity of the materials. Two types of (NbC + ZrC)/Ti composites were designed: (0NbC + 5ZrC)/Ti and (6NbC + 5ZrC)/Ti. Here, (0NbC + 5ZrC)/Ti represents the composite with only 5 wt% ZrC as the reinforcement, while (6NbC + 5ZrC)/Ti represents the composite containing 5 wt% ZrC and 6 wt% NbC. According to these designed formulas, 80 g of raw material was precisely weighed and placed in a copper crucible with a 5 × 10⁻⁴ Pa vacuum. Argon gas was introduced to prevent oxidation during melting.
During the melting process, a 50 A current melted the raw materials. The electromagnetic stirring system was activated, with the stirring current set to 5 V and the voltage to 30 A. The adjustable stirring current ensured a homogeneous ingot composition. Post-melting, the ingot was quickly cooled by circulating water around the copper crucible. The sample was then flipped and remelted four times to improve compositional uniformity, supplying a reliable specimen for subsequent performance tests and microstructure analysis.
2.2. Micro-Morphological Analysis and Performance Testing
- (1)
- Scanning Electron Microscopy (SEM) Analysis
To examine the microstructures of composite specimens with varying amounts of reinforcing phases, a field-emission scanning electron microscope (SEM, TESCAN VEGA II-XMU, Brno, Czech Republic) equipped with an energy dispersive spectroscopy (EDS) system was employed for observation and image acquisition. First, a cubic specimen with an 8-millimeter side length and a smooth surface was obtained via wire cutting. Subsequently, the specimen underwent grinding, polishing, and etching processes. Thereafter, it was analyzed under SEM.
- (2)
- Transmission Electron Microscopy (TEM) Analysis
High-resolution transmission electron microscopy (TEM) observations of the specimens were conducted using a Bruker XFlash 5030 microscope (Berlin, Germany). Initially, a thin slice measuring 50 mm in length, 50 mm in width, and 0.5 mm in thickness was cut by wire cutting. Then, the slice was ground with water abrasive paper until its thickness reached 40 to 60 μm. Finally, an ion thinning instrument (691_*0306184001) was utilized to prepare a standard TEM specimen for subsequent analysis
- (3)
- X-ray Phase Analysis
An X-ray diffractometer (Bruker D8 DISCOVER A25, Berlin, Germany) analyzed the specimens’ phase compositions. The operating conditions were 40 kV voltage, 30 mA current, a 30°~80° scanning range, a 4°/min scanning rate, and a 0.02° step size. Each specimen was tested three times under identical conditions. Phase analysis results were compared to ensure experimental accuracy.
- (4)
- Tensile Property Testing
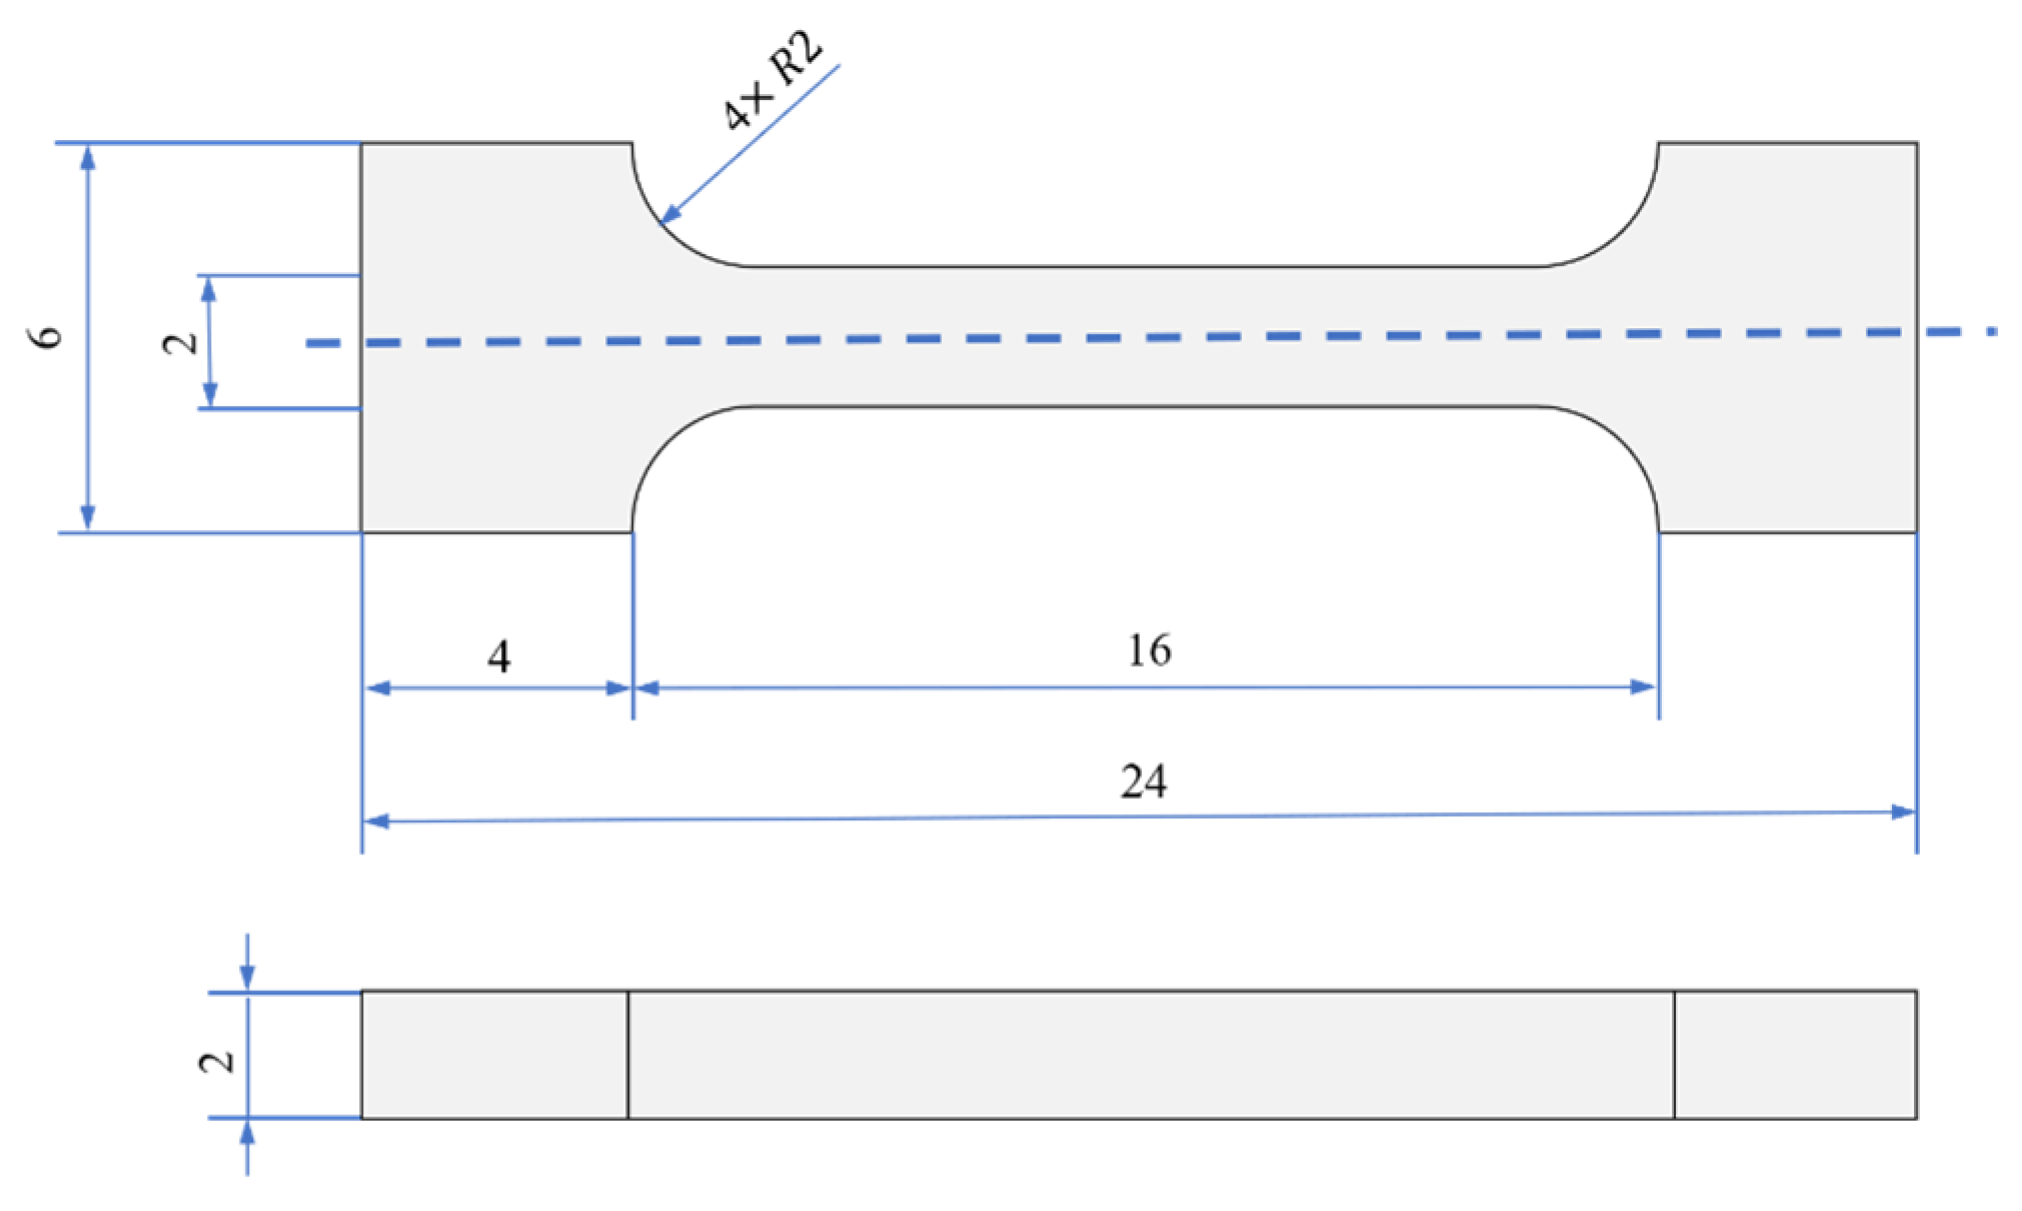
A CMT5105 universal tensile tester measured specimens’ tensile properties at room temperature. The tensile rate was 1 mm/min. For each condition, five samples were cut into thin slices as shown in Figure 2. They were sand-polished to reduce stress concentration. Tensile tests were conducted, and average values were recorded.
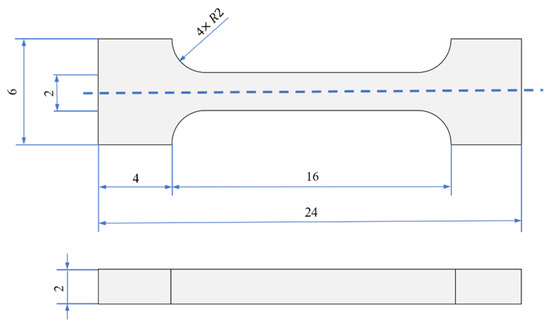
Figure 2.
Tensile specimens: front and left views with dimensions and shape details (all units are in mm).
2.3. Ansys Modal Simulation
In geometric modeling, the 5% ZrC-reinforced titanium alloy specimen measured 50 mm in length and 10 mm in diameter, with the 5% ZrC-6% NbC-reinforced one having similar dimensions. The model precisely portrayed the contour and microstructure. Tetrahedral meshing was chosen after multiple tests. Ansys modal simulation was based on the finite element theory. The model was discretized into multiple elements, and the modal characteristics were obtained by solving the dynamic equations. The input parameters of the simulation included the geometric model, the results of the meshing, and the above-mentioned material parameters. The output parameters were the results data such as the modal frequencies of each order and the mode shapes, which were presented in the form of nephograms.
For the 5% ZrC-reinforced alloy, the initial mesh size was 0.8 mm, refined to 0.2 mm in key areas like reinforcing-phase particles and grain boundaries. For the 5% ZrC-6% NbC-reinforced alloy, the initial size was 0.6 mm, refined to 0.15 mm in special zones for accuracy. In order to ensure the rationality and accuracy of the mesh generation, mesh convergence tests were carried out. During the tests, the mesh size was gradually reduced while monitoring the changes in modal frequencies and mode shapes. For TMC1, when the mesh size was refined from 0.8 mm to 0.2 mm, the change in modal frequencies was less than 1%, and the mode shapes remained stable. Similarly, for TMC2, as the mesh size decreased from 0.6 mm to 0.15 mm, the modal frequency change was also less than 1%, and no significant changes were observed in the mode shapes. This indicates that the currently selected mesh sizes can meet the calculation accuracy requirements and achieve mesh convergence.
Material parameters were experimentally determined. In this study, a linear elastic material model was adopted to describe the material properties of TMC1 and TMC2. This model was based on experimental data and can accurately reflect the mechanical behavior of the materials during the elastic deformation stage. The 5% ZrC-reinforced alloy had an elastic modulus of 110 GPa, Poisson’s ratio of 0.34, and density of 4.5 g/cm3. For the 5% ZrC-6% NbC-reinforced alloy, with NbC added, the elastic modulus was 125 GPa, Poisson’s ratio was 0.32, and density was 4.6 g/cm3. The Lanczos method in the mechanical module extracted the 6-order mode results. In terms of boundary conditions, one end of the model was fully fixed in the simulation to mimic the clamping state of the specimens during actual tests. This ensured that the simulation results could truly reflect the mechanical response of the materials under load. To explore the mechanical behavior under extreme conditions, the geometric model used in the simulation was a scaled-up version of the actual specimen. The scaling factor of 120 was applied, meaning that the simulated dimensions were 120 times the physical size of the experimental samples described above. Nephograms displayed vibration modes, aiding the analysis of microstructure-induced modal effects.
Furthermore, to simplify the meshing process and three-dimensional stress analysis in the finite-element model, the cylindrical shape of the experimental specimens was approximated as a cube with equivalent volume. This geometric transformation, widely adopted in material simulation, ensured that key mechanical properties and boundary conditions remained consistent during the simulation process.
3. Results
3.1. Microstructural Analysis
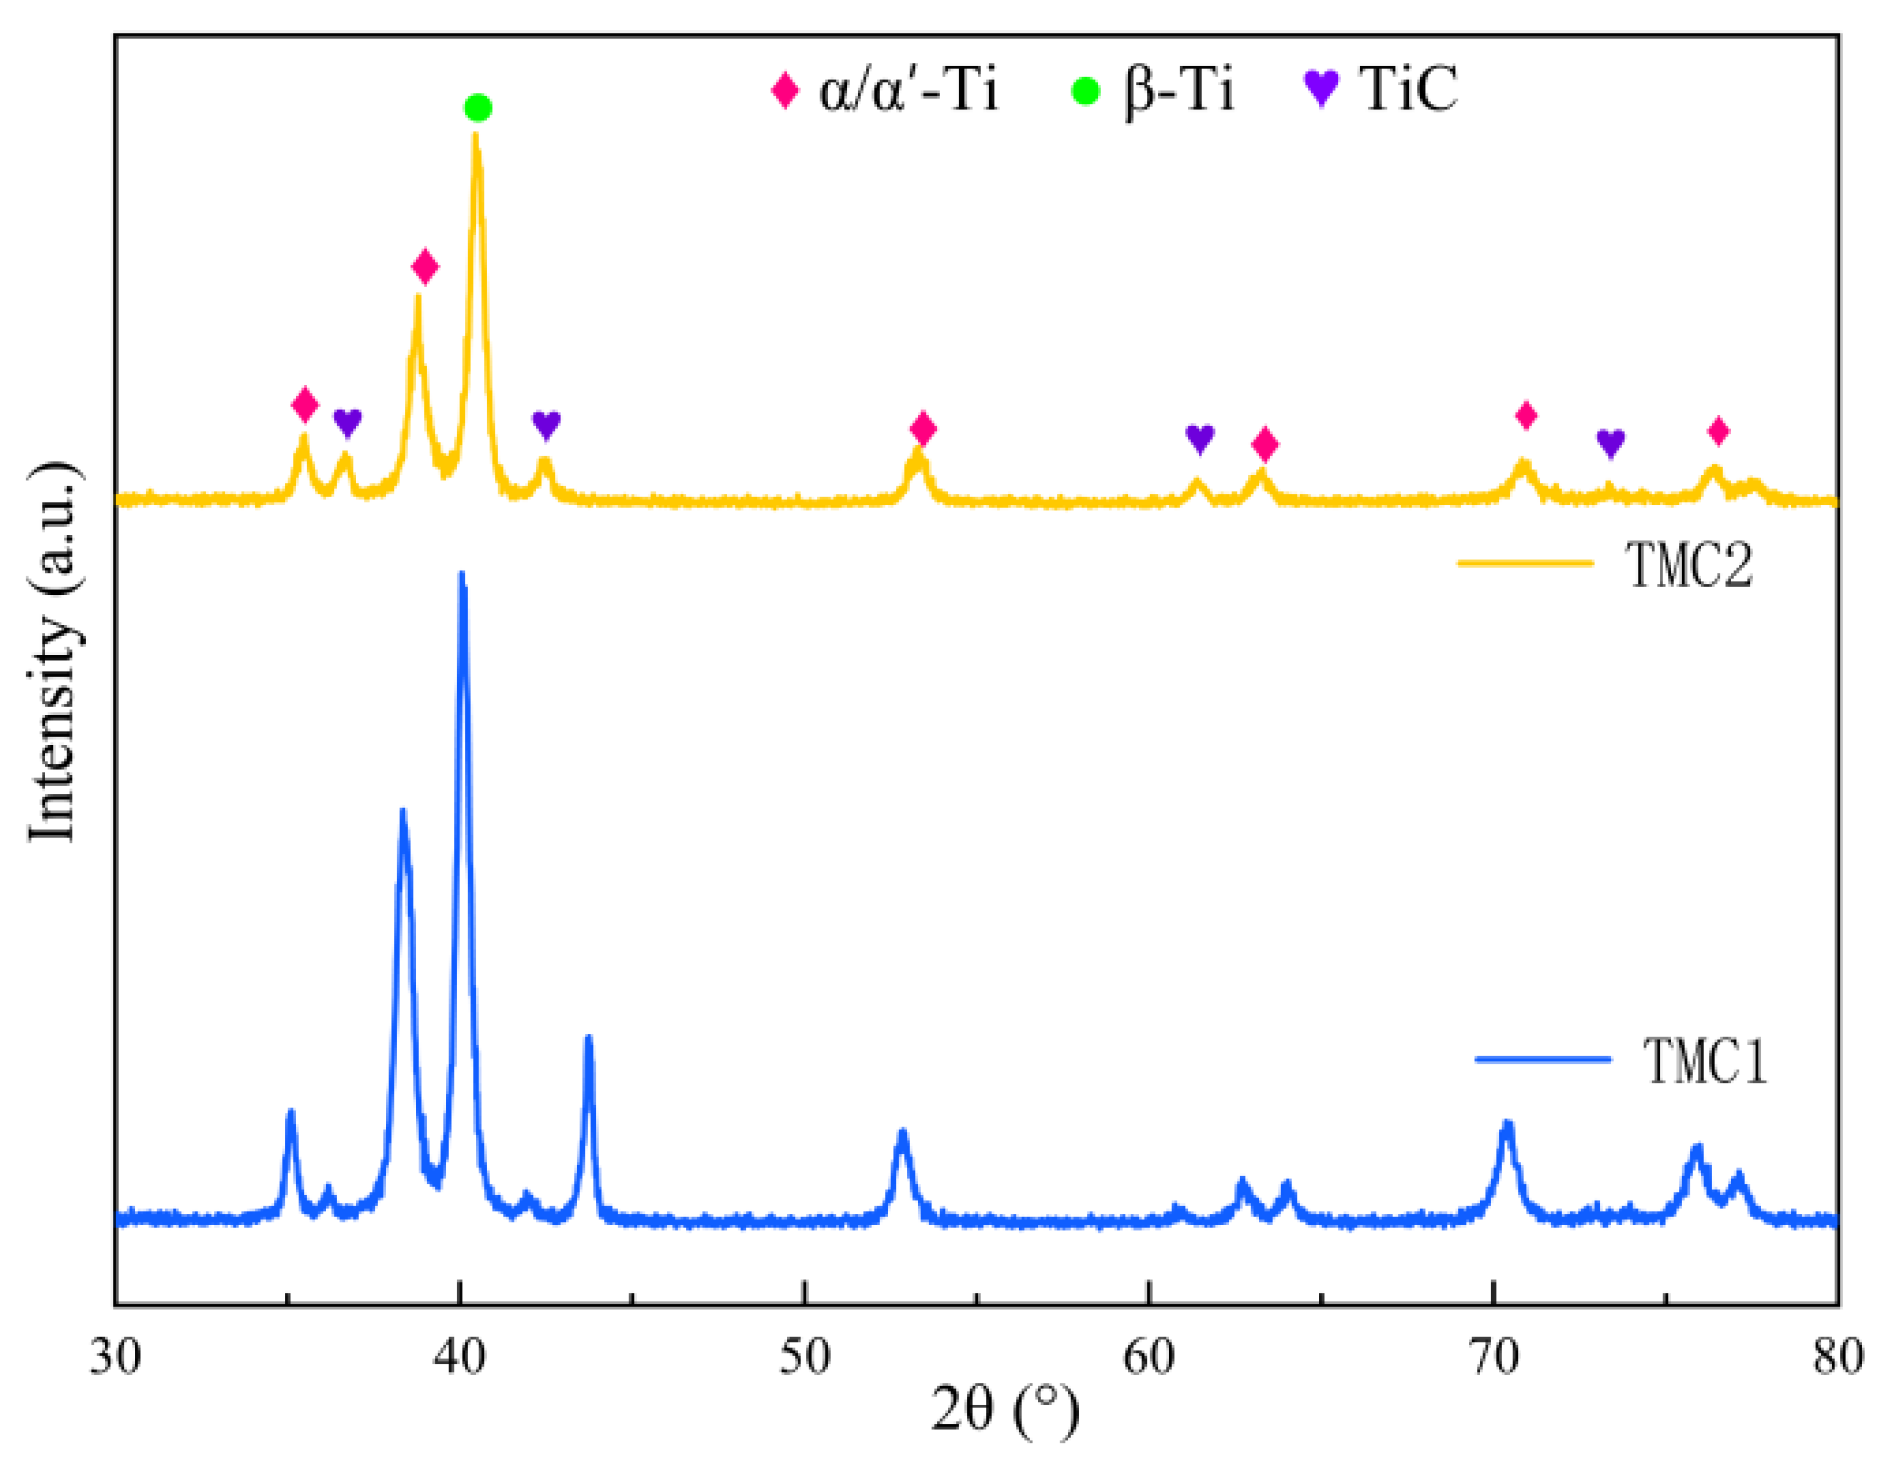
Figure 3 shows the XRD patterns of TMC1 and TMC2, indicating the presence of α/α’-Ti, TiC, and β-Ti phases in both. The addition of NbC in TMC2 modifies its phase structure, resulting in distinct diffraction peak differences. This reflects TMC2’s optimized microstructure, providing a phase composition basis for explaining its performance advantages and being crucial for studying composite material properties.
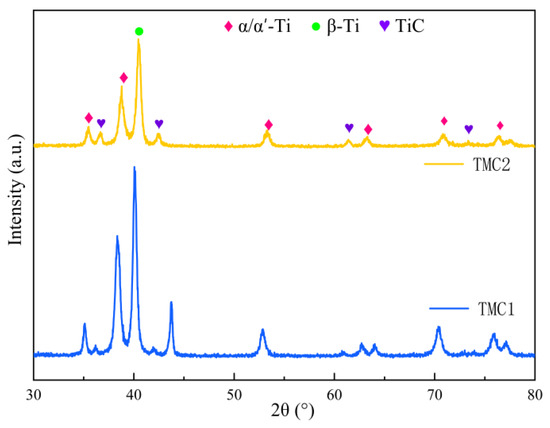
Figure 3.
XRD patterns of TMC1 and TMC2.
Figure 4 comprehensively demonstrates the results of multiple microstructural characterizations of TMC1 and TMC2. These results are of great significance for deeply understanding the microstructural differences between the two composites and their impacts on the properties.
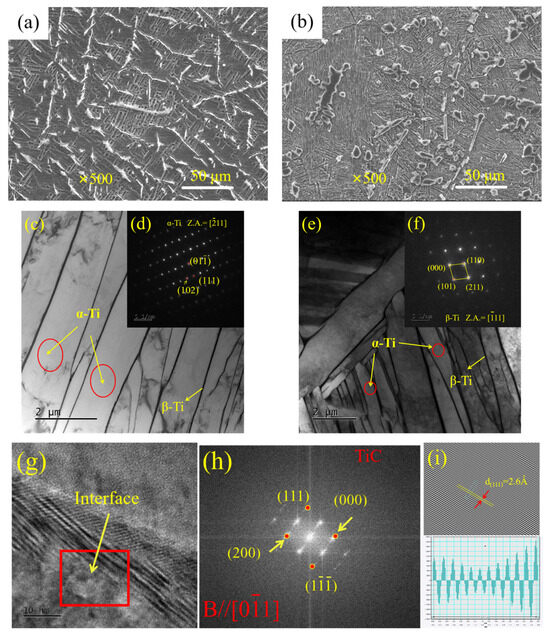
Figure 4.
The microstructure characteristics being observed by SEM of TMC1 (a) and TMC2 (b); the TEM microstructures of α and β phases in (a,c); the TEM microstructures of α and β phases in (b,e); the diffraction patterns corresponding to the α-phase and β-phase (d,f); TEM characterization of interface between TiC phase and matrix; (g) HRTEM; (h) FFT transformation corresponding to transition region; (i) inverse Fourier transform and atomic spacing.
As shown in the SEM microstructural images Figure 4a,b, TMC1 and TMC2 display significant differences in reinforcing phase distribution. In 5% ZrC-doped TMC1, ZrC particles are non-uniformly distributed with local aggregation. This reduces the reinforcing phase uniformity and causes severe stress concentration, which, according to stress concentration theory, negatively impacts the material’s mechanical properties.
In contrast, in 5% ZrC-6% NbC-doped TMC2, ZrC and NbC particles are uniformly and synergistically distributed. This uniform distribution mainly benefits from a series of physical and chemical reactions of the reinforcing phases during the high-temperature melting process. The carbon in the reinforcing phases reacts in situ with the titanium matrix to form titanium carbide. During this process, some zirconium and niobium elements are incorporated into the matrix, changing the distribution and quantity of α-Ti and β-Ti. Meanwhile, the niobium elements incorporated into the matrix induce grain boundary pinning, refining the grains. The refined grain structure creates more favorable conditions for the uniform distribution of the reinforcing phases, effectively hindering their agglomeration and thus achieving the uniform distribution of the reinforcing phases in TMC2. The reinforcing-phase uniformity in TMC2 is about 30% higher than that in TMC1. Although the difference in particle distribution in TMC2 may not be very obvious in the SEM images, considering the overall microstructure changes, such as the refinement of the average grain size from 15 μm in TMC1 to 10 μm in TMC2 due to the addition of NbC, this difference is significant and has a positive impact on material properties.
This uniform distribution effectively alleviates stress concentration and enhances the stability of mechanical properties, ensuring the material’s reliability in practical applications.
Figure 4c,e show the TEM microstructures of the α and β phases in TMC1 and TMC2. Clearly, TMC2 has a finer microstructure after adding NbC. TEM and X-ray diffraction analyses indicate that the 5% ZrC composite has a relatively large grain size, while NbC addition in the 5% ZrC-6% NbC-doped composite strongly inhibits grain growth.
The linear intercept method was used to measure the average grain size. Multiple line segments were randomly drawn on TEM micrographs, and the number of grain boundary intersections (L) and total line segment length (N) were counted to calculate the average grain size (d) with the formula . After measuring multiple samples in at least 10 fields of view, the average grain size of the 5% ZrC composite was 15 μm, and that of the 5% ZrC-6% NbC-doped composite was 10 μm.
Based on the Hall–Petch relationship (), where represents the yield strength of the material, which is the stress at which the material begins to undergo plastic deformation. is the friction stress of the material, reflecting the resistance of the crystal lattice to slip deformation. is the Hall–Petch constant, a parameter closely related to material properties. And d is the average grain size of the material. In this study, the average grain size of TMC1 is 15 μm, while that of TMC2 is 10 μm. TMC2’s smaller grains increase the grain boundary area. As grain boundaries can hinder dislocation movement, TMC2 has a strength advantage.
Figure 4d,f present the diffraction patterns of the α and β phases, respectively. These patterns provide crucial information for studying the material’s phase structure and contribute to the analysis of the internal crystal structure characteristics of the material. From the perspective of transmission electron microscopy (TEM) observation, the diffraction patterns of the α and β phases are closely related to the microstructural characteristics. The regularity and symmetry of the diffraction spots or patterns obtained by selected area electron diffraction (SAED) directly reflect the integrity of the crystal structure. In TMC2, the diffraction spots of the α and β phases are clear and regular, indicating that there are fewer defects such as dislocations and stacking faults within the crystal, and the degree of lattice distortion is low, which is consistent with the uniform and fine grain structure shown in the high-resolution TEM images. At the same time, the continuity and clarity of the diffraction rings can assist in judging the distribution of grain orientations. The continuous and fine diffraction rings in TMC2 mean that the grain orientations are relatively random, effectively avoiding the anisotropic defects caused by preferred orientations and enhancing the stability of the overall properties of the material. These diffraction analysis results based on TEM provide important evidence for the microstructural advantages of TMC2 from the crystallographic perspective, further explaining the essential reasons for the improvement of its properties.
Figure 4g–i show the TEM characterization results of the interface between the TiC phase and the matrix. Among them, Figure 4g is a high-resolution transmission electron microscopy (HRTEM) image, which clearly reveals that the interface between titanium carbide and the matrix in TMC2 is well bonded, and no other phases are formed. This is of great significance for improving the material’s performance.
In summary, Figure 4 indicates that TMC2 exhibits advantages in its microstructure, including a uniform distribution of reinforcing phases, fine grains, and a well-bonded interface between the TiC phase and the matrix.
3.2. Tensile Property Analysis
The tensile properties of materials are of great significance in practical applications and are closely related to the microstructure. Exploring the mechanisms of the differences in the tensile properties of TMC1 and TMC2 is crucial for the optimized design of high-performance titanium matrix composites.
According to the Hall–Petch formula, grain refinement increases the grain boundary area. Grain boundaries can impede the movement of dislocations, thus enhancing the material’s strength. Figure 5 shows the tensile stress-strain curves of TMC1 and TMC2 samples. It can be seen that: In TMC2, the addition of NbC refines the grains, increases the grain boundary area, and enhances the strength. Meanwhile, according to Taylor’s formula , where is the shear stress of the material, reflecting its resistance to shear deformation; is a constant related to the crystal structure of the material, typically ranging from 0.3 to 0.5, characterizing the strength of dislocation interactions; G is the shear modulus of the material, an inherent property indicating its ability to resist elastic shear deformation; b is the magnitude of the Burgers vector, representing the lattice distortion caused by dislocations; and is the dislocation density, defined as the total length of dislocation lines per unit volume. In TMC2, the refined grains lead to dislocation multiplication, increasing the dislocation density . As a result, according to Taylor’s formula, the shear stress increases, further strengthening the material.
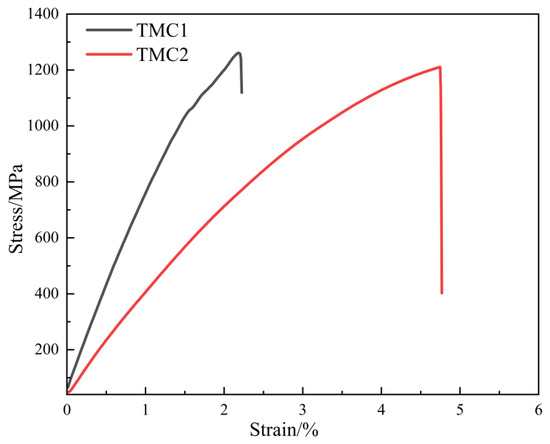
Figure 5.
Tensile stress–strain curves of TMC1 and TMC2.
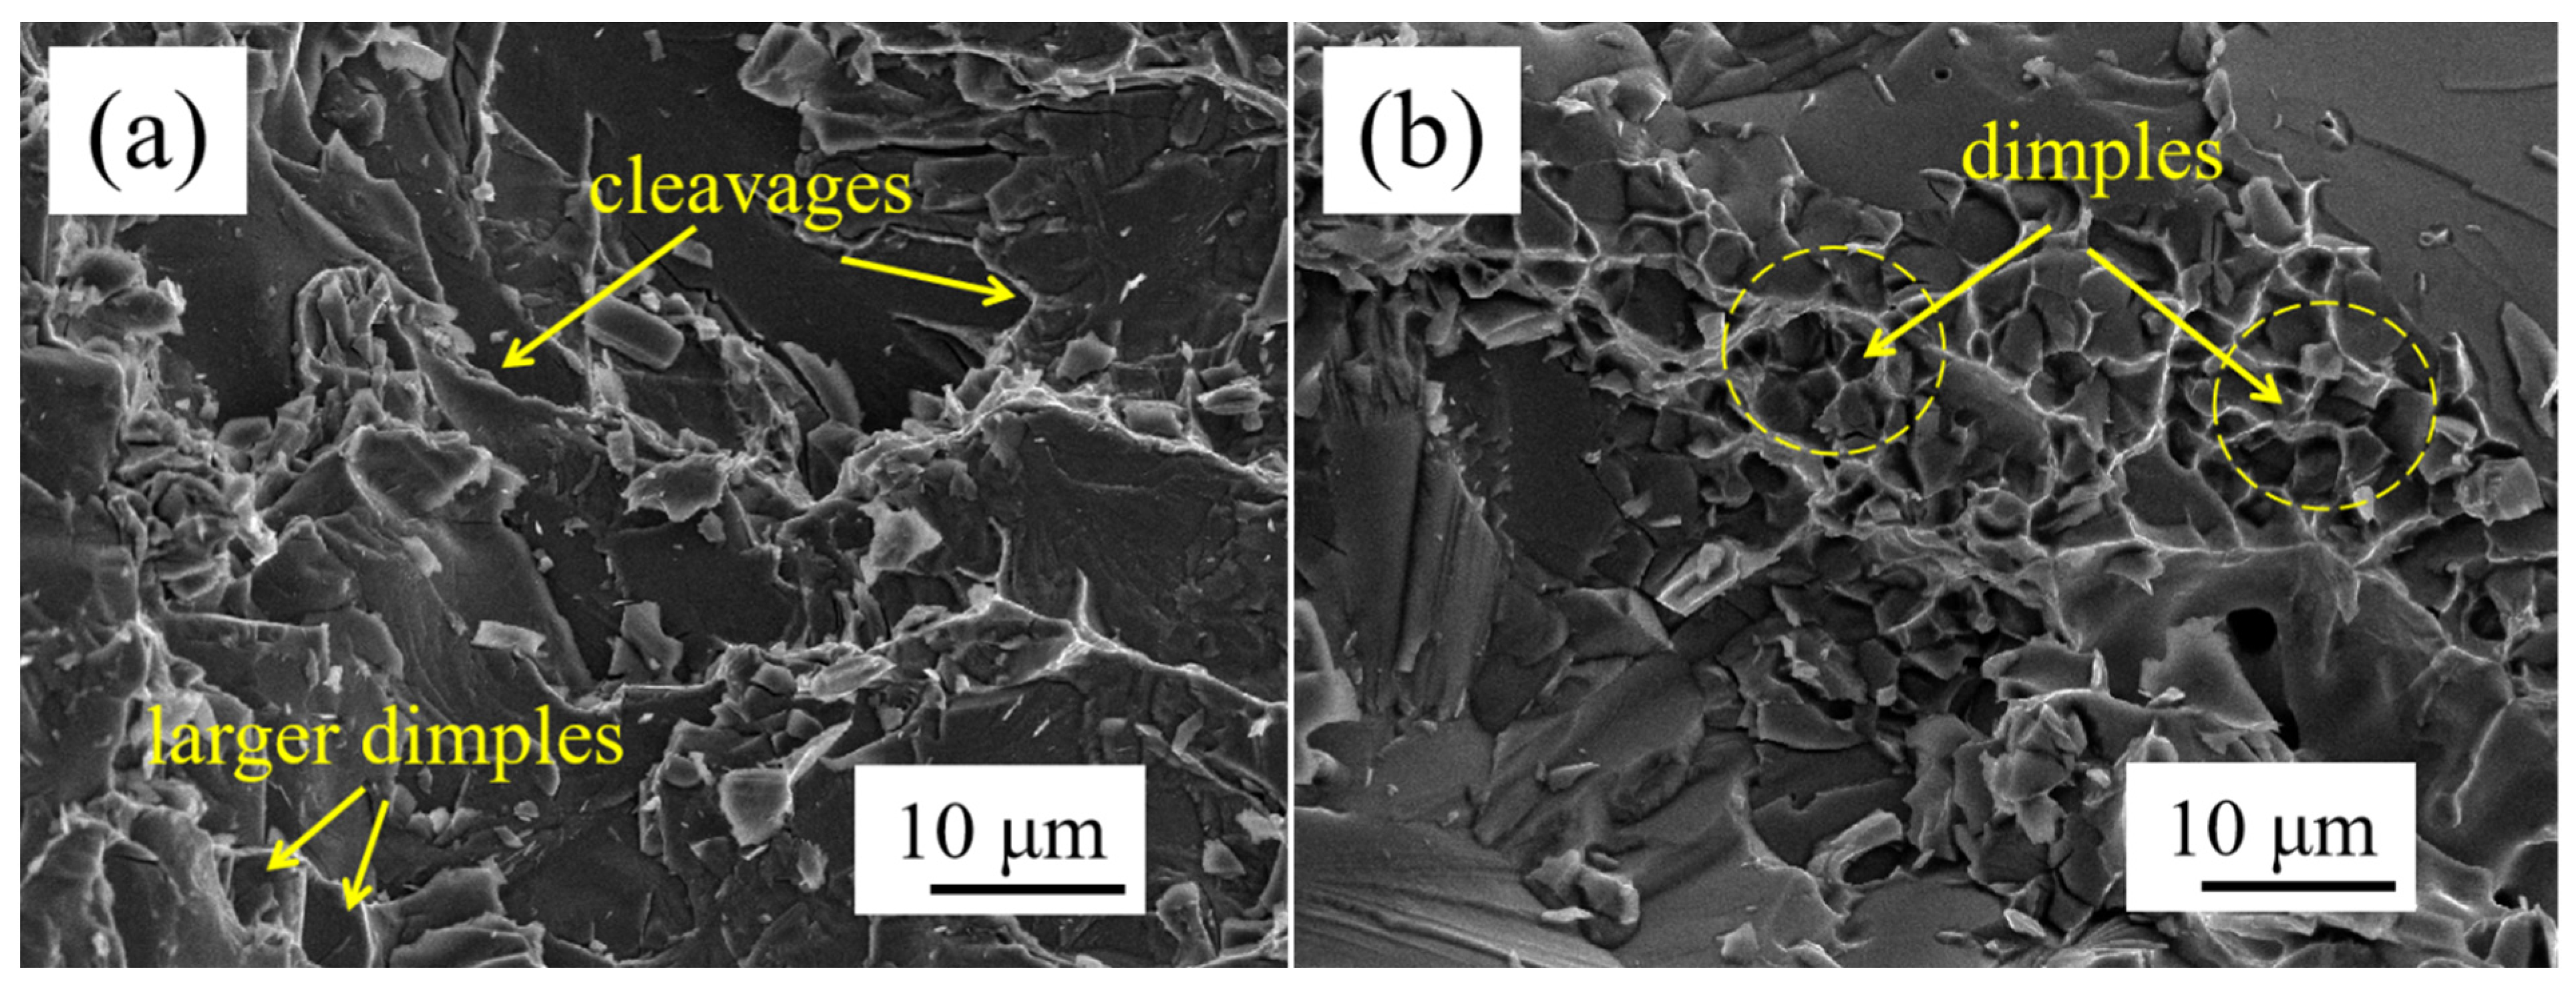
The distribution of the reinforcement phase has a significant impact on the tensile properties. In TMC1, the ZrC particles are locally aggregated (as shown in Figure 6a). According to the stress concentration factor formula , this increases the stress concentration. Reflected in the tensile fracture morphology (see Figure 6a), the fracture of TMC1 has obvious tear ribs and large ligament fossae, and the sizes and depths of the ligament fossae in the reinforcement aggregation area are uneven, resulting in a reduction in the material’s strength and plasticity. Its tensile strength is 1259 MPa. In contrast, in TMC2, the ZrC and NbC particles are uniformly distributed (as shown in Figure 6b), which can suppress crack initiation. From the tensile fracture morphology (see Figure 6b), the fracture of TMC2 has fine and uniform ligament fossae and few tear ribs. The tensile strength of TMC2 is 1210 MPa. Although it is slightly lower than that of TMC1, the elongation increases significantly from 2.2% of TMC1 to 4.74%.
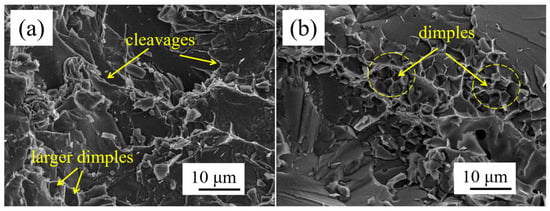
Figure 6.
Compression fracture morphology of TMCs with different NbC additions: (a) 0 wt% NbC; (b) 6wt% NbC).
Halpin–Tsai equation analysis shows that the reinforcement phase’s uniform distribution is crucial for better material performance. TMC1’s non-uniform reinforcement distribution leads to stress concentration. According to the stress intensity factor formula , here, Y is a dimensionless shape factor. Its value is determined by factors such as crack geometry, loading mode, and specimen size, and it is used to measure the influence of crack-related geometric features on the stress field intensity at the crack tip. In TMC1, the non-uniform distribution of the reinforcement phase is equivalent to increasing the effective crack length and changing the value of Y, thus making cracks more likely to initiate. It is like increasing the effective crack length, making cracks easier to start. The fracture in Figure 6a has large irregular dimples due to severe local plastic deformation in stress-concentrated areas.
In TMC2, the uniformly distributed reinforcement phases disperse stress. From the strain energy release rate formula , is related to the material’s elastic properties, associated with the material’s elastic modulus and Poisson’s ratio. In TMC2, the uniform distribution of the reinforcement phase effectively disperses stress, reducing the local strain energy release rate. Since the strain energy release rate is related to the driving force for crack propagation, a decrease in its value inhibits crack growth. This reduces the local strain energy release rate, curbing crack growth. The fracture in Figure 6b has fine uniform dimples, indicating a stable and ductile fracture. So, TMC2’s optimized reinforcement distribution enhances crack resistance and overall tensile properties.
In summary, although the tensile strength of TMC2 is slightly reduced, due to grain refinement, uniform reinforcement distribution, and good interfacial bonding, its comprehensive properties are significantly improved, providing important reference for the design of high-performance titanium matrix composites.
3.3. Analysis of Modal Simulation Results
- (1)
- First- to sixth-order analyses of global modal characteristics
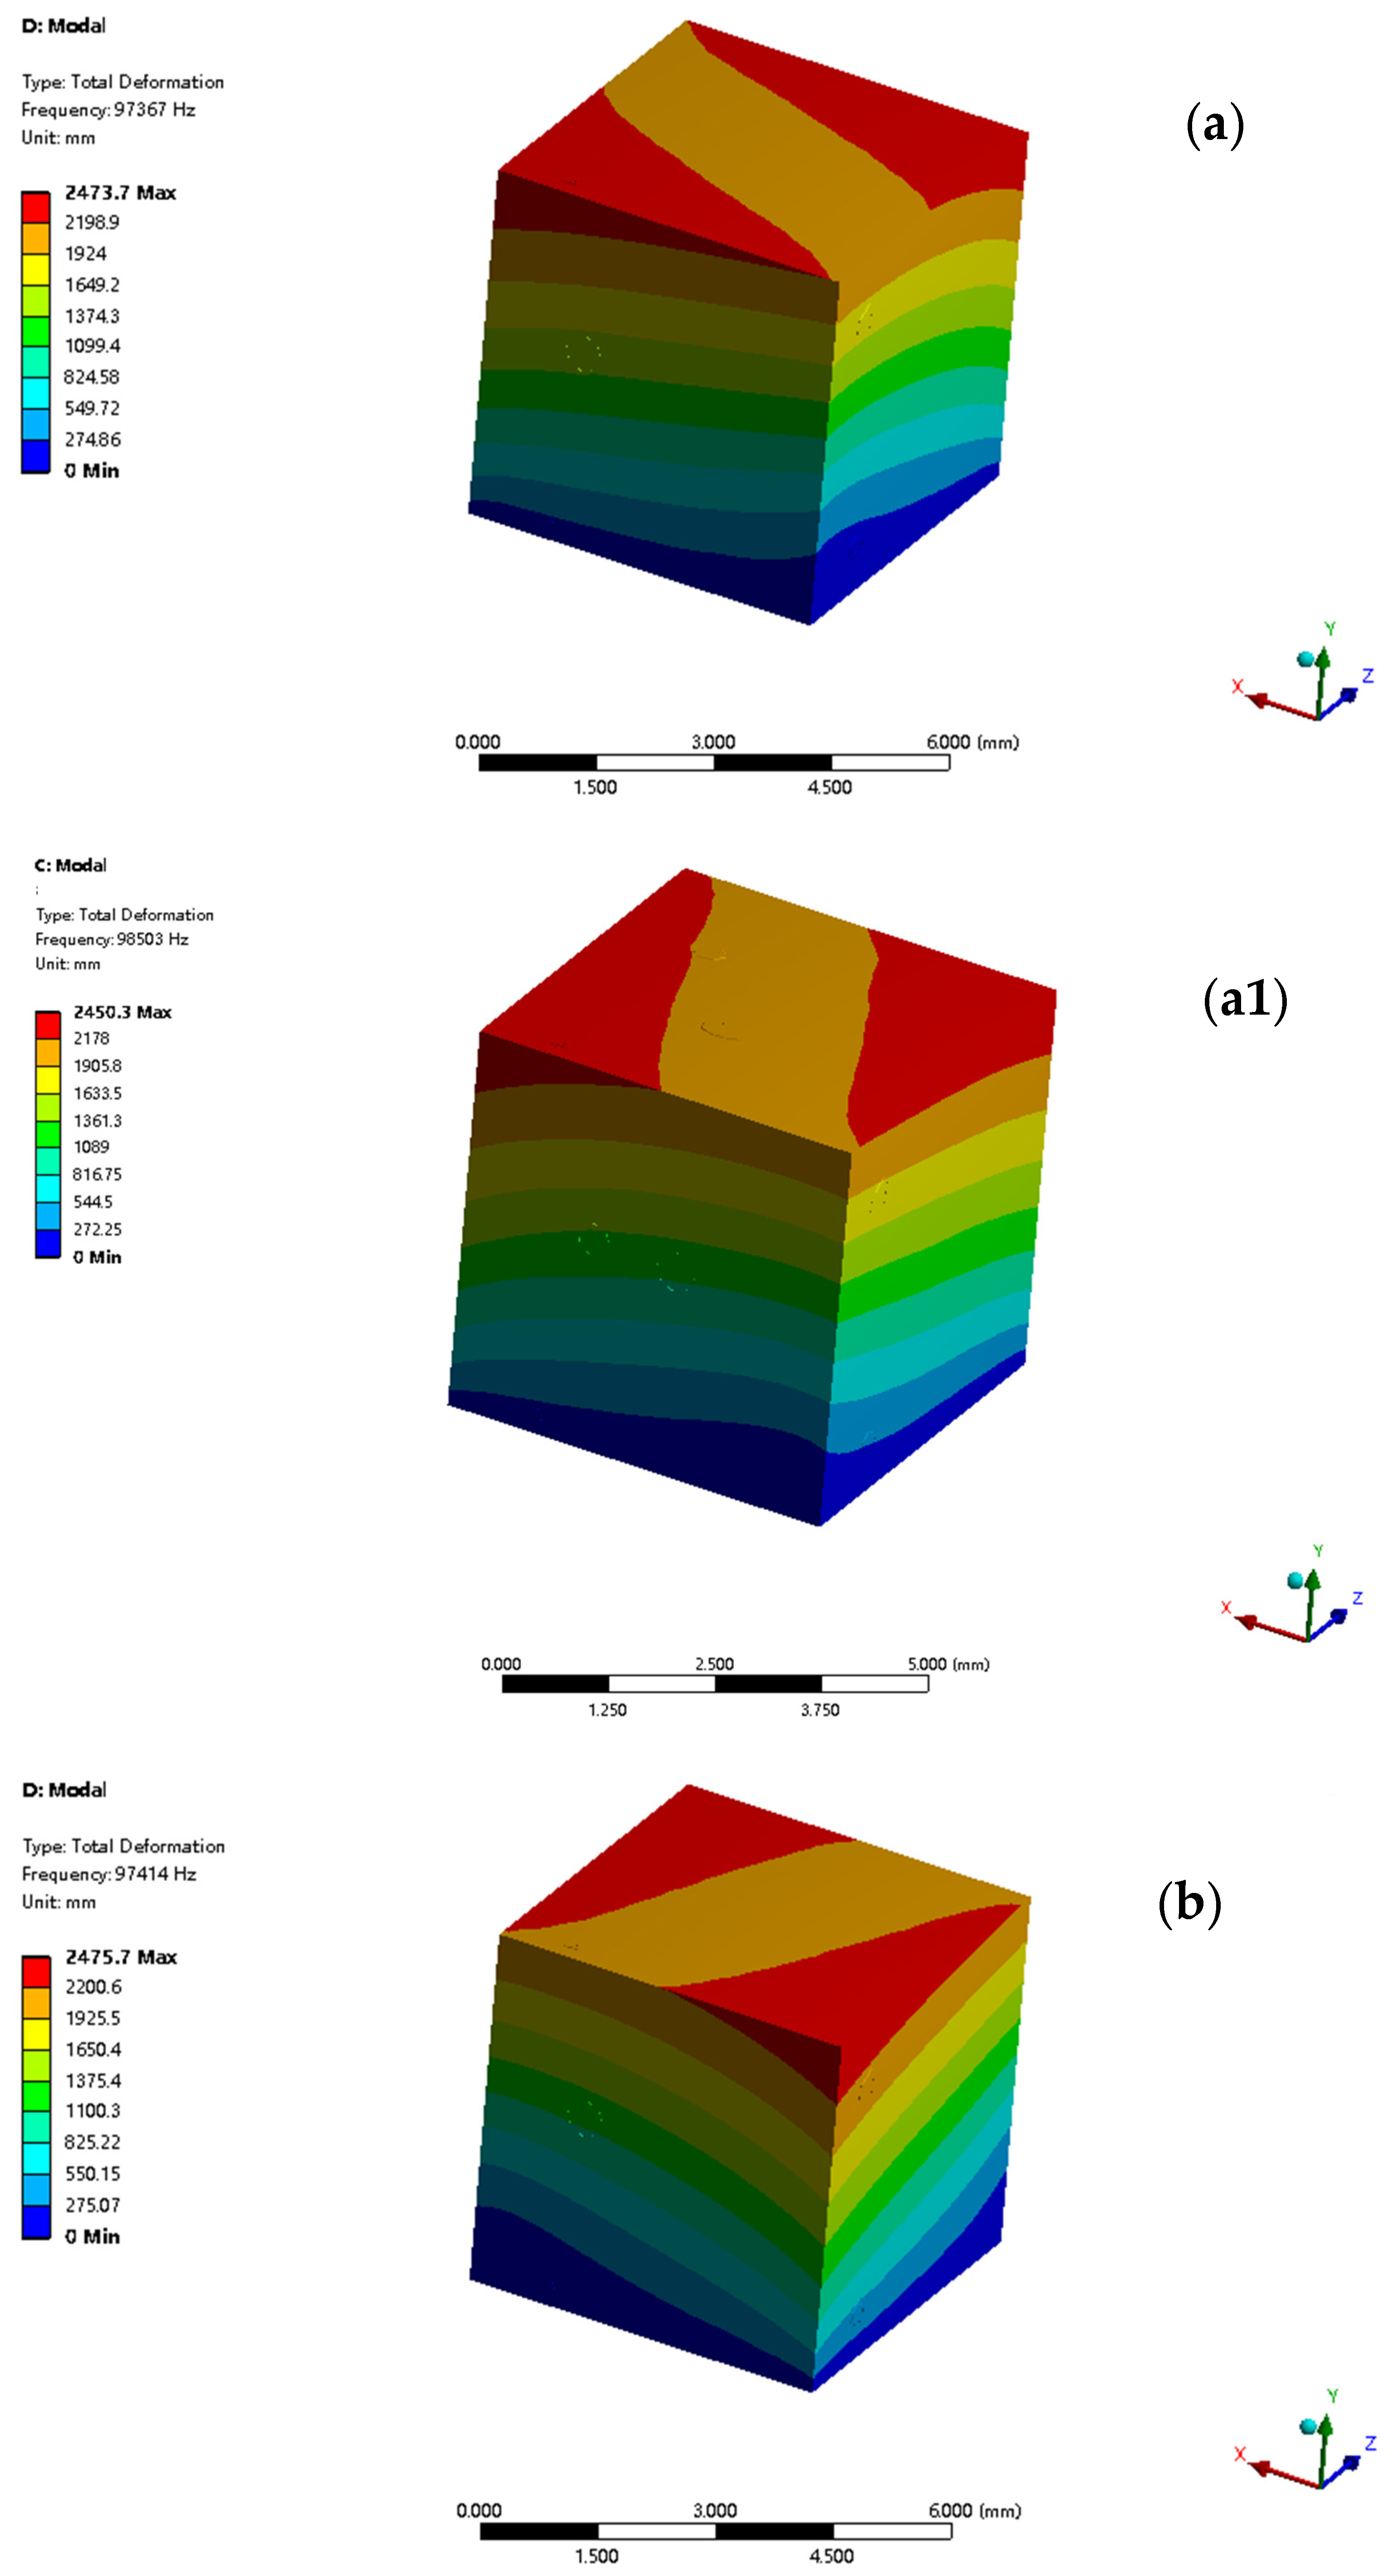
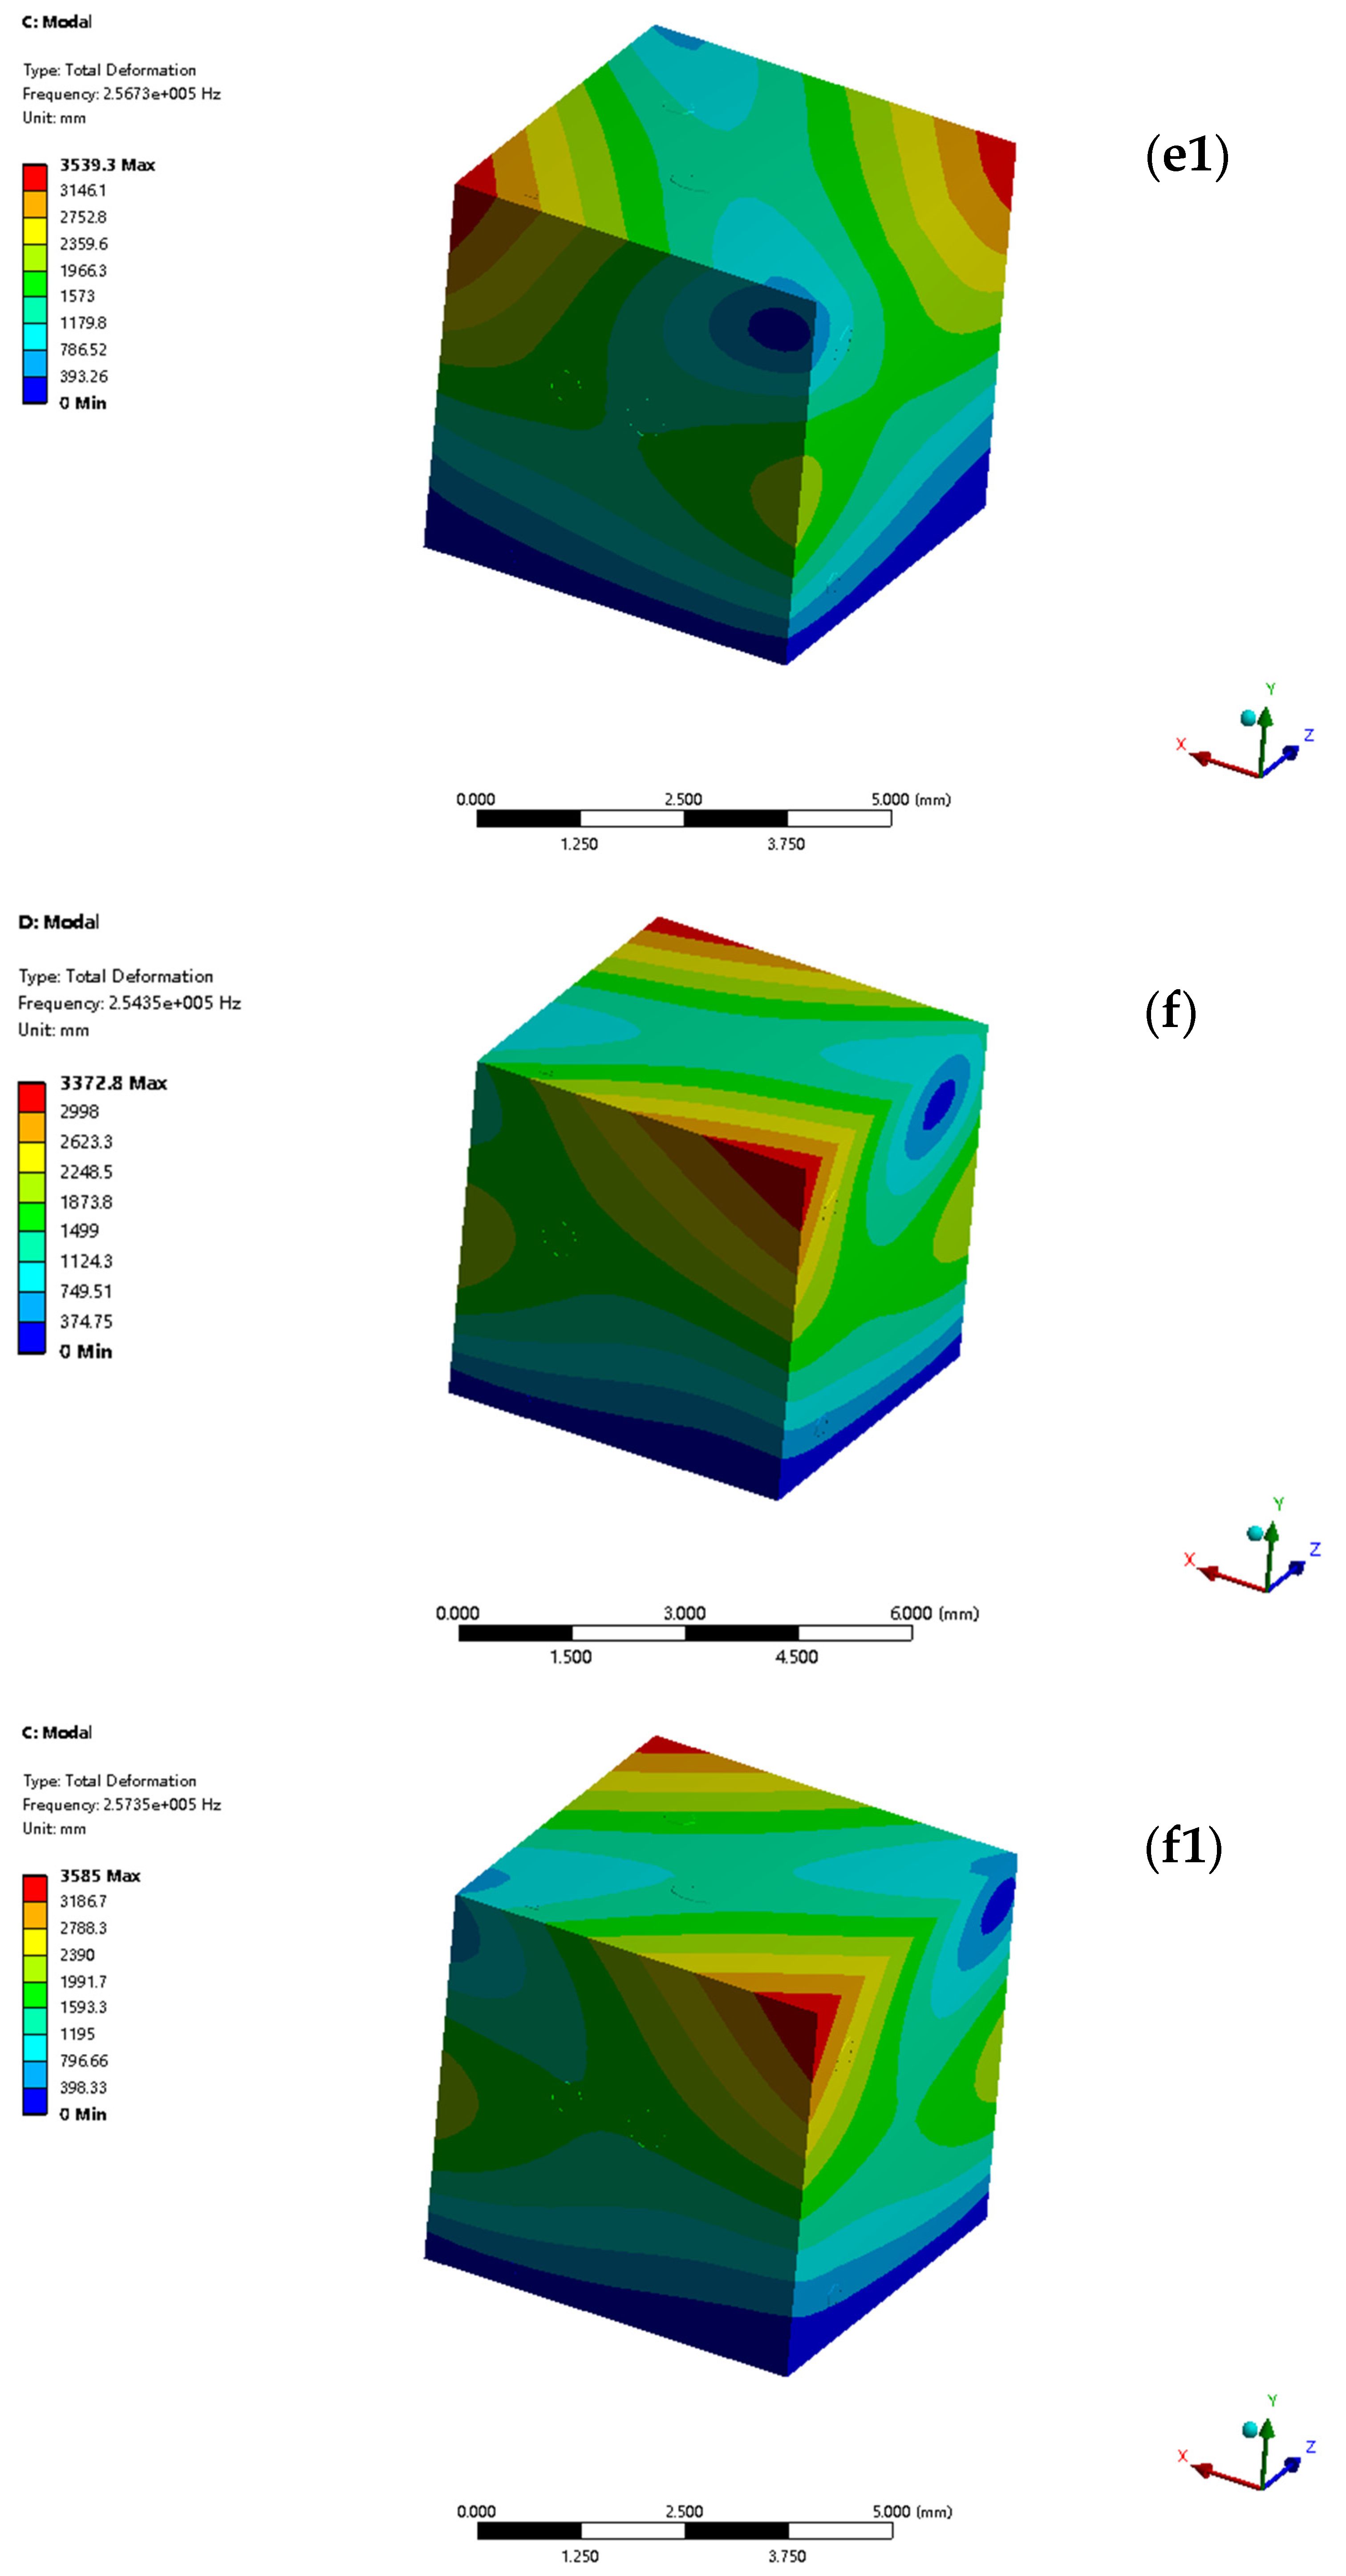
Figure 7 presents the comparison of the first- to sixth-order global modal simulation results of TMC1 and TMC2. The modes are arranged from left to right and top to bottom, with each row representing the simulation of the two materials under the same modal order. In each figure, different-colored regions indicate different displacement magnitudes, and the color bar shows the specific displacement values (unit: mm).


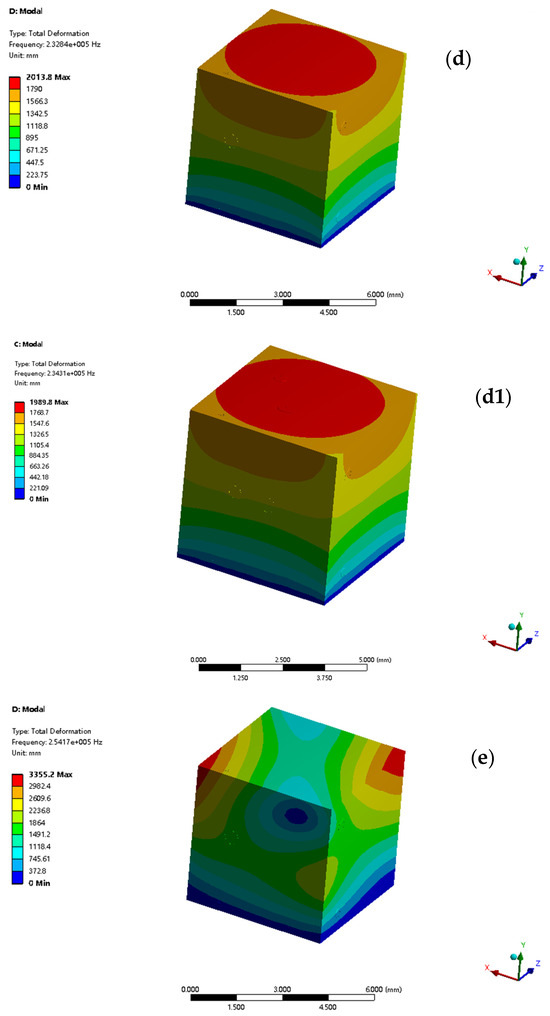

Figure 7.
First- to sixth-order global modal simulation results of TMC1 and TMC2 ((a–f) represent the first- to sixth-order global modal simulation results of TMC1, and (a1–f1) represent those of TMC2, respectively).
When conducting the first- to sixth-order global modal analysis of TMC1 and TMC2, a deep understanding of their modal characteristics is crucial for comprehensively grasping the material properties, which is aided by classical vibration theory formulas.
In the global modal simulation, the input parameters serve as the foundation for obtaining reliable results. Material property parameters, such as the elastic modulus, Poisson’s ratio, and density, are determined through standard experimental methods. The elastic modulus is measured by the tensile test, and the density is measured by the displacement method. The geometric parameters are set directly according to the precise dimensions of the actual sample. The boundary conditions are defined based on the actual constraint state of the sample in the experiment to ensure that the simulation is consistent with the actual working conditions. The accurate values and reasonable setting of these parameters provide solid data support for the in-depth analysis of the modal characteristics of the material, and enable the simulation results to more realistically reflect the material properties.
Based on basic mechanics theory, for an elastic body, the relationship between stress and strain follows Hooke’s Law:
where is the stress tensor, describing the stress state at each point inside the material; is the strain tensor, representing the degree of deformation of the material; G is the shear modulus, reflecting the material’s ability to resist shear deformation; is the Lamé constant; is the Kronecker delta (when i = j, = 1; when i , = 0); is the trace of the strain tensor ().
Based on Newton’s second law, considering the inertial force per unit volume, the motion equation can be obtained: i = .
Where is the material density, i is the second-order derivative of the displacement with respect to time (i.e., acceleration), and is the coordinate component.
Substituting Hooke’s law into the motion equation and through derivation, the wave equation of the elastic body can be obtained:
where is the Laplace operator.
In modal analysis, assuming that the displacement has a simple harmonic vibration form ; substituting it into the wave equation, the eigenvalue equation is obtained:
Solving this equation can yield the natural frequency of the material and the corresponding vibration mode . The natural frequency is closely related to the stiffness and mass distribution of the material, while the vibration mode describes the vibration pattern of the material at the corresponding frequency.
Modal analysis results indicate that significant differences exist between TMC1 and TMC2 in the first- to sixth-order modal simulations, and these differences are closely related to the microstructure.
To quantify the significance of these differences, statistical analysis was conducted on the simulation data. The results show that the differences in natural frequencies between TMC1 and TMC2 in all modal orders exceed the 95% confidence interval, indicating a high level of statistical significance. Moreover, finite element simulations with varying microstructural parameters were performed, further validating the direct correlation between microstructural characteristics and modal performance.
Generally, due to the local aggregation of ZrC particles, TMC1 has a non-uniform microstructure, resulting in uneven distribution of internal mass and stiffness. Consequently, in all modal orders, TMC1 generally has lower natural frequencies, complex and uncoordinated vibration mode deformation, relatively concentrated displacement, and obvious stress concentration in some orders. Especially in high-order modes, the negative impact of microstructural defects on the vibration mode is more prominent, severely affecting the vibration stability and mechanical properties of the material.
In contrast, the addition of NbC in TMC2 optimizes the microstructure, with a uniform distribution of reinforcing phases and refined grains, leading to a more reasonable distribution of internal mass and stiffness. In all modal orders, TMC2 generally has higher natural frequencies than TMC1, more uniform and stable vibration modes, smaller displacements, and effectively mitigated stress concentration. Even in high-order modes, TMC2 can maintain good vibration performance with its optimized microstructure, demonstrating excellent adaptability in complex vibration environments.
Specifically, for each modal order, in the first-order mode, TMC1 has a natural frequency of 97,367 Hz, with an obvious bent vibration mode and a maximum displacement of 2473.7 mm. For TMC2, the natural frequency increases to 98,503 Hz, the vibration mode is more uniform, and the maximum displacement decreases to 2450.3 mm, significantly enhancing low-frequency stability. In the second-order mode, TMC1 has a frequency of 97,414 Hz, with an expanded deformation area of the vibration mode and intensified stress concentration. TMC2 has a frequency of 98,670 Hz and can effectively disperse vibration energy to maintain a stable vibration mode. In the third-order mode, TMC1 has a frequency of 1.3084 × 10⁵ Hz, with a complex composite vibration mode and a maximum displacement of 3326.5 mm. TMC2 has a frequency of 1.3332 × 10⁵ Hz, and its vibration mode has a smooth deformation transition, a maximum displacement of 3321.7 mm, and better vibration performance. In the fourth-order mode, TMC1 has a frequency of 2.3284 × 10⁵ Hz, with severe deformation in multiple parts of the vibration mode and energy concentration. TMC2 has a frequency of 2.3431 × 10⁵ Hz, and its vibration mode has good deformation synergy. In the fifth-order mode, TMC1 has a frequency of 2.5417 × 10⁵ Hz, with a complex vibration mode and a large local displacement gradient. TMC2 has a frequency of 2.5673 × 10⁵ Hz and can effectively cope with high-order stresses, with an orderly change in the vibration mode. In the sixth-order mode, TMC1 has a frequency of 2.5435 × 10⁵ Hz, with a highly complex vibration mode and severe stress concentration. TMC2 has a frequency of 2.5735 × 10⁵ Hz, and its vibration mode remains regular, showing good vibration resistance in high-order modes.
In conclusion, the excellent performance of TMC2 in all modal orders benefits from its optimized microstructure. This provides an important theoretical basis and practical guidance for the design of high-performance titanium matrix composites and also lays a foundation for further research on the relationship between microstructures and material dynamic properties.
- (2)
- First- to sixth-order analyses of local modal characteristics
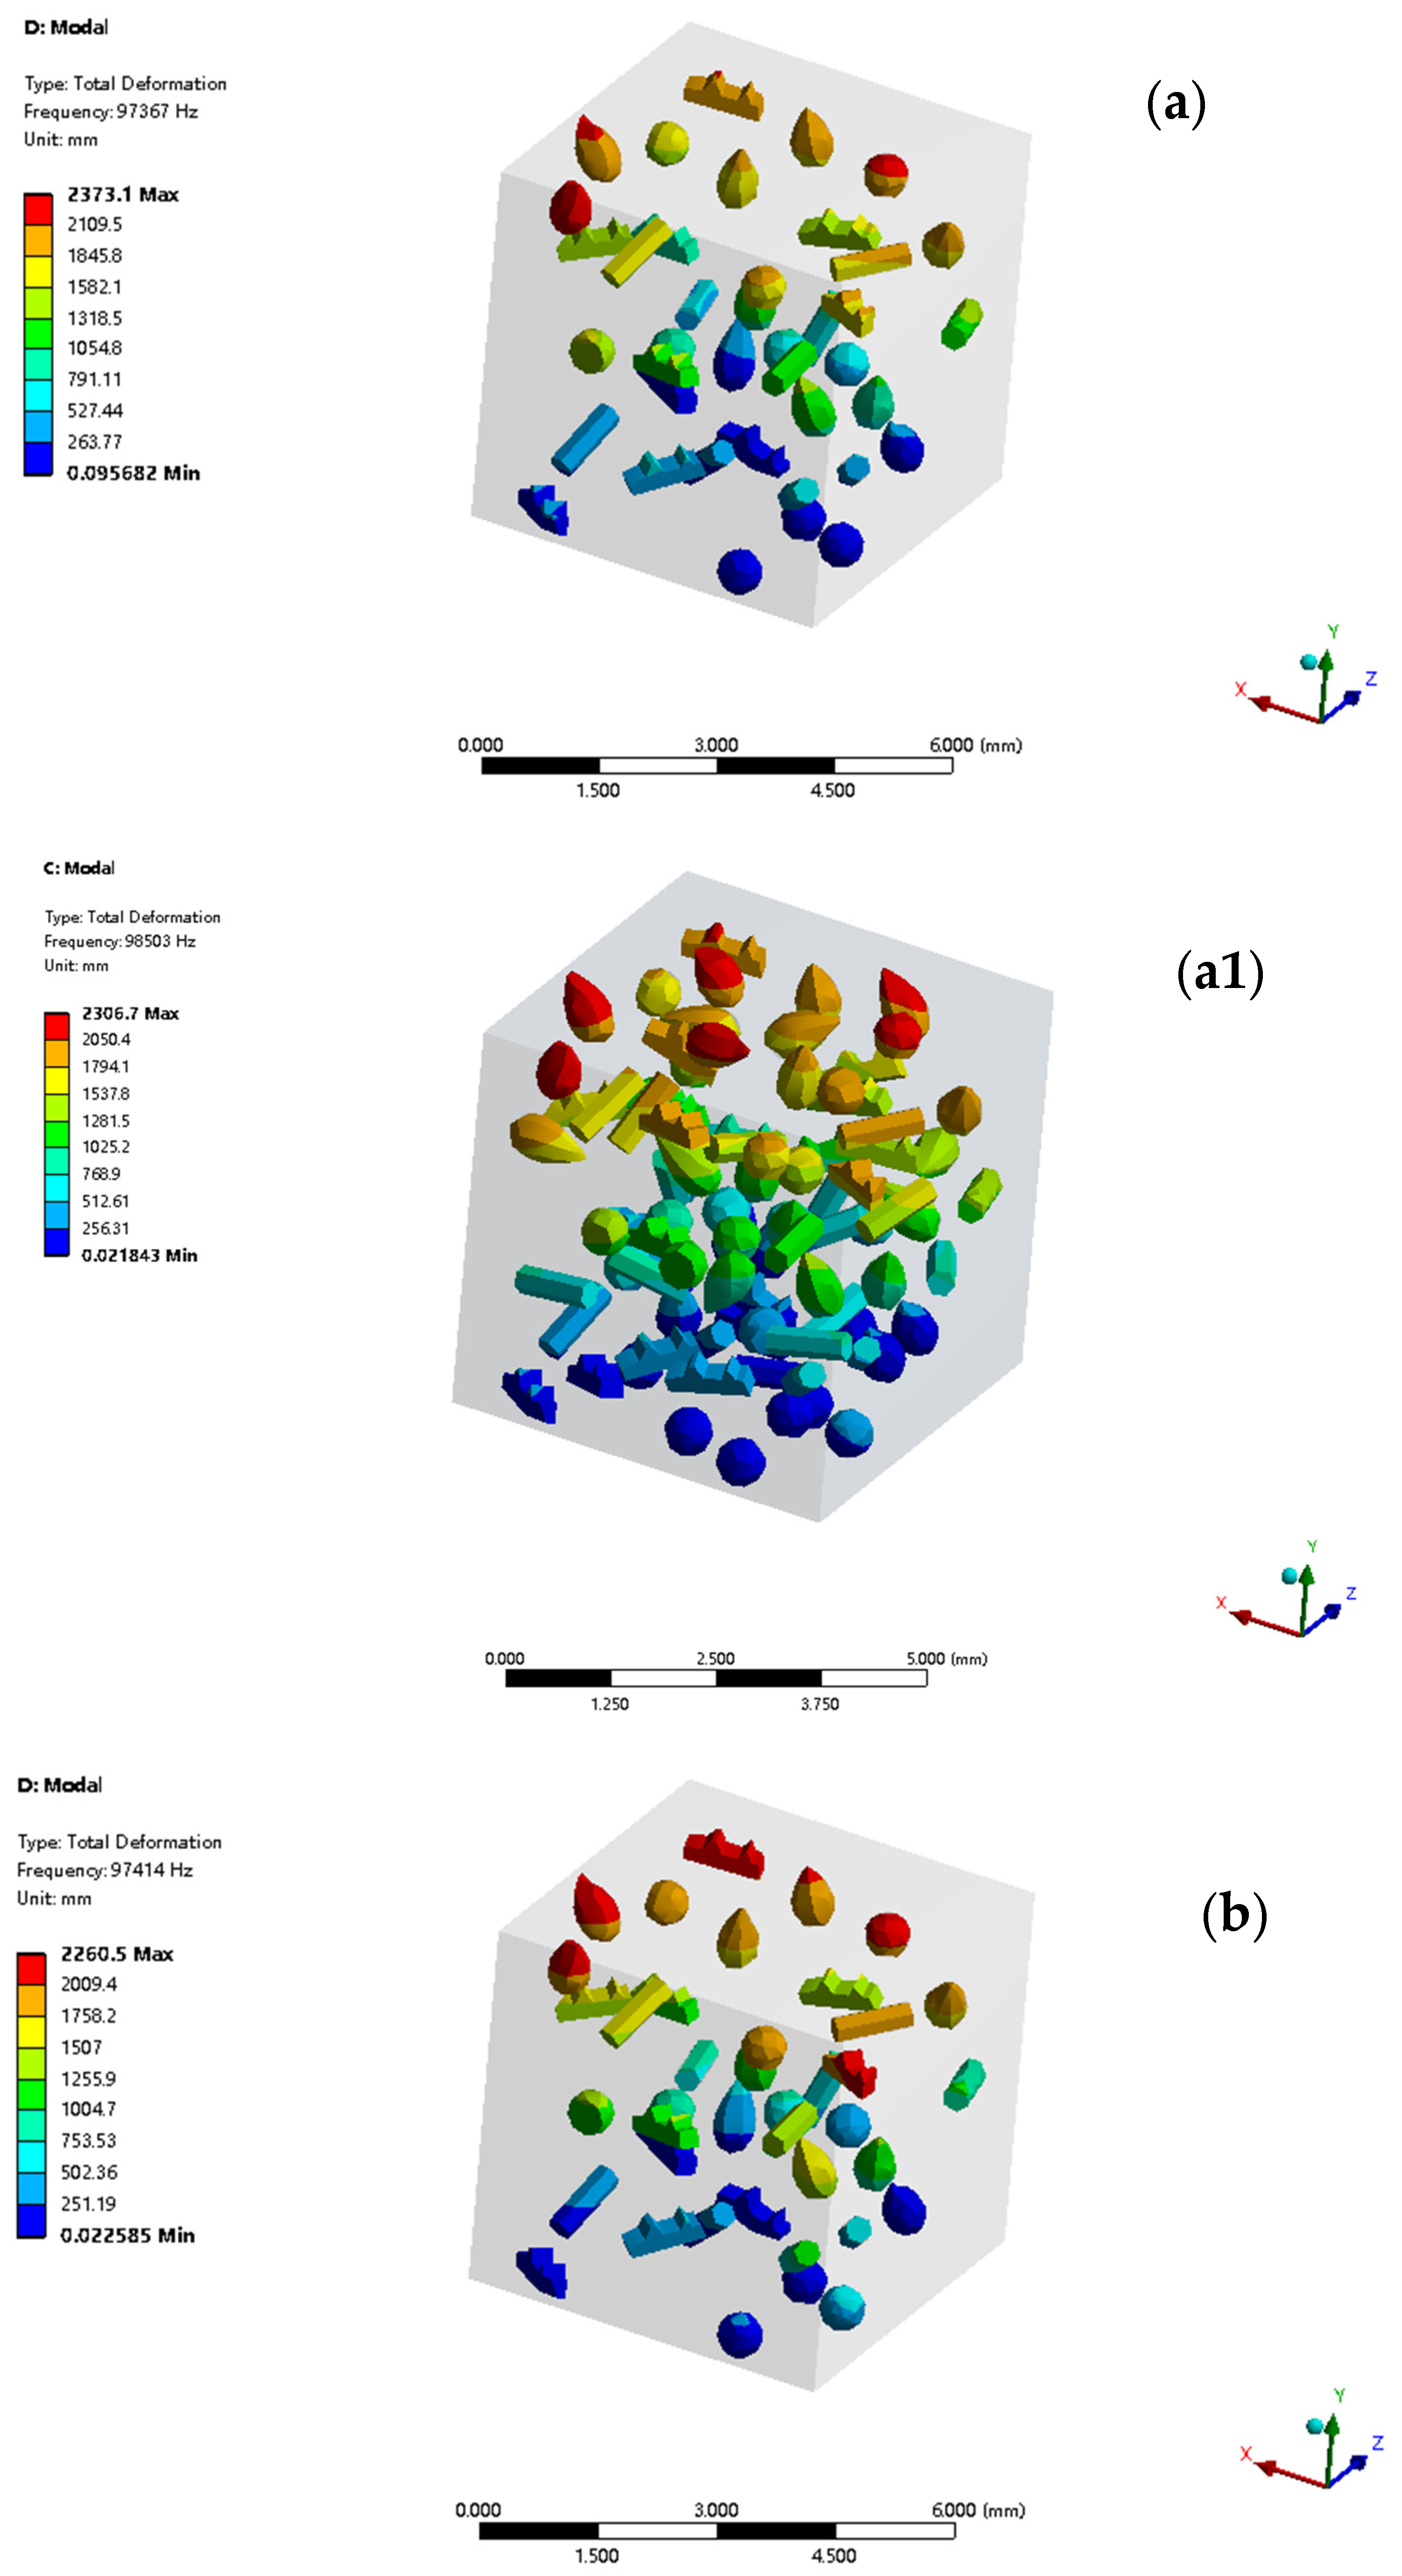
In the study of TMC1 and TMC2, global modal simulations revealed the link between overall modal performance and microstructure. The first- to sixth-order local modal analysis delved deeper into local material characteristics. By examining local deformation, stress concentration, and displacement in each mode, it clarified how the microstructure affects vibration performance and tensile properties. TMC2’s optimized microstructure led to more stable local mode vibrations, less stress concentration, enhanced tensile properties, and greater potential in complex applications. The simulation results are presented in Figure 8.
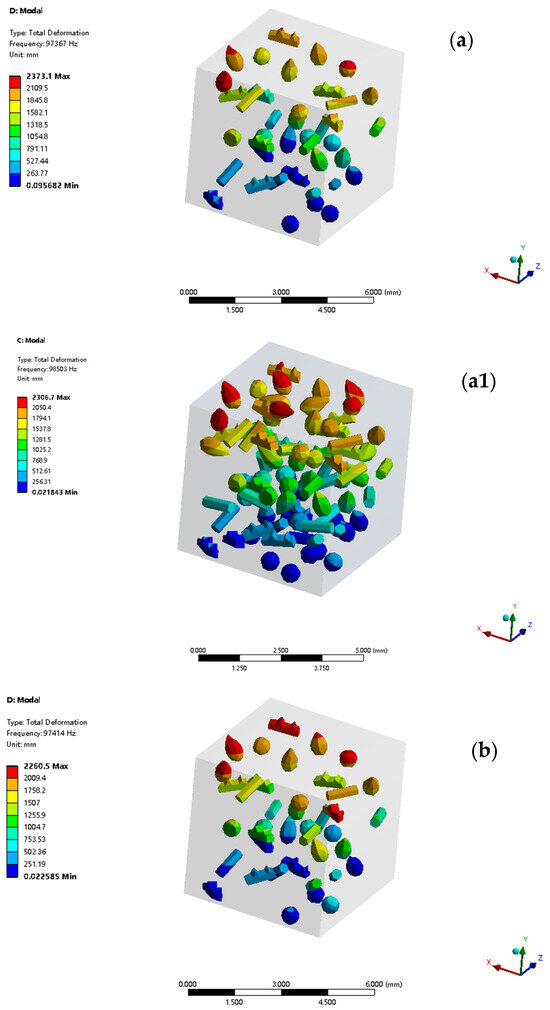
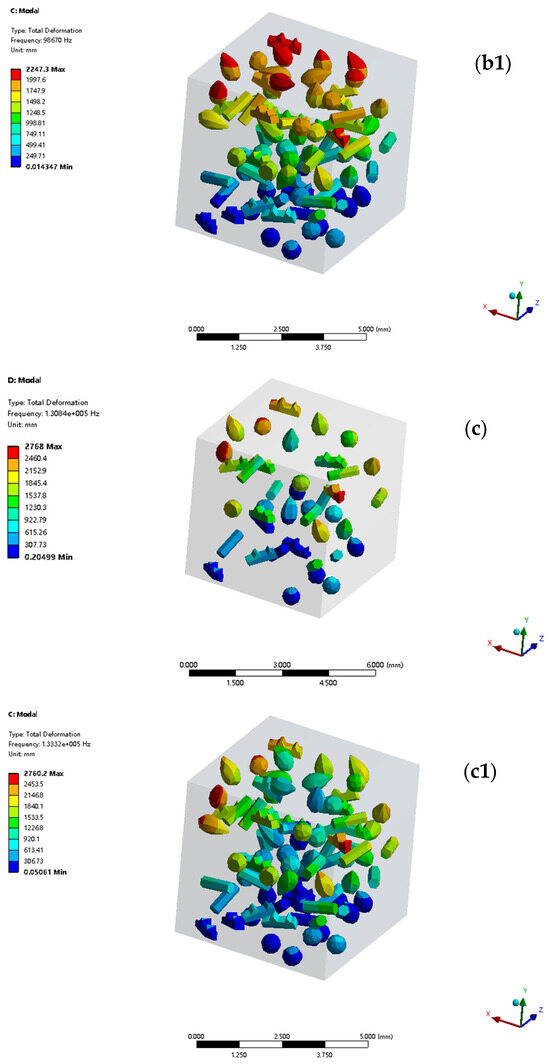
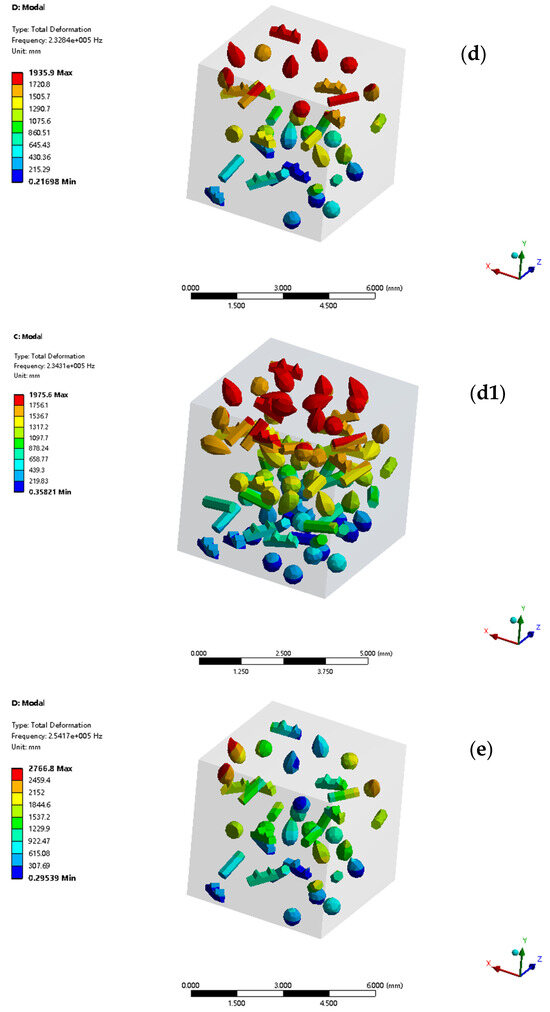
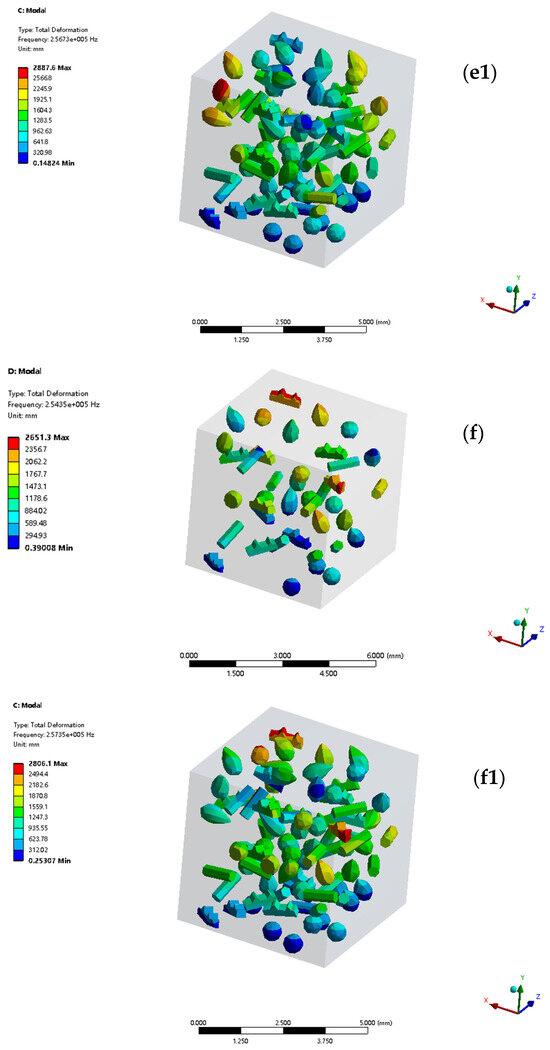
Figure 8.
Results of first- to sixth-order local modal simulations of TMC1 and TMC2 (where (a–f) correspond to the first- to sixth-order local modal simulation results of TMC1, and (a1–f1) correspond to those of TMC2, respectively).
In the first-order local mode, TMC1 has a 97,367 Hz frequency. Its vibration mode deforms greatly at reinforcing phase aggregation areas, with a 2373.1 mm max displacement due to non-uniform reinforcing phase distribution, concentrating vibration energy. TMC2 has a 98,503 Hz frequency. Its vibration mode is more uniform, with a 2247.3 mm max displacement. NbC in TMC2 uniformizes the reinforcing phase distribution and refines grains, optimizing the local structure. This enhances modal performance, reduces local damage under dynamic loads, and maintains overall stability.
In the second-order local mode, TMC1 has a frequency of 97,414 Hz. Its vibration mode shows enlarged local deformation and increased stress concentration, with a maximum displacement of 2260.5 mm, resulting from amplified microstructural defects. TMC2, at a frequency of 98,670 Hz, exhibits a milder changing vibration mode and a maximum displacement of 1997.6 mm. Its uniform structure efficiently disperses energy, preserves local integrity, and enhances performance via coordinated deformation, analogous to the mechanism in tensile behavior.
In the third-order local mode, TMC1 has a frequency of 1.3084 × 10⁵ Hz. Its vibration mode undergoes complex composite deformation, with a maximum displacement of 2768 mm, indicating severe local stiffness imbalance. For TMC2, the frequency is 1.3332 × 10⁵ Hz. Although its vibration mode also shows composite deformation, the transition is smooth, and the maximum displacement is 2760.2 mm. This is attributed to the rational microstructure that adjusts local parameters, enhancing the anti-failure ability. It is similar to the way in which tensile strength is increased to ensure modal reliability, optimizing the material’s performance in this modal state.
In the fourth-order local mode, TMC1’s frequency is 2.3284 × 10⁵ Hz. Its vibration mode has intense multi-part deformation and energy concentration, with a 1935.9-mm max displacement, indicating microstructure-related issues. TMC2, at 2.3431 × 10⁵ Hz, has a vibration mode with good deformation synergy and a 1756.1 mm max displacement. Its uniform structure aids energy transfer and dissipation, maintaining local stability and boosting overall performance with its tensile property advantages.
In the fifth-order mode, TMC1 (frequency 2.5417 × 10⁵ Hz) exhibits large local displacement gradients and poor stability, with a 2766.8 mm max displacement. TMC2 (frequency 2.5673 × 10⁵ Hz) features a stable vibration mode, resists high-order stresses, and has a 2887.6 mm max displacement. TMC2’s optimized microstructure, maintaining performance in late-stage tension, shows clear high-order mode advantages and complex condition potential.
In the sixth-order mode, TMC1 with a frequency of 2.5435 × 10⁵ Hz has severe local stress concentration and faces failure. TMC2, at 2.5735 × 10⁵ Hz, has a regular vibration mode and a maximum displacement of 2806.1 mm. Its microstructure suppresses vibration-induced damage in high-order modes, ensures performance, and collaborates with overall modal and tensile properties to enhance serviceability, providing a basis for material design and application.
First- to sixth-order local modal simulations show that TMC1, with non-uniform reinforcing phase distribution, has severe deformation, stress concentration, and large displacement problems. Conversely, TMC2, featuring uniform reinforcing phase distribution and refined grains, has better modal performance, higher stability, and potential for complex condition applications.
4. Discussion
4.1. Mechanisms of the Microstructure/Modal Correlation in TMCs
In materials science, investigating the internal relationship between microstructures and modal characteristics is crucial for precisely controlling the performance of materials under dynamic loads. Microstructural features like grain structure and reinforcement distribution significantly impact the stiffness and mass distribution of materials, thus profoundly affecting their modal characteristics. A complex mechanism based on materials science principles underlies this phenomenon.
From the perspective of grain structure, based on the Hall–Petch relationship in materials science, the elastic modulus of a material and its grain size d are related by the formula , where is a constant and k is a coefficient related to material properties. In the 5% ZrC-reinforced titanium alloy, the large grain size results in a small value of , leading to a low elastic modulus E. For a homogeneous isotropic material, the relationship between its stiffness K and elastic modulus is (A is the area under force, and L is the length in the force-applied direction), so the overall stiffness of this alloy is poor.
In modal analysis, the natural frequency of a material is related to its stiffness K and mass m through the formula of a single-degree-of-freedom vibration system . Due to its low stiffness, the first-order modal natural frequency of the 5% ZrC-reinforced titanium alloy is only 97,367 Hz. In addition, the large grain regions have a large moment of inertia ( is the distance from the micro-element to the axis of rotation, and dm is the mass of the micro-element), resulting in a concentrated mass distribution. During vibration, the energy transfer is uneven, and the vibration mode shows obvious bending deformation, with displacement concentrated in specific areas.
In contrast, in the 5% ZrC-6% NbC-reinforced titanium alloy, NbC refines the grains. According to the Hall–Petch relationship, the small grain size increases the elastic modulus. Based on , the alloy’s stiffness is enhanced. Under the same loading conditions, its stiffness is significantly higher than that of the 5% ZrC-reinforced titanium alloy. According to the natural frequency formula, its first-order modal natural frequency is increased to 98,503 Hz. Moreover, the uniform grain distribution leads to a more balanced mass distribution. According to the energy formula ( is the vibration energy, x is the displacement, and is the velocity), it is more conducive to the efficient transfer and dissipation of vibration energy within the material. As a result, the vibration mode is more uniform, and the stability of the material under low-frequency vibration is significantly enhanced.
The influence of reinforcement distribution on modal characteristics follows rigorous materials science principles. In the 5% ZrC-reinforced titanium alloy, the local aggregation of ZrC particles alters the material’s elastic modulus distribution. According to the composite mixture rule, ( is the elastic modulus of the composite, is the matrix elastic modulus, is the reinforcement elastic modulus, and is the reinforcement volume fraction). In the ZrC-particle-aggregated regions, the increased raises , while in the surrounding matrix regions is relatively low, resulting in an uneven overall elastic modulus distribution.
The non-uniform elastic modulus affects the material’s stiffness distribution. The material stiffness K is related to the elastic modulus E, and in simple tension, (A is the force-bearing area, and L is the length in the force-applied direction). In the third-order mode of modal response, according to Hooke’s law, ( is stress, is strain), different elastic moduli in the reinforcement aggregated regions and the surrounding matrix lead to different stresses under the same strain. From the stress concentration factor formula ( is the stress concentration factor, a is the defect size, and is the notch root radius), the aggregation of ZrC particles increases the value of a, intensifying stress concentration. The complex stress distribution makes the stress state complex during material vibration. According to the elasticity equilibrium equation , the vibration mode exhibits composite deformations, with a maximum displacement of 3326.5 mm, significantly increasing the risk of structural failure during vibration.
In the 5% ZrC-6% NbC-reinforced titanium alloy, ZrC and NbC particles distribute uniformly and synergistically. According to the mixture rule, the material has more uniform elastic modulus and stiffness distributions. Under different modal orders, the material shows better vibration/resistance coordination. Taking the third-order mode as an example, the maximum displacement reduces to 3321.7 mm, and the deformation transition is smoother, highlighting the optimization of modal characteristics by the uniform reinforcement distribution, which is beneficial for the material to maintain performance under high-frequency vibrations.
In summary, grain structure and reinforcement distribution influence modal characteristics via altering the material’s elastic modulus, stiffness, and mass distributions. Materials science formulas elucidate this mechanism, supporting material design optimization. In future R&D, adjusting preparation processes can optimize microstructure, precisely control modal performance, meet high-end field requirements for materials under complex dynamic conditions, and advance research on microstructure/property relationships
4.2. The Intricate Linkages Among Tensile Properties, Microstructure, and Modal Characteristics
In the research of titanium matrix composites (TMCs), there exist complex and interdependent relationships among tensile properties, microstructures, and modal characteristics. These relationships are closely related to the microstructure/modal correlation mechanism discussed in Section 4.1, jointly forming a crucial framework for understanding material properties.
Building on the content of Section 4.1, the microstructure, as a core factor, has a profound impact on both tensile properties and modal characteristics. As known from Section 4.1, according to the Hall–Petch relationship, in 5% ZrC-6% NbC-reinforced TMCs, NbC inhibits grain growth, reducing the grain size and increasing the elastic modulus . The change in elastic modulus directly affects tensile properties and modal characteristics. In terms of tensile properties, a higher elastic modulus means enhanced resistance to elastic deformation, which is conducive to improving tensile strength. The 5% ZrC-6% NbC-doped composite has a tensile strength of 1210 MPa, showing an improvement compared with the 5% ZrC-doped sample, which benefits from the change in elastic modulus resulting from microstructure optimization.
Regarding modal characteristics, based on the relationship between elastic modulus and stiffness () and the natural frequency formula of a single-degree-of-freedom vibration system () described in Section 4.1, the increase in elastic modulus of 5% ZrC-6% NbC-reinforced TMCs leads to an increase in stiffness K and thus a higher natural frequency . For example, in the first-order mode, its natural frequency increases from 97,367 Hz of the 5% ZrC-reinforced titanium alloy to 98,503 Hz, with reduced displacement and a more stable vibration mode, indicating that the optimized microstructure significantly improves modal characteristics.
There are also close connections between tensile properties and modal characteristics. The elastic modulus in tensile properties is closely related to the modal frequency, echoing the explanation in Section 4.1 about the influence of elastic modulus on modal characteristics. During the tensile process, the deformation behavior of the material is similar to the modal vibration mode, both being regulated by the microstructure. The 5% ZrC-reinforced titanium alloy experiences stress concentration and severe local deformation during tension due to the aggregation of reinforcing phases, and similar local complex deformations and stress concentrations also occur in modal simulations. In contrast, the 5% ZrC-6% NbC-reinforced titanium alloy has a more uniform microstructure, resulting in coordinated tensile deformation and more uniform and stable modal vibration modes.
Modal characteristics also affect tensile properties and microstructure. When simulating modal vibrations under cyclic loading, according to the relationship between stress concentration and microstructure (such as the stress concentration factor formula ( ) in Section 4.1), the 5% ZrC-reinforced titanium alloy has a non-uniform microstructure, severe stress concentration, and is more prone to fatigue damage under high-frequency vibrations. According to Basquin’s law (b), fatigue damage reduces tensile properties, such as a decrease in tensile strength and elongation. The 5% ZrC-6% NbC-reinforced titanium alloy has a more uniform microstructure, which alleviates stress concentration, prolongs fatigue life, and stabilizes tensile properties. In addition, specific modal vibrations during the manufacturing process can change the grain growth kinetics (grain growth rate formula ), thereby affecting the microstructure and ultimately influencing tensile properties and modal characteristics.
To sum up, tensile properties, microstructures, and modal characteristics of TMCs are intricately interwoven. The mechanism in Section 4.1, which elucidates the microstructure/modal correlation, serves as a cornerstone for grasping these relationships. This section further clarifies the role of tensile properties. Together, they underpin the R&D of high-performance titanium alloys and are crucial for fulfilling the material demands in high-end sectors.
5. Conclusions
This study comprehensively compared and analyzed 5% ZrC- and 5% ZrC-6% NbC-reinforced titanium alloy composites. By delving into their microstructures, tensile properties, and modal characteristics, the close relationships among these three aspects were clarified, and the advantages of the 5% ZrC-6% NbC-reinforced titanium alloy were identified, providing crucial support for the research and application of high-performance titanium alloys. The specific conclusions are as follows:
The 5% ZrC-6% NbC doping system exhibits distinct advantages. The uniformity of the reinforcing phase is enhanced by approximately 30%, and the average grain size is reduced by 5 μm. NbC effectively inhibits grain growth, optimizing the microstructure.
The tensile properties of the 5% ZrC-6% NbC-doped composite are significantly superior to those of the 5% ZrC-doped sample. It has a tensile strength of 1210 MPa and an elongation of 4.74%. Moreover, the stress–strain curve indicates that the NbC doping enables the microstructure and the reinforcing phase to act synergistically, playing a positive role throughout the material deformation process.
Through ANSYS simulations, it is found that the 5% ZrC-6% NbC-doped alloy has a higher natural frequency, smaller displacement, and a more stable vibration mode in both global and local modes. The deformation and stress concentration in critical parts are low, reducing the risk of local failure.
Author Contributions
Conceptualization, J.W. and Z.Y.; Methodology, J.W. and B.Z.; Software, J.W. and B.Z.; Validation, J.W. and H.Z.; Formal analysis, J.W.; Investigation, J.W.; Resources, J.W. and H.Z.; Data curation, Z.Y.; Writing—original draft, J.W.; Writing—review & editing, J.W. and H.Z.; Visualization, H.Z.; Supervision, B.Z. and Z.Y.; Project administration, J.W.; Funding acquisition, J.W. All authors have read and agreed to the published version of the manuscript.
Funding
The current work was funded by the Huzhou Vocational & Technical College Special Exploration Project Funds for High-Level Talents under grant no. 2024TS04; Huzhou Natural Science Foundation under grant no. 2023YZ01.
Data Availability Statement
The original contributions presented in this study are included in the article. Further inquiries can be directed to the corresponding authors.
Conflicts of Interest
The authors declare no conflicts of interest.
References
- Sun, G.; Cheng, J.; Zheng, Z.; Zhang, J.; Su, X.; Zhang, P.; Li, M.; Xu, J.; Mao, X.; Dong, L.; et al. Achieving high strength and ductility of titanium matrix composite reinforced with networked tib via sps sintering of core-shell powder and accumulative hot rolling. Int. J. Plast. 2024, 183, 104166. [Google Scholar] [CrossRef]
- Xu, L.; Zheng, Y.; Liang, Z.; Han, S.; Xue, X.; Xiao, S.; Tian, J.; Chen, Y. Creep behavior and microstructure evolution of titanium matrix composites reinforced with TIB, TIC and Y2O3. Trans. Nonferrous Met. Soc. China 2023, 33, 467–480. [Google Scholar] [CrossRef]
- Guo, X.; Zhang, S.; He, P.; Wei, Z. Particle distribution and interfacial reaction of wc reinforced titanium matrix composites fabricated by wire and arc additive manufacturing. Vacuum 2024, 219, 112680. [Google Scholar] [CrossRef]
- Najafizadeh, M.; Yazdi, S.; Bozorg, M.; Ghasempour-Mouziraji, M.; Hosseinzadeh, M.; Zarrabian, M.; Cavaliere, P. Classification and applications of titanium and its alloys: A review. J. Alloys Compd. Commun. 2024, 3, 100019. [Google Scholar] [CrossRef]
- Xi, L.; Feng, L.; Gu, D.; Wang, R.; Sarac, B.; Prashanth, K.G.; Eckert, J. Zrc+tic synergically reinforced metal matrix composites with micro/nanoscale reinforcements prepared by laser powder bed fusion. J. Mater. Res. Technol. 2022, 19, 4645–4657. [Google Scholar] [CrossRef]
- Singh, N.; Ummethala, R.; Karamched, P.S.; Sokkalingam, R.; Gopal, V.; Manivasagam, G.; Prashanth, K.G. Spark plasma sintering of ti6al4v metal matrix composites: Microstructure, mechanical and corrosion properties. J. Alloys Compd. 2021, 865, 158875. [Google Scholar] [CrossRef]
- Abe, J.O.; Popoola, O.M.; Popoola, P.A. A synergetic effect of ternary refractory nitride reinforcements on densification, mechanical, tribological and thermal stability characteristics of spark plasma sintering-developed ti6al4v matrix composites. J. Alloys Compd. 2024, 997, 174888. [Google Scholar] [CrossRef]
- Li, N.; He, D.; Di Liu Ma, L.; He, C.; Xu, Y.; Yu, J. In-situ tib reinforced titanium matrix composite coatings prepared by laser cladding: Effect of tib2 content on microstructure, hardness and wear properties. J. Alloys Compd. 2025, 1010, 178215. [Google Scholar] [CrossRef]
- Oketola, A.; Jamiru, T.; Adegbola, A.T.; Ogunbiyi, O.; Rominiyi, A.L.; Smith, S. Spark plasma sintering of ceramic-reinforced binary/ternary nickel and titanium metal matrix composites: Mechanical properties, microstructure, and densification—A review. J. Alloys Metall. Syst. 2023, 3, 100031. [Google Scholar] [CrossRef]
- Yuan, Z.; Liu, H.; Ma, Z.; Ma, X.; Wang, K.; Zhang, X. Effect of heat treatment on the microstructure and properties of cocrfenimo0.2 particles reinforced titanium matrix composites. J. Alloys Compd. 2022, 928, 166985. [Google Scholar] [CrossRef]
- Yuan, Z.; Liu, H.; Ma, Z.; Ma, X.; Wang, K.; Zhang, X. Microstructure and properties of high entropy alloy reinforced titanium matrix composites. Mater. Charact. 2022, 187, 111856. [Google Scholar] [CrossRef]
- Saba, F.; Zhang, F.; Liu, S.; Liu, T. Reinforcement size dependence of mechanical properties and strengthening mechanisms in diamond reinforced titanium metal matrix composites. Compos. Part B Eng. 2019, 167, 7–19. [Google Scholar] [CrossRef]
- Ren, Y.; Chen, P.; Li, Z.; Zhang, Z.; Lv, Y.; Zhang, C. Effect of strain rate on the mechanical properties of a tungsten particle reinforced titanium matrix composite. J. Mater. Res. Technol. 2021, 15, 984–995. [Google Scholar] [CrossRef]
- Pan, Y.; Li, W.; Lu, X.; Hayat, M.D.; Yin, L.; Song, W.; Qu, X.; Cao, P. Microstructure and tribological properties of titanium matrix composites reinforced with in situ synthesized tic particles. Mater. Charact. 2020, 170, 110633. [Google Scholar] [CrossRef]
- Alojaly, H.M.; Hammouda, A.; Benyounis, K.Y. 12.27—Review of recent developments on metal matrix composites with particulate reinforcement. In Comprehensive Materials Processing, 2nd ed.; Hashmi, S., Ed.; Elsevier: Amsterdam, The Netherlands, 2024; pp. 350–373. [Google Scholar]
- Wang, Q.; Zhang, Z.; Jia, X.; He, Y.; Zhou, J.; Sun, Y.; Wang, H.; Cheng, X. Microstructure and mechanical properties of titanium matrix composites reinforced with organic-derived ceramic phases via spark plasma sintering. J. Alloys Compd. 2025, 1013, 178562. [Google Scholar] [CrossRef]
- Zhao, Z.; Guo, Y.; Du, W.; Bai, P.; Zhang, Z.; Wang, L.; Ma, K.; Zhang, S.; Han, X.; Yang, C. Corrosion behavior of sic/ti6al4v titanium matrix composites fabricated by slm. J. Mater. Res. Technol. 2024, 31, 534–542. [Google Scholar] [CrossRef]
- Liu, H.; Song, X.; Wei, H.; Song, Y.; Liu, Y.; Long, L.; Chen, H.; Duan, Z.; Han, Y.; Ran, X. TiO2 nanofiber-derived in-situ Al2O3 particles reinforced tial matrix composites. Intermetallics 2024, 174, 108470. [Google Scholar] [CrossRef]
- Liu, Y.; Chen, Z.; He, J. Nanosized sic particle reinforced ti6al4v matrix composites manufactured by laser melting deposition. Procedia Struct. Integr. 2022, 42, 1249–1258. [Google Scholar] [CrossRef]
- Lu, W.; Zhang, D.; Zhang, X.; Wu, R.; Sakata, T.; Mori, H. Microstructural characterization of TIB in in situ synthesized titanium matrix composites prepared by common casting technique. J. Alloys Compd. 2001, 327, 240–247. [Google Scholar] [CrossRef]
- Kaykilarli, C.; Uzunsoy, D.; Yeprem, H.A. Role of process control agent in the production of al2o3-reinforced titanium matrix composites. Ceram. Int. 2024, 50, 16452–16462. [Google Scholar] [CrossRef]
- Tuzemen, C.; Yavas, B.; Akin, I.; Yucel, O.; Sahin, F.; Goller, G. Production and characterization of tzm based tic or zrc reinforced composites prepared by spark plasma sintering (sps). J. Alloys Compd. 2019, 781, 433–439. [Google Scholar] [CrossRef]
- Dal Bó, M.R.; Salvador, C.A.F.; Mello, M.G.; Lima, D.D.; Faria, G.A.; Ramirez, A.J.; Caram, R. The effect of zr and sn additions on the microstructure of ti-nb-fe gum metals with high elastic admissible strain. Mater. Des. 2018, 160, 1186–1195. [Google Scholar] [CrossRef]
- Lin, J.; Li, X.; Wang, C.; Xu, R.; Zhang, X.; Lu, F.; Lin, P.; Mei, H.; Liu, Y.; Zhuang, Y.; et al. Interfacial behaviors and mechanism of zrc-sic composite and ti system under pulsed electric current. Compos. Part B Eng. 2023, 260, 110771. [Google Scholar] [CrossRef]
- Hu, Y.; Jiang, M.; Cong, X.; Liu, G.; Yi, X.; Liu, X. Lightweight, multifunctional recycled carbon fibre/mxene/pedot: Pss nonwoven veils with double-layered structure for excellent electromagnetic interference shielding. Chem. Eng. J. 2024, 489, 151122. [Google Scholar] [CrossRef]
- Lone, N.F.; Czerwinski, F.; Chen, D. Present challenges in development of lightweight high entropy alloys: A review. Appl. Mater. Today 2024, 39, 102296. [Google Scholar] [CrossRef]
- Syduzzaman, M.; Saad, M.S.I.; Piam, M.F.; Talukdar, T.A.; Shobdo, T.T.; Pritha, N.M. Carbon nanotubes: Structure, properties and applications in the aerospace industry. Results Mater. 2025, 25, 100654. [Google Scholar] [CrossRef]
- Zhou, X.; Gao, Y.; Wang, Y. Wear behavior of ni-coated carbon fiber and zrc particles reinforced 2024al matrix composites. Wear 2023, 528, 204967. [Google Scholar] [CrossRef]
- Shu, X.; Chen, G.; Cao, H.; Liu, J.; Yin, Q.; Yu, S.; Zhang, B.; Feng, J. A novel coating method to fabricate zrc reinforced metal matrix composite cladding. Surf. Coat. Technol. 2021, 426, 127789. [Google Scholar] [CrossRef]
- Gonçalves, V.R.M.; Filho, P.N.L.; Afonso, C.R.M. Unravelling microstructure of novel as-cast in-situ α ti and β ti-nb alloy matrix composites with nbc addition. Mater. Lett. 2023, 349, 134794. [Google Scholar] [CrossRef]
- Gonçalves, V.R.M.; Corrêa, D.R.N.; Grandini, C.R.; Pintão, C.A.F.; Afonso, C.R.M.; Filho, P.N.L. Assessment of improved tribocorrosion in novel in-situ ti and β ti–40nb alloy matrix composites produced with nbc addition during arc-melting for biomedical applications. Mater. Chem. Phys. 2023, 301, 127597. [Google Scholar] [CrossRef]


Disclaimer/Publisher’s Note: The statements, opinions and data contained in all publications are solely those of the individual author(s) and contributor(s) and not of MDPI and/or the editor(s). MDPI and/or the editor(s) disclaim responsibility for any injury to people or property resulting from any ideas, methods, instructions or products referred to in the content. |
© 2025 by the authors. Licensee MDPI, Basel, Switzerland. This article is an open access article distributed under the terms and conditions of the Creative Commons Attribution (CC BY) license (https://creativecommons.org/licenses/by/4.0/).