

Experimental Investigation of the Interplay Between Al-, B-, and Ti-Nitrides in Microalloyed Steel and Thermodynamic Analysis


Abstract
1. Introduction
2. The Thermodynamics of the Fe-C-N-A-B-Ti System in the Fe-Rich Corner in Microalloyed Steel
2.1. Calphad Modeling
2.2. Subsystems with Relevance in Microalloyed Steel
2.3. Gibbs Energy Description of the BN-Phase
3. Materials and Sample Characterization
3.1. Composition
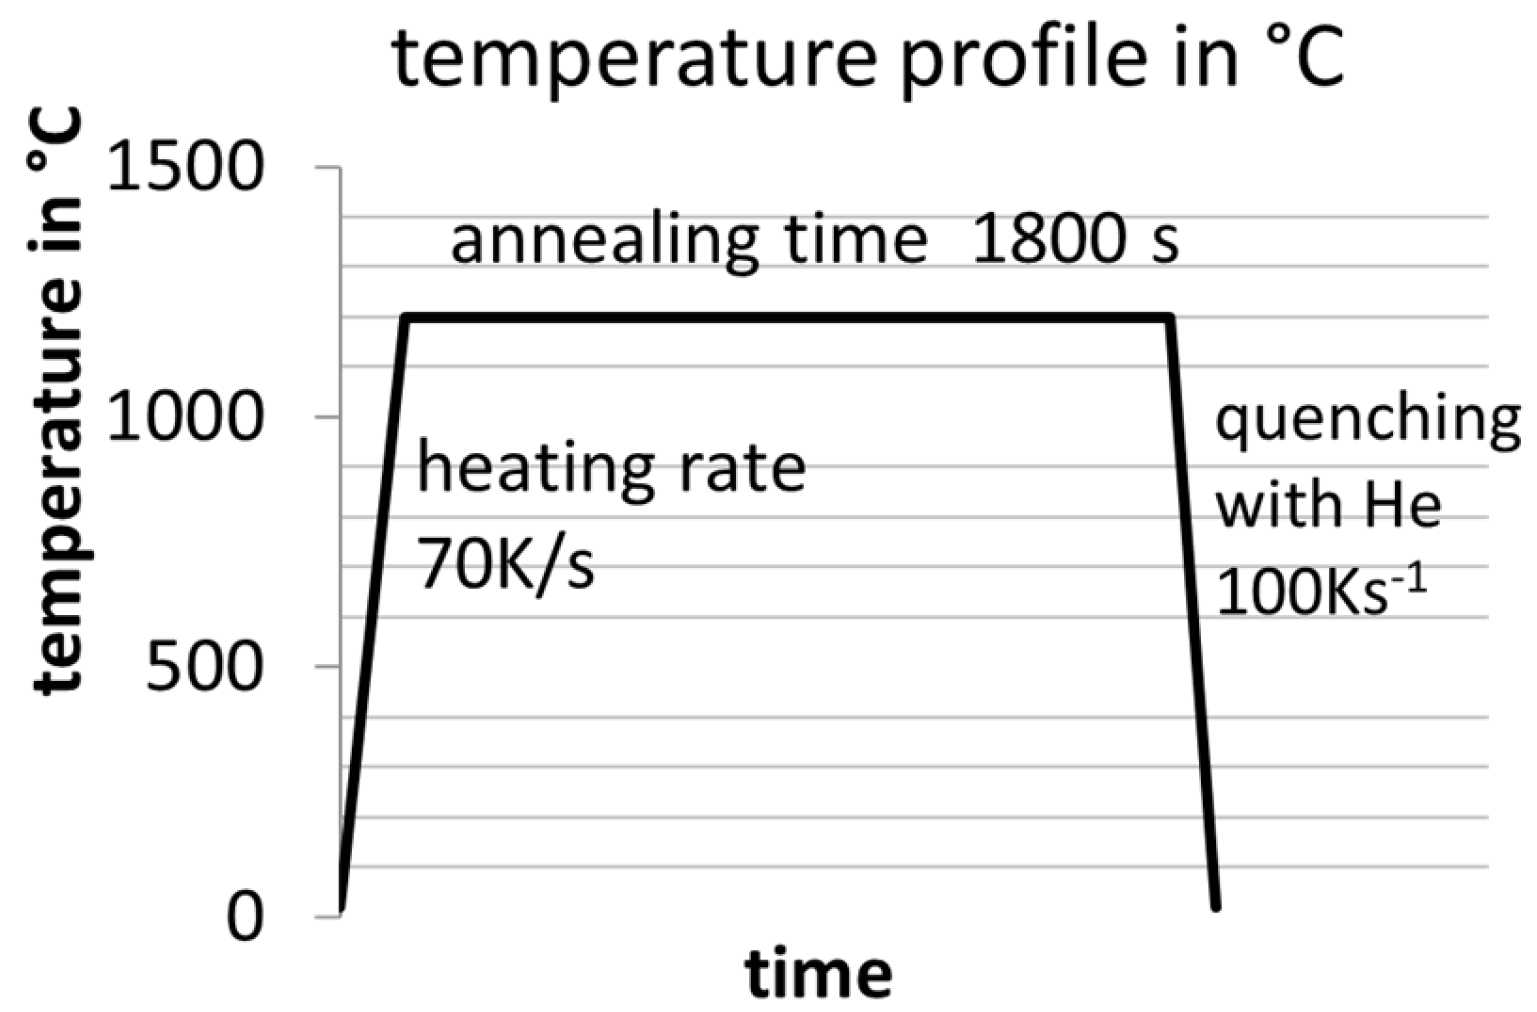
3.2. Methods
3.2.1. Microstructure Analysis
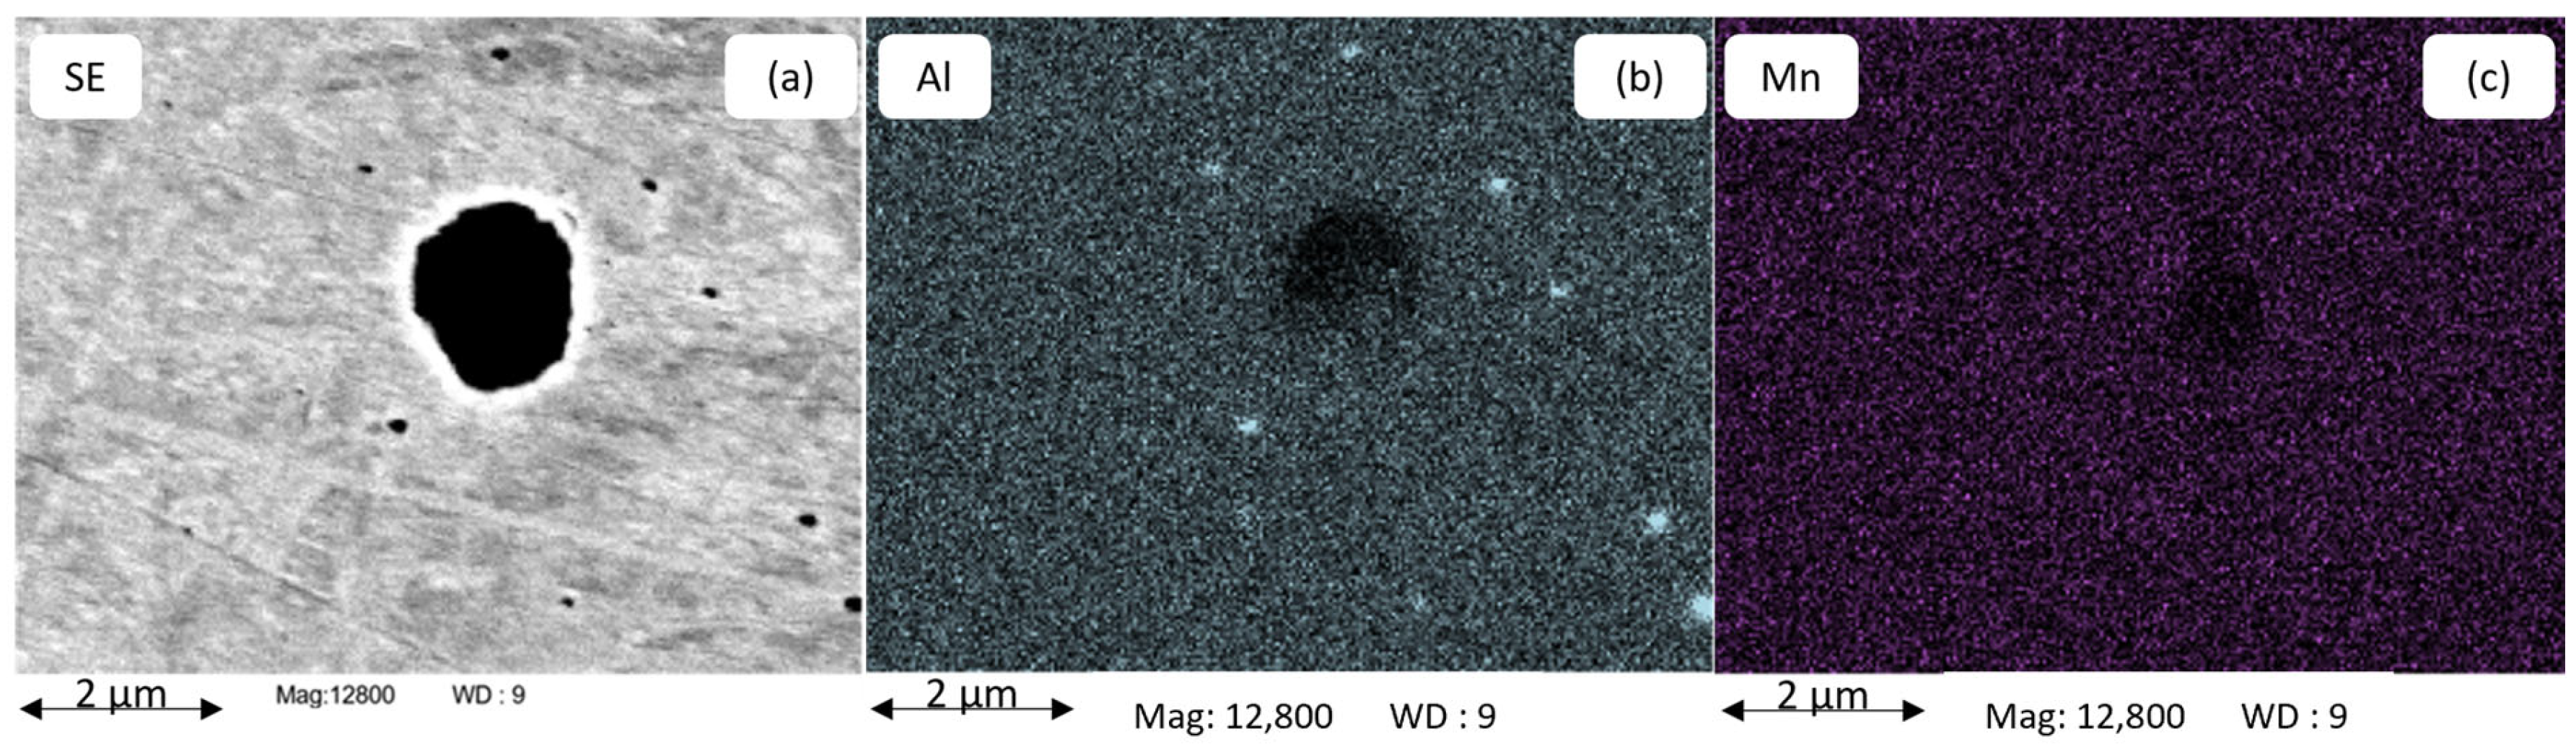
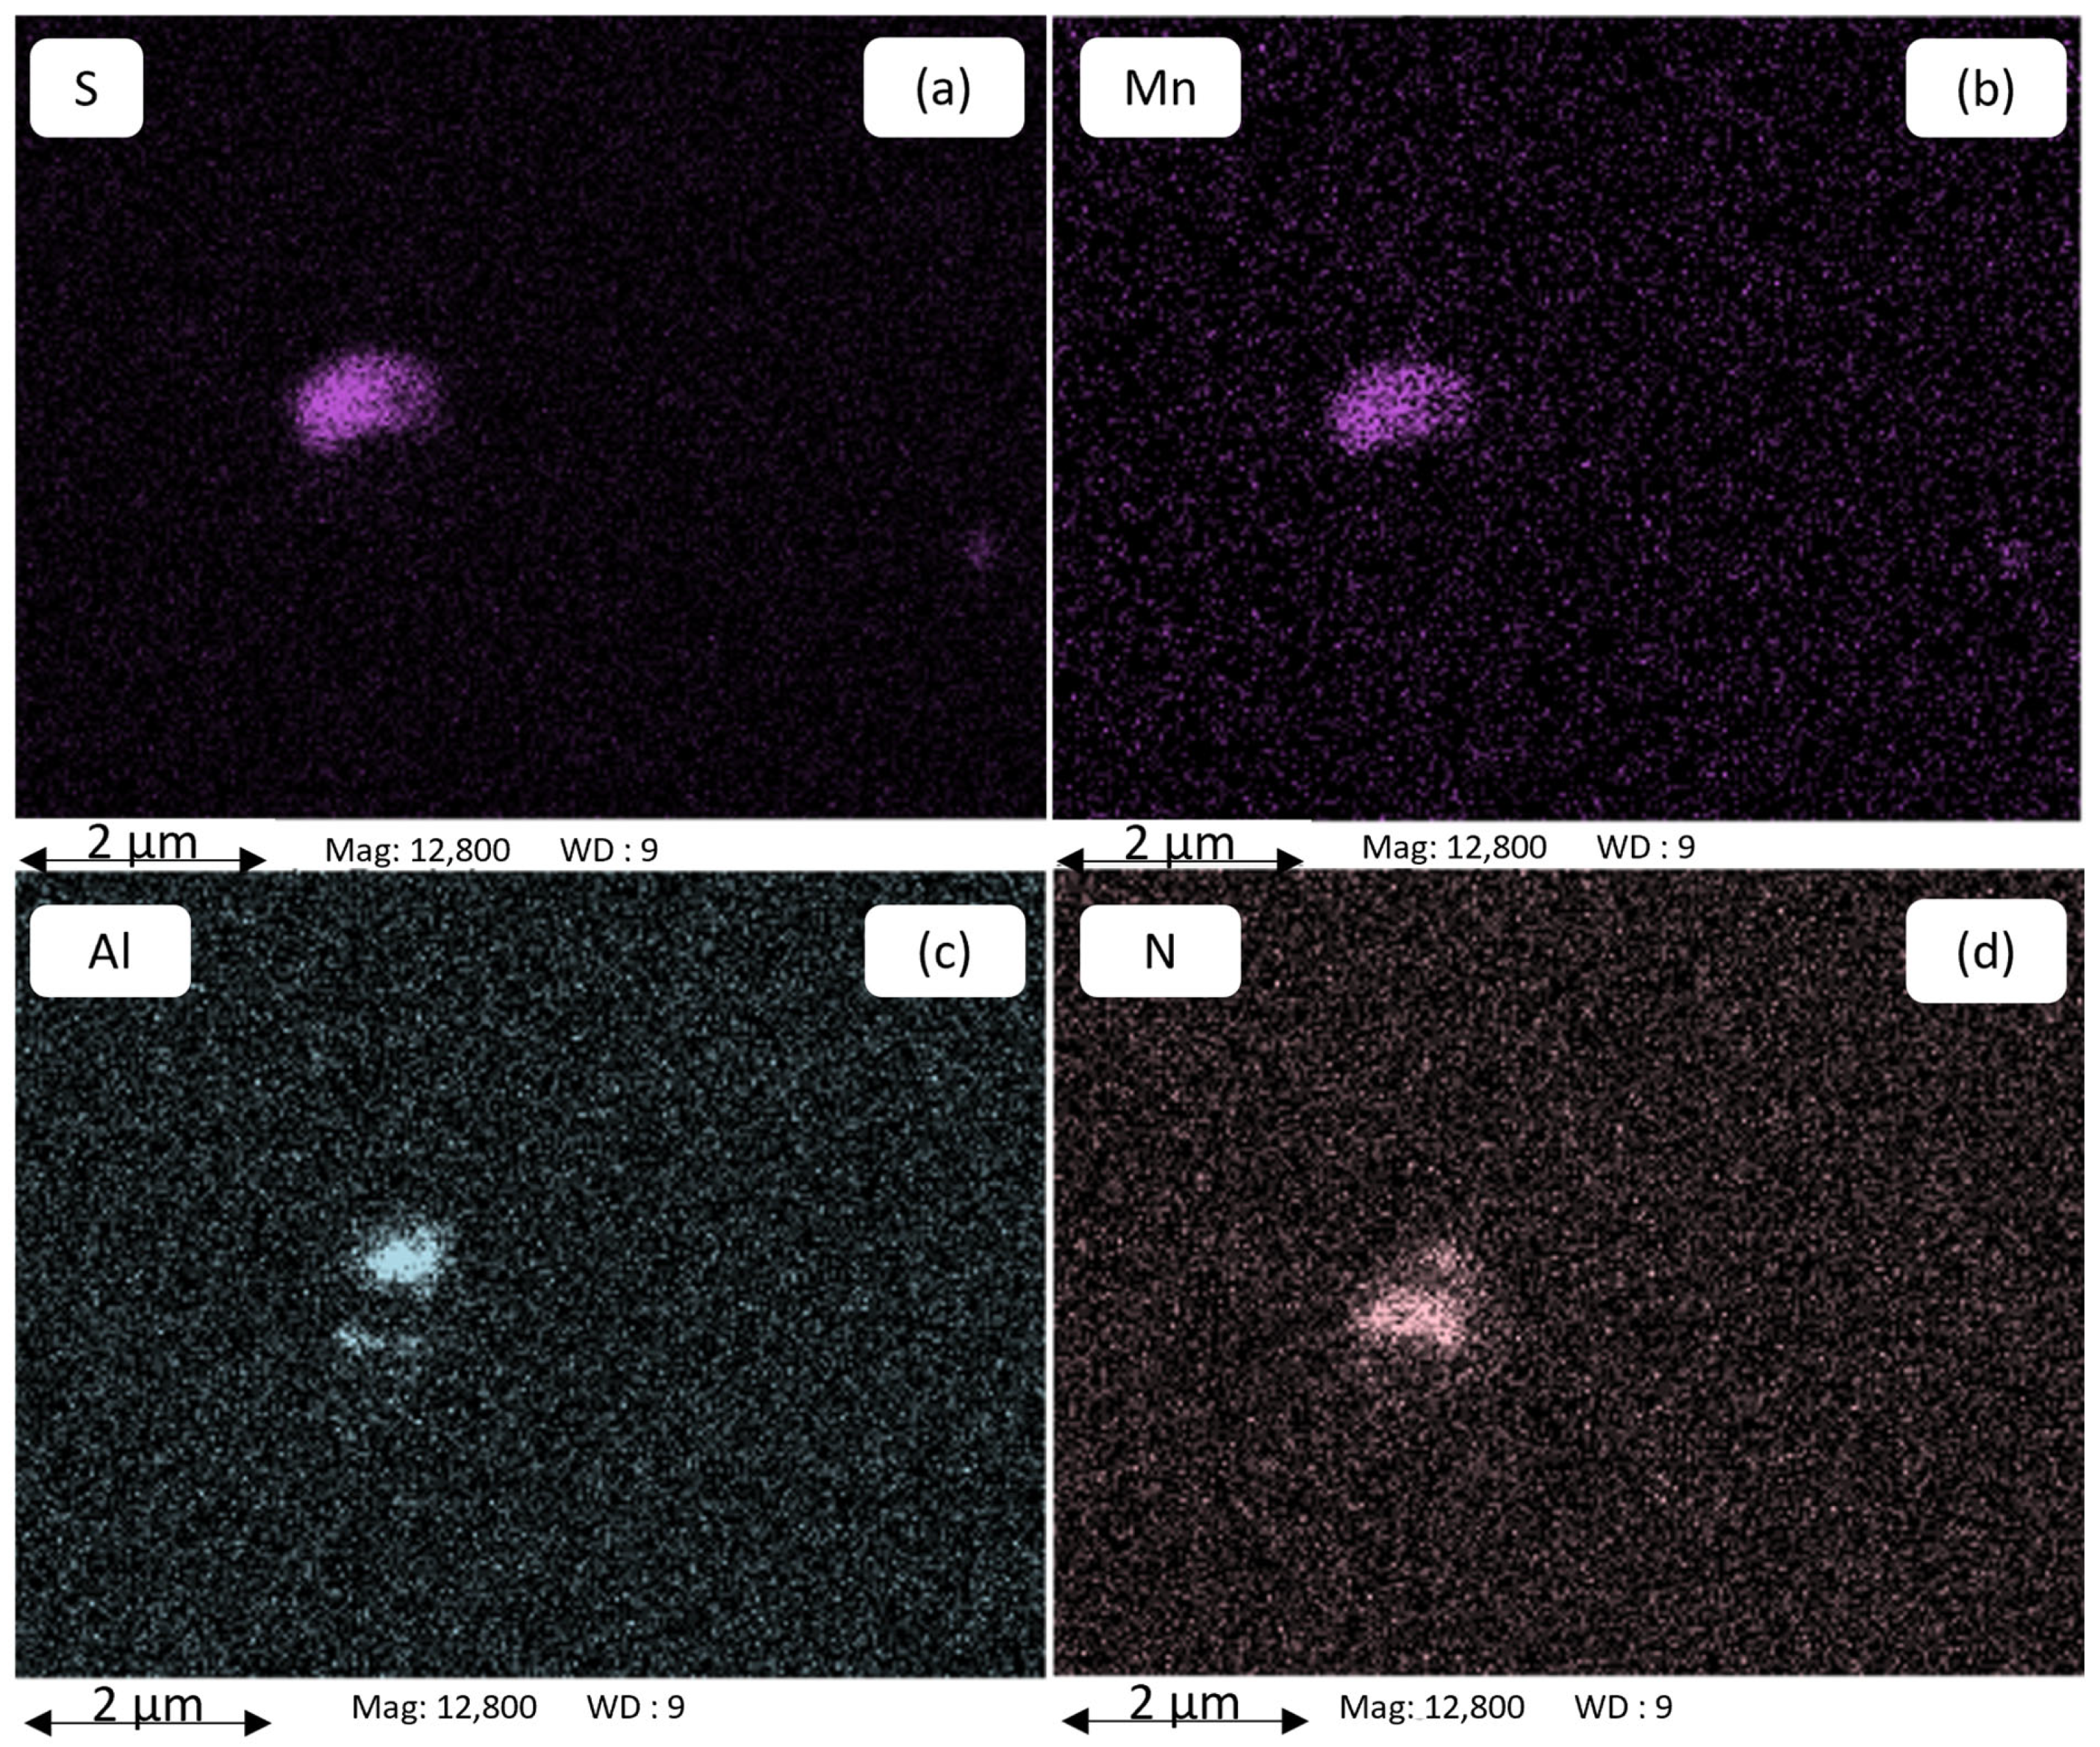
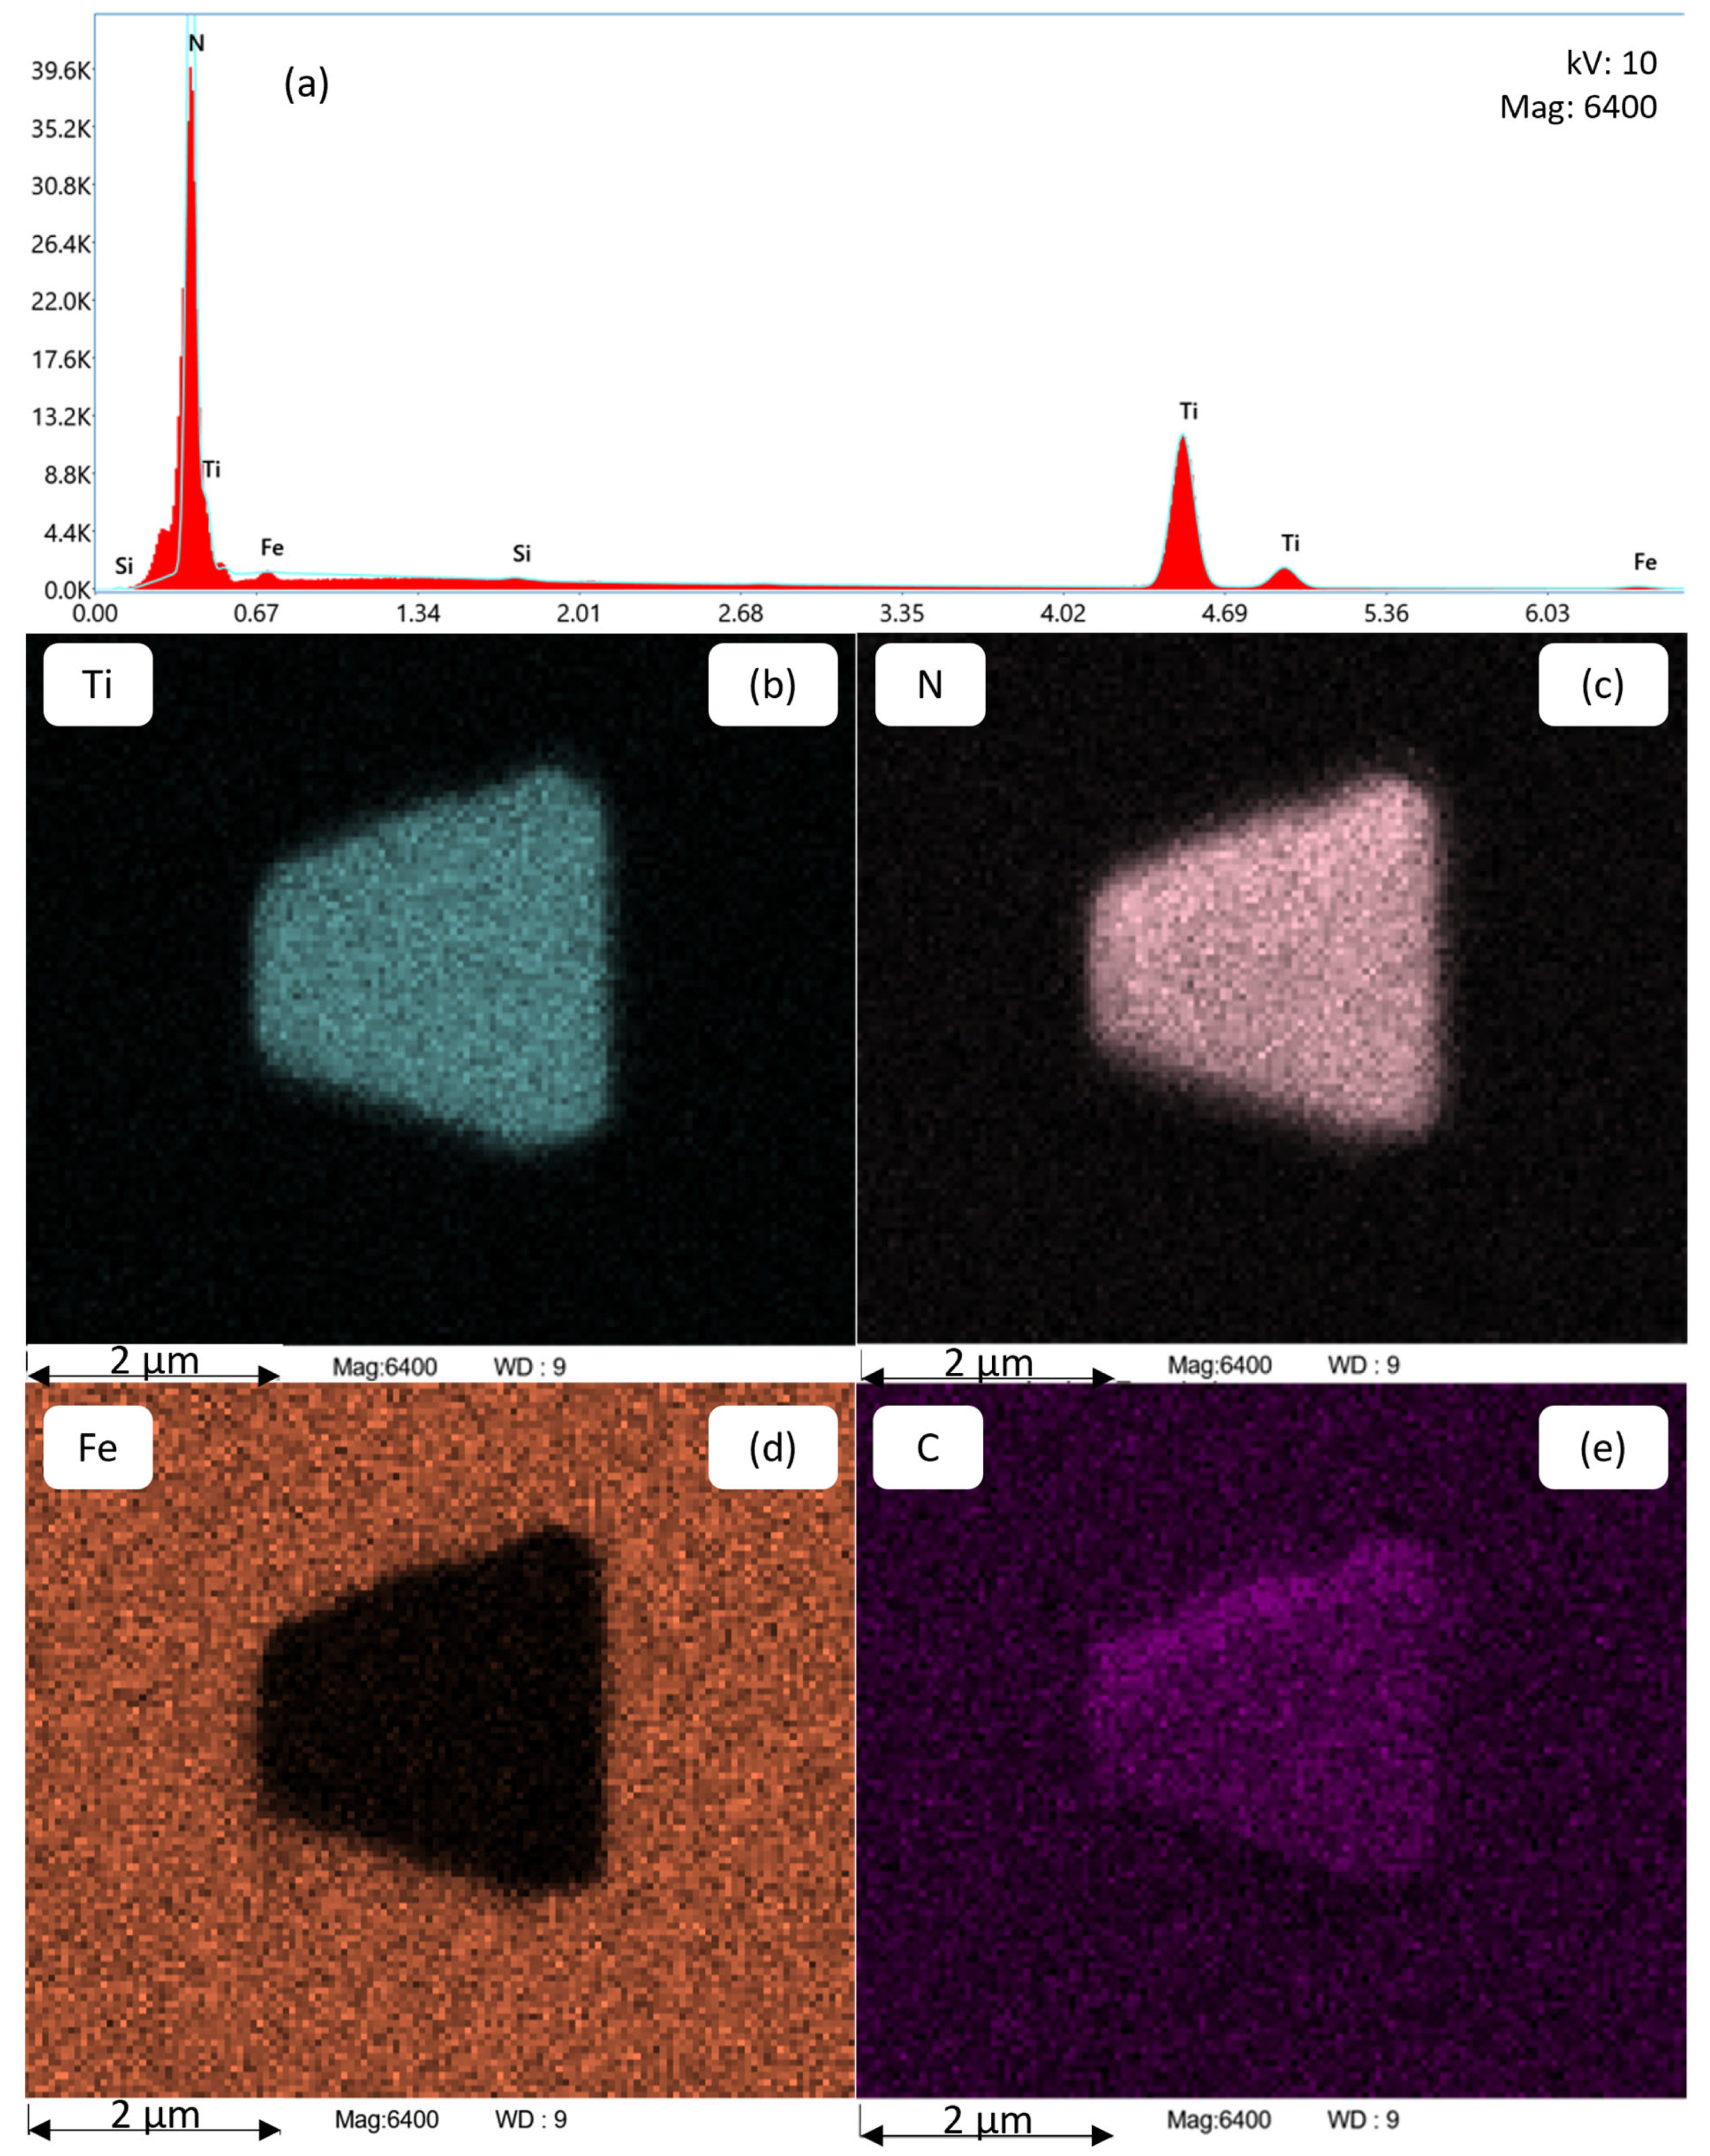
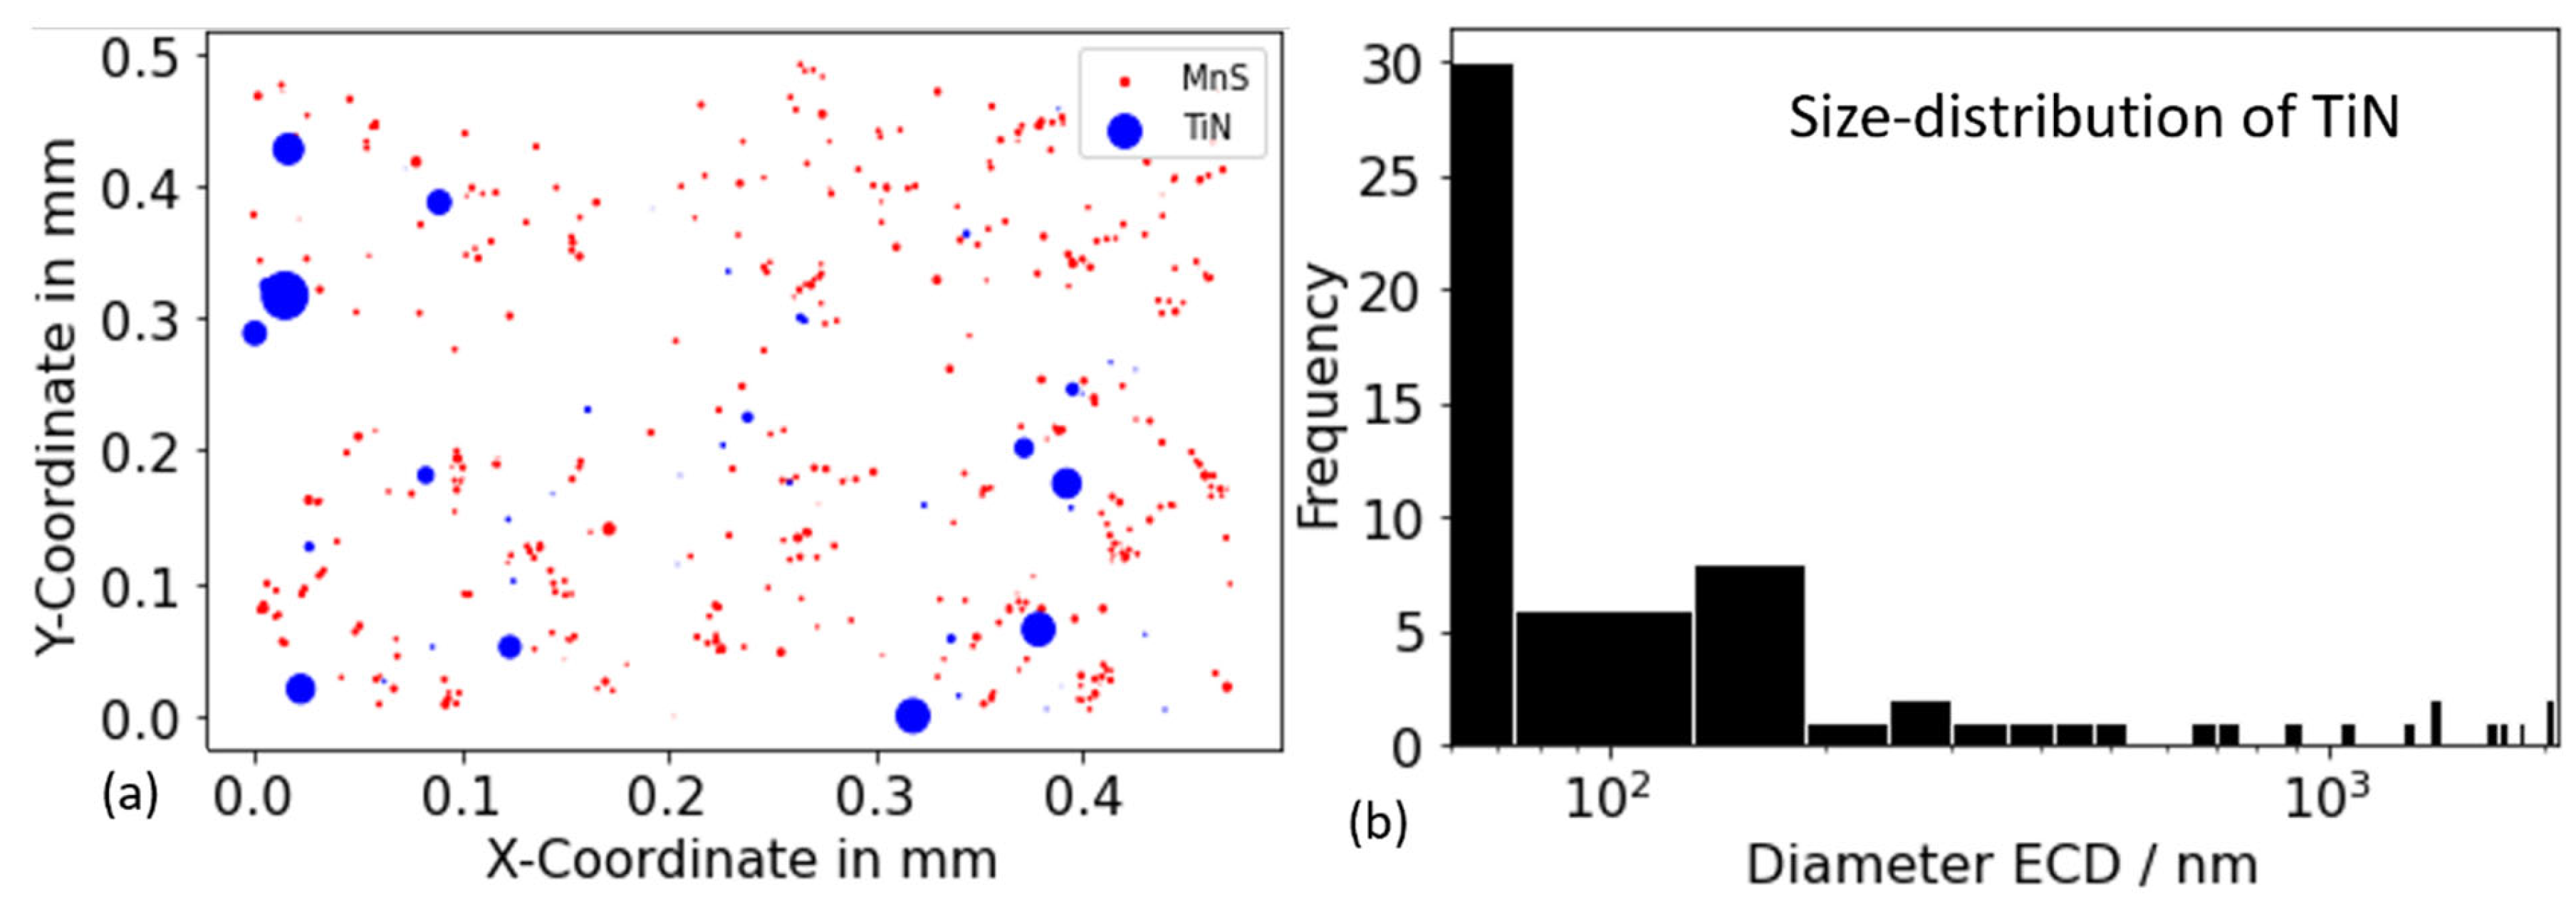
3.2.2. EDS—Particle Analysis
4. Results
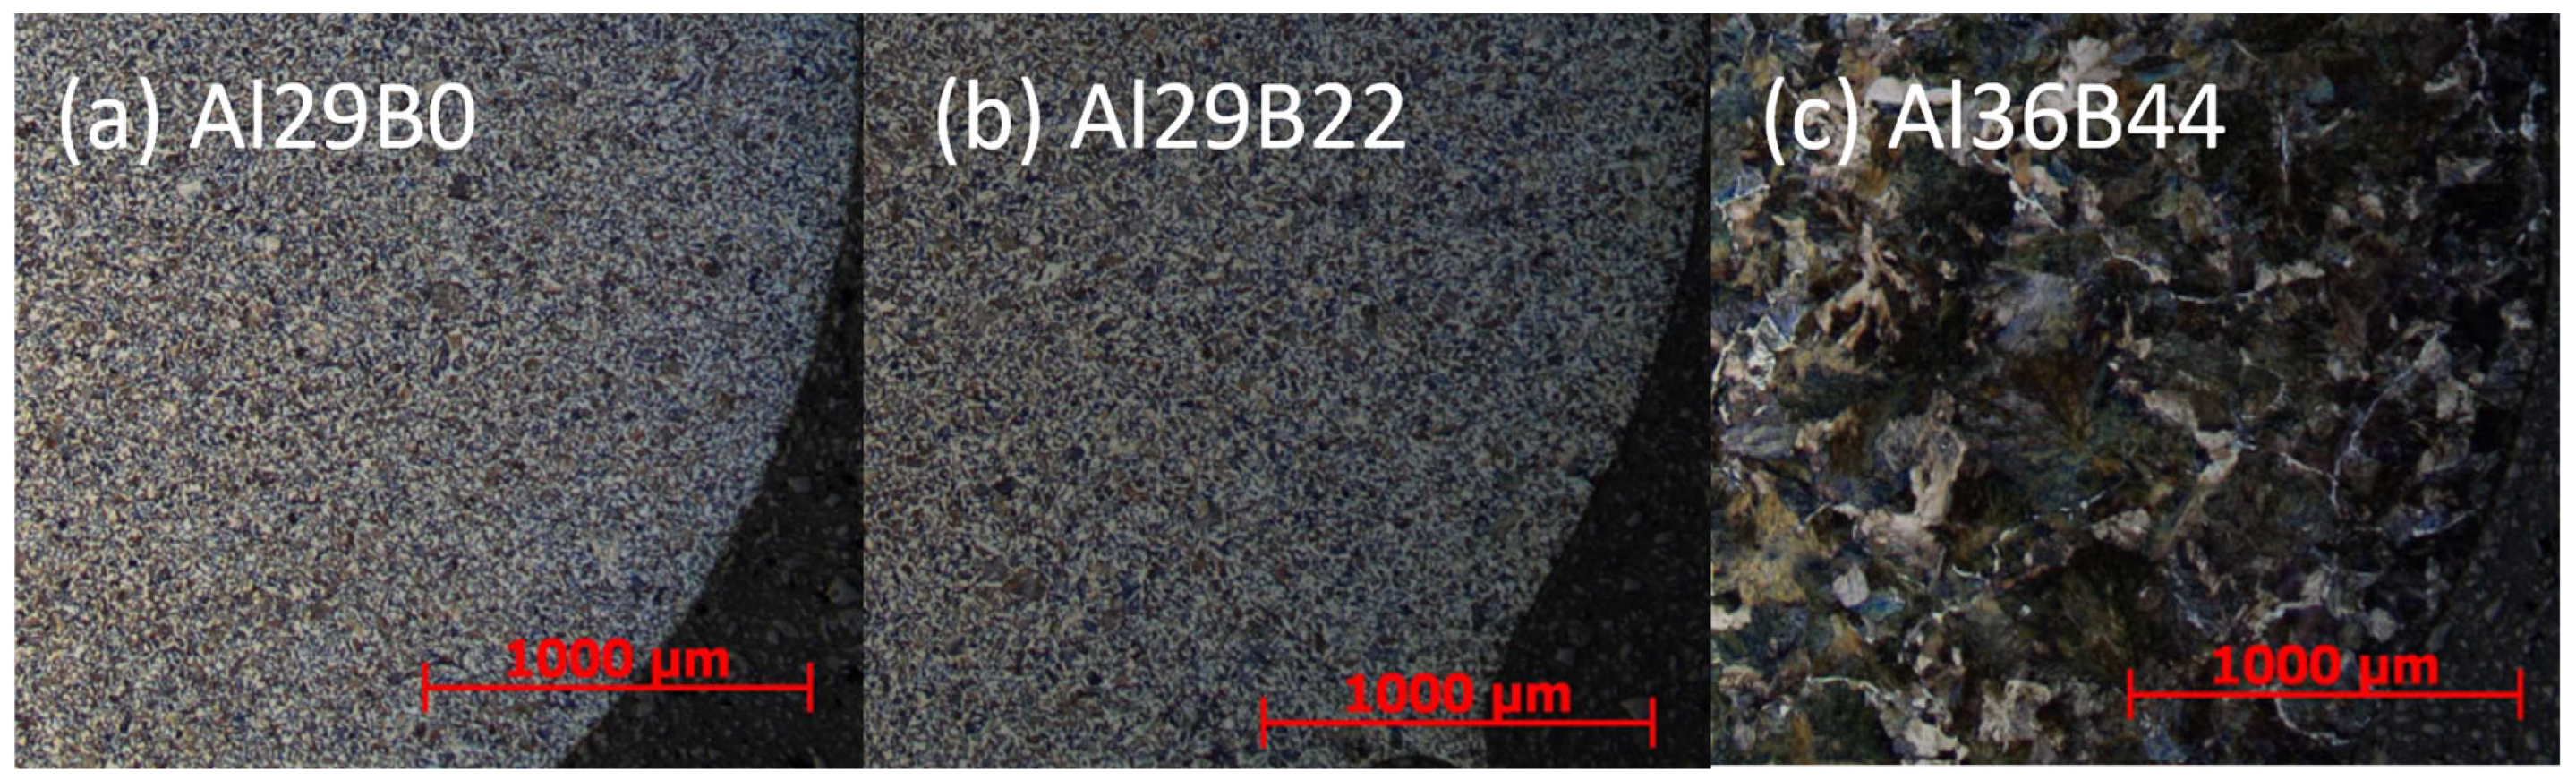
4.1. Initial Microstructure
4.2. Interrelation of AlN and BN Within Fe-C-N-Al-B
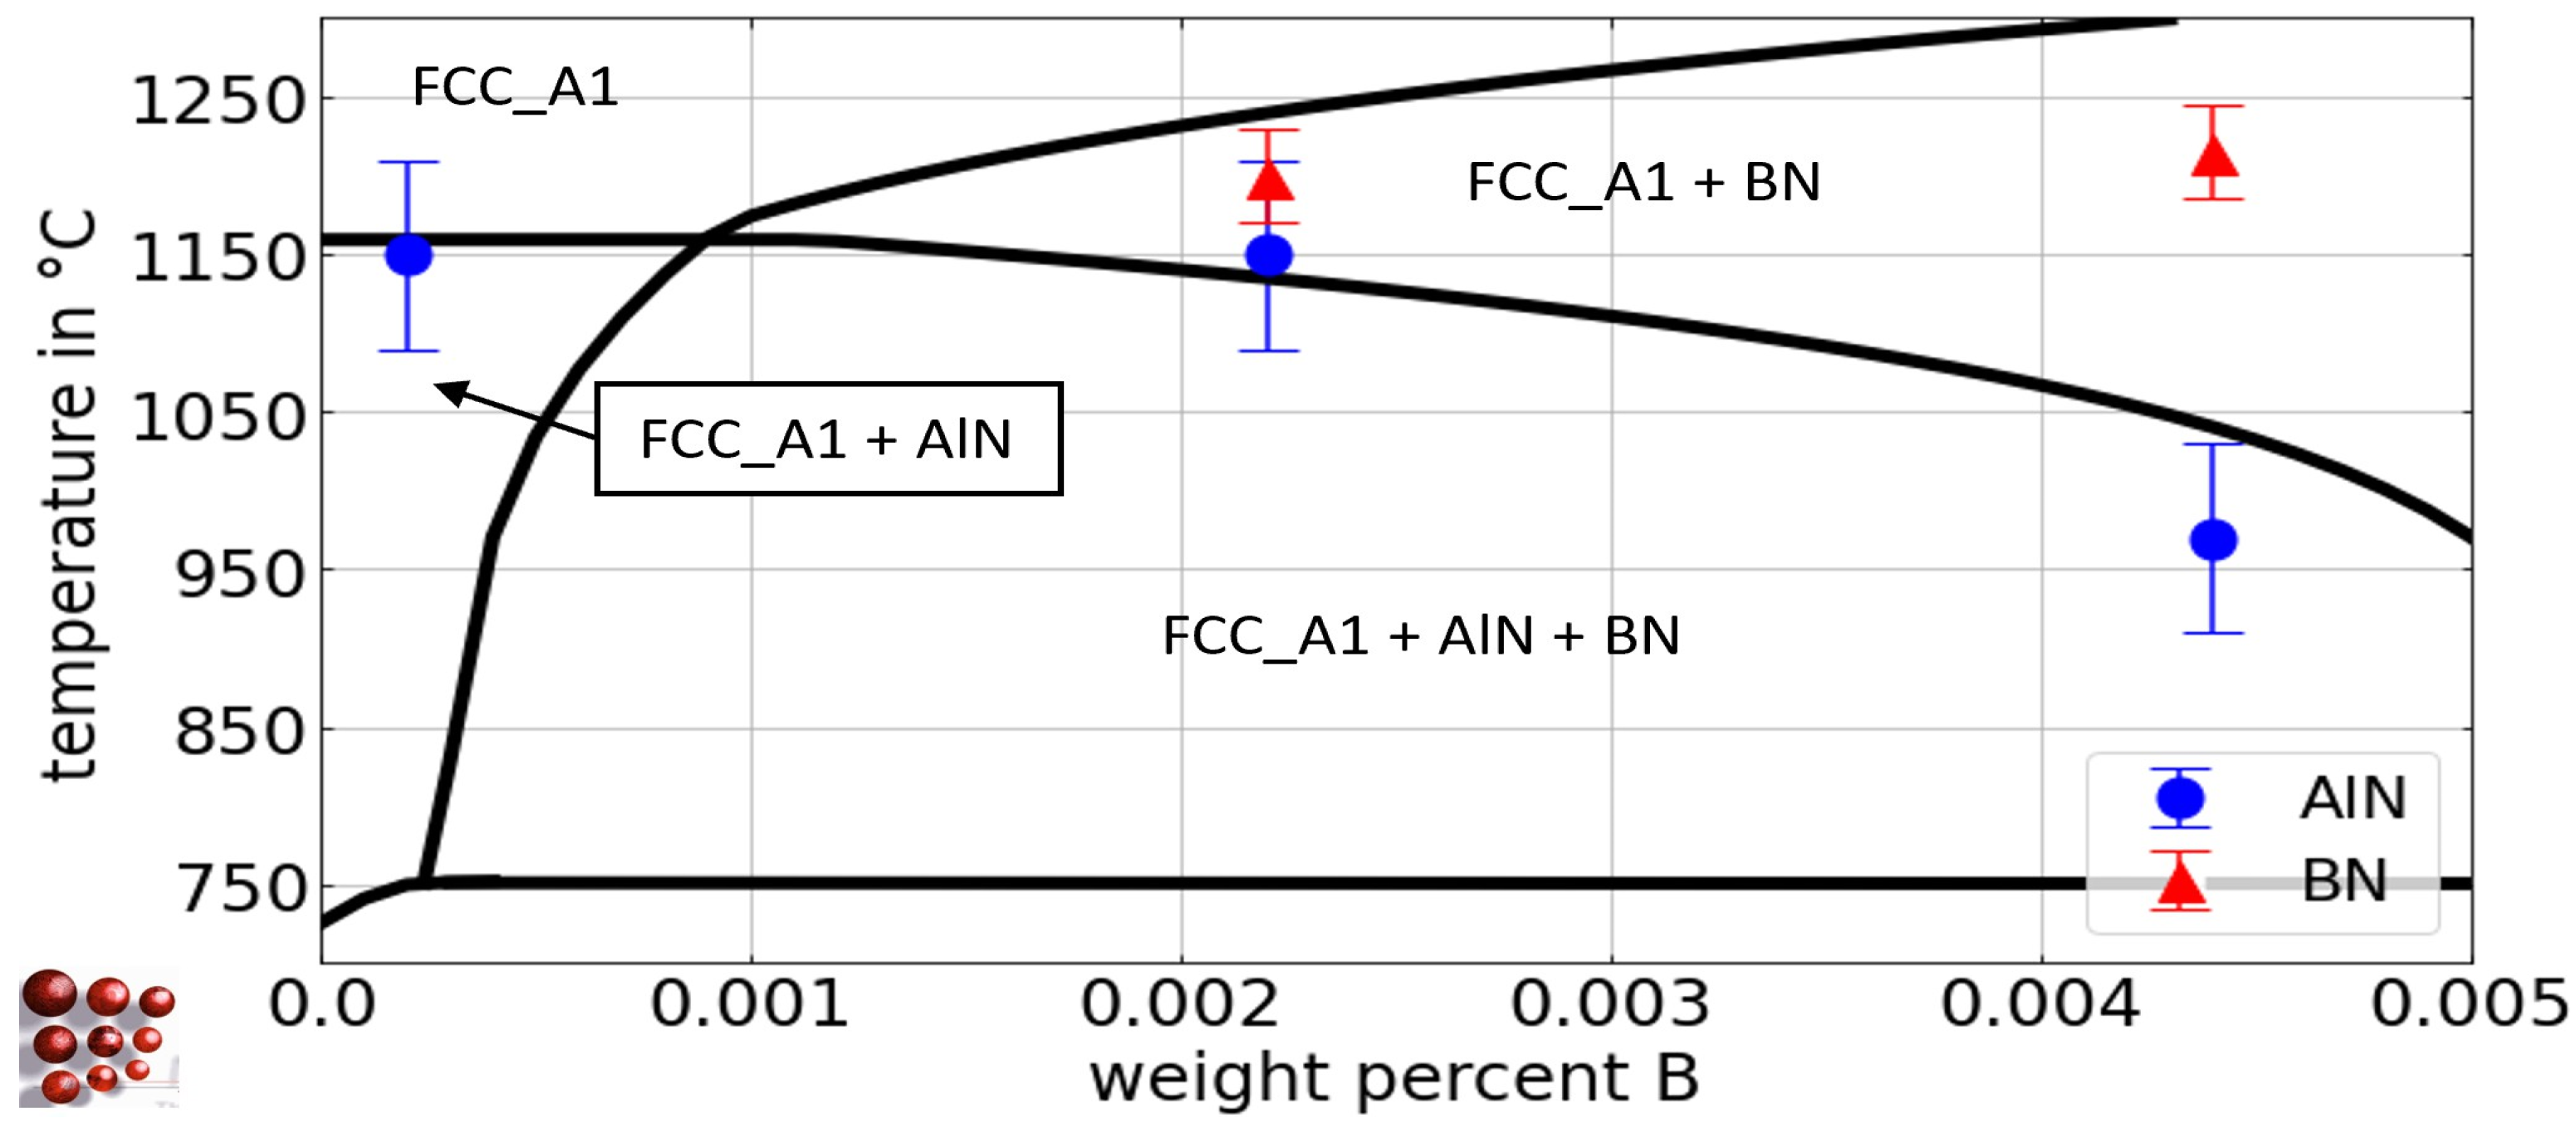
4.2.1. Solvus—Temperature of AlN and BN
4.2.2. Pseudo-Binary Fe-Al and Fe-B Phase Diagram Within the Fe-N-C-Al-B System
4.3. Interrelation of AlN, BN, and TiN Within Fe-C-N-Al-B-Ti
4.3.1. Experiment
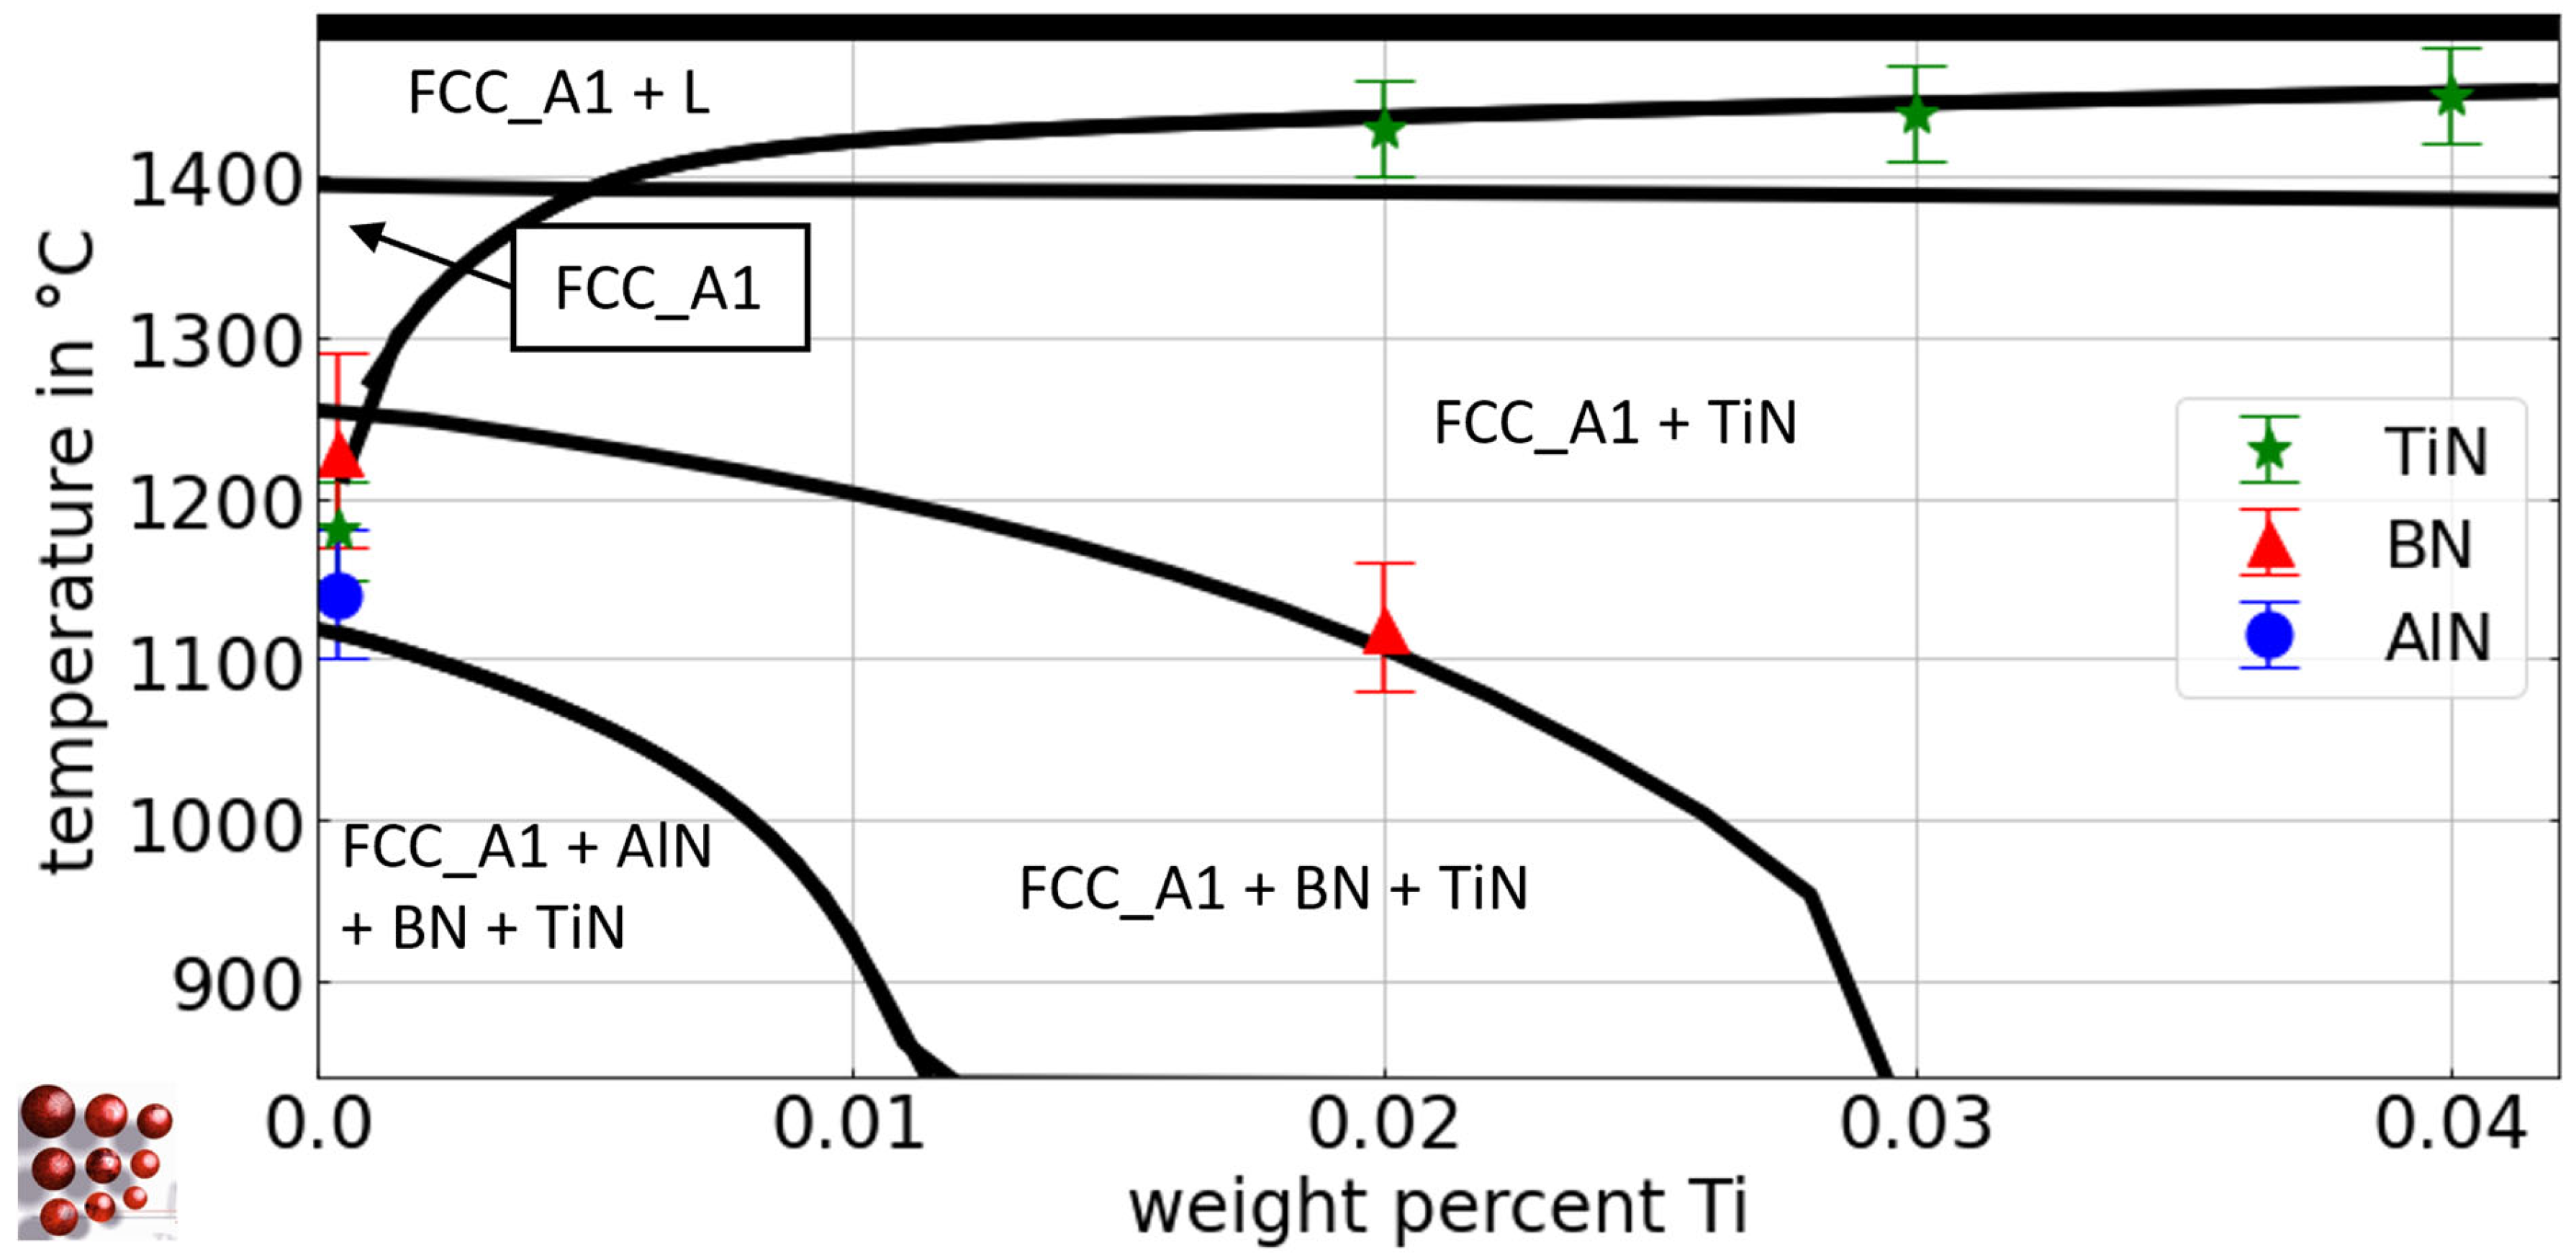
4.3.2. Pseudo-Binary Fe-Ti Phase Diagram Within the Fe-N-C-Al-B-Ti System
5. Summary
Author Contributions
Funding
Data Availability Statement
Acknowledgments
Conflicts of Interest
References
- Baker, T.N. Microalloyed Steels. Ironmak. Steelmak. 2016, 43, 264–307. [Google Scholar] [CrossRef]
- e Silva, A.C. Challenges and opportunities in thermodynamic and kinetic modeling microalloyed HSLA steels using computational thermodynamics. Calphad 2020, 68, 101720. [Google Scholar] [CrossRef]
- Habu, R.; Miyata, M.; Tamukai, S.; Sekino, S. Improvement of Hardenability of Steel Containing Aluminum and Boron by Double Quenching. Trans. Iron Steel Inst. Jpn. 1983, 23, 176–183. [Google Scholar] [CrossRef]
- Kawamura, K.; Otsubo, T.; Furukawa, T. Relationship between the Hardenability of Steel and the “Effective Boron” in Steel. Trans. Iron Steel Inst. Jpn. 1976, 16, 545–550. [Google Scholar] [CrossRef]
- McMahon, C.J. The role of solute segregation in promoting the hardenability of steel. Met. Trans. A 1980, 11, 531–535. [Google Scholar] [CrossRef]
- Wipp, D. Boron Influence on Microstructural Evolution and Mechanical Properties in Micro-Alloyed Carbon Steels: Precipitation and Segregation Behavior. Ph.D. Thesis, Technische Universität Wien, Vienna, Austria.
- Sharma, M.; Ortlepp, I.; Bleck, W. Boron in Heat-Treatable Steels: A Review. Steel Res. Int. 2019, 90, 1900133. [Google Scholar] [CrossRef]
- Wang, W.S.; Zhu, H.Y.; Sun, J.; Lei, J.L.; Duan, Y.Q.; Wang, Q. Thermodynamic analysis of BN, AlN AND TiN Precipitation in boron-bearing steel. Metalurgija 2019, 58, 199–202. [Google Scholar]
- Baker, T.N. Titanium microalloyed steels. Ironmak. Steelmak. 2019, 46, 1–55. [Google Scholar] [CrossRef]
- Wilson, F.G.; Gladman, T. Aluminium nitride in steel. Int. Mater. Rev. 1988, 33, 221–286. [Google Scholar] [CrossRef]
- Gontijo, M.; Chakraborty, A.; Webster, R.F.; Ilie, S.; Six, J.; Primig, S.; Sommitsch, C. Thermomechanical and Microstructural Analysis of the Influence of B- and Ti-Content on the Hot Ductility Behavior of Microalloyed Steels. Metals 2022, 12, 1808. [Google Scholar] [CrossRef]
- Kaufman, L.; Bernstein, H. Computer Calculation of Phase Diagrams with Special Reference to Refractory Metals; Academic Press Inc.: New York, NY, USA, 1970. [Google Scholar]
- Gustafson, P. A thermodynamic evaluation of the Fe-C system. Calphad 1985, 259–267. [Google Scholar] [CrossRef]
- Frisk, K. A thermodynamic evaluation of the Cr-N, Fe-N, Mo-N and Cr-Mo-N systems. Calphad 1991, 15, 79–106. [Google Scholar] [CrossRef]
- Miettinen, J.; Visuri, V.-V.; Fabritius, T.; Vassilev, G. Thermodynamic Description of Ternary Fe-B-X Systems. Part 7: Fe-B-C. Arch. Met. Mater. 2020, 65, 923–933. [Google Scholar] [CrossRef]
- Lee, B.-J. Thermodynamic assessment of the Fe-Nb-Ti-C-N system. Met. Mater. Trans. A 2001, 32, 2423–2439. [Google Scholar] [CrossRef]
- Chin, K.-G.; Lee, H.-J.; Kwak, J.-H.; Kang, J.-Y.; Lee, B.-J. Thermodynamic calculation on the stability of (Fe, Mn) 3AlC carbide in high aluminum steels. J. Alloy. Compd. 2010, 505, 217–223. [Google Scholar] [CrossRef]
- Povoden-Karadeniz, E. (Ed.) Thermodynamic Database “ME-Fe_CDLIPE2.0.2.tdb. Unpublished work. 2025. [Google Scholar]
- Rios, P.R.; da Fonseca, G.S. Grain Boundary Pinning by Particles. Mater. Sci. Forum 2010, 638–642, 3907–3912. [Google Scholar] [CrossRef]
- Radis, R.; Kozeschnik, E. Kinetics of AlN Precipitation in Microalloyed Steel. Model. Simul. Mater. Sci. Eng. 2010, 18, 55003. [Google Scholar] [CrossRef]
- Wriedt, H.A. The Al−N (Aluminum-Nitrogen) System. Bull. Alloy. Phase Diagr. 1986, 7, 329–333. [Google Scholar] [CrossRef]
- Bruls, R.; Hintzen, H.; de With, G.; Metselaar, R.; van Miltenburg, J. The temperature dependence of the Grüneisen parameters of MgSiN2, AlN and β-Si3N4. J. Phys. Chem. Solids 2001, 62, 783–792. [Google Scholar] [CrossRef]
- Lu, X.-G.; Selleby, M.; Sundman, B. Assessments of molar volume and thermal expansion for selected bcc, fcc and hcp metallic elements. Calphad 2005, 29, 68–89. [Google Scholar] [CrossRef]
- Sennour, M.; Esnouf, C. Contribution of Advanced Microscopy Techniques to Nano-Precipitates Characterization: Case of AlN Precipitation in Low-Carbon Steel. Acta Mater. 2003, 51, 943–957. [Google Scholar] [CrossRef]
- Gao, N.; Baker, T.N. Austenite Grain Growth Behaviour of Microalloyed Al-V-N and Al-V-Ti-N Steels. ISIJ Int. 1998, 38, 744–751. [Google Scholar] [CrossRef]
- Chen, Y.-L.; Wang, Y.; Zhao, A. Precipitation of AlN and MnS in Low Carbon Aluminium-Killed Steel. J. Iron Steel Res. Int. 2012, 19, 51–56. [Google Scholar] [CrossRef]
- Führer, M.; Zamberger, S.; Povoden-Karadeniz, E. Experimental determination of AlN in microalloyed steel and thermodynamic analysis. Calphad 2024, 88, 102790. [Google Scholar] [CrossRef]
- Massardier, V.; Guétaz, V.; Merlin, J.; Soler, M. Kinetic and Microstructural Study of Aluminium Nitride Precipitation in a Low Carbon Aluminium-Killed Steel. Mater. Sci. Eng. A 2003, 355, 299–310. [Google Scholar] [CrossRef]
- Pearson, W.B.; Villars, P.; Calvert, L.D. Pearson’s Handbook of Crystallographic Data for Intermetallic Phases; ASM International: Materials Park, OH, USA, 1986. [Google Scholar]
- Suzuki, S.; Tanino, M. Role of Grain Boundary Segregation in Austenite Decomposition of Low-Alloyed Steel. Mater. Sci. Forum 2007, 558–559, 965–970. [Google Scholar] [CrossRef]
- Sakuraya, K.; Okada, H.; Abe, F. Influence of Heat Treatment on Formation Behavior of Boron Nitride Inclusions in P122 Heat Resistant Steel. ISIJ Int. 2006, 46, 1712–1719. [Google Scholar] [CrossRef]
- Jonsson, S. Assessment of the Fe-Ti-C system, calculation of the Fe-TiN system, and prediction of the solubility limit of Ti(C,N) in liquid Fe. Met. Mater. Trans. B 1998, 29, 371–384. [Google Scholar] [CrossRef]
- ASM Handbook Committee. High-Strength Structural and High-Strength Low-Alloy Steels. In Properties and Selection: Irons, Steels and High Performance Alloys, 10th ed.; ASM Metals Handbook; ASM: Metals Park, OH, USA, 1990; Volume 1, pp. 403–423. [Google Scholar]
- Najafkhani, F.; Kheiri, S.; Pourbahari, B.; Mirzadeh, H. Recent Advances in the Kinetics of Normal/Abnormal Grain Growth: A Review. Arch. Civ. Mech. Eng. 2021, 21, 29. [Google Scholar] [CrossRef]
- Monschein, S.; Ragger, K.S.; Zügner, D.; Fasching, J.; Schnitzer, R. Influence of the Ti Content on the Grain Stability and the Recrystallization Behavior of Nb-Alloyed High-Strength Low-Alloyed Steels. Steel Res. Int. 2022, 93, 2200094. [Google Scholar] [CrossRef]
- Su, C.; Zhao, G.; Xiao, H.; Lan, Y.; Huang, F. Abnormal Grain Growth of Hi-B Steel in the Secondary Recrystallization. Met. Microstruct. Anal. 2018, 7, 608–617. [Google Scholar] [CrossRef]
- Roy, S.; Karmakar, A.; Mukherjee, S.; Kundu, S.; Srivastava, D.; Chakrabarti, D. Effect of starting microstructure on austenite grain sizes developed after reheating of HSLA steel. Mater. Sci. Technol. 2014, 30, 1142–1153. [Google Scholar] [CrossRef]
- Lang, D.; Povoden-Karadeniz, E.; Schatte, J.; Knabl, W.; Clemens, H.; Primig, S. Thermodynamic evaluation of the Mo-rich corner of the Mo-Hf-C system including O impurities. J. Alloy. Compd. 2017, 695, 372–381. [Google Scholar] [CrossRef]
- Saunders, N.; Miodownik, A.P. CALPHAD (Calculation of Phase Diagrams): A Comprehensive Guide, Transferred to Digital Print; Pergamon Materials Series: Pergamon, Turkey, 1998. [Google Scholar]
- Dinsdale, A. SGTE Data for Pure Elements. Calphad 1991, 15, 317–425. [Google Scholar] [CrossRef]
- Chipman, J. Thermodynamics and phase diagram of the Fe-C system. Met. Trans. 1972, 3, 55–64. [Google Scholar] [CrossRef]
- Göhring, H.; Leineweber, A.; Mittemeijer, E. A thermodynamic model for non-stoichiometric cementite; the Fe–C phase diagram. Calphad 2016, 52, 38–46. [Google Scholar] [CrossRef]
- Naraghi, R.; Selleby, M.; Ågren, J. Thermodynamics of stable and metastable structures in Fe–C system. Calphad 2014, 46, 148–158. [Google Scholar] [CrossRef]
- Hallstedt, B.; Djurovic, D.; von Appen, J.; Dronskowski, R.; Dick, A.; Körmann, F.; Hickel, T.; Neugebauer, J. Thermodynamic properties of cementite. Calphad 2010, 34, 129–133. [Google Scholar] [CrossRef]
- Van Rompaey, T.; Kumar, K.H.; Wollants, P. Thermodynamic optimization of the B–Fe system. J. Alloy. Compd. 2002, 334, 173–181. [Google Scholar] [CrossRef]
- Chart, T.G. CECA, Research Project No.7210, CA/3/303; Comission des Communautès Europèennes: Brussels, Belgium, 1981. [Google Scholar]
- Massalski, T.B. (Ed.) Binary Alloys Phase Diagrams, 2nd ed.; ASM International: Metals Park, OH, USA, 1990. [Google Scholar]
- Kubaschewski, O. Iron–Binary Phase Diagrams; Springer: Berlin, Germany, 1982. [Google Scholar]
- Hallemans, B.; Wollants, P.; Roos, J.R. Thermodynamic Reassessment and Calculation of the Fe-B Phase Diagram. Int. J. Mater. Res. 1994, 85, 676–682. [Google Scholar] [CrossRef]
- Ohtani, H.; Hasebe, M.; Ishida, K.; Nishizawa, T. Calculation of Fe-C-B ternary phase diagram. Trans. Iron Steel Inst. Jpn. 1988, 28, 1043–1050. [Google Scholar] [CrossRef]
- Kaufman, L.; Uhrenius, B.; Birnie, D.; Taylor, K. Coupled pair potential, thermochemical and phase diagram data for transition metal binary systems-VII. Calphad 1984, 8, 25–66. [Google Scholar] [CrossRef]
- Lucci, A.; Della Gatta, G.; Venturello, G. On the Solubility of Boron in High-Purity Alpha-Iron. Met. Sci. J. 1969, 3, 14–17. [Google Scholar] [CrossRef]
- Brodowsky, H.; Wernicke, H.-J. Activity coefficients and the α-γ transition lines in Fe-B alloys. Calphad 1984, 8, 159–162. [Google Scholar] [CrossRef]
- Brown, A.; Garnish, J.D.; Honeycombe, R.W.K. The Distribution of Boron in Pure Iron. Met. Sci. 1974, 8, 317–324. [Google Scholar] [CrossRef]
- Raghavan, V. B-Fe-N (boron-iron-nitrogen). J. Phase Equilibria Diffus. 1993, 14, 619–620. [Google Scholar] [CrossRef]
- Tomashik, V. Boron—Iron—Nitrogen: Iron systems: Phase diagrams, crystallographic and thermodynamic data. Landolt-Börnstein—Group IV Phys. Chem. 2008, 457–471. [Google Scholar] [CrossRef]
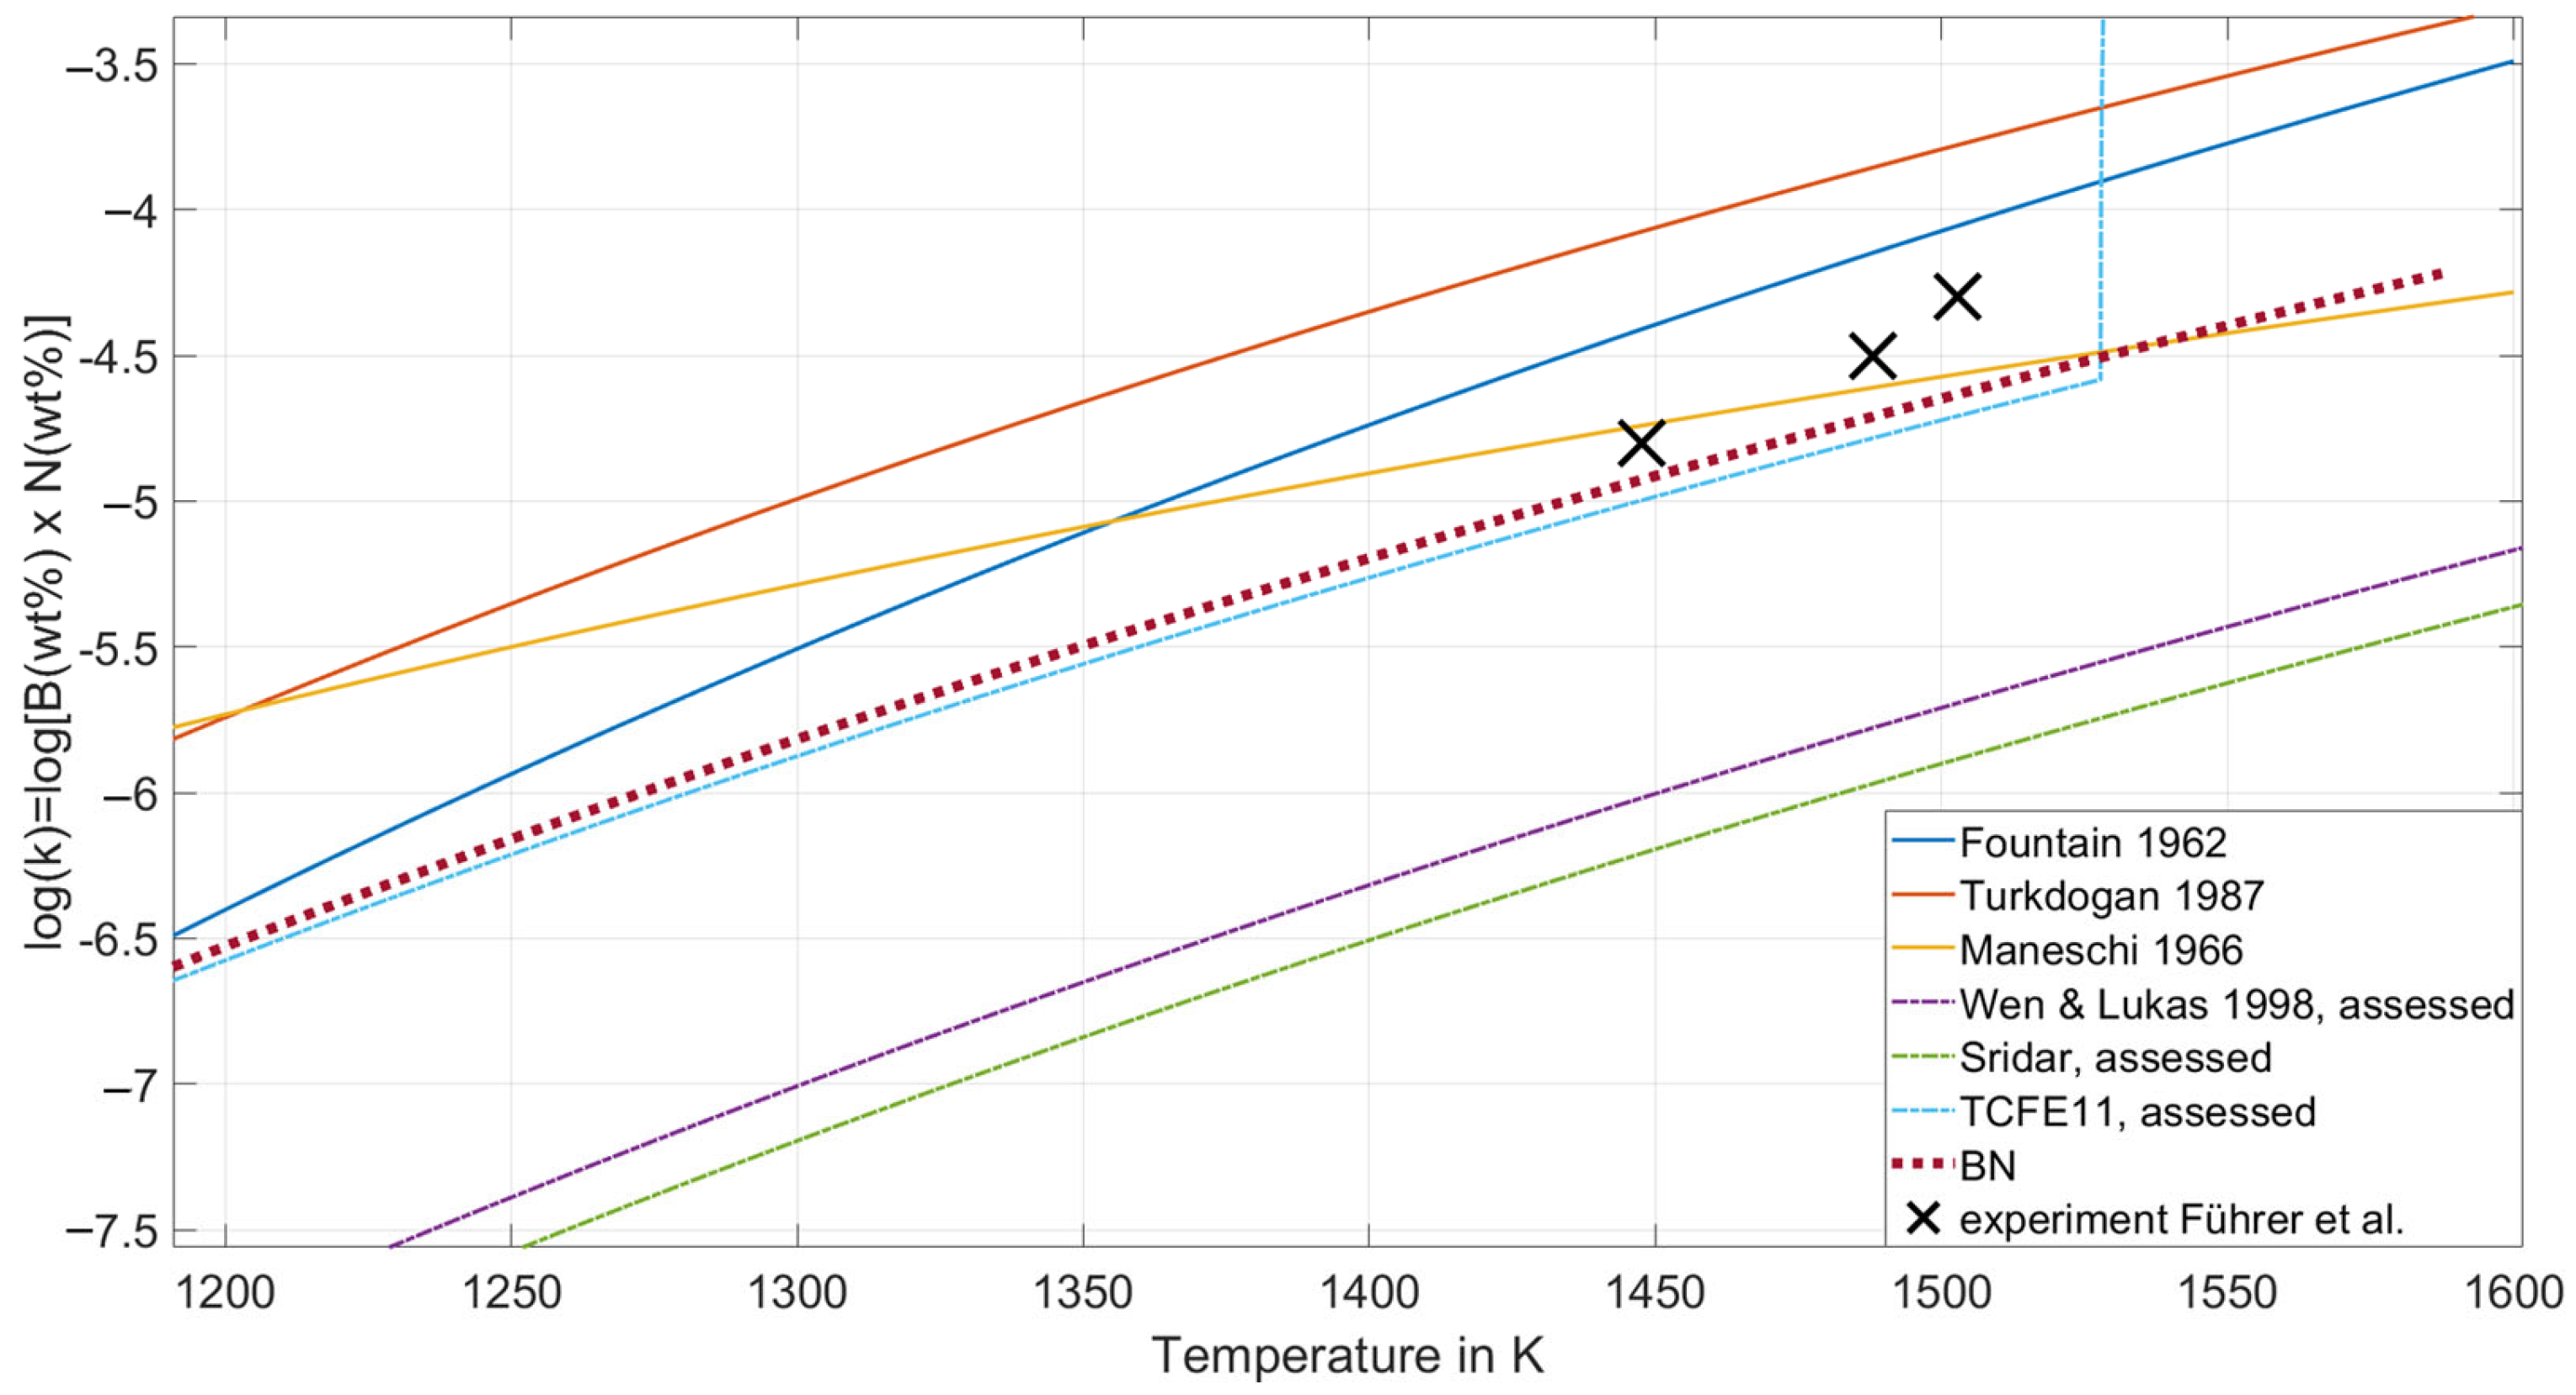
- Fountain, R.W.; Chipman, J. Solubility and Precipitation of Boron Nitride in Iron-Boron Alloys; Union Carbide Metals Co.: Niagara Falls, NY, USA, 1962; Volume 224. [Google Scholar]
- Führer, M.; Zamberger, S.; Shan, Y.; Helml, L.; Srikakulapu, K.; Schnitzer, R.; Kozeschnik, E.; Povoden-Karadeniz, E. Influence of Boron Grain Boundary Segregation on the Thermodynamics of the Fe-C-B-N System; unpublished manuscript; Institue of materials science and technology: TU Wien, Vienna, Austria, 2025. [Google Scholar]
- Saunders, N. COST 507: Thermochemical database for light metal alloys. Light Met. 1998, 2, 23–27. [Google Scholar]
- Jacob, A.; Sobotka, E.; Povoden-Karadeniz, E. Thermodynamic modeling of multicomponent MX phases (M = Nb, Ti, V; X = C, N) in steel. Calphad 2025, 88, 102795. [Google Scholar] [CrossRef]
- Povoden-Karadeniz, E. mc_fe_v2.061. 2023. Available online: https://www.matcalc.at/images/stories/Download/Database/mc_fe_v2061.tdb (accessed on 23 August 2023).
- Hillert, M.; Jonsson, S. An Assessment of the Al-Fe-N System. Met. Trans. A 1992, 23, 3141–3149. [Google Scholar] [CrossRef]
- Miettinen, J.; Vassilev, G. Thermodynamic Description of Ternary Fe-B-X Systems. Part 1: Fe-B-Cr. Arch. Met. Mater. 2014, 59, 601–607. [Google Scholar] [CrossRef]
- Seierstein, M. System Al–Fe. COST507. In Thermochemical Database for Light Metal Alloys; Ansara, I., Dinsdale, A.T., Rand, M.H., Eds.; European Commission: Luxembourg; Office for Official Publications: Washington, DC, USA, 1998; p. 234. [Google Scholar]
- Witusiewicz, V.; Bondar, A.; Hecht, U.; Rex, S.; Velikanova, T. The Al–B–Nb–Ti system. J. Alloy. Compd. 2008, 465, 64–77. [Google Scholar] [CrossRef]
- Maneschi, B.A.S. Analysis of Nitrides in Boron Steels by Extraction of Nonmetallic Phases; MET ITAL: New York, NY, USA, 1966. [Google Scholar]
- Turkdogan, E.T. Causes and effects of nitride and carbonitride precipitation in HSLA steels in relation to continuous casting. In Proceedings of the 70th Steelmaking Conference Proceedings, Pittsburgh, PA, USA, 29 March–1 April 1987. [Google Scholar]
- Sridar, S.; Kumar, R.; Kumar, K.H. Thermodynamic Modelling of Al-B-N System. Calphad 2019, 65, 291–298. [Google Scholar] [CrossRef]
- Wen, H.; Lukas, H.-L. Thermochemical Database for Light Metal Alloys; Ansara, I., Dinsdale, A.T., Rand, M.H., Eds.; European Communities: Luxembourg, 1998; Volume 2, System B-N; pp. 65–68. [Google Scholar]
- Thermo-Calc Software. CALPHAD Methodology—Thermo-Calc Software. 2023. Available online: https://thermocalc.com/about-us/methodology/the-calphad-methodology/ (accessed on 5 April 2024).
- Dworkin, A.S.; Sasmor, D.J.; Van Artsdalen, E.R. The Thermodynamics of Boron Nitride; Low-Temperature Heat Capacity and Entropy; Heats of Combustion and Formation. J. Chem. Phys. 1954, 22, 837–842. [Google Scholar] [CrossRef]
- LECO Corporation. LECO. Available online: https://de.leco.com/ (accessed on 7 February 2025).
- Law, C.A. Treatise of Petroleum Geology/Handbook of Petroleum Geology: Exploring for Oil and Gas Traps. Chapter 6: Evaluating Source Rocks; AAPG Special Volumes; AAPG: Tulsa, OK, USA, 1999. [Google Scholar]
- Lambda WDS Spectrometers|EDAX. Available online: https://www.edax.com/products/wds/lambda-wds-analysis-system. (accessed on 8 August 2024).
- Schacht, E.; Richter, J. Erfahrungen mit Ätzmitteln zum Nachweis der ehemaligen Austenitkorngrenzen in Stählen / Experiences with Etching Reagents to Show Former Austenite Grain Boundaries in Steels. Pr. Met. 1998, 35, 384–395. [Google Scholar] [CrossRef]
- Lückl, M. Kinetics Simulation of MnS Precipitation in Electrical Steel. Steel Res. Int. 2016, 87, 271–275. [Google Scholar] [CrossRef]
- Wang, Y.-N.; Bao, Y.-P.; Wang, M.; Zhang, L.-C.; Chen, Y.-N. Basic Research on Precipitation and Control of BN Inclusions in Steel. Met. Mater. Trans. B 2013, 44, 1144–1154. [Google Scholar] [CrossRef]
- Schneider, A.; Stallybrass, C.; Konrad, J.; Kulgemeyer, A.; Meuser, H.; Meimeth, S. Formation of primary TiN precipitates during solidification of microalloyed steels—Scheil versus DICTRA simulations. Int. J. Mater. Res. 2008, 99, 674–679. [Google Scholar] [CrossRef]


| System | Citation |
|---|---|
| Fe-C | Gustafson [13] |
| Fe-N | Frisk [14] |
| Fe-B, Fe-B-C, Fe-B-N | Miettinen and Vassilev [63], Führer et al. [58] |
| Fe-Al | Seierstein [64], Chin et al. [17] |
| Fe-Ti | Lee [16] |
| Ti-N | Lee [16] |
| Ti-C | Povoden-Karadeniz [61] |
| Al-Ti | Witusiewicz et al. [65] |
| Al-N | Saunders [59], Führer et al. [27] |
| Al-C | Chin et al. [17] |
| Fe-Al-C | Chin et al. [17] |
| Fe-Al-N | Hillert and Jonsson [62] |
| Fe-Ti-C | Povoden-Karadeniz [61] |
| Mass Fraction in %, Fe = bal. | ||||||||
|---|---|---|---|---|---|---|---|---|
| Alloy | C | N | Al | B | Ti | Mn | S | O |
| Fe-C-N-Al-B-B-variation | ||||||||
| Al29B0 | 0.51 | 0.0076 | 0.029 | 0.0002 | 0.000 | 0.123 | 0.006 | 0.001 |
| Al29B22 | 0.50 | 0.0073 | 0.029 | 0.0022 | 0.000 | 0.123 | 0.006 | 0.001 |
| Al36B44 | 0.50 | 0.0070 | 0.036 | 0.0044 | 0.000 | 0.123 | 0.007 | 0.001 |
| Fe-C-N-Al-B-Al-variation | ||||||||
| B21Al0 | 0.50 | 0.0070 | 0.009 | 0.0021 | 0.000 | 0.115 | 0.0070 | 0.001 |
| B19Al35 | 0.49 | 0.0079 | 0.035 | 0.0019 | 0.000 | 0.114 | 0.008 | 0.001 |
| B21Al87 | 0.49 | 0.0083 | 0.087 | 0.0021 | 0.000 | 0.114 | 0.008 | 0.001 |
| B21Al180 | 0.50 | 0.0086 | 0.180 | 0.0021 | 0.000 | 0.117 | 0.008 | 0.001 |
| B21Al416 | 0.49 | 0.0086 | 0.416 | 0.0021 | 0.000 | 0.117 | 0.009 | 0.001 |
| Fe-C-N-Al-B-Ti-Ti-variation | ||||||||
| Al36B25Ti0 | 0.51 | 0.0069 | 0.036 | 0.0025 | 0.000 | 0.131 | 0.007 | 0.001 |
| Al38B36Ti20 | 0.50 | 0.0052 | 0.038 | 0.0036 | 0.020 | 0.131 | 0.007 | 0.001 |
| Al42B38Ti30 | 0.50 | 0.0045 | 0.042 | 0.0038 | 0.030 | 0.131 | 0.007 | 0.001 |
| Al44B39Ti42 | 0.50 | 0.0042 | 0.044 | 0.0039 | 0.042 | 0.130 | 0.007 | 0.001 |
| Type | |||||||||
|---|---|---|---|---|---|---|---|---|---|
| ECD [nm] | Al [wt.-%] | B [wt.-%] | N [wt.-%] | Ti [wt.-%] | C [wt.-%] | Mn [wt.-%] | S [wt.-%] | O [wt.-%] | |
| AlN | >60 | >2 | <0.1 | >0 | <0.1 | <3 | <3 | <0.1 | <0.1 |
| BN | >60 | <0.1 | >2 | >0 | <0.1 | <3 | <3 | <0.1 | <0.1 |
| TiN | >60 | <0.1 | <0.1 | >0 | >2 | >0 | <3 | <0.1 | <0.1 |
| MnS | >60 | <3 | <3 | <3 | <3 | <3 | >3 | >0.5 | <0.1 |
| Al2O3 | >60 | >2 | <3 | <3 | <3 | <3 | <3 | <0.1 | >1 |
| Alloy | Al | B | Ti | N | Tsol AlN | Tsol BN | Tsol AlN | Tsol BN |
|---|---|---|---|---|---|---|---|---|
| in wt.-% | experimental in °C | simulative in °C | ||||||
| Al29B0 | 0.029 | 0.0002 | 0.000 | 0.0076 | 1150 ± 30 | - | 1187 | - |
| Al29B22 | 0.029 | 0.0022 | 0.000 | 0.0073 | 1150 ± 30 | 1200 ± 15 | 1165 | 1235 |
| Al36B44 | 0.036 | 0.0044 | 0.000 | 0.0070 | 970 ± 40 | 1215 ± 15 | 1122 | 1280 |
| B21Al0 | 0.009 | 0.0021 | 0.000 | 0.0070 | - | 1230 ± 15 | - | 1230 |
| B19Al35 | 0.035 | 0.0019 | 0.000 | 0.0079 | 1180 ± 20 | 1215 ± 20 | 1195 | 1220 |
| B21Al88 | 0.088 | 0.0021 | 0.000 | 0.0083 | 1250 ± 20 | 1110 ± 20 | 1280 | - |
| B21Al180 | 0.180 | 0.0021 | 0.000 | 0.0086 | 1350 ± 50 | - | 1370 | - |
| B21Al416 | 0.416 | 0.0021 | 0.000 | 0.0086 | (1450 ± 50) | - | - | 1460 |
| Alloy | Al | B | Ti | N | Tsol AlN | Tsol BN | Tsol AlN | Tsol BN | Tsol TiN |
|---|---|---|---|---|---|---|---|---|---|
| in wt.-% | experiment in °C | simulation in °C | |||||||
| Al36B25Ti0 | 0.036 | 0.0025 | 0.000 | 0.0069 | 1140 ± 20 | 1230 ± 20 | 1170 | 1240 | - |
| Al38B36Ti20 | 0.038 | 0.0036 | 0.020 | 0.0052 | - | 1120 ± 20 | - | 1100 | 1430 ± 20 |
| Al42B38Ti30 | 0.042 | 0.0038 | 0.030 | 0.0045 | - | - | - | - | 1440 ± 20 |
| Al44B39Ti42 | 0.044 | 0.0039 | 0.042 | 0.0042 | - | - | - | - | 1450 ± 20 |
Disclaimer/Publisher’s Note: The statements, opinions and data contained in all publications are solely those of the individual author(s) and contributor(s) and not of MDPI and/or the editor(s). MDPI and/or the editor(s) disclaim responsibility for any injury to people or property resulting from any ideas, methods, instructions or products referred to in the content. |
© 2025 by the authors. Licensee MDPI, Basel, Switzerland. This article is an open access article distributed under the terms and conditions of the Creative Commons Attribution (CC BY) license (https://creativecommons.org/licenses/by/4.0/).
Share and Cite
Führer, M.; Zamberger, S.; Seubert, C.; Povoden-Karadeniz, E. Experimental Investigation of the Interplay Between Al-, B-, and Ti-Nitrides in Microalloyed Steel and Thermodynamic Analysis. Metals 2025, 15, 705. https://doi.org/10.3390/met15070705
Führer M, Zamberger S, Seubert C, Povoden-Karadeniz E. Experimental Investigation of the Interplay Between Al-, B-, and Ti-Nitrides in Microalloyed Steel and Thermodynamic Analysis. Metals. 2025; 15(7):705. https://doi.org/10.3390/met15070705
Chicago/Turabian StyleFührer, Markus, Sabine Zamberger, Christoph Seubert, and Erwin Povoden-Karadeniz. 2025. "Experimental Investigation of the Interplay Between Al-, B-, and Ti-Nitrides in Microalloyed Steel and Thermodynamic Analysis" Metals 15, no. 7: 705. https://doi.org/10.3390/met15070705
APA StyleFührer, M., Zamberger, S., Seubert, C., & Povoden-Karadeniz, E. (2025). Experimental Investigation of the Interplay Between Al-, B-, and Ti-Nitrides in Microalloyed Steel and Thermodynamic Analysis. Metals, 15(7), 705. https://doi.org/10.3390/met15070705