Article

Geometric Analysis of the Scaling of the Manganese Recovery Process Using Current Distribution and Potential Simulation Techniques

by
Esaú M. Rodríguez Vigueras
1,
Victor E. Reyes Cruz
1,*,
Felipe M. Galleguillos Madrid
2,
José A. Cobos Murcia
1,
Quinik L. Reyes Morales
3,
Gustavo Urbano Reyes
1,
Marissa Vargas Ramírez
1,
Felipe Legorreta García
1 and
Marinka Varas
2
1
Instituto de Ciencias Básicas e Ingeniería, Universidad Autónoma del Estado de Hidalgo (UAEH), Mineral de la Reforma 42184, Hidalgo, Mexico
2
Centro de Desarrollo Energético de Antofagasta, Universidad de Antofagasta, Av. Universidad Antofagasta 02800, Antofagasta 1271155, Chile
3
Instituto Potosino de Investigación Científica y Tecnológica (IPICYT), San Luis Potosi 78216, San Luis Potosi, Mexico
*
Author to whom correspondence should be addressed.
Metals 2025, 15(5), 562; https://doi.org/10.3390/met15050562
Submission received: 7 February 2025 / Revised: 28 February 2025 / Accepted: 6 March 2025 / Published: 20 May 2025
(This article belongs to the Section Computation and Simulation on Metals)

Abstract

:
Electrolytic metallic manganese (EMM) is used as an alloying metal to provide resistance to abrasion and corrosion. Highly pure EMM is obtained through electrorecovery or electrowinning. Efforts are ongoing to improve the efficiency and profitability of this process, as 85 to 90% of manganese is produced by the mining industry. This study applied computer-aided engineering (CAE) to provide information on the behavior of the potential distribution at the electrodes in cells separated by membranes, which allows for the optimization of the EMM production process. The experimental results obtained galvanostatically for EMM allowed for validation of the simulation parameters. It was determined that the cell with 11 compartments is more suitable compared to cells with fewer compartments, since it has lower oxidation-normalized current density and oxidation potential, which affect the distribution of cathodic potential in the process of obtaining EMM. The simulation highlighted a better distribution of the cathodic and anodic potentials due to the increase in the number of electrodes. This saves time and resources in the design of electrochemical cells with a greater number of compartments.

Graphical Abstract

1. Introduction

The abundance of manganese on the Earth’s surface makes it an element of great interest, used in alloys and manganese compounds in various industries [1]. It acts as a material that mitigates oxidative stress and improves the cellular environment, performing better in environments with low iron levels [2]. Furthermore, it is widely used in rechargeable batteries because of its affordability, low cost, safety, ease of manufacturing, and ability to store large amounts of energy in a reversible and innovative way [3].
Manganese ferroalloys are also used in the steel industry to strengthen steel through the formation of iron carbides, as well as in aluminum to resist abrasion and corrosion, generating promising materials for manufacturing technologies [4]. Promising manganese oxide coatings can also be utilized in the purification of air and water, as well as in neutralizing waste gasses from internal combustion engines [5]. The main manganese producers and marketers include the United States, Japan, Germany, Australia, Gabon, Brazil, China, and India [6]. However, manganese reserves are decreasing due to increased demand, with 85–90% of the manganese produced by the mining industry being used in the steel and aluminum industries [7]. It is essential to continue researching and optimizing metal recovery processes, as electrochemical methods play an active role in recovering raw materials from waste materials, especially through scalable solutions. Some authors emphasize the study of electric current, electric fields, and potential control for the electro-recovery of valuable materials in complex electrolytes [8].
Therefore, efficient manganese recovery is crucial, especially when a high degree of purity is required. Electrorecovery or electrowinning uses electrochemical reduction to recover the metal in the form of flakes with a purity of 99.9%, making it an ideal alloy material for advanced and specialized steels [9].
Various strategies have been developed to improve the efficiency and characteristics of the manganese deposit. For example, in 2004, Song et al. investigated the electrowinning of Mn0 and MnO2 from sulfated solutions in a two-compartment reactor separated by an anionic membrane. The metallic Mn deposit presented a smooth, dense, and uniform appearance in each phase [10].
Anionic membrane electrolytic reactors separate the species formed on the electrodes by using an anolyte and a catholyte, enabling the controlled deposition of manganese without significant chemical interference in the deposit’s composition [11]. However, because sulfate migration causes pH changes, it can reduce the efficiency of manganese reduction and promote undesirable side reactions, such as hydrogen evolution. These reactions may compromise deposit quality and even lead to its detachment from the electrode during recovery.
In 2010, Qifeng et al. reported a current efficiency of 85% under optimal conditions. Using manganese sulfate and ammonium sulfate as the catholyte and sulfuric acid as the anolyte in a cell separated by an anion exchange membrane, they identified selenium dioxide as the most effective additive for deposition during extended electrolysis periods [11]. Tsurtsumia et al. investigated how different factors affect the efficiency of metallic manganese production. They analyzed manganese (Mn) and ammonium sulfate concentrations, temperature, additives, and cathode current density using a laboratory cell with compartments separated by a membrane. They found that at 90 °C, the formation of manganese oxide is favored, and that although additives can be beneficial, under certain conditions they can contaminate the manganese deposited on the cathode [12].
In 2016, Jianming-Lu et al. explored the recovery of metallic manganese from manganese carbonate using a three-compartment diaphragm cell designed to enhance manganese deposition. However, the use of a polyacrylamide polymer affected the internal stress of the deposit and its structure at high doses. They achieved an electrorecovery purity of 99.7% [13]. In addition, in 2013, Rojas-Montes et al. reported current efficiencies ranging from 65.56% to 78.07% and specific energy consumptions between 9985 and 8523 kWh/t [14]. Furthermore, subsequent research has examined the influence of additives and specific process conditions. For example, Rojas et al. (2017) investigated the production of electrolytic metallic manganese (EMM) by adding selenium oxide (SeO2) as an additive to MnSO4 solutions in a two-compartment cell separated by a commercial membrane (CMI 7001) [15]. Their experimental findings revealed selenium’s specific behavior in inhibiting hydrogen evolution and its connection to sulfite formation. Meanwhile, S.K. Padhy et al. (2018) studied the electrorecovery of EMM using a two-compartment cell separated by a polypropylene membrane. They obtained EMM from analytical reagent-grade MnSO4·H2O and employed ammonium sulfate and sodium oleates to enhance process efficiency [16].
In 2021, Rojas-Montes et al. indicated that TeO2 is the most suitable additive to replace SeO2 in Mn recovery [17]. However, Reyes-Morales et al. (2021, 2022) investigated the electrochemical reduction in ionic species during manganese deposition using anion exchange membranes, highlighting the crucial influence of elemental selenium and membrane selection on the efficiency and solubility of manganous products [18,19]. In 2023, Haidong-Zhong et al. analyzed the energy consumption of a galvanostatic electrolysis process, reducing energy consumption by 7.82% and increasing electrical efficiency by 3.33%. The authors characterized the process using electrochemical techniques, finding good oxygen evolution activity and low charge transfer resistance, providing a new approach to electrolytic manganese production [20]. These studies reveal the complexity of the electrochemical process and the importance of considering multiple variables to optimize EMM recovery. As of 2024, Kexuan-Lyu et al. achieved current efficiencies of approximately 85.1% and an energy consumption of 4189 kWh/t. The authors attribute this efficiency to the reduction in sludge and side reactions, as well as the use of a reactor with compartments separated by an anion-exchange membrane and an acidification chamber [21].
Studies on the production of EMM are diverse and emphasize the importance of understanding the reactions, counter-reactions, and the electrical efficiency involved in the process. However, no studies have been conducted on scaling this process through simulations to provide important information on the potential distribution, particularly for cells with more than three compartments.
The use of software such as COMSOL allows for exploring the variables involved in the electrochemical process, as finite element analysis has identified conditions to shorten the time required to achieve optimal conditions in an electrolytic system. These include electrode distances, geometries, and current distributions in the electrodes. This has resulted in time optimization, cost savings, and an evaluation of the scaling process [22]. On the other hand, simulation has facilitated both the analysis of current distribution in different reactors and the geometric analysis and performance parameters of these systems [23,24,25]. Finite element analysis has determined the conditions necessary to shorten the time to reach optimal electrolytic system conditions, such as electrode distances and the dynamics of the electrolytic solution [26]. Therefore, EMM production can be optimized by considering conditions previously studied in the literature and based on experimental results of parameters such as potential and electric current, types of membranes, and electrolyte composition. Using computer-aided engineering (CAE) [27], this approach provides information on potential distribution in the electrodes during the scaling of membrane cells in the EMM process.
The effects of geometry, activation overpotential, and the cumulative impact of these factors, as well as the effect of concentration overpotential [28], can be observed in simulations of primary, secondary, and tertiary current distributions. To date, no kinetic simulation studies have been performed regarding EMM. Therefore, this research used simulations of secondary current distribution to evaluate EMM recovery under optimal conditions, validating the simulation parameters with cells containing two and five compartments before projecting the scale up to cells with 7 to 13 compartments.

2. Materials and Methods

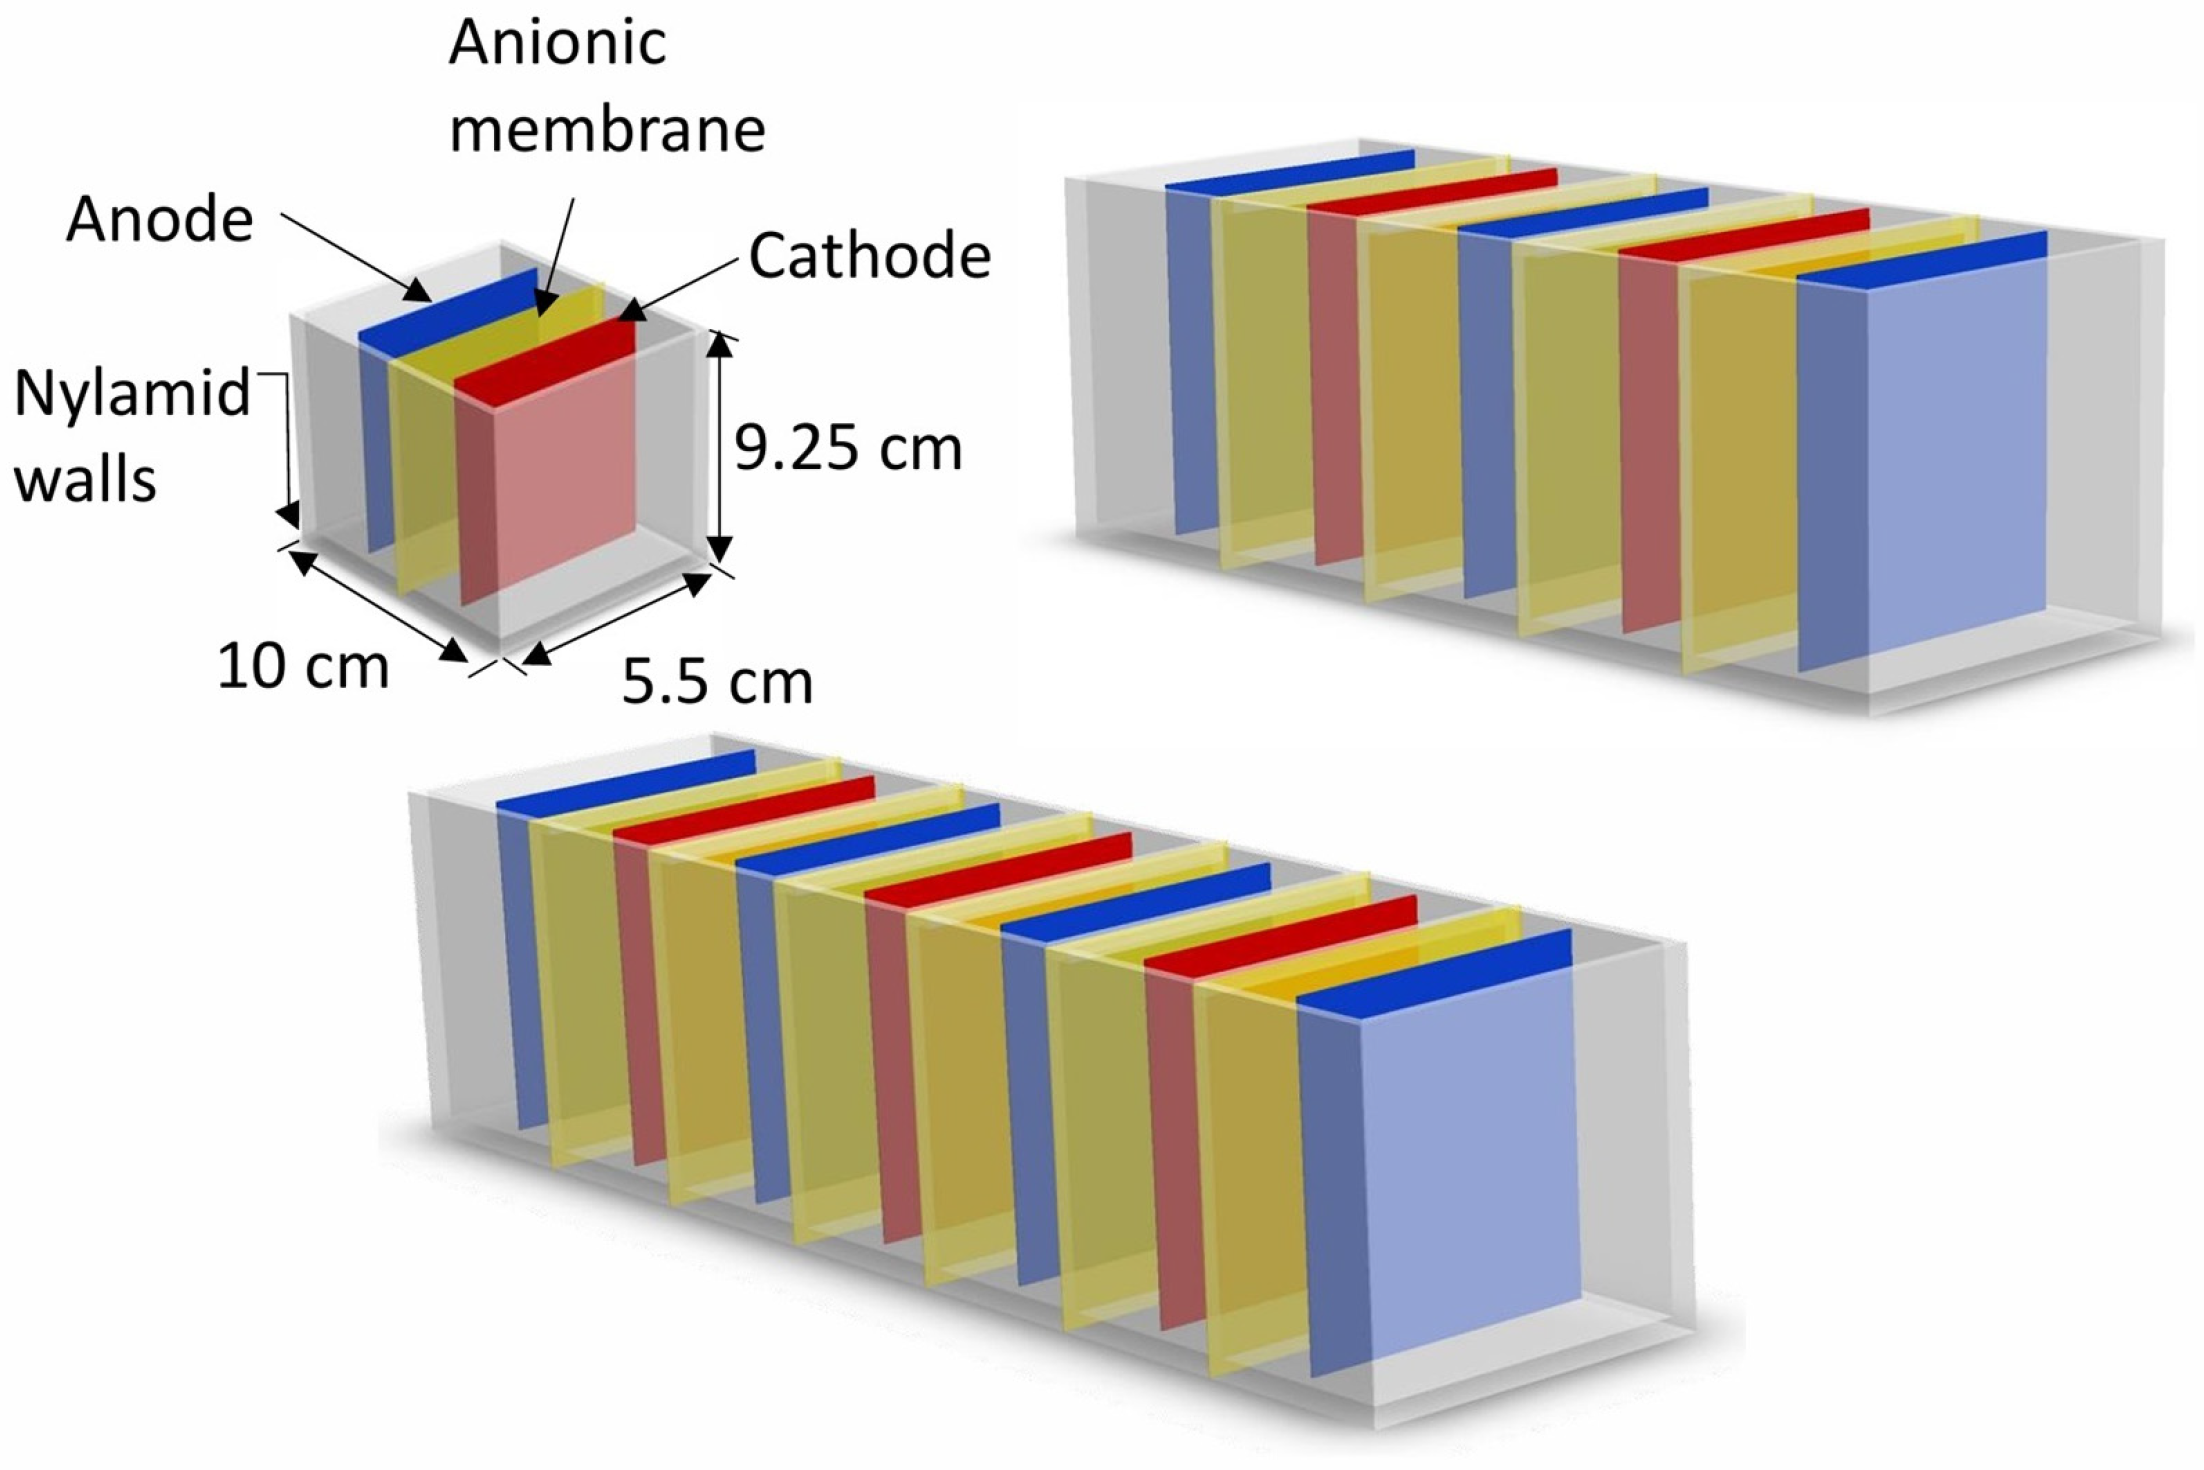
2.1. Studied Geometry

The membrane cell consists of at least two compartments separated by a membrane with anionic permeability characteristics. This design maintains electronic interaction between the anolyte and the catholyte, ensuring that Mn2+ ions are deposited exclusively on the cathode during the electrodeposition of metallic Mn. Each cell compartment measures 100 mm in width, 55 mm in depth, and 92.5 mm in height, with an electrode spacing of 54.45 mm. The electrodes (cathodes and anodes) are 87.0 mm wide, 0.82 mm thick, and 92.5 mm high. The membrane, which is 0.45 mm thick, covers the entire cross-sectional area of the cell, separating the anolyte from the catholyte. A graphical representation of the cell’s separate compartments is shown in Figure 1.

2.2. Mathematical Model

The primary and secondary current distributions in a membrane cell indicate a predominance of secondary currents along the electrodes. Additionally, an edge effect is predicted at the corners of the electrodes due to the behavior of the electrolyte. The electrochemical reaction at the electrodes is reversible, as there is no charge accumulation in the electrolyte and the concentration gradient is negligible [16]. This ensures uniform conductivity within both the electrolyte and the electrodes.
The distribution of current density and potential in cells with geometries ranging from 2 to 13 compartments depends on the configuration of the electrochemical cells. This approach provides a simplified analysis of how geometry affects electrical current (EC) performance. The general flow equation can be expressed as follows [17]:
2 φ x 2 + 2 φ y 2 + 2 φ z 2 = 0
where φ represents the electric potential in the electrolyte.
It is assumed that the distribution of electrical current within the diaphragm cell can be determined by considering that both charge transfer and mass transport conditions are negligible. This is because the ohmic resistance within the cell primarily dictates the distribution of electrical current. Consequently, the electric current values can be calculated at any point within the reactor coordinates.
Table 1 lists some properties of the electrolyte, as well as data on the energy conditions supplied to the electrochemical system.
The simulation of primary and secondary electrical current distributions was carried out using the data presented in Table 2 under both steady-state and transient conditions. These conditions were derived from the work of Reyes Morales et al., who reported higher current efficiencies using Ruthenium DSA and Neosepta AMX anionic membranes under a current density of −300 A·m−2 with a catholyte pH of 3.6. The conductivity parameters used were 203 S·m−1 for the anolyte and 125.7 S·m−1 for the catholyte. The membrane was analyzed as an electrolyte, as it serves as the interface between the anolyte and catholyte with a conductivity of 0.0363 S·m−1.
The electrical current density was determined at any point of the diaphragm cell according to Ohm’s law [20].
j = k φ
where j is the electric current density, ∇ is the Laplacian operator, φ is the electric potential, and k is the conductivity of the electrolyte.
The electric current density (j) was calculated throughout the entire geometry using the Laplacian operator (∇) applied to the scalar field representing the electric potential (φ). The walls that were not electrodes were treated as insulators, meaning no electric current flowed through them, as described by Equation (3). These insulated walls primarily represent the boundaries containing the catholyte and anolyte solutions, which do not participate in the electronic exchange.
k φ ξ = 0
where ξ denotes the typical surface condition.
The average electric current density (jave) was calculated using Equation (4) based on the electric current applied between the cathode and the anode. It is important to note that the objective of this study is to enhance the performance of the diaphragm cell by optimizing its geometry and the number of compartments. Consequently, the concentration of species on the electrode surface was assumed to remain constant (as this is a steady-state analysis) for the determination of the electrolyte’s current density, as well as the cathodic and anodic potentials in the various separated-compartment cells.
j a v e = 1 A c 0 A j a v e j d A c
The simulations focused on the distribution of secondary currents, limiting the system to −300 A·m−2 to approximate the galvanostatic experiments. The proposed system includes a continuous medium (the electrolyte), boundary conditions such as insulation (cell walls), and the initial electric potential of the electrolyte. The electrode–electrolyte interface was modeled using the energy conditions and material properties of the electrodes across all simulations.
COMSOL Multiphysics® 6.0 software facilitates the use of various approximations for the Butler–Volmer equation. In cases where transport within the electrolyte is considered negligible compared to the electron transfer process, a simplified form of Equation (5) is used.
i l o c = i 0 e α a F η R T e α c F η R T
Thus, as η approaches zero, the exponential term in Equation (5) can be linearized as shown in Equation (6). The linearized Butler–Volmer equation (Equation (6)) on the surface of the electrodes was used to establish the external electric potential and limiting current, as well as an anodic and cathodic transfer coefficient of 0.5 and a stationary regime.
i l o c = i o C R C R o a F η R T + C o C 0 o a F η R T
where i l o c is the Faradaic current density, i 0 is the exchange current, C R is the concentration, C R 0 is the apparent concentration, α a is the electron transfer coefficient, F is the Faraday constant, η is the electrode overpotential, R is the constant of an ideal gas, T is the temperature, and C 0 C 0 o is the relationship of transport in the electrolyte and electron transfer.

2.3. Simulation

A theoretical analysis of the electric current density and potential distribution for the outlined geometries (Figure 1) was conducted using an approximation of the Laplace equation (Equation (2)) at any point within the diaphragm cell. This approximation was derived from the local electrical potential gradient, utilizing the secondary current distribution module in COMSOL Multiphysics® 6.0 software. The simulations were performed on a Dell® Inspiron 20 model 3048 workstation equipped with an AMD A9 dual-core processor (3.10 GHz), a RADEON R5 graphics card with 3 GB of video memory, 250 GB of ROM, and 8 GB of RAM by DELL technologies manufacture in Taoyuan, Taiwan.
For this analysis, a mesh was constructed to account for the geometry of the electrodes and their relative proximity. The mesh parameters included a maximum element size of 0.01491, a minimum element size of 0.00109, a maximum element growth rate of 1.4, a curvature factor of 0.4, and a narrow region resolution of 0.7 (Figure 2).
The refinement and calculation time values are shown in Table 3.
The effects of the lateral electrode arrangement and their dimensions on the diaphragm cell were analyzed. First, the operation of a single pair of electrodes was evaluated (Figure 2a), following the classic cell design. Next, the diaphragm cell configurations with two, three and four cathodes surrounded by anodes were examined (Figure 2b, Figure 2c and Figure 2d), respectively). Additionally, arrangements with five and six cathodes surrounded by anodes were analyzed.

2.4. Validation

The percentage error was calculated for the simulations of cells with 2 and 5 compartments to represent the approximation to real conditions, expressed as follows:
p e r c e n t a g e   e r r o r = V E x p e r i m e n t a l V S i m u l a t e d V E x p e r i m e n t a l × 100
where Vexperimental represents the actual potential data obtained from the chronopotentiometric tests and Vsimulated is the potential derived from the simulations.
Current Efficiency Equation:
η c = m r z F M A I t × 100 %
where η c represents the current efficiency, m r is the mass recovered through the electrolysis process, z is the number of electrons involved in the deposition reaction, F is Faraday’s constant, M A is the atomic mass of manganese, I is the applied current, and t is the electrolysis time.
Energy Consumption Equation:
C E = E c e l E E Q η c
where C E is the energy consumption, E c e l is the cell potential, E E Q is the electrochemical equivalent of manganese, and η c is the current efficiency.

3. Results

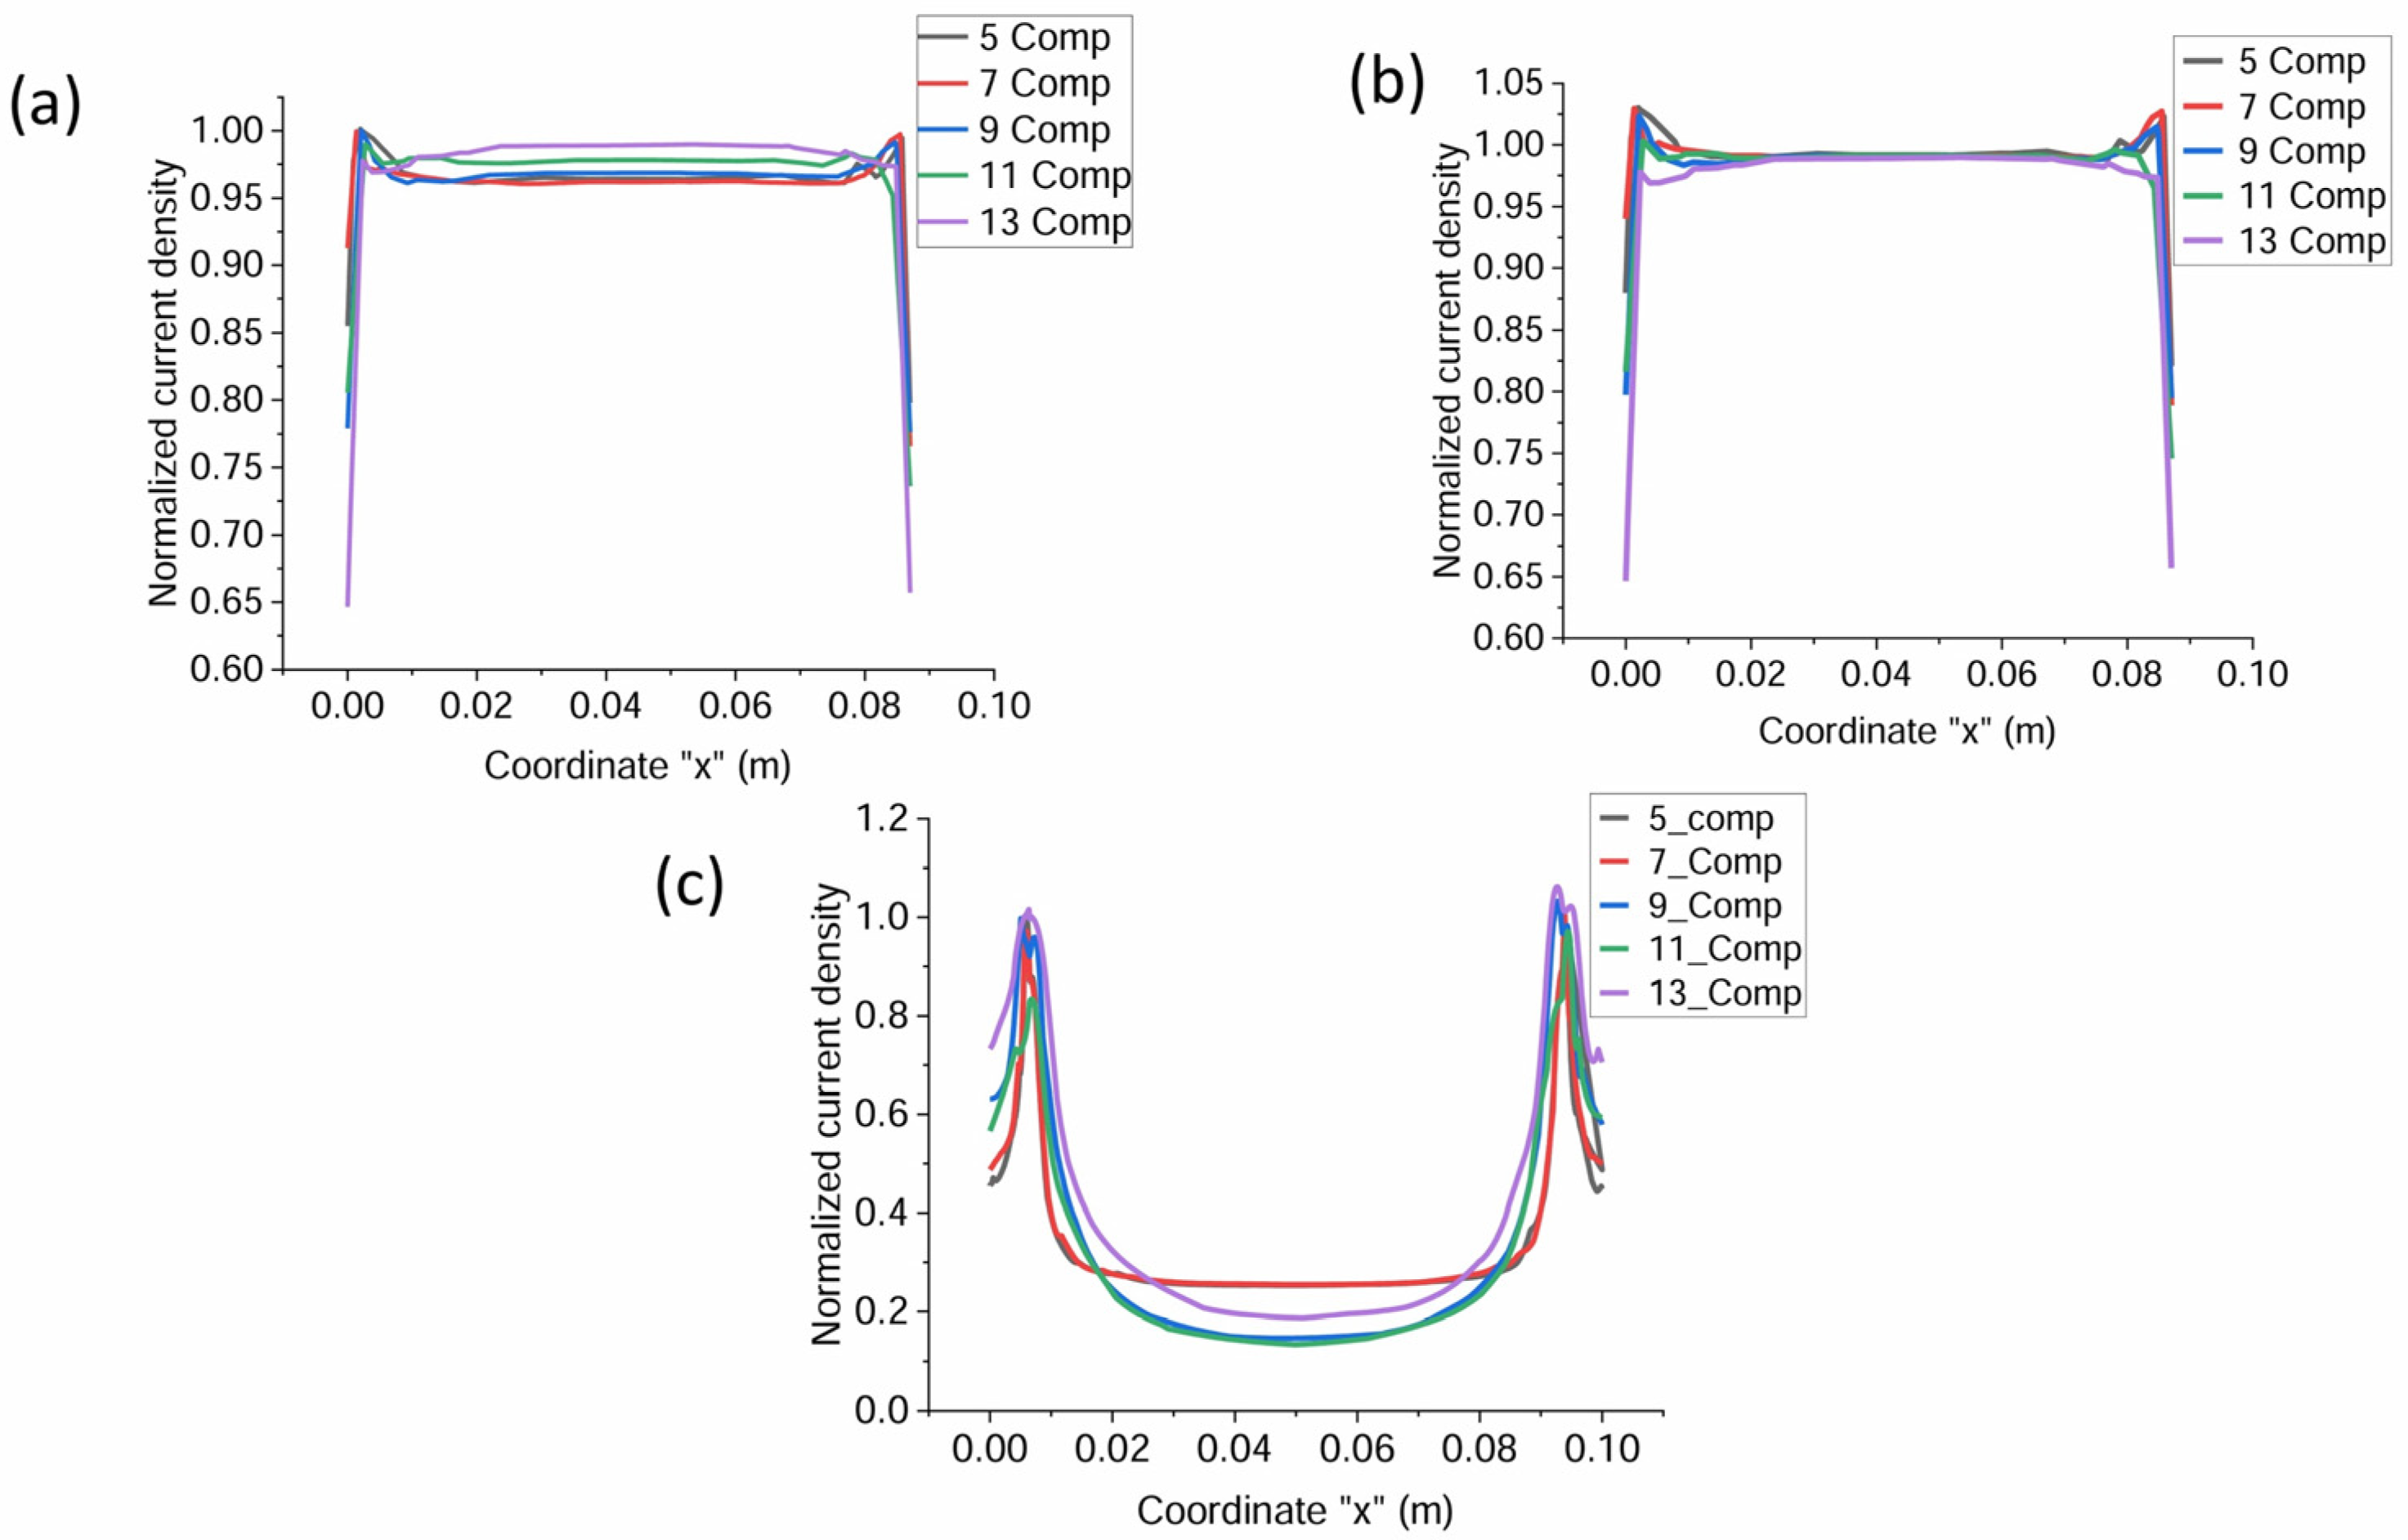
3.1. Current Density Distribution of the Electrolyte in Cell with Separate Compartments

Figure 3 shows a section parallel to the xy-plane of a cell with separate compartments at a height of 0.05 m, allowing half of the cell to be viewed from above. The contours represent the electrolyte, facilitating the analysis of the current density distribution behavior in various configurations, as detailed below, involving 2 compartments (Figure 3a), 5 compartments (Figure 3b), 7 compartments (Figure 3c), and 9 compartments (Figure 3d).
Figure 3. Current density distribution of the press-type cell with (a) 2, (b) 5, (c) 7, and (d) 9 compartments.
Metals 15 00562 g003
In the cell with two compartments (Figure 3a), the surfaces of both electrodes are oriented towards the Nylamid insulating walls and the other electrode, respectively. It is observed that both electrodes present a greater distribution of the current density of the electrolyte on the edges (−350 Am−2) due to the creepage lines in the corners. The surfaces in front of the other electrode exhibit a current density of the electrolyte of approximately −400 Am−2, while the surfaces directed towards the insulating walls show a lower value, at around −100 Am−2.
This distribution of the current density of the electrolyte can be improved by using an arrangement with a greater number of electrodes, where the cathodes are surrounded by two anodes. This improves the distribution in front of the cathodes, resulting in better diaphragm cell performance and operation.
The arrangements with five (Figure 3b), seven (Figure 3c), and nine (Figure 3d) compartments present a better distribution of the current density of the electrolyte in the cathodes and the anodes located between two cathodes. Since the purpose of the study is to improve the current density distribution at the cathodes, configurations where the anodes are at the edges of cells and all cathodes are surrounded by anodes were analyzed. In these configurations, the edge anodes in cells have an approximate electrolyte current density of −100 Am−2, but both the surfaces facing the cathodes and the anodes surrounded by cathodes show a current density of approximately −290 Am−2. This distribution is repeated in front of all the cathodes in any of the arrangements presented, guaranteeing an adequate distribution of the current density of the electrolyte over all the cathodes and avoiding the presence of creepage lines at the edges of electrodes, thereby achieving a more uniform distribution.
In the two-compartment cells, the electrolyte current density varies from −100 to −400 Am−2 throughout the cell, while in configurations with more than two compartments, it is −100 Am−2 at the ends and −290 Am−2 in the rest of the cell.

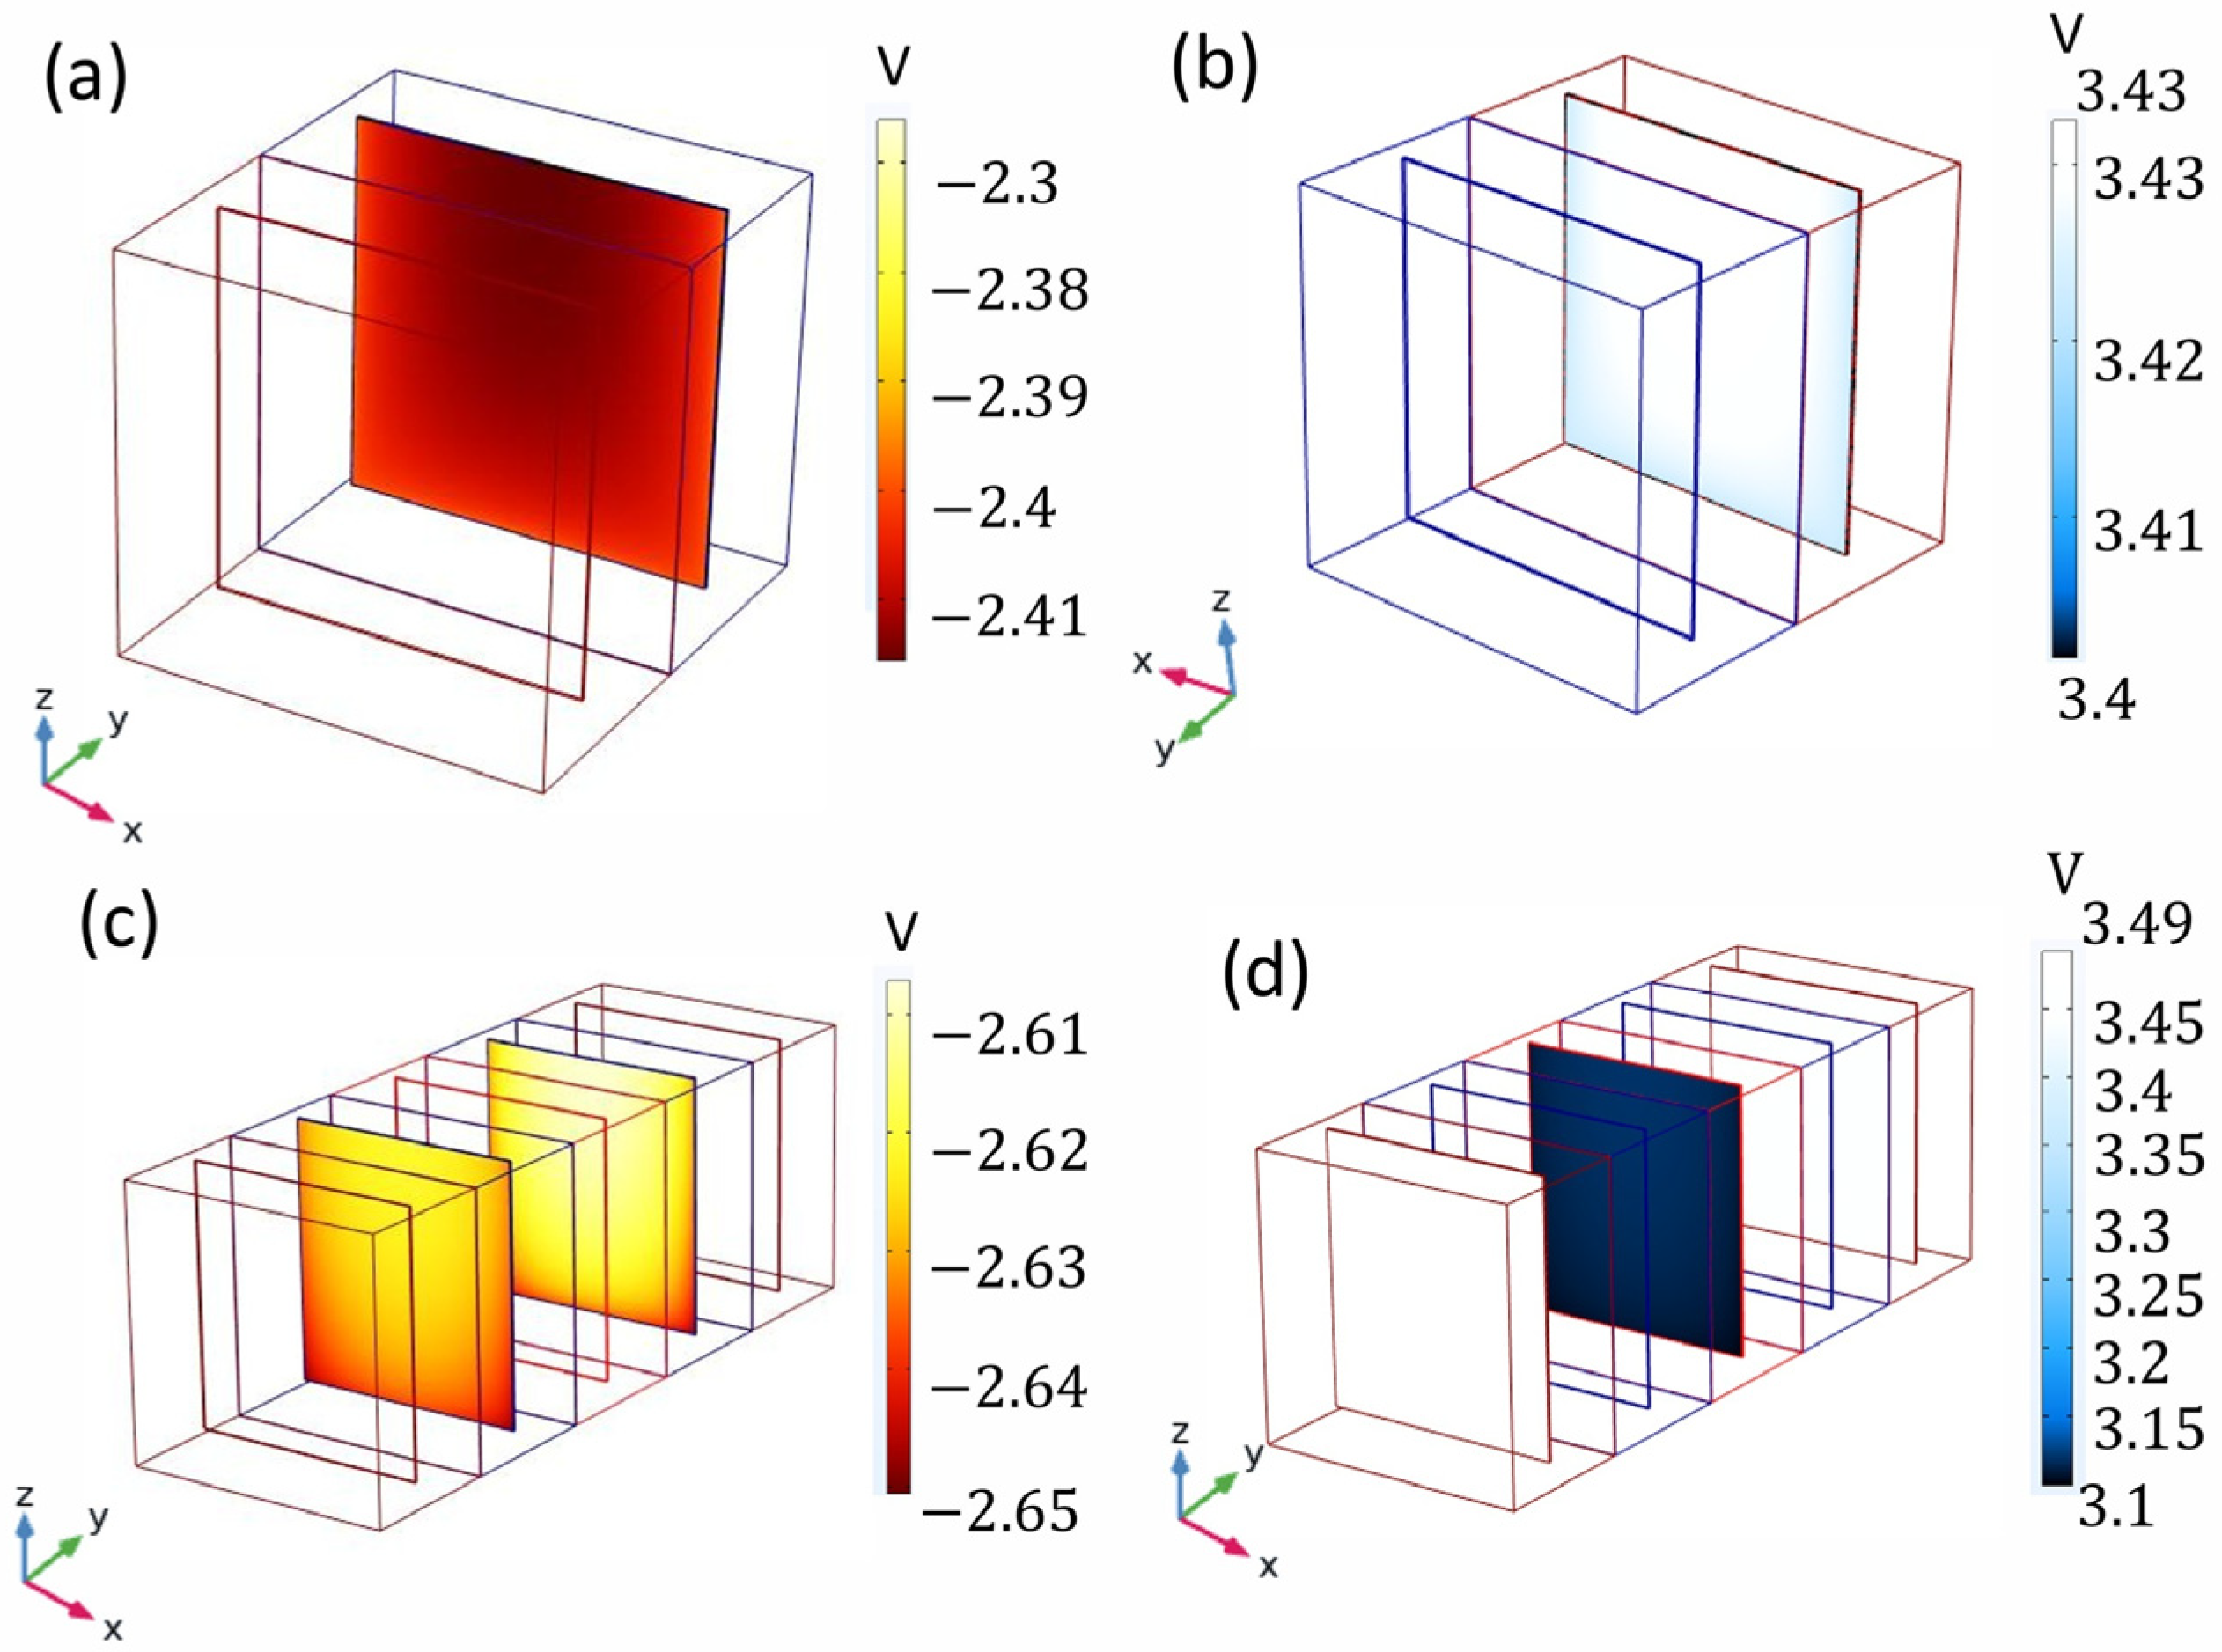
3.2. Distribution of the Electrochemical Potential in the Cells with Two Compartments and Five Compartments

Figure 4 illustrates the potential distributions for the two-compartment cells at the cathode (Figure 4a) and the anode (Figure 4b), as well as for the five-compartment cells at the cathode (Figure 4c) and the anode (Figure 4d) under the operating conditions of −300 A·m−2, using a Neosepta AMX membrane and a ruthenium counter electrode.
The cathode face parallel to the anode (Figure 4a) has a distribution of the electrochemical potential on the electrode surface between −2.4 and −2.42 V vs. SCE, which is greater than the potential values on the electrode face directed towards the Nylamid insulating wall (−2.37 and −2.38 V vs. SCE). This behavior is due to the better distribution of the current density in the electrolytes, which represents a difference in −300 Am−2 between these faces. Also, the distribution of the electrochemical potential on the surface of the anode (Figure 4b) is between 3.40 and 3.41 V vs. SCE and depends, in the same way, on the current density distribution of the anolyte.
The geometry with five compartments was analyzed to demonstrate the improved potential distribution. Figure 4c shows that the faces of the cathodes with the anodes at the ends of the cell have a potential distribution of −2.625 to −2.640 V vs. SCE, which is attributed to the fact that the potential distribution of the central face of the anode in front of the cathodes is lower (3.14 V vs. SCE) than that of the ends of the cell (3.45 V vs. SCE), as shown in Figure 4d; this is because the density distribution of electrolyte current in the central anode on its two faces is greater (−290 Am−2) than that of the anodes at the ends that see the Nylamid at −100 Am−2. It is important to mention that there is the same potential distribution behavior of the cathodes and anodes on the “Y”-axis. The potential distribution on both faces of the cathodes of the five-compartment cell is in the same order of magnitude with a value of −2.625 V vs. SCE (Figure 4c).

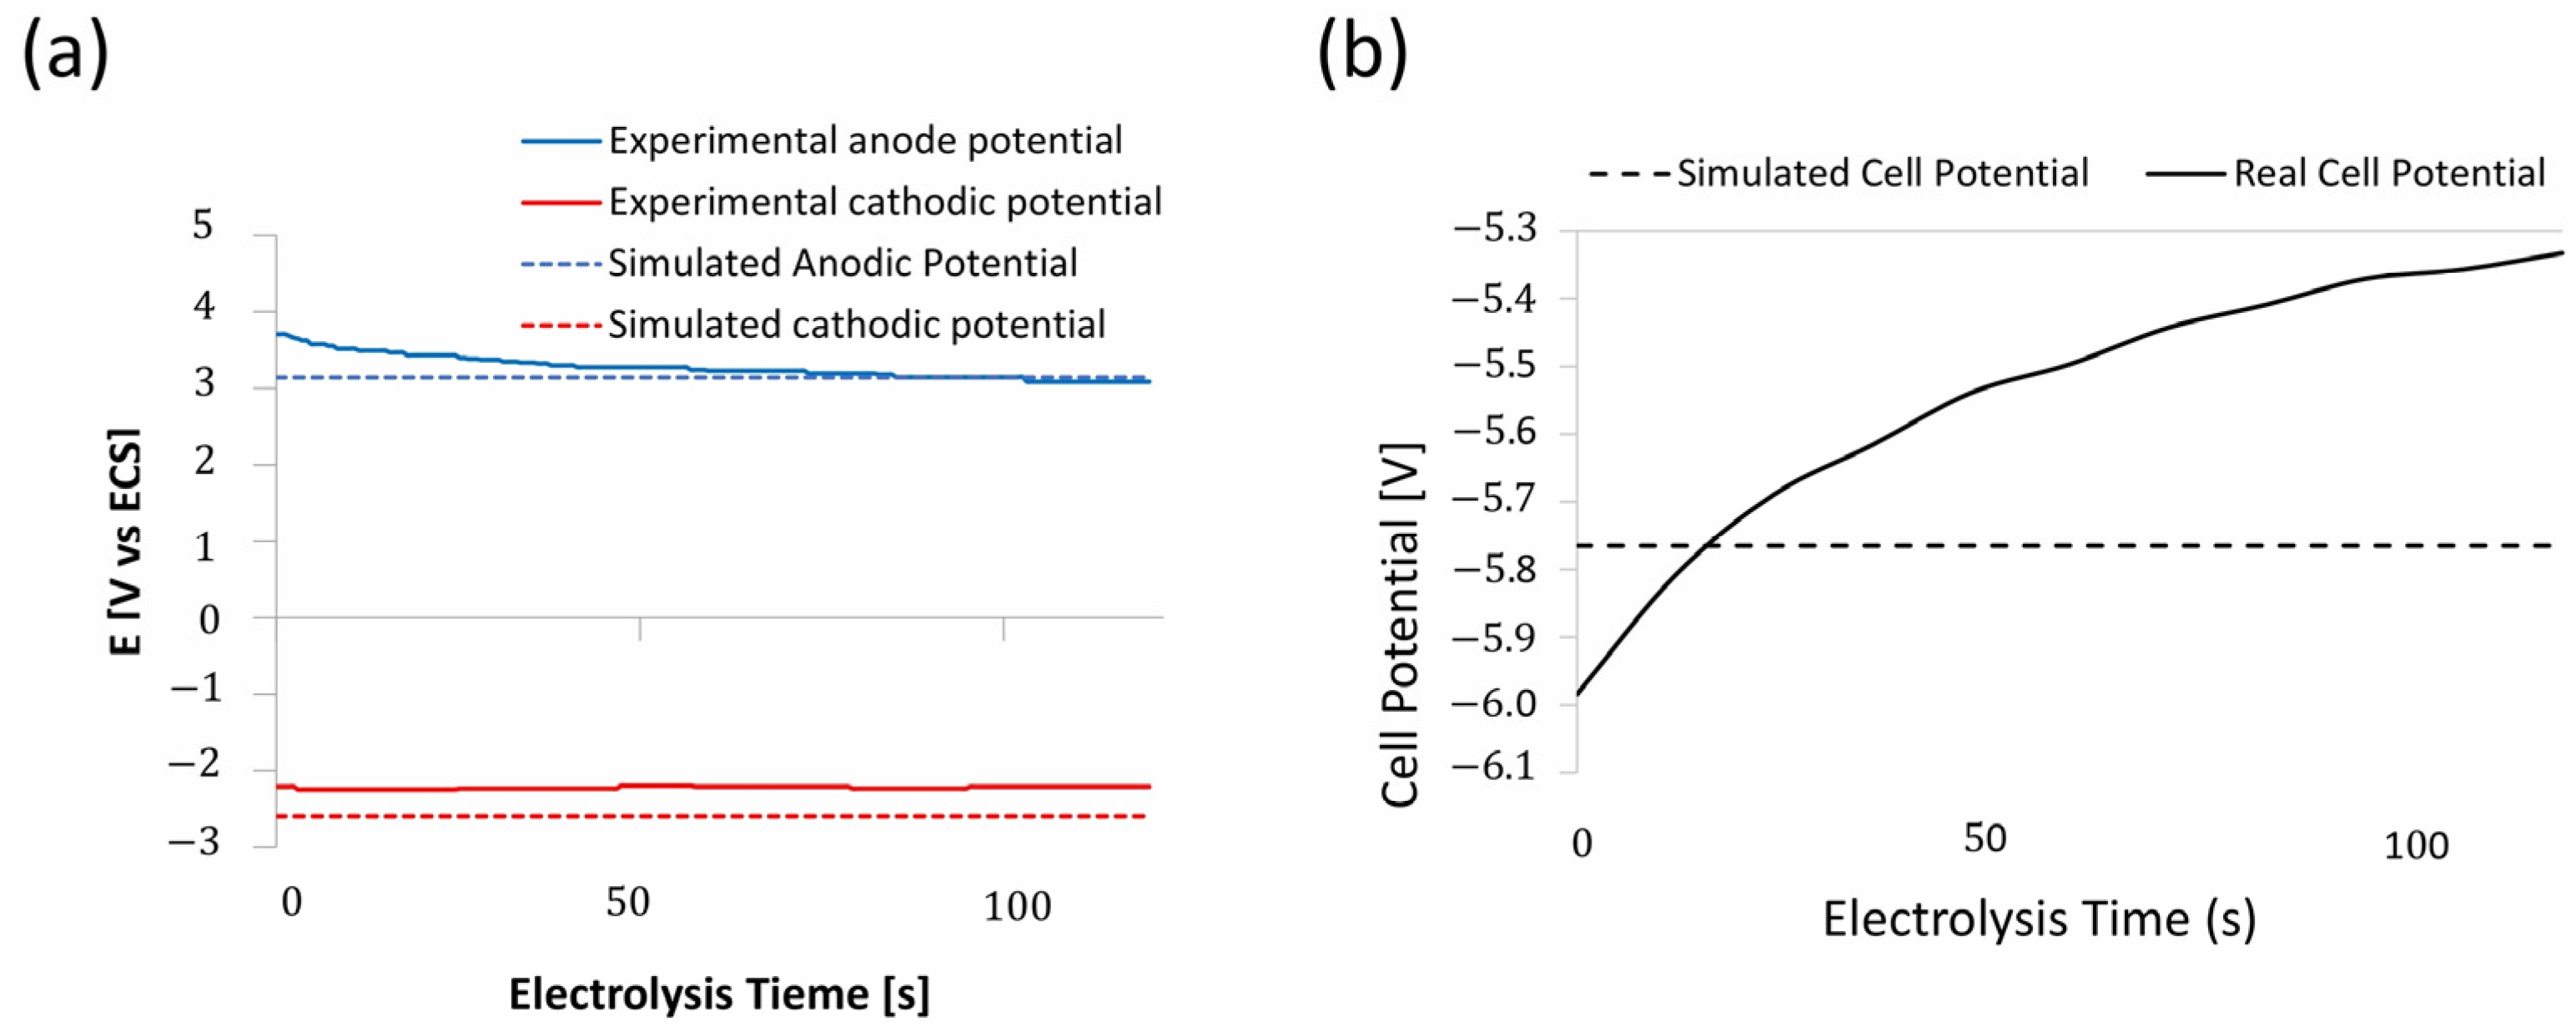
3.3. Experimental Validation

To validate the simulation results, they were compared to the experimental results of potential and mass of the production of EMM obtained at 120 min of electrolysis at −300 Am−2.
The experimental values of the cathodic potential (−2.22 V vs. SCE) and anodic potential (3.27 V vs. SCE) for the two-compartment cell (Figure 5a, solid line) are similar to those obtained from the COMSOL simulation for the two-compartment cell, which were −1.7576 V and 3.8384 V vs. ECS, respectively (Figure 5a, dotted line). These values represent a percentage error of 20.87% for the cathodic potential and 17.23% for the anodic potential.
On the other hand, the cell potential experimental results obtained in the simulation of two compartments are similar to 5.59 V and 5.8 V, respectively.
The cell potential of the five-compartment cell after 120 min, 5.33 V (Figure 5b, solid line), is similar to the simulation result of 5.765 V (Figure 5b, dotted line), which was obtained from the cathode and anodic electrochemical potential values of −2.625 V and 3.14 V vs. SCE, respectively (Figure 4c,d), with a percentage error of 0.31%. These error percentages have been calculated using Equation (7).
The current efficiency and energy consumption for the two- and five-compartment cells are shown in Table 4, where Formulas (8) and (9) are applied.
In Table 4, it is observed that the experimental mass values of the EMM for the two-compartment and five-compartment cells (5.838 g and 11.88 g, respectively) are similar to those obtained from the COMSOL simulation (5.207 g and 11.616 g), when the current efficiency of these electrochemical processes is 59% and 60.7%, respectively. Additionally, it is observed that increasing the number of cells decrease energy consumption, decreasing from 9.2435 kWh/kg in the two-compartment cell to 8.67 kWh/kg in the five-compartment cell.

3.4. Projection of the Cell Operation with a Greater Number of Compartments

Figure 6 shows the distribution of secondary current in the cathodes and anodes of cells with seven (Figure 6a,b) and nine compartments (Figure 6c,d). The faces of the cathodes facing the end anodes exhibit similar behavior in terms of potential distribution (−2.55 and −2.34 V vs. ECS for the seven- and nine-compartment cells, respectively), as do the central cathodes of these cells (with values of −2.31 and −2.17 V vs. SCE for the seven- and nine-compartment cells, respectively). This similarity is due to differences in the potential distribution on the central faces of the anodes (3 V vs. SCE for the seven-compartment cell and values of 3.1 and 3.2 V vs. SCE in the nine-compartment cell). In these configurations, the potential distribution on both faces of the cathodes is similar for cells with more than five compartments depending on the position of the cathodes within the cells. However, the nine-compartment cell showed three different potential distributions in the anodes (3.1, 3.2, and 3.45 V vs. SCE), while the five-compartment cell exhibited two potential distributions (3.14 and 3.45 V vs. SCE), as did the seven-compartment cell (3 and 3.45 V vs. SCE). This could indicate a higher transformation rate of the oxidized species involved in the kinetics of Mn deposition. The potential distribution behavior is consistent in both the cathodes and the anodes along the X-axis and Y-axis.
With the help of software, a dotted line was drawn to identify a set of data (current density and potential distribution with oxidation and reduction reactions) in the center of the anodes facing the cathodes and vice versa. For a better understanding, this line on the anode was placed at 28.32 mm on the “Y”-axis parallel to the “zx” plane and for the cathode 82.77 mm in the same direction. This set of data was made in cells with 5 to 13 compartments.
The electrolyte volume in both the cathodic and anodic compartments is 509 mL, resulting in a total electrolyte consumption of 1018 mL for the two-compartment cell and 2545 mL for the five-compartment cell. For cells with more than five compartments, electrolyte consumption is proportional to the number of compartments. These values were replaced by simulation, providing the following theoretical volume estimates for cells with 7, 9, 11, and 13 compartments: 3563 mL, 4581 mL, 5599 mL, and 6617 mL, respectively, totaling 20,360 mL. This projection study allowed us to save 140% of the electrolyte when comparing the real experiment (five-compartment cell) with the simulated data (seven-compartment cell).
Figure 7 shows the normalized current density distribution for the cathodes (Figure 7a) and anodes (Figure 7b) along the X-axis of the surface. Figure 7c presents the normalized current density distribution for the anode surfaces, face directed towards the Nylamid.
In Figure 7a, the normalized current density of the cathodes surface is 0.9617 for the five- and seven-compartment cells, 0.9684 for the nine-compartment cell, 0.978 for the 11-compartment cell, and 0.989 for the 13-compartment cells. The normalized current density of the anode surfaces facing the cathode (Figure 7b) is 0.991 in all the cells (5 to 13 compartments). In contrast, the current density of the anode surfaces facing Nylamid (Figure 7c) is 0.255 for the five and seven-compartment cells, 0.145 for the nine-compartment cell, 0.134 for the 11-compartment cell, and 0.187 for the 13-compartment cells.
This indicates that as the number of compartments increases, a greater deposit of EMM is obtained on both sides of the cathodes. Additionally, the amount of oxidized species produced at the anodes can interfere with the kinetics of Mn deposition, as sulfate migration through the anionic membrane into the cathodic compartment is possible. This migration alters the concentration and pH conditions within the compartment, potentially affecting the deposition process.
Figure 8 shows the curves that describe the potential distribution along the “X”-axis on the surface of the anodes and cathodes.
In Figure 8a, it is observed that the potential distribution on the surface of the cathodes is nearly constant in all cells, with values of −2.62, −2.56, −2.53, −2.5, and −2.49 V vs. SCE for the 5-, 7-, 9-, 11-, and 13-compartment cells, respectively. This behavior in the potential distribution of the cathodes is attributed to the lower electrolyte current density in the two-compartment cells compared to the other cells
In Figure 8b, it is observed that in all the cells, the potential distribution at the edges of the anode becomes increasingly anodic, reaching a maximum with parabolic behavior. In the cells with 5 to 13 compartments, the potential distribution at the edges of the anode gradually decreases, reaching minimum values of 3.442, 3.4419, 3.4410, 3.4406, and 3.4404 V vs. SCE, respectively, while the anode surfaces facing Nylamid (Figure 8c) reach maximum values of 3.4906, 3.4902, 3.4895, 3.4893, and 3.4892 V vs. SCE for 5- to 13-compartment cells, respectively.
The presence of anions produced at the anodes can shift the kinetics of Mn electrodeposition towards more cathodic potentials, which is reflected in the potential distribution of the cathodes observed in the different cell configurations (Figure 8a).
Thus, simulation results indicate that the 11-compartment cell presents better performance in the process of obtaining MME than the 5-, 7-, 9-, and 13-compartment cells by having a lower normalized current density (0.134) and a lower potential distribution (3.4406 and 3.4893 V vs. SCE) at the surface of the anode.

4. Conclusions

The similarity of the potential of cell, mass, and current density values of the two- and five-compartment cells of escalation simulation in COMSOL with the experimental results of the current-limiting controlled EMM validate the simulation programming parameters and thus the projection of the potential distribution of cathodes and anodes in cells with more than five compartments. As the number of compartments increases to five, energy consumption decreases from 9.2435 kWh/kg to 8.67 kWh/kg.
The 11-compartment cell is the most suitable for escalating the EMM deposit. This is because the normalized current density and potential distribution on the anodes are smaller compared to the 5-, 7-, 9-, and 13-compartment cells, resulting in a decrease in oxidation reactions and their impact on the cathode potential modifications.
Through simulation using the module current distribution secondary in COMSOL, it is possible to determine the potential distribution of anode and cathode electrodes in scaling electrochemical processes of electrowinning. This allows for scaling these processes to an industrial level, saving time, materials, and resources, as well as optimizing the electrochemical arrangement in diaphragm cells.

Author Contributions

V.E.R.C. contributed to the project administration, methodology, and formal analysis of the research. E.M.R.V. contributed to the realization of the research and data curation. F.M.G.M. contributed to the funding acquisition for the project leading to this publication and formal analysis. J.A.C.M. contributed to the conceptualization and formal analysis. Q.L.R.M. contributed to the supervision and sofware. G.U.R. contributed to the writing—review and editing, visualization and formal analysis of the research. M.V.R. contributed to the supervision and validation of the research. F.L.G. contributed to the supervision and validation of the research. M.V. contributed to resources and the formal analysis of the research. All authors have read and agreed to the published version of the manuscript.

Funding

This research was funded by ANID-Chile through the research project FONDECYT Initiation 11230550 and the ANID/FONDAP 1522A0006 Solar Energy Research Center SERC-Chile.

Data Availability Statement

The original contributions presented in this study are included in the article. Further inquiries can be directed to the corresponding author.

Acknowledgments

The authors would like to thank ANID-Chile for its support through the FONDECYT research project Initiation 11230550 and the ANID/FONDAP Solar Energy Research Center 1522A0006 SERC-Chile. They would also like to thank CONAHCYT for its financial support through the PhD scholarship in Materials Science from the Academic Area of Earth and Materials Sciences, from the Institute of Basic Sciences and Engineering of the Autonomous University of the State of Hidalgo.

Conflicts of Interest

The authors declare no conflicts of interest.

References

  1. Singh, V.; Chakraborty, T.; Tripathy, S.K. A Review of Low Grade Manganese Ore Upgradation Processes. Miner. Process. Extr. Met. Rev. 2019, 41, 417–438. [Google Scholar] [CrossRef]
  2. Aguirre, J.D.; Culotta, V.C. Battles with Iron: Manganese in Oxidative Stress Protection. J. Biol. Chem. 2012, 287, 13541–13548. [Google Scholar] [CrossRef]
  3. Wang, M.; Zhang, X.; Chao, D.; Qiao, S.Z.; Alshareef, H.N.; Chen, W. Opportunities of Aqueous Manganese-Based Batteries with Deposition and Stripping Chemistry. Adv. Energy Mater. 2020, 11, 2002904. [Google Scholar] [CrossRef]
  4. Dashevskiy, V.Y.; Zhuchkov, V.I.; Zhdanov, A.V.; Leontyev, L.I. Production of Manganese Ferroalloys from Russian Manganese Ores. In Advanced Methods and Technologies in Metallurgy in Russia; Springer: Berlin/Heidelberg, Germany, 2018; pp. 103–111. [Google Scholar] [CrossRef]
  5. Karakurkchi, A.V.; Sakhnenko, N.D.; Ved, M.V.; Luhovskyi, I.S.; Drobakha, H.A.; Mayba, M.V. Features of Plasma Electrolytic Formation of Manganese- and Cobalt-Containing Composites on Aluminum Alloys. Adv. Mater. Sci. Eng. 2019, 2019, 1–13. [Google Scholar] [CrossRef]
  6. Sun, X.; Hao, H.; Liu, Z.; Zhao, F. Insights into the global flow pattern of manganese. Resour. Policy 2020, 65, 101578. [Google Scholar] [CrossRef]
  7. Fernández-González, D.; Sancho-Gorostiaga, J.; Piñuela-Noval, J.; González, L.F.V. Anodic Lodes and Scrapings as a Source of Electrolytic Manganese. Metals 2018, 8, 162. [Google Scholar] [CrossRef]
  8. Petersen, H.A.; Myren, T.H.; O’Sullivan, S.J.; Luca, O.R. Electrochemical methods for materials recycling. Mater. Adv. 2021, 2, 1113–1138. [Google Scholar] [CrossRef]
  9. Ayala, J.; Fernández, B. Recovery of manganese from silicomanganese slag by means of a hydrometallurgical process. Hydrometallurgy 2015, 158, 68–73. [Google Scholar] [CrossRef]
  10. Song, X.; Zhou, J.; Shui, B.; Wang, S.; Wu, N. Electrodeposition of Manganese Metal and Co-production of Electrolytic Manganese Dioxide Using Single-membrane Double-chamber Electrolysis. Electrochemistry 2021, 89, 447–454. [Google Scholar] [CrossRef]
  11. Wei, Q.; Ren, X.; Du, J.; Wei, S.; Hu, S. Study of the electrodeposition conditions of metallic manganese in an electrolytic membrane reactor. Miner. Eng. 2010, 23, 578–586. [Google Scholar] [CrossRef]
  12. Tsurtsumia, G.; Shengelia, D.; Koiava, N.; Lezhava, T.; Gogoli, D.; Beriashvili, L.; Hydrometallurgy, I.K. Novel hydro-electrometallurgical technology for simultaneous production of manganese metal, electrolytic manganese dioxide, and manganese sulfate monohydrate. Hydrometallurgy 2019, 186, 260–268. [Google Scholar] [CrossRef]
  13. Lu, J.; Dreisinger, D.; Glück, T. Electrolytic manganese metal production from manganese carbonate precipitate. Hydrometallurgy 2016, 161, 45–53. [Google Scholar] [CrossRef]
  14. Rojas-Montes, J.C.; Pérez-Garibay, R.; Uribe-Salas, A. The Effects of an Anionic Membrane on the Electrodeposition of Manganese Ions: A Kinetic and Statistical Study. J. Electrochem. Soc. 2013, 161, D67–D72. [Google Scholar] [CrossRef]
  15. Rojas-Montes, J.C.; Pérez-Garibay, R.; Uribe-Salas, A.; Teodoro, B.-S. Selenium reaction mechanism in manganese electrodeposition process. J. Electroanal. Chem. 2017, 803, 65–71. [Google Scholar] [CrossRef]
  16. Padhy, S.K.; Tripathy, B.C.; Alfantazi, A. Effect of sodium alkyl sulfates on electrodeposition of manganese metal from sulfate solutions in the presence of sodium metabisulphite. Hydrometallurgy 2018, 177, 227–236. [Google Scholar] [CrossRef]
  17. Montes, J.C.R.; Santillán, C.G.F.; Gómez, V.J.M.; Casillas, D.C.M.; Chigo, R.L.; Epistemus, F.A. Evaluación de Aditivos Alternativos Al SeO2 en la Electrodeposición de Manganeso Métalico. Epistemus 2021, 15, 49–55. [Google Scholar] [CrossRef]
  18. Reyes-Morales, Q.L.; Reyes-Cruz, V.E.; Trujillo-Estrada, A.; Cobos-Murcia, J.A.; Urbano-Reyes, G.; Pérez-Labra, M. Selenium and sulphur reactions involved in manganese reduction from sulphate solutions. RSC Adv. 2021, 11, 25542–25550. [Google Scholar] [CrossRef]
  19. Reyes-Morales, Q.L.; Reyes-Cruz, V.E.; Estrada, A.T.; Cobos-Murcia, J.A.; Reyes, G.U.; Labra, M.P.; Meneses, E.R. The effect of two anionic membranes (AMI 7001s and Neosepta AMX) on the electrodeposition of manganese from sulphate solutions. RSC Adv. 2022, 12, 17661–17674. [Google Scholar] [CrossRef]
  20. Zhong, H.; Zhang, Q.; Liu, Z.; Du, J.; Tao, C. Ti/Ti4O7 Anodes for Efficient Electrodeposition of Manganese Metal and Anode Slime Generation Reduction. ACS Omega 2023, 8, 38469–38480. [Google Scholar] [CrossRef]
  21. Lyu, K.; Zhang, W.; Chen, Y.; Wang, C. Energy-efficient and advanced electrowinning of metallic manganese within a novel H exchange membrane cell using a Ti/IrO−RuO−SiO anode. Sep. Purif. Technol. 2024, 347, 127489. [Google Scholar] [CrossRef]
  22. Cobos-Murcia, J.A.; Hernández-Aguilar, E.; Trujillo-Estrada, A.; Gallegos-Ortega, G.; Reyes-Cruz, V.E. Geometry optimization of an electrochemical reactor for bleaching kaolin. Clay Miner. 2022, 57, 183–191. [Google Scholar] [CrossRef]
  23. Tsai, T.H.; Babulal, S.M.; Wu, Y.F. Numerical simulation and experimental study on electrochemical recovery of copper using cylindrical and conical flow reactors. Int. J. Electrochem. Sci. 2024, 20, 100894. [Google Scholar] [CrossRef]
  24. Ma, C.W.; Yu, S.H.; Fang, J.K.; Yang, P.F.; Chang, H.C. The physical improvement of copper deposition uniformity with the simulation models. J. Electroanal. Chem. 2023, 948, 117790. [Google Scholar] [CrossRef]
  25. Wang, X.; Li, C.; Tie, J. Numerical Simulation of Cathode Nodule Local Effects. Metals 2024, 14, 457. [Google Scholar] [CrossRef]
  26. Pérez, T.; León, C.P.; Walsh, F.C.; Nava, J.L. Simulation of current distribution along a planar electrode under turbulent flow conditions in a laboratory filter-press flow cell. Electrochim. Acta 2015, 154, 352–360. [Google Scholar] [CrossRef]
  27. Vázquez, A.; Rodríguez, I.; Lázaro, I. Primary potential and current density distribution analysis: A first approach for designing electrocoagulation reactors. Chem. Eng. J. 2011, 179, 253–261. [Google Scholar] [CrossRef]
  28. Giaccherini, A.; Caporali, S.; Berretti, E.; Marcantelli, P.; Sanzari; Perissi, I.; Innocenti, M. Finite Elements Analysis of an Electrochemical Coating Process of an Irregularly Shaped Cathode with COMSOL Multiphysics®. ECS Trans. 2015, 64, 1. [Google Scholar] [CrossRef]
Figure 1. Diaphragm-type cell with compartments separated by an anionic membrane (yellow); cathodes 1, 2, and 3 (red) are surrounded by the corresponding anodes (blue).
Metals 15 00562 g001
Figure 2. Schematic representation of the compartment model with (a) 2, (b) 5, (c) 7, and (d) 9 mesh sections.
Metals 15 00562 g002
Figure 4. Two-compartment cells showing the (a) cathode and (b) anode, as well as the cell with 5 compartments showing the (c) cathode and (d) anode.
Metals 15 00562 g004
Figure 5. Experimental determination of the (a) electrode potential values in the 2-compartment arrangement and the (b) cell potential in the 5-compartment arrangement compared to the experimental results.
Metals 15 00562 g005
Figure 6. Distribution of the electrochemical potentials of the (a) cathodes and (b) anodes in the arrangements of 7 compartments and the (c) cathodes and (d) anodes of 9 compartments.
Metals 15 00562 g006
Figure 7. Current density on the X-axis of surface. (a) Cathodes, (b) anodes, and (c) normalized current density focusing on Nylamid.
Metals 15 00562 g007
Figure 8. Potential distribution along the “X”-axis on the surface of the (a) cathodes, (b) anodes and (c) normalized current density face directed towards the Nilamyd.
Metals 15 00562 g008
Table 1. Experimental parameters (real).
ParameterValue
Manganese sulfate [M]0.27
Ammonium sulfate [M]125.7
Selenium dioxide [mM]5.4
Acid sulfuric [M]0.5
Chemical concentration equivalent [g/Ah]1.025
Current density [A/m2]300
Electrolysis time [min]120
Temperature [T]/K293.15
Table 2. Parameters used in the numerical simulation.
ParameterValue
Anolyte conductivity [k]/Sm−1203
Catholyte conductivity [k]/Sm−1125.7
Membrane conductivity [k]/Sm−10.0363
Exchange current density [i0]/Am−2300
Cathode external electrical potential [ φ s, ext]/V−2.5
Anode external electrical potential [ φ s, ext]/V3.5
Cathodic transfer coefficient [αc]0.5
Anodic transfer coefficient [αa]0.5
Temperature [T]/K293.15
Table 3. Mesh refinement and simulation times.
Cell ConfigurationNumber of Elements (Domain)Number of Elements (Contour)Refinement and
Solution Time
2 compartments802,482124,538648 s
5 compartments909,450133,506679 s
7 compartments1,066,757144,4901213 s
9 compartments1,146,220126,5041340 s
11 compartments1,613,451191,2641808 s
13 compartments2,401,282284,6001819 s
Table 4. Real and simulated recovered masses of EMM.
CellReal Mass [g] η c , Real Current
Efficiency [%]
Simulated Mass [g]CE [kWh/kg]
25.838595.2079.2435
511.8860.711.6168.67
Disclaimer/Publisher’s Note: The statements, opinions and data contained in all publications are solely those of the individual author(s) and contributor(s) and not of MDPI and/or the editor(s). MDPI and/or the editor(s) disclaim responsibility for any injury to people or property resulting from any ideas, methods, instructions or products referred to in the content.

