

Experimental and Numerical Investigation on Dynamic Shear Behavior of 30CrMnSiNi2A Steel Using Flat-Hat Specimens

Abstract
1. Introduction
2. Materials and Methods
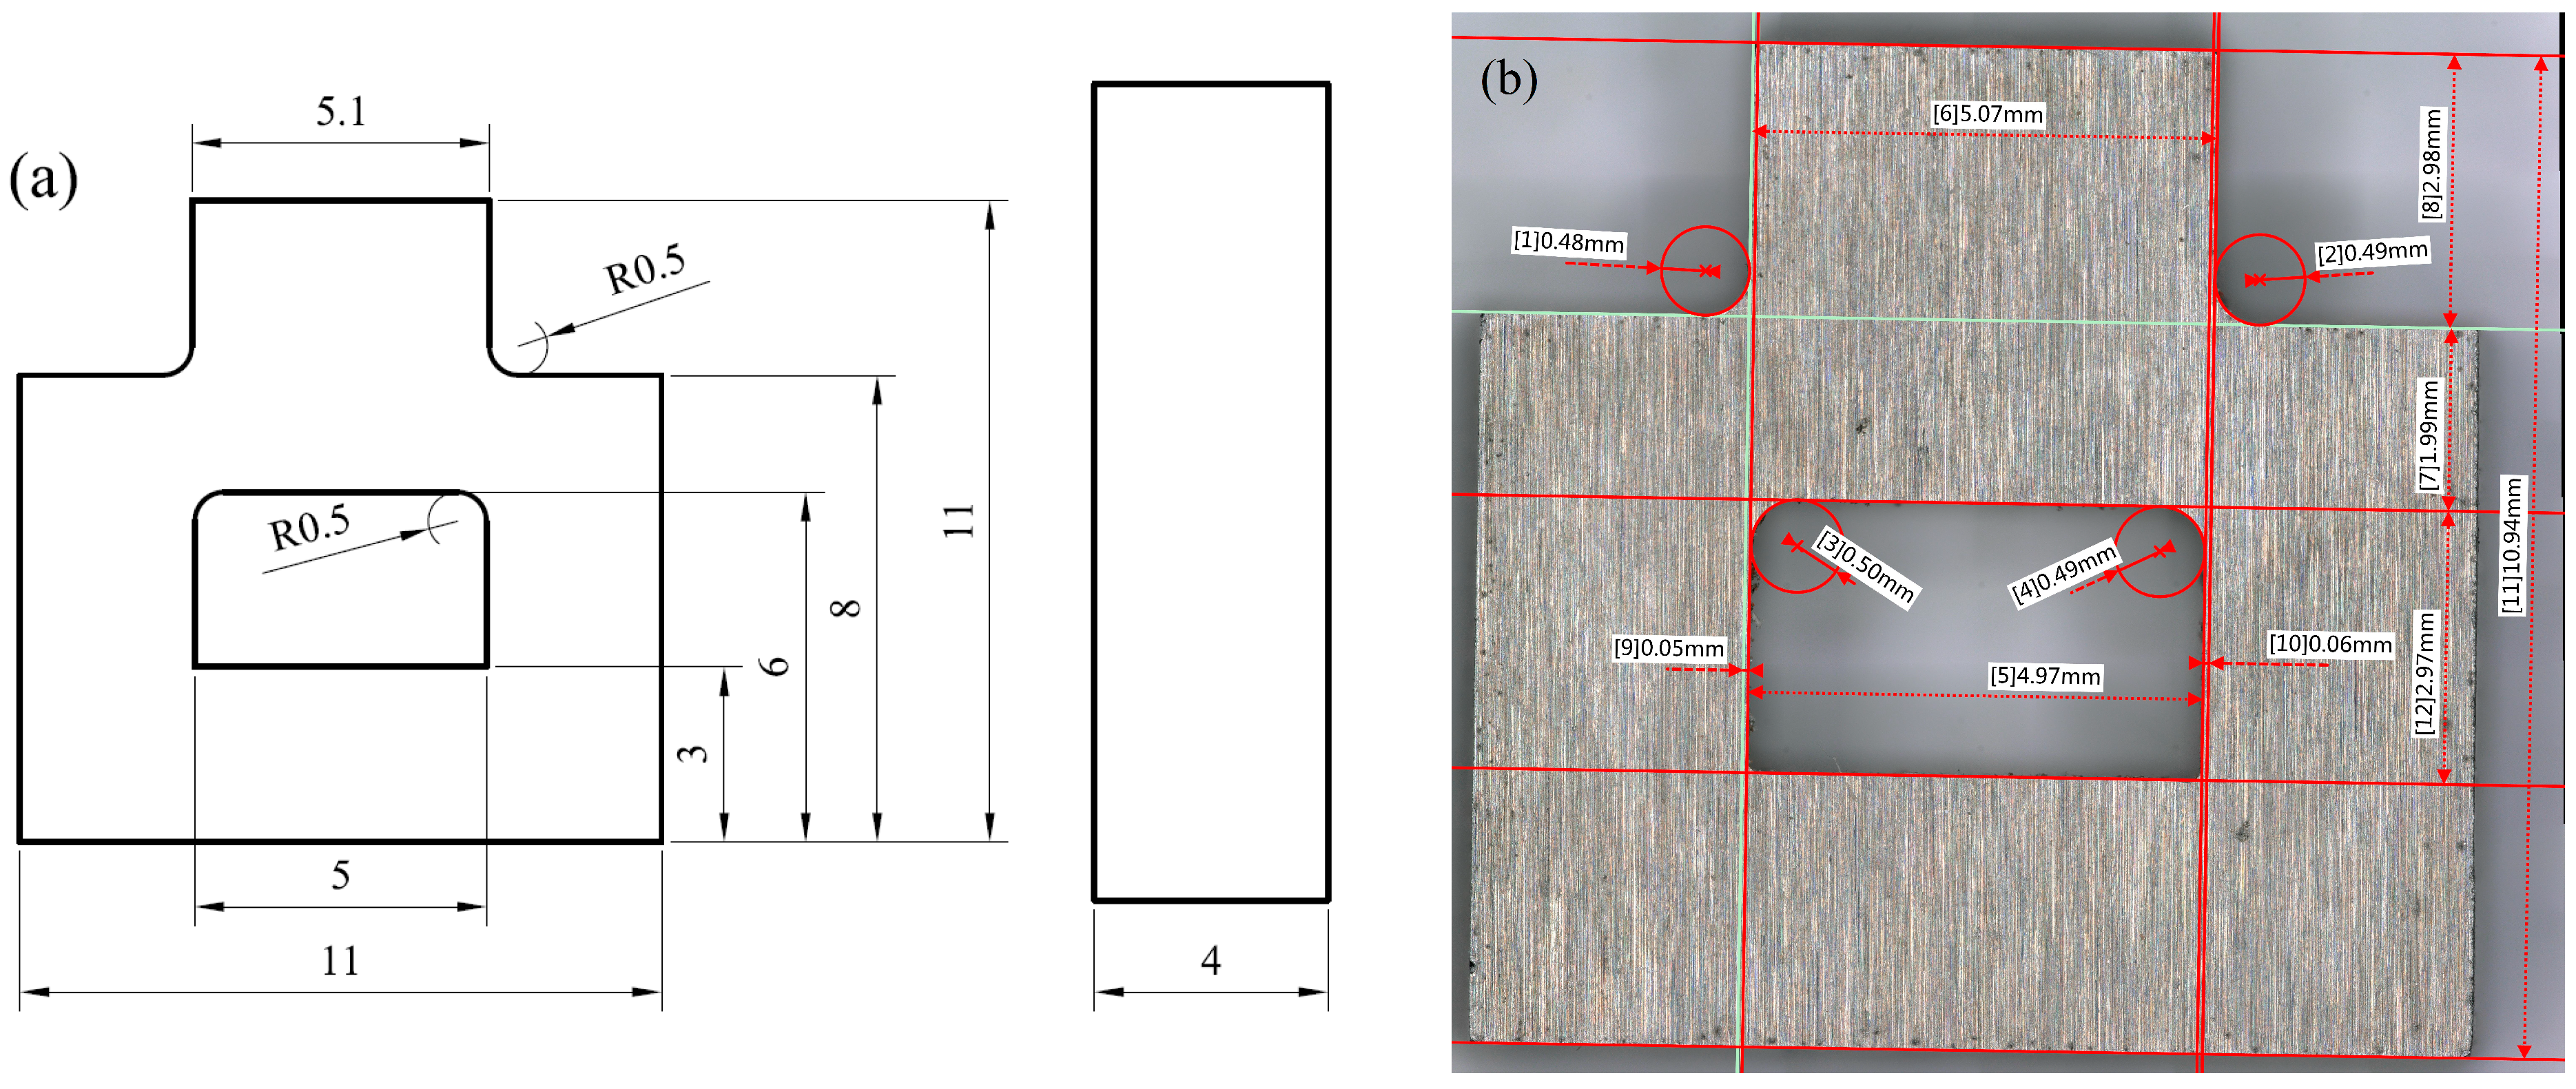
2.1. Materials and Specimen Geometry
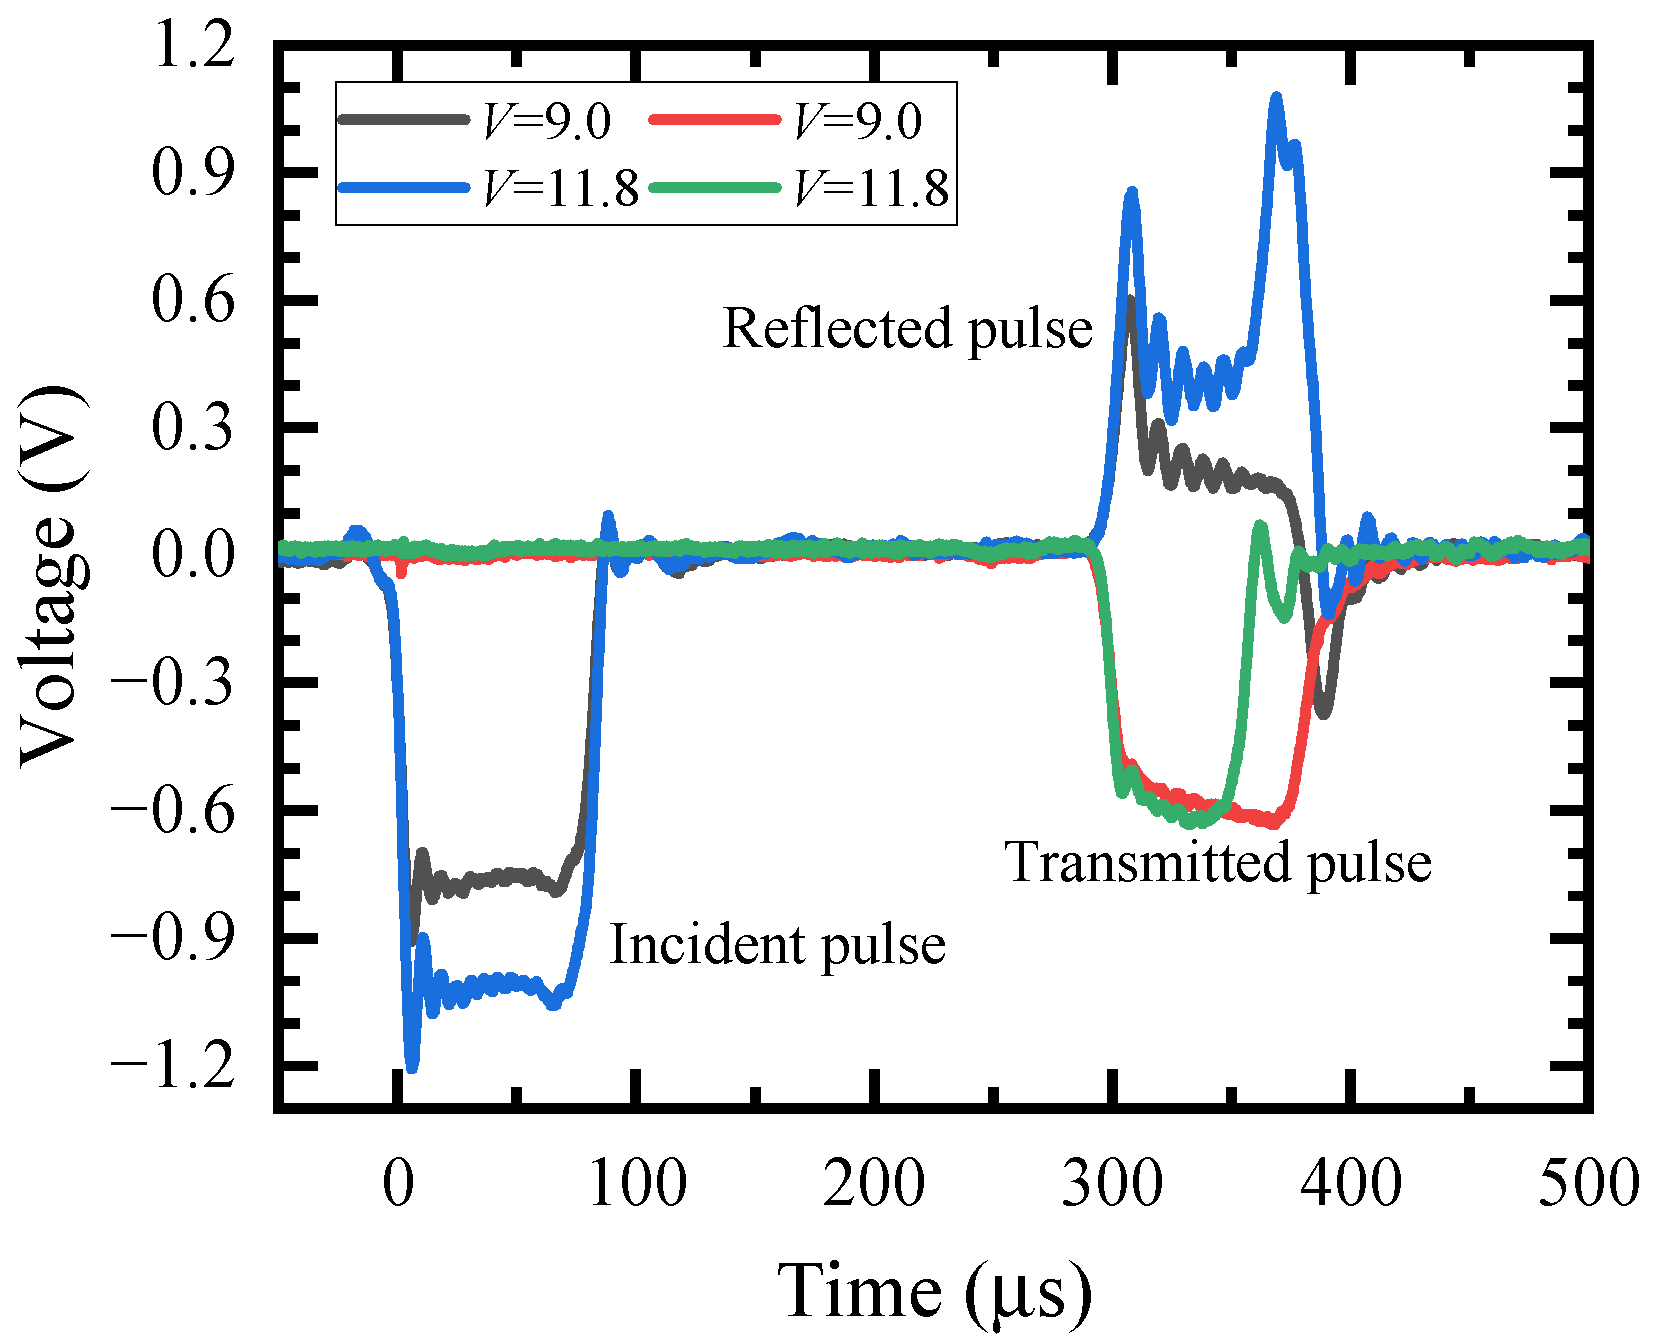
2.2. Experimental Work
2.3. Finite Element Simulation Set-Up
3. Results
3.1. Experimental Results
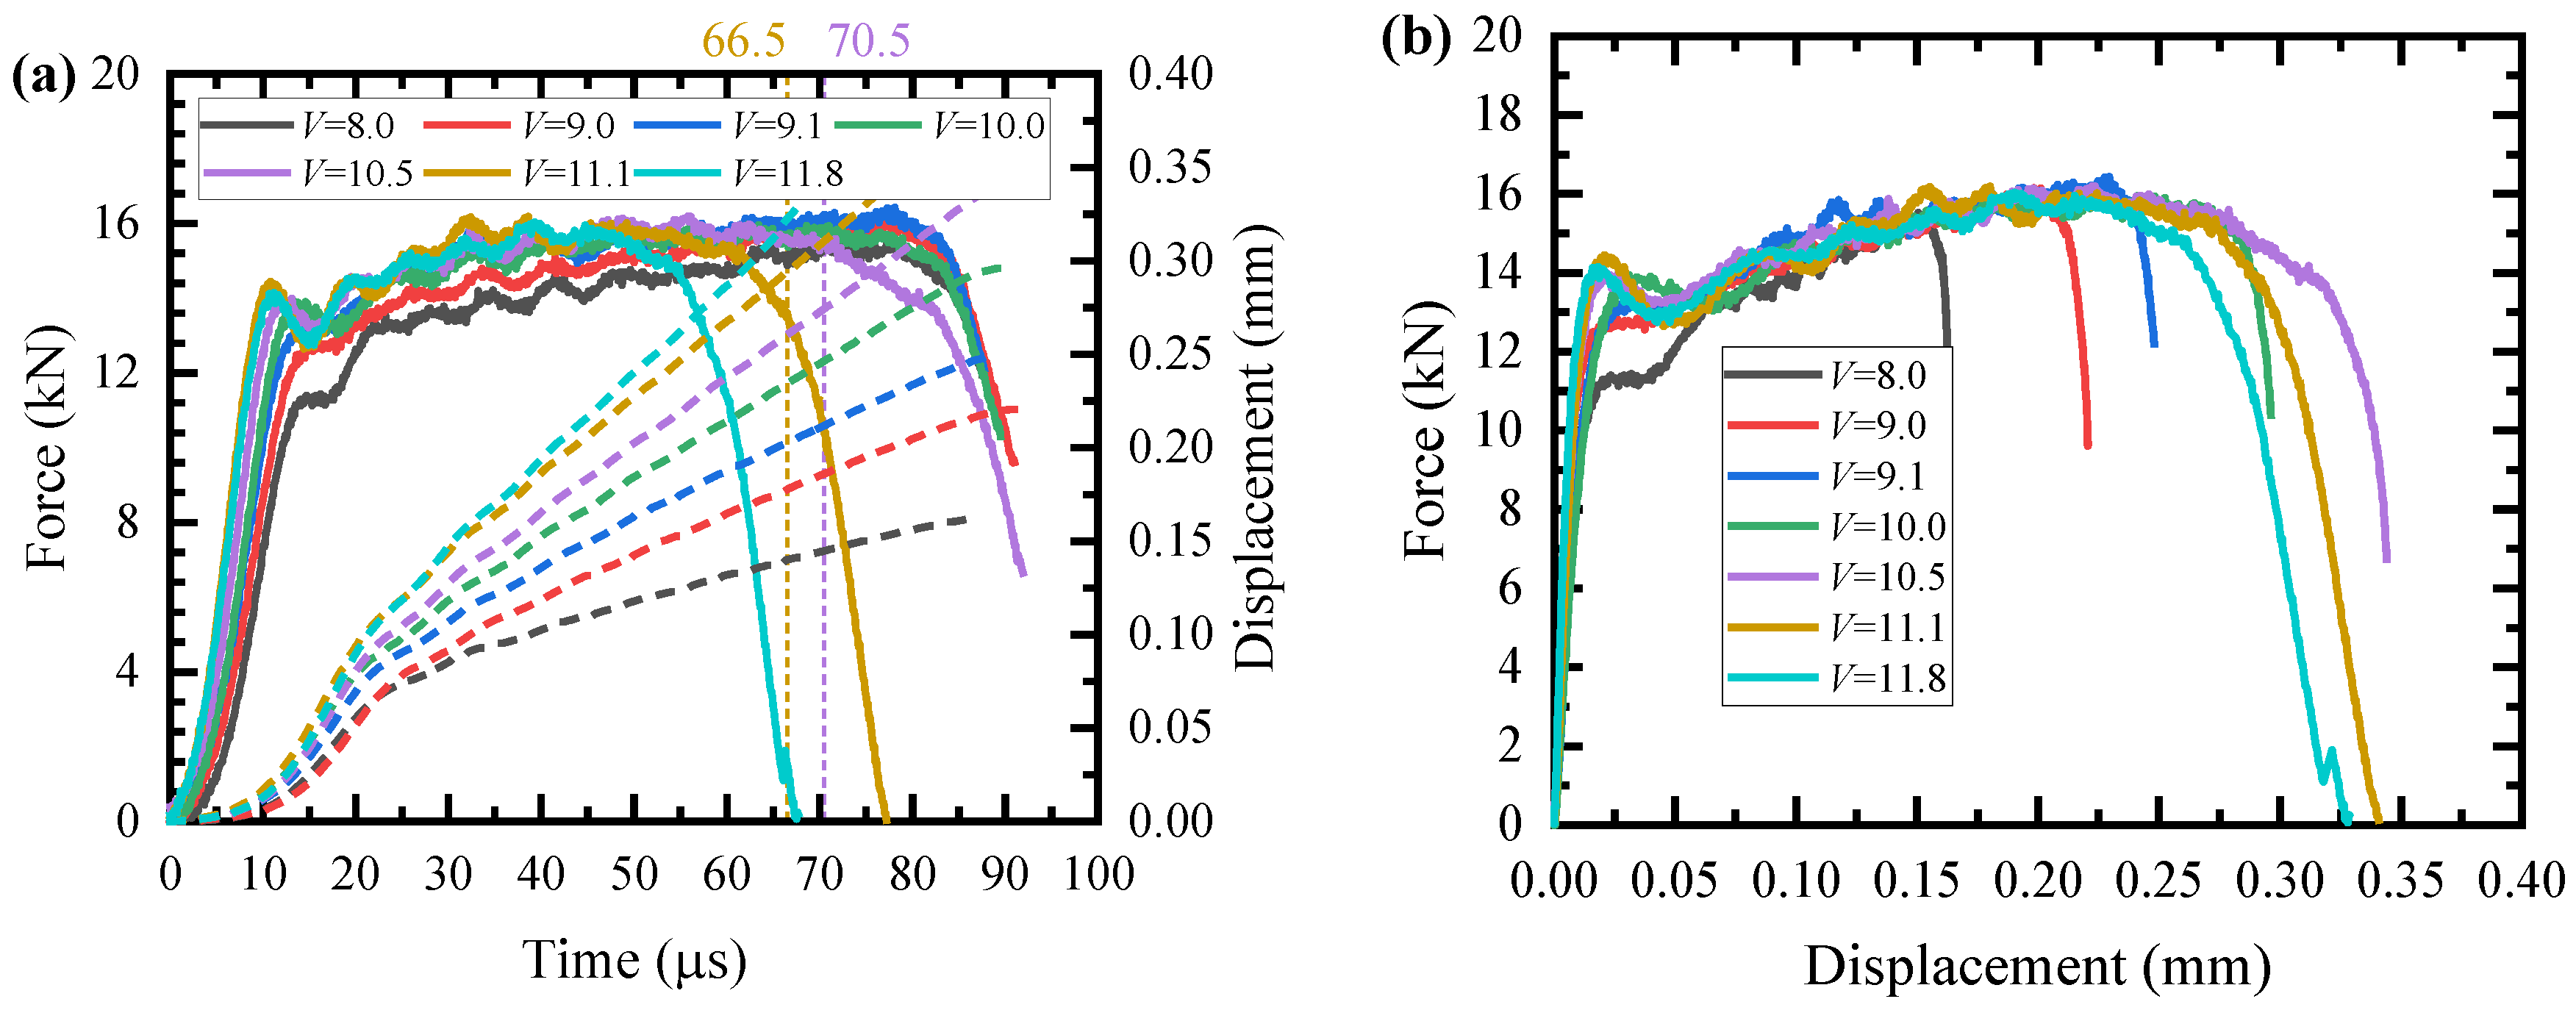
3.1.1. Mechanical Response
3.1.2. Microstructural Observation
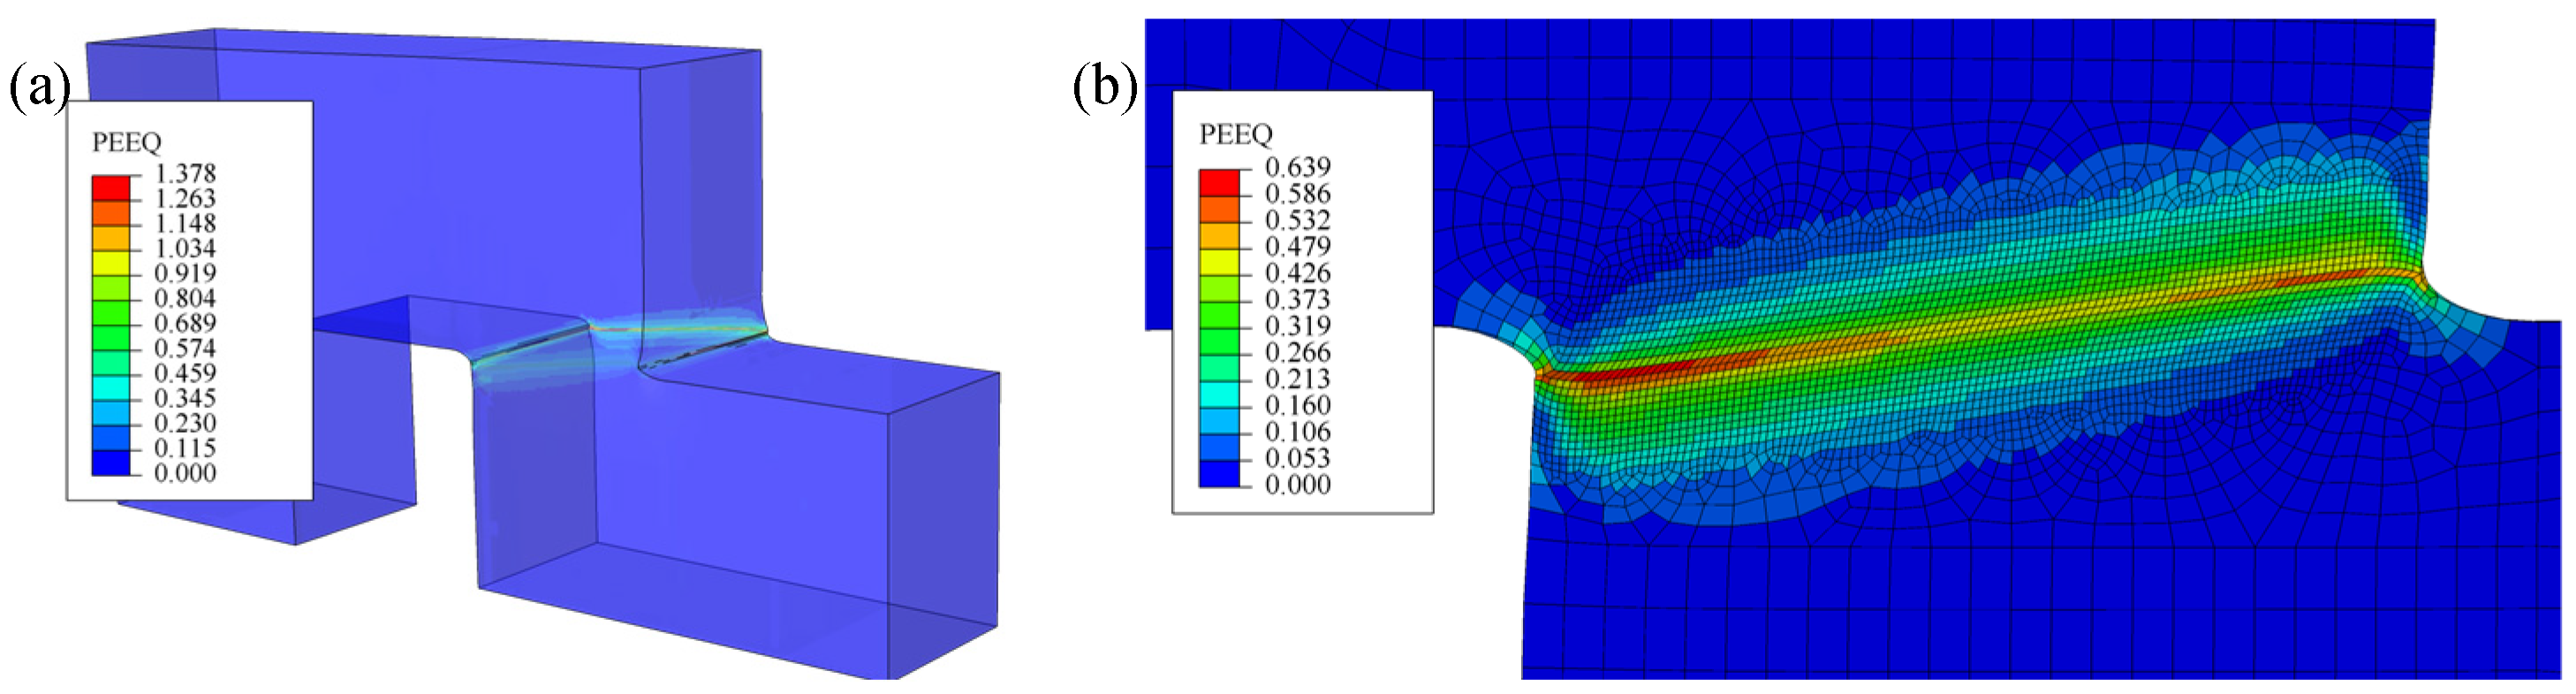
3.2. Numerical Results
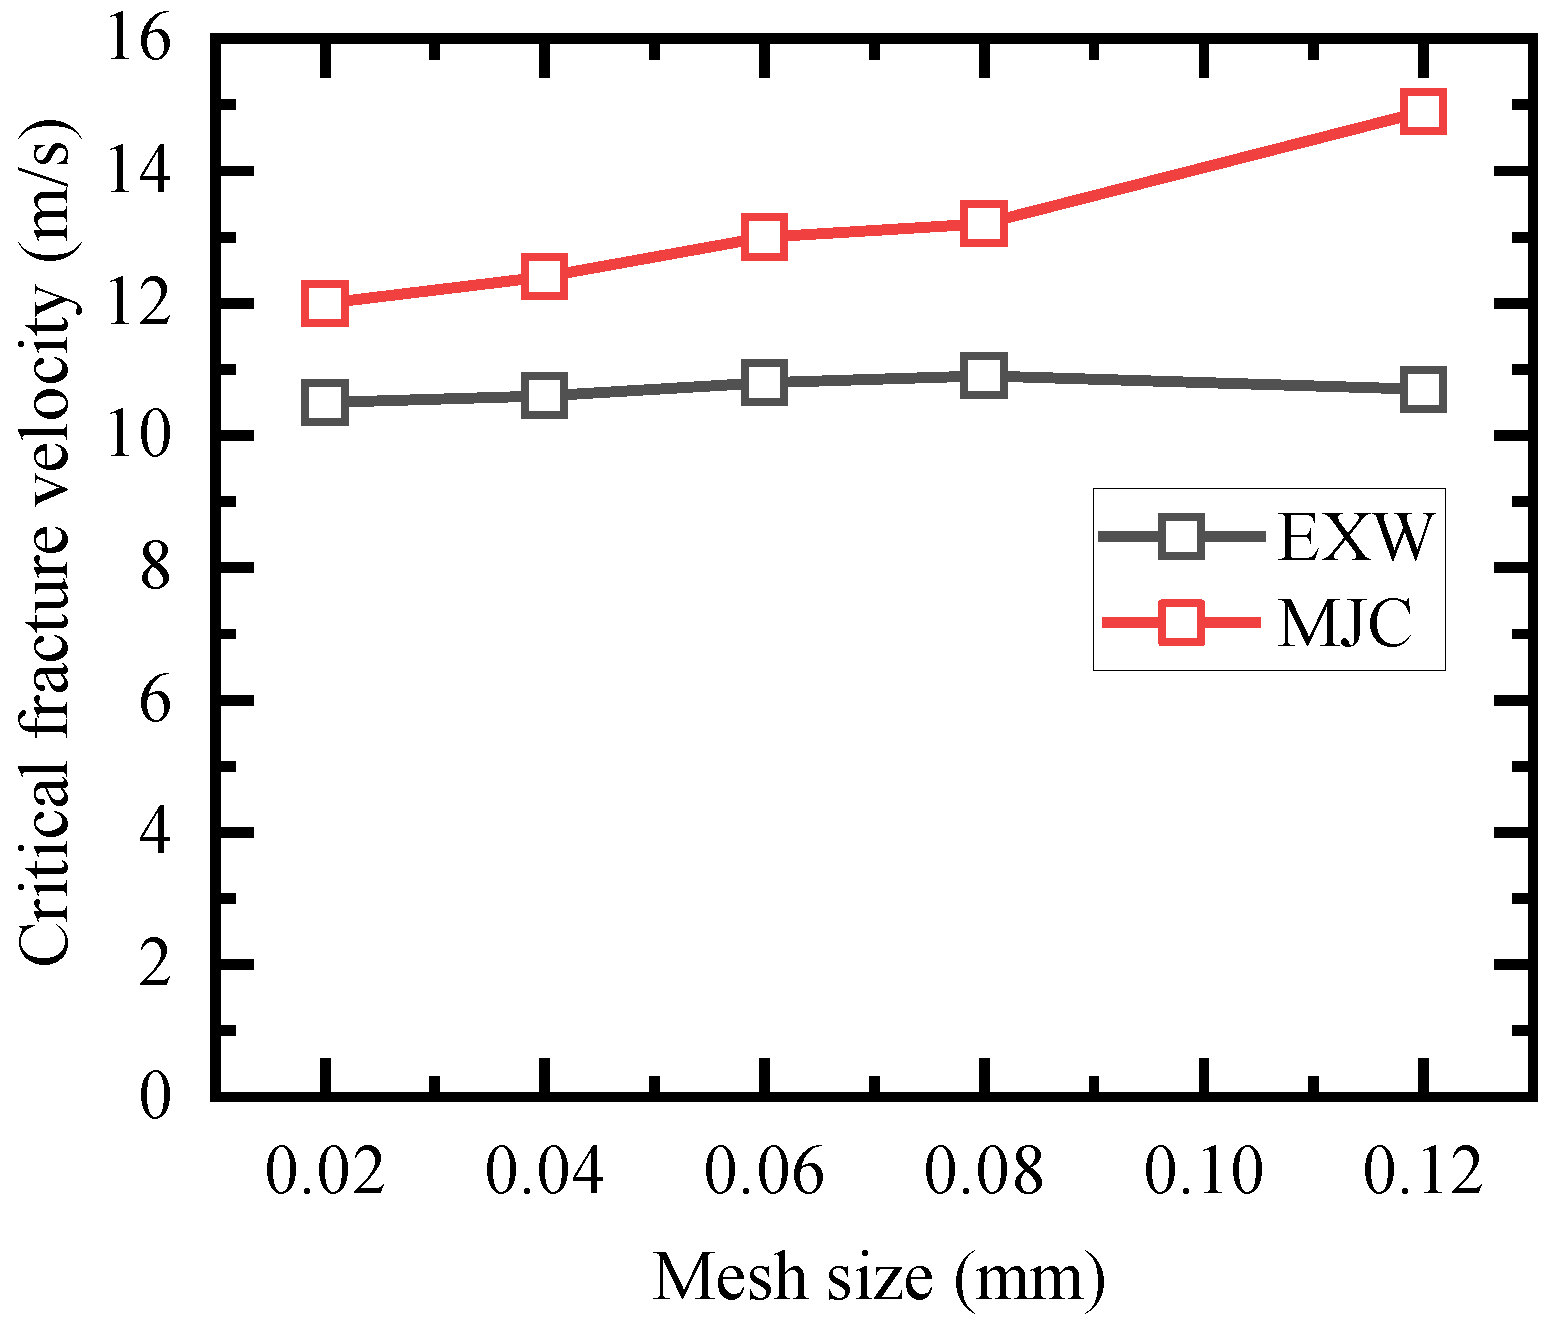
3.2.1. Mesh Size Sensitivity
3.2.2. Critical Fracture Velocity
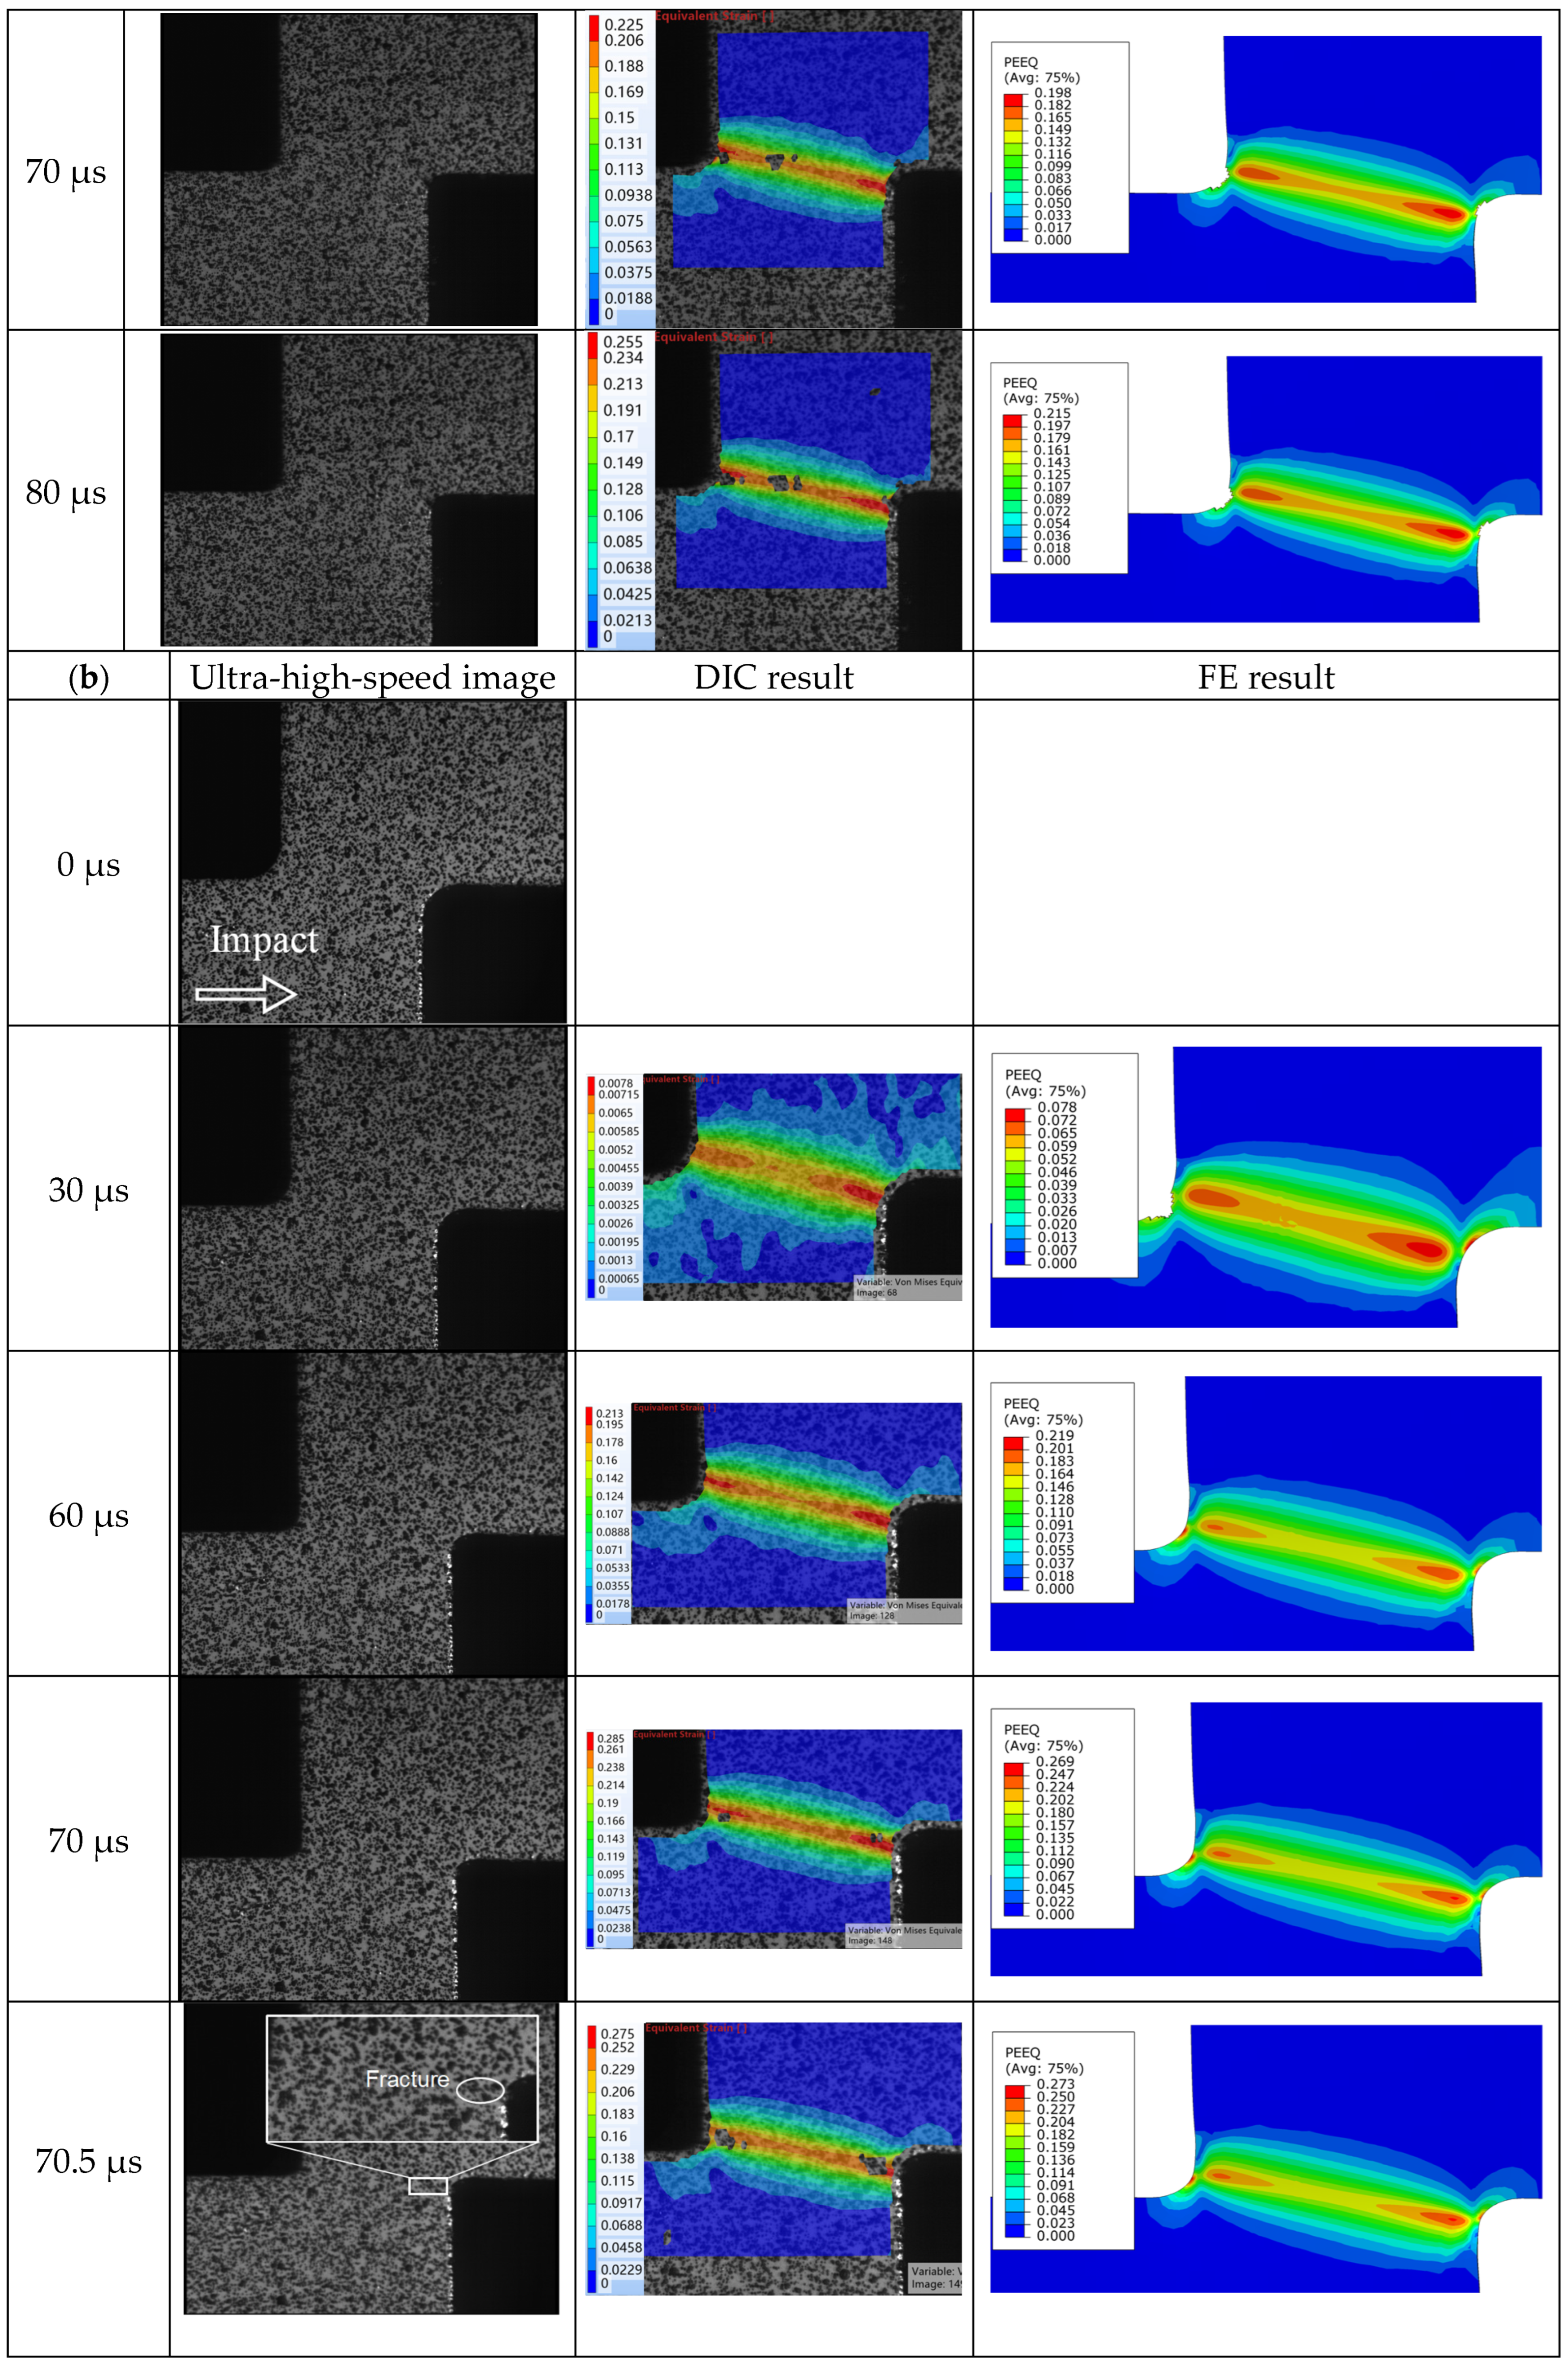
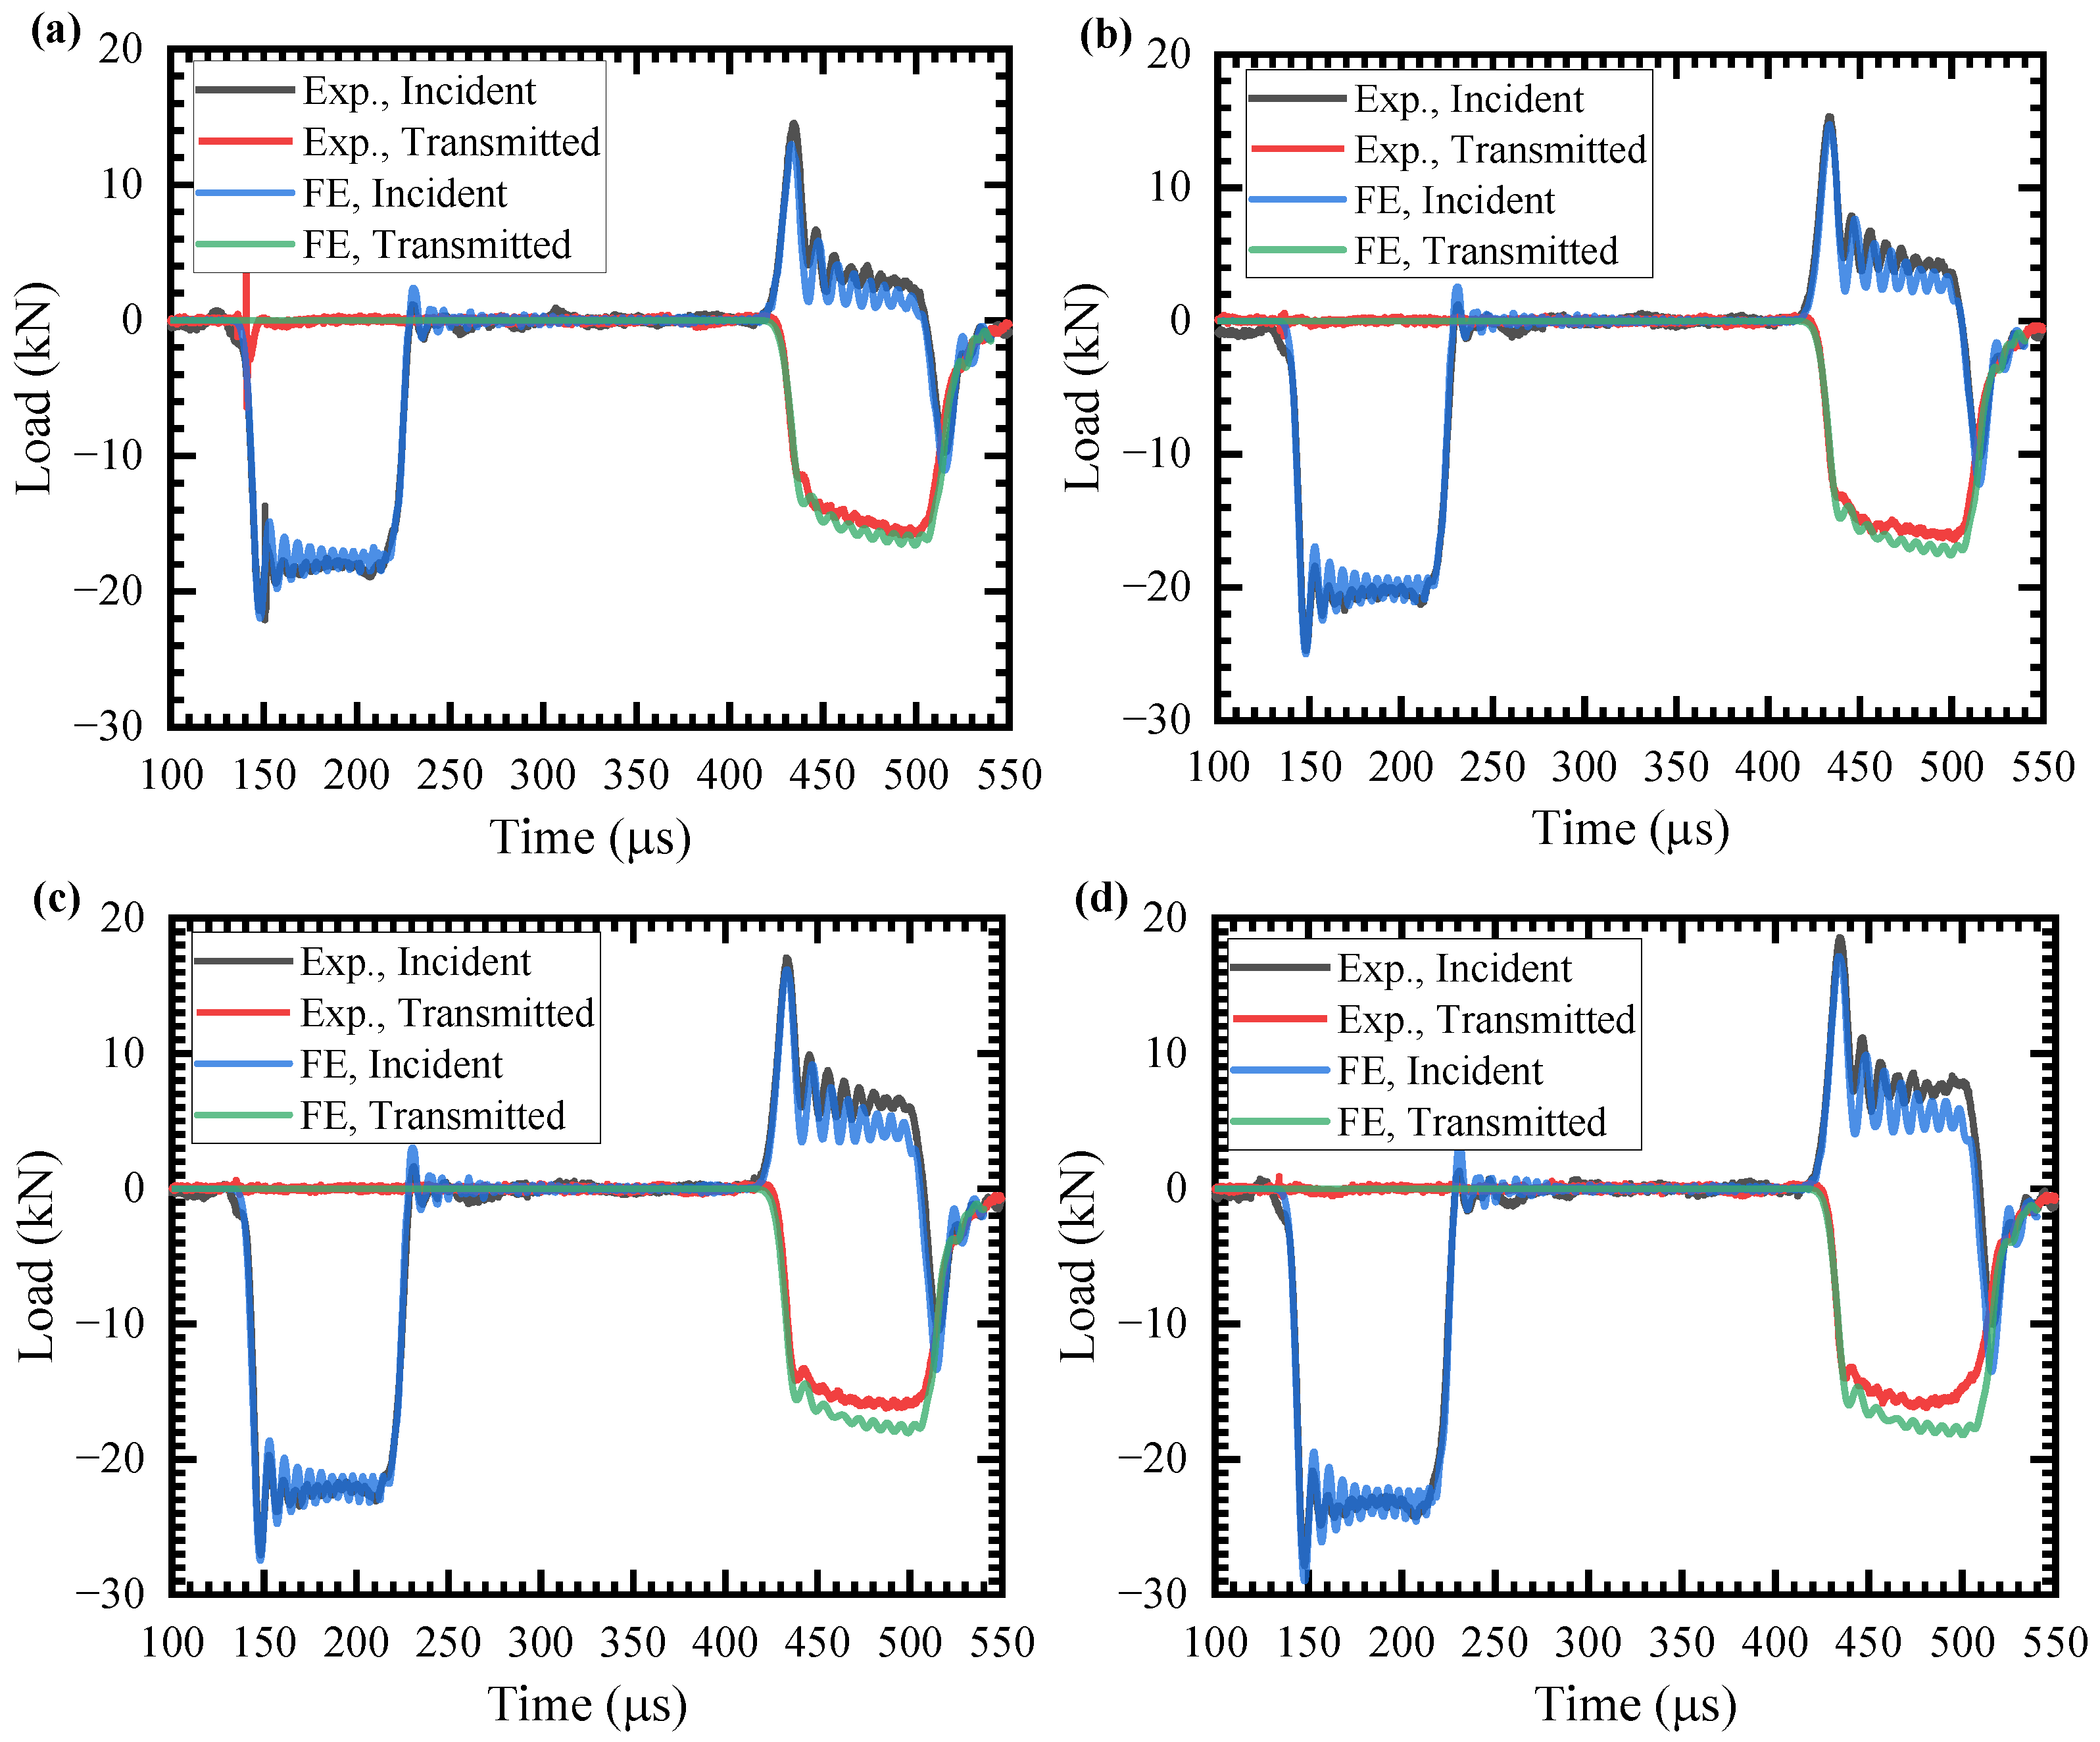
3.2.3. Loading History
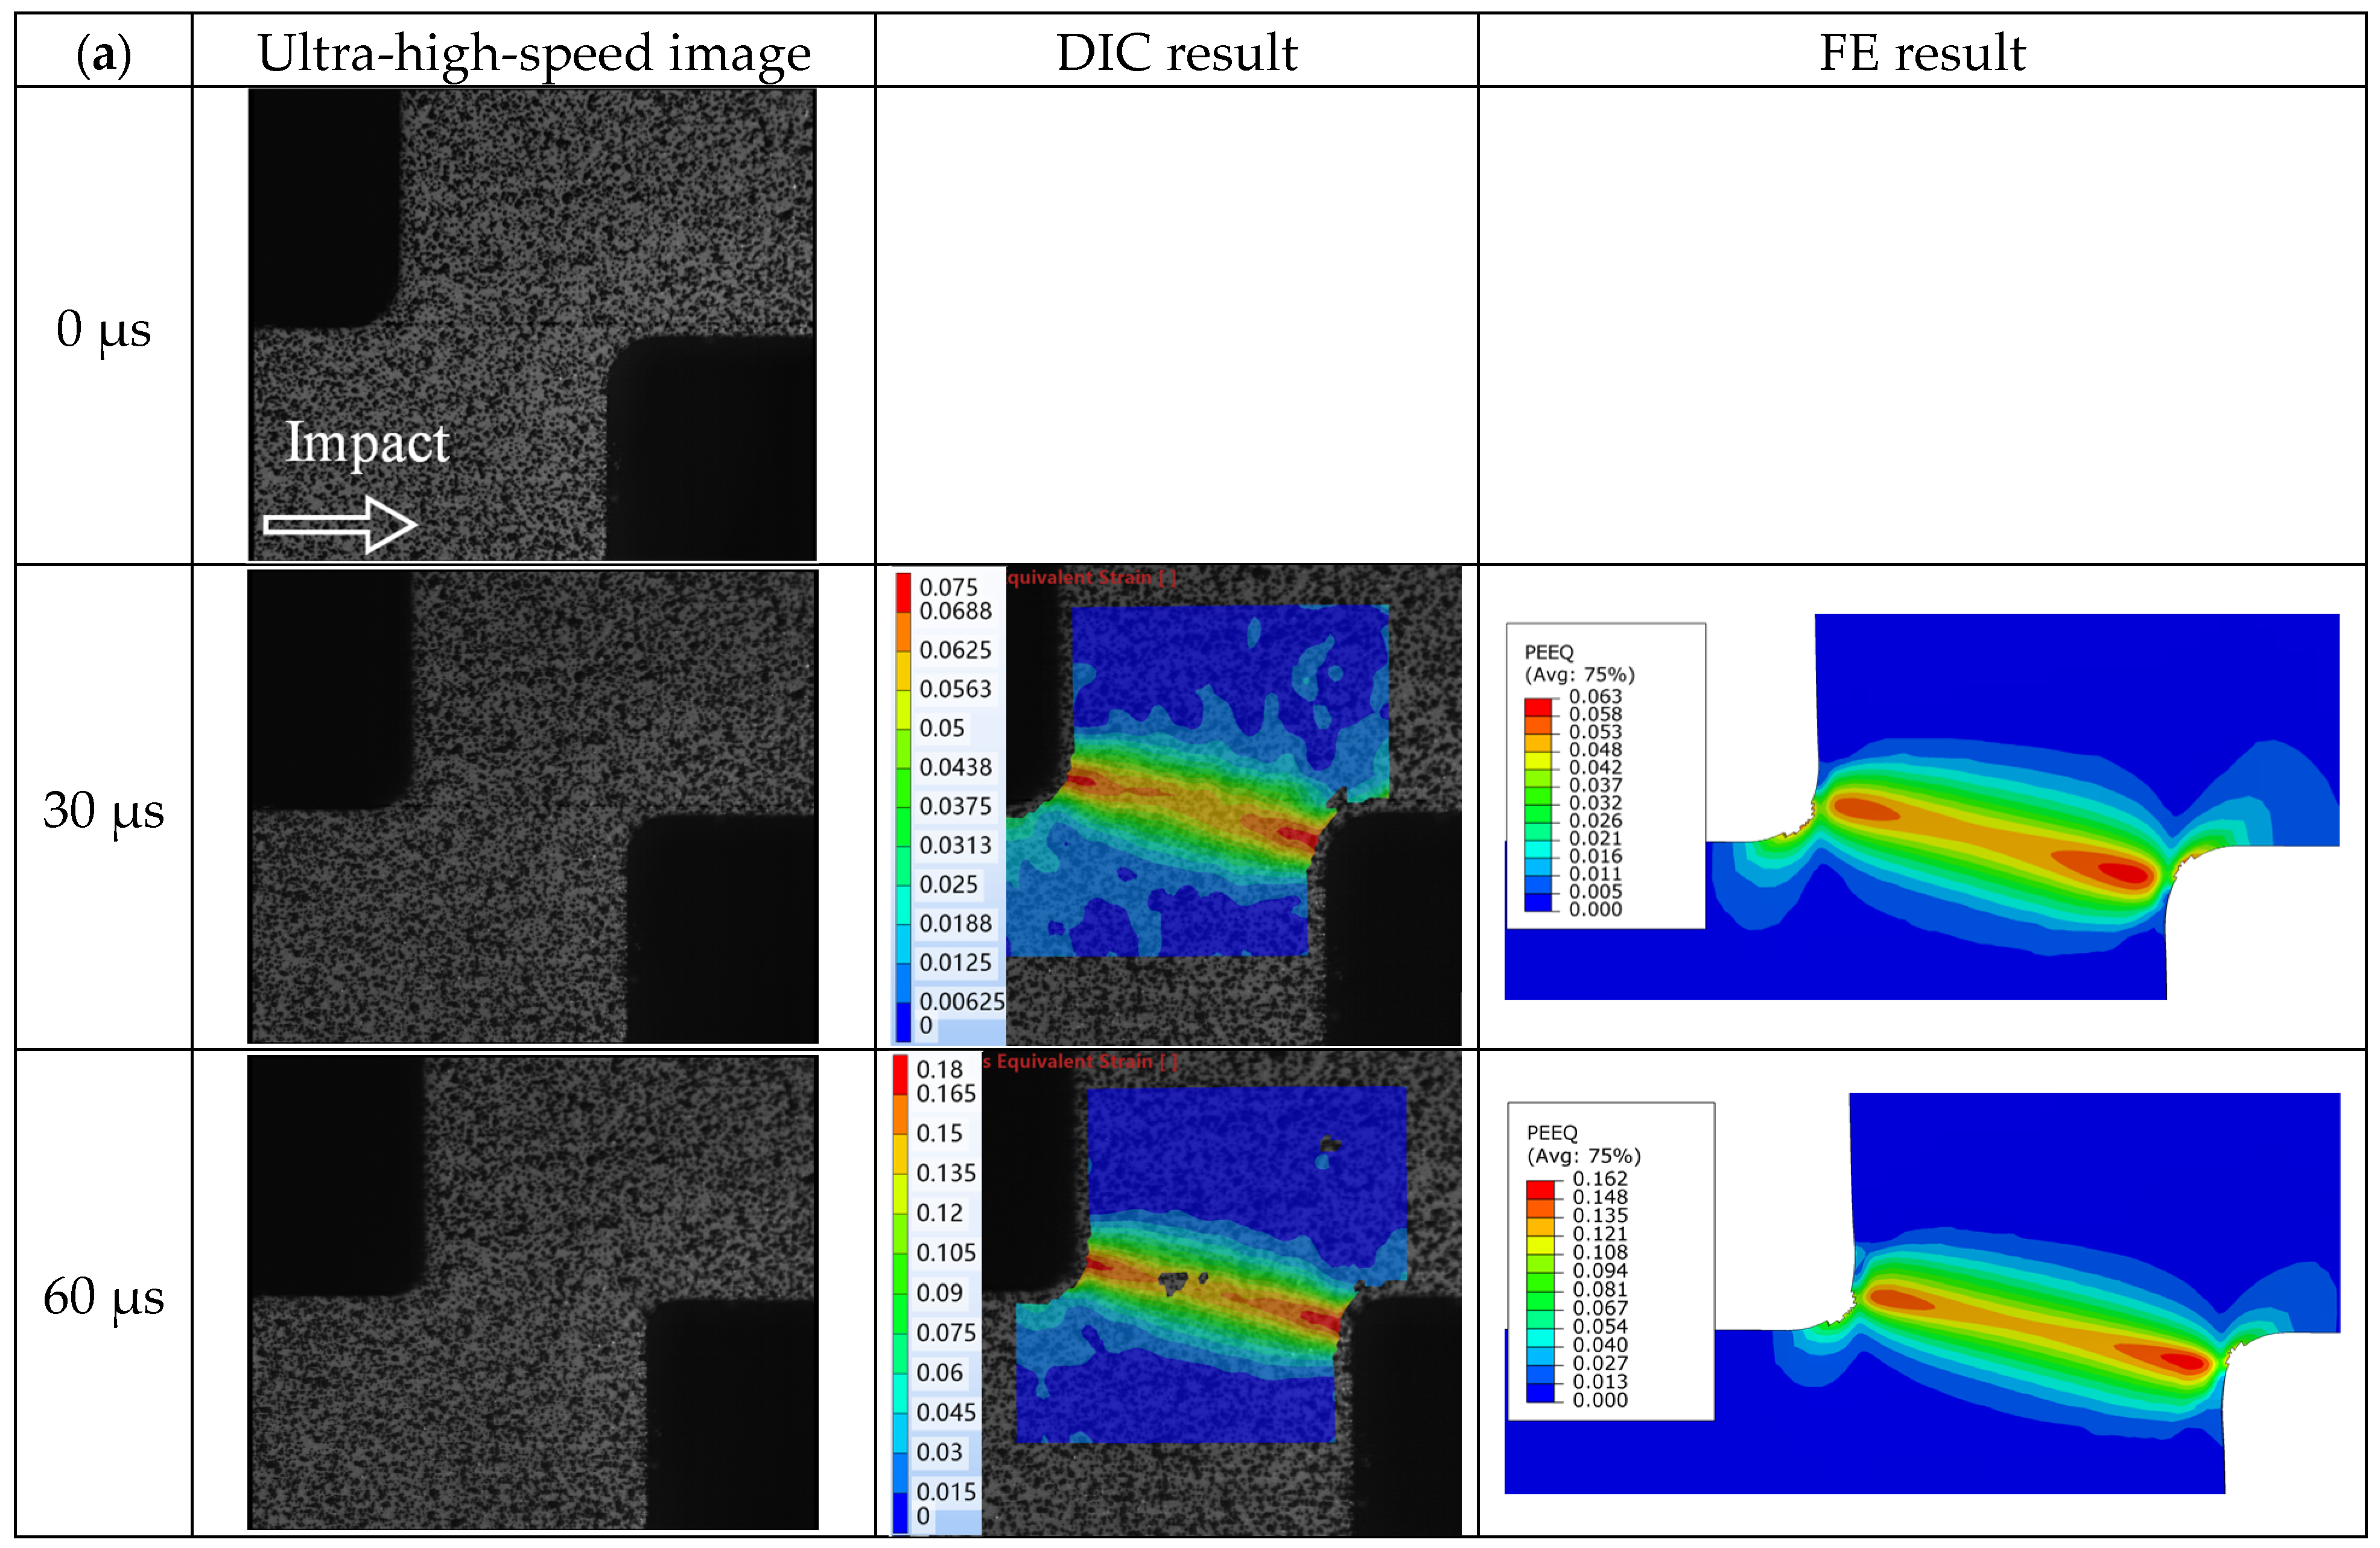
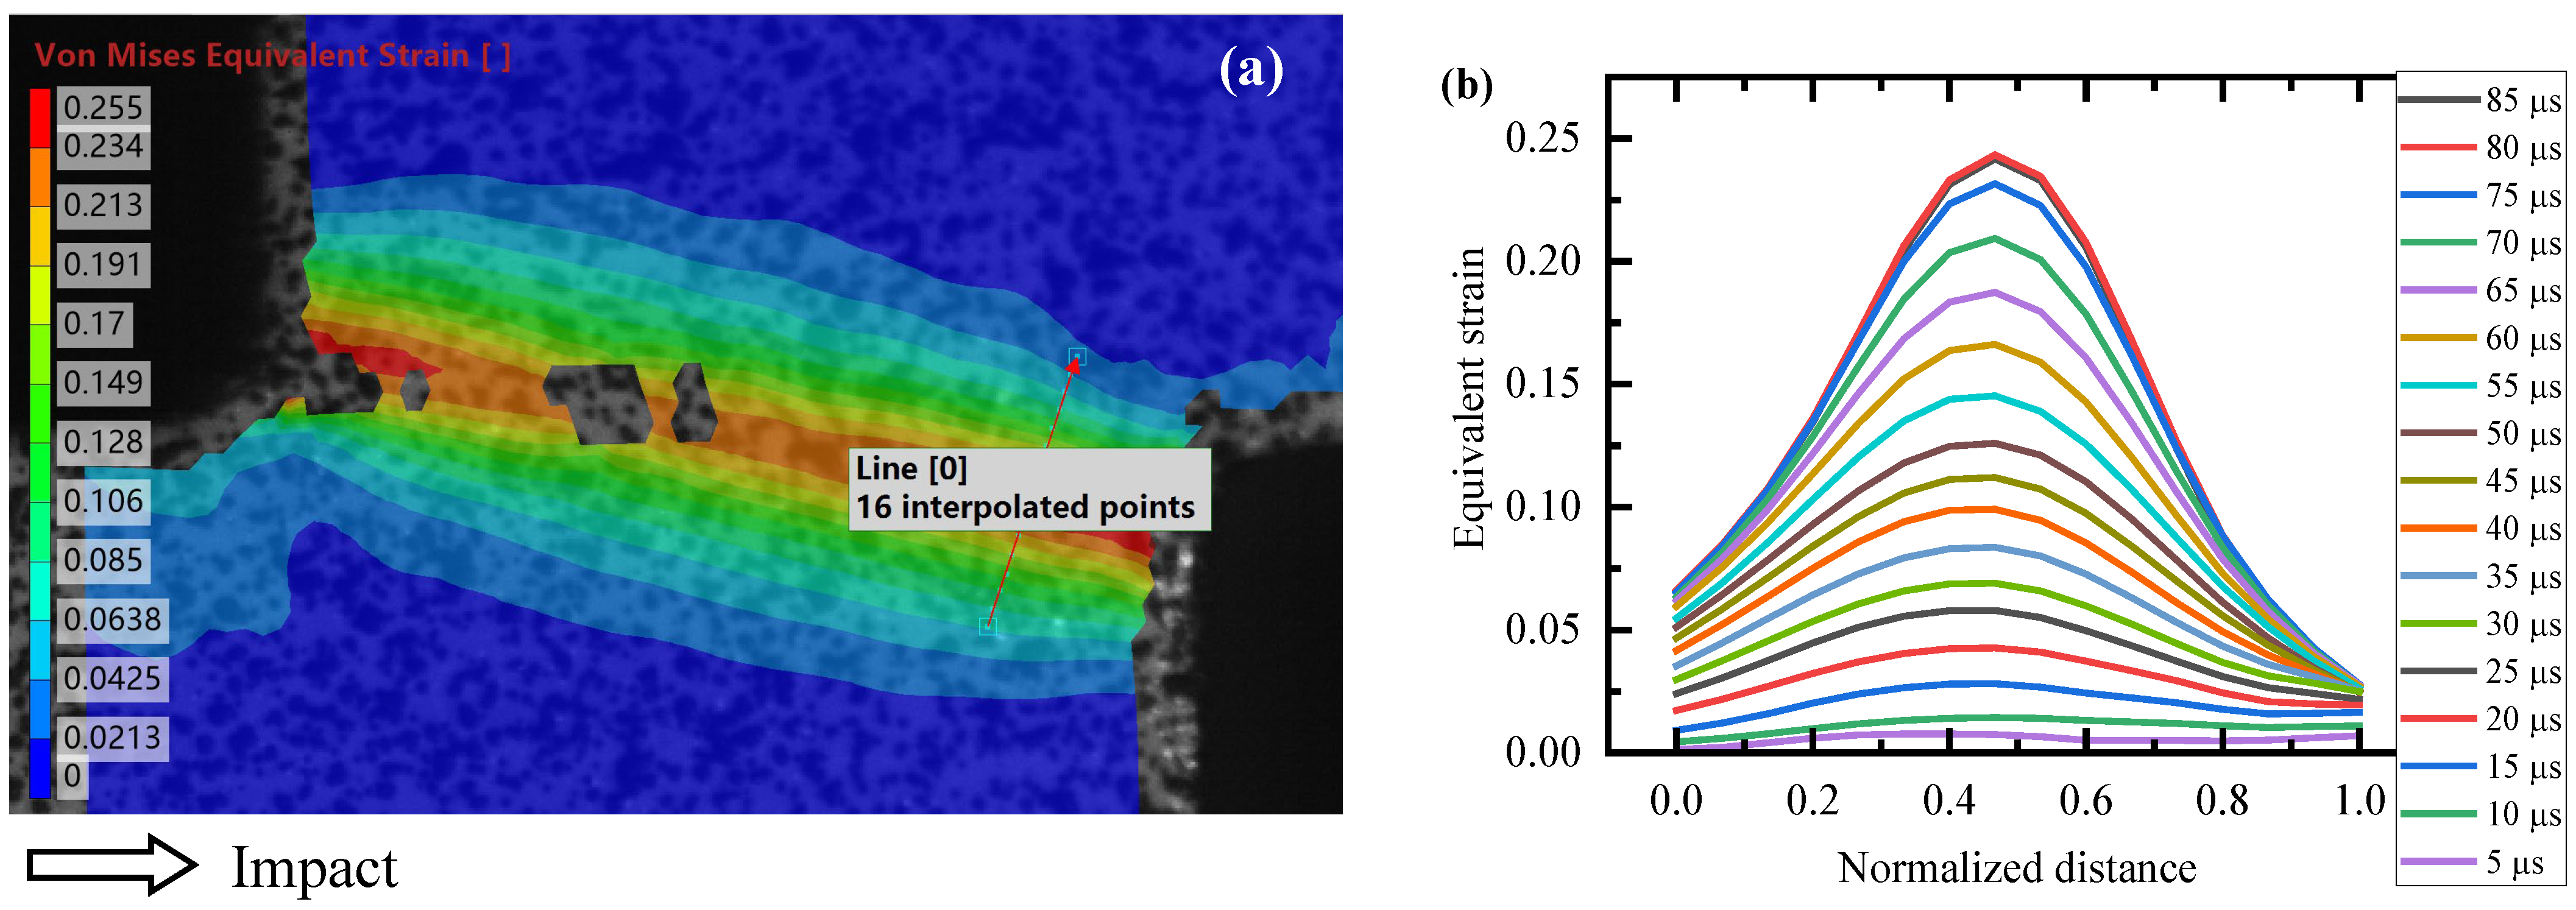
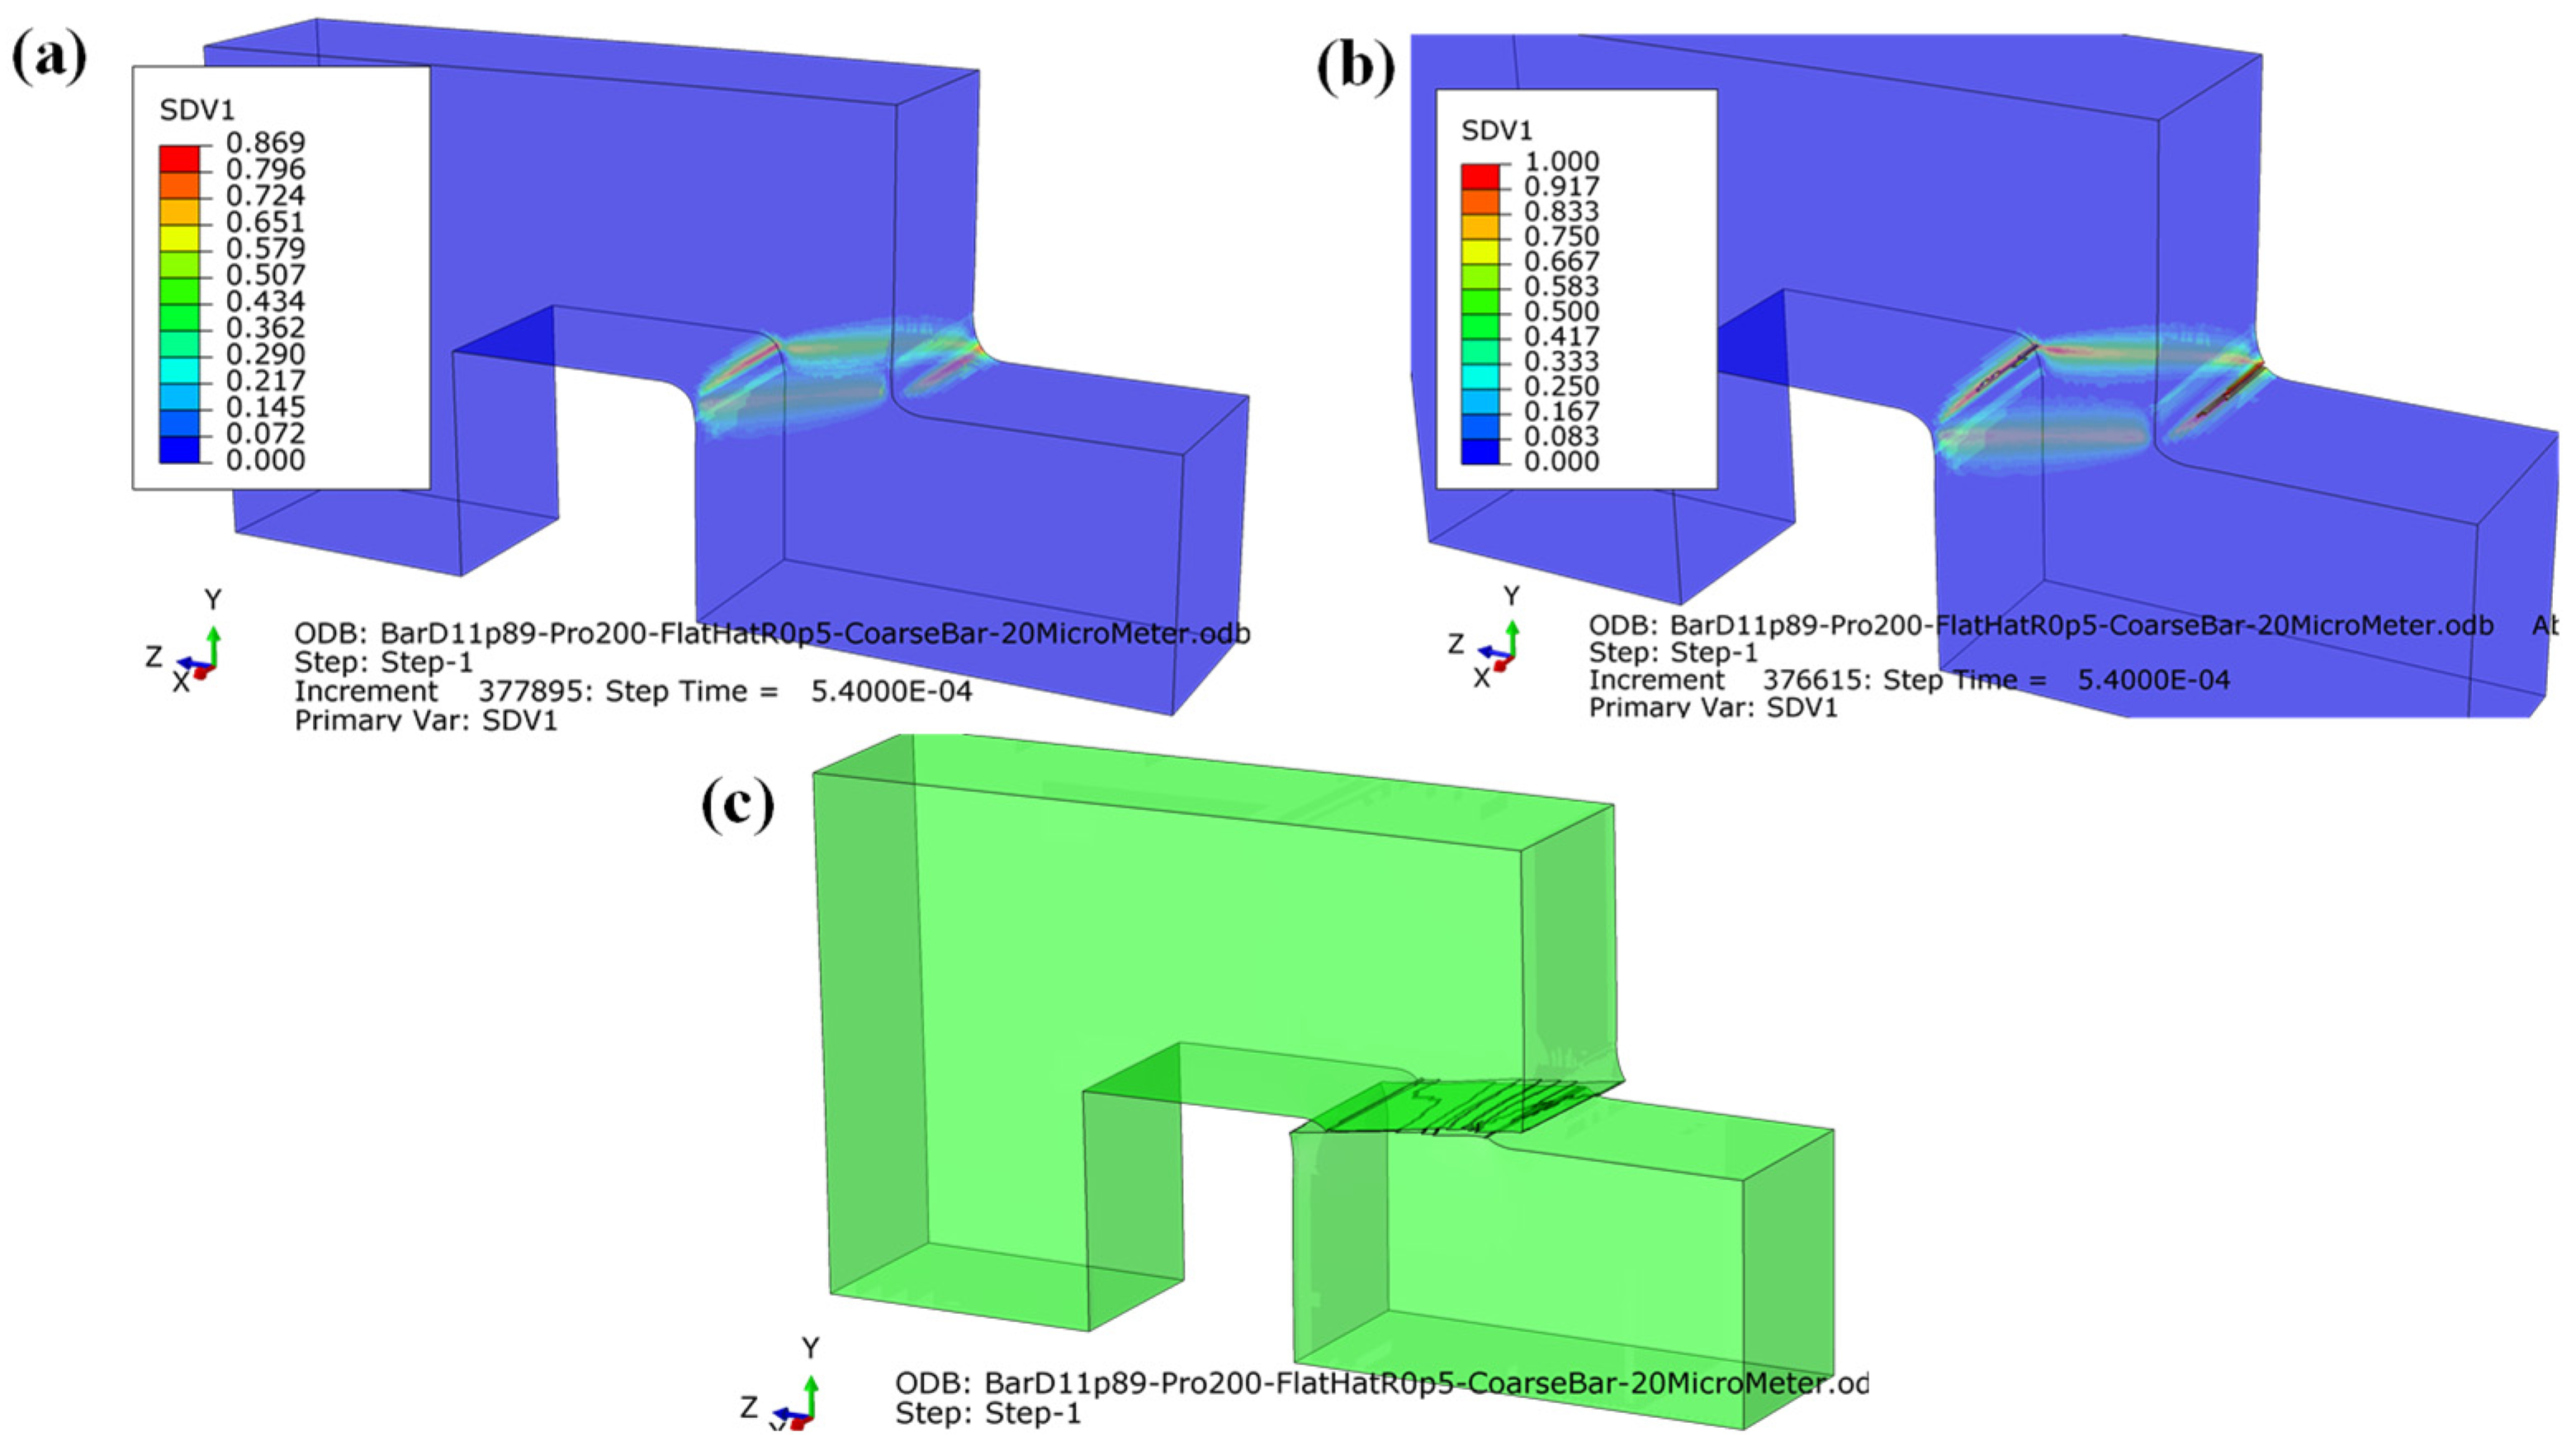
3.2.4. Strain Distribution
4. Discussion
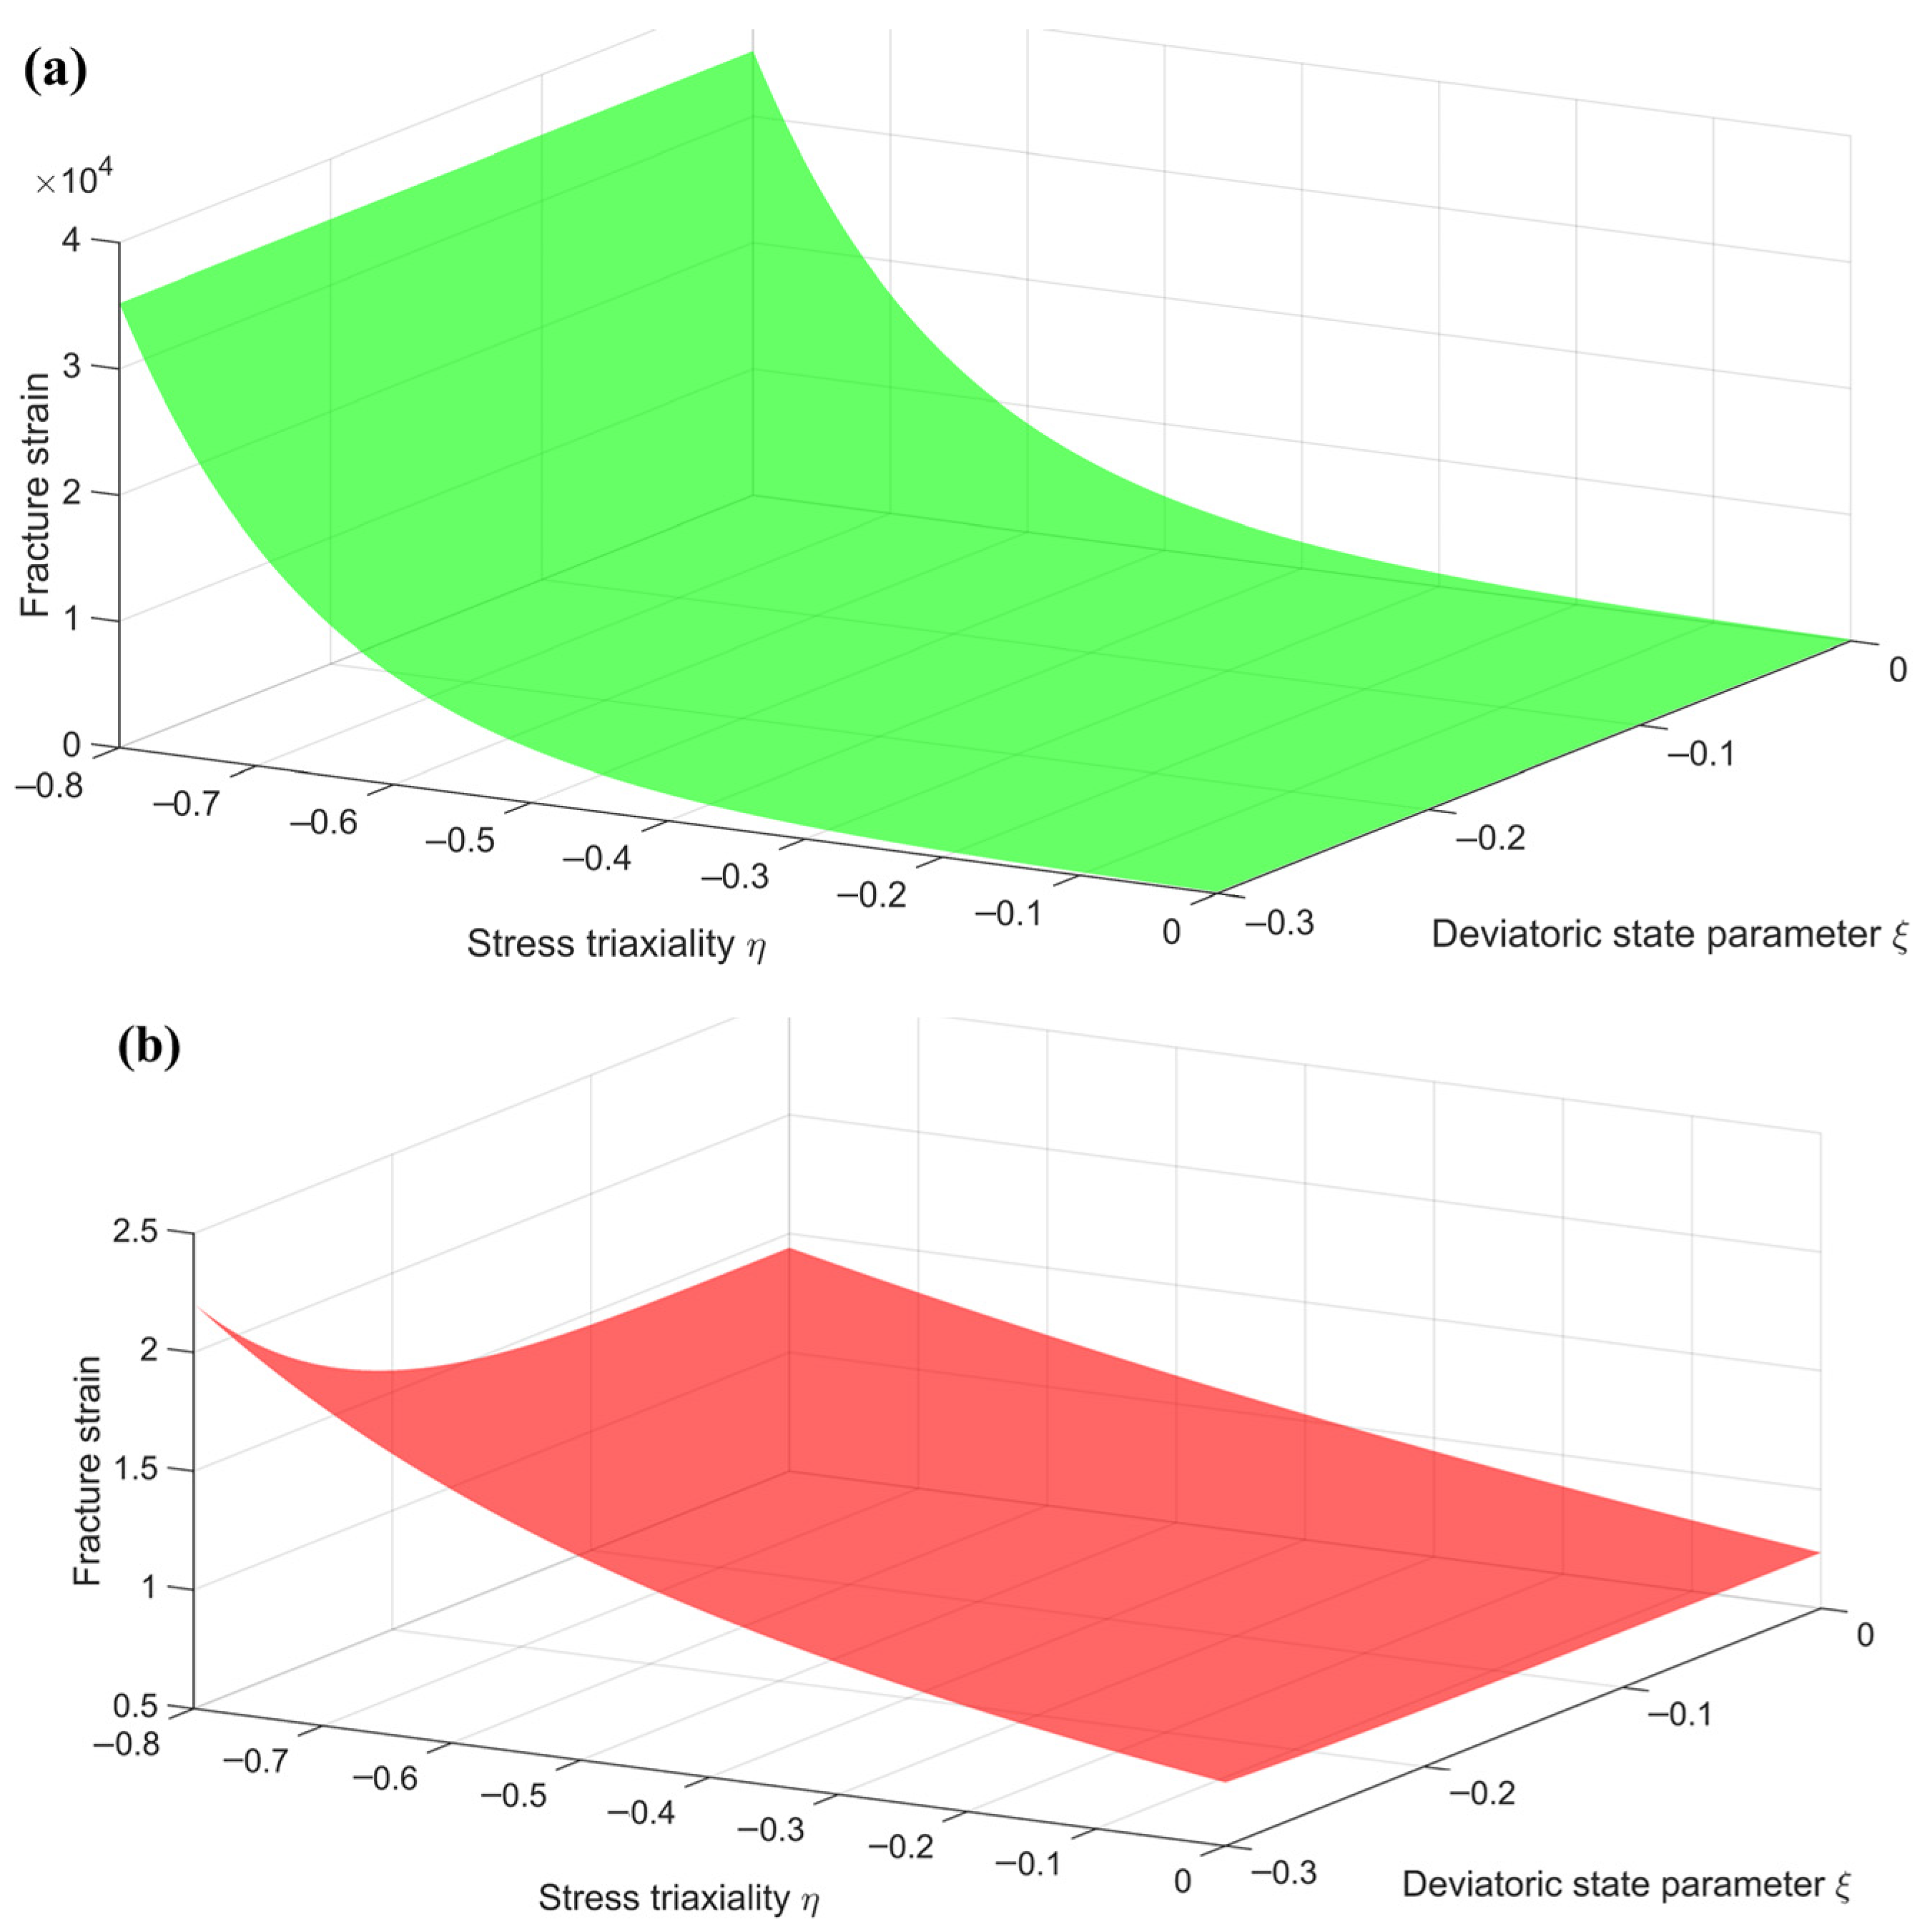
4.1. Stress State
4.2. Fracture Mechanism
5. Conclusions
- The critical fracture velocity leading to partial fracture of the flat-hat-shaped specimens is 10.5 m/s, and deformed shear bands with a width of approximately 0.14 mm form at this critical velocity.
- The strain along the shear path exhibits a non-uniform distribution with localized concentrations near the corners of the specimen, especially the inner corner.
- The EXW fracture criterion predicts an identical critical fracture velocity and estimates the fracture initiation instants within an error of 5.3%.
- The MJC fracture criterion overestimates the critical fracture velocity by 14.3%.
- The EXW fracture criterion attributes the shear fracture behavior to a combination of ductile fracture and material instability, whereas the MJC criterion attributes it exclusively to material instability.
- The improved accuracy achieved by employing the Lode-dependent EXW fracture criterion may be attributed to the compress–shear stress state and the accurate prediction of the failure mechanism of the dynamic shear fracture.
Supplementary Materials
Author Contributions
Funding
Data Availability Statement
Conflicts of Interest
Abbreviations
| MJC | modified Johnson–Cook |
| EXW | extended Xue–Wierzbicki |
| SHPB | Split Hopkinson Pressure Bar |
| DIC | digital image correlation |
| FE | finite element |
| FHS | flat-hat-shaped |
| TQ | Taylor–Quinney |
References
- Dey, S.A.; Børvik, T.; Hopperstad, O.S.; Leinum, J.R.; Langseth, M. The effect of target strength on the perforation of steel plates using three different projectile nose shapes. Int. J. Impact Eng. 2004, 30, 1005–1038. [Google Scholar] [CrossRef]
- Børvik, T.; Hopperstad, O.S.; Langseth, M.; Malo, K.A. Effect of target thickness in blunt projectile penetration of Weldox 460 E steel plates. Int. J. Impact Eng. 2003, 28, 413–464. [Google Scholar] [CrossRef]
- Børvik, T.; Langseth, M.; Hopperstad, O.S.; Malo, K.A. Perforation of 12 mm thick steel plates by 20 mm diameter projectiles with flat, hemispherical and conical noses: Part I: Experimental study. Int. J. Impact Eng. 2002, 27, 19–35. [Google Scholar] [CrossRef]
- Dean, J.; Dunleavy, C.S.; Brown, P.M.; Clyne, T.W. Energy absorption during projectile perforation of thin steel plates and the kinetic energy of ejected fragments. Int. J. Impact Eng. 2009, 36, 1250–1258. [Google Scholar] [CrossRef]
- Wang, Y.; Chen, X.; Xiao, X.; Vershinin, V.V.; Ge, R.; Li, D.S. Effect of Lode angle incorporation into a fracture criterion in predicting the ballistic resistance of 2024-T351 aluminum alloy plates struck by cylindrical projectiles with different nose shapes. Int. J. Im-Pact Eng. 2020, 139, 103498. [Google Scholar] [CrossRef]
- Børvik, T.; Hopperstad, O.S.; Berstad, T.; Langseth, M. Numerical simulation of plugging failure in ballistic penetration. Int. J. Solids Struct. 2001, 38, 6241–6264. [Google Scholar] [CrossRef]
- Hancock, J.W.; Mackenzie, A.C. On the mechanisms of ductile failure in high-strength steels subjected to multi-axial stress-states. J. Mech. Phys. Solids 1976, 24, 147–160. [Google Scholar] [CrossRef]
- Bao, Y.; Wierzbicki, T. On fracture locus in the equivalent strain and stress triaxiality space. Int. J. Mech. Sci. 2004, 46, 81–98. [Google Scholar] [CrossRef]
- Wierzbicki, T.; Bao, Y.; Lee, Y.W.; Bai, Y. Calibration and evaluation of seven fracture models. Int. J. Mech. Sci. 2005, 47, 719–743. [Google Scholar] [CrossRef]
- Gao, X.; Kim, J. Modeling of ductile fracture: Significance of void coalescence. Int. J. Solids Struct. 2006, 43, 6277–6293. [Google Scholar] [CrossRef]
- Yang, X.; Guo, Y.; Li, Y. A new ductile failure criterion with stress triaxiality and Lode dependence. Eng. Fract. Mech. 2023, 289, 109394. [Google Scholar] [CrossRef]
- Peng, J.; Zhou, P.; Wang, Y.; Dai, Q.; Knowles, D.; Mostafavi, M. Stress triaxiality and lode angle parameter characterization of flat metal specimen with inclined notch. Metals 2021, 11, 1627. [Google Scholar] [CrossRef]
- Bai, Y.; Wierzbicki, T. A new model of metal plasticity and fracture with pressure and Lode dependence. Int. J. Plast. 2008, 24, 1071–1096. [Google Scholar] [CrossRef]
- Ghazali, S.; Algarni, M.; Bai, Y.; Choi, Y. A study on the plasticity and fracture of the AISI 4340 steel alloy under different loading conditions and considering heat-treatment effects. Int. J. Fract. 2020, 225, 69–87. [Google Scholar] [CrossRef]
- Peng, Z.; Zhao, H.; Li, X.; Yuan, L.; Zhu, T. Ductile fracture of X80 pipeline steel over a wide range of stress triaxialities and Lode angles. Eng. Fract. Mech. 2023, 289, 109470. [Google Scholar] [CrossRef]
- Lou, Y.; Huh, H. Extension of a shear-controlled ductile fracture model considering the stress triaxiality and the Lode param-eter. Int. J. Solids Struct. 2013, 50, 447–455. [Google Scholar] [CrossRef]
- Xiao, X.; Pan, H.; Bai, Y.; Lou, Y.; Chen, L. Application of the modified Mohr–Coulomb fracture criterion in predicting the ballistic resistance of 2024-T351 aluminum alloy plates impacted by blunt projectiles. Int. J. Impact Eng. 2019, 123, 26–37. [Google Scholar] [CrossRef]
- Xiao, X.; Wang, Y.; Vershinin, V.V.; Chen, L.; Lou, Y. Effect of Lode angle in predicting the ballistic resistance of Weldox 700 E steel plates struck by blunt projectiles. Int. J. Impact Eng. 2019, 128, 46–71. [Google Scholar] [CrossRef]
- Zhao, Q.; Xiao, X.; Ge, R.; Zhang, Y.; Chen, X.; Jia, B. Experimental-numerical study on ballistic impact behavior of 316L austenitic stainless steel plates against blunt and ogival projectiles. Int. J. Hydrogen Energy 2023, 48, 8526–8548. [Google Scholar] [CrossRef]
- Shi, Y.; Hu, A.; Du, T.; Xiao, X.; Jia, B. Experimental and Numerical Study on the Protective Behavior of Weldox 900 E Steel Plates Impacted by Blunt-Nosed Projectiles. Metals 2022, 12, 141. [Google Scholar]
- Meyer, L.W.; Manwaring, S. Critical adiabatic shear strength of low alloyed steel under compressive loading. In Metallurgical Applications of Shock-Wave and High-Strain-Rate Phenomena (EXPLOMET85); CRC Press: Boca Raton, FL, USA, 1985; pp. 657–674. [Google Scholar]
- Ran, C.; Liu, Q.; Chen, P.; Chen, Q. Dynamic forced shear characteristics of Ti-6Al-4V alloy using flat hat-shaped specimen. Eng. Fract. Mech. 2020, 238, 107286. [Google Scholar] [CrossRef]
- Nie, Y.; Claus, B.; Gao, J.; Zhai, X.; Kedir, N.; Chu, J.; Sun, T.; Fezzaa, K.; Chen, W.W. In situ observation of adiabatic shear band formation in aluminum alloys. Exp. Mech. 2020, 60, 153–163. [Google Scholar] [CrossRef]
- Zhao, G.; Yu, X.; Zeng, Q.; Zhu, S.; Qi, W.; Chen, H. Evolution of local deformation field inside adiabatic shear band of 1018 steel studied using digital image correlation with micro-speckles. Extrem. Mech. Lett. 2022, 54, 101769. [Google Scholar] [CrossRef]
- Ran, C.; Chen, P. Dynamic shear deformation and failure of Ti-6Al-4V and Ti-5Al-5Mo-5V-1Cr-1Fe alloys. Materials 2018, 11, 76. [Google Scholar] [CrossRef] [PubMed]
- Rahmaan, T.; Abedini, A.; Butcher, C.; Pathak, N.; Worswick, M.J. Investigation into the shear stress, localization and fracture behaviour of DP600 and AA5182-O sheet metal alloys under elevated strain rates. Int. J. Impact Eng. 2017, 108, 303–321. [Google Scholar] [CrossRef]
- Gao, W.; Zhu, Z.; Wang, M.; Zhou, L.; Ren, L.; Wang, Y. Investigation of the influence of non-uniform strain zone on the crack propagation of PMMA material based on 2D-DIC. Int. J. Impact Eng. 2025, 196, 105159. [Google Scholar] [CrossRef]
- Ostash, O.P.; Muravs’ Kyi, L.I.; Voronyak, T.I.; Kmet’, A.B.; Andreiko, I.M.; Vira, V.V. Determination of the size of the fatigue prefracture zone by the method of phase-shifting interferometry. Mater. Sci. 2011, 46, 781–788. [Google Scholar] [CrossRef]
- Miyauchi, K. A proposal for a planar simple shear test in sheet metals. Sci. Pap. Inst. Phys. Chem. Res. 1984, 78, 27–40. [Google Scholar]
- Gary, G.; Nowacki, W.K. Essai de cisaillement plan appliqué à des tôles minces. J. Phys. IV 1994, 4, C8–C65. [Google Scholar] [CrossRef]
- Klepaczko, J.R. An experimental technique for shear testing at high and very high strain rates. The case of a mild steel. Int. J. Impact Eng. 1994, 15, 25–39. [Google Scholar] [CrossRef]
- Xu, Z.; Ding, X.; Zhang, W.; Huang, F. A novel method in dynamic shear testing of bulk materials using the traditional SHPB tech-nique. Int. J. Impact Eng. 2017, 101, 90–104. [Google Scholar] [CrossRef]
- Jia, B.; Rusinek, A.; Pesci, R.; Bernier, R.; Bahi, S.; Wood, P. A novel technique for dynamic shear testing of bulk metals with application to 304 austenitic stainless steel. Int. J. Solids Struct. 2020, 204, 153–171. [Google Scholar] [CrossRef]
- Lee, S.; Huh, H. Shear stress hardening curves of AISI 4130 steel at ultra-high strain rates with Taylor impact tests. Int. J. Impact Eng. 2021, 149, 103789. [Google Scholar] [CrossRef]
- Chen, W.; Song, B. Split Hopkinson (Kolsky) Bar: Design, Testing and Applications; Springer: New York, NY, USA, 2011. [Google Scholar]
- Wu, S. Experimental and Numerical Study on the Failure Mechanism of High Strength Metallic Targets; Nanjing University of Aeronautics and Astronautics: Nanjing, China, 2023. (In Chinese) [Google Scholar]
- Budiwantoro, B.; Kariem, M.A.; Febrinawarta, B. The influence of shear angles on the split Hopkinson shear bar testing. Int. J. Impact Eng. 2021, 149, 103787. [Google Scholar] [CrossRef]


| C | Si | Mn | P | S | Cr | Ni | Mo | Cu | W | V | Ti |
|---|---|---|---|---|---|---|---|---|---|---|---|
| 0.28 | 1.02 | 1.12 | 0.014 | 0.001 | 1.01 | 1.50 | 0.08 | 0.03 | 0.01 | 0.01 | 0.0065 |
| Processing Parameters | Specification |
|---|---|
| Matching criteria | ZNSSD |
| Shape function | Affine |
| Interpolation function | Local bicubic splines |
| Progress history | Spatial + update reference |
| Subset size SS [px] | 27 |
| Step size (ST) [px] | 7 |
| Strain window (SW) | 9 |
| Strain tensor—polynomial | Hencky-Q4 |
| Virtual strain gauge (VSG) [px] | 41 |
| Description | Notation | Value |
|---|---|---|
| Modulus of elasticity | E (GPa) | 200.4 |
| Poisson’s ratio | V | 0.3 |
| Density | r (g/m3) | 7790 |
| Yield stress constant | A (MPa) | 1095.6 |
| Strain hardening constants | B (MPa) | 1020.8 |
| n | 0.601 | |
| Q (MPa) | 204.4 | |
| β | 33.455 | |
| α | 0.23 | |
| Strain rate constant | C | 0.014 |
| Reference strain rate | (/s) | 4.17 × 10⁻⁴ |
| Thermal softening constants | p | 2.880 |
| m | 1.677 | |
| Reference temperature | T0 (K) | 293 |
| Melting temperature | Tm (K) | 1764.4 |
| Taylor–Quinney coefficient | χ | 0.9 |
| Specific heat | Cp(J/kg/K) | 530 |
| MJC fracture criterion | D1 | 0.215 |
| D2 | 125.205 | |
| D3 | −7.049 | |
| D4 | −0.037 | |
| D5 | 149.17 | |
| D6 | 5.48 | |
| EXW fracture criterion | C1 | 16.7 |
| C2 | 3.898 | |
| C3 | 0.7342 | |
| C4 | 0.8425 | |
| C5 | 4 | |
| D4 | −0.037 | |
| D5 | 149.17 | |
| D6 | 5.48 |
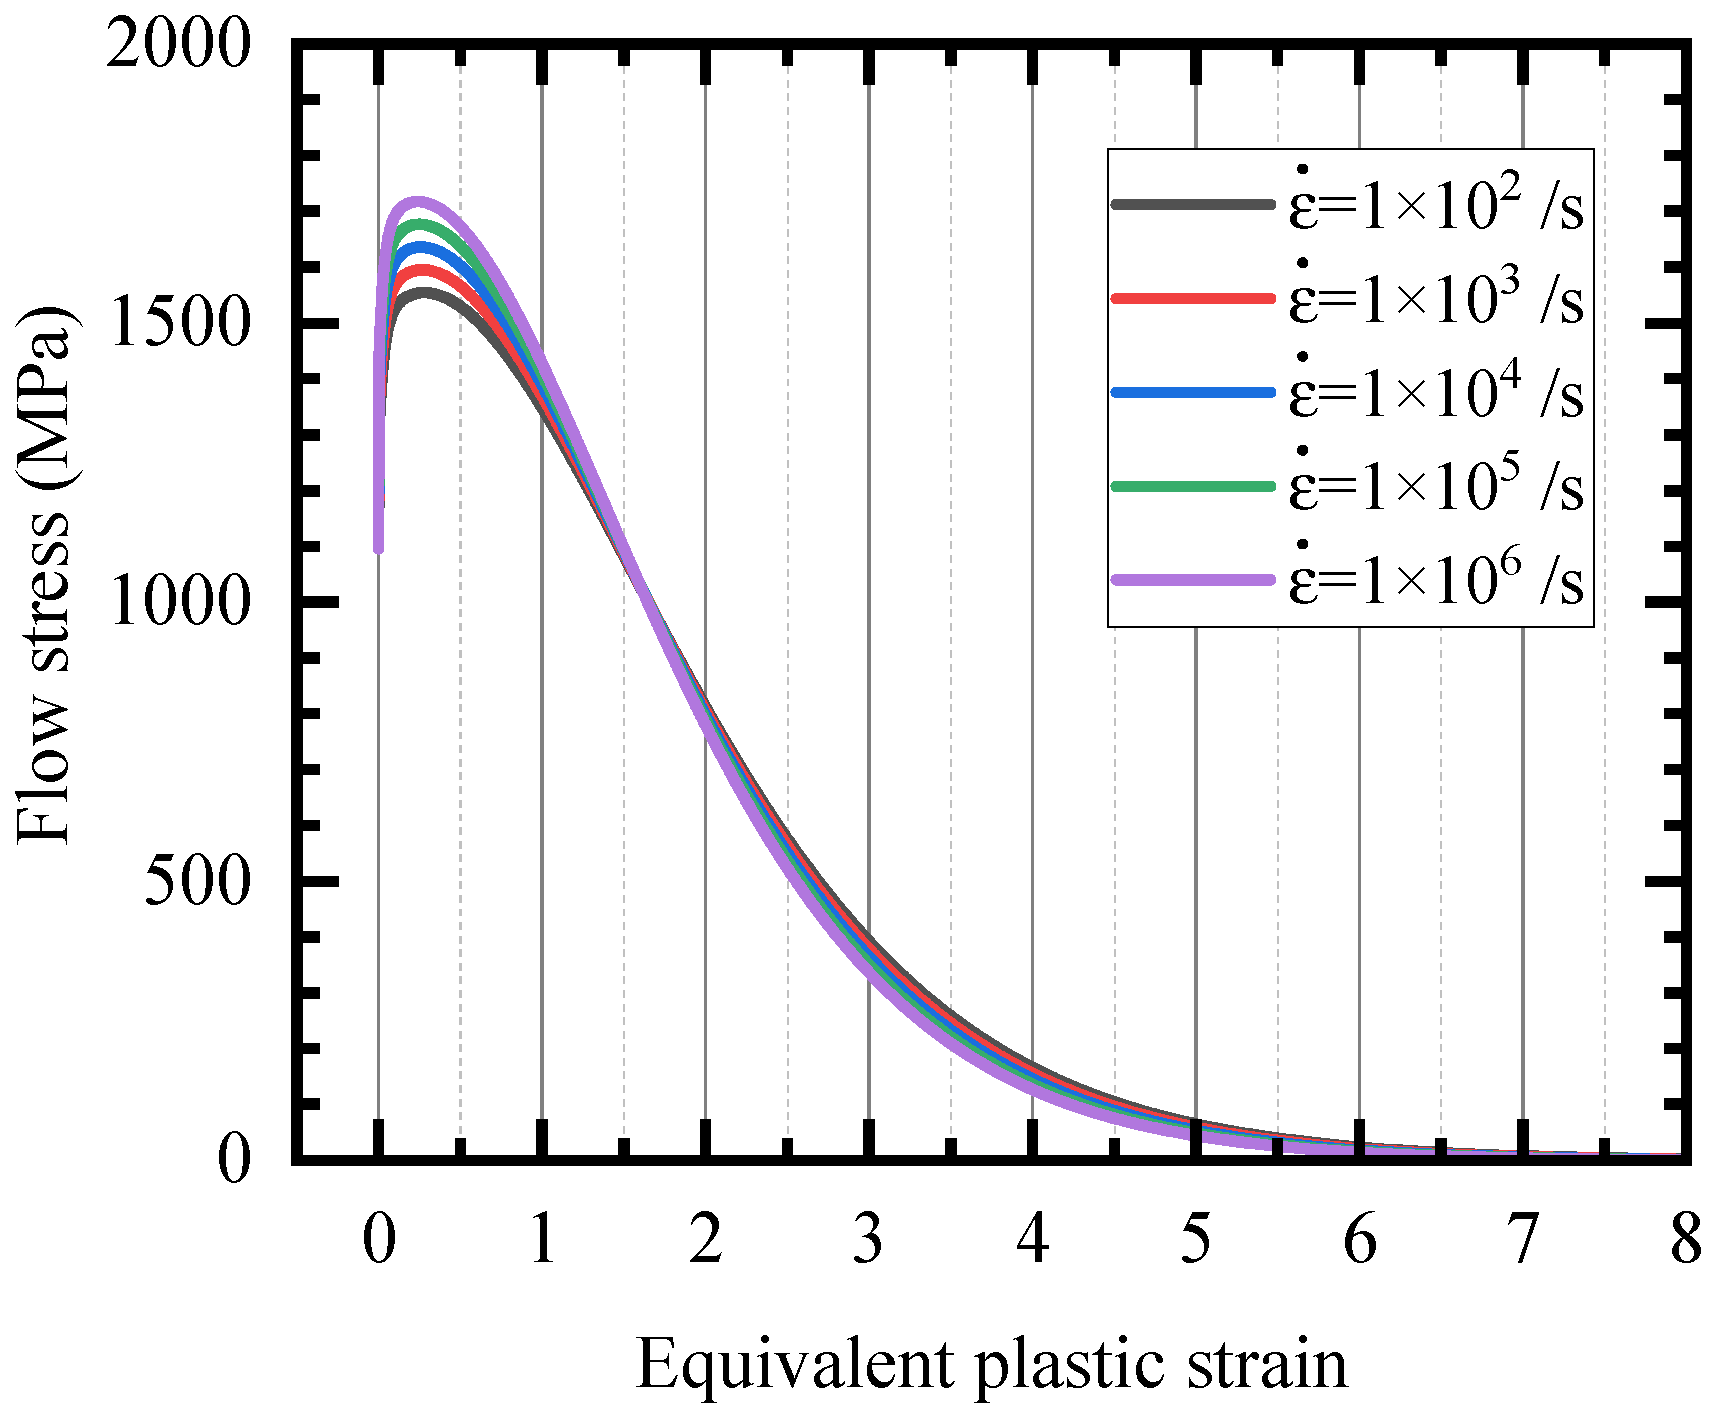
| Strain Rate (/s) | Material Instability Strain |
|---|---|
| 102 | 0.239 |
| 103 | 0.236 |
| 104 | 0.235 |
| 105 | 0.239 |
| 106 | 0.210 |
Disclaimer/Publisher’s Note: The statements, opinions and data contained in all publications are solely those of the individual author(s) and contributor(s) and not of MDPI and/or the editor(s). MDPI and/or the editor(s) disclaim responsibility for any injury to people or property resulting from any ideas, methods, instructions or products referred to in the content. |
© 2025 by the authors. Licensee MDPI, Basel, Switzerland. This article is an open access article distributed under the terms and conditions of the Creative Commons Attribution (CC BY) license (https://creativecommons.org/licenses/by/4.0/).
Share and Cite
Xiao, X.; Wang, Y.; Wu, S.; Zhou, C. Experimental and Numerical Investigation on Dynamic Shear Behavior of 30CrMnSiNi2A Steel Using Flat-Hat Specimens. Metals 2025, 15, 563. https://doi.org/10.3390/met15050563
Xiao X, Wang Y, Wu S, Zhou C. Experimental and Numerical Investigation on Dynamic Shear Behavior of 30CrMnSiNi2A Steel Using Flat-Hat Specimens. Metals. 2025; 15(5):563. https://doi.org/10.3390/met15050563
Chicago/Turabian StyleXiao, Xinke, Yuge Wang, Shuaitao Wu, and Chuwei Zhou. 2025. "Experimental and Numerical Investigation on Dynamic Shear Behavior of 30CrMnSiNi2A Steel Using Flat-Hat Specimens" Metals 15, no. 5: 563. https://doi.org/10.3390/met15050563
APA StyleXiao, X., Wang, Y., Wu, S., & Zhou, C. (2025). Experimental and Numerical Investigation on Dynamic Shear Behavior of 30CrMnSiNi2A Steel Using Flat-Hat Specimens. Metals, 15(5), 563. https://doi.org/10.3390/met15050563