Article

Effect of Laser Welding Parameters on Similar and Dissimilar Joints for Tab–Busbar Interconnects

LORTEK Technological Center, Basque Research and Technology Alliance BRTA, Arranomendia Kalea 4A, 20240 Ordizia, Spain
*
Author to whom correspondence should be addressed.
Metals 2025, 15(5), 547; https://doi.org/10.3390/met15050547
Submission received: 14 April 2025 / Revised: 12 May 2025 / Accepted: 13 May 2025 / Published: 15 May 2025
(This article belongs to the Special Issue Welding and Joining Technology of Dissimilar Metal Materials)

Abstract

The demand for electric mobility has driven the development of advanced laser welding technologies such as dual beam welding and beam shaping. Nevertheless, some intrinsic characteristics present challenges to exploring all its benefits. In this sense, this study investigates the effect of the laser welding parameters employed on the weld quality in busbar–battery interconnects. Dual beam and beam shaping strategies were applied in Al-Al (AA1050 H24) and Al-Cu (AA1050 H24 and C11000) overlap joint configurations adopting statistical methods. For Al-Al joints, welding speed was the most significant parameter influencing interface width, whereas in Al-Cu joints, core power was the only significant parameter affecting both interface width and penetration in the studied configuration. Common defects, such as porosity and cracks, were observed in both material combinations. In Al-Al joints, higher welding speeds resulted in up to a 16% (65.6 HV) increase in hardness, while, in Al-Cu joints, the peak value reached around 900 HV in the interface zone due to the formation of intermetallic compounds (IMCs). In addition, IMCs with complex structures and significant compositional variations, including Cu9Al4 and CuAl2 were identified.

1. Introduction

The global demand for sustainable energy solutions and reduced carbon emissions has substantially increased the attractiveness of electric vehicles (EVs). This represents a shift in the automotive industry’s perspective towards electric mobility, emphasizing the importance of continually improving the manufacturing processes. In particular, this rise requires the development of reliable and efficient techniques for battery manufacturing. Therefore, advanced welding processes need to meet these demands to produce sound joints to enhance the performance and safety of EVs.
In a battery pack, several individual cells are connected in series and parallel to produce the necessary electrical energy. The main electrical connections are made using a busbar, a metallic strip or bar that ensures efficient transfer of electricity, maintains a consistent voltage level across the pack, and helps in managing heat dissipation. This component is widely used in the automotive industry and made of copper and aluminum due to due to their excellent electrical and thermal conductivity properties [1,2].
Particularly, proper design and installation, in various shapes and sizes to fit specific requirements, are critical for the performance and safety of the battery pack. There are several techniques for battery pack manufacturing, and the most common processes are laser beam welding (LBW), resistance spot welding, and ultrasonic welding. The LBW process offers numerous advantages, including high power density, a small heat-affected zone, high welding speed, and flexibility. Many studies have demonstrated the superiority of LBW in terms of joint quality, as it enhances both the electrical and mechanical properties of the connections [3,4].
Despite the suitability of the aluminum series 1XXX for busbar and battery tab applications due to its high thermal and electrical conductivity, ductility, corrosion resistance, and low density, certain joint defects may arise. Porosity and hot cracking are prominent defects observed, with porosity appearing in two distinct forms: metallurgical and wormhole. Metallurgical porosity typically appears when hydrogen is present in the welding pool. On the other hand, Kah et al. [5] attributed wormhole porosity to keyhole instability and the rapid solidification rates during welding. According to Huang et al. [6], this type of porosity results from the collapse of the keyhole. These pores are irregular in shape, larger than metallurgical pores, and typically concentrated at the center of the weld. Furthermore, hot cracking is also a common defect due to several factors, including high thermal stress, rapid solidification rates, and chemical composition. Notably, the weld zone morphology influences the formation and the microstructure, where coarse grain structures are more likely to form than finer grain structures [7,8].
Besides these defects, another challenge that most welding processes face is the joining of dissimilar materials. In the case of LBW, other defects such as intermetallic phases and cracks may arise when two different materials are involved [9]. These defects occur when the materials exhibit poor affinity for each other due to differences in their physical, chemical, and thermal properties. As a result, the weld may not be capable of supporting the dynamic loads that the battery can be subjected to. Therefore, the dissimilar joint must meet certain mechanical requirements to ensure proper quality.
In this context, LBW offers an alternative and innovative strategy by utilizing beam shaping with either wobbling or dual beam technology, both of which have a beneficial effect on weld quality. Dual beam laser welding uses two separate laser beams to improve surface quality by better controlling surface solidification, enhancing keyhole stability, and reducing spatter. Additionally, an adjustable configuration of center and outer beams—each with independent power and modulation control—significantly enhances joint quality and improves the precision of the welding process.
This advanced approach to beam shaping is especially well-suited for applications commonly found in battery manufacturing for electric vehicles. This leads to smoother welds with fewer defects and cleaner surfaces compared to single-beam welding [10].
In addition, the preheating provided by the leading edge of the ring increases the energy absorption of the material. The subsequent heating enlarges the molten pool to allow gas bubbles to escape, while the core beam ensures sufficient penetration of the weld [11]. Jabar et al. [12] employed the dual beam configuration in hilumin to aluminum busbar connections and observed positive outcomes achieved with the correct core power/power ring ratio, enhancing both the mechanical and electrical properties.
The wobbling technique is a beam shaping strategy that involves oscillating the laser beam in a controlled motion, typically circular or elliptical, during the welding process. This motion is achieved using rotating mirrors in the welding head, and the focal point is no longer static and can be dynamically adjusted by modifying the shape, amplitude, and frequency of the beam movement. Therefore, improvements in weld quality are achieved by enhancing penetration, reducing the heat-affected zone (HAZ), and providing more uniform weld shapes. It ensures better energy distribution and minimizes defects like spatter or cracking. Likewise, the beam wobbling technique can mitigate the occurrence of pores generated by the keyhole by widening it [6]. The study carried out by Wang et al. [13] demonstrated that wobbling facilitated the flow of the material and stabilized the keyhole. A similar effect has been demonstrated using a dual spot beam [14]. This method also stabilizes the welding process, making it suitable for high-precision applications in industries like automotive and aerospace.
For Al-Cu joints, challenges arise because both metals have low absorptivity in the near-infrared laser spectrum. Despite being soluble in each other in the liquid state, several intermetallic compounds (IMCs) are formed during the solidification process. These compounds are characterized as brittle and exhibit high hardness values (ranging from 36 up to 930 HV) [15], which can lead to cracking and, consequently, joint fracture. Additionally, many of these brittle phases have high electrical resistance, much higher than copper or aluminum [16]. Furthermore, the properties of the IMC layer depend on its chemical composition and thickness. Specifically, the kinetics of IMC layer growth are controlled by diffusion, suggesting that high process speeds could potentially prevent or diminish their formation [17].
Overall, studies have investigated different configurations of materials, layouts, laser equipment, and optical configurations pursuing process optimization. Generally, the process parameter combination required to obtain defect-free joints is very narrow. When the laser power applied is too low, the joints display weak characteristics, while, at higher power levels, cracks form in the joints due to the IMC [2,18]. It was observed by Dimatteo et al. [19] that using a smaller laser diameter to generate lower power reduced the heat input. This reduction favored a wider process window, allowing for better control of penetration and mixing of copper and aluminum.
This study aims to assess the influence of laser welding parameters on the quality of welds in both similar and dissimilar joints for components used in electric vehicle battery systems. Specifically, dual beam and beam shaping techniques were employed for welding Al–Al and Al–Cu overlap joints. Laser welding is a complex process involving a large number of interrelated variables that can significantly affect joint quality. To address this complexity, a Design of Experiments (DoE) methodology was implemented. This approach enables a systematic analysis of the process, allowing the identification of the most influential parameters, a better understanding of their interactions, and the exclusion of less relevant variables. Consequently, it facilitates a more efficient and targeted optimization of the welding procedure.

2. Materials and Methods

The materials used in the experiments are AA1050 H24 aluminum alloys and C11000 copper alloy, typically employed in EV battery packs. For the Al-Cu overlap joints, copper sheets with a thickness of 0.3 mm were placed on the top of 1.5 mm thick AA 1050 sheets. In the case of Al-Al samples, 0.5 mm sheets were placed on top of the 1.5 mm sheets. The chemical compositions of both materials are depicted in Table 1 and Table 2, which display their physical properties. Figure 1 shows a schematic configuration of the welding samples, where the circular line represents the overlap joint.
For the experiments, a Fiber Laser Coherent ARM 6 kW was used. This dual beam fiber laser system consisted of independently controllable core and ring beam outputs, allowing a high precision energy delivery. The welding head used was a scanner, which incorporated rotating mirrors for the wobbling technique. The principal characteristics are described in Table 3. Air shielding gas of 5 L/min was used.
A statistical method was utilized to comprehend the impact of the primary laser welding parameters on joint quality, as well as to reduce materials usage, time, and cost. In this context, a Design of Experiments (DOE) approach was employed. Using the Box–Behnken Design (BBD) method, the experiments were carried out with three levels for each independent parameter. In the Al-Al overlap joints, the experimental designs included four factors: core power, ring power, wobbling amplitude, and welding speed. A total of 25 experiments were required. On the other hand, in the Cu-Al overlap joints the experiments involved three-factor designs, resulting in 13 welding samples. The welding parameters of core power, ring power, and speed were selected as inputs, as these joints were made without wobbling. Parameter limits have been targeted by achieving the highest possible process speeds to reduce the interaction time between Cu and Al and thus reduce the formation of an IMC layer [17]. The variation of the parameters applied on both configurations are shown in Table 4.
Partial penetration welding is required in the tab–busbar welding application, so, after conducting speculative welding trials, the preliminary results were used to define the parameter ranges and generate the DOE. To assess the relative influence of each welding parameter on interface width and penetration, a Pareto chart was employed to visualize the standardized effects obtained from the statistical model developed in Python (Spyder Integrated Development Environment (IDE), version 5.5.1.)
A sample was produced for each condition of the DoE, and metallographic analyses were performed to evaluate them. The joint cross-sections were mounted and prepared following standard metallographic procedures, including grinding with 800, 1200, 2000, and 4000 µm SiC paper, followed by polishing with 3 and 1 µm diamond paste. In the case of sample preparation for Electron Backscatter Diffraction (EBSD) an additional polishing stage with colloidal silica (40 nm) was added. Macrographic analyses were performed with a LEICA DVM6, optical microscope in LEICA MICROSYSTEMS GmbH (Wetzlar, Germany). Two macrographs were prepared and analyzed for each sample. Microscopy studies were performed with a Zeiss Ultra Plus Scanning Electron Microscope (FEG-SEM) (Zeiss Microscopy, Oberkochen, Germany). The EBSD mappings were generated at an acceleration voltage of 15 kV and collected using a CRYSTAL detector from Oxford Instruments (Oxford, UK). The indexation of the Kikuchi lines and determination of orientations were performed using the AZTEC and CHANNEL 5 software, developed by HKL Technology (Oxford, UK). The microhardness Vickers measurements were performed in an EMCO DuraScan 10, 20 durometer from EMCO -TEST Prüfmaschinen GmbH, Kuchi Brennhoflehen-Kellau, Germany using a load of 500 g following a hardness matrix with a 200 µm spacing between indentations.

3. Results

3.1. Al-Al Joints

3.1.1. DoE Analysis

The results obtained from the 25 joints were analyzed to evaluate the effect of the four process variables (as described in Table 4) on two responses: interface width and penetration. Figure 2 shows the standardized Pareto chart and the welding parameters’ response for interface width. As observed, all welding parameters, in addition to the ring power–speed combination, displayed a relevant impact on the response with a significance level of α = 0.05. This significance was determined by comparing the standardized effects against the critical t-value of 2.228, which corresponds to 10 degrees of freedom and defines the threshold for statistical significance in the Pareto chart. Any term with a standardized effect exceeding ±2.228 is considered significant at the 95% confidence level.
The most significant parameter was welding speed, followed by ring power, amplitude, and core power. As both core and ring powers and amplitude increased, the interface width expanded. However, an increase in welding speed caused a reduction in interface width. This was attributed to the fact that higher core and ring powers raise energy density, which melted a greater quantity of material and widened the interface width. Similarly, a larger wobbling amplitude spreads the laser’s energy over a wider surface. Although the energy density at each point decreased, the heat accumulated over a larger area, resulting in a wider weld as the molten region expanded laterally along the oscillation path. In contrast, increasing welding speed reduced the interaction time between the laser and the material, leading to a narrower interface.
Figure 3 shows the Pareto Chart for the penetration response. The main parameter that displayed the highest influence was core power, followed by speed, ring power, amplitude, and ring power–speed interaction. The effects of core power and speed were similar to those observed in the interface width response; however, both ring power and amplitude had a much smaller effect. According to the main effect graphs, increasing the core power significantly affected penetration. The results showed a notable increase in penetration from approximately 0.6 mm at 0.8 kW to around 1.1 mm at 1.2 kW. While higher ring power caused a gradual rise in penetration, an increase in amplitude and speed led to a slight decrease in penetration.

3.1.2. Joint Analysis

The joints were evaluated using optical microscopy. Macrographic analysis of both the top view and cross sections revealed key features such as penetration, weld width, and the presence of defects. Porosity was the most common defect, characterized by rounded cavities scattered throughout the weld and along the edges of the interface. In addition, irregular wormhole porosities were also found at the root of the weld. This defect is usually associated with the collapse of the molten pool over the keyhole.
To conduct a more detailed assessment of the impact of welding speed and wobbling on joint quality, four joints were selected for analysis in which only one parameter varied at a time, allowing the individual effects of welding speed and wobbling amplitude to be evaluated independently in terms of microstructure and mechanical performance. Table 5 shows the parameters applied to these joints, and Figure 4 provides their macrographs for comparison.
It was observed that joint 10 exhibited a greater presence of pores with irregular shape and larger dimensions, followed by joints 6 and 25. Measurements indicated that the pores in these joints reached maximum lengths of 227.5 µm, 175.15 µm, and 164.84 µm, respectively. Notably, joint 16 did not exhibit any pores, indicating a complete absence of this type of defect. Similarly, sample 25 presents some pores at the interface, but no root pores have been observed, commonly referred to as wormhole porosity. These results indicated the positive influence of wobbling, which allowed the keyhole to widen, preventing the collapse of the molten pool over it and, consequently, avoiding the formation of such porosity. In the joints manufactured without wobbling (6 and 10), wormhole porosity was observed in both cases. Despite the use of dual beam technology, the keyhole did not remain open long enough to prevent the molten pool from collapsing, leading to cavities filled with trapped gas. However, with the introduction of wobbling, the keyhole widened, preventing the collapse of the molten pool over the keyhole.
The most significant variation was observed in penetration, exhibiting a maximum difference of 0.8 mm between the highest and lowest values. This variation can be attributed to both an increase in core power and a decrease in speed, which were identified as key factors in the Pareto chart. The influence of speed was further noticed when comparing joints 6 and 25, where a rise in speed led to a reduction in penetration, accompanied by a decrease in interface width. This trend was associated with the shorter interaction time between the laser and the material as speed increased.
A hardness map has been superimposed on the macrographs, as illustrated in Figure 5. The joints produced at 18 m/min (6 and 16) showed slightly higher hardness values in the welding zone compared to those welded at 15 m/min (10 and 25). This increase was mainly seen in the upper part of the weld. Joint 16 exhibited the highest measurements in the upper zone, with a peak value of 65.6 HV, which corresponds to an increase of 16% compared to the base material. In contrast, joint 25 displayed the lowest values in the same zone, with a peak of 58.5 HV. At the same time, a decrease in hardness was observed along the length of the weld, with lower values at the root of the weld.
A noticeable difference in hardness was observed along the weld between the two sheets, likely influenced by two factors. First, although both sheets were made from the same alloy (AA1050), the lower sheet exhibited lower hardness than the upper sheet due to differences in their manufacturing processes. As a result, the hardness measured in the heat-affected zone (HAZ), the weld, and the base material were lower in the lower sheet. Second, slight cooling differences between the upper and lower sections of the weld, likely due to variations in heat conduction, may also contribute to the observed reduction in hardness.
The microstructure of the as-received Al1050 with thicknesses of 0.5 and 1.5 mm has been analyzed by means of EBSD. The sheets underwent a cold rolling process, resulting in a microstructure characterized by elongated grains oriented in the rolling direction (Figure 6). In addition, the high deformation observed was quantified using the Kernel Average Misorientation (KAM) parameter, and the results can be seen in Table 6. According to the measurements, the thinner sheet displayed a greater grain size and a mean intercept length higher than the 1.5 mm sheet. The KAM values are typical for rolled aluminum, showing no significant differences between them.
The IPF maps of joints 6 and 16 can be seen in Figure 7, where the grains were traced with a disorientation of 15 °. In the weld zone, elongated grains were observed, aligned with the center of the weld, while equiaxed grains were predominant at the center. Additionally, small equiaxed grains were evident in the HAZ. These grain characteristics were shaped by the solidification process, with the grains growing in the direction of the heat flow, which was perpendicular to the molten pool. As a result, the columnar grains grow towards the weld centerline. On the other hand, the grains displayed a random orientation, with no orientation patterns observed near the detected pores.
For the measurement of grain size, the data were partitioned to include only the grains that were part of the weld, and the results are shown in Figure 8. No significant differences were noted among the values measured in all samples, which ranged from 18.8 to 21.2 µm, with an average of 20 µm. This indicates that no trends have been observed with respect to process speed or the use of wobbling. Additionally, an increase in grain size up to 32% was observed in the welded joint area compared to the rest of the sample, which corresponds to the high heat input and rapid thermal cycles associated with the process.

3.2. Al-Cu Joints

3.2.1. DoE Analysis

As mentioned in the experimental section, the investigation carried out by Lee et al. [17] was considered for the DOE of the Al-Cu joints. As the conclusions indicated that higher process speeds reduce the formation of intermetallic compounds, the parameters applied in this investigation were selected accordingly. In this sense, 13 samples were welded to assess the influence of the three process variables (Table 4) on two responses: interface width and penetration depth. It was observed that, in four of them, the materials were joined, i.e., the penetration was zero; however, these specimens were included in the statistical analysis.
According to the Pareto charts (Figure 9), core power was identified as the only statistically significant factor influencing both interface width and penetration at a significance level of α = 0.05. As expected, an increase in core power resulted in greater penetration and a corresponding increase in interface width. Other parameters—such as ring power and welding speed, as well as their interactions— did not exhibit significant effects based on the critical t-value of 4.303, which corresponds to the model’s degrees of freedom and defines the threshold for statistical significance at the 95% confidence level.
Although welding speed did not reach statistical significance, a general inverse trend was observed with respect to core power; that is, increasing the welding speed tended to reduce both response variables. In contrast, no clear relationship or trend was found for ring power.

3.2.2. Joints Analysis

As mentioned, four samples failed to produce consistent joints. The welding parameters applied corresponded to lower core power values and higher processing speeds. This combination of process parameters led to insufficient energy input to join both materials. Specifically, samples with speeds of 30 m/min and core power below 2 kW exhibited minimal penetration (Figure 10C,E), which may lead to mechanically weakened joints. Table 7 displays the parameters applied to these joints, and Figure 10 illustrates their macrographs. As observed, the maximum width of 0.63 mm and a penetration depth of 0.42 mm were achieved when the maximum core power of 2 kW and core ring of 3.5 kW were applied.
In the other samples, various defects were observed, primarily trapped porosity. In aluminum welding, porosity formation is primarily attributed to the entrapment of hydrogen (H2) and its low solubility in solid aluminum. These small pores were more concentrated in the interface of both materials and in the aluminum bottom sheet (aluminum Figure 10B,D). In sample 4, shown in Figure 10B, a larger pore size can be detected in the copper, with a maximum length of 155.8 µm, which may be attributed to keyhole instabilities caused by turbulent fluid flow [15].
Another defect identified was cracking, likely related to the differences in the thermal properties of the materials. Copper exhibits a melting temperature of 1083 °C and a thermal conductivity of 401 W/M·K, whereas aluminum has a melting temperature of 660 °C and a thermal conductivity of 237 W/m·K. As thermal characteristics significantly influence the cooling rate, the two materials solidify at different rates, resulting in the development of stresses within the fusion zone, which can ultimately lead to cracking in the joint. In Figure 10F, a macrograph with the above-mentioned defects can be seen.
During laser welding of Al-Cu alloys, the formation of IMC layer is commonly observed. These compounds form within the weld and are generally associated with a deterioration in both mechanical and electrical properties. The mechanical behavior of the IMC layer is primarily influenced by its composition and thickness, both of which are significantly affected by the heat input [20]. A more detailed investigation was conducted to evaluate its mechanical properties and formation on the defect-free joint 2 (Figure 10A).
The EDS maps (Figure 11) illustrate the elemental distribution within the weld zone, highlighting the area where copper and aluminum were mixed during the process. Due to copper’s higher atomic weight compared to aluminum, when copper is positioned on top, it tends to migrate through the aluminum. This phenomenon is evidenced by the presence of copper in the bottom portion of the joint.
Figure 12 displays the microhardness map of joint 02. The average hardness of the base material was 85 HV for copper and 43 HV for aluminum. A significant improvement in the hardness was observed in the welding zone, where the peak measured in the interface reached values approximately 900 HV. In contrast, no notable differences in hardness were observed in the rest of the weld or HAZ.
The chemical composition fluctuations observed on the maps have been quantified using horizontal and vertical composition lines (Figure 13). Three vertical lines, each measuring 45 mm, were traced, one at each edge of the weld and one in the center. In the central area, there was a length of approximately 300 µm where both metals were present. In line 1, this interaction length was reduced to 150 µm, while, in line 3, it increases again, confirming the compositional fluctuations within the weld and the lack of homogeneity. Regarding the horizontal lines, two lines were traced, one near the interface and the other at weld root, to analyze residual copper. Particularly, copper traces were observed in the lower weld area, indicating that this element reached this region. Several point analyses (A to H) were also performed, and they confirmed the significant variation in the composition.
The structure obtained is highly complex, with compositional variations ranging from 95% wt copper to 2% wt. This suggests the formation of various intermetallic compounds and Al-Cu solid solutions, which is consistent with the high hardness values measured in this area.
A columnar phase was observed adjacent to the copper as well as on an isolated small island in the weld. This phase appeared as a darker region in the optic image (Figure 14D) and as a brighter area in SEM images (Figure 14E,F). Additionally, it exhibited a high hardness of approximately 900 HV and a copper composition exceeding 75% in wt., indicating that it could correspond to the Cu9Al4 phase based on both hardness and composition (Figure 13; location c) analysis. Next to this zone, closer to the lower part of the weld, a grayish zone was observed (Figure 14D), with a composition of 50% wt. of copper (Figure 13; location d and h) and hardnesses around 530 HV, which can be identified with the phase CuAl2.
This arrangement has been previously reported in another study [21], where four distinct layers of phases were unequivocally identified. The Cu9Al4 phase is situated close to the copper, while the CuAl2 phase is adjacent to it. In that work, these layers were clearly identified and well-defined, in contrast to the results presented in this investigation, where the layers were not uniform and were less delineated. This difference could be attributed to the processing speed, as the results presented in this study were conducted at a speed three times higher than in the previous study, which may lead to the non-homogeneous nature of the intermetallic compound region.

4. Discussion

4.1. Al-Al Joints

The findings from the Al-Al joints provided key insights into the parameters influencing weld quality. The interface width was primarily affected by welding speed, followed by ring power, amplitude, and core power. An increase in core and ring power led to greater penetration and a wider interface (0.54 mm), whereas higher welding speed and amplitude result in a reduction in both penetration and interface width. Interestingly, core power had the most significant impact on penetration, with a maximum value of 1.23 mm achieved at 1.2 kW.
The analysis of both interface width and penetration depth indicated that all process parameters investigated had a significant impact. In particular, core power and welding speed exhibited the most pronounced individual effects. These factors are related to their influence on energy density and, consequently, the interaction time of the laser with the material. In this context, the power is directly proportional to the total energy involved, while the speed is inversely proportional. Higher power increases the energy available for welding, whereas higher speed reduces the duration of exposure to the material, affecting the geometry of the weld [22,23].
The primary defect observed was porosity, characterized by rounded cavities along the weld bead and irregular wormhole porosity at the weld root. In similar joints (e.g., aluminum–aluminum), porosity is primarily attributed to the difference in hydrogen solubility between the liquid and solid states of aluminum, which can lead to gas entrapment during solidification. A previous study [11] has analyzed the influence of dual beam technology on porosity in laser welding of aluminum, showing favorable results, as the use of a dual beam enlarges the keyhole. However, in this study, porosity was not eliminated solely by using the dual beam; it was necessary to further widen the molten pool by employing wobbling. Other factors also played a significant role in this characteristic, with welding speed being one of the key contributors. Notably, the referenced study employed a significantly lower welding speed (3 m/min) compared to the speeds used in the present work (30 to 40 m/min). Additionally, variations in the aluminum alloys used could further explain the observed differences, as seen in the work conducted on Al 5XXX alloys [14].
Furthermore, joints produced at higher welding speeds demonstrated increased hardness in the weld zone, with measurements indicating a 16% rise. As expected, the weld center was composed of elongated grains, whereas more rounded grains were found toward the weld core. Particularly, the variations in the process parameters did not lead to significant differences in the grain size at the weld center, which consistently measured an average of 20 µm. This grain growth behavior has been analyzed in other studies, showing that grains grow from the outer weld area toward the inside until a new nucleation of equiaxed grains occurs within the molten pool [7,23]. Moreover, the welded microstructure exhibited a grain size increase of up to 32% compared to the base material.

4.2. Al-Cu Joints

The results for the Al-Cu joints, based on the standardized effects plotted in the Pareto chart, identified core power as the only statistically significant factor affecting both interface width and penetration at α = 0.05. As core power increases, both interface width and penetration increase accordingly. As a result, a maximum width of 0.63 mm and a penetration depth of 0.42 mm were achieved when the maximum values of core and core ring power were applied (2 and 3.5 kW, respectively). In contrast, there was no clear trend regarding the effect of ring power on the welding process.
Defects such as porosity and cracks were observed in the welds. Small pores were primarily detected at the interface between the two materials and within the bottom aluminum sheet. The formation mechanisms of porosity in Al-Cu dissimilar joints are significantly influenced by their distinct thermal conductivities and melting points. Aluminum has a lower melting point (~660 °C) and higher thermal conductivity (~394 W/m·K) compared to copper (~1083 °C and ~210–220 W/m·K, respectively). These differences lead to asymmetric heat distribution during welding, as copper tends to conduct heat away more rapidly, which can result in insufficient melting of the copper side and excessive melting of the aluminum side. This imbalance may trap gases (such as hydrogen or vaporized low-boiling-point elements) in the molten aluminum, leading to porosity. Furthermore, the rapid solidification of aluminum around still-liquid copper can hinder gas escape. At higher process speed, the cooling rate is too rapid, leaving insufficient time for the hydrogen to escape.
The laser welding of Al-Cu alloys often leads to the formation of IMC with a complex structure. These compounds exhibited significant compositional variations that contributed to the heterogeneity of the weld structure. Notably, a significant increase in hardness was observed, with a peak value of approximately 900 HV at the weld interface, which was associated with these compounds.
Several studies have highlighted the influence of these compounds on joint integrity, particularly when the thickness of the intermetallic compound layer exceeds 5 µm. The findings consistently identify CuAl2 as the most significant contributor to the weakening of the joint, emphasizing its critical role in compromising structural stability [20]. Additionally, the effect of process speed on the formation of these compounds has been examined by Lee et al. [24] and confirmed that processing speeds exceeding 50 m/min could effectively suppress their formation. However, despite operating at similar speeds in this study, such suppression was not observed, suggesting that other factors may also influence the formation of the intermetallic layers or that higher process speeds should be explored to reduce overall heat input and limit IMC formation, while still ensuring sufficient penetration to achieve acceptable mechanical properties.
Overall, this study on laser welding parameters using dual beam and beam shaping techniques applied to Al-Al and Al-Cu joints revealed several key findings, as these technologies offer enhanced control over the conventional laser welding process through additional adjustable parameters, each of which also influences the joint dimensions. Core power primarily affects penetration depth, as higher values increase energy density, enabling deeper keyhole formation. However, in dissimilar joints, excessive core power may promote the formation of brittle intermetallic compounds. In contrast, ring power has a greater influence on weld width, as it distributes energy over a broader area. It assists in preheating the surrounding material and reducing thermal gradients, which improves process stability and helps minimize defects such as porosity—particularly in dissimilar joints. Welding speed inversely affects both penetration and width, where higher speeds reduce the interaction time between the laser and the material, resulting in narrower and shallower welds. Lower speeds increase heat input, which may enhance penetration but also raise the risk of defects. Finally, wobble amplitude increases weld width by oscillating the beam path. This improves energy distribution and can help mitigate IMC formation, but, if the amplitude is too large, it may compromise penetration. Under the studied conditions, the use of wobbling appears to be necessary to prevent trapped porosity. Among the tested welding speeds, 15 m/min showed the best metallographic quality. Regarding laser power, a core power of 1 and a ring power of 1.3 kW proved to be suitable. However, depending on the mechanical property requirements for the final application, it may be possible to reduce both power values—while maintaining this ratio—in order to decrease penetration depth.
Additionally, the outcomes demonstrated that joints can be produced using this combination of techniques in both similar and dissimilar material configurations, particularly for specialized applications such as electric vehicle battery components. Notably, the influence of the primary welding parameters was established on joint dimensions and quality through metallurgical characterizations and hardness evaluations. However, further detailed analysis is required to deepen the understanding of this specific dual beam and wobble technique. Future research could focus on evaluating the mechanical properties of the resulting joints.

5. Conclusions

Dual beam and beam shaping laser welding technologies were applied to Al-Al and Al-Cu overlap joints to study the effects of process parameters on joint quality. The findings are summarized as follows:
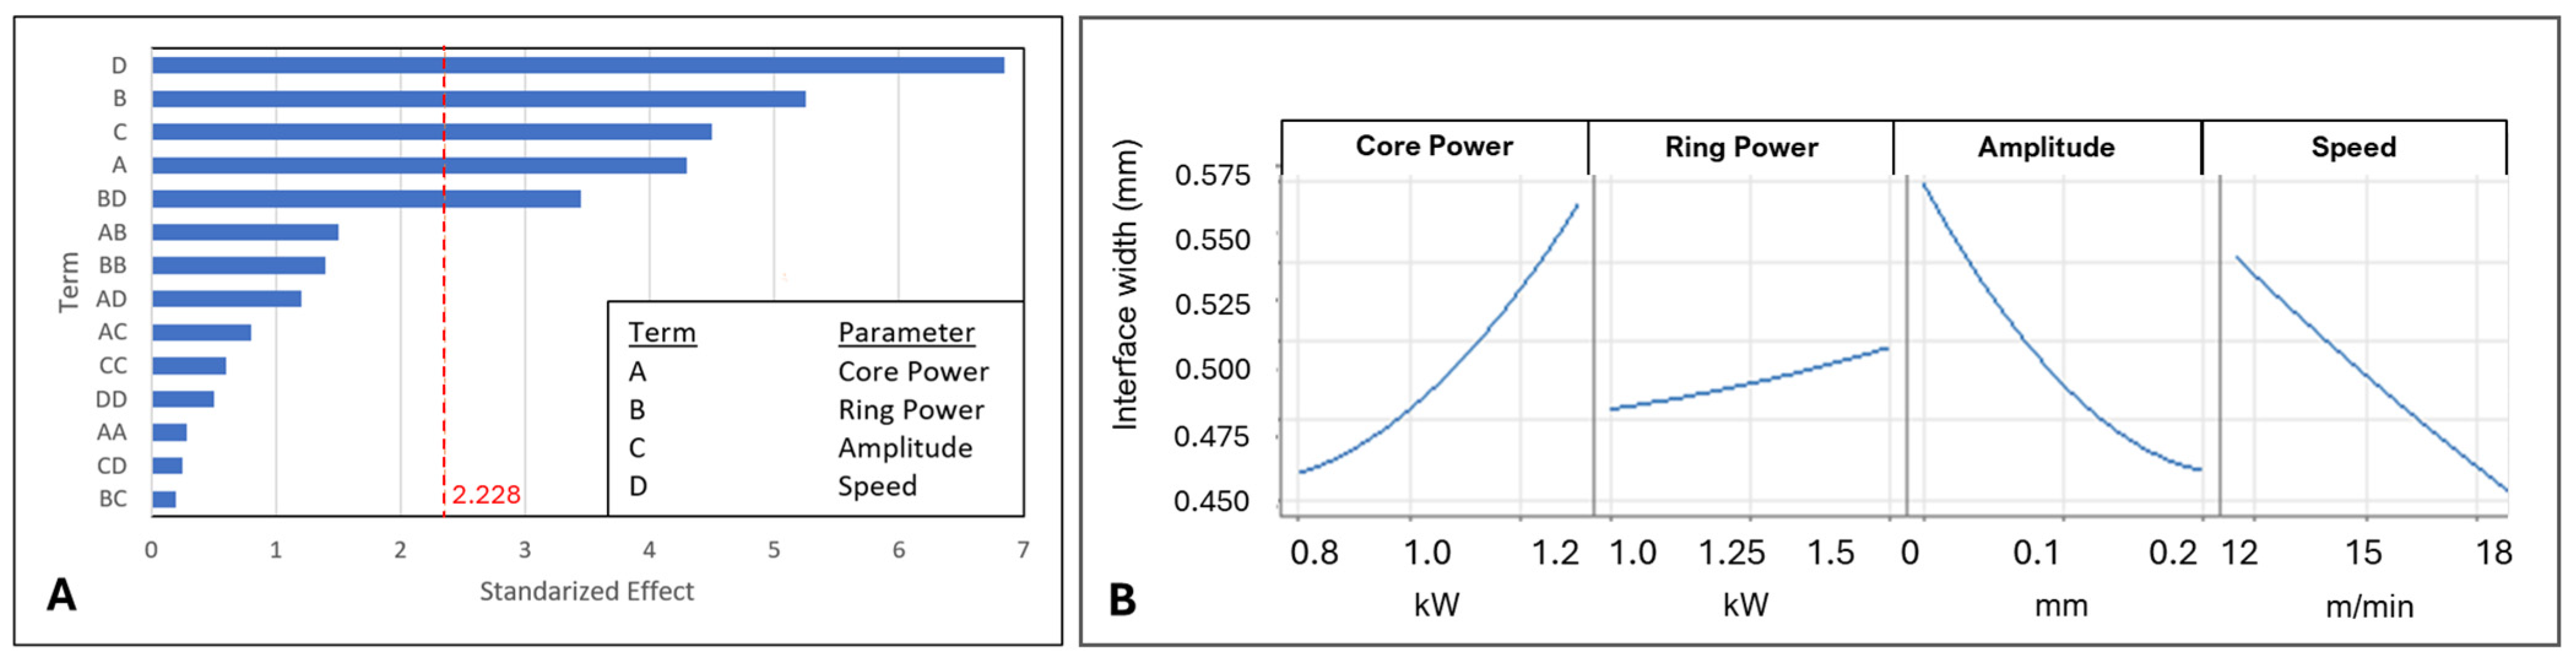
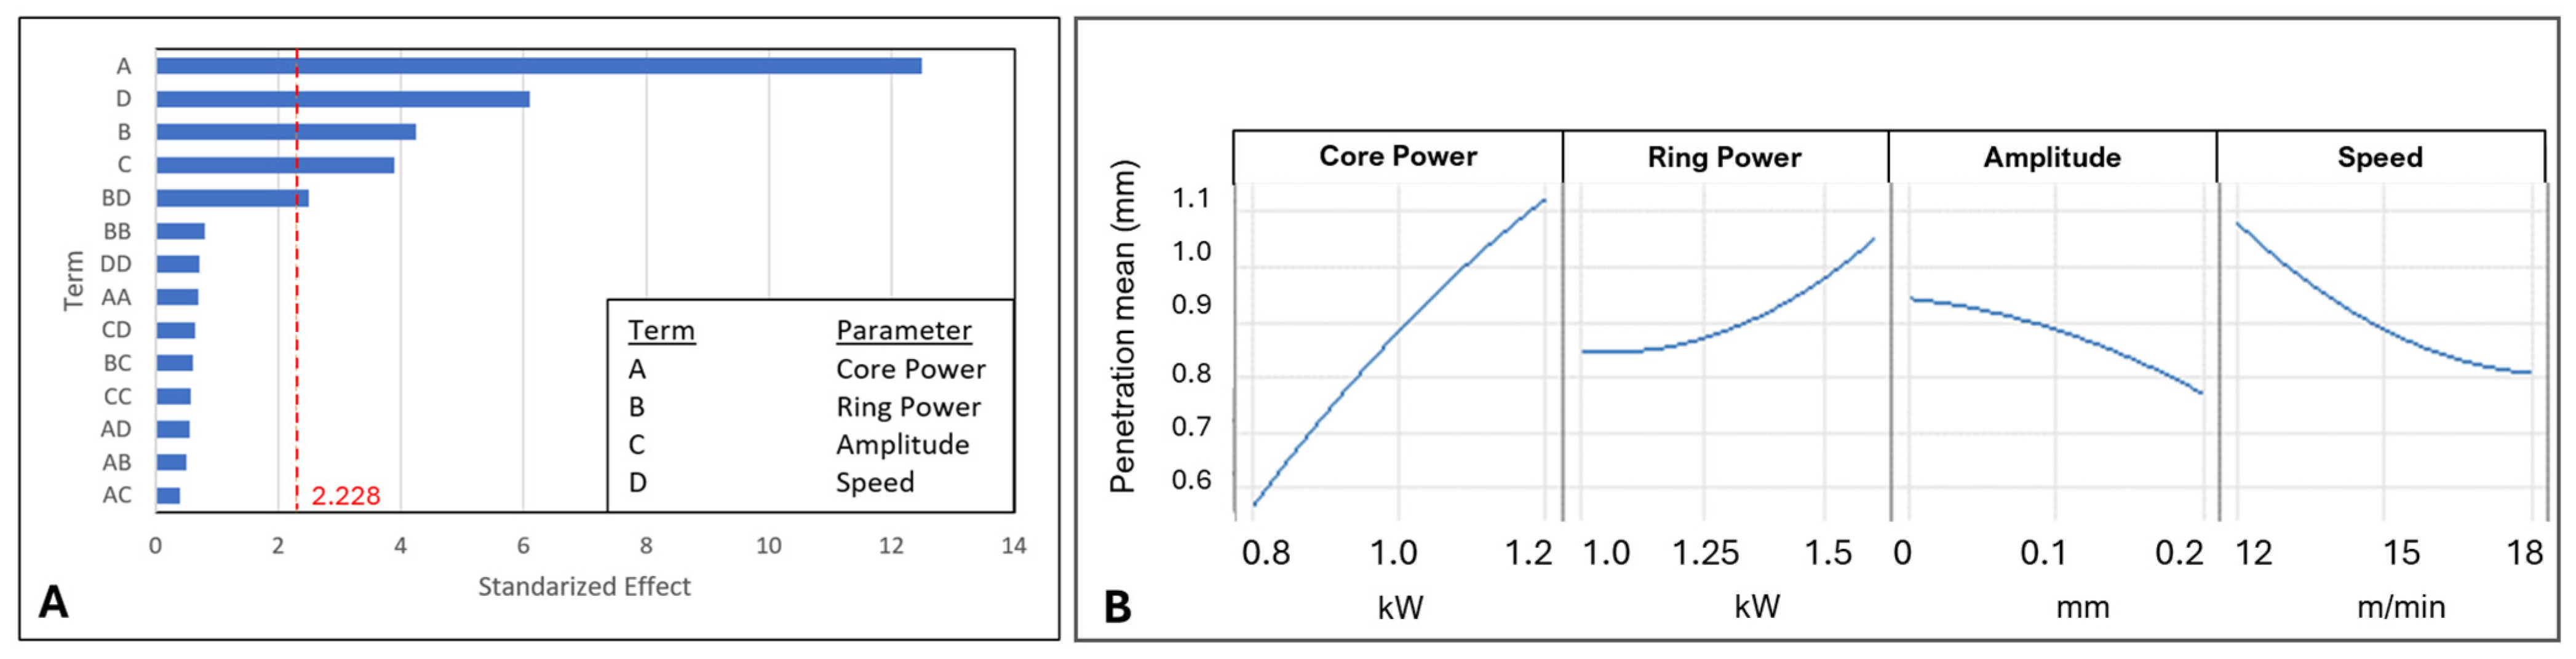
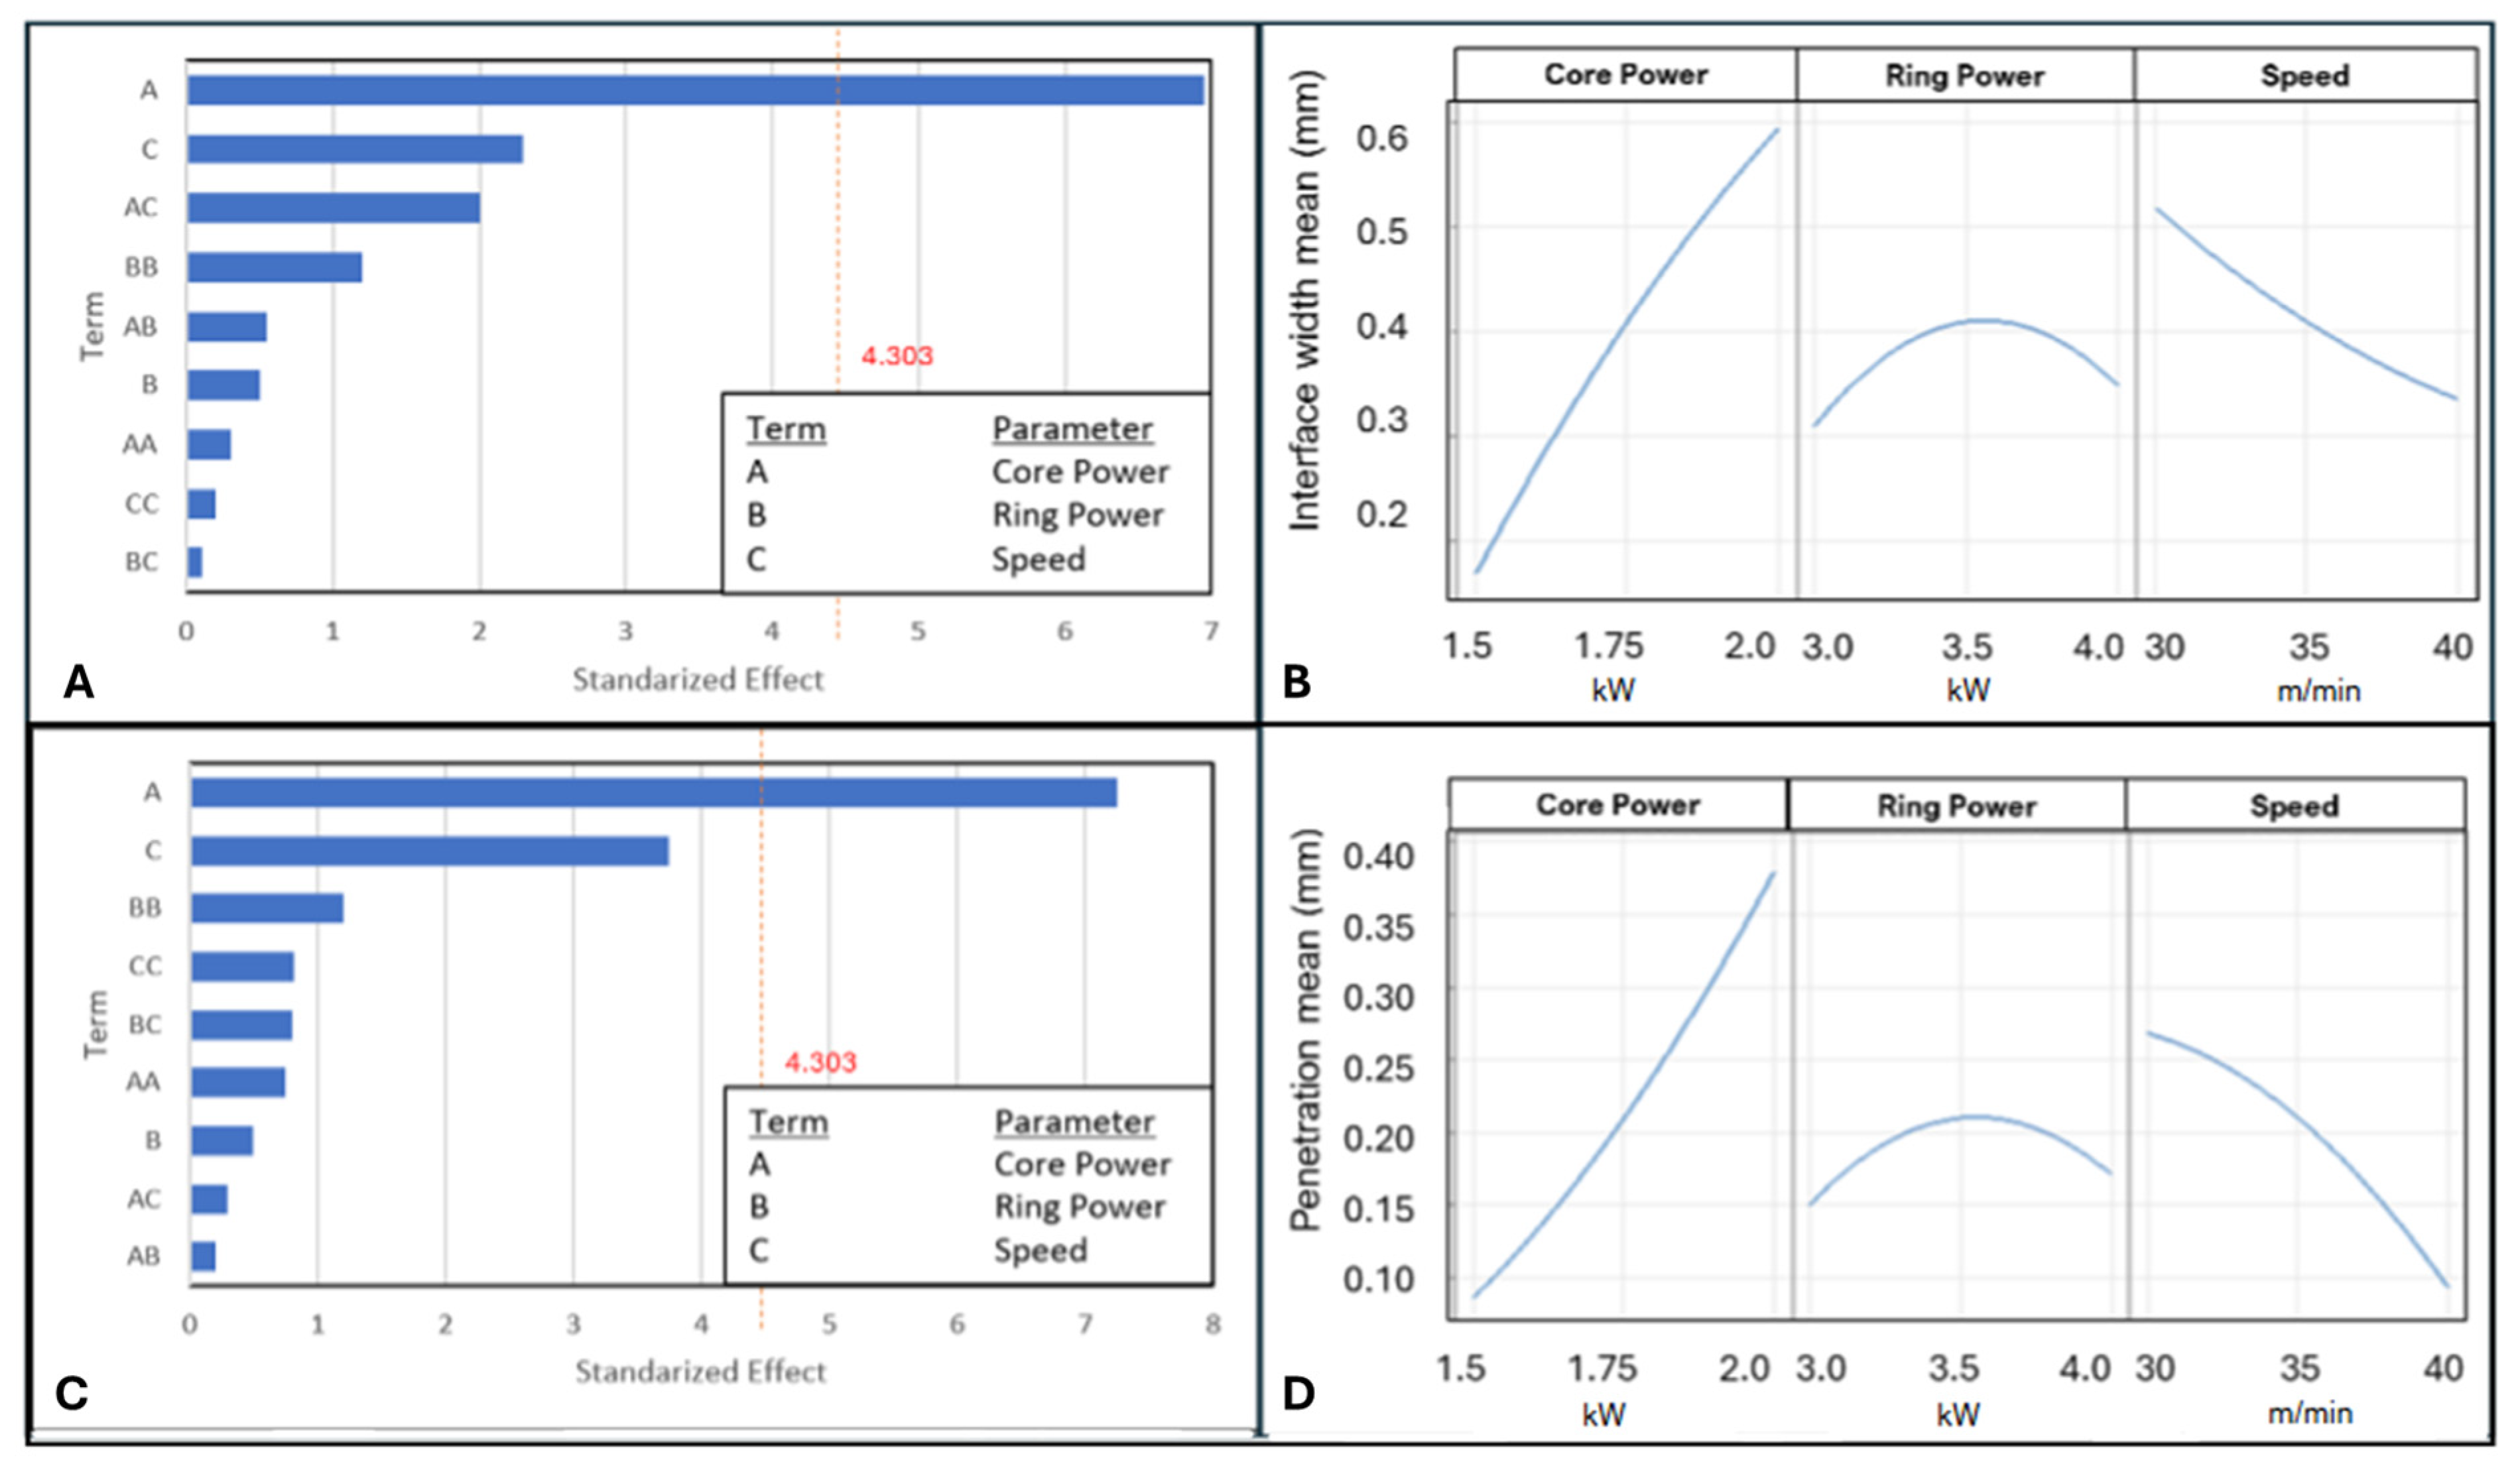
  • The Pareto chart, used to visualize the standardized effects from the statistical model, revealed that welding speed had the strongest influence on interface width in Al–Al joints, followed by ring power, wobbling amplitude, and core power. Higher core and ring powers widened interfaces and increased penetration depth, while greater speed and amplitude reduced them. The maximum penetration value of 1.23 mm was achieved at 1.2 kW of core power.
  • In the Al-Cu joints, core power was the only significant parameter, with increased core power enhancing both interface width and penetration depth. The maximum width of 0.63 mm and a penetration depth of 0.42 mm were achieved when the maximum core power of 2 kW and core ring of 3.5 kW were applied. Ring power showed no clear trend.
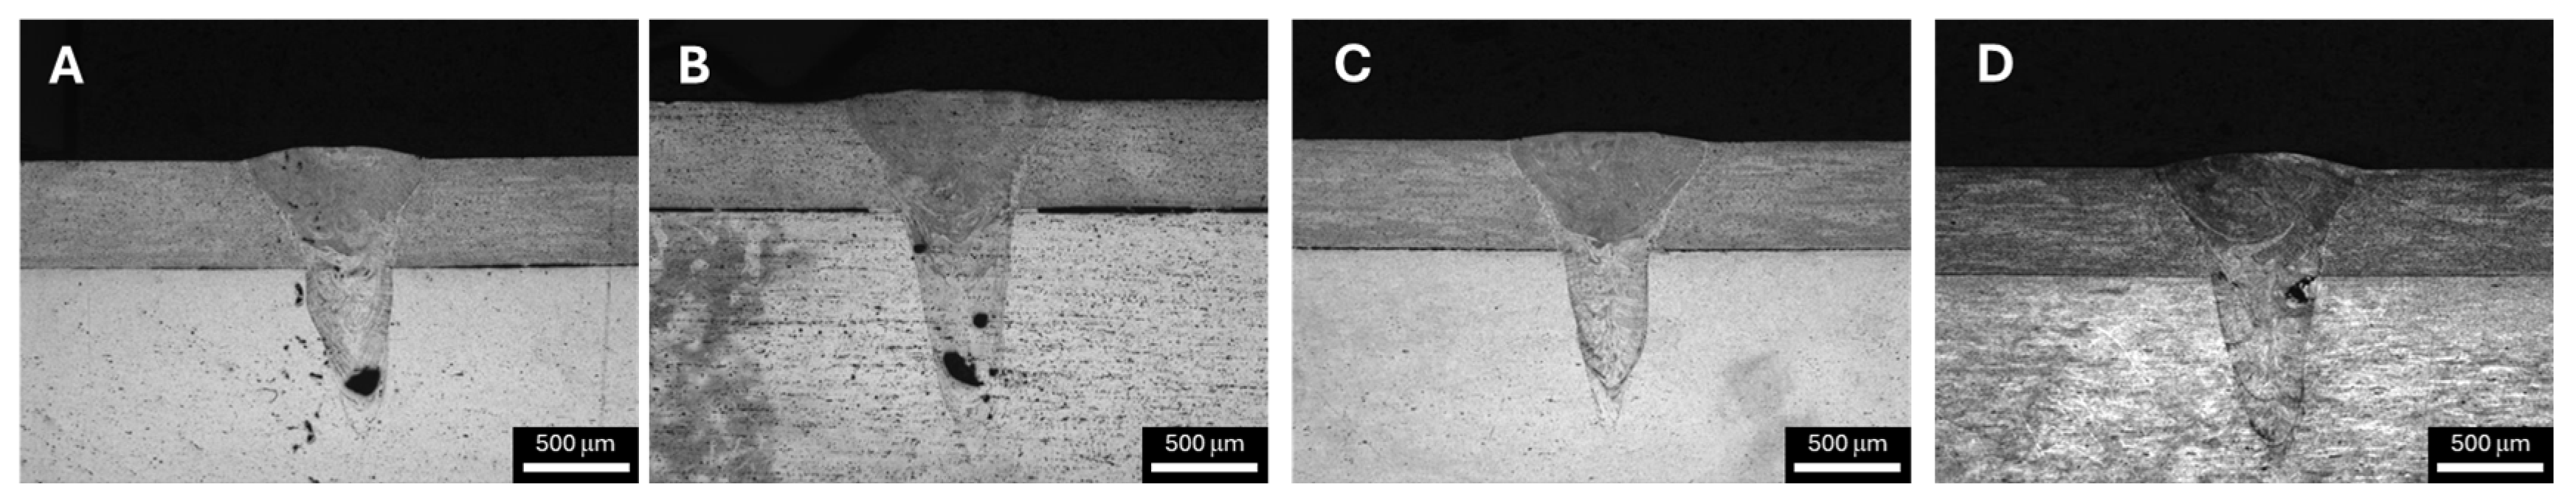
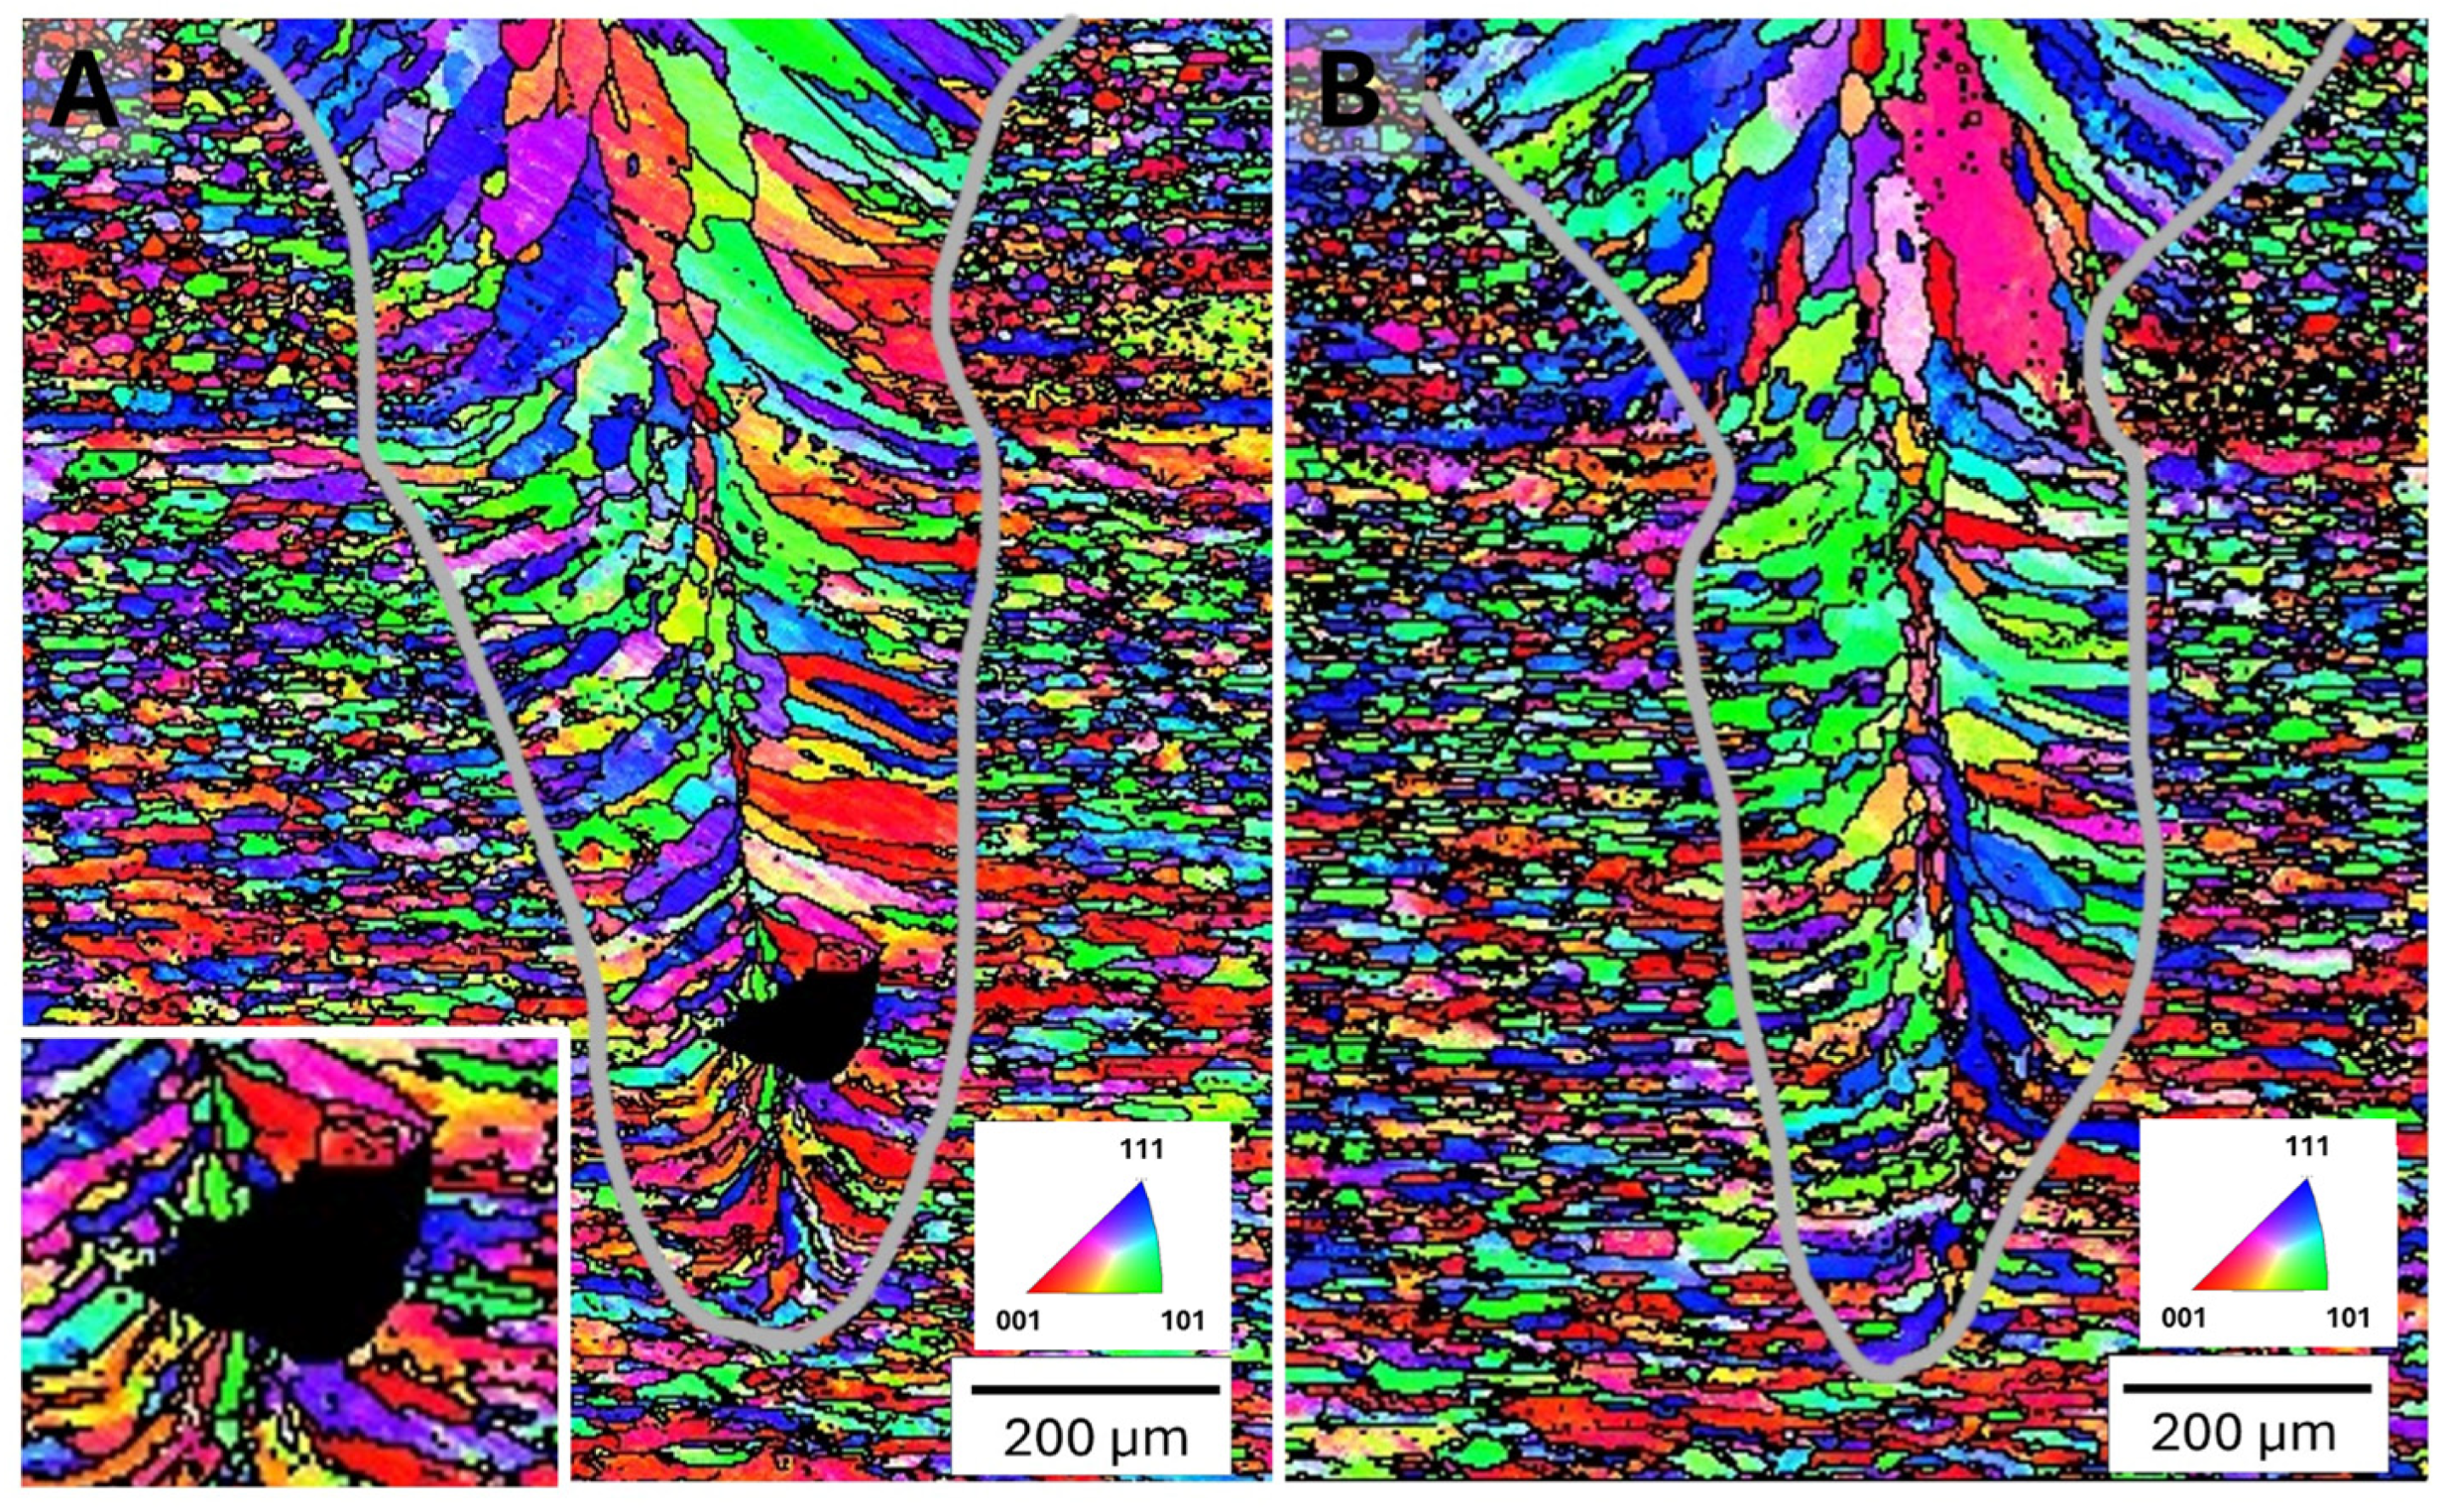
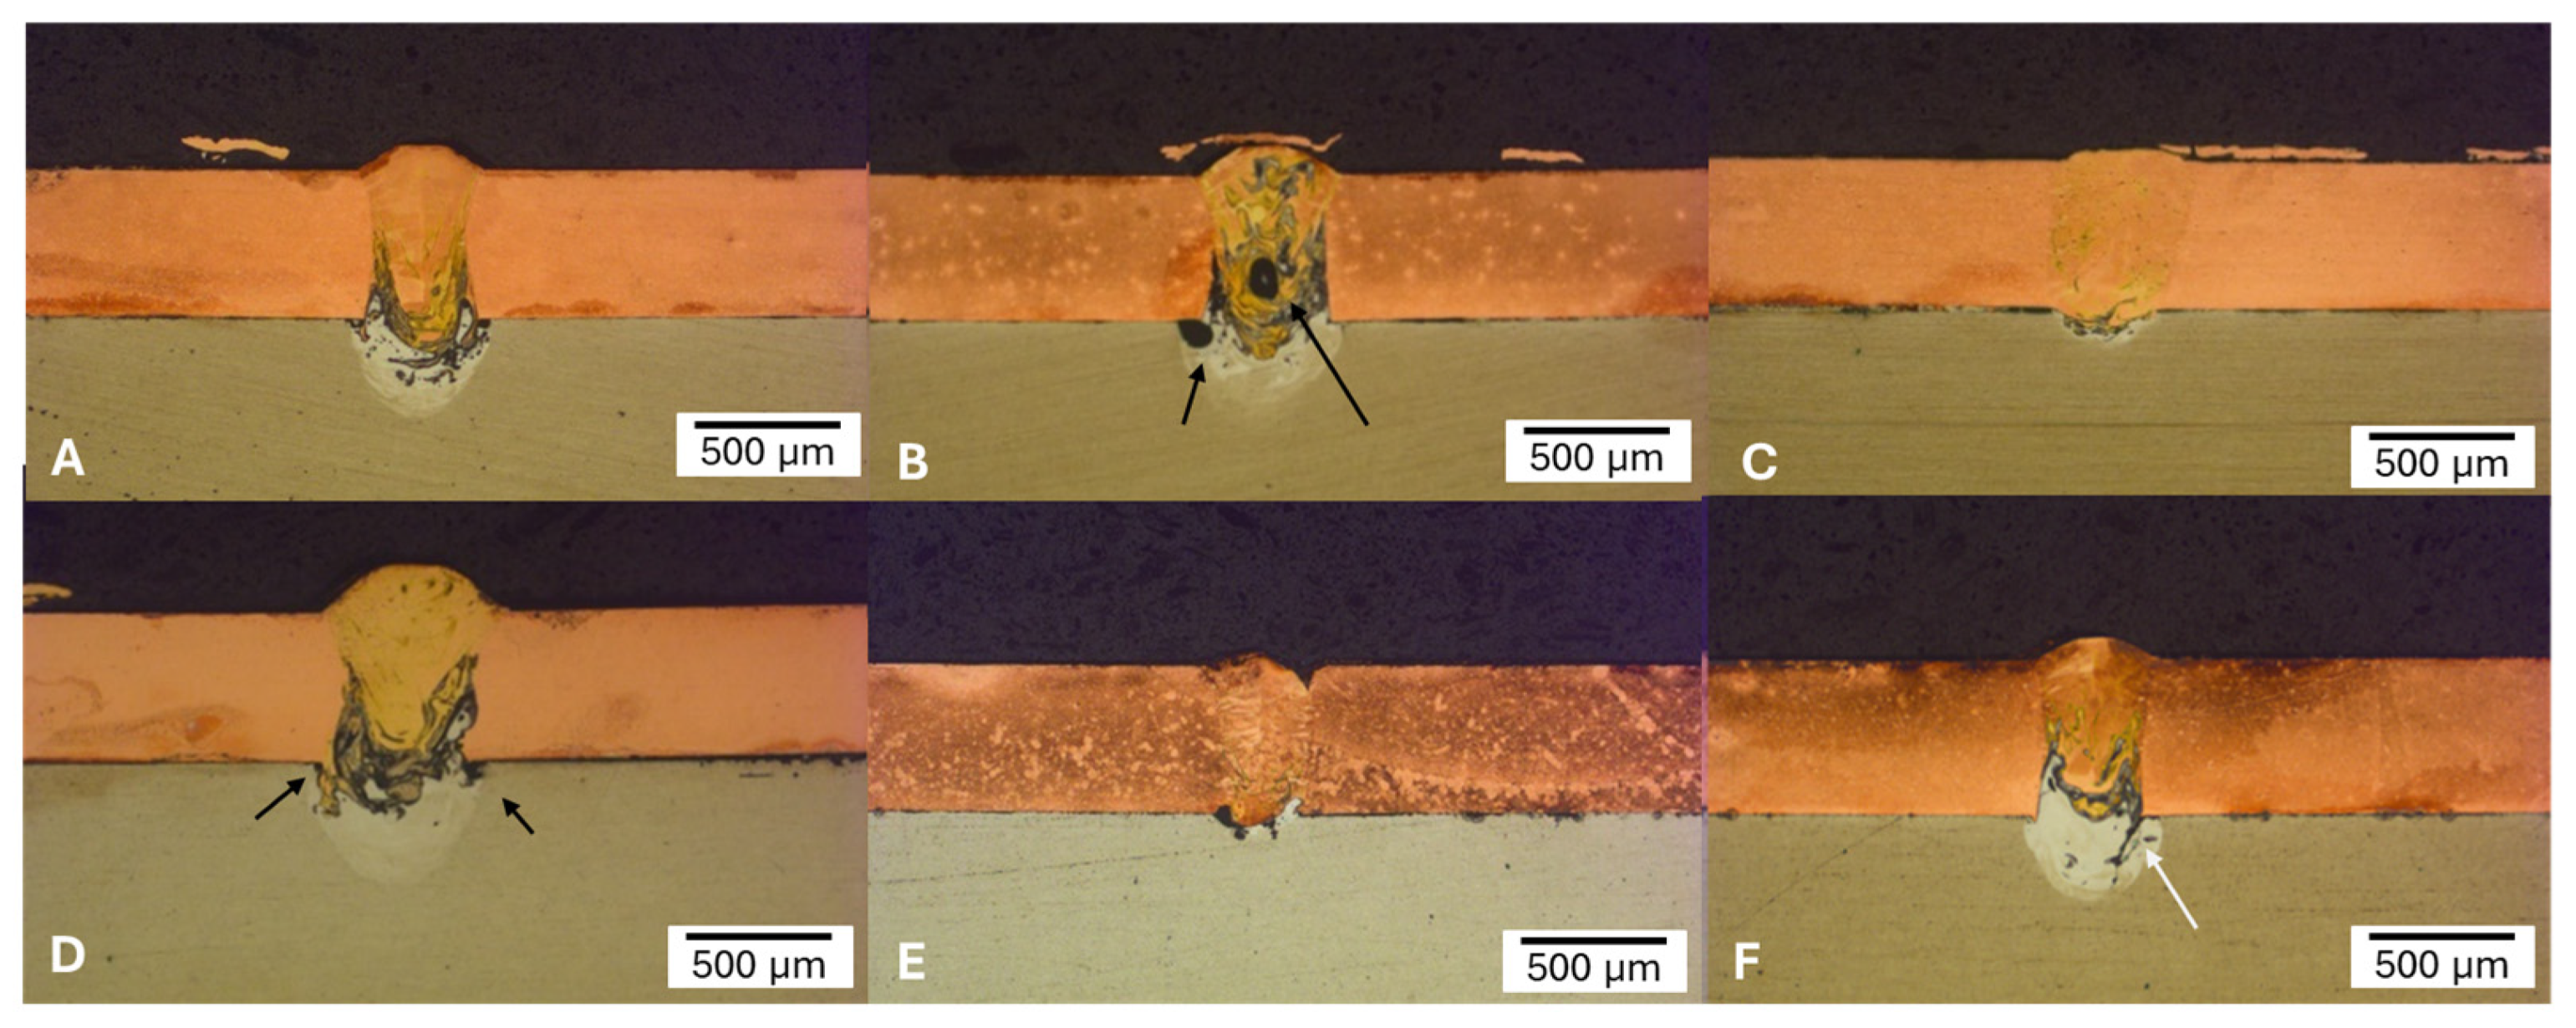
  • Common defects in both joints’ configuration included porosity and cracks. In Al-Al welds, porosity appeared as rounded cavities along the bead and wormhole porosity at the root. Higher processing speeds in Al-Al joints resulted in a 16% increase in hardness compared to the base material. This was accompanied by the formation of elongated grains near the weld center and rounded grains with random orientations near pores, leading to a grain size increase of up to 32%.
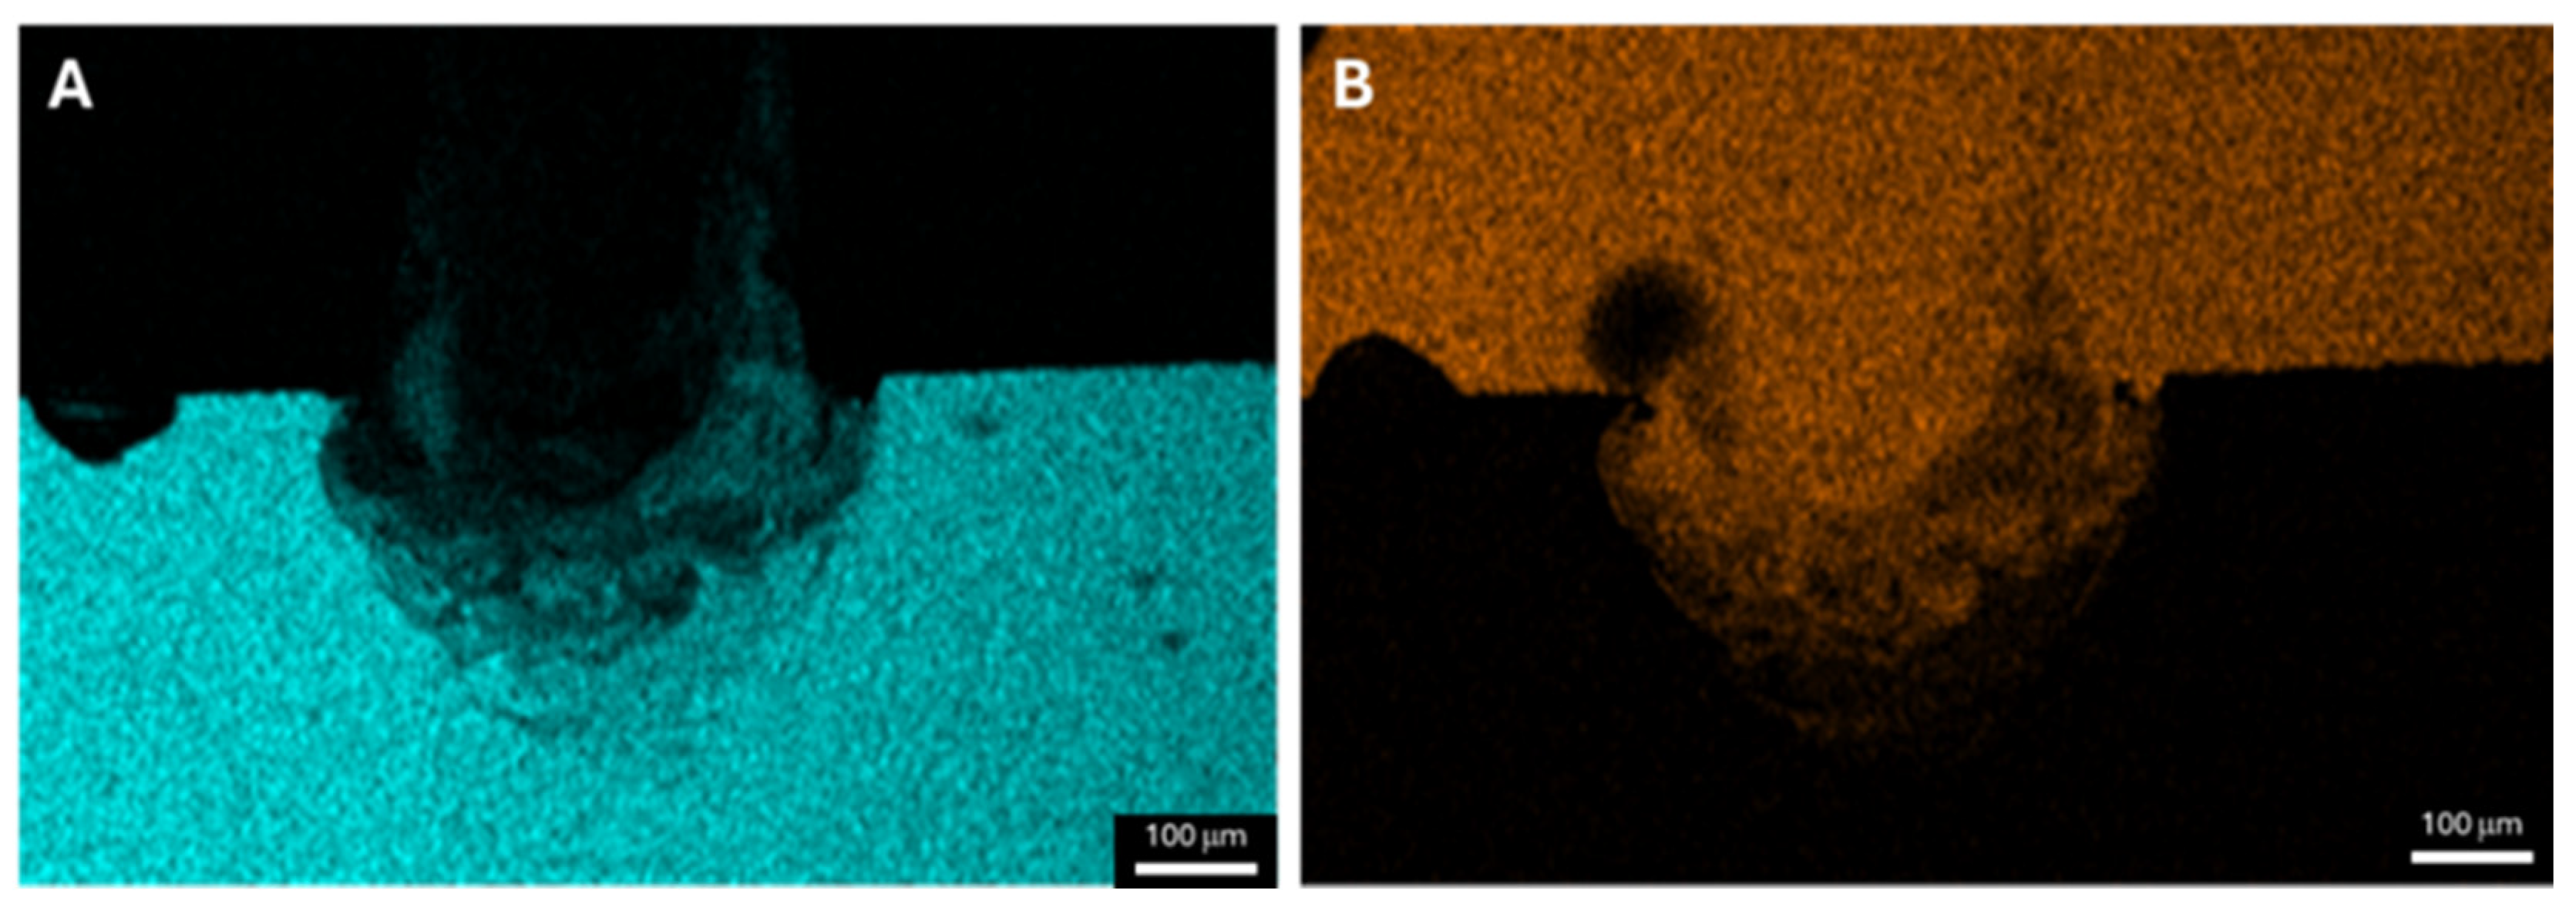
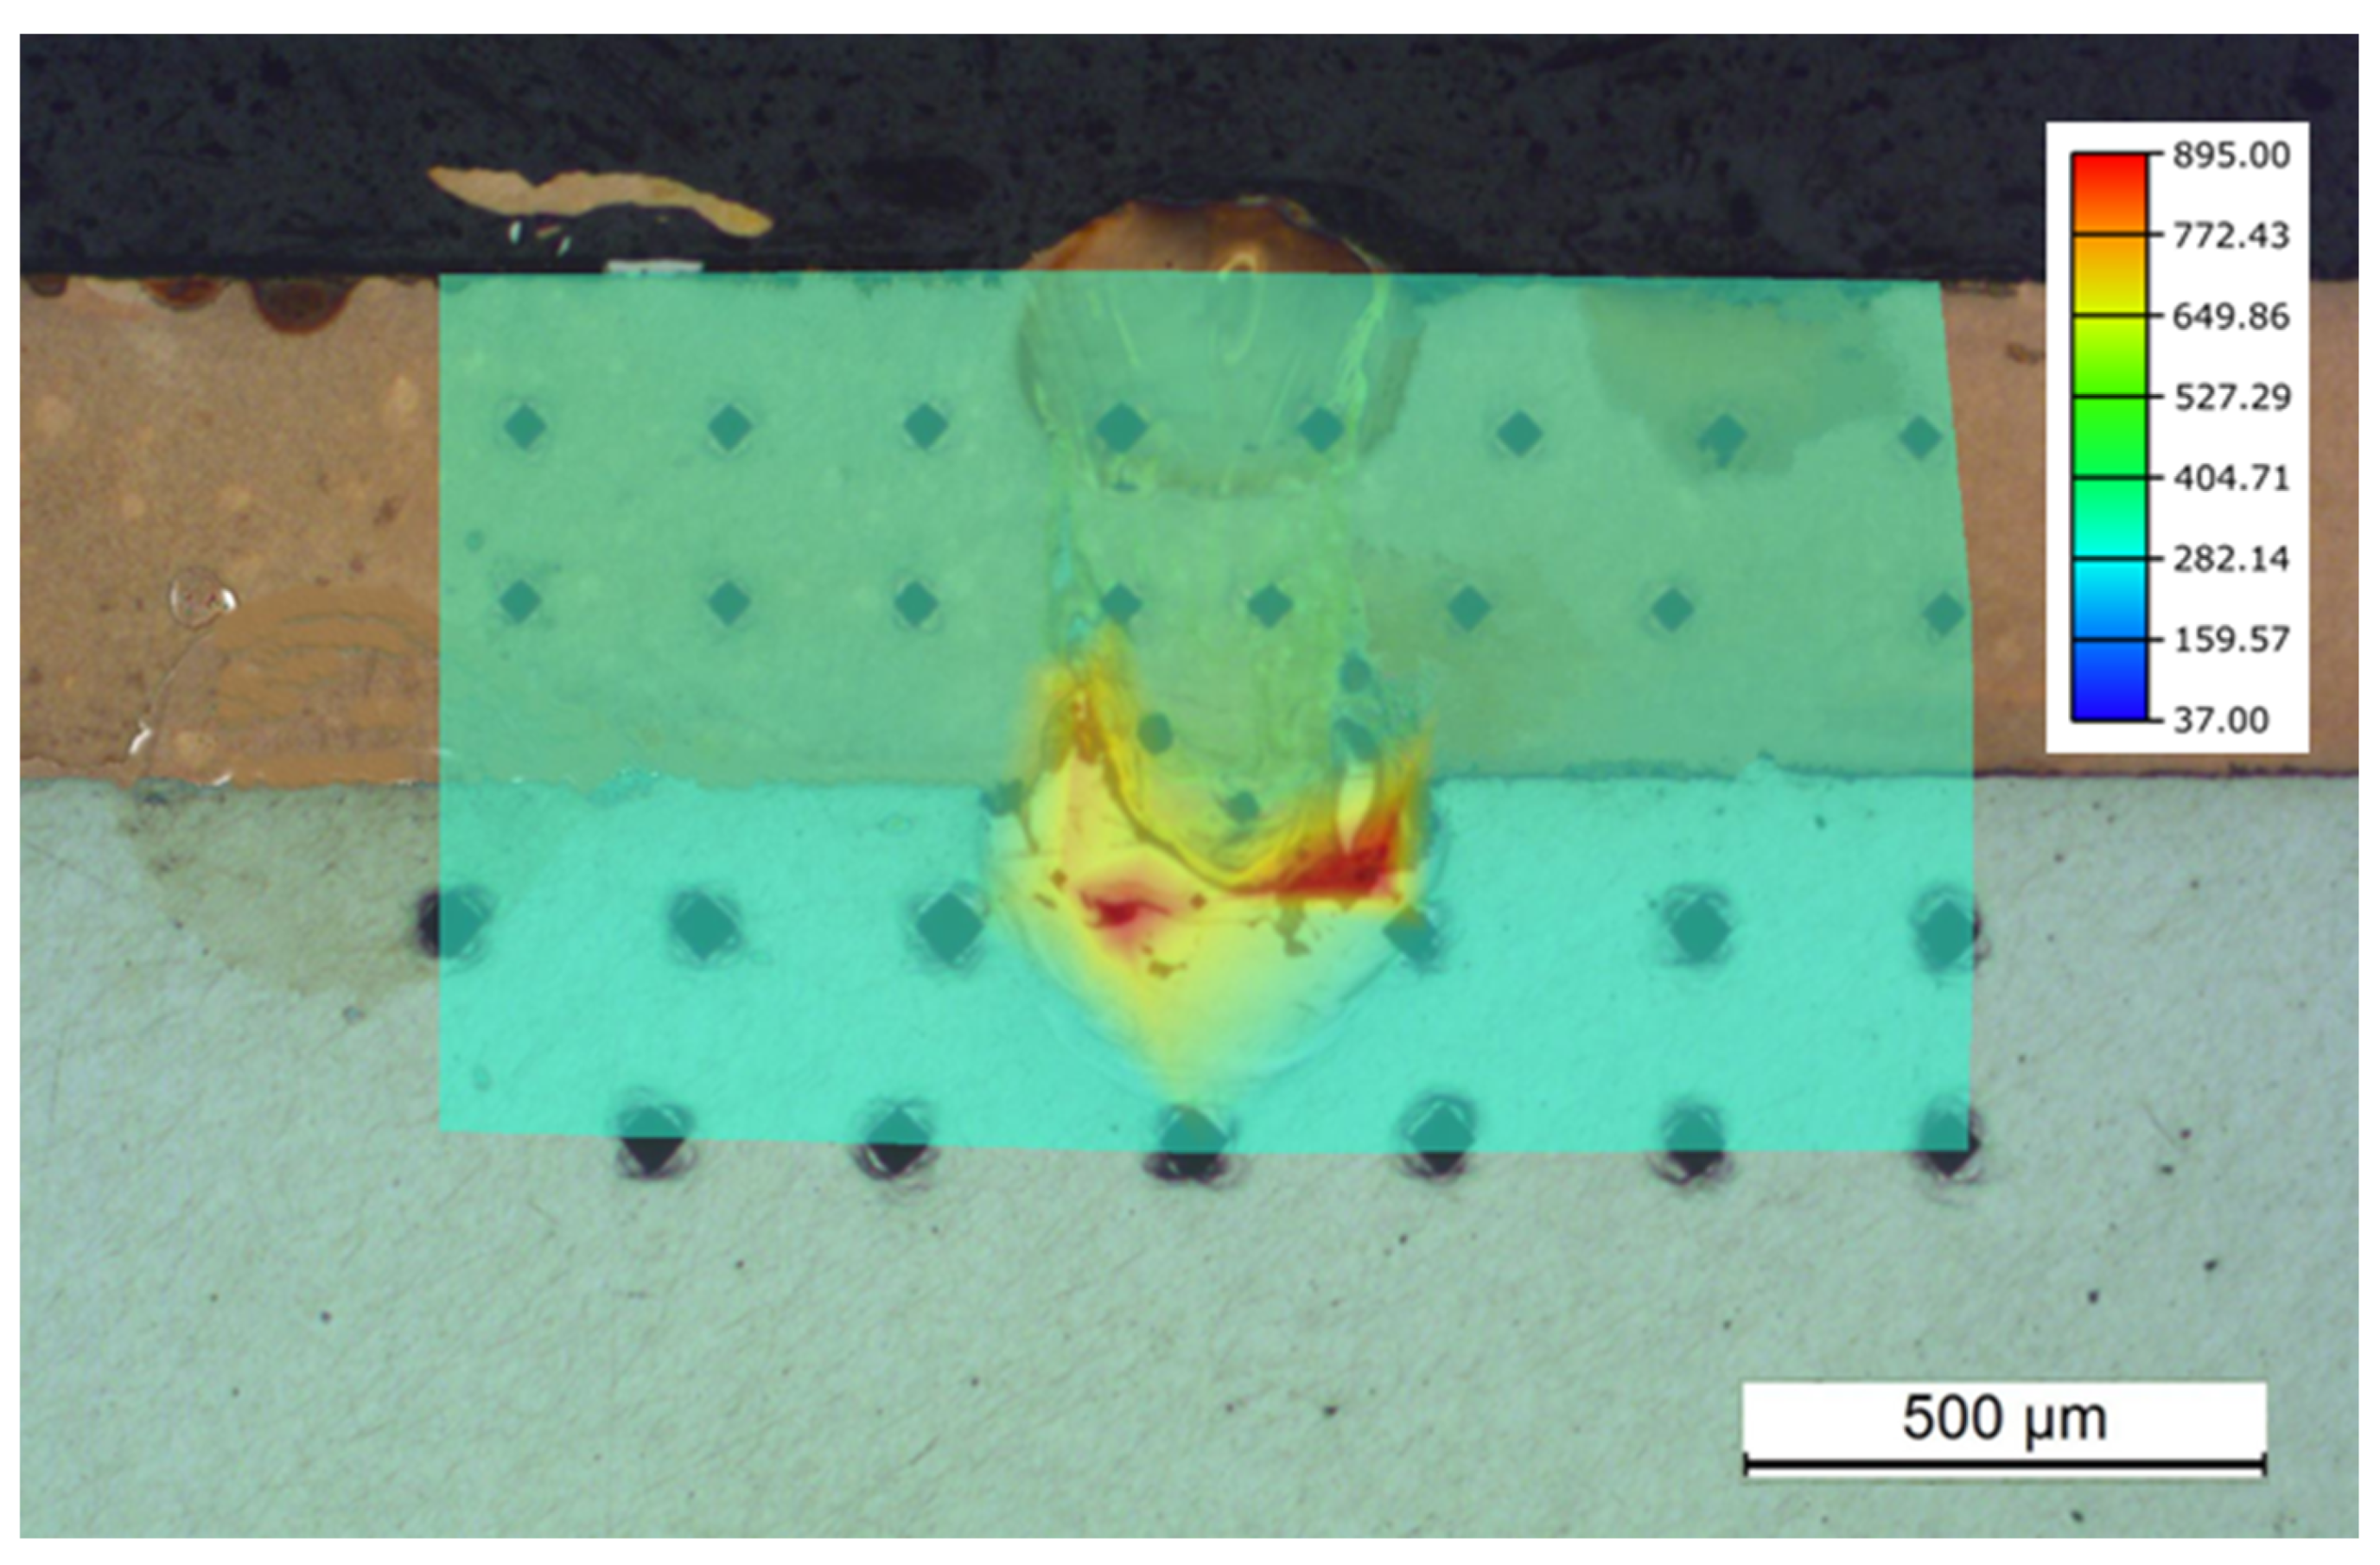
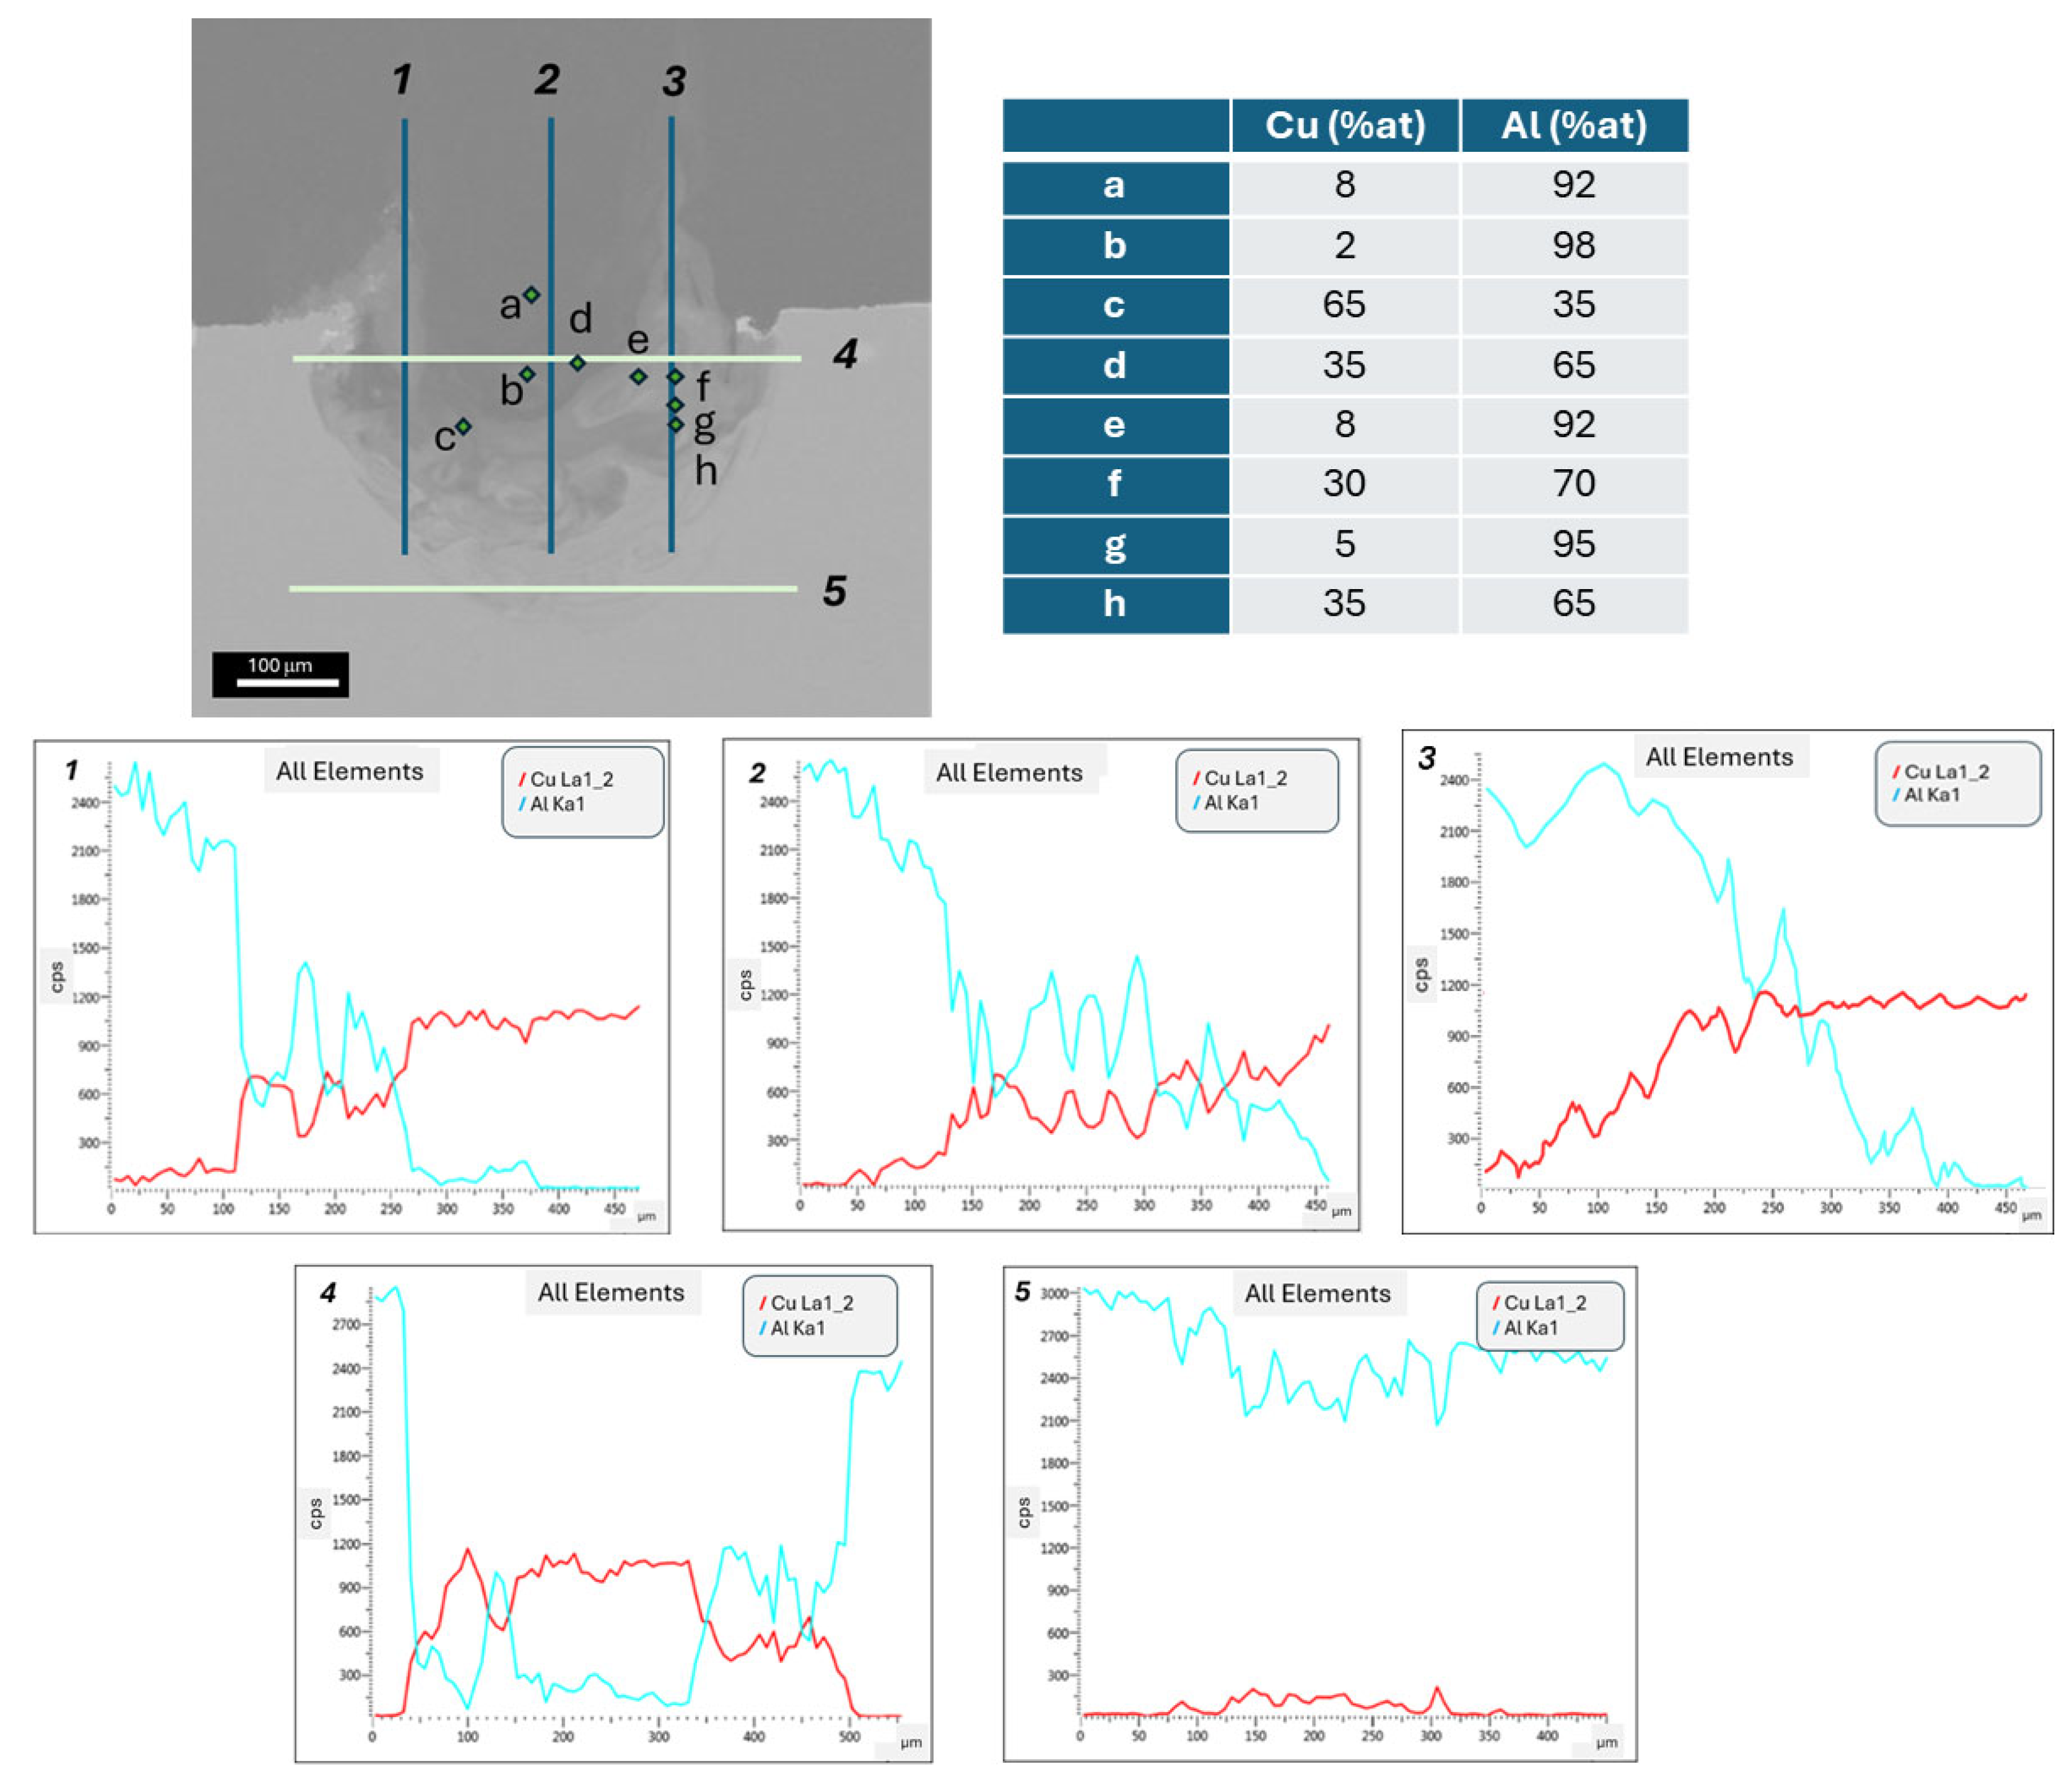
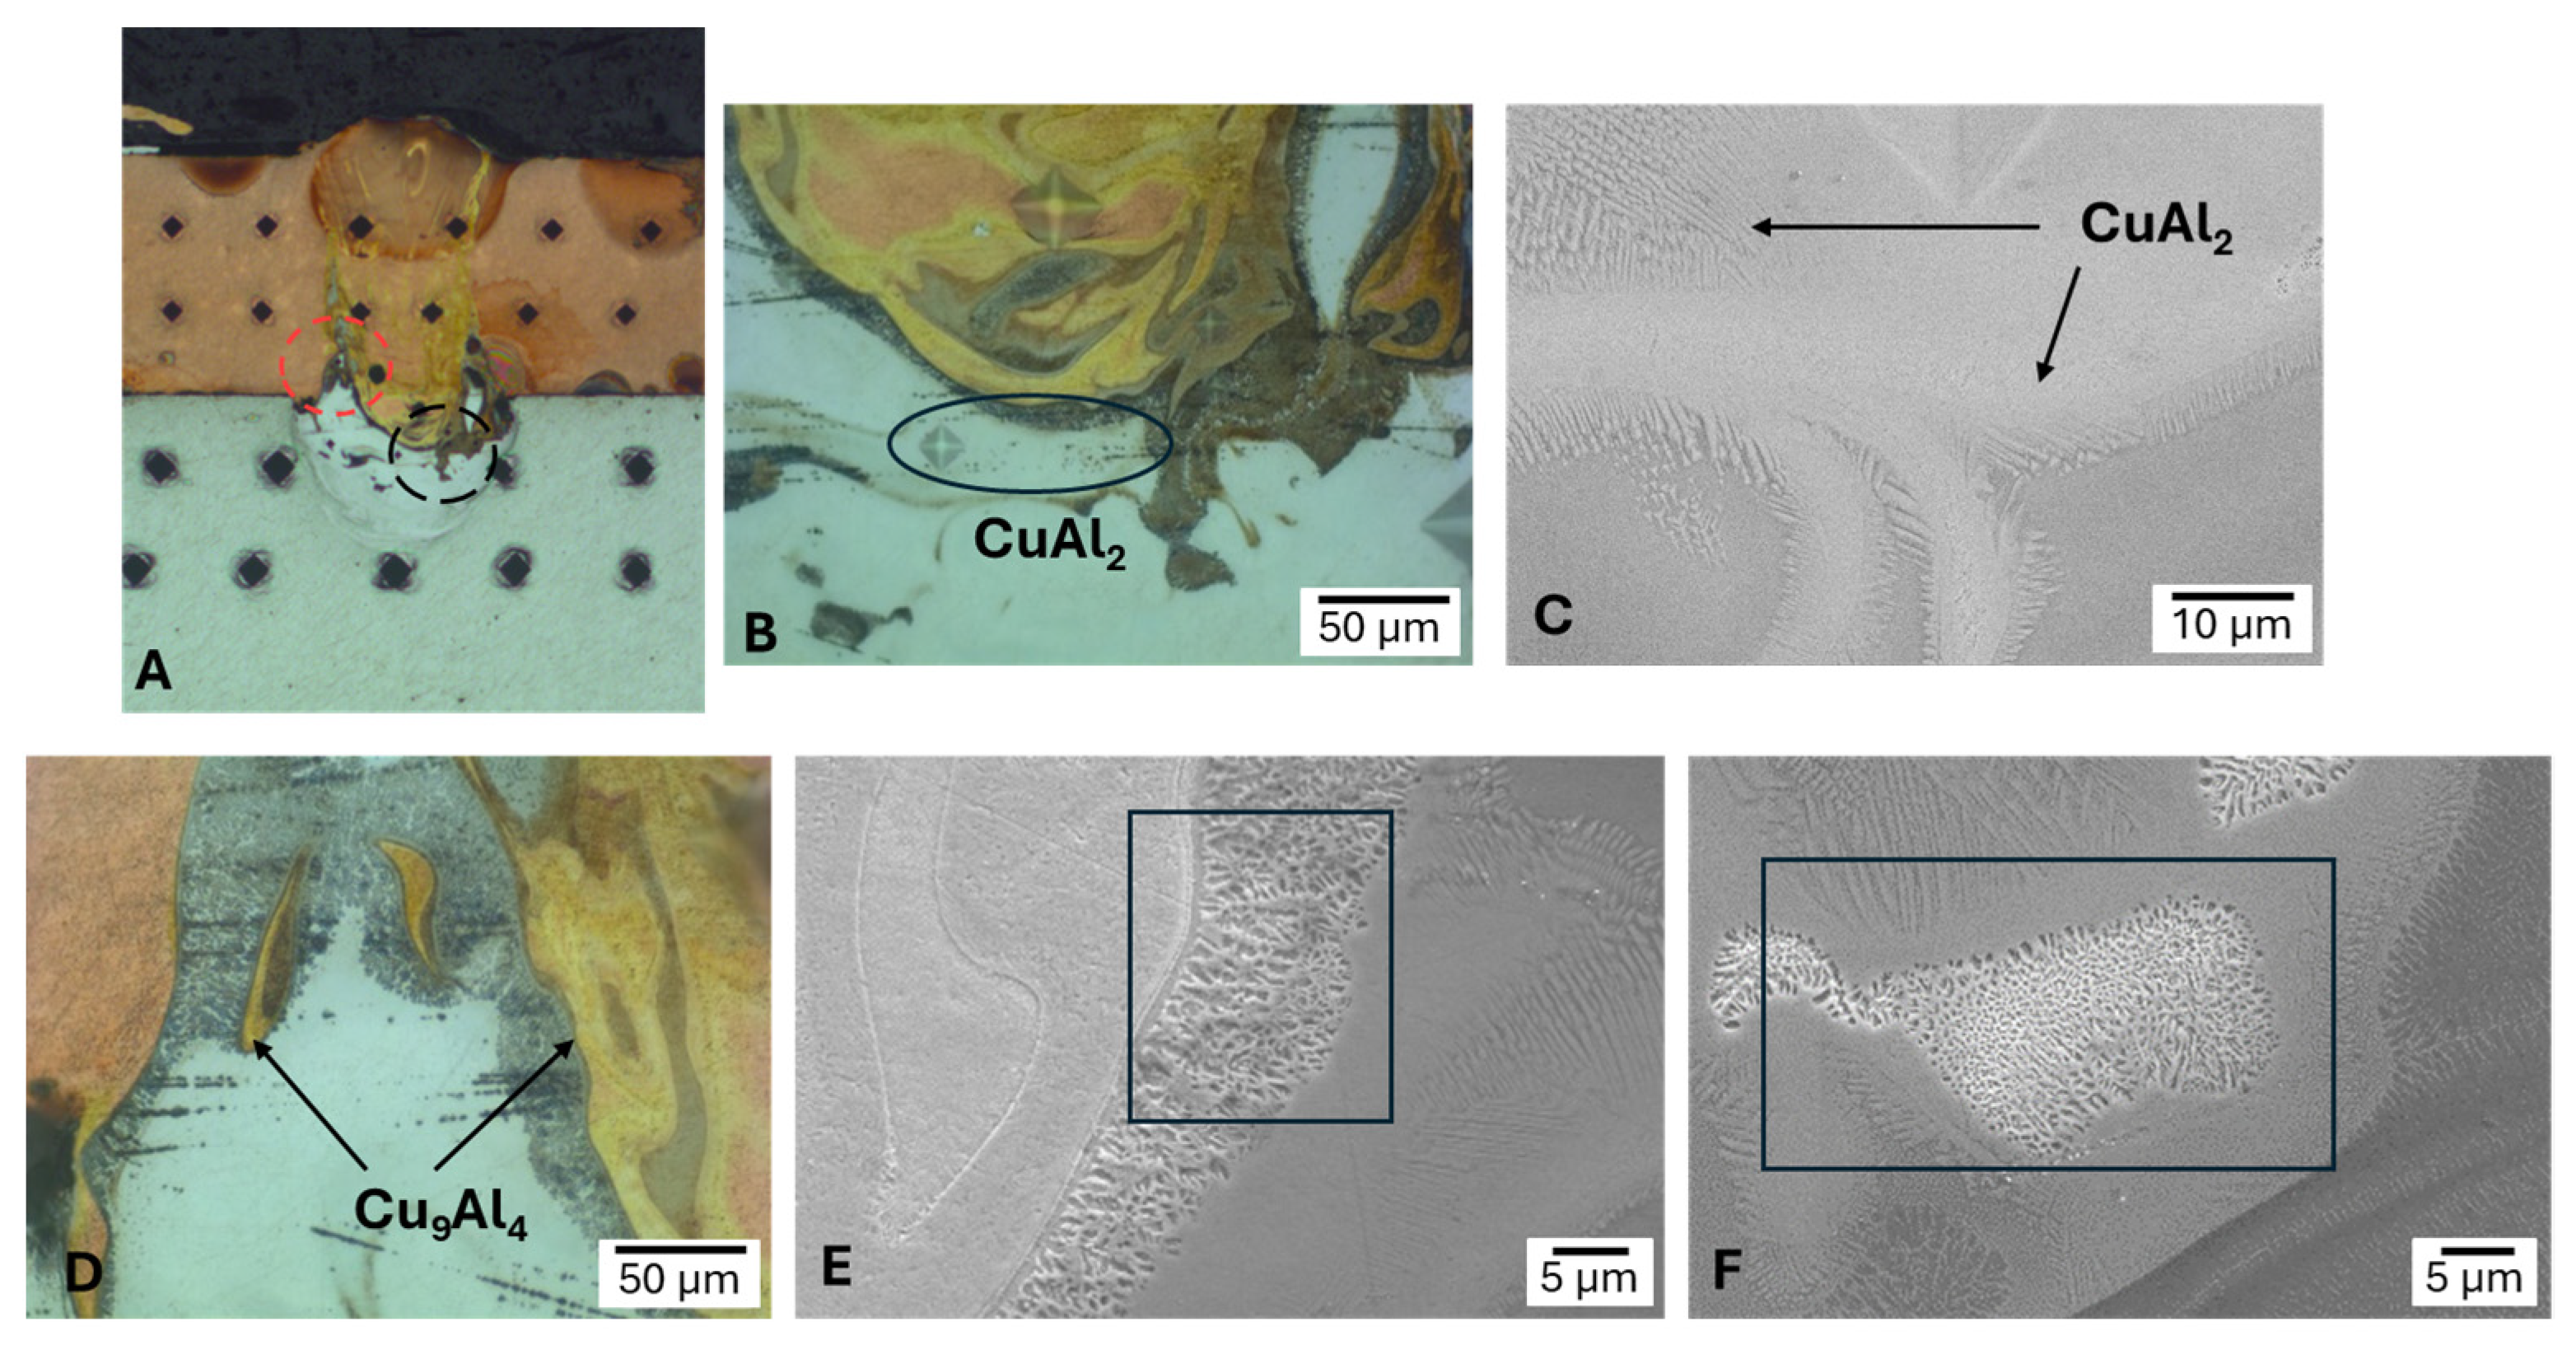
  • Al-Cu welding frequently formed intermetallic compounds, including Cu9Al4 and CuAl2, with complex structures and compositional variations ranging from 95 wt% copper to 5 wt% aluminum. A significant increase in hardness up to 900 HV at the weld interface was detected, which was attributed to the presence of these compounds.
  • The formation of defects such as porosity and cracking in the Al–Cu joints was primarily attributed to the significant differences in thermal properties between the two materials. These discrepancies result in uneven solidification rates, which induce thermal stress within the fusion zone, promoting crack formation. In addition, the brittle intermetallic phases formed compromise the mechanical performance of the weld, increasing susceptibility to cracking and weakening the metallurgical bond.

Author Contributions

Conceptualization, M.C.T. and M.C.; methodology, M.C.T. and R.G.; investigation, M.C.T., R.G. and E.A.; writing—original draft preparation, M.C.T. and M.C.; writing—review and editing, M.C.T. and M.C.; project administration, M.C.T.; funding acquisition, E.A. All authors have read and agreed to the published version of the manuscript.

Funding

This research was funded by the Economic Development, Sustainability and Environment Agency of the Basque Government through the program ‘ELKARTEK 2024’ project, grant number KK-2024/00113.

Data Availability Statement

Data will be made available on request.

Acknowledgments

The authors would like to express their gratitude to Iñigo Antero for his assistance in performing the laser welding experiments. The authors extend their thanks to Uxue Nafarrete for her expertise in preparing samples for microstructural analysis and Ivan Huarte for his expertise in laser welding methodology.

Conflicts of Interest

The authors declare no conflicts of interest.

Abbreviations

The following abbreviations are used in this manuscript:
IMCIntermetallic compounds
EVsElectrical Vehicles
LBWLaser Beam Welding
ARMAdjustable Ring Mode
HAZHeat affected zone

References

  1. Kumar, N.; Beaumont, R.; Gomez, J.S.; Harris, C.; Masters, I. A modelling approach for laser welding of busbars to lithium-ion prismatic cell terminals to enhance failure prediction. Opt. Laser Technol. 2024, 176, 110989. [Google Scholar] [CrossRef]
  2. Sadeghian, A.; Iqbal, N. A review on dissimilar laser welding of steel-copper, steel-aluminum, aluminum-copper, and steel-nickel for electric vehicle battery manufacturing. Opt. Laser Technol. 2022, 146, 107595. [Google Scholar] [CrossRef]
  3. Luan, B.L.; Campbell, G.; Gauthier, M.; Liu, X.Y.; Davidson, I.; Nagata, J.; Lépinay, M.; Bernier, F.; Argue, S. Surface Modification and Fabrication of Li-Ion Battery Components for Plug-In Hybrid Electric Vehicle. ECS Trans. 2010, 25, 59–71. [Google Scholar] [CrossRef]
  4. Brand, M.J.; Schmidt, P.A.; Zaeh, M.F.; Jossen, A. Welding techniques for battery cells and resulting electrical contact resistances. J. Energy Storage 2015, 1, 7–14. [Google Scholar] [CrossRef]
  5. Kah, P.; Rajan, R.; Martikainen, J.; Suoranta, R. Investigation of weld defects in friction-stir welding and fusion welding of aluminium alloys. Int. J. Mech. Mater. Eng. 2015, 10, 26. [Google Scholar] [CrossRef]
  6. Huang, Y.; Fleming, T.G.; Clark, S.J.; Marussi, S.; Fezzaa, K.; Thiyagalingam, J.; Leung, C.L.A.; Lee, P.D. Keyhole fluctuation and pore formation mechanisms during laser powder bed fusion additive manufacturing. Nat. Commun. 2022, 13, 1170. [Google Scholar] [CrossRef]
  7. Rakhi, K.; Kang, S.; Shin, J. Hot-Cracking Mechanism of Laser Welding of Aluminum Alloy 6061 in Lap Joint Configuration. Materials 2023, 16, 6426. [Google Scholar] [CrossRef]
  8. Jiang, M.; Chen, X.; Chen, Y.; Tao, W. Mitigation of porosity defects in fiber laser welding under low vacuum. J. Mech. Work. Technol. 2020, 276, 116385. [Google Scholar] [CrossRef]
  9. Chludzinski, M.; dos Santos, R.E.; Churiaque, C.; Ortega-Iguña, M.; Sánchez-Amaya, J.M. Pulsed laser welding applied to metallic materials—A material approach. Metals 2021, 11, 640. [Google Scholar] [CrossRef]
  10. Cha, J.H.; Choi, H.W. Characterization of dissimilar aluminum-copper material joining by controlled dual laser beam. Int. J. Adv. Manuf. Technol. 2021, 119, 1909–1920. [Google Scholar] [CrossRef]
  11. Sun, T.; Mohan, A.; Liu, C.; Franciosa, P.; Ceglarek, D. The impact of Adjustable-Ring-Mode (ARM) laser beam on the microstructure and mechanical performance in remote laser welding of high strength aluminium alloys. J. Mater. Res. Technol. 2022, 21, 2247–2261. [Google Scholar] [CrossRef]
  12. Jabar, S.; Sun, T.; Franciosa, P.; Kotadia, H.R.; Ceglarek, D.; Paolini, B.; Faulhaber, R. Effect of a ring-shaped laser beam on the weldability of aluminum-to-hilumin for battery tab connectors. J. Laser Appl. 2023, 35, 042038. [Google Scholar] [CrossRef]
  13. Wang, Z.; Oliveira, J.; Zeng, Z.; Bu, X.; Peng, B.; Shao, X. Laser beam oscillating welding of 5A06 aluminum alloys: Microstructure, porosity and mechanical properties. Opt. Laser Technol. 2019, 111, 58–65. [Google Scholar] [CrossRef]
  14. Haboudou, A.; Peyre, P.; Vannes, A.B. Study of keyhole and melt pool oscillations in dual beam welding of aluminium alloys effect on porosity formation. In Proceedings of the First International Symposium on High-Power Laser Macroprocessing, Osaka, Japan, 27–31 May 2002. [Google Scholar]
  15. Harati, E.; Kah, P. Laser welding of aluminum battery tab to variable Al/Cu busbars in Li-ion battery joint. AIMS Mater. Sci. 2022, 9, 884–918. [Google Scholar] [CrossRef]
  16. Solchenbach, T.; Plapper, P.; Cai, W. Electrical performance of laser braze-welded aluminum–copper interconnects. J. Manuf. Process. 2014, 16, 183–189. [Google Scholar] [CrossRef]
  17. Lee, S.J.; Nakamura, H.; Kawahito, Y.; Katayama, S. Effect of welding speed on microstructural and mechanical properties of laser lap weld joints in dissimilar Al and Cu sheets. Sci. Technol. Weld. Join. 2014, 19, 111–118. [Google Scholar] [CrossRef]
  18. Kumar, N.; Masters, I.; Das, A. In-depth evaluation of laser-welded similar and dissimilar material tab-to-busbar electrical interconnects for electric vehicle battery pack. J. Manuf. Process. 2021, 70, 78–96. [Google Scholar] [CrossRef]
  19. Dimatteo, V.; Ascari, A.; Liverani, E.; Fortunato, A. Experimental investigation on the effect of spot diameter on continuous-wave laser welding of copper and aluminum thin sheets for battery manufacturing. Opt. Laser Technol. 2022, 145, 107495. [Google Scholar] [CrossRef]
  20. Bunaziv, I.; Akselsen, O.M.; Ren, X.; Nyhus, B.; Eriksson, M.; Gulbrandsen-Dahl, S. A review on laser-assisted joining of aluminium alloys to other metals. Metals 2021, 11, 1680. [Google Scholar] [CrossRef]
  21. Zuo, D.; Hu, S.; Shen, J.; Xue, Z. Intermediate layer characterization and fracture behavior of laser-welded copper/aluminum metal joints. Mater. Des. 2014, 58, 357–362. [Google Scholar] [CrossRef]
  22. Sanati, S.; Nabavi, S.F.; Esmaili, R.; Farshidianfar, A. Laser Wobble Welding Process: A Review on Metallurgical, Mechanical, and Geometrical Characteristics and Defects. Lasers Manuf. Mater. Process. 2024, 11, 743–780. [Google Scholar] [CrossRef]
  23. Feng, J.; Zhang, P.; Yan, H.; Shi, H.; Lu, Q.; Liu, Z.; Wu, D.; Sun, T.; Li, R.; Wang, Q. Application of Laser Welding in Electric Vehicle Battery Manufacturing: A Review. Coatings 2023, 13, 1313. [Google Scholar] [CrossRef]
  24. Lee, S.-J.; Choi, K.-D.; Lee, S.-J.; Shin, D.-S.; Jung, J.-P. Welding Properties of Dissimilar Al-Cu Thin Plate by a Single-Mode Fiber Laser. Metals 2022, 12, 1957. [Google Scholar] [CrossRef]
Figure 1. Schematic illustration of welding samples, where the black line represents the welding path (circle diameter 12 mm) and the welding direction has been indicated.
Metals 15 00547 g001
Figure 2. Standardized Pareto chart (A) and parameters response (B) for interface width of Al-Al joints.
Metals 15 00547 g002
Figure 3. Standardized Pareto chart (A) and parameters response (B) for penetration of Al-Al joints.
Metals 15 00547 g003
Figure 4. Macrographs of Al-Al joints: 6 (A), 10 (B), 16 (C), and 25 (D).
Metals 15 00547 g004
Figure 5. Microhardness profiles of the Al-Al joints: 6 (A), 10 (B), 16 (C), and 25 (D).
Metals 15 00547 g005
Figure 6. IPF maps of the as-received AA1050 with 0.5 mm (A) and 1.5 mm (B).
Metals 15 00547 g006
Figure 7. IPF maps of specimens 6 (A) and 16 (B).
Metals 15 00547 g007
Figure 8. Grain size measurements of the joints and entire samples.
Metals 15 00547 g008
Figure 9. Standardized Pareto chart (A) and parameters response for interface width (B). Standardized Pareto chart (C) and parameters response for penetration (D) of Al-Cu joints.
Metals 15 00547 g009
Figure 10. Macrographs of the selected specimens of the Al-Cu joints: 2 (A), 4 (B), 5 (C), 6 (D), 11 (E), and 13 (F). Black arrows indicate the pores and white arrow cracks.
Metals 15 00547 g010
Figure 11. EDS maps of sample 2 showing the Al (A) and Cu (B) elements.
Metals 15 00547 g011
Figure 12. Microhardness map of sample 2.
Metals 15 00547 g012
Figure 13. Chemical analysis of sample 2.
Metals 15 00547 g013
Figure 14. Optical and SEM images of sample 2 showing the microstructures generated. In (A), the macrograph indicates the area from which images (B,C) were taken, indicated by a black circle, and the area corresponding to images (DF) is marked with a red circle.
Metals 15 00547 g014
Table 1. Chemical composition of AA1050 and C11000 alloys.
Chemical Composition (wt %)
AA1050
H24
AlSiFeCuMnMgZnTiOthers
1.5 mm99.500.1010.2750.0010.030.0010.030.0110.001
0.5 mm99.500.1100.2000.0300.0300.0300.0400.010-
C110000.3 mmCuBiOPbOthers
99.9000.00050.04000.00500.0300
Table 2. Properties of the Al and Cu alloys used in this study (T = 20 °C).
Properties AA1050C11000
Density (g/cm3)2.78.9
Absorptivity (λ ≈ 1 μm) (%)≈7≈3
Fusion Temperature (°C)6601083
Electrical Conductivity (MS/m)34–3657
Thermal Conductivity (W/m·K−1)210–220394
Coefficient of thermal expansion (10−6·K−1)2417
Table 3. Characteristics of the fiber laser system.
Laser Source
Fiber Laser High Light FL 6000 ARM 2 + 4, Coherent
Wavelength1070 nm
Maximum Core Power2 kW
Optical Fiber Diameter (Core)50 µm
Maximum Ring Power4 kW
Optical Fiber Diameter (Ring)200 µm
Scanner
2D scanner Scansonic RLW-S
Focal distance400 mm
Collimated distance200 mm
Table 4. Levels of the process parameter applied on the Al-Al and Al-Cu overlap joints.
LevelIIIIII
Al-Al
Core Power (kW)0.81.01.2
Ring Power (kW)1.01.31.6
Wobbling Amplitude (mm)0.00.10.2
Welding Speed (m/min)12.015.018.0
Al-Cu
Core Power (kW)1.51.752.0
Ring Power (kW)3.03.54.0
Welding Speed (m/min)30.035.040.0
Table 5. Process parameters applied on the selected joint welded with Al-Al.
JointCore Power
(kW)
Ring Power
(kW)
Speed
(m/min)
Wobbling Amplitude
(mm)
Interface Width (mm)Penetration (mm)
61.01.3180.00.41 ± 0.010.84 ± 0.01
101.21.3150.00.54 ± 0.011.23 ± 0.03
161.01.6180.10.45 ± 0.060.87 ± 0.04
251.01.3150.10.50 ± 0.010.89 ± 0.13
Table 6. Grain size and KAM measurements of the as-received AA1050.
AA1050Mean Intercept Length (µm)KAM (°)
0.5 mm4.592.07
1.5 mm3.752.14
Table 7. Laser process parameters and dimensional characteristics of Al-Cu joints.
JointCore Power
(kW)
Core Ring
(kW)
Speed
(m/min)
Interface Width
(mm)
Penetration (mm)
223350.51 ± 0.010.34 ± 0.01
423350.56 ± 0.050.38 ± 0.05
51.53.5300.41 ± 0.060.17 ± 0.06
623.5300.63 ± 0.010.42 ± 0.01
111.753400.30 ± 0.040.07 ± 0.01
131.753.5350.41 ± 0.070.21 ± 0.08
Disclaimer/Publisher’s Note: The statements, opinions and data contained in all publications are solely those of the individual author(s) and contributor(s) and not of MDPI and/or the editor(s). MDPI and/or the editor(s) disclaim responsibility for any injury to people or property resulting from any ideas, methods, instructions or products referred to in the content.

