


Application of Bayesian Statistics in Analyzing and Predicting Carburizing-Induced Dimensional Changes in Torsion Bars


Abstract
1. Introduction
2. Fundamentals of Bayesian Theory
2.1. Basics of Bayesian Statistics
- is the posterior probability, representing the updated belief about the parameter θ after observing data D.
- is the likelihood, representing the probability of observing data D given the parameter θ.
- is the prior probability, representing the initial belief about the parameter θ before observing the data.
- is the marginal likelihood or evidence, which normalizes the posterior distribution and ensures that it sums to one.
2.2. Prior Distribution
2.3. Likelihood Function
2.4. Posterior Distribution
- (1)
- Determine the likelihood function based on the observed data and the assumed model.
- (2)
- Combine the likelihood with the prior distribution.
- (3)
- Divide by the marginal likelihood to ensure the posterior distribution integrates to one.
2.5. Example Calculation
- (1)
- Posterior Mean (μn):
- (2)
- Posterior Variance (σ2):
3. Application of Bayesian Statistics in Predicting Carburizing Distortion
3.1. Material and Sample Preparation
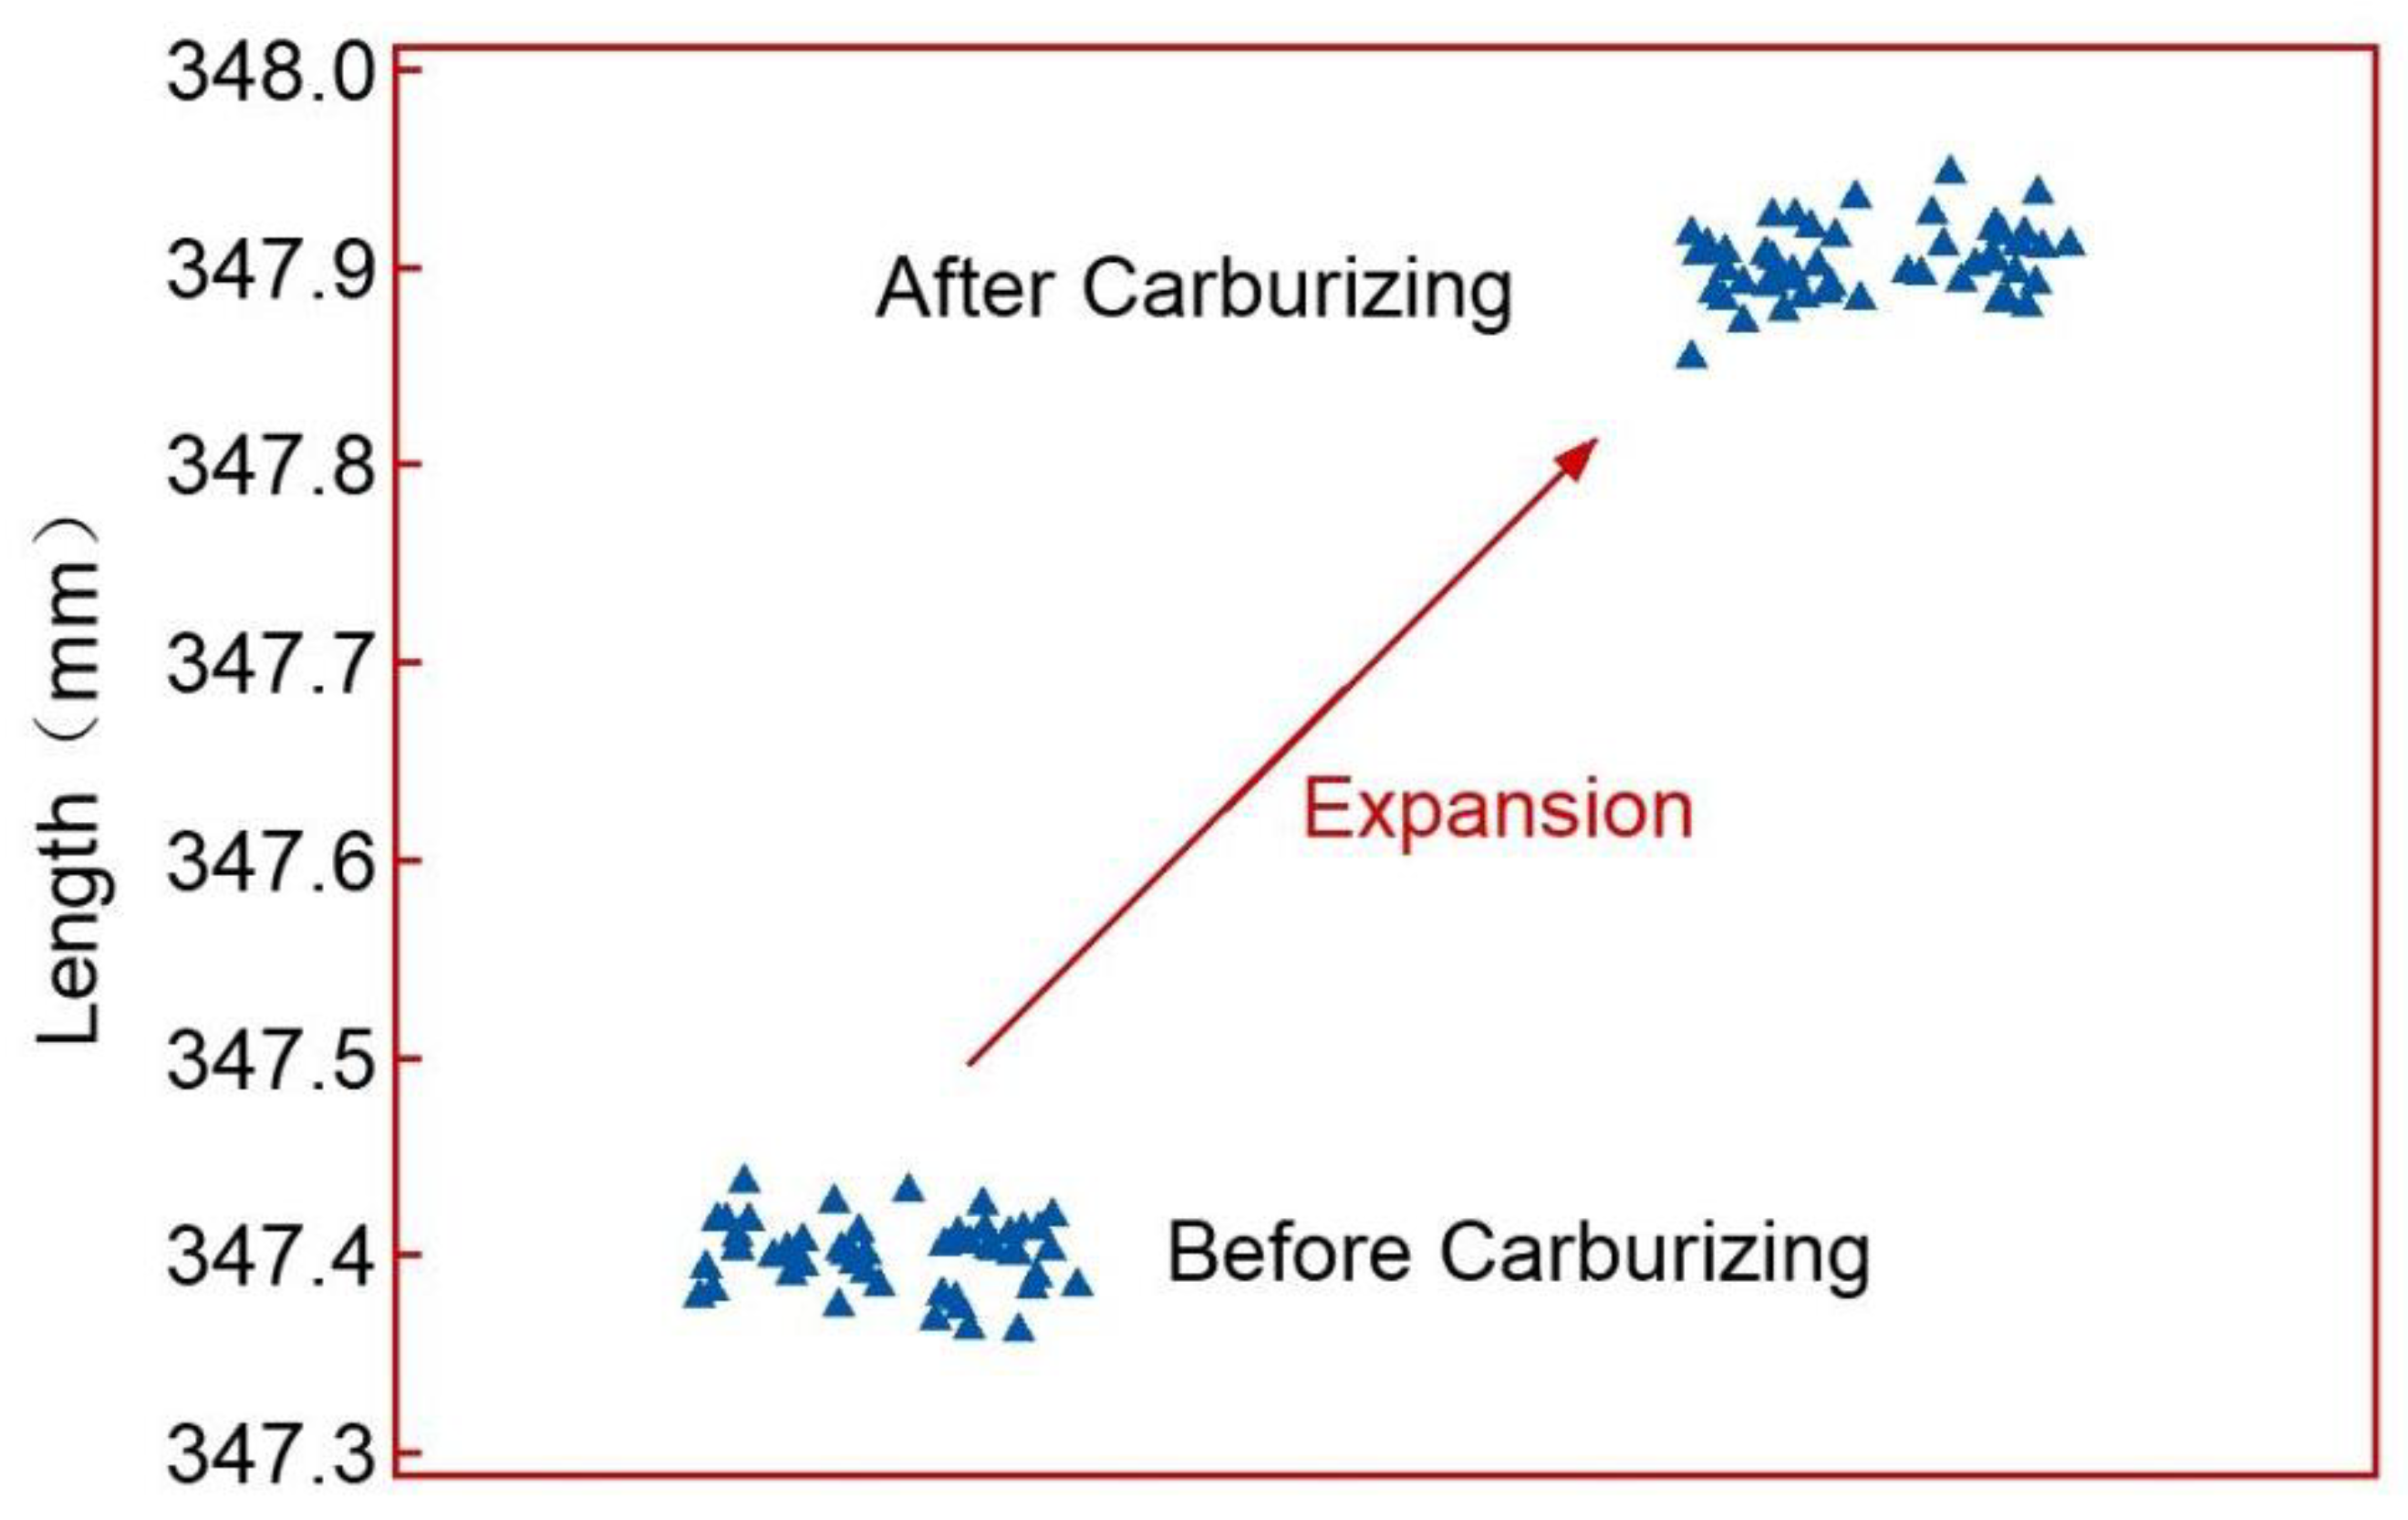
3.2. Dimensional Analysis Before and After Carburizing
- (1)
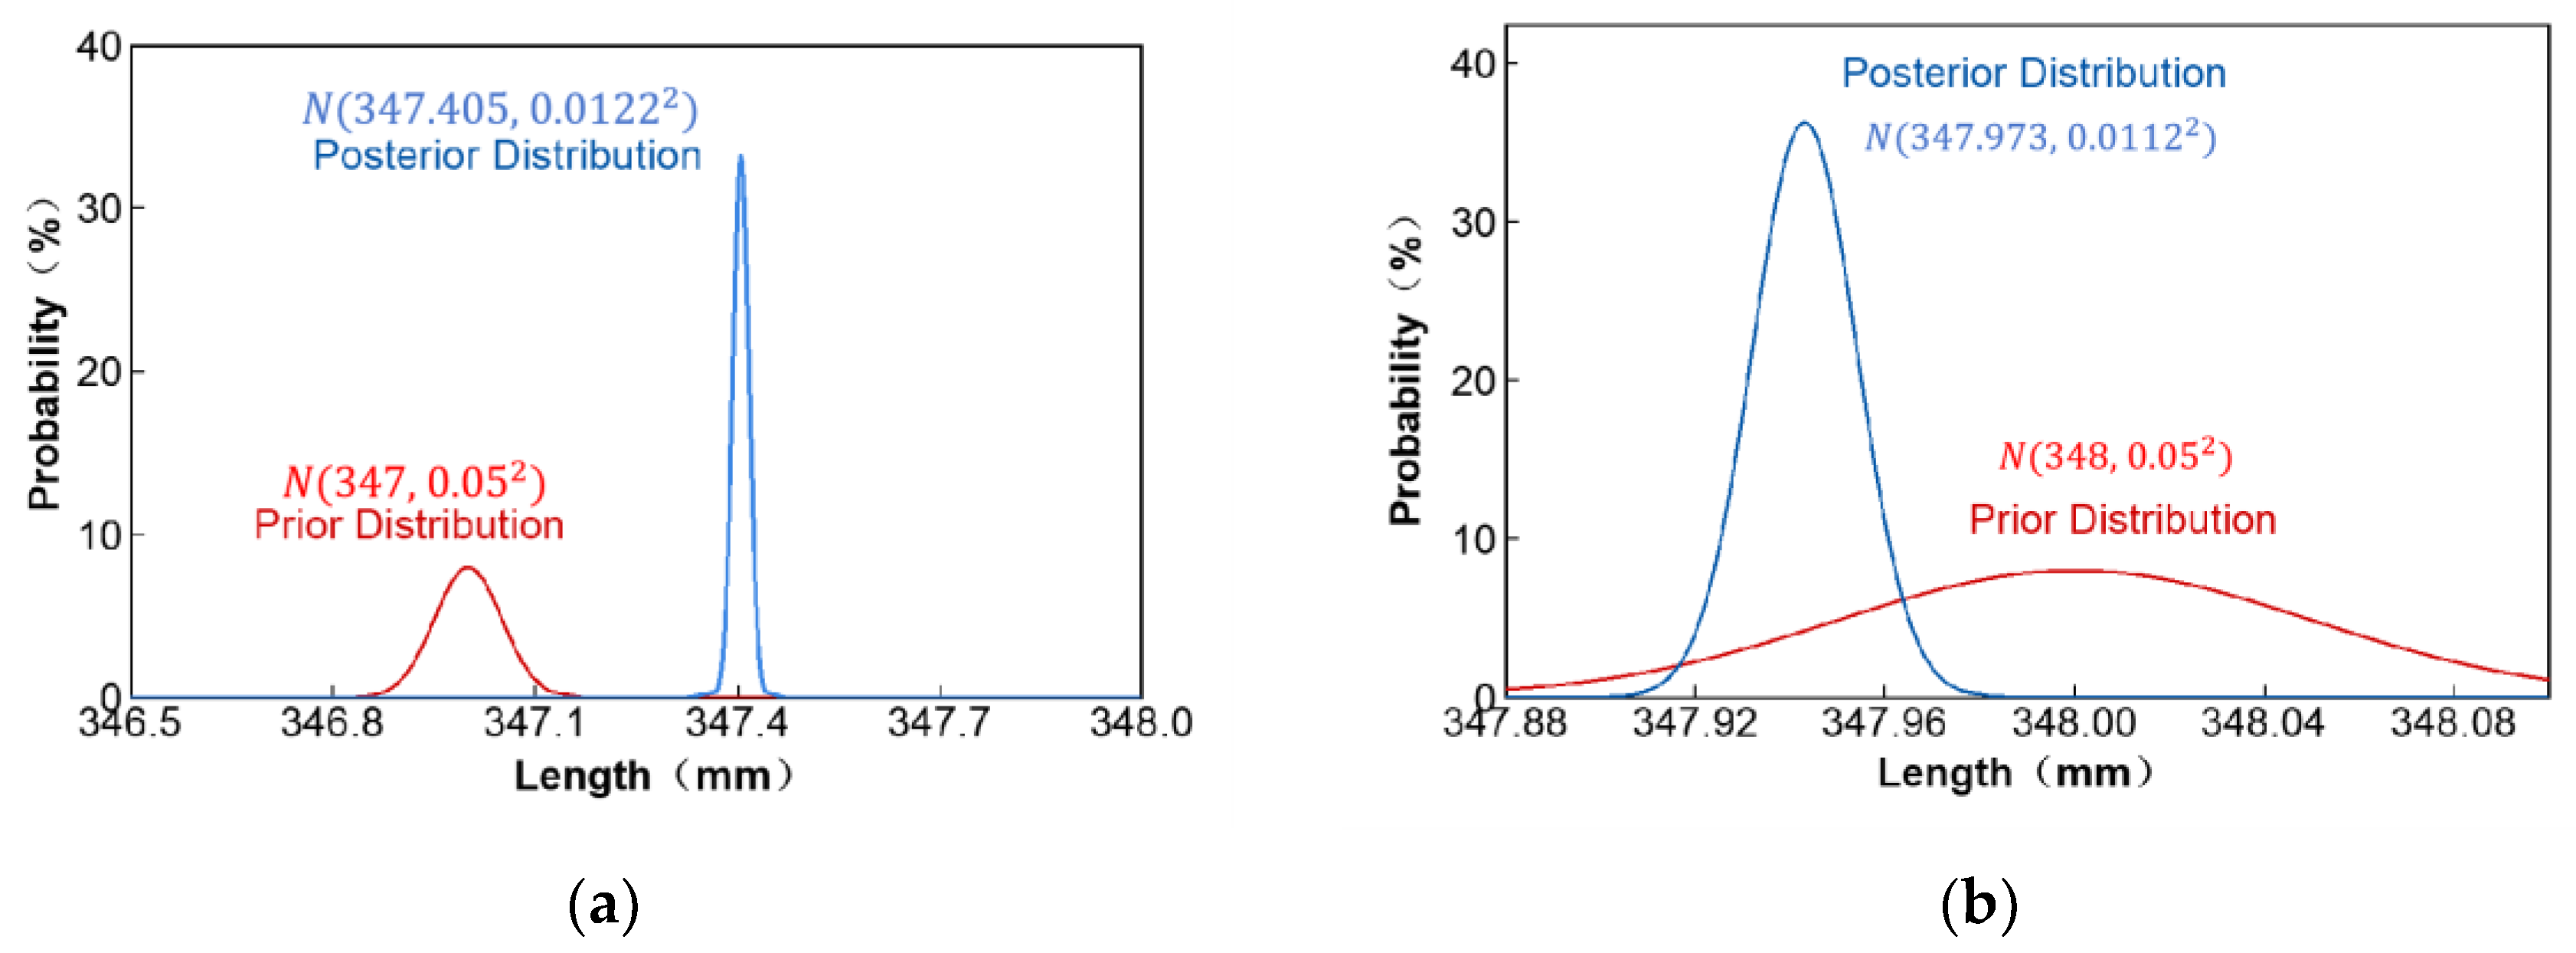
- Prior Distribution:
- (2)
- Likelihood Function:
- (3)
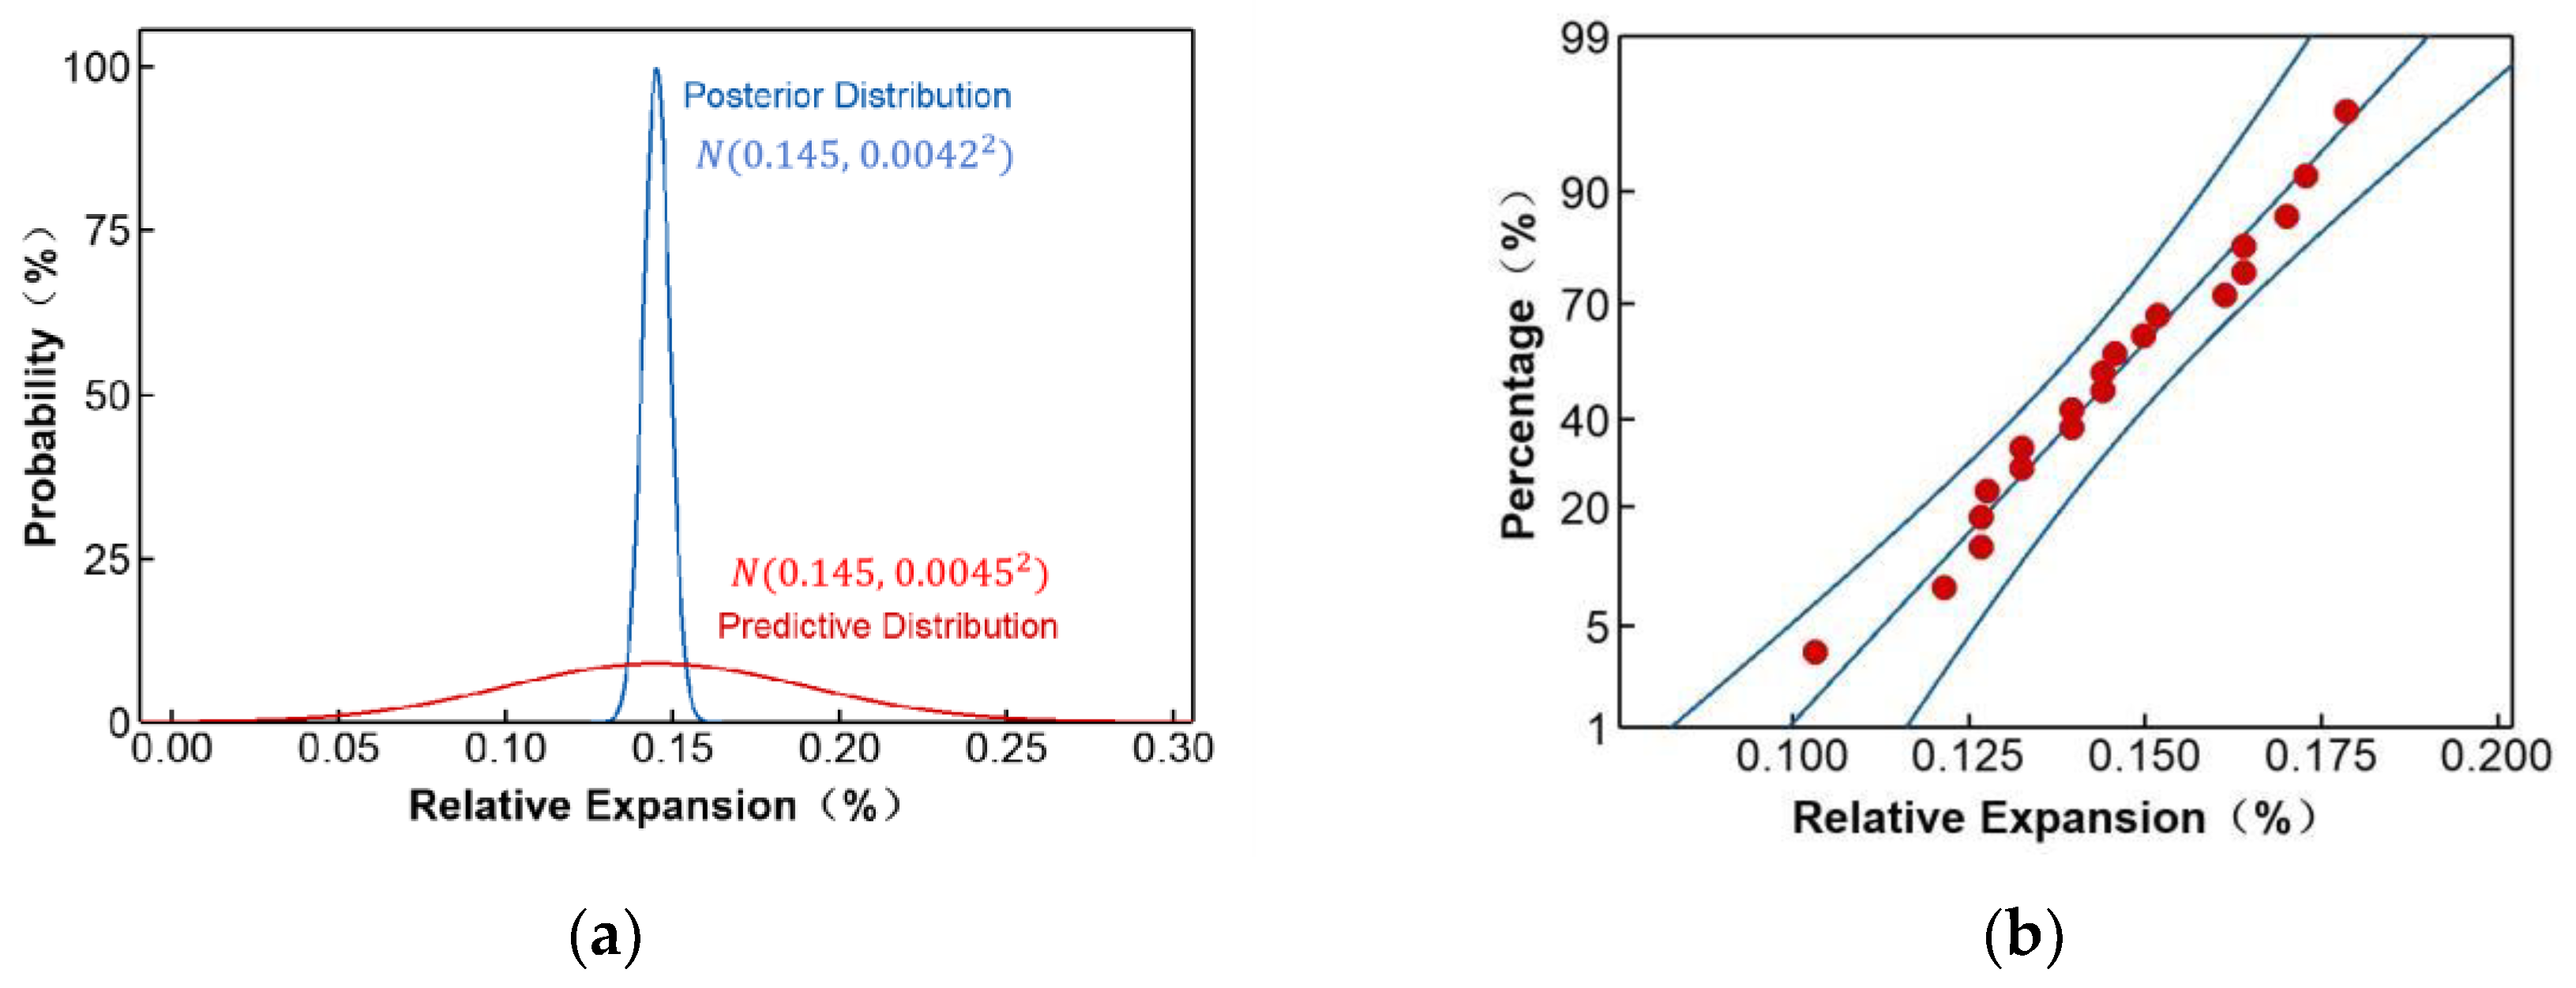
- Posterior Distribution: The posterior distribution of θ given D is also a normal distribution, obtained by combining the prior and the likelihood:
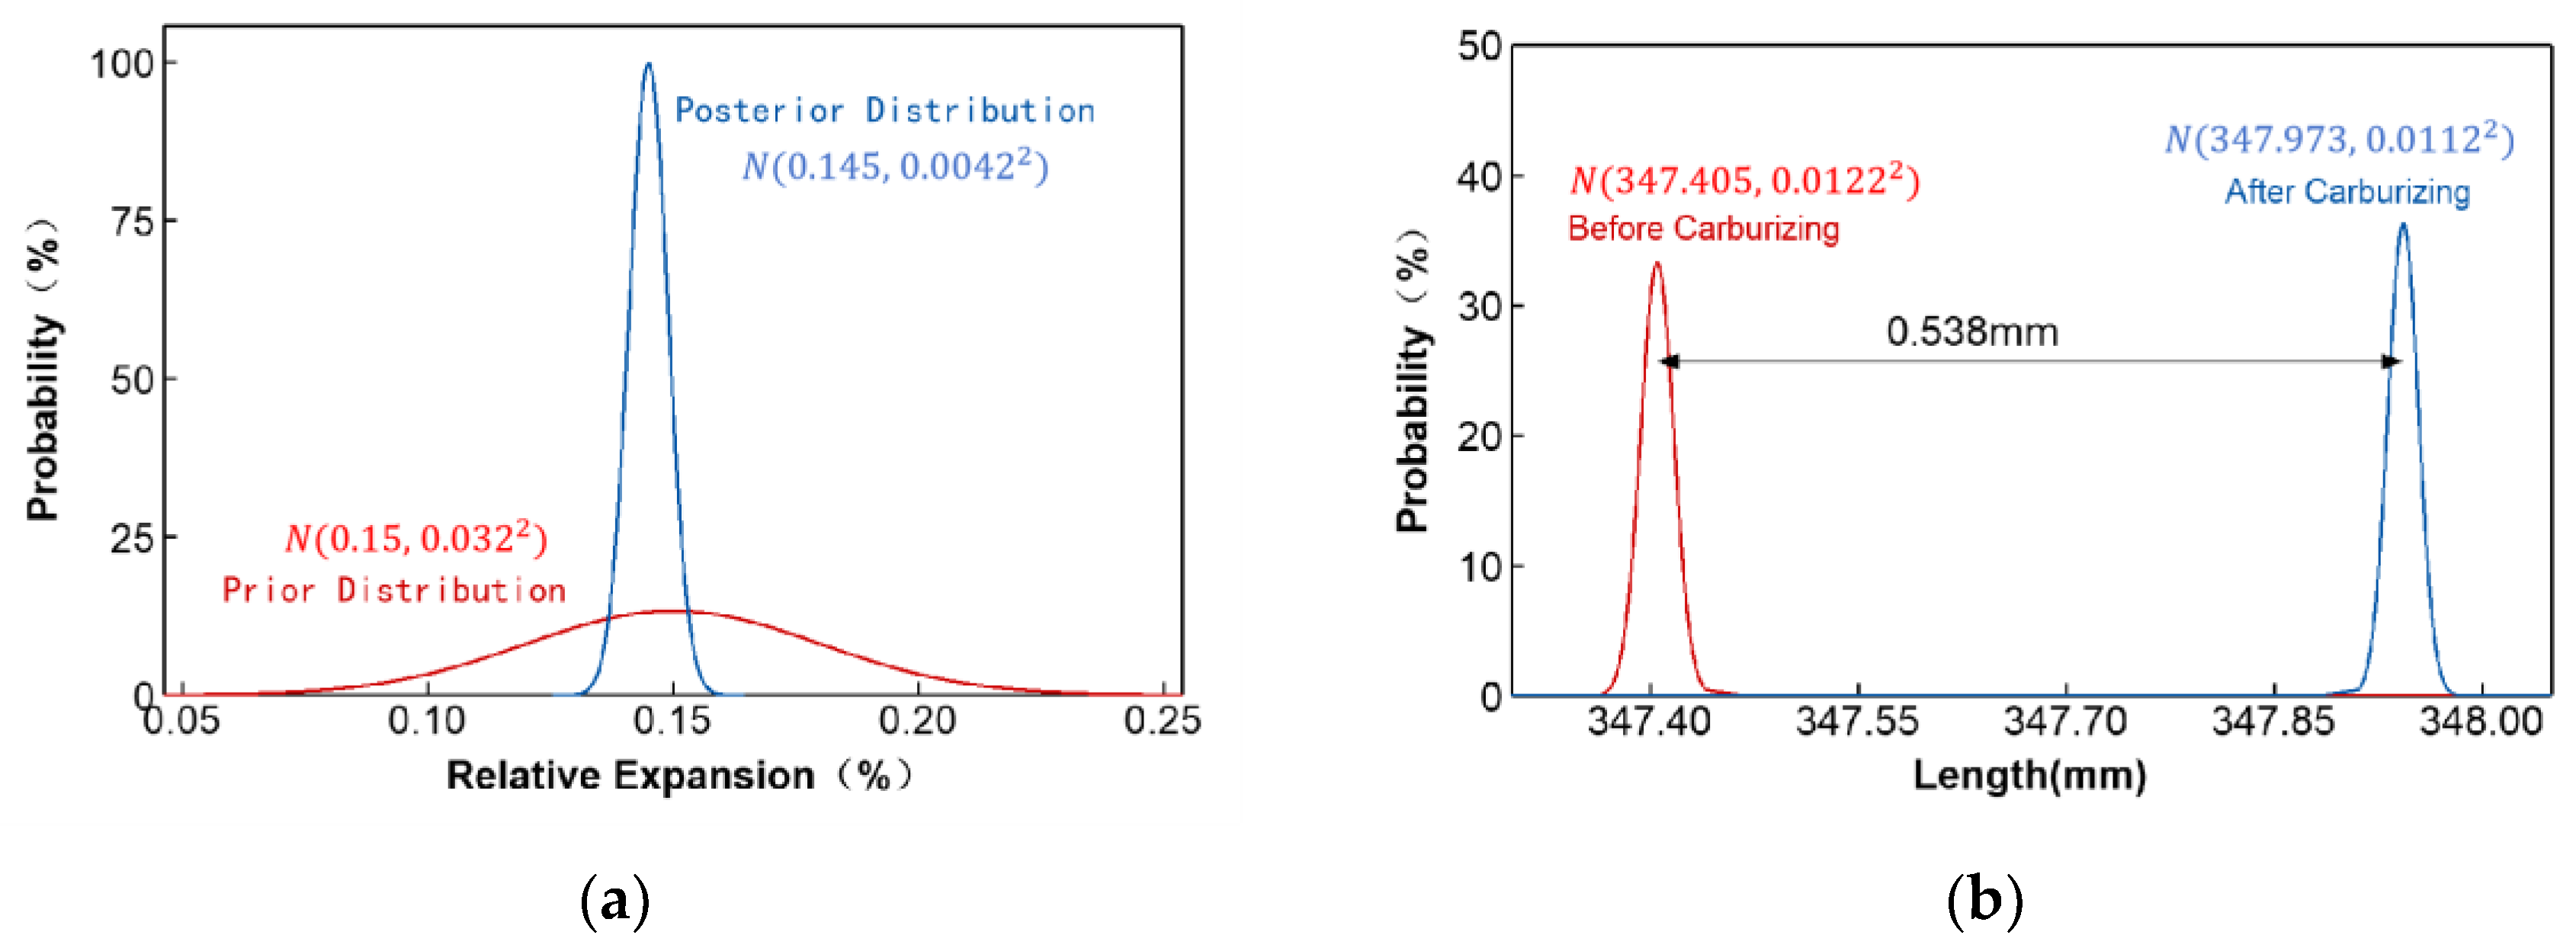
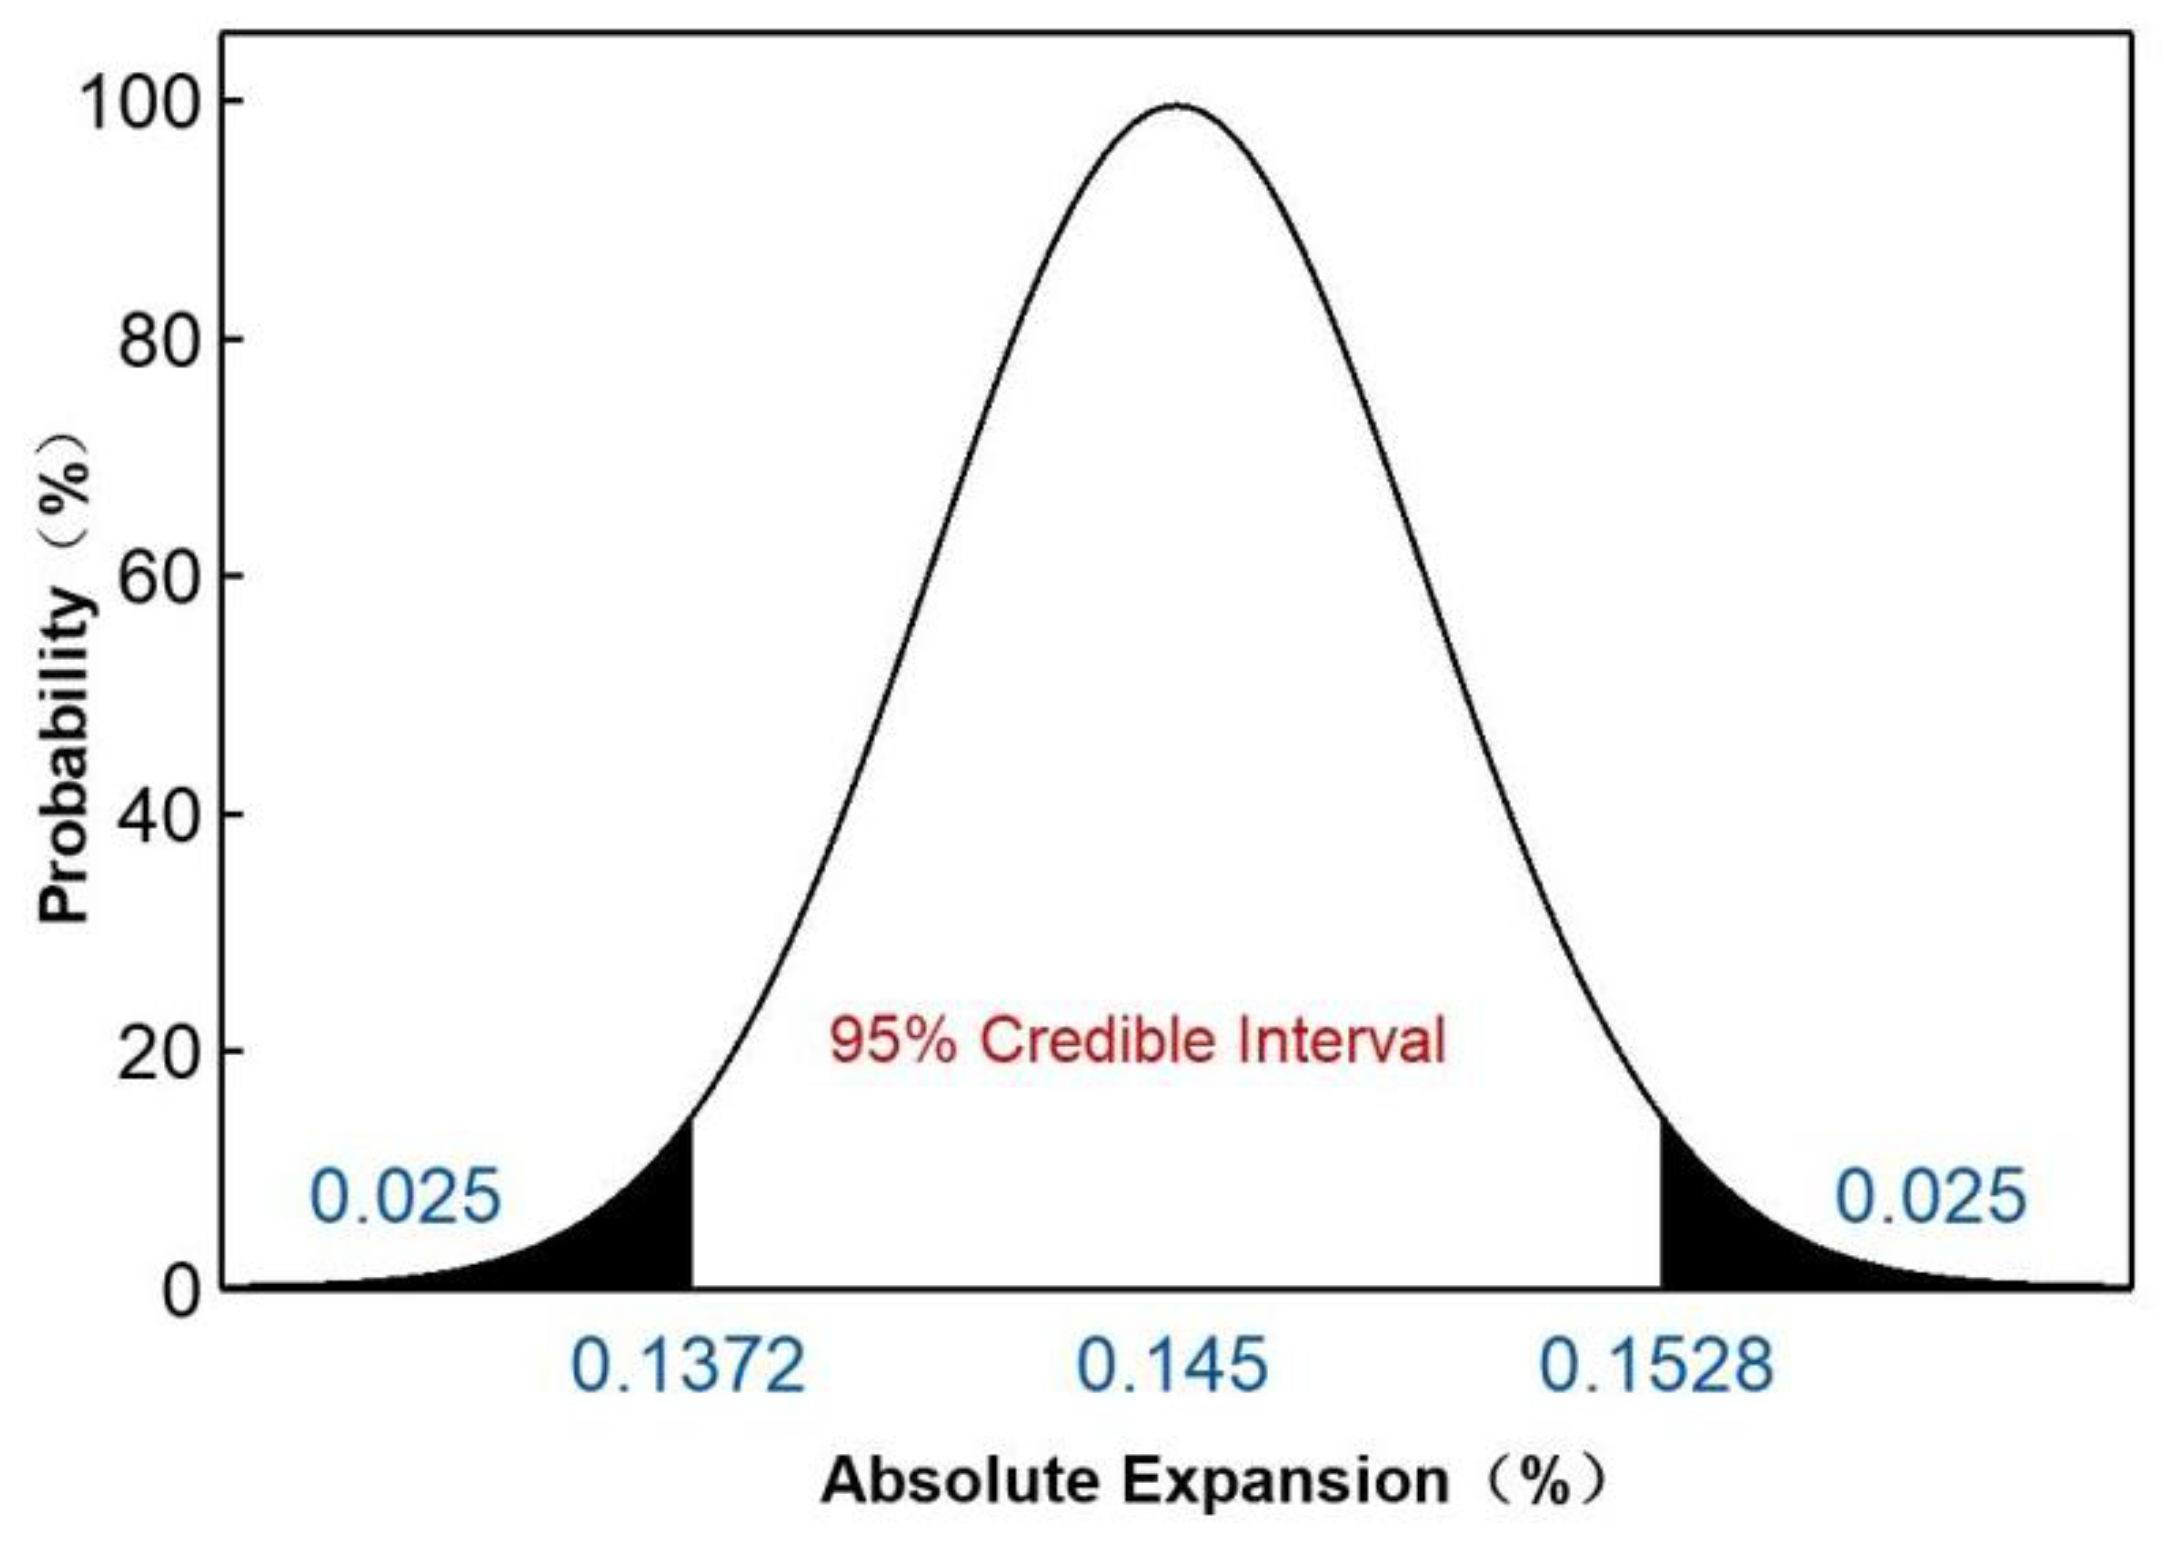
3.3. Establishing a Distortion Model Using Bayesian Statistics
4. Conclusions
Author Contributions
Funding
Data Availability Statement
Conflicts of Interest
References
- Li, X.; Huang, Q.; Xie, Y.; Gong, X. Application and improvement of continuous monitoring methods for artificial radionuclides based on Bayesian statistics. J. Radioanal. Nucl. Chem. 2024, 333, 5211–5223. [Google Scholar] [CrossRef]
- Jung, J.; Yoon, J.I.; Hyung, K.P.; Kim, J.Y.; Kim, H.S. Bayesian approach in predicting mechanical properties of materials: Application to dual phase steels. Mater. Sci. Eng. A 2019, 743, 382–390. [Google Scholar] [CrossRef]
- Hooft, R.W.W.; Straver, L.H.; Spek, A.L. Determination of absolute structure using Bayesian statistics on Bijvoet differences. J. Appl. Crystallogr. 2008, 41, 96–103. [Google Scholar] [CrossRef]
- Zheng, Y.; Xie, Y.; Long, X. A comprehensive review of Bayesian statistics in natural hazards engineering. Nat. Hazards 2021, 108, 63–91. [Google Scholar] [CrossRef]
- Koch, K. Introduction to Bayesian Statistics. Am. Stat. 2007, 60, 98–99. [Google Scholar]
- Castelletti, F.; Consonni, G. Bayesian graphical modeling for heterogeneous causal effects. Stat. Med. 2023, 42, 15–32. [Google Scholar] [CrossRef] [PubMed]
- Guo, J.; Riebler, A.; Rue, H. Bayesian bivariate meta-analysis of diagnostic test studies with interpretable priors. Stat. Med. 2017, 36, 3039–3058. [Google Scholar] [CrossRef]
- Mccandless, L.C.; Gustafson, P.; Austin, P.C. Bayesian propensity score analysis for observational data. Stat. Med. 2010, 28, 94–112. [Google Scholar] [CrossRef]
- Zhou, Q.; Mcneal, C.; Copeland, L.A.; Zachariah, J.P.; Song, J.J. Bayesian propensity score analysis for clustered observational data. Stat. Methods Appl. 2020, 29, 335–355. [Google Scholar] [CrossRef]
- Li, L.; Donnell, E.T. Incorporating Bayesian methods into the propensity score matching framework: A no-treatment effect safety analysis. Accid. Anal. Prev. 2020, 145, 105691. [Google Scholar] [CrossRef]
- Sutton, A.J.; Abrams, K.R. Bayesian methods in meta-analysis and evidence synthesis. Statal Methods Med. Res. 2001, 10, 277–303. [Google Scholar] [CrossRef] [PubMed]
- Macnab, Y.C. On identification in Bayesian disease mapping and ecological-spatial regression models. Stat. Methods Med. Res. 2012, 23, 134–155. [Google Scholar] [CrossRef] [PubMed]
- Wada, K.; Watanabe, M.; Shinno, M.; Noguchi, K.; Ogino, H. Development of Radiation Dermatitis Grading Method based on Bayesian Estimation using EfficientNet. Med. Imaging Technol. 2022, 40, 48–58. [Google Scholar]
- Adamina, M.; Tomlinson, G.; Guller, U. Bayesian statistics in oncology: A guide for the clinical investigator. Cancer 2009, 115, 5371–5381. [Google Scholar] [CrossRef]
- Zhou, J.; Jiang, X.; Xia, H.A.; Wei, P.; Hobbs, B.P. Predicting outcomes of phase III oncology trials with Bayesian mediation modeling of tumor response. Stat. Med. 2022, 41, 751–768. [Google Scholar] [CrossRef]
- Ross, R.J.; Baker, R.E.; Parker, A.; Ford, M.J.; Mort, R.L.; Yates, C.A. Using approximate Bayesian computation to quantify cell-cell adhesion parameters in a cell migratory process. npj Syst. Biol. Appl. 2017, 3, 9. [Google Scholar] [CrossRef]
- Johnston, S.T.; Simpson, M.J.; McElwain, D.L.; Binder, B.J.; Ross, J.V. Interpreting scratch assays using pair density dynamics and approximate Bayesian computation. Open Biol. 2014, 4, 140097. [Google Scholar] [CrossRef]
- Greenland, S. Bayesian perspectives for epidemiological research: I. Foundations and basic methods. Int. J. Epidemiol. 2006, 35, 765. [Google Scholar] [CrossRef]
- Brand, K.P.; Small, M.J. Updating Uncertainty in an Integrated Risk Assessment: Conceptual Framework and Methods. Risk Anal. 2010, 15, 719–729. [Google Scholar] [CrossRef]
- Ahmed, S.; Li, T.; Huang, S.; Cao, J. Dynamic and quantitative risk assessment of Cruise ship pod propulsion system failure: An integrated Type-2 Fuzzy-Bayesian approach. Ocean Eng. 2023, 279, 114601. [Google Scholar] [CrossRef]
- Vanitha, C.N.; Malathy, S.; Dhanaraj, R.K.; Nayyar, A. Optimized pollard route deviation and route selection using Bayesian machine learning techniques in wireless sensor networks. Comput. Netw. 2022, 216, 109228. [Google Scholar] [CrossRef]
- Wakabayashi, Y.K.; Otsuka, T.; Krockenberger, Y.; Sawada, H.; Taniyasu, Y.; Yamamoto, H. Machine-learning-assisted thin-film growth: Bayesian optimization in molecular beam epitaxy of SrRuO3 thin films. APL Mater. 2019, 7, 101114. [Google Scholar] [CrossRef]
- Cohen, S. Bayesian Analysis in Natural Language Processing (Synthesis Lectures on Human Language Technologies); Springer Nature: Berlin, Germany, 2016; Volume 9, pp. 1–274. [Google Scholar]
- Valcamonico, D.; Baraldi, P.; Zio, E.; Decarli, L.; Crivellari, A.; La Rosa, L. Combining natural language processing and bayesian networks for the probabilistic estimation of the severity of process safety events in hydrocarbon production assets. Reliab. Eng. Syst. Saf. 2024, 241, 109638. [Google Scholar] [CrossRef]
- Pires, G.; Castelo-Branco, M.; Nunes, U. Visual P300-based BCI to steer a wheelchair: A Bayesian approach. In Proceedings of the 2008 30th Annual International Conference of the IEEE Engineering in Medicine and Biology Society, Vancouver, BC, Canada, 20–25 August 2008; Volume 2008, pp. 658–661. [Google Scholar] [CrossRef]
- Moradi, R.; Cofre-Martel, S.; Droguett, E.L.; Modarres, M.; Groth, K.M. Integration of deep learning and Bayesian networks for condition and operation risk monitoring of complex engineering systems. Reliab. Eng. Syst. Saf. 2022, 222, 108433. [Google Scholar] [CrossRef]
- Wu, R.; Liu, C.; Jiang, D. Unsupervised Bayesian change-point detection approach for reliable prognostics and health management of complex mechanical systems. Reliab. Eng. Syst. Saf. 2024, 245, 110037.1–110037.11. [Google Scholar] [CrossRef]
- Park, S.J.; Heogh, W.; Yang, J.; Kang, S.; Jeong, W.; Lee, H.; Jang, T.-S.; Jung, H.-D.; Jahazi, M.; Han, S.C.; et al. Meta-structure of amorphous-inspired 65.1Co28.2Cr5.3Mo lattices augmented by artificial intelligence. Adv. Compos. Hybrid Mater. 2024, 7, 224. [Google Scholar] [CrossRef]
- Chen, S.; Bai, Y.; Zhou, X.; Yang, A. A deep learning dataset for metal multiaxial fatigue life prediction. Sci. Data 2024, 11, 1027. [Google Scholar] [CrossRef]
- Pałczyński, K.; Skibicki, D.; Pejkowski, Ł.; Andrysiak, T. Application of Machine Learning Methods in Multiaxial Fatigue Life Prediction. Fatigue Fract. Eng. Mater. Struct. 2023, 46, 416–432. [Google Scholar] [CrossRef]
- Xu, G.T.; Luo, J.; Lu, F.Q.; Wang, G.; Liu, H.T.; Zhao, M.H. Characterization of fracture toughness for surface-modified layer of 18CrNiMo7-6 alloy steel after carburizing heat treatment by indentation method. Eng. Fract. Mech. 2022, 269, 108508. [Google Scholar] [CrossRef]
- Zhou, G.; Guo, J.; Zhao, J.; Tang, Q.; Hu, Z. Nanoindentation Properties of 18CrNiMo7-6 Steel after Carburizing and Quenching Determined by Continuous Stiffness Measurement Method. Metals 2020, 10, 125. [Google Scholar] [CrossRef]
- An, X.; Tian, Y.; Wang, H.; Wang, Z. Effect of Preheat Treatment on Microstructure and Properties of a Gear Steel for High-Temperature Carburizing. Steel Res. Int. 2020, 91, 2000180. [Google Scholar] [CrossRef]
- Xu, G.T.; Cao, X.Y.; Qiao, Y.K.; Sun, B.; Wang, G.; Zhao, M.H.; Li, Y. Anisotropic elastic–plastic properties of surface-modified layers of 18CrNiMo7-6 alloy steel after carburizing heat treatment determined by an indentation method. J. Mater. Res. Technol. 2022, 17, 1349–1362. [Google Scholar] [CrossRef]
- Yuan, T.; Ma, Y.; Zhu, X.; Wu, Z. Experimental Study on Surface Modification Carburizing Alloy Steel of High Pressure Water Jet. Mach. Des. Manuf. 2018, 7, 70–72. [Google Scholar] [CrossRef]
- Cornelius, A.; Karandikar, J.; Schmitz, T. Bayesian stability and force modeling for uncertain machining processes. npj Adv. Manuf. 2024, 1, 11. [Google Scholar] [CrossRef]
- Mehta, P.; Kuttolamadom, M.; Mears, L. Mechanistic force model for machining process—Theory and application of Bayesian inference. Int. J. Adv. Manuf. Technol. 2017, 91, 3673–3682. [Google Scholar] [CrossRef]
- Papananias, M. Bayesian monitoring of machining processes using non-intrusive sensing and on-machine comparator measurement. Int. J. Adv. Manuf. Technol. 2025, 137, 1929–1942. [Google Scholar] [CrossRef]
- Bolstad, W.M.; Curran, J.M. Front Matter. In Introduction to Bayesian Statistics, 3rd ed.; Bolstad, W.M., Curran, J.M., Eds.; John Wiley & Sons: Hoboken, NJ, USA, 2016. [Google Scholar] [CrossRef]
- Johnson, S.R.; Tomlinson, G.A.; Hawker, G.A.; Granton, J.T.; Feldman, B.M. Methods to elicit beliefs for Bayesian priors: A systematic review. J. Clin. Epidemiol. 2010, 63, 355–369. [Google Scholar] [CrossRef]
- Depaoli, S.; Winter, S.D.; Visser, M. The Importance of Prior Sensitivity Analysis in Bayesian Statistics: Demonstrations Using an Interactive Shiny App. Front. Psychol. 2020, 11, 608045. [Google Scholar] [CrossRef]
- An, Z.; Nott, D.J.; Drovandi, C. Robust Bayesian synthetic likelihood via a semi-parametric approach. Stat. Comput. 2020, 30, 543–557. [Google Scholar] [CrossRef]
- Kelter, R. Analysis of Bayesian posterior significance and effect size indices for the two-sample t-test to support reproducible medical research. BMC Med. Res. Methodol. 2020, 20, 88. [Google Scholar] [CrossRef] [PubMed]


| Sample No. | 1 | 2 | 3 | .... | 28 | 29 | 30 | Mean | Standard Deviation |
|---|---|---|---|---|---|---|---|---|---|
| Machined Size (mm) | 347.50 | 347.44 | 347.46 | .... | 347.5 | 347.5 | 347.34 | 347.43 | 0.068 |
| Size After Carburizing (mm) | 347.96 | 347.9 | 347.9 | .... | 348 | 347.94 | 347.96 | 347.94 | 0.062 |
| Expansion (%) | 0.132 | 0.132 | 0.127 | .... | 0.144 | 0.127 | 0.179 | 0.145 | 0.02 |
Disclaimer/Publisher’s Note: The statements, opinions and data contained in all publications are solely those of the individual author(s) and contributor(s) and not of MDPI and/or the editor(s). MDPI and/or the editor(s) disclaim responsibility for any injury to people or property resulting from any ideas, methods, instructions or products referred to in the content. |
© 2025 by the authors. Licensee MDPI, Basel, Switzerland. This article is an open access article distributed under the terms and conditions of the Creative Commons Attribution (CC BY) license (https://creativecommons.org/licenses/by/4.0/).
Share and Cite
Sun, G.; Li, Z.; Jiao, Y.; Wang, Q. Application of Bayesian Statistics in Analyzing and Predicting Carburizing-Induced Dimensional Changes in Torsion Bars. Metals 2025, 15, 546. https://doi.org/10.3390/met15050546
Sun G, Li Z, Jiao Y, Wang Q. Application of Bayesian Statistics in Analyzing and Predicting Carburizing-Induced Dimensional Changes in Torsion Bars. Metals. 2025; 15(5):546. https://doi.org/10.3390/met15050546
Chicago/Turabian StyleSun, Guojin, Zhenggui Li, Yanxiong Jiao, and Qi Wang. 2025. "Application of Bayesian Statistics in Analyzing and Predicting Carburizing-Induced Dimensional Changes in Torsion Bars" Metals 15, no. 5: 546. https://doi.org/10.3390/met15050546
APA StyleSun, G., Li, Z., Jiao, Y., & Wang, Q. (2025). Application of Bayesian Statistics in Analyzing and Predicting Carburizing-Induced Dimensional Changes in Torsion Bars. Metals, 15(5), 546. https://doi.org/10.3390/met15050546