1. Introduction
Most metals and ceramics are aggregates of crystalline grains. In general, polycrystalline materials have higher strength compared to single-crystal materials because of the existence of grain boundaries, and, therefore, are often used as engineering materials [
1]. The deformation of polycrystals is affected by crystal structure, grain boundaries, grain size, and grain orientation. A majority of classical theory experiments on metal deformation are based on single crystals [
2,
3,
4,
5], and the polycrystalline deformation theory focuses on computational simulation [
6,
7,
8]. While polycrystalline materials dominate engineering applications due to their superior strength from grain boundary effects, their deformation mechanisms remain inadequately understood compared to single crystals. Traditional studies rely heavily on computational simulations of polycrystals or single-crystal experiments, leaving a gap in experimental observations of orientation evolution in individual grains during dynamic loading. This study bridges this gap by combining in-situ tensile testing with electron backscatter diffraction (EBSD) to unravel how grain orientation, size, and neighbor interactions govern deformation in Ni5W alloy—a key substrate for high-temperature superconducting tapes.
The EBSD technique is commonly used in SEMs (Scanning Electron Microscopes) within laboratories working on material science and geology on a wide variety of materials and applications to understand the crystallographic aspects of microstructures [
9,
10,
11]. In-situ EBSD tensile testing has been combined with conventional mechanical loading and EBSD techniques. The combination of EBSD and tensile testing has been used to record the surface morphology, the orientation evolution of each crystal, and the dislocations accumulated in the material due to mechanical deformation [
12,
13,
14,
15,
16,
17,
18]. With the help of in-situ EBSD stretching technology, the mechanism of the microstructure of the material under deformation is first identified, and then the material structure that affects performance in the actual application process is assessed. At present, several researchers have studied metal and alloy deformation using in-situ EBSD tensile testing technology [
19,
20,
21,
22]. However, it was found that the process of changes in the microstructure of polycrystalline materials affected by stress is very complicated.
The second-generation high-temperature superconductor film made of REBa
2Cu
3O
7-δ (REBCO, where RE is Y or a rare earth element) can transport high current densities exceeding 10 × 6 A cm
−2 at 77 K but requires a c-axis orientation and low-angle grain boundaries [
23,
24,
25]. Nickel alloys can obtain a strong cube texture through heavy cold deformation and annealing recrystallization, making these a promising choice of substrate for epitaxial growth of YBCO films [
26,
27,
28]. The alloy substrate supports the epitaxial deposition of the superconducting thin film layers, which is crucial for manufacturing high-quality coated conductor tapes. At present, the nickel alloy with 5% tungsten (Ni5W) is a widely used substrate for YBCO-coated conductors [
29,
30]. In our previous studies [
31], in-situ EBSD tensile testing was employed to evaluate the stability of the grain orientation of the substrate used for YBCO under stress.
In this process, the deformation of Ni5W alloy with a strong cube texture was discovered. The Ni5W alloy with a strong cube texture decreases the effect of grain orientation on deformation, which helps in improving the understanding of changes in the microstructure of polycrystalline materials during the deformation process. Thus, with the help of a combination of EBSD and in-situ tensile test systems, this study aims to characterize the evolution of microstructural features in Ni5W alloy with a strong cube texture under uniaxial tensile testing, including grain boundaries, grain orientation, and dislocations. This will contribute to a better understanding of the deformation of polycrystalline materials.
3. Results
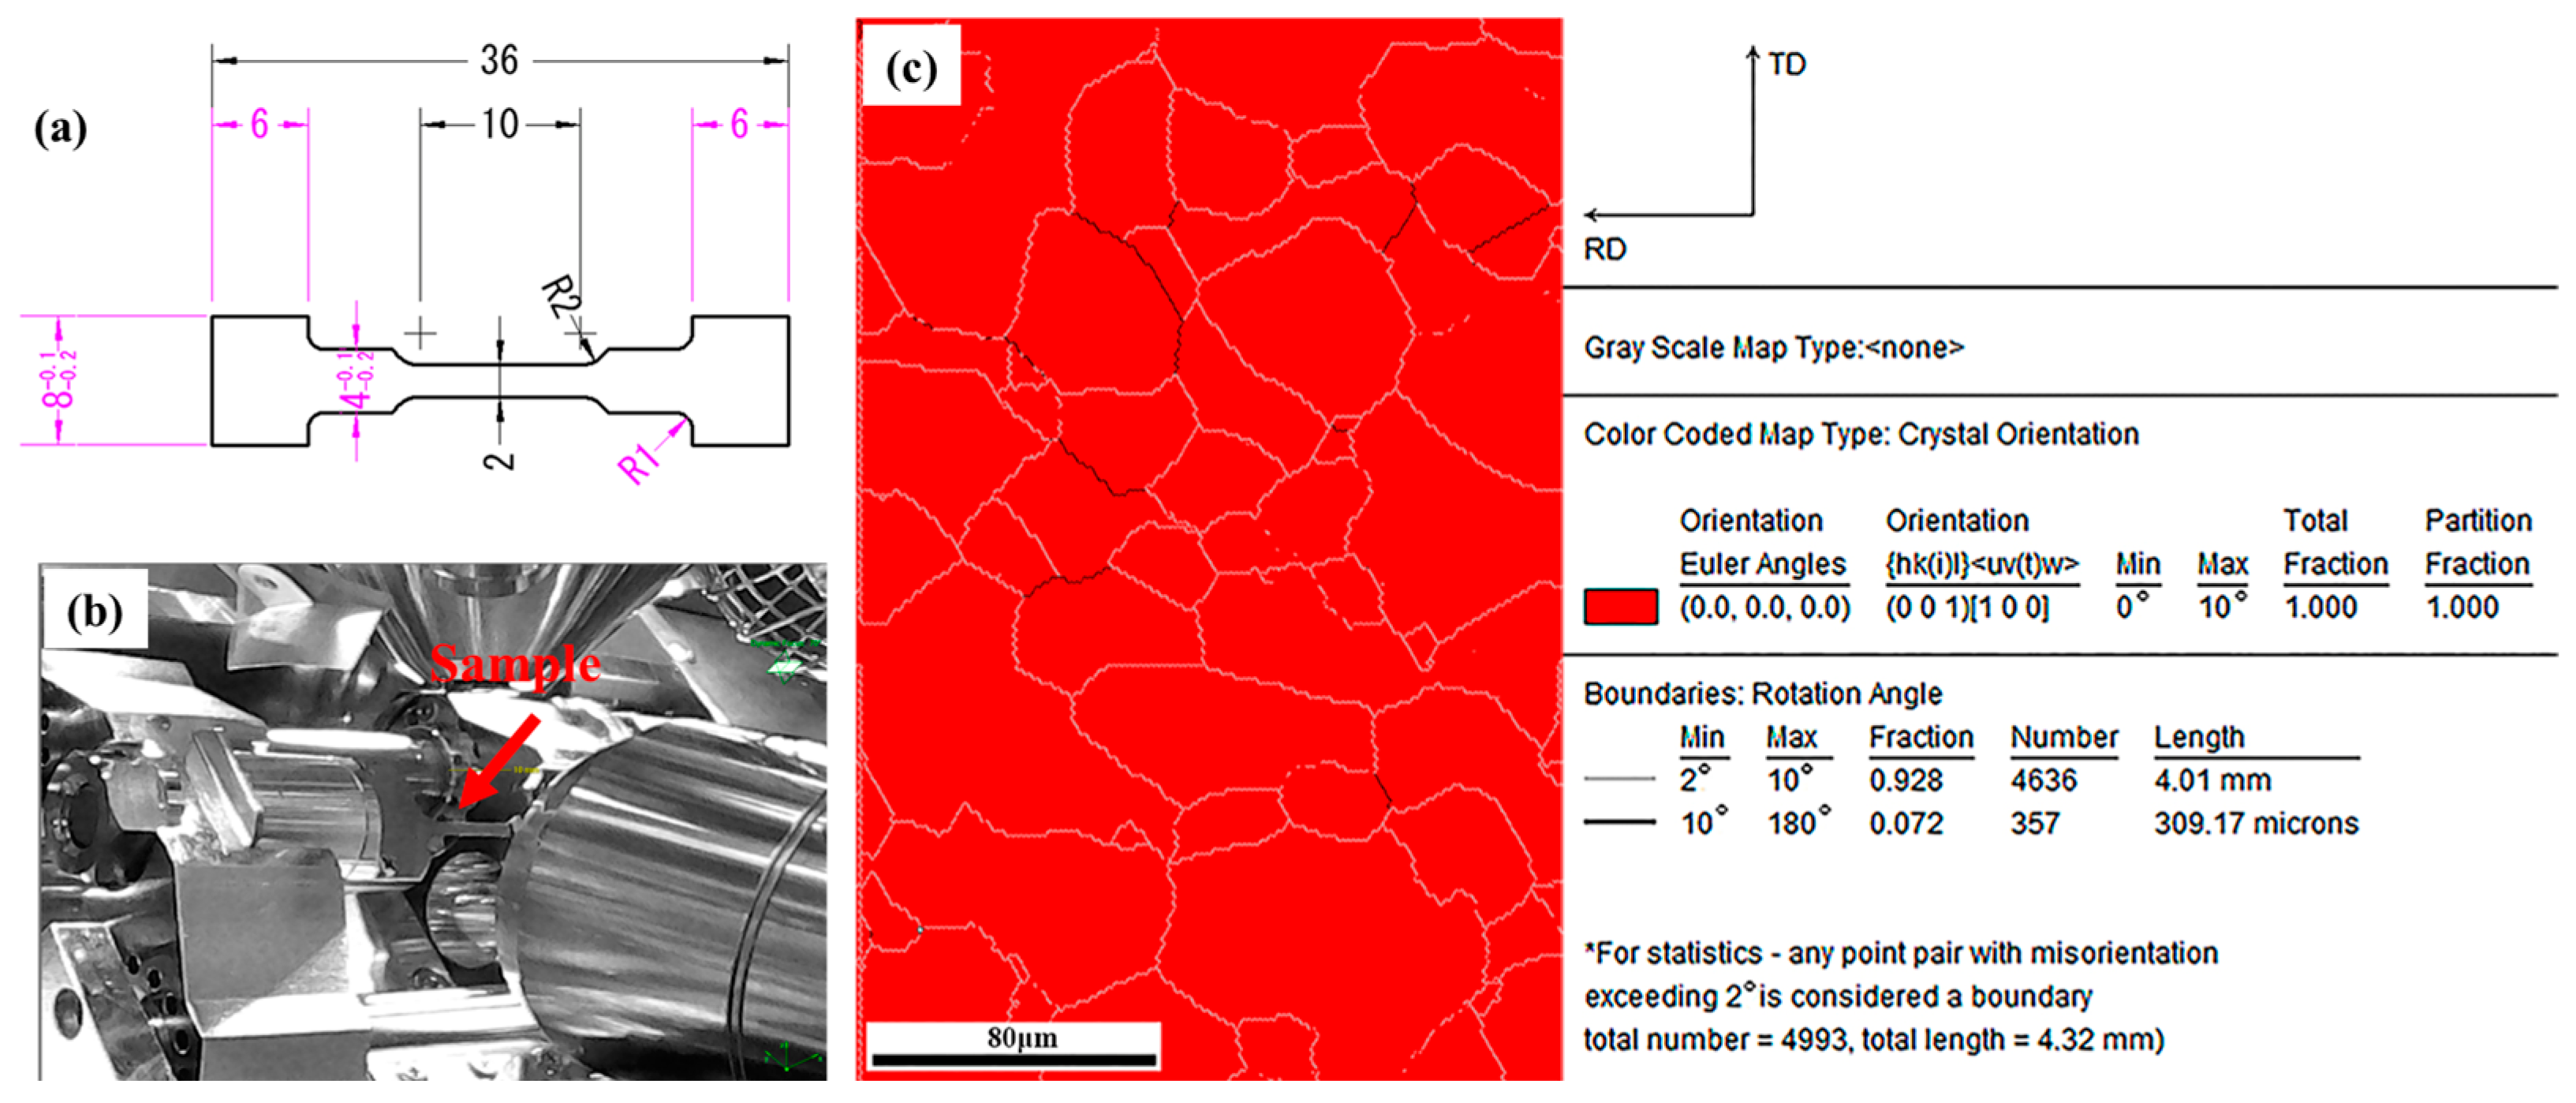
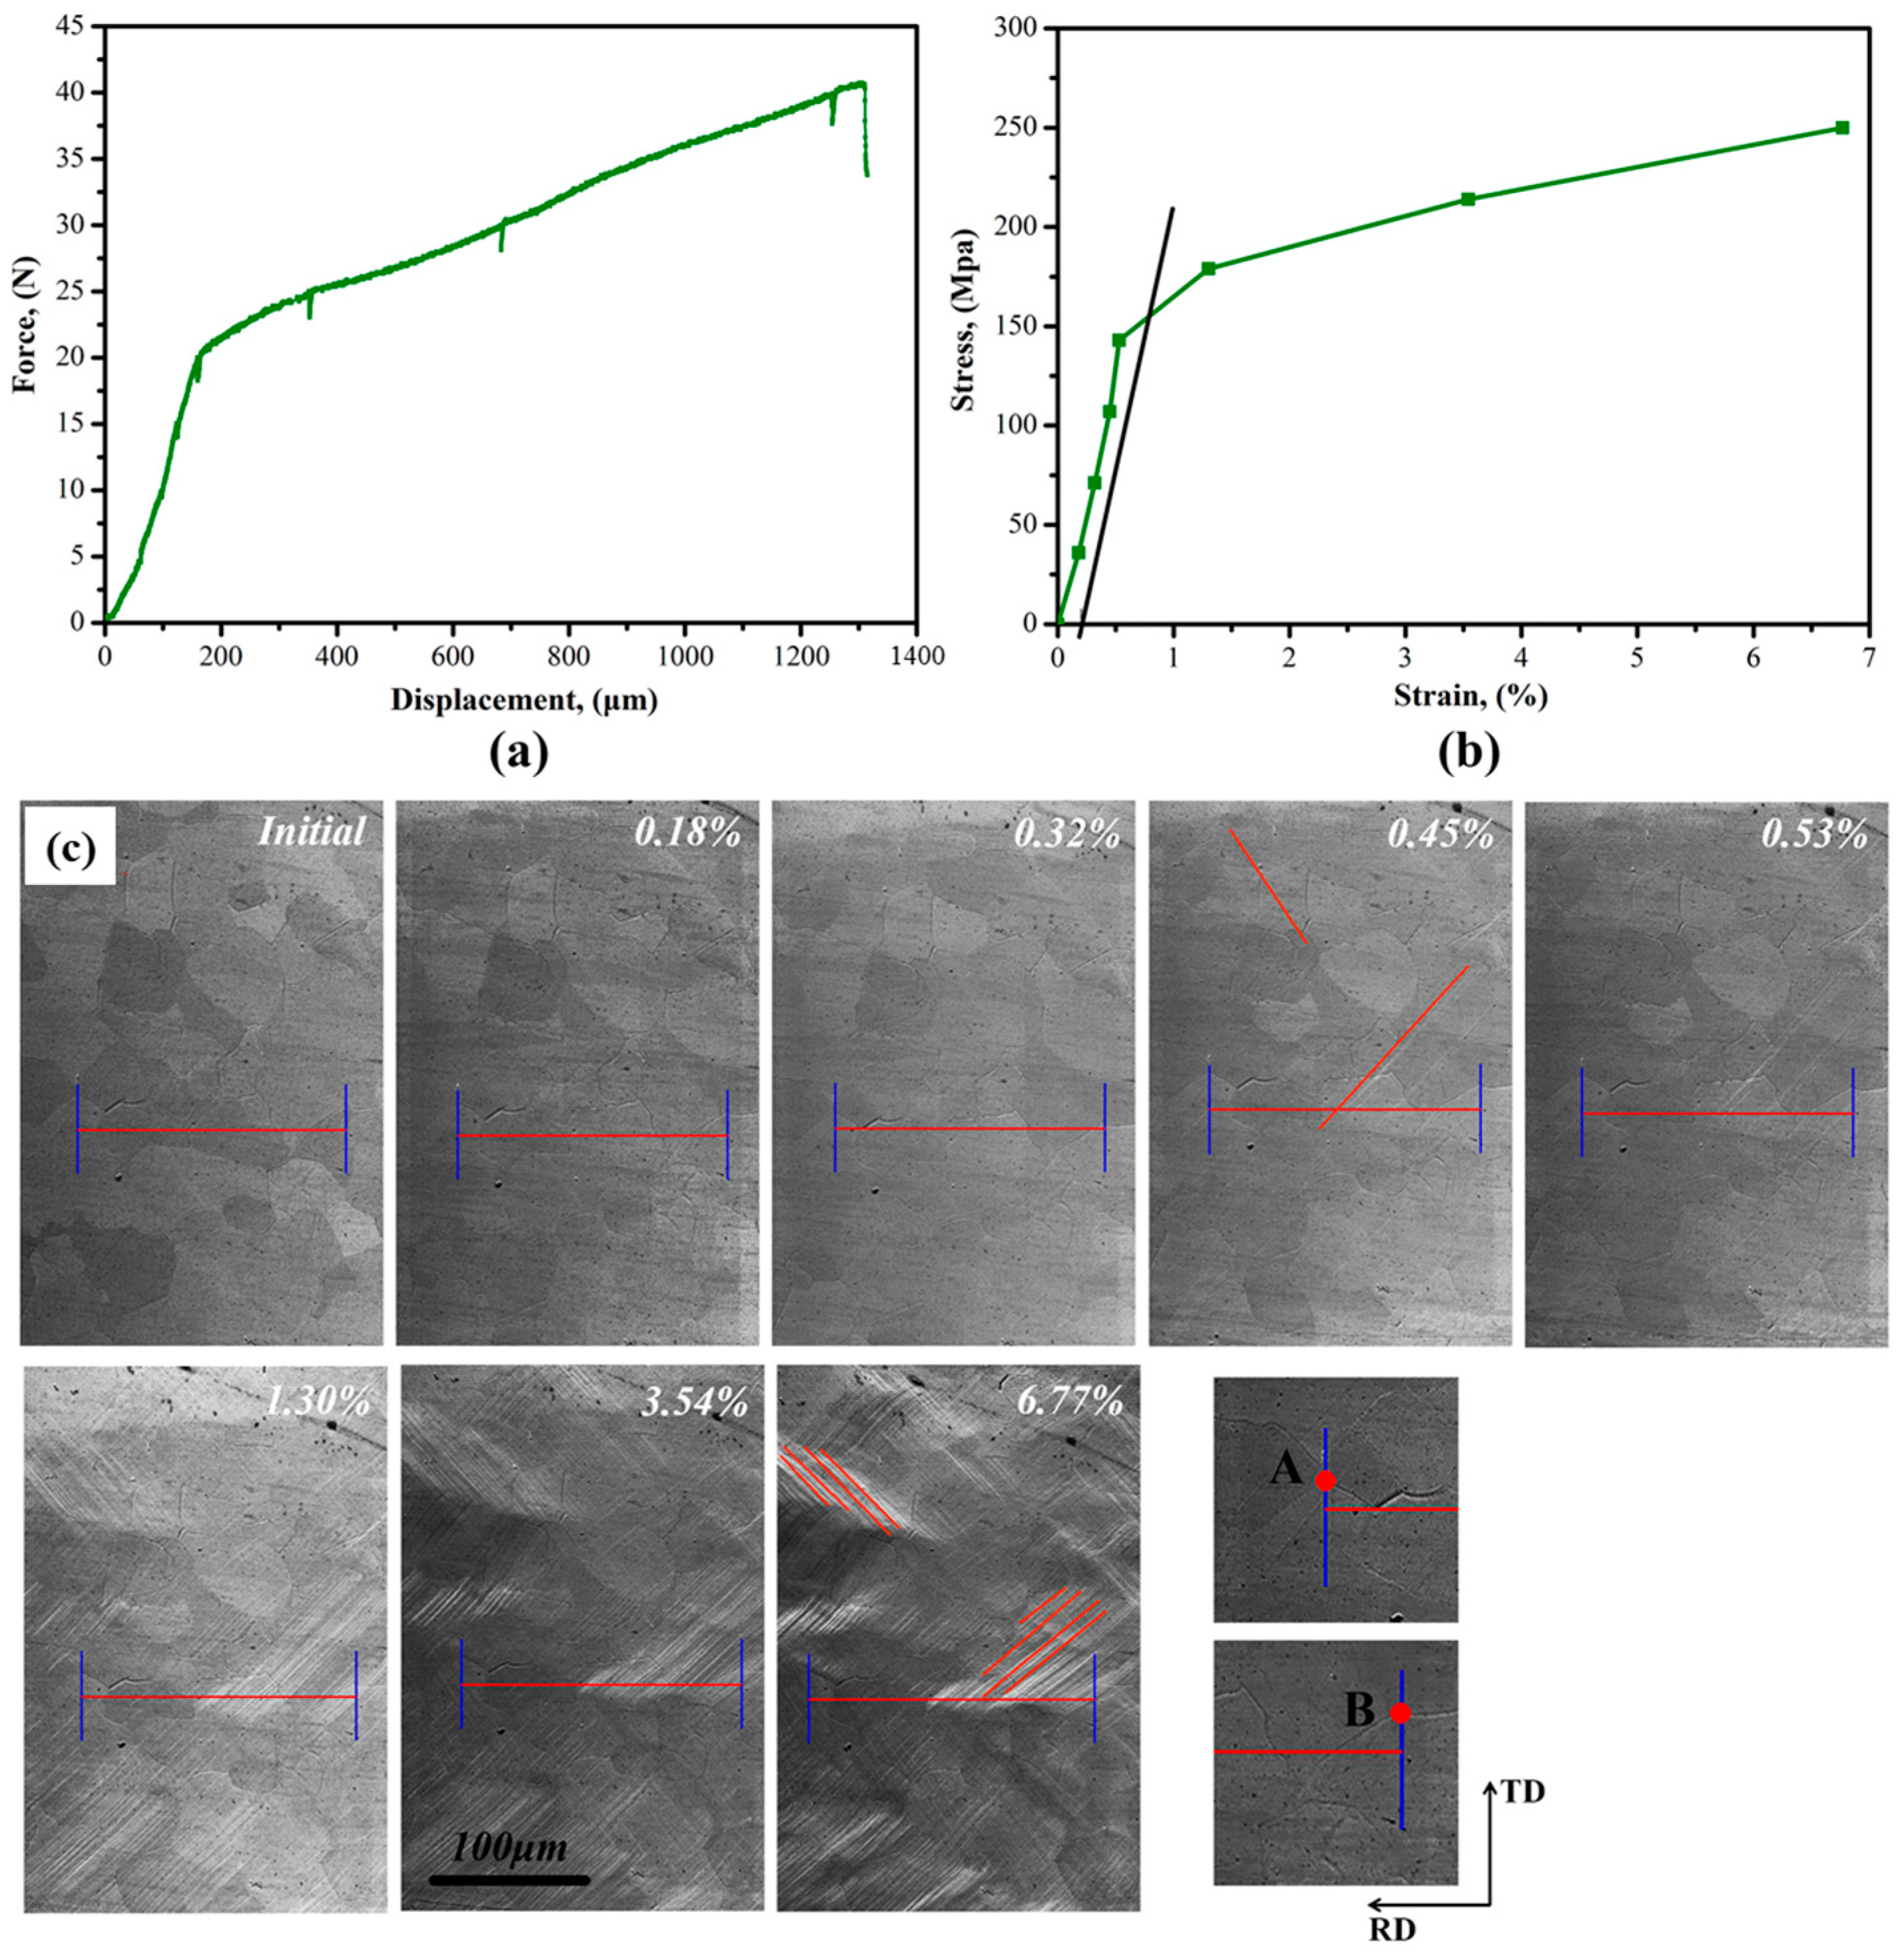
Figure 2a shows the force-displacement curve of the specimen collected during the tensile test. It can be observed that the specimen relaxed while the EBSD data were being gathered. To accurately determine the strain of the specimen at various stress levels, SEM images were used to measure the horizontal distance between points A and B, which correspond to the grain boundary nodes, as illustrated in
Figure 2c. The stress-strain curve is shown in
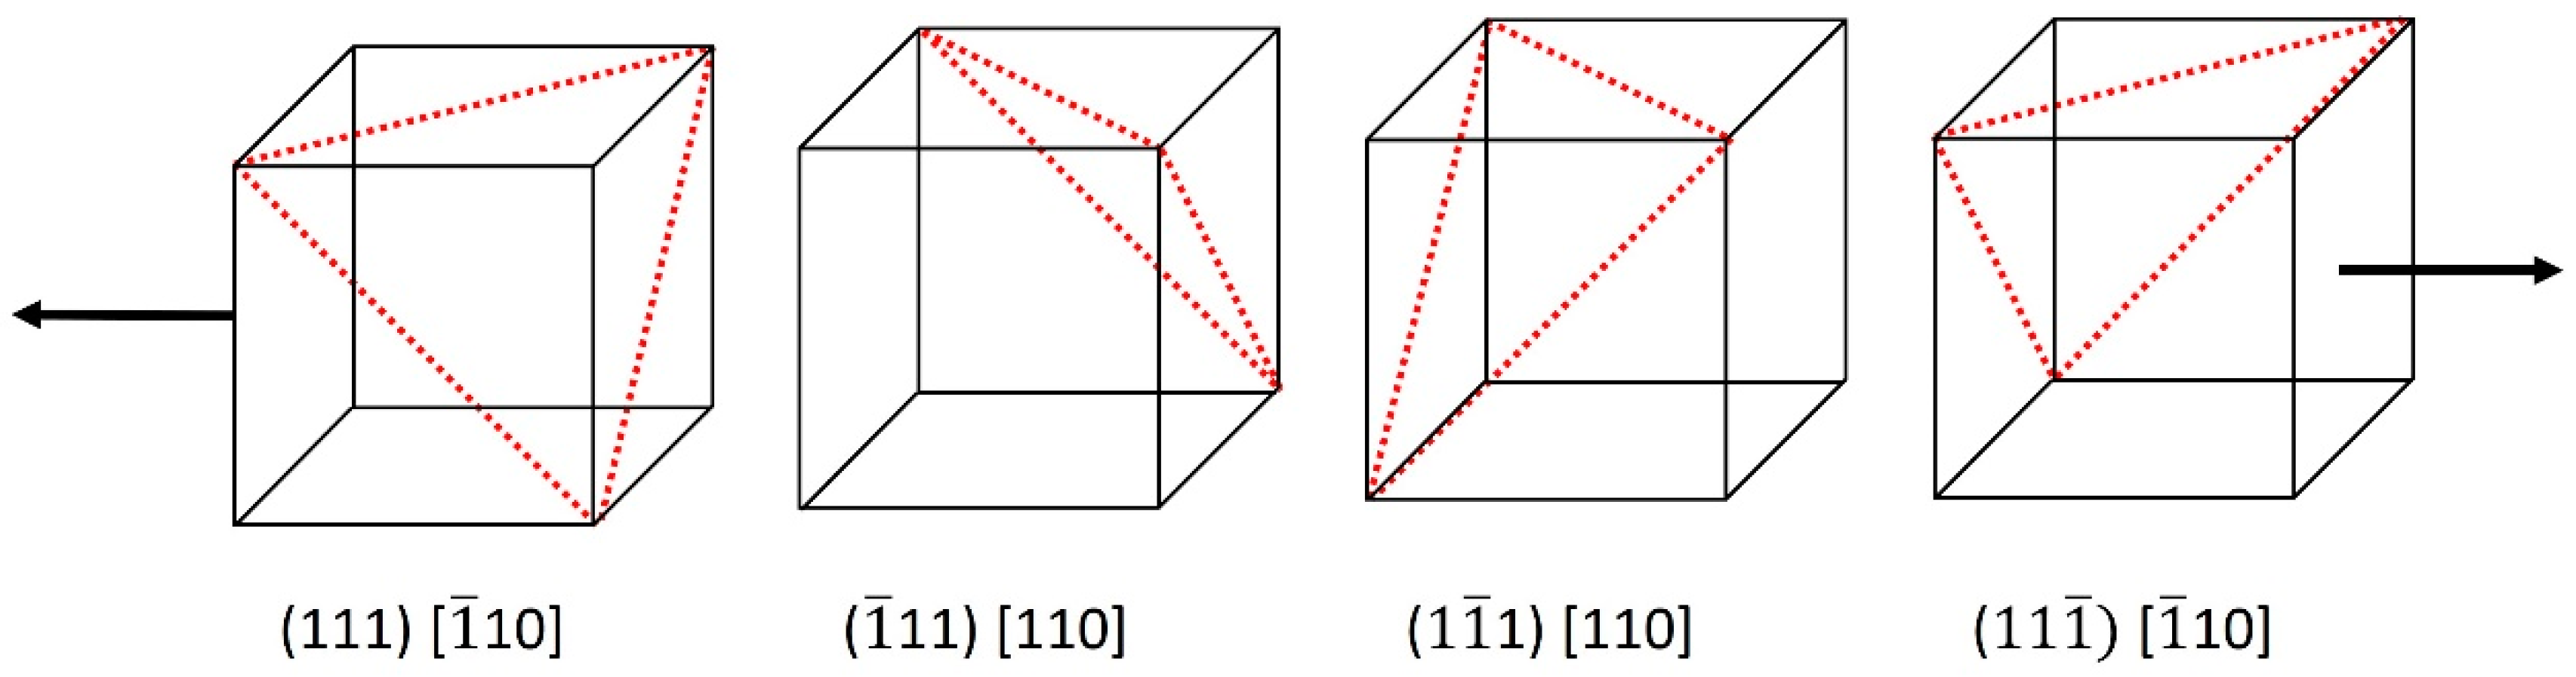
Figure 2b, where the yield strength of the specimen is approximately 154 MPa. Since nickel is an FCC metal, the four primary slip systems—(111) [1
0], (1
1) [110], (11
) [110], and (11
) [1
0]—were activated during the uniaxial tensile test, as shown in
Figure 3. From
Figure 2c, it is evident that slip lines appeared at 0.45% strain, forming a 45° angle with the tensile direction. The activation of all four slip systems can be attributed to the effects of grain boundaries and grain orientation. The presence of grain boundaries and orientation differences during the tensile process complicated the force transmission between adjacent grains. At the microscopic level, the grains in the specimen were not subjected to purely uniaxial tensile forces. As deformation progressed, the orientation of the grains continuously changed, altering the direction of the forces acting on them. This dynamic change led to the activation of all four slip systems. It is clearly shown in
Figure 2c that two of the four slip directions (marked in red) were visible at 6.77% of the maximum strain.
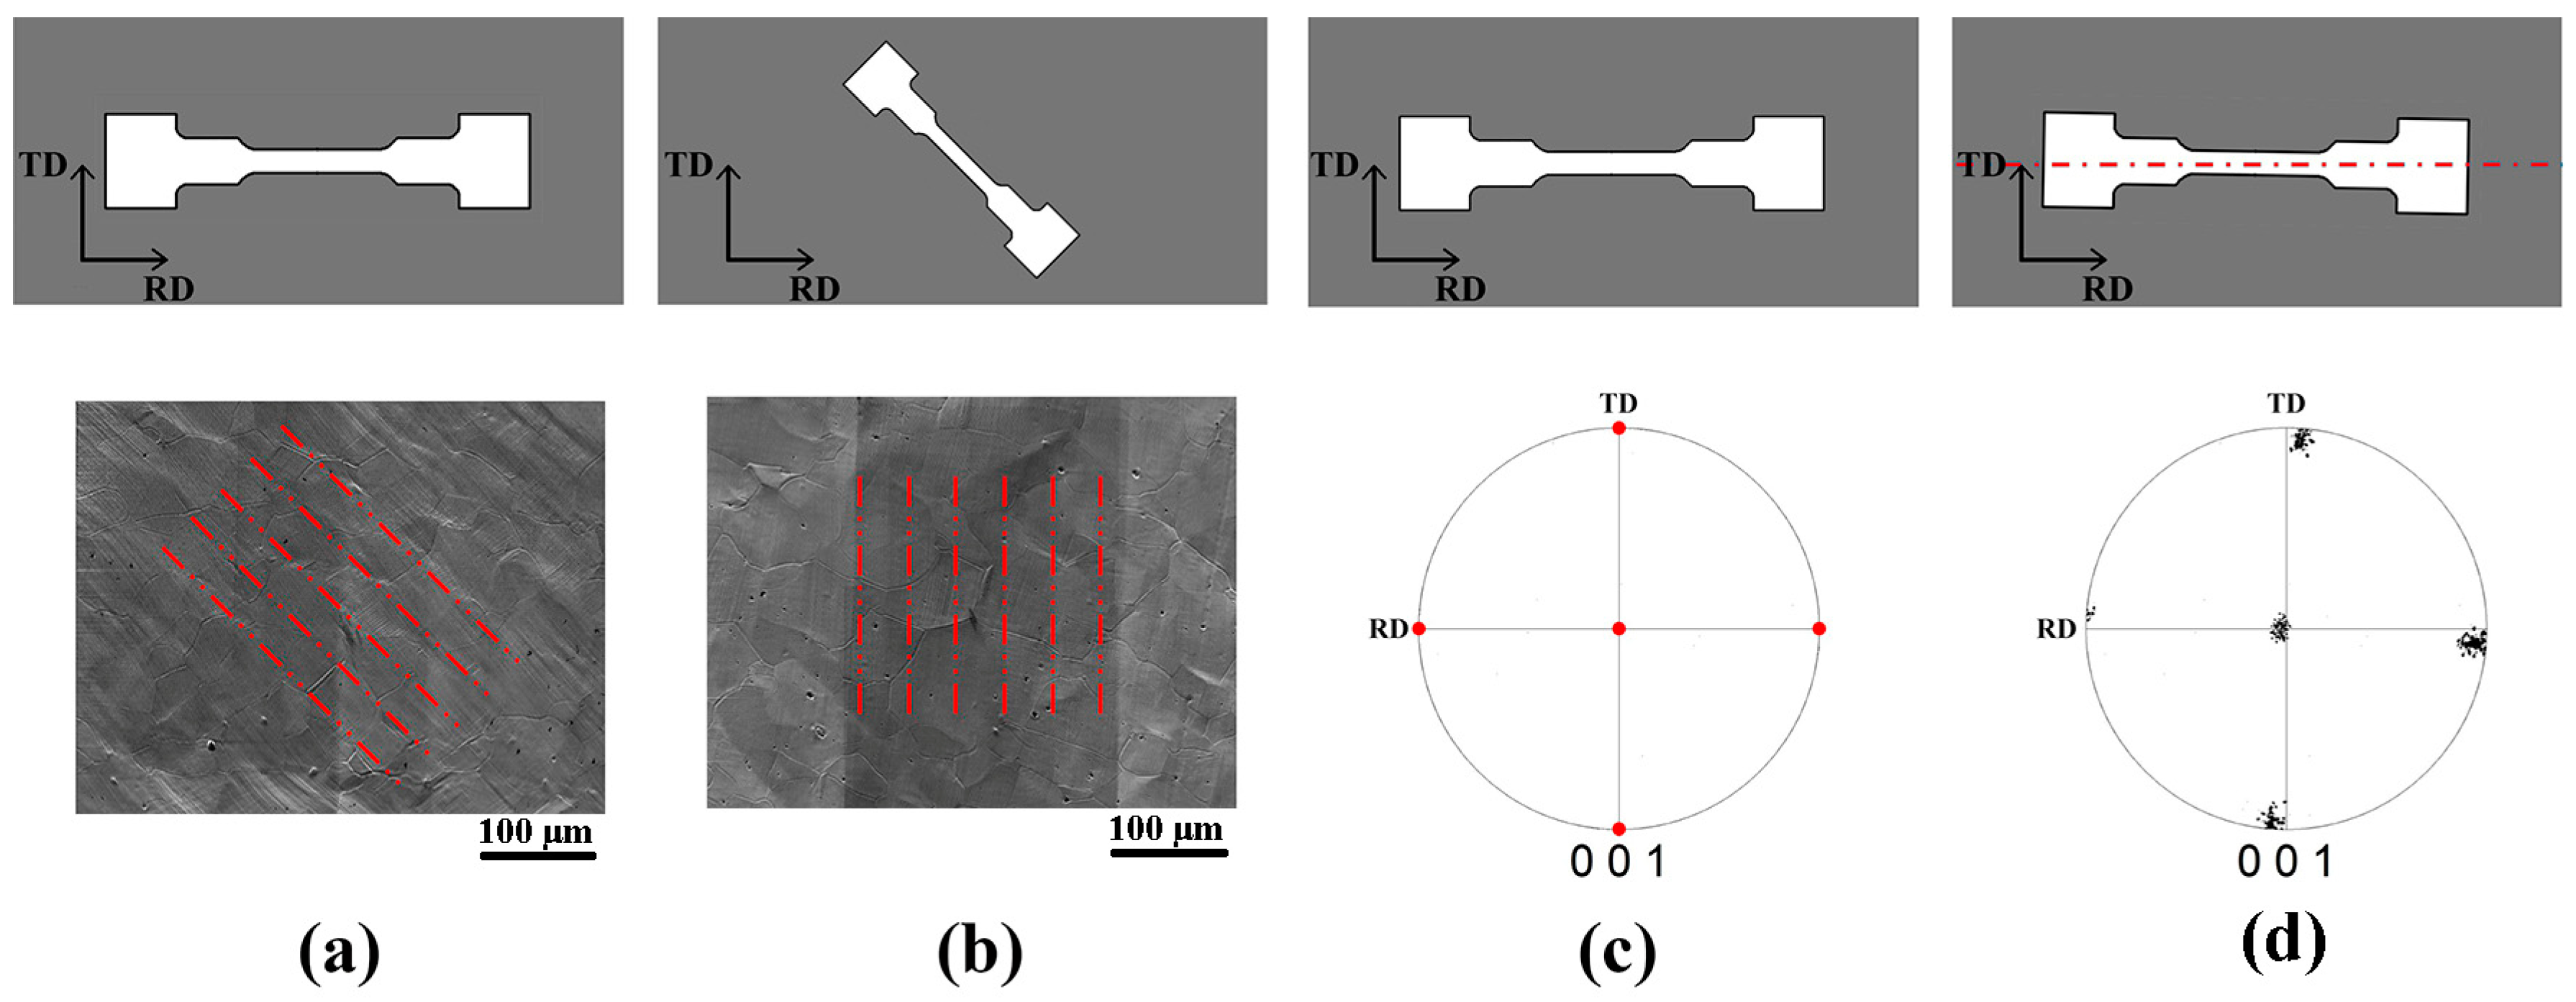
Texture plays a significant role in the deformation behavior of materials. The angle between the tensile direction and the rolling direction of the sample can have different effects on the specimen’s behavior.
Figure 4a shows the specimen taken along the rolling direction, where the tensile direction coincides with the rolling direction. In this configuration, slip lines appear at a 45° angle to the tensile direction. On the other hand, the specimen taken from the 45°-RD direction shows slip lines at a 90° angle to the tensile direction. The inverse pole figure (IPF) of the ideal Ni5W alloy specimen, taken along the rolling direction, is shown in
Figure 4c. However, the actual specimen deviates slightly from the RD direction, which is visible in the IPF collected via EBSD. In conventional material characterization studies, researchers can often present the orientation distribution of materials by correcting the coordinate system. However, during in-situ tensile testing, correcting the coordinate system is not advisable due to the inherent relationship between the tensile direction and the rolling direction.
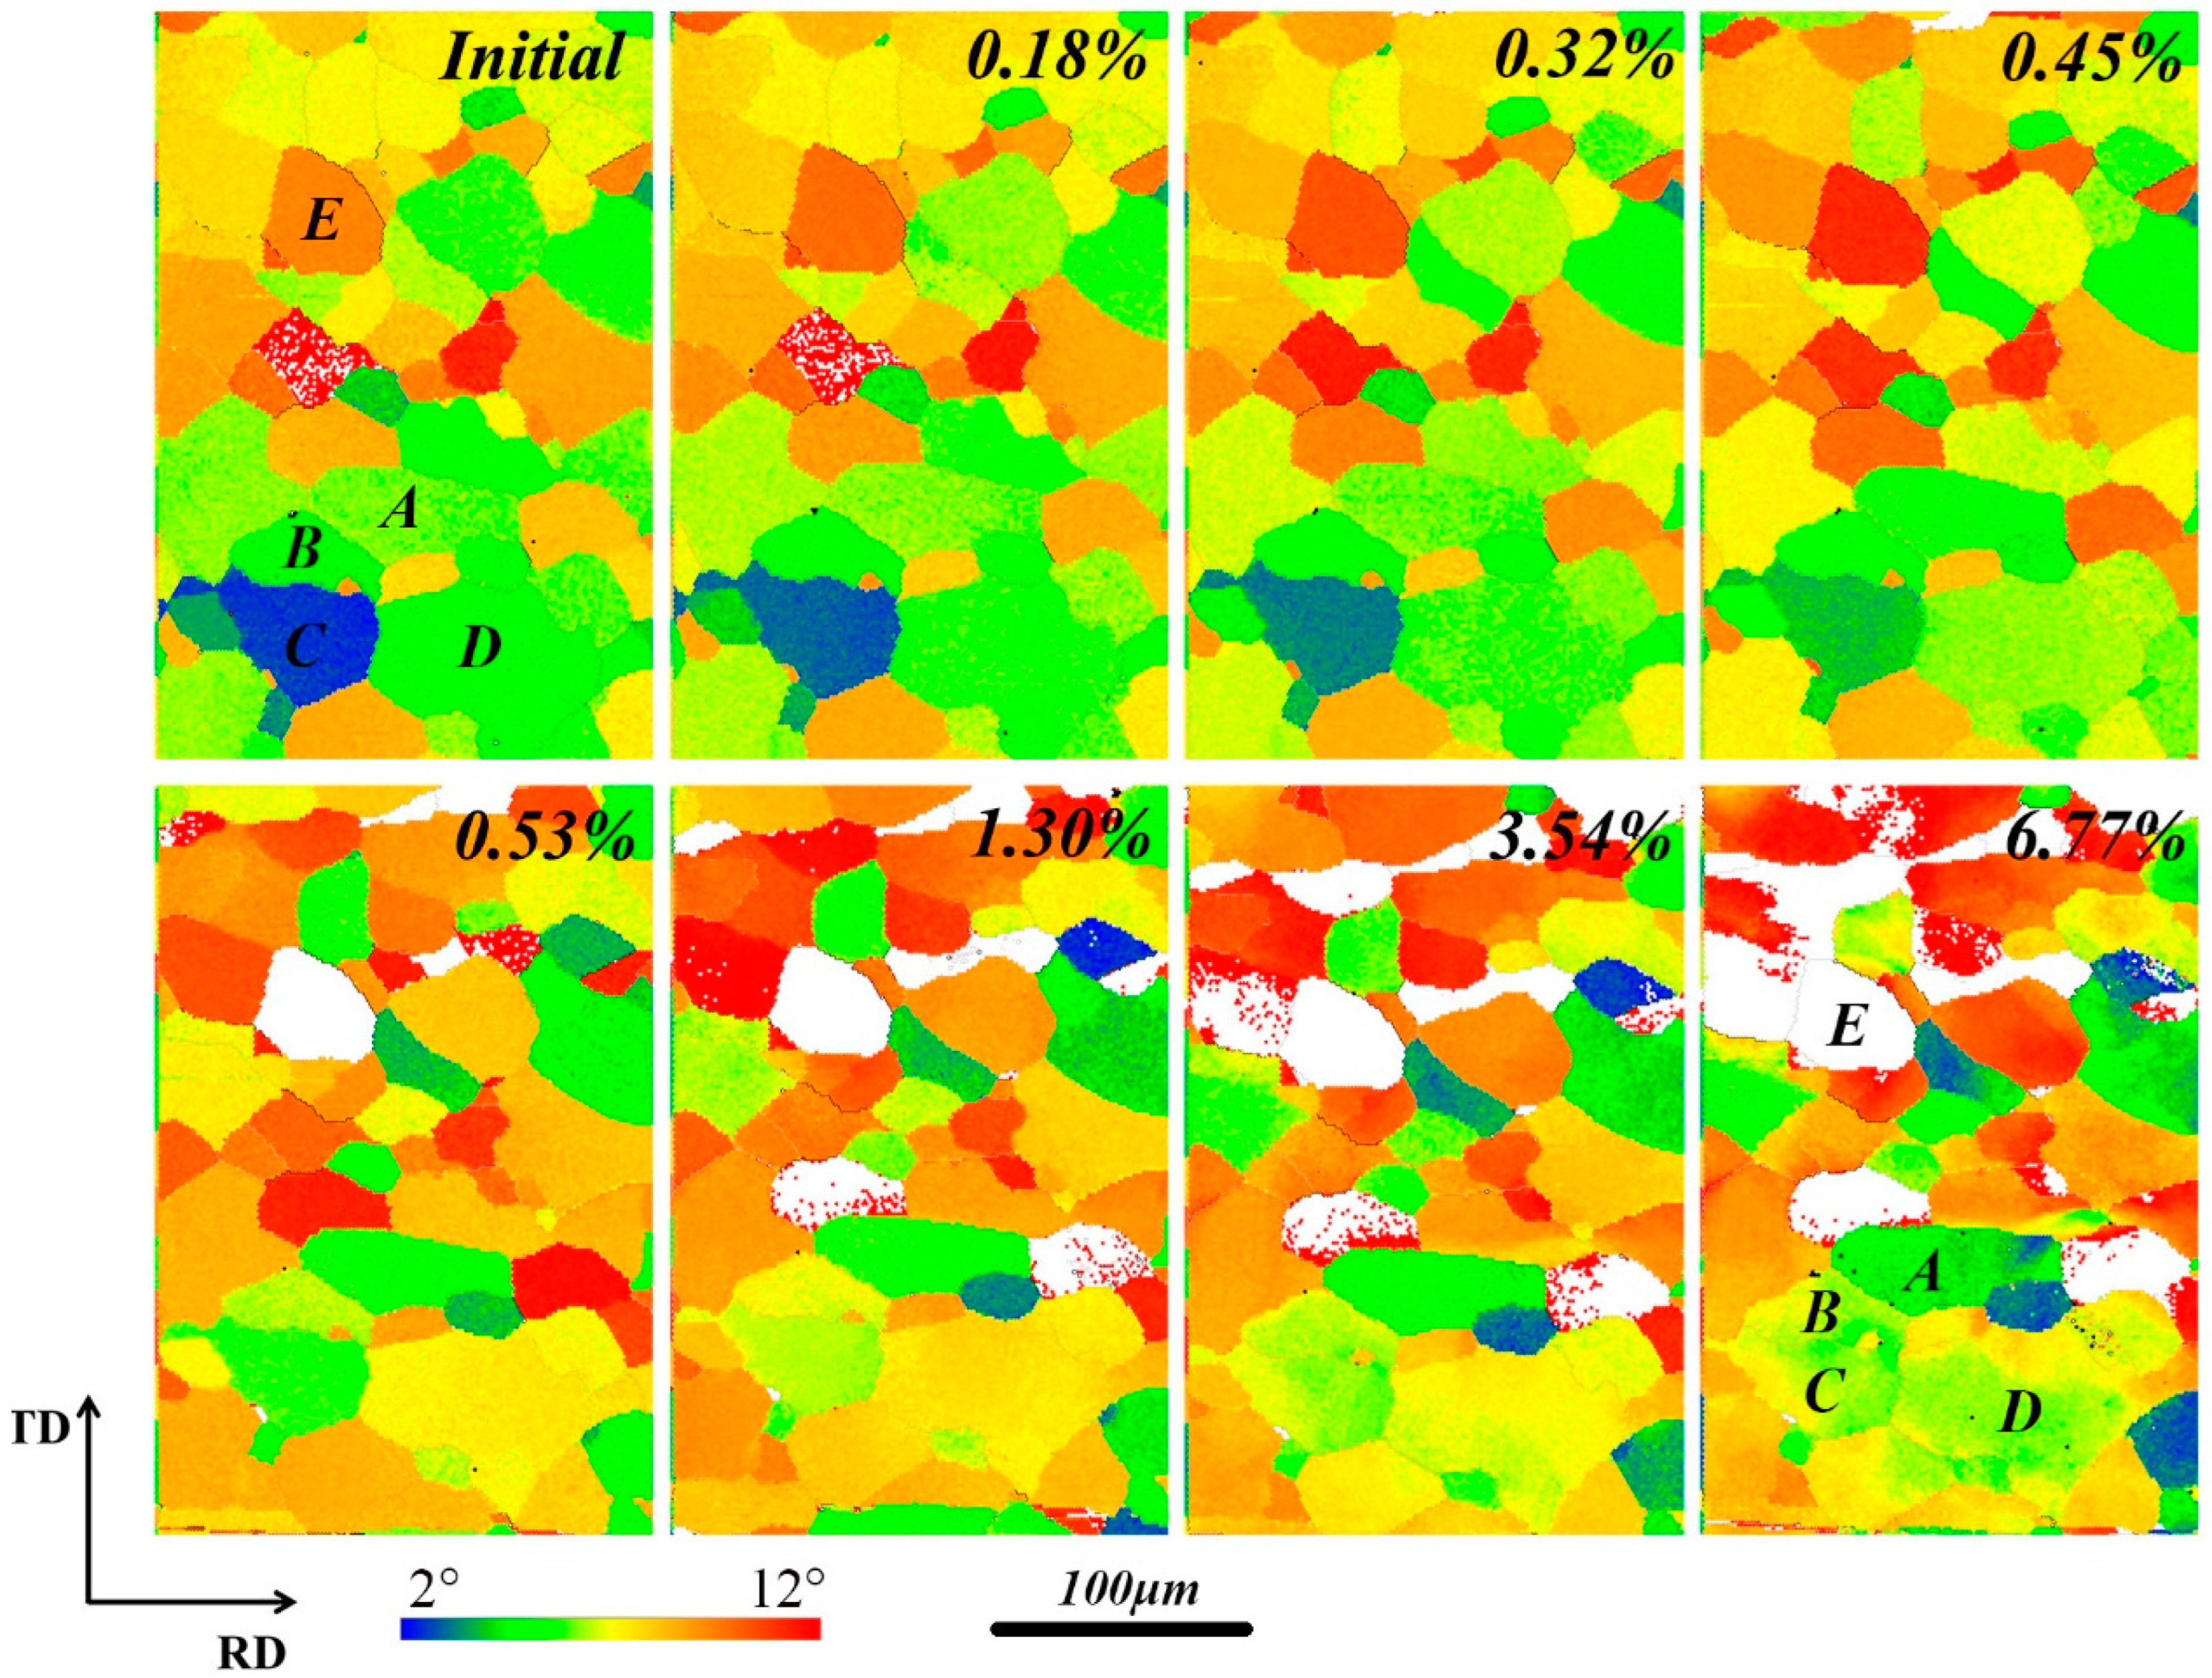
The crystal orientation (CO) maps were prepared to describe the change in grain orientation during the in-situ tensile testing, as shown in
Figure 5. Due to the large deformation rolling and high-temperature recrystallization heat treatment, Ni5W forms a strong cube texture. The (001) [100] was defined as the reference, as this specimen has a strong cube texture, and the [100] direction coincides with the rolling and stretching directions. Each pixel is colored according to the deviated angle with respect to the (001) [100] orientation in the CO maps. The grain orientation information of the specimen can be displayed accurately through the CO maps. It can be seen that the grain orientation of the specimen was concentrated between 2° and −12°. The deviation angle begins from 2° as the specimen was at an angle to the rolling direction, deviating from the (001) [100] orientation in
Figure 5. The percentage of grains with misorientation greater than 12° at each strain level is shown in
Table 2. The color of grains changed marginally with elastic deformation, indicating that the orientation of the grains was stable. The slip systems were not activated during the elastic deformation, and the deformation of the specimen was caused by the crystal lattice distortion. As the strain exceeded 0.45%, slip lines appeared on the surface of the specimen, as shown in
Figure 3. The color of the grains in the specimen changed, and the number of white colored grains gradually increased, accompanied by an increase in the strain level. These white grains deviated from (001) [100] by more than 12°.
In addition, the rotation of points within the same grain varied, and sub-grains gradually formed inside some of the grains (marked by A, B, C, and D) when the strain reached 3.54%.
The Schmid factor model is an effective way to predict the evolution of grain orientation during deformation in single materials, based on slip-in crystals:
where:
σ is the yield stress,
τCRSS is the critical slitting stress (CRSS), and
m is the Schmid factor.
where:
∅ (θ) is the angle between the applied load direction and the normal direction of the slip plane,
∅ (θ) is the angle between the applied load direction and the slip direction,
V1 is the normal direction of the slip plane, and
V2 is the load direction.
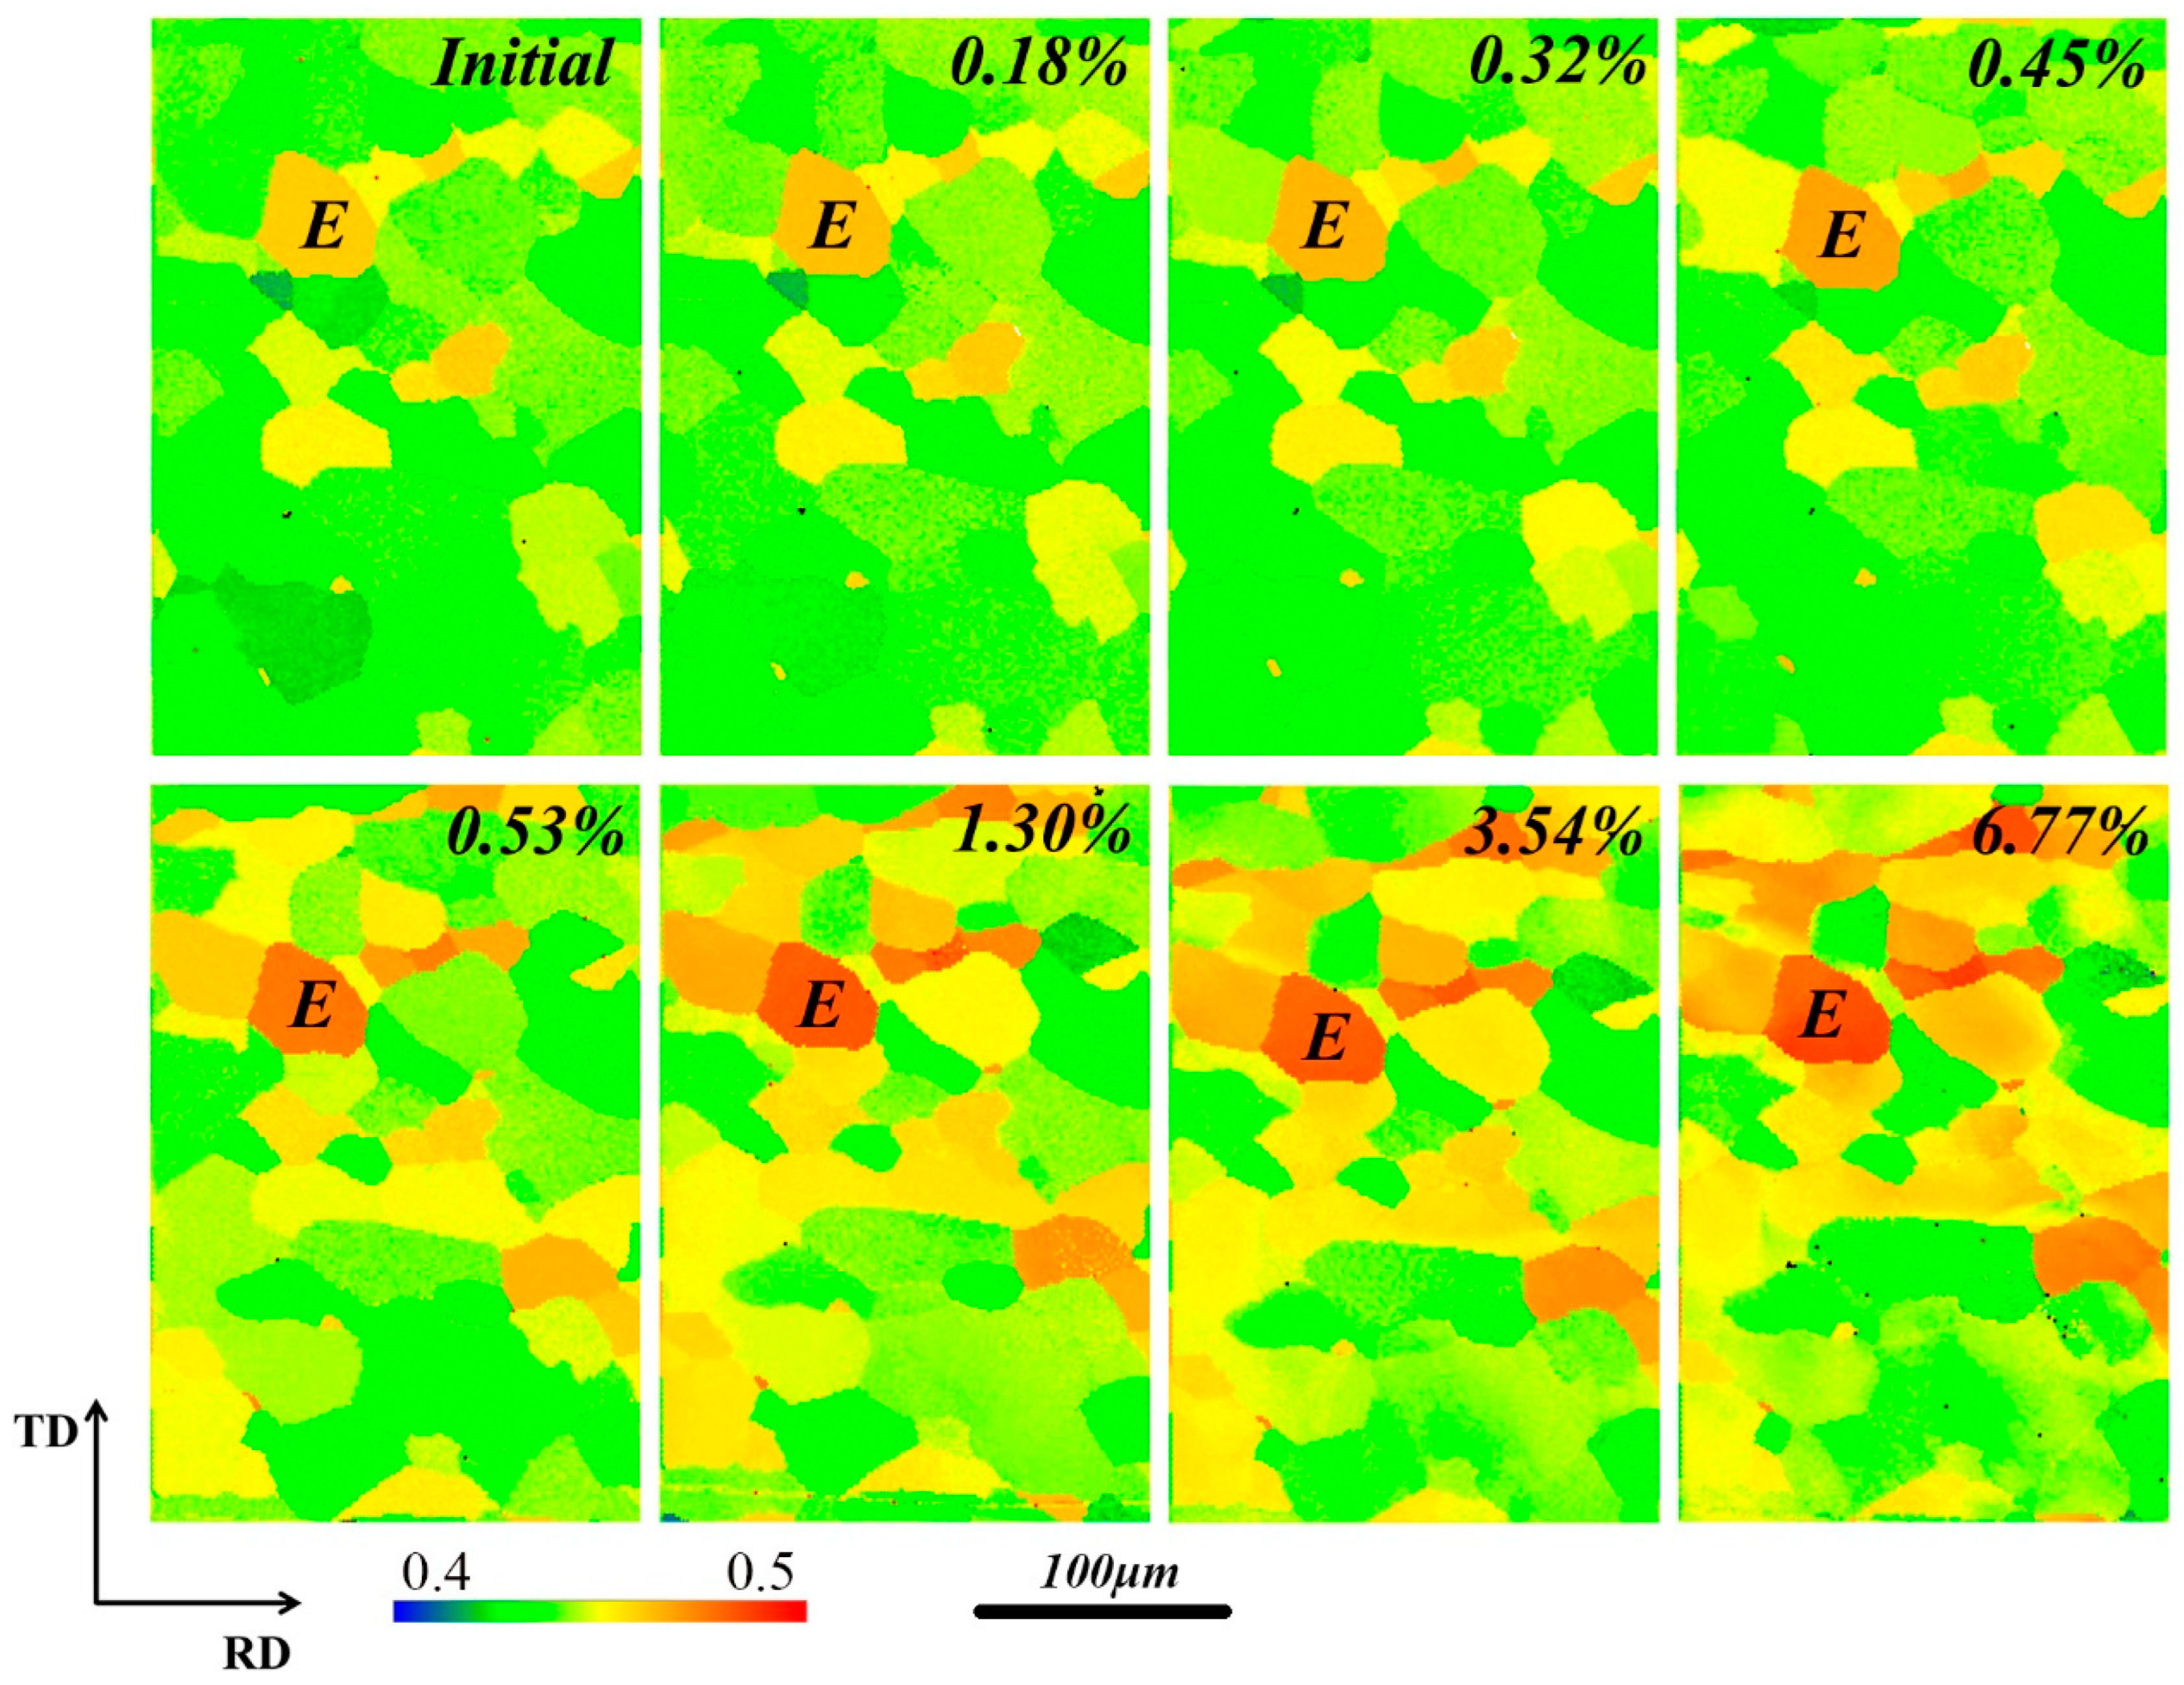
In a polycrystalline material, slip generally occurs simultaneously on more than one slip system to achieve continuity with its neighbors. Therefore, the Schmid approach is not suitable for investigating polycrystalline materials. However, the Ni5W alloy specimen with a strong cube texture is a special material, and the SEM images (
Figure 2) show that the symmetrical slip system of the material was only under the {111} <110> uniaxial tension.
Figure 6 shows the Schmid factor maps for different strains from in-situ EBSD tensile testing for the Ni5W alloy specimen. The Schmid factor values of grains for the specimen ranged between 0.4 and 0.5 for different strains, which shows that the sample could not be easily deformed. In polycrystalline materials, the more concentrated the Schmid factor value of the material, the easier it is to deform. The texture of the material has a significant impact on its strength, and the more concentrated the Schmid factor value, the higher the texture strength. As shown in
Figure 5, although several factors, such as grain size, grain boundaries, and orientation, affect grain rotation in the deformation process, the Schmid factor maps could predict the grains that would rotate towards the white color. It can be seen that the average Schmid factor value of all grains also gradually increased with the increase in strain, and grains such as grain E, which had high Schmid factor values, easily rotated during the plastic deformation process. The grains with a high Schmid factor value rotated only marginally during the elastic deformation process, but these grains gradually deviated from (001) [100] and became white during the plastic deformation, as shown in
Figure 6.
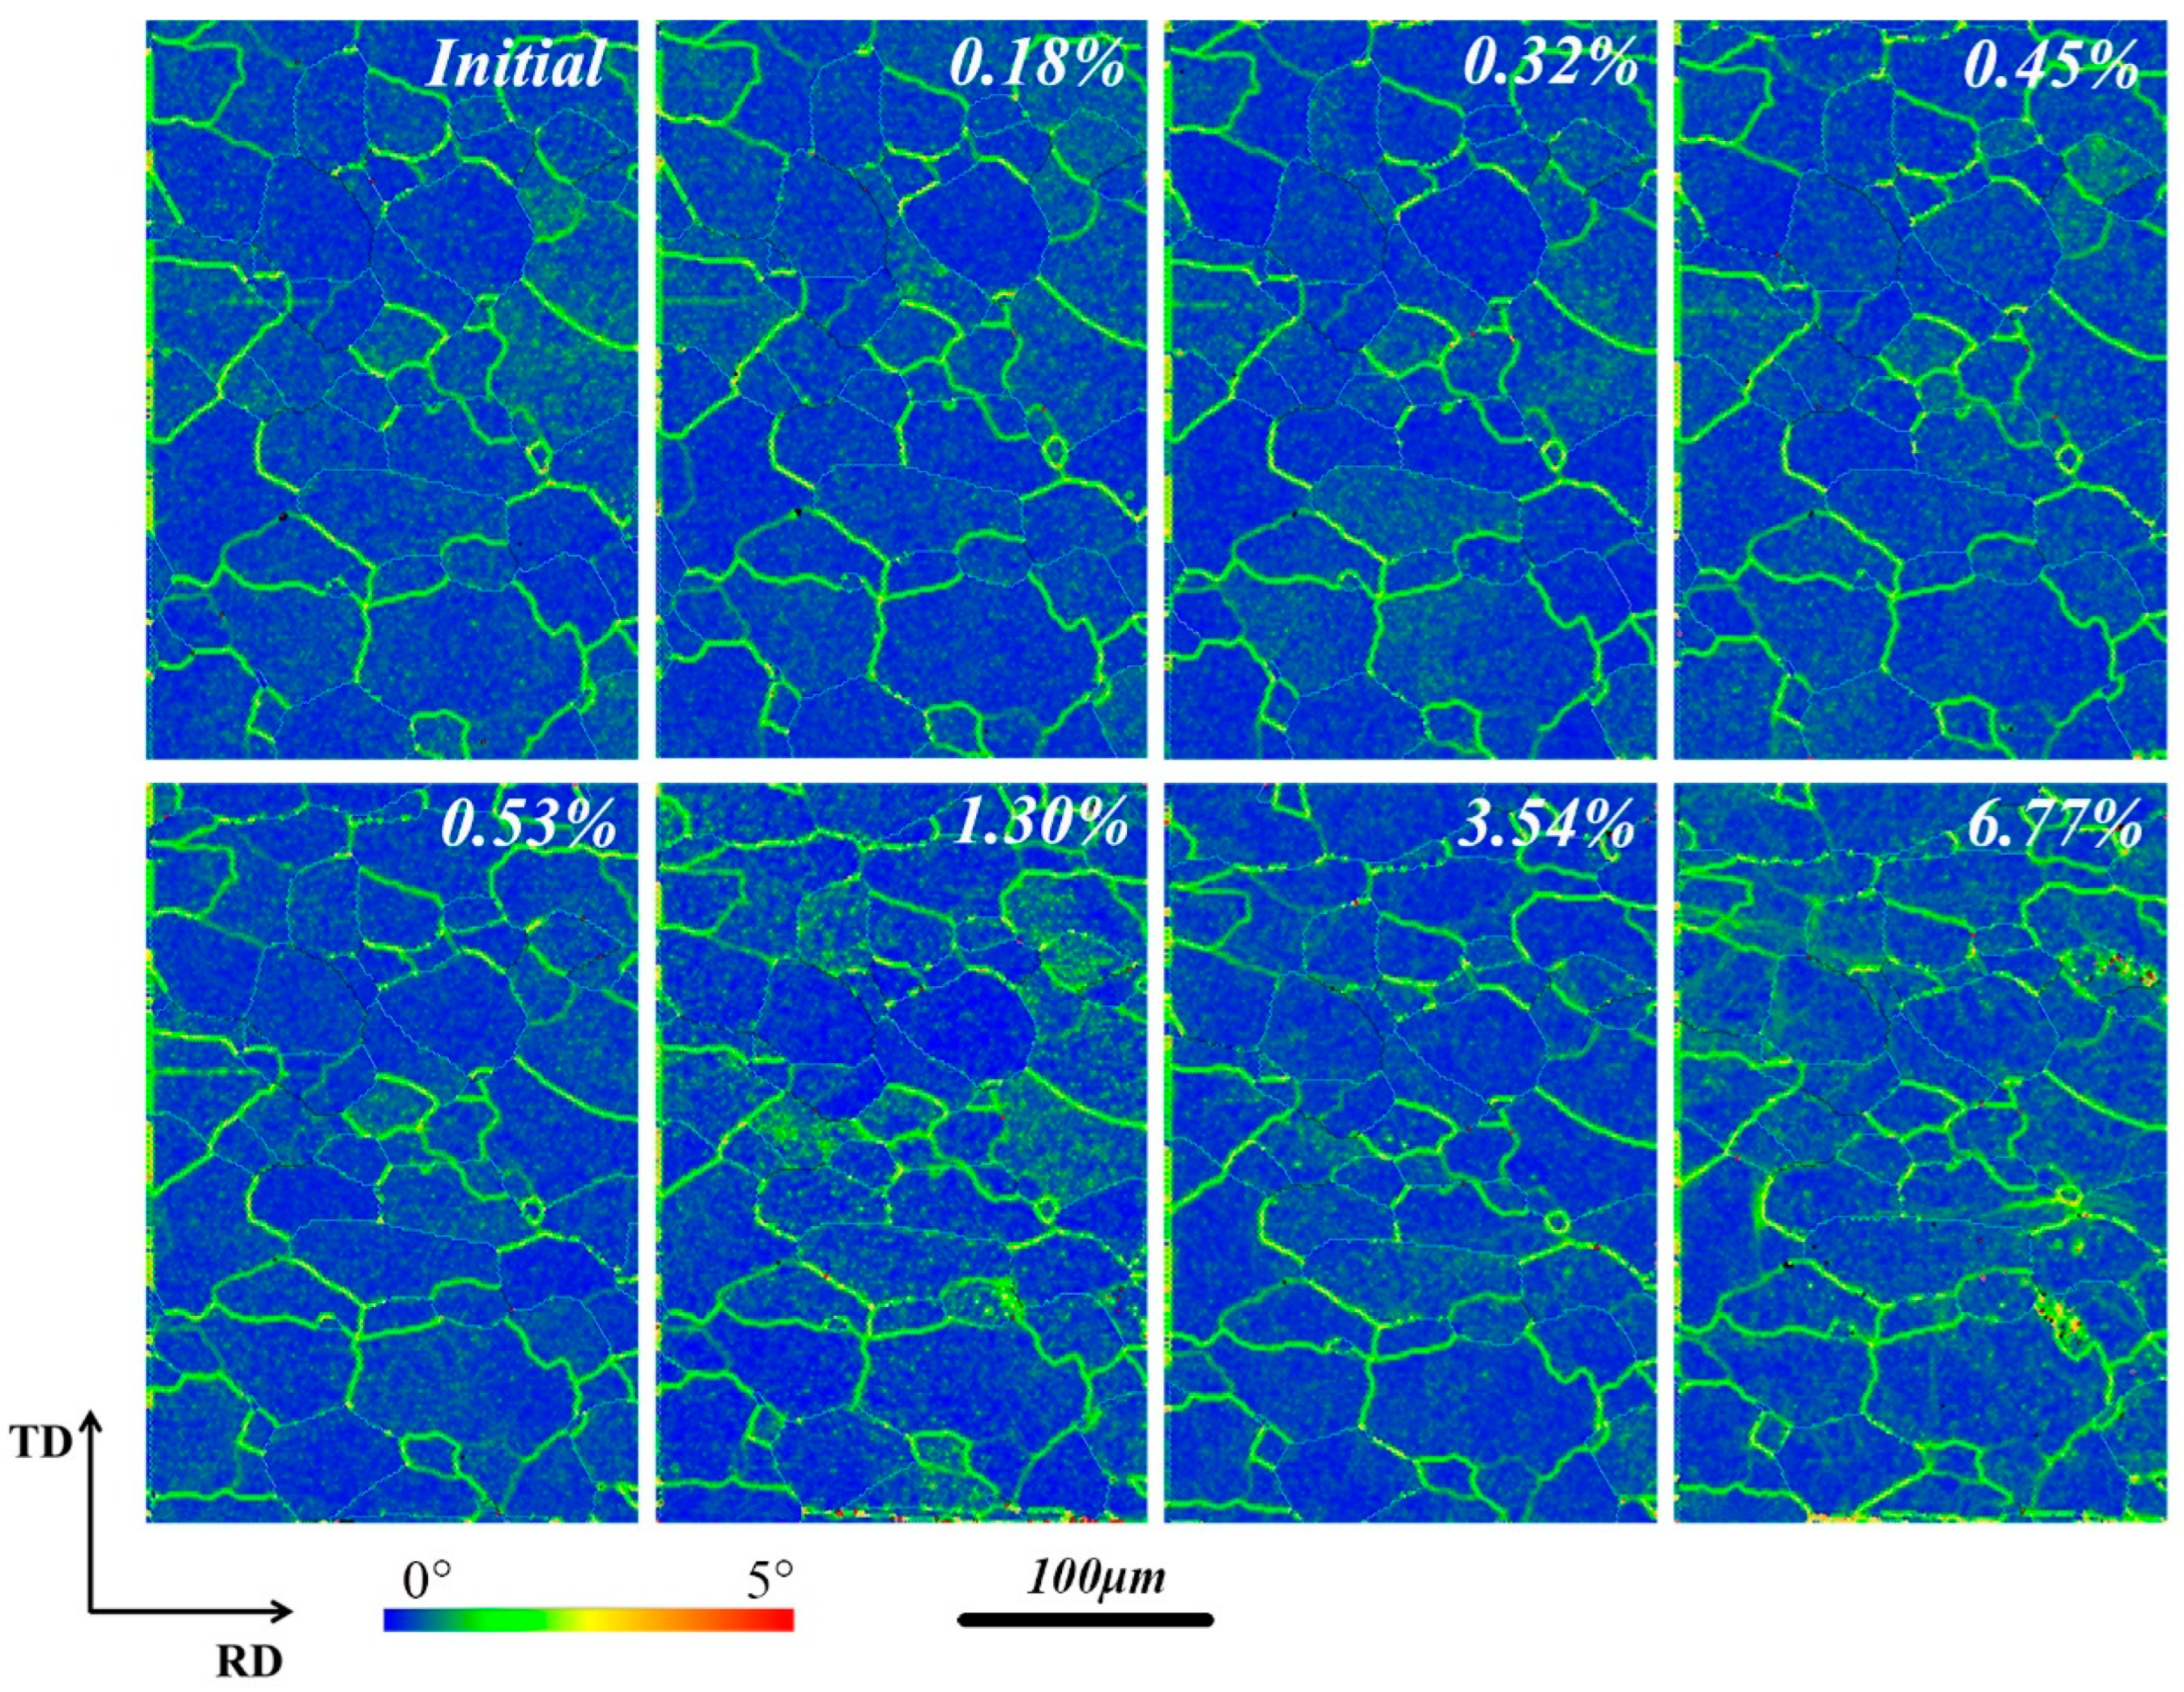
Local misorientation can be used to visualize dislocations through a misorientation kernel approach. In the kernel average misorientation (KAM) mode, the misorientations of the kernel and all the points along its perimeter are measured. The local misorientation value assigned to the center point is the average of these misorientations. It is possible to use either only the points at the perimeter of the kernel or all the points within the kernel itself.
Figure 7 displays the KAM maps for the Ni5W alloy specimen obtained from in-situ EBSD tests at various strains. The average misorientation between each data point and its neighboring points (excluding misorientations greater than the set threshold of 5°) was calculated using the KAM method. In the KAM maps, the green and yellow points, which represent high misorientation angles, indicate the presence of dislocations.
At the initial stage of the specimen, dislocations were found to cluster along the grain boundaries and were evenly distributed within the grains. These dislocations are generated as the sample deforms and slides along the slip plane. It was observed that dislocations increased at a strain of 1.30%, disappeared again at 3.54%, and further increased at 6.77%, as shown in
Figure 7. During the deformation process, dislocations were generated within the crystal lattice and moved along the slip plane. However, the uneven deformation within grains in polycrystalline materials meant that, after being generated, dislocations did not immediately move along the slip plane and instead were trapped at the grain boundaries. These dislocations became entangled, resisting deformation, but would eventually move and disappear as the applied force increased. This indicates that dislocations fluctuate in response to increasing strain. The fluctuation in dislocation density, as seen in the KAM plot, reflects the competitive interaction between dynamic recovery and dislocation proliferation. At a strain of 1.30%, the sudden increase in dislocation density (indicated by the enlargement of the green area) corresponds to an increase in the work hardening rate, which is reflected by the change in slope of the stress-strain curve (
Figure 2b). Meanwhile, dislocation recombination at a strain of 3.54% may be linked to local dynamic recovery.
4. Discussion
As shown in
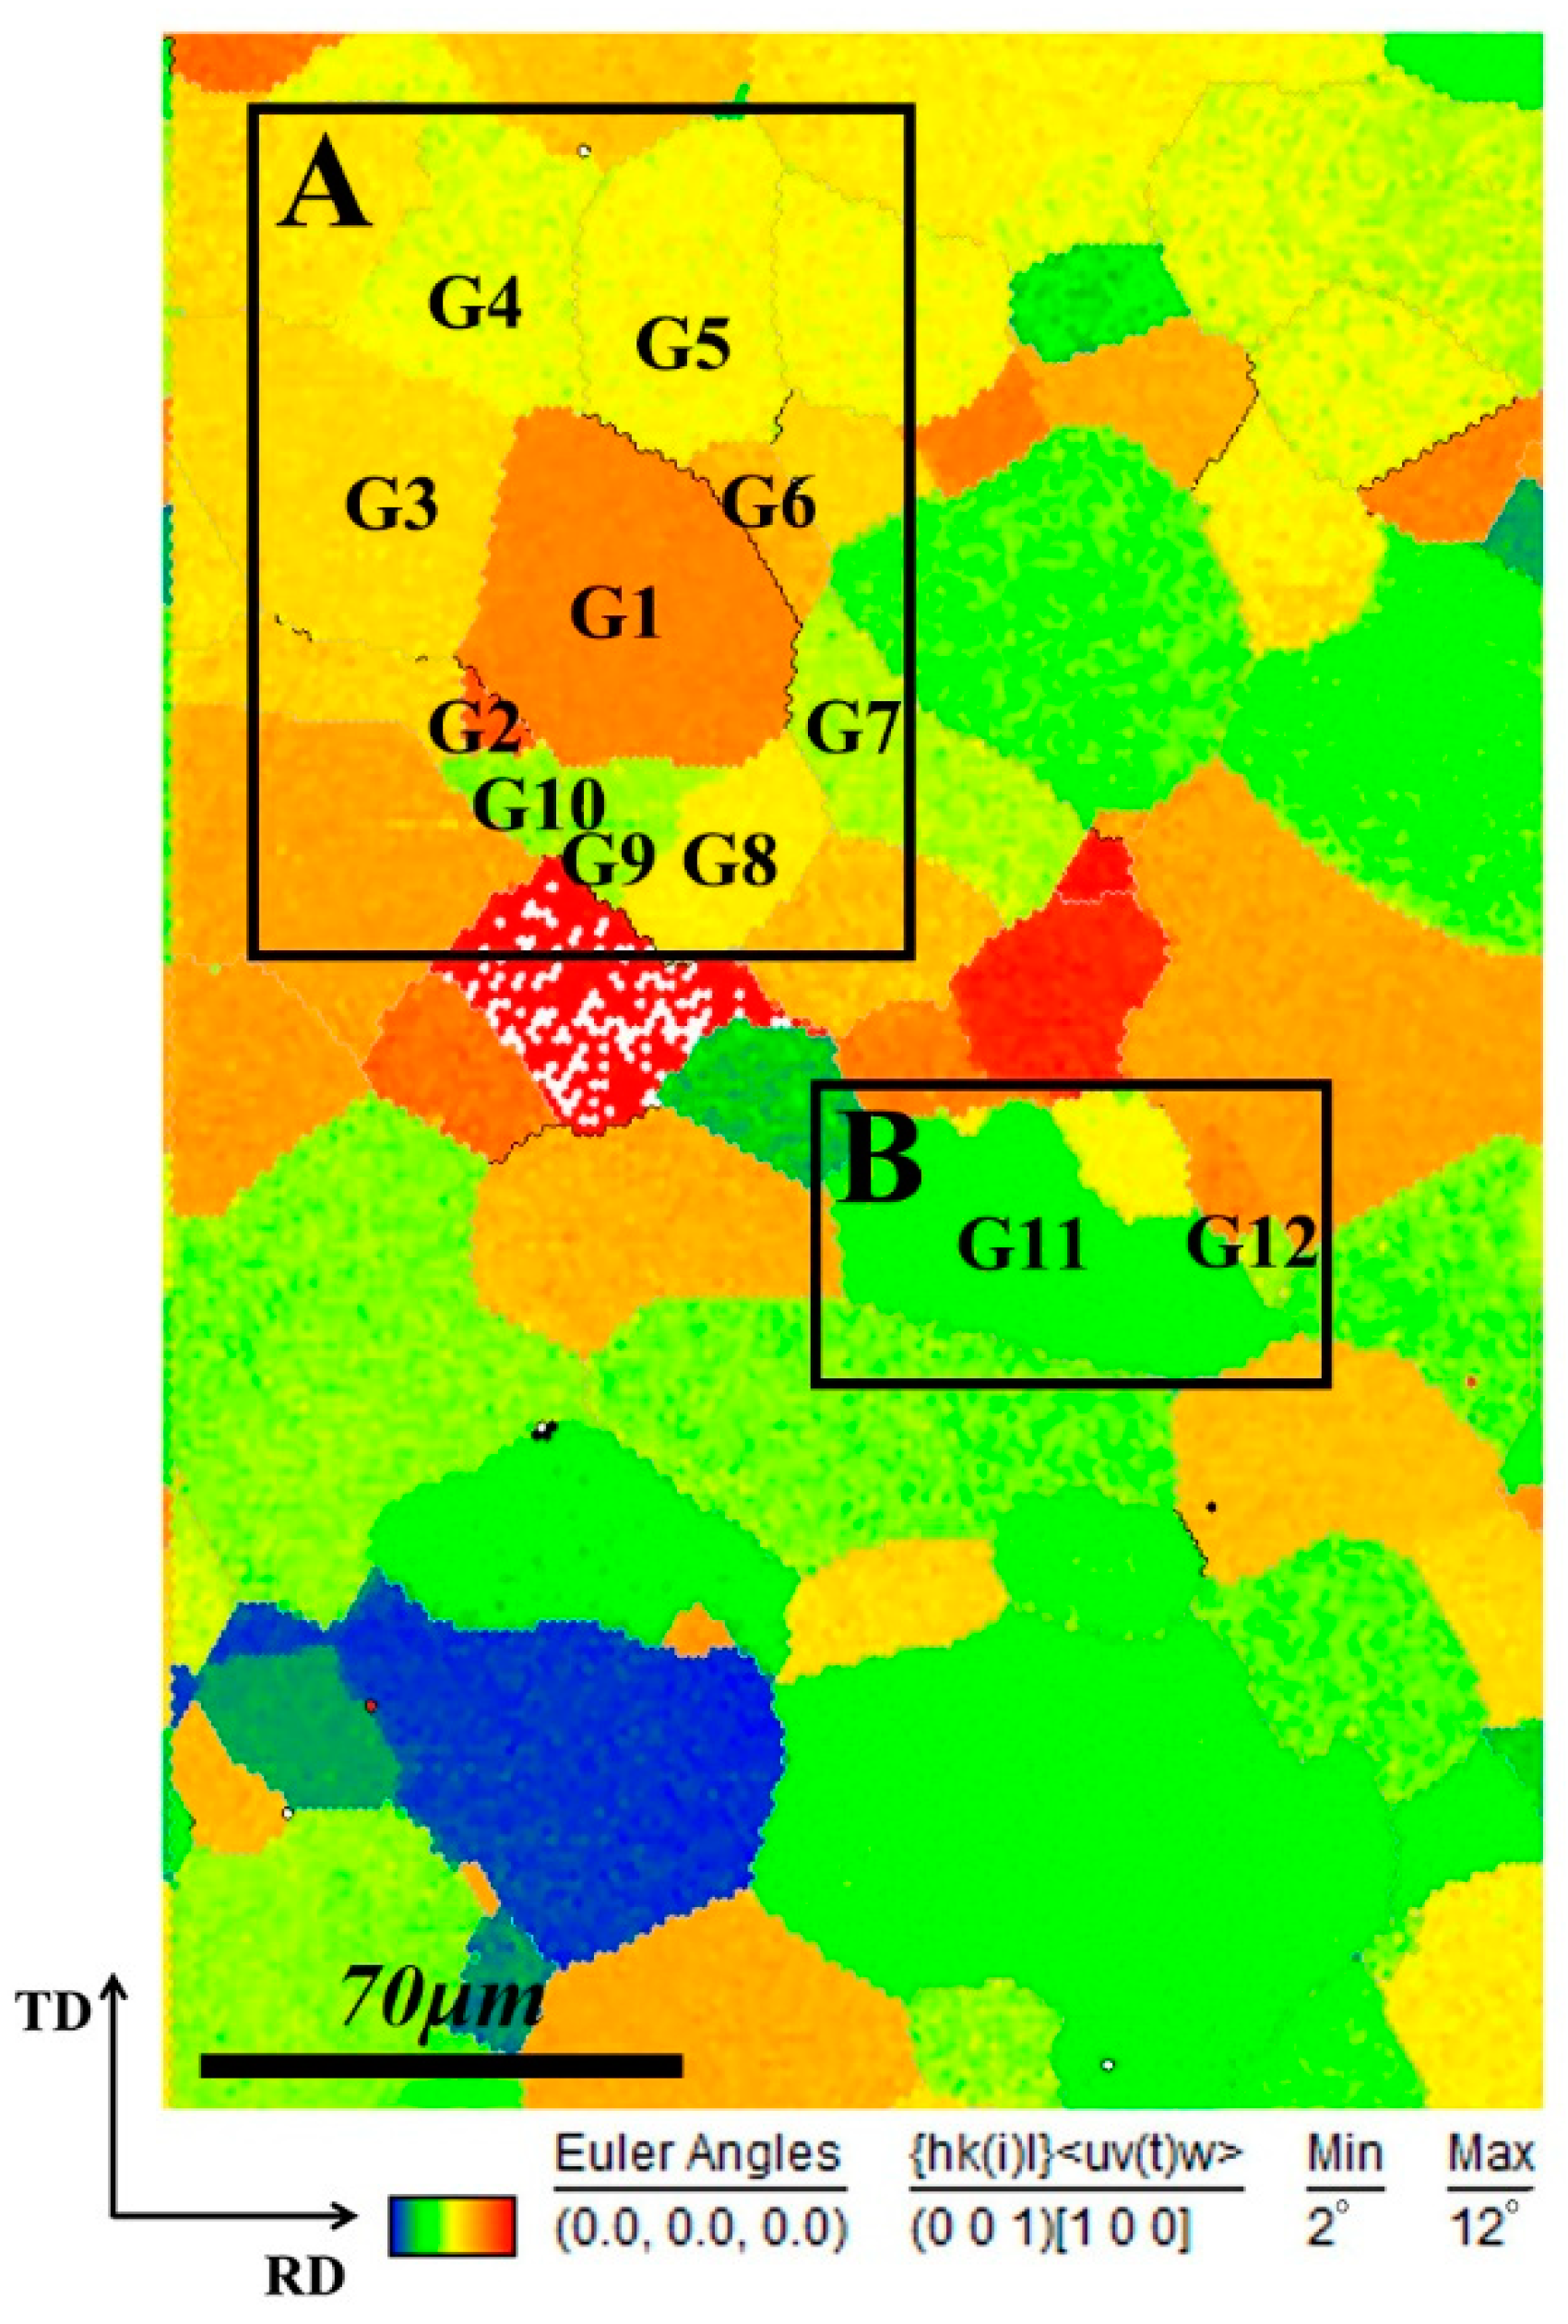
Figure 5, the grains of the Ni5W specimen gradually deviated from the cubic orientation with increasing strain. In this section, we systematically discuss the rotation of grains, the change of dislocations, and the generation of new grains. Two regions have been discussed in detail, as shown in
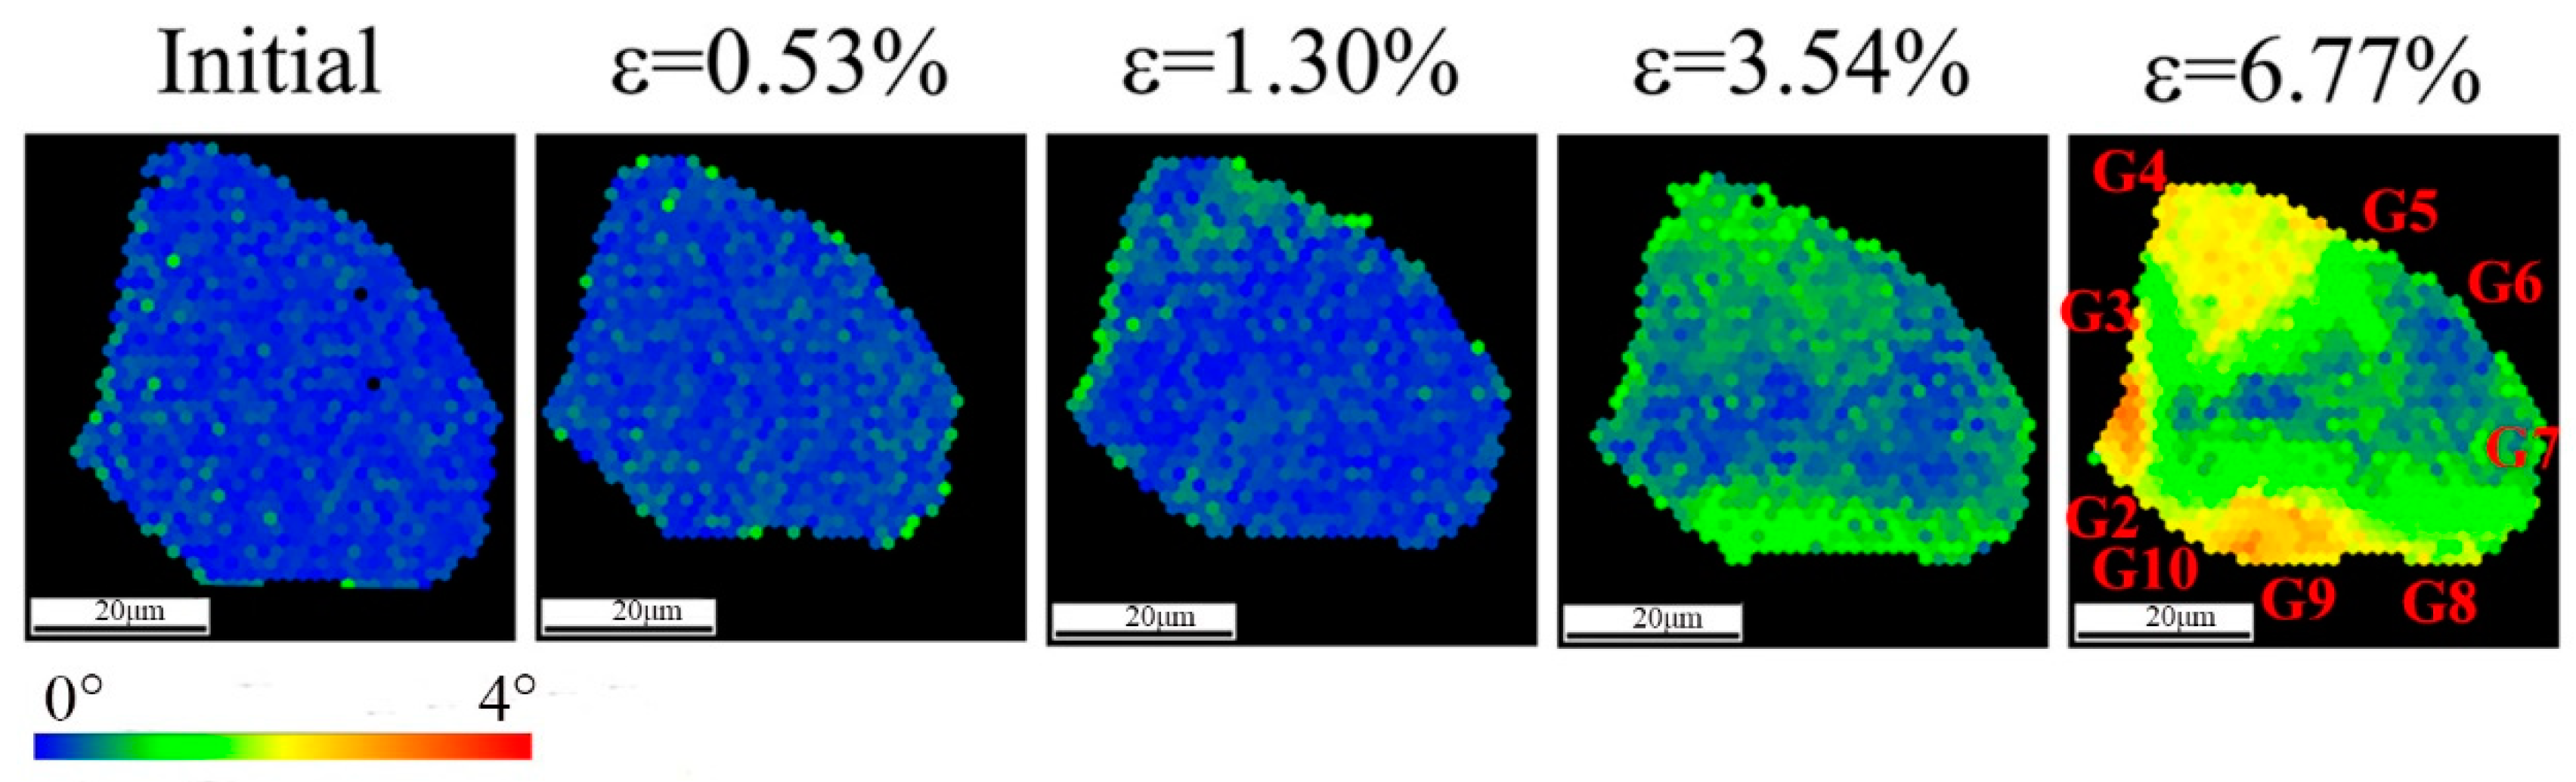
Figure 8. Region A, which contained grains G1–10, was selected to study the rotation and deformation of the grains, as G1 had a high Schmid factor value and deviated away from the cube texture (2–12°) as the deformation increased. Region B contained grains G11 and G12, which were selected to study the formation of new grains as G11 was finally divided into two grains.
As shown in
Figure 9, the misorientations of grains G1–G10 were initially within 10° of each other. However, as the strain increased, their misorientations exhibited varying trends.
Figure 9a highlights a series of transformations that occurred, corresponding with changes in color. In this region, grain G1 initially deviated from its cubic orientation, transforming into a white color (
Figure 9a). This phenomenon is primarily attributed to the relatively high Schmid factor values in G1 (
Figure 9b). The Schmid factor plays a significant role in understanding the orientation transformation in this specimen. For a specimen with a strong cube texture, such as this one, only a single slip system, {111} <110>, is active under uniaxial tension. However, this simple relationship does not apply in polycrystalline materials, where multiple grains with different orientations coexist and complex stress states arise. In
Figure 9a, it can be seen that G1 has a high Schmid factor, indicating its ease of deformation. During plastic deformation, external forces generate dislocations within the crystal lattice, which then move along slip directions within the slip planes. The movement of dislocations along specific directions and planes leads to relative sliding between the two sides of the plane. These dislocation movements collectively cause changes in the grain shape, which are the result of millions of such operations. The deformation of polycrystalline materials involves dynamic interactions between grains, with concurrent shape changes and orientation rotations. Throughout this process, the boundaries between grains must always be in stress equilibrium. In this tensile specimen, grain G1 was in close proximity to nine neighboring grains (G2–G10), the highest number of neighboring grains among all the grains, suggesting a complex stress environment surrounding G1. Additionally, G1 was larger than grains G2 and G6–G10 (G1 ≈ G3–5 ≥ G6–G10 ≥ G2). According to the Hall-Petch theory, the smaller the grains, the more stable they are. A high Schmid factor value and a complex stress environment make it easier for G1 to change its shape and rotate its lattice.
The rotation of grains directly affects the texture distribution of the material. As the cubic-oriented grains deviate from the [100] direction, the Schmid factor distribution tends to spread, leading to differences in the activation probabilities of different slip systems. This orientation dispersion can reduce the anisotropic yield strength of the material and may induce local strain concentration, which in turn affects macroscopic ductility. For example, the high Schmid factor (0.48) of G1 grains causes them to preferentially slip, which hinders the coordinated deformation of adjacent grains (G3, G4), ultimately resulting in uneven necking at the macroscopic level (
Figure 2c).
Figure 10 shows the IPFs of the specimen at different strains. During the elastic deformation process (ɛ < 0.32%), the grains’ orientations changed marginally, which was not obvious in the CO maps (
Figure 5). It is worth noting that some grains gradually deviated from (001) [100] as the amount of deformation increased during the plastic deformation process. In addition, all grains began to diverge from the point of concentration at a strain level of 1.30%. In order to better analyze the change in grain orientation, G1, marked by a red circle in
Figure 11, was selected for specific analysis. At the initial status of the specimen, G1 was located away from (001) [100]. As the tensile strength increased, G1 rotated and deviated from (001) [100], accompanied by deformations, and had a high Schmid factor value and complex stress environment. When the strain was at 1.30%, G1 diverged from the point of concentration, similar to other grains.
Figure 11 shows the grain reference orientation deviation maps of G1 at different strains. In the grain reference orientation deviation maps, the average orientation for the grain is considered as the grain reference orientation, and the different colors in the maps represent the grain orientation deviation angle with respect to the average grain orientation. Maps constructed using this method are helpful in visualizing the distribution of local misorientation within a grain. It can be seen in
Figure 11 that the local misorientation of G1 is within 1° at the initial status. Interestingly, the deformation of the same grain was not uniform because of the influence of adjacent grains. The grains G3 and G4, which had a significantly higher rotation at 1.30% strain (
Figure 9a), caused the position of G1 near G3, G4, to have higher local misorientation than other parts of G1. At the strain of 3.54%, the position of G1 was near G8–10, and it had high local misorientation, indicating that this part of G1 was heavily deformed. When the strain reached 6.77%, the low local misorientation position of G1 only existed in the middle and near G6, as G6 had almost no orientation rotation during the tensile process. Thus, it was predicted that G1 would be divided into multiple sub-crystalline grains if the deformation continued because of the uneven intragranular deformation. In summary, the deformation within one grain was uneven as it was affected by the surrounding grains, and the one grain will be divided into multiple grains, accompanied by deformation.
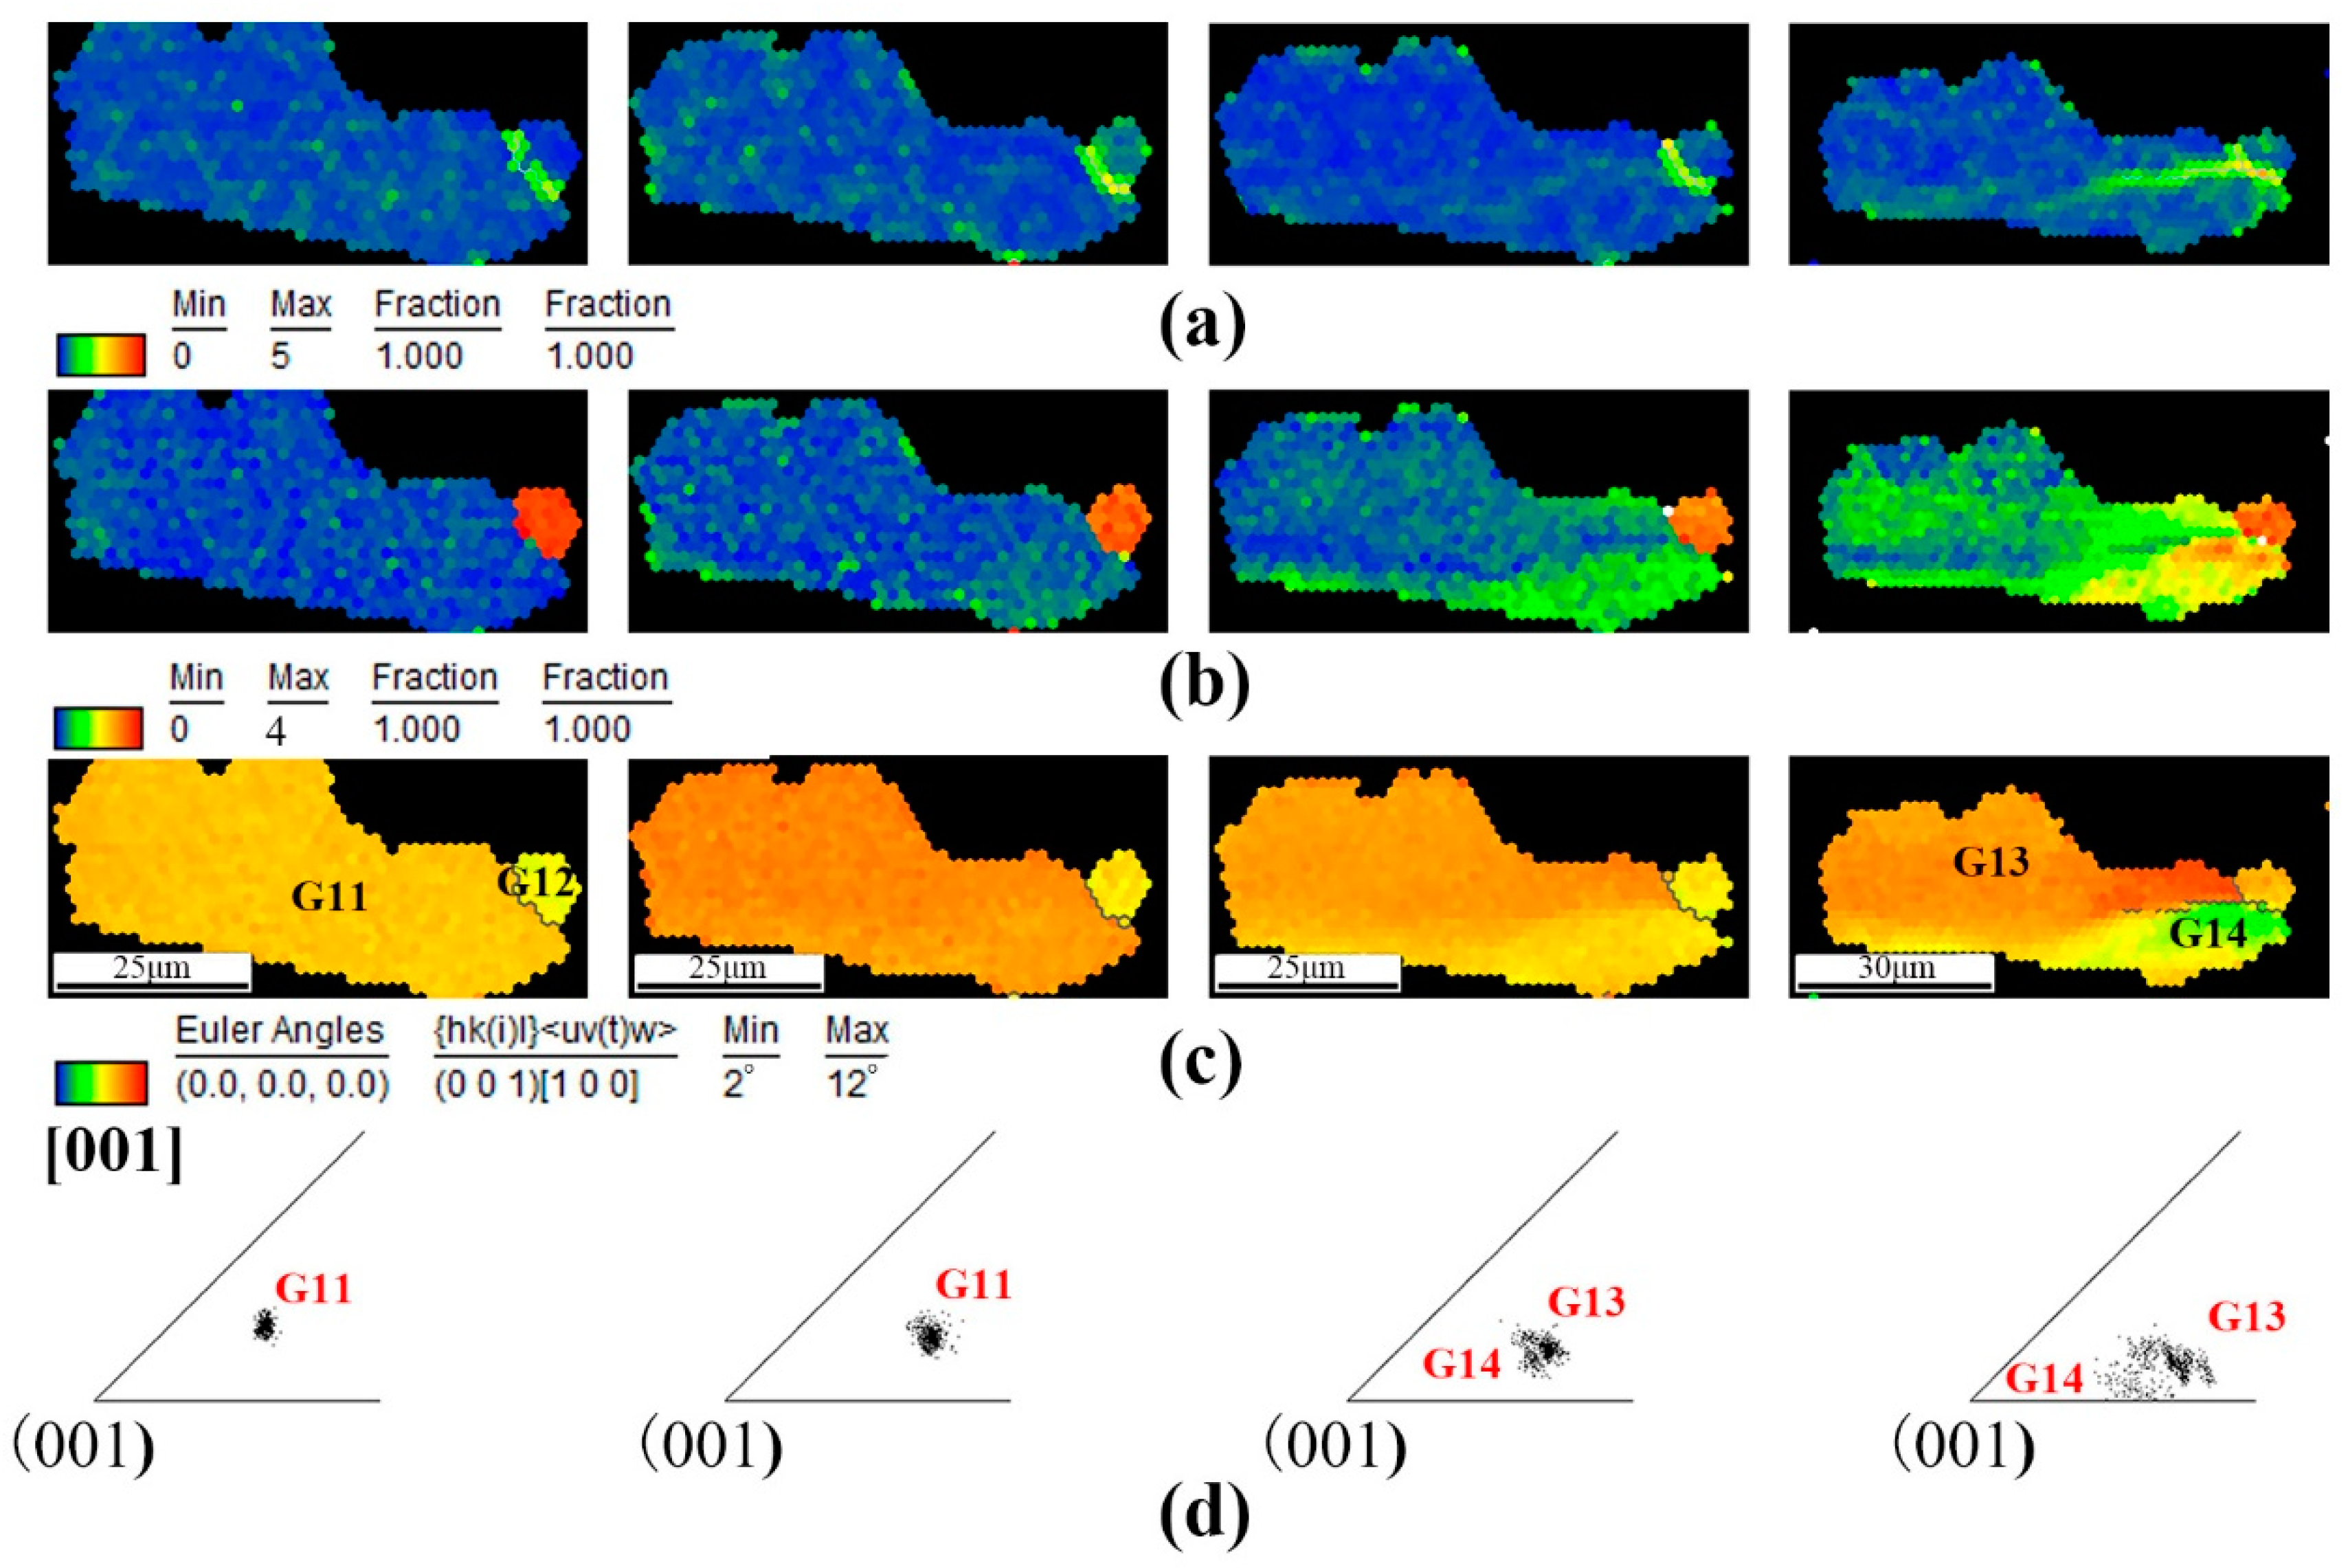
Previously, it was observed that the local misorientation within G1 gradually increased as deformation progressed. This indicated that the uneven deformation within the grain was influenced by the surrounding grains. Despite G1 having a high local misorientation, it did not divide into two grains, even at a strain of 6.77%. However, as shown in
Figure 12, G11 splits into G13 and G14, likely due to the influence of G12. The KAM map (
Figure 12a) of region B reveals that the dislocations, represented by the green line, are concentrated along the boundary between G11 and G12 at 6.77% strain. Additionally, the grain reference orientation deviation maps (
Figure 12b) for region B show that the local misorientation in the lower half of G11 was higher than that in the upper part at a strain of 3.54%. G12 was situated along the dividing line between these two halves. This phenomenon can be attributed to the high stability of G12 during the deformation process, both in terms of its orientation and local misorientation, as shown in
Figure 12b,c. As a result, G11 had to divide into two grains, G13 and G14, in order to complete the deformation. It is also notable that G12 has a very small size (
Figure 8), and its boundary contains numerous dislocations (
Figure 7), contributing to its high stability. During the deformation process, the stable G12 acted like a “nail,” causing G11 to split into two distinct grains, G13 and G14.
In summary, the deformation of grains in a polycrystalline material arises from changes in grain shape and crystal lattice rotation. This study focuses on grain rotation during the deformation process, using in-situ EBSD technology with various models, including scanning electron microscopy, crystal orientation, kernel average misorientation (KAM), Schmid factor, IPF, and grain reference orientation deviation. It was found that grain rotation in the specimen with a single orientation corresponded to its Schmid factor value, adjacent grains, and grain size. First, grains with a high Schmid factor rotated naturally (
Figure 9) because the movement of slip lines in the crystal lattice requires a critical stress that corresponds to the Schmid factor value (σ = τ_CRSS/m). Additionally, grains with more adjacent grains were found to be less stable during deformation, as the presence of grain boundaries, differences in orientation, and variations in the sizes of neighboring grains led to uneven deformation within the central grain, G1 (
Figure 11). Lastly, smaller grains were found to be highly stable, consistent with the Hall-Petch theory, and their stability influenced the strain of adjacent grains (
Figure 12).

 ,
, 


