Article

Study of Tensile Fracture and Interfacial Strength of 316L/Q345R Stainless Steel Composite Plate Based on Molecular Dynamics

1
School of Mechanical Engineering, University of Science and Technology Beijing, Beijing 100083, China
2
Huai Hai Industrial Group Co., Ltd., Changzhi 046012, China
*
Authors to whom correspondence should be addressed.
Metals 2025, 15(5), 502; https://doi.org/10.3390/met15050502
Submission received: 8 March 2025 / Revised: 19 April 2025 / Accepted: 28 April 2025 / Published: 30 April 2025

Abstract

:
This study employs molecular dynamics (MD) simulations to investigate the interface adhesive strength of 316L/Q345R stainless steel composite plates. An atomic model of the 316L/Q345R interface was developed, and tensile performance simulations were conducted to analyze the effects of temperature and strain rate on the material’s mechanical properties. The results demonstrate that the 316L/Q345R interface exhibits superior strength and plasticity compared to both Q345R and 316L individually, with the interface strength being 19.61% higher than Q345R and 29.98% higher than 316L. The study reveals that the ultimate stress of the interface decreases with increasing temperature in the range of 300 K to 600 K, showing a reduction of approximately 0.06 σ0 for every 100 K increase. Additionally, within the strain rate range of 4 × 10⁷ s−1 to 4 × 10⁸ s−1, both the ultimate stress and fracture strain of the interface decrease as the strain rate increases. These findings provide valuable insights into the interface performance of 316L/Q345R stainless steel composite plates, contributing to the understanding of their mechanical behavior under various conditions.

1. Introduction

Metal composite materials, with exceptional properties such as their high toughness, strength, and wear resistance which are difficult to achieve with single materials, have been widely applied in the fields of aerospace, vehicle, and electronic engineering [1,2]. The damage and failure of metal composite materials are closely related to the interface bonding performance. The interface bonding strength is an important indicator for evaluating the bonding performance, which can be obtained through experimental or theoretical analysis methods. In experimental methods, tensile [3], shear [4], peeling [5], bending [6], and impact [7] tests are commonly used to measure the interface bonding strength of composite materials. Although the experimental method can measure the interface bonding strength of composite materials, it requires a lot of time and high economic costs. Particularly, during the experimental process, the inability to determine the interface strength is often due to the primary damage or fracture of the substrate in the composite material [8,9,10,11], and the main reason for this phenomenon is that the interface bonding strength of the composite material is higher than the strength of the substrate.
Another method for measuring the interface bonding strength of composite materials is the theoretical analysis method. Camanho et al. [12] proposed a mechanical model based on fracture mechanics theory to predict the tensile strength of composite laminate. Adams et al. [13] studied the stress distribution of the interface layer under an axial compressive load through theoretical analysis. Wu et al. [14] proposed an empirical formula describing the relationship between failure stress and stress singularity at a three-dimensional interface, predicting the interface strength of composite adhesive joints. Felger et al. [15] studied the interface strength of composite materials under a uniaxial tensile load, assuming that the composite material interface undergoes brittle fracture and the substrate undergoes linear elastic deformation, using fracture mechanics theory. However, due to the need for many simplifications and assumptions in the analytical calculation of the interface bonding strength of composite materials, the interface strength calculated with this method has a large deviation.
For composite materials with an interface bonding strength higher than the substrate strength, both experimental and theoretical analysis methods have difficulty in calculating their interface bonding strength. Therefore, to further explore the bonding strength of composite materials’ interface, some scholars have begun to study the mechanical properties of the interface from the microscopic scale by simulating tensile deformation. Regarding the tensile mechanical behavior of single-metal materials, researchers have conducted detailed studies and explored the effects of temperature and strain rate on their tensile performance. Ma et al. [16] simulated the deformation behavior of single-crystal tungsten under a tensile load and explored the effect of temperature on its tensile mechanical properties, finding that, like FCC metals, the elastic modulus and tensile strength of tungsten decrease with increasing temperature. Meanwhile, Chang et al. [17] simulated the tensile deformation behavior of titanium single crystals along the [0001] direction and explored the effect of the strain rate on the tensile properties of titanium single crystals, finding that the yield stress and fracture strain of titanium single crystals increase with an increasing strain rate.
While some progress has been made in studying the tensile mechanical properties of single-metal materials, some researchers have begun to simulate the tensile behavior of composite materials. Choi et al. [18] comparatively analyzed the mechanical behavior of carbon nanotube/aluminum (CNT/Al) composite materials and pure aluminum under tensile loading, finding that the elastic modulus of (8,8) CNT/Al can be increased by up to 39% compared to pure aluminum, and the corresponding toughness value is increased by nearly 100%. Tomar et al. [19] simulated the tensile deformation behavior of the α-Fe2O3 + FCC-Al composite material, Fe2O3, and Al at room temperature and found that the strength of the α-Fe2O3 + FCC-Al composite material was higher than that of the Fe2O3 and Al materials. The above researchers conducted simulation studies on the tensile mechanical properties of composite materials and compared them with the mechanical properties of single-metal materials, and some scholars have also begun to explore the effects of temperature and strain rate on their mechanical properties. Zhu et al. [20] investigated the effect of temperature on the uniaxial tensile properties of Gr/Al nano-laminated composite materials and found that Gr/Al composite materials have higher strength and elastic modulus and more difficulty undergo plastic deformation at low temperatures. Kardani et al. [21] studied the effect of temperature on the tensile mechanical properties of Cu/Ag nanocomposite materials and found that the yield strength and elastic modulus of Cu/Ag nanocomposite materials decreased with increasing temperature. Zhou et al. [22] studied the effect of strain rate on the tensile properties of nano Cu/SiC composite materials and found that the yield stress increased nonlinearly with an increasing strain rate.
Along with achievements in the study of the tensile mechanical properties of composite materials, some scholars have gradually started to use molecular dynamics methods to study the interfacial phenomena of composite materials. Chen et al. [23] proposed a method to calculate the diffusion layer thickness by simulating the interfacial atomic diffusion behavior during the explosive composite process of Cu/Al, combining molecular dynamics and classical atomic diffusion theory. Qin et al. [24] simulated and analyzed the atomic diffusion behavior at the interface between austenitic stainless steel and iron during the high-temperature compression process and discussed the effects of compression temperature and strain rate on the interfacial diffusion behavior. The above scholars carried out detailed research on the atomic diffusion behavior at the interface, proposing methods to determine the thickness and location of the diffusion layer and comprehensively discussing the effects of temperature and strain rate on the interfacial diffusion behavior. The results showed that the increase in temperature could enhance the diffusion behavior of the interfacial atoms and increase the thickness of the interfacial layer, but the increase in the strain rate weakened the diffusion behavior of the interfacial atoms and reduced the thickness of the interfacial layer.
Based on the determination of the thickness and location of composite materials’ interface layer, some scholars have further explored the atomic structure of the interface and the dislocation nucleation mechanism under loading conditions. Chen et al. [25] proposed a new method to predict the atomic structure of the Mg/Nb interface by combining atomic simulation and interface dislocation theory. Zhang et al. [26] simulated the dislocation nucleation mechanism of the interface structure of various Cu/Nb composite materials under a shear load.
In view of the limitations of the existing methods in the determination of interfacial strength, this paper took a 316L stainless steel/Q345R low-alloy steel composite plate as the research object, put forward a molecular dynamics-based characterization method of interfacial bonding strength, for the first time constructing the atomic-scale model of 316L/Q345R, simulated the process of hot-pressing the composite, and accurately obtained the structure of the composite interfacial layer. It then put forward the method of independently extracting and replicating the structure of the interfacial layer, proposed to generate a specialized “interfacial tensile model”, thus avoiding the problem of matrix destruction and focusing on the analysis of interfacial strength. Finally, the influence of temperature and strain rate on the interfacial bonding strength was systematically investigated. First, in metal–metal composites, the strength of interfacial bonding is significantly affected by the temperature and pressure conditions imposed during the preparation process. A high temperature can significantly enhance the diffusion ability of atoms, meaning that the elements between dissimilar materials have interfacial interpenetration, thus forming a compositional transition layer with a certain thickness and realizing the transformation from physical adsorption to metallurgical bonding. At the same time, applying a certain pressure helps to compact the micro-projections on the surface of the material, increase the contact area of the atoms, and inhibit the formation of holes, thus improving the bonding effect and interfacial strength. In this study, a high temperature of 1500 K and a pressure of 50 MPa were used to establish the atomic structure model of the 316L/Q345R system and conduct hot-pressing composite simulation to obtain the interfacial layer structure of the composite plate. Then, the interfacial layer was extracted along the direction perpendicular to the interface, and the obtained atomic structure model of the interfacial layer was stacked and replicated along the direction perpendicular to the interface to obtain an independent interfacial atomic structure model. Based on the obtained interfacial atomic structure model, the tensile simulation of the interfacial layer structure model was carried out to determine the bond strength of the composite plate interface, and the effects of temperature and strain rate on the bond strength of composite plates were systematically discussed.

2. MD Simulation and Methods

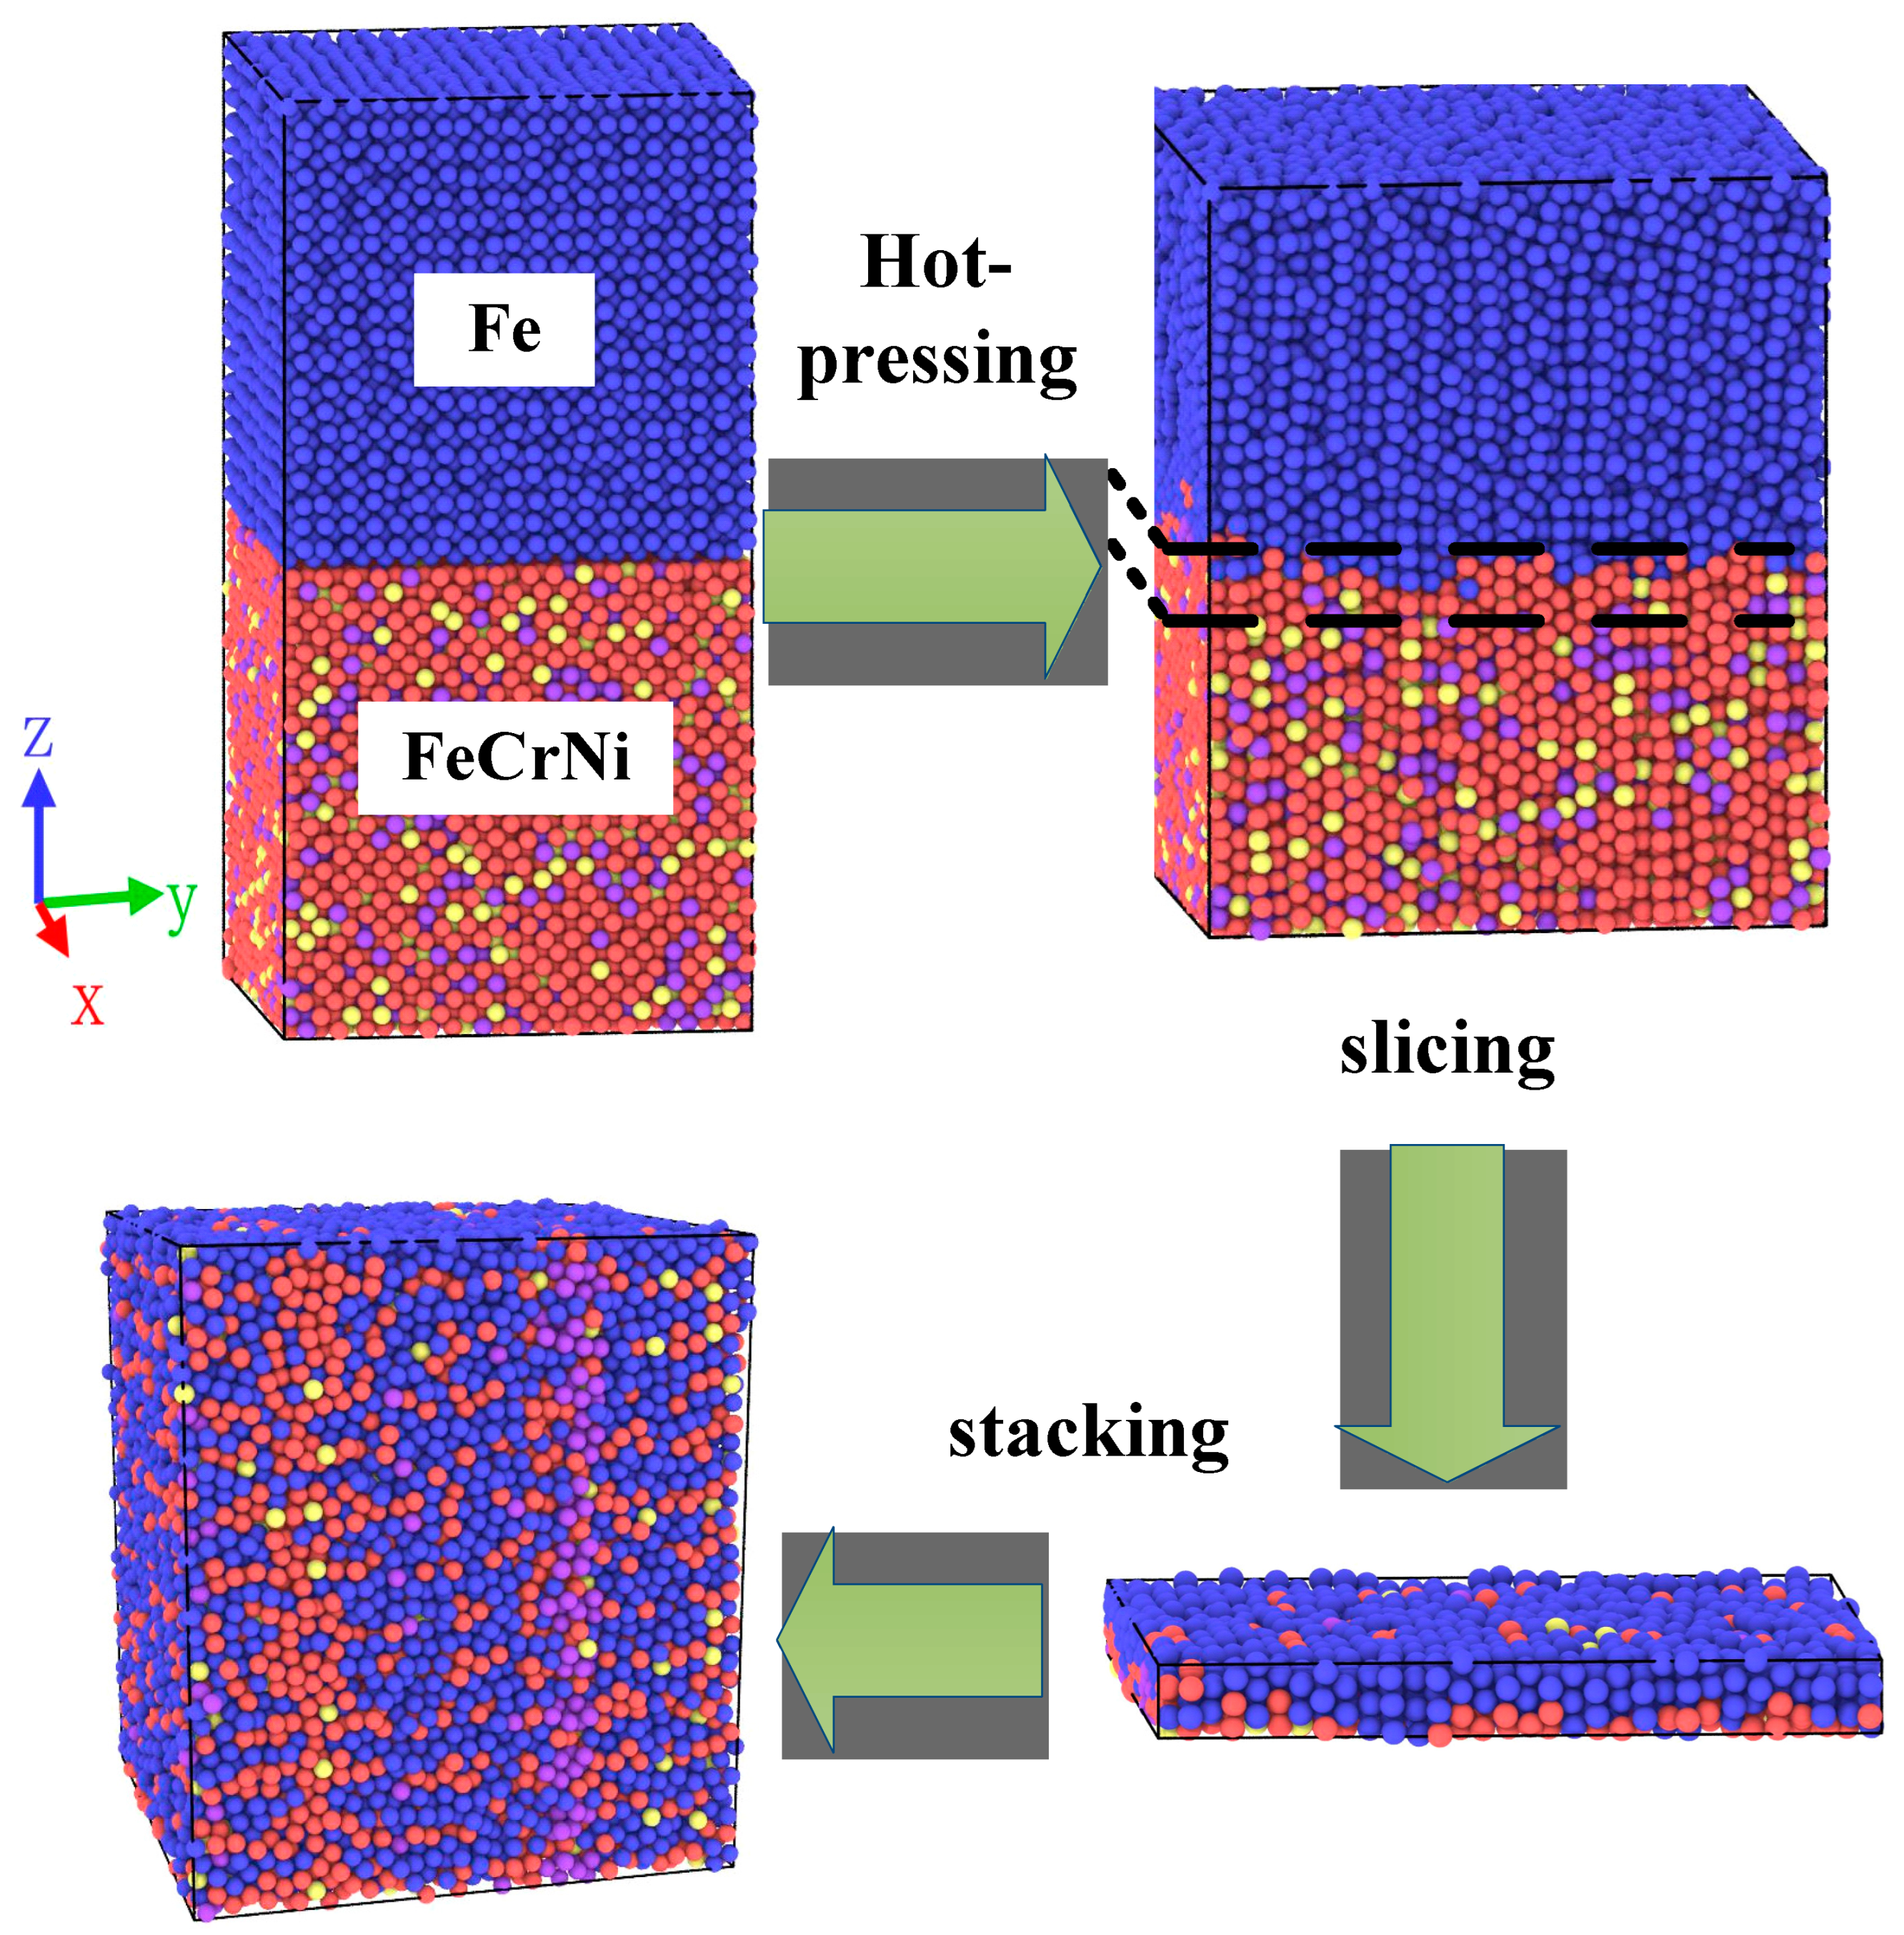
2.1. Model Establishment

This paper took a 316L/Q345R composite plate as the research object and proposed a method to determine the interfacial bonding strength of the composite plate based on molecular dynamics theory. The elemental compositions of 316L and Q345R materials, excluding iron, are shown in Table 1. To simplify the microscopic model, this study chose to ignore the trace elements in 316L and Q345R materials. The total content of elements other than iron in Q345R low-carbon steel was less than 2%, so Q345R low-carbon steel was simplified to pure Fe without other elements. For 316L stainless steel, only the relatively large content of Cr and Ni elements needed to be considered (the content of Cr and Ni was 16.03% and 10.03%, respectively), and the atomic number ratio of the elements was Fe:Cr:Ni = 35:8:5 (error < 0.1%, proportionality highly consistent with original values). Therefore, this paper used the Fe74-Cr16-Ni10 alloy to simulate 316L stainless steel material, ensuring that its structure and performance were basically similar.
In order to determine the bonding strength of the composite plate interface, a 316L/Q345R stainless steel composite plate model was established. The composite plate interface was obtained by simulating the hot-pressing composite process. The composite plate interface layer was defined as the region where the atomic concentrations of Fe, Cr, and Ni along the compression direction (Z-axis) were all greater than 5%. The 5% cutoff was chosen to exclude tail-end fluctuations due to thermal perturbations while capturing the chemically affected transition zone, consistent with previous studies on diffusion-based interface identification [23,24]. Based on the interface layer judgment criteria, the thickness and position of the composite plate interface layer were determined. The OVITO (version 3.12.2) visualization software [27] was used to extract the determined interface layer from the composite material model, and then the interface layer was stacked along the Z-axis direction using the Replicate Command instruction in the LAMMPS [28] software package (version lammps-3Mar2020) to obtain the final interface layer structure model for subsequent tensile simulation research. Meanwhile, models of the 316L and Q345R base materials with the same interface layer structural dimensions were also established. By comparing the tensile simulations of these three materials under the same conditions, the bonding strength of the composite plate interface was characterized.
The constructed 316L/Q345R composite plate model is shown in Figure 1. The upper layer of Q345R low-carbon steel had a body-centered cubic structure of pure Fe; the lower layer of 316L stainless steel was based on the face-centered cubic structure γ-Fe, with Cr and Ni atoms randomly replacing the lattice sites in a predetermined proportion. Their contact surface was an ideal (100) plane. The size of the upper Q345R low-carbon steel was 20a1 (X) × 20a1 (Y) × 20a1 (Z), and the size of the lower 316L stainless steel was 16a2 (X) × 16a2 (Y) × 32a2 (Z) (a1 = 0.287 nm and a2 = 0.359 nm were the lattice constants of body-centered cubic iron and face-centered cubic iron, respectively). The total number of atoms in the model was 32,384, with 16,000 atoms in the Q345R low-carbon steel region and 16,384 atoms in the 316L stainless steel region. The composite plate model was established with periodic boundary conditions in the X and Y directions. Along the Z-axis direction, two layers of atoms were fixed on the upper surface of the Q345R material and the lower surface of the 316L material to form a fixed interface.
In molecular dynamics (MD) simulations, the rational selection of boundary conditions is a key strategy to balance computational efficiency and physical realism. Among them, periodic boundary conditions (PBCs) and Lees–Edwards boundary conditions (LECs) are two types of core methods. In this paper, we chose periodic boundary conditions, which are characterized by the fact that, when a particle in the cell moves outside the simulated system, at the same time there will be particles entering from the adjacent system from the relative direction, and its mathematical expression is
A x = A x + n L , n = n 1 , n 2 , n 3
where A is a physical quantity parameter, n1, n2, and n3 are any integer, and L is the boundary length of the simulation system.
Molecular dynamics (MD) simulations are based on the thermodynamic system of systems theory, which constructs the behavior of atomic/molecular dynamics in the framework of statistical mechanics by constraining the macroscopic covariates of the system (e.g., temperature T, volume V, pressure P, or energy E). Depending on the research needs, the system can be modeled using the microcanonical variety (NVE, where N, constant number of particles; V, volume; and E, energy), the canonical variety (NVT, constant N, V, and T), or the isothermal and isobaric variety (NPT, constant N, P, and T), respectively.

2.2. Simulation Method

The EAM potential is used to describe the interactions between Fe, Cr, and Ni [29]. In addition to the interatomic interaction V, this potential function also includes the cohesive energy F (dependent on the local electron density ρ). The latter term approximates the many-body potential interaction of all neighboring atoms. The total energy in the EAM can be represented by the following form of the many-body potential function:
E = 1 2 i , j = 1 j i N V t i t j r i j + i = 1 N F t i ρ i j
rij represents the distance between atoms i and j, N denotes the total number of atoms in the system, and ti and tj indicate the specific chemical compositions (Fe, Ni, and Cr). The local electron density contributed by the neighboring atoms surrounding atom i is given by
ρ i = j = 1 j i N φ t j r i j
This text discusses the use of molecular dynamics (MD) simulations to study the properties of the FeNiCr ternary system. The potential function φ representing the electron density of the elements was defined, including 12 functions such as φFe, φNi, φCr, EFe, ENi, ECr, PFeNi, PFeCr, PNiCr, PFeFe, PNiNi, and PCrCr. This potential function was validated by previous studies and can be used for simulating FeCrNi/Fe systems.
The simulation process involved initializing the atoms with Maxwell–Boltzmann velocity distribution, numerically integrating the equations of motion using the velocity Verlet algorithm with a time step of 1 × 10⁻¹⁵ s, and relaxing the structure to equilibrium using a Nose–Hoover thermostat and barostat.
For compression simulation, the system was first relaxed at 1500 K and 0 pressure for 20 ps, then compressed along the Z-direction at a strain rate of 3 × 10⁹ s−1 for 100 ps, under NPT ensemble with periodic boundary conditions. For tensile simulation, the system is first relaxed at 300 K and 0 pressure for 200 ps, then stretched along the Z-direction at a strain rate of 4 × 10⁸ s−1 for 800 ps, under the NVT ensemble with fixed lateral dimensions. All simulations were performed using the LAMMPS software, and the atomic data were processed using the OVITO visualization tool.

3. Results and Discussion

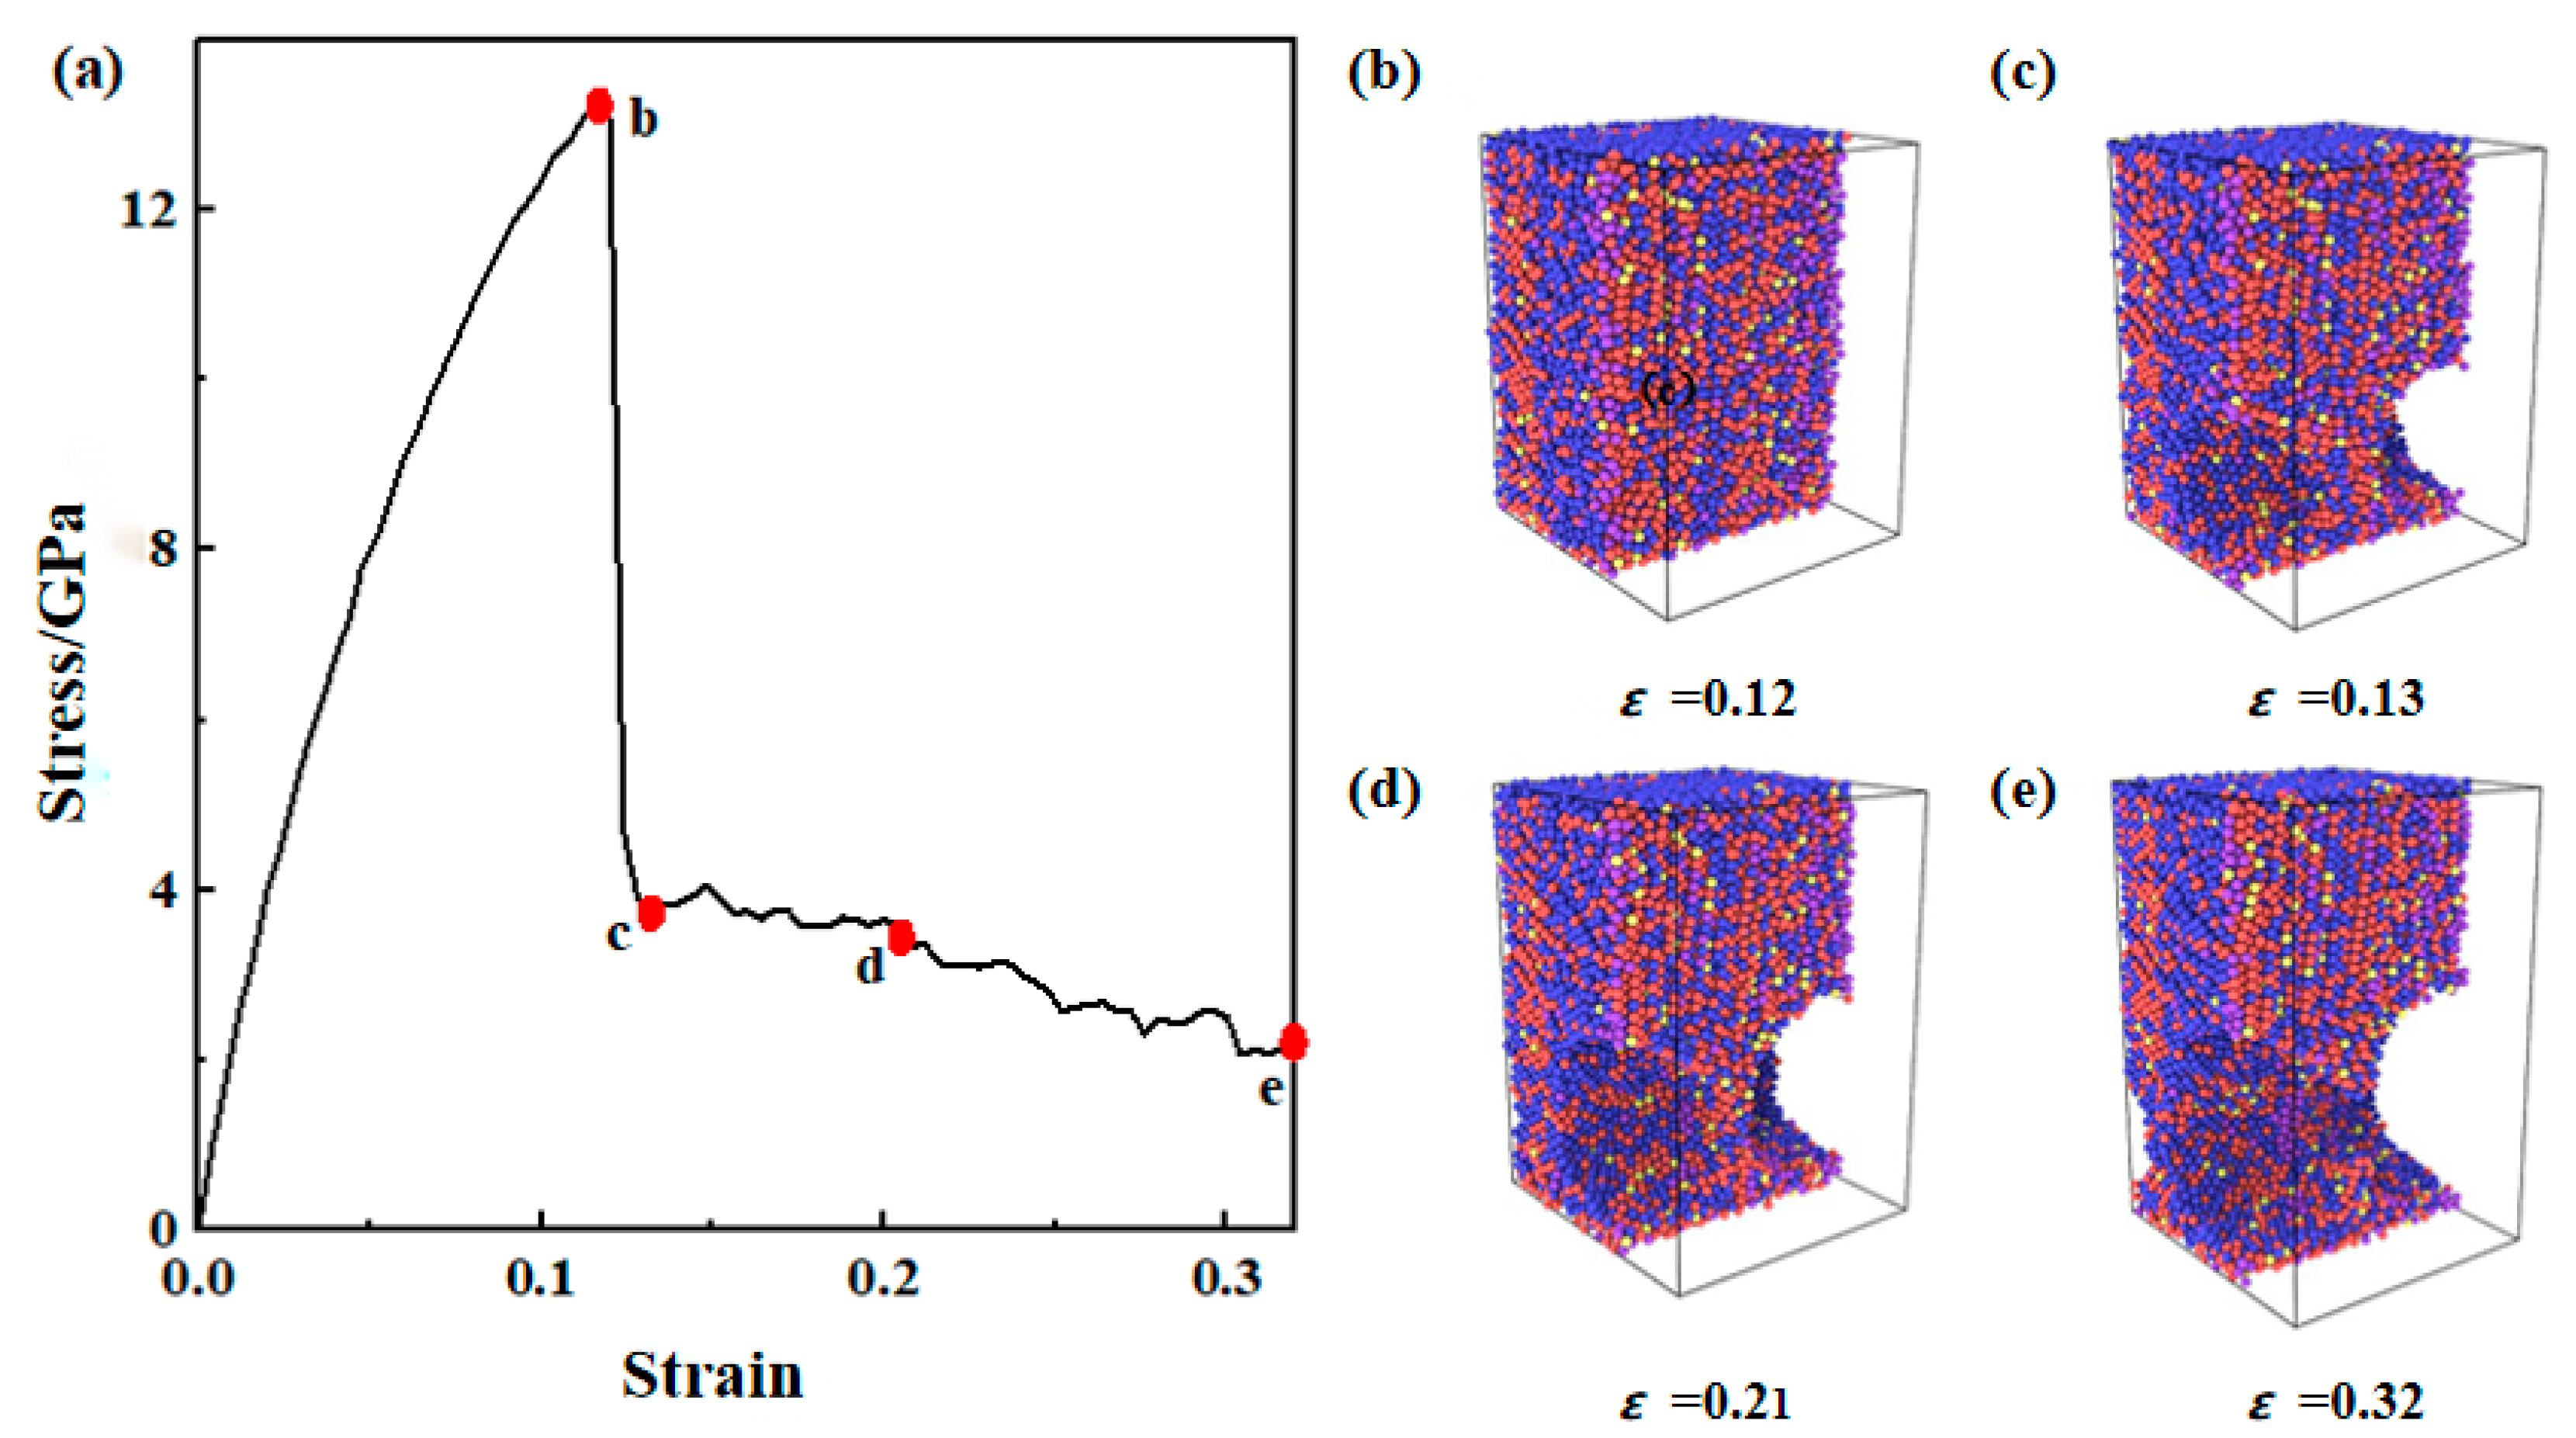
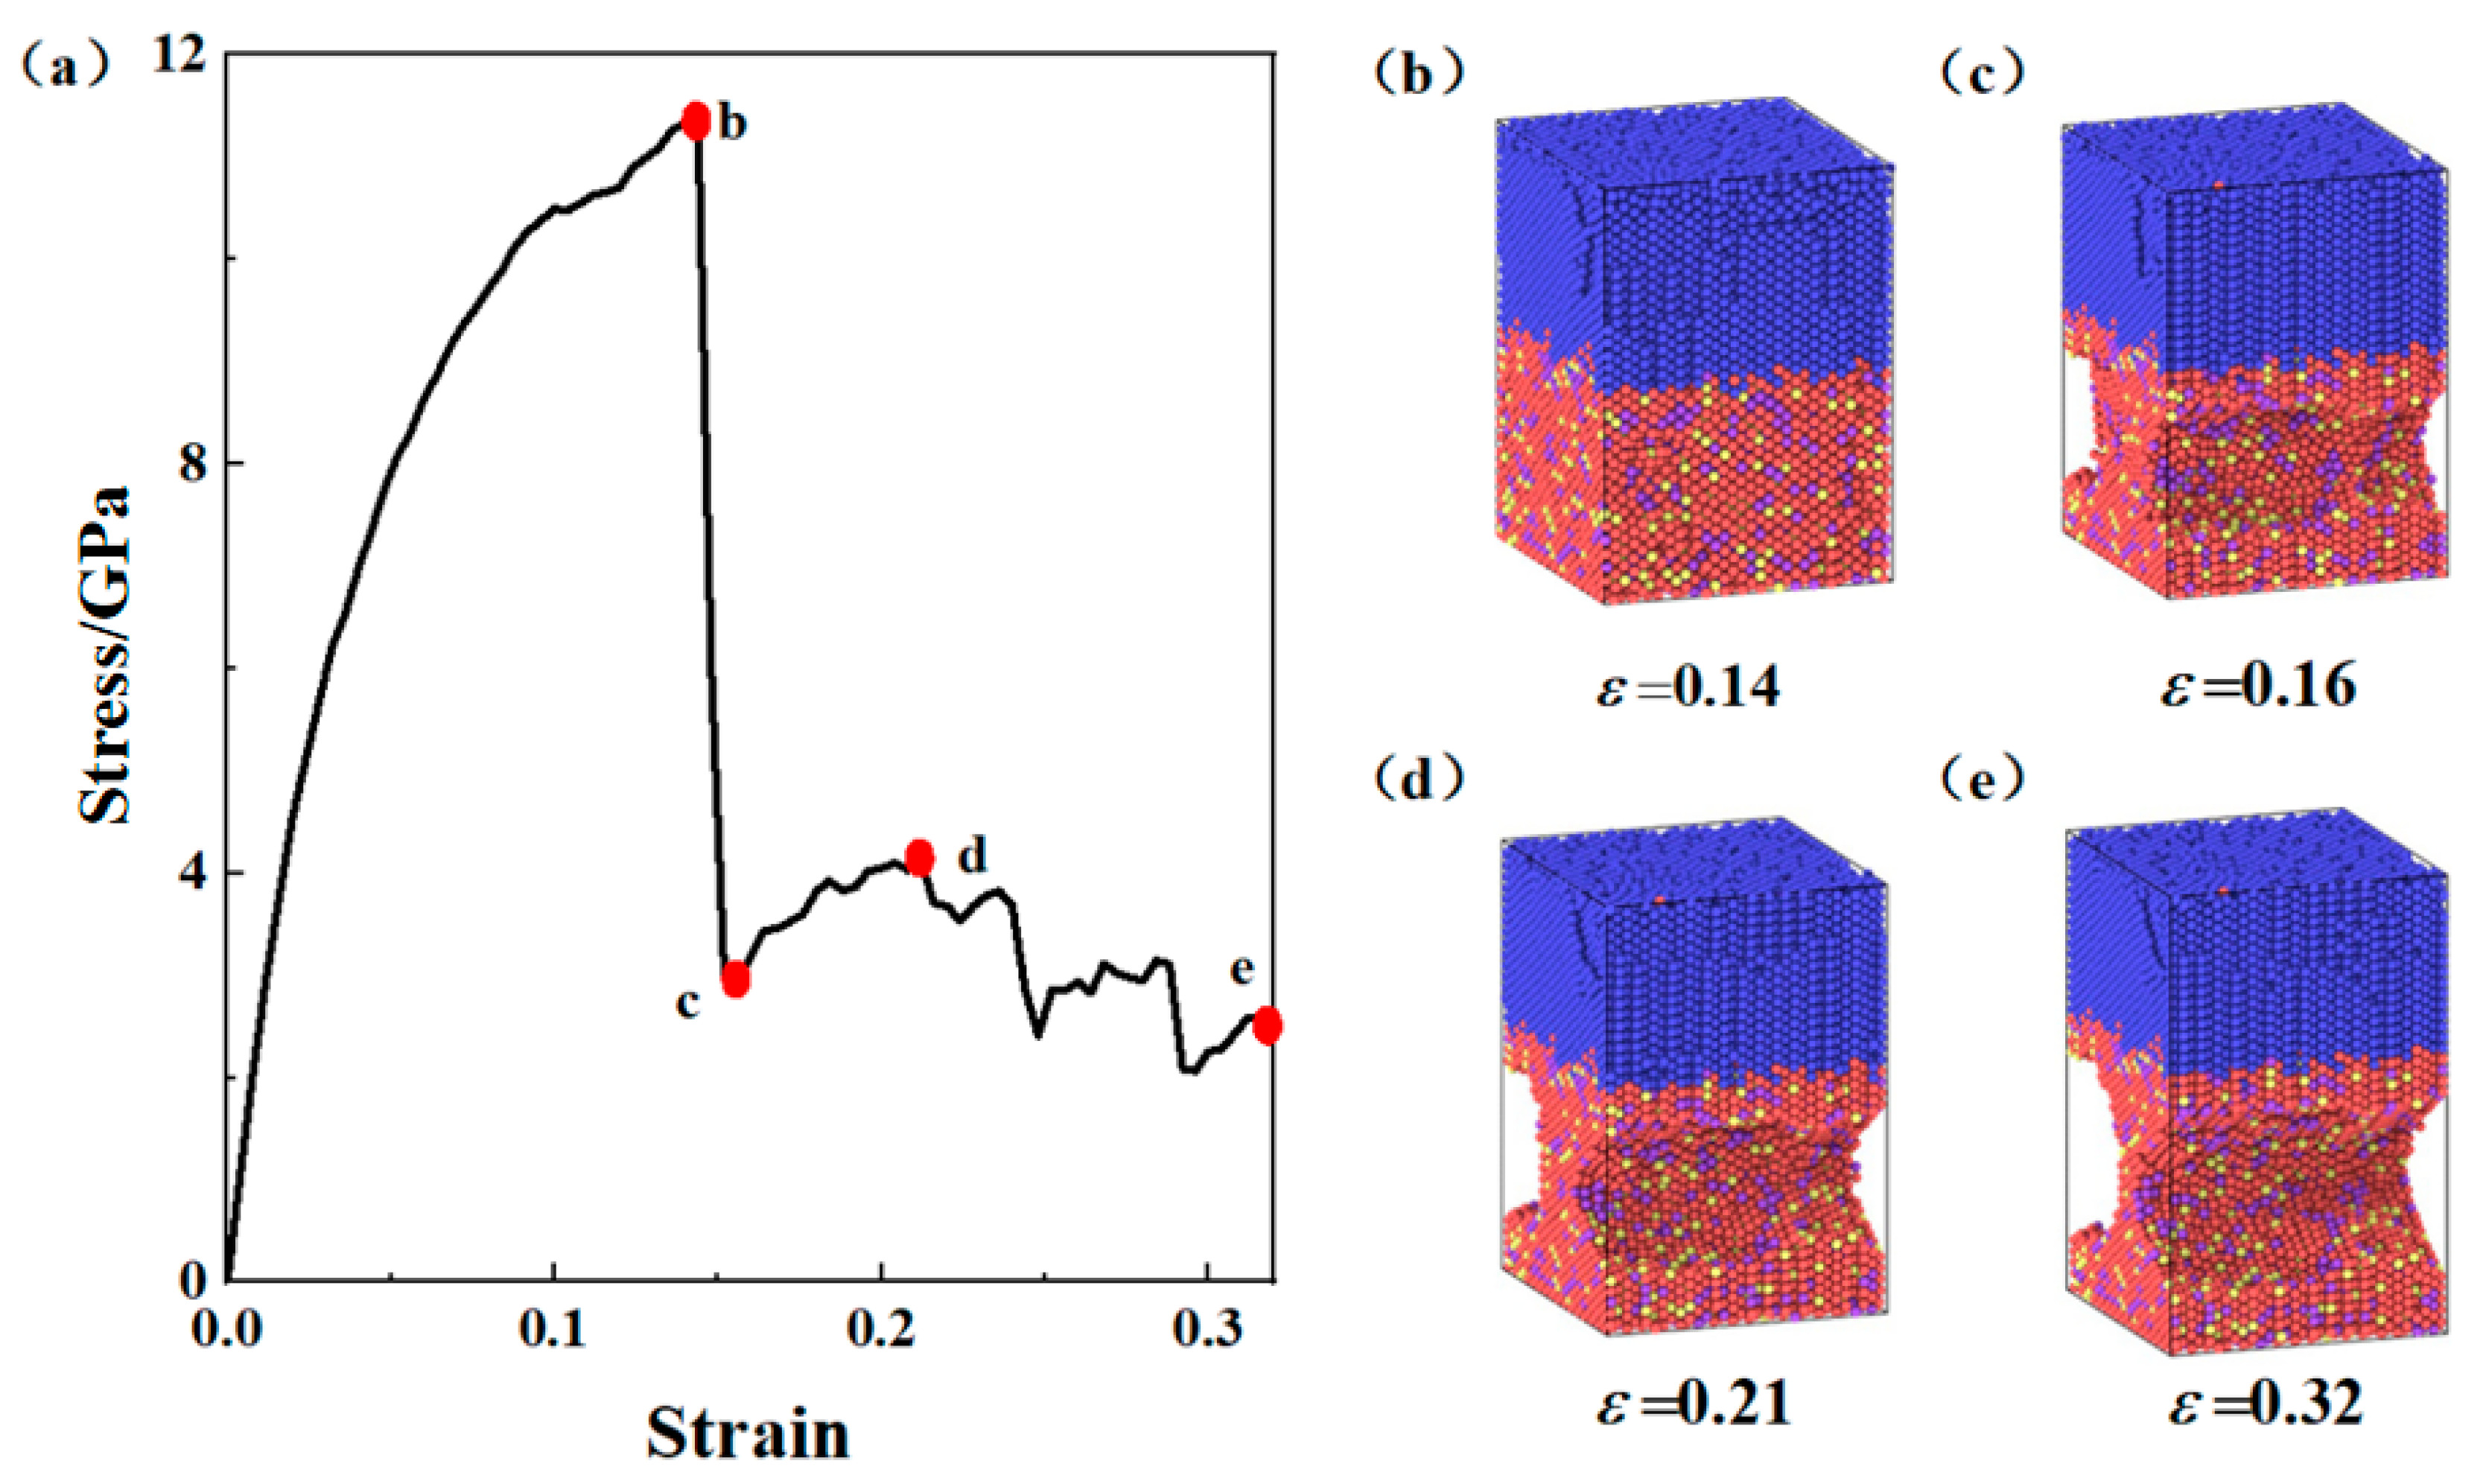
3.1. Tensile Deformation Process of the Composite Plate Interface

In Lammps, the stress values were calculated using the virial stress formula commonly used in molecular dynamics simulations with the following expression:
σ α β = 1 V i m i v i α v i β + i < j r i j α F i j β
where σαβ denotes the components of the stress tensor, V is the volume of the system, mi and viα are the mass and velocity components in the α direction of the ith atom, respectively, and rijα and Fijβ are the relative displacements between the ith and jth atoms and the components of the interaction forces in the α and components in the β direction.
The stress–strain curve and the evolution of the atomic structure of the 316L/Q345R composite plate interface under uniaxial tensile loading along the Z-axis are shown in Figure 2. For ease of discussion, the load points at different deformation stages are labeled as b, c, d, and e, with the subscripts corresponding to the model numbers. When ε ≤ 0.03, the curve was in the linear elastic stage, where the stress increased linearly with the strain, similar to the elastic deformation of metals on the macroscale, indicating that the elastic deformation of the material at the nanoscale still followed Hooke’s law. When ε ≥ 0.03, the stress–strain curve entered the elastic–plastic stage, with the stress continuously increasing as the strain increased. When the strain ε = 0.12 (point b), the stress reached the maximum value. In the molecular dynamics simulation, the maximum stress value was much higher than the experimental value, which was due to the perfect lattice structure of the model without defects, such as dislocations, voids, and impurities, which were present in the material on the macroscale.
When ε > 0.12, the stress decreased rapidly, entering the plastic flow stage, until reaching the maximum strain (ε = 0.32). During the plastic flow stage, the continuous breaking of metal bonds caused the stress at the composite interface to decrease, while the displacement of interface atoms under plastic deformation led to the formation of new metal bonds, causing the stress to rise again, resulting in stress fluctuations in the stress–strain curve (stage c–e). When ε increased from 0.13 to 0.21, the stress decreased by 3.60%; when ε increased from 0.21 to 0.32, the stress decreased by 57.64%. The fracture evolution process is clearly depicted in Figure 2b–d: in Figure 2b, atomic arrangements become disordered with growing dislocation activity; in Figure 2c, visible cracks emerge at the interface, marking the onset of the fracture; in Figure 2d, these cracks propagate and coalesce, leading to a large-scale interfacial failure. This structural evolution corresponds well with the observed stress decline, indicating the underlying atomic-scale fracture mechanisms during plastic flow. That is, when 0.13 ≤ ε ≤ 0.21, the stress decreased slowly with increasing strain, while when 0.21 ≤ ε ≤ 0.32, the stress decreased significantly with increasing strain.
When ε = 0.12, the atomic structure of the composite plate interface is shown in Figure 2b, where the atomic arrangement is disordered, and dislocations are continuously increasing, leading to a rapid decrease in stress. When ε = 0.13, the atomic structure of the composite plate interface, as shown in Figure 2c, exhibited clear fracturing. When 0.13 ≤ ε ≤ 0.32, the atomic structure of the composite plate interface, as shown in Figure 2c–e, became increasingly fragmented along the Z-direction as the tensile process progressed. As the composite plate fractured, the tensile stress gradually decreased until the final destruction of the interface structure.
To further investigate the bonding strength of the composite board interface, the tensile deformation process of the 316L/Q345R composite board was also simulated. The stress–strain curve and the evolution of the atomic structure of the composite board under uniaxial tensile loading along the Z-axis are shown in Figure 3. For the convenience of discussion, the load points at different deformation stages are labeled as b, c, d, and e, and the subscripts correspond to the model numbers.
In the initial deformation stage, the stress increased linearly with the increase in strain until the proportional limit on the curve (the corresponding strain ε = 0.02). Subsequently, with the further increase in strain, a brief yield plateau appeared, followed by the strain-hardening stage. In the strain-hardening stage, the stress continued to increase with the increase in strain, but the rate of increase was lower compared to the initial stage. The stress kept increasing until the peak point (point b) and then decreased sharply, entering a state of plastic flow with fluctuating stress. During the plastic flow stage, the stress experienced another strengthening, leading to a second stress peak (the corresponding strain ε = 0.21). Finally, the stress oscillated and decreased with the increase in strain until the strain ε reached 0.32.
The atomic structure corresponding to the ultimate stress is shown in Figure 3b, where the atomic positions have undergone significant changes, and the dislocation density continues to increase, but the surface shows no obvious changes. When the tensile strain reaches 0.16, the atomic structure evolution shown in Figure 3c indicates that the 316L layer of the composite board exhibits obvious necking. The atomic structures in the plastic flow state are shown in Figure 3c–e, where the length along the Z-direction increases, and the degree of necking becomes more severe as the deformation progresses. Ultimately, the composite board fails in the lower region (i.e., the 316L layer). This suggests that the strength of the composite board interface is higher than that of the 316L base material, which may be due to the work hardening during the composite process and the reduced stress transfer effect at the interface.
During the plastic deformation stage (ε > 0.12), the observed stress fluctuation corresponded to competing atomic-scale events at the interface. From the atomic snapshots in Figure 2b–d, it can be inferred that the initial plasticity was governed by the nucleation and glide of dislocations, particularly in the softer Q345R region. As the strain increased, local stress concentrations near the interface promoted void nucleation, especially at lattice mismatch sites or disordered regions enriched with Cr and Ni. These voids subsequently grew and coalesced along the Z-direction, leading to the formation of internal cracks, as observed in Figure 2c–d. The failure mode could therefore be attributed to a void-dominated ductile fracture mechanism, rather than brittle cleavage. Notably, the interface delayed failure by promoting local plastic flow, indicating a certain degree of crack blunting effect induced by the composite nature of the system.

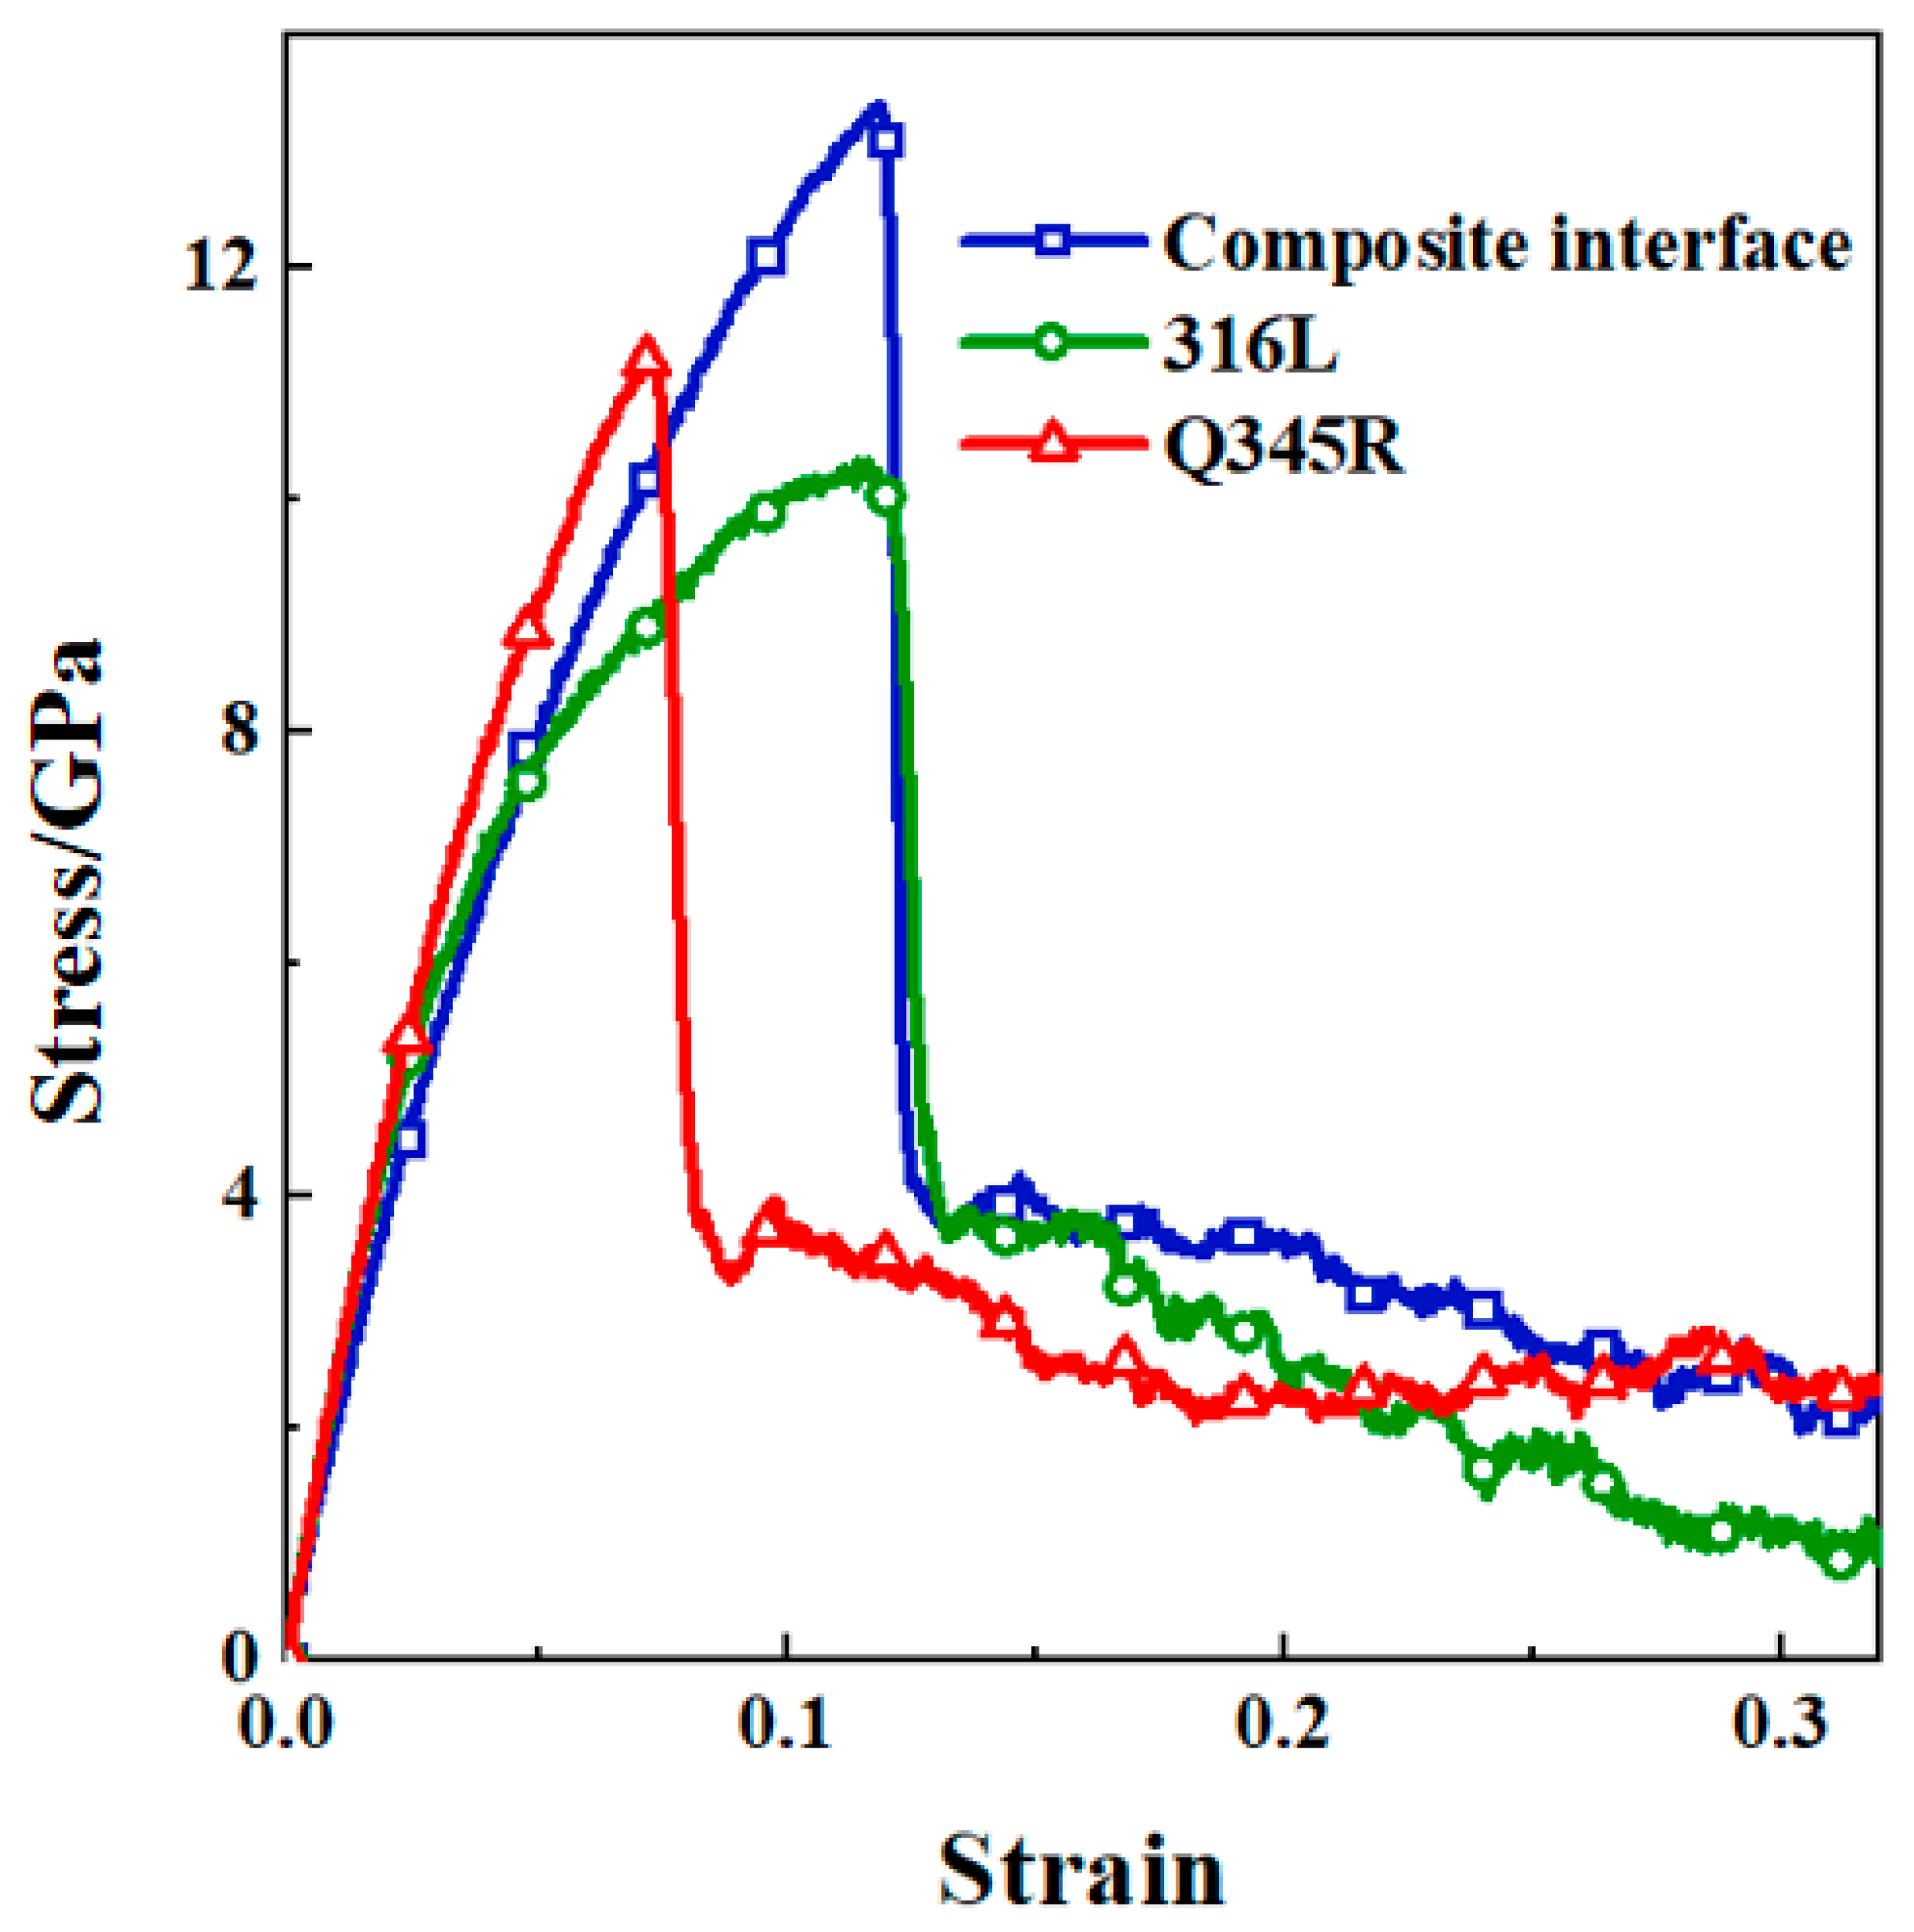
3.2. Strength Comparison Between Composite Board Interface and Substrate Materials

To further investigate the relationship between the strength of the composite board interface and the substrate materials, the tensile deformation process of the substrate materials was also simulated using the molecular dynamics method. The stress–strain curves of the 316L/Q345R composite board interface and the 316L and Q345R substrate materials under uniaxial tensile loading are shown in Figure 4. The general trends of the stress–strain curves for the different materials were similar. All the curves underwent a very short linear elastic stage, then deviated from elastic behavior and entered the elastic–plastic deformation stage. As the strain increased, the stress continued to increase to a peak value, then decreased sharply, and finally entered a state of continuous stress reduction during plastic flow.
By comparing the stress–strain curves of the three materials, it could be concluded that the tensile strength of the composite board interface was the highest, followed by the Q345R material, and the 316L material had the lowest tensile strength. It was evident that the composite plate interface stress–strain maximum value was situated at the origin of the inclination angle of approximately 71°. Similarly, the Q345R stress–strain maximum value was positioned at the origin of the inclination angle of around 75°. Furthermore, the 316L stress–strain maximum value was located at the origin of the inclination angle of approximately 64°. The strength of the composite board interface was 19.61% higher than that of the Q345 material and 29.98% higher than that of the 316L material. When the stress value reached the maximum, the strain of the composite board interface increased by 2.59% compared to the 316L material, and increased by 65.28% compared to Q345R.
By comparing the elastic modulus of the composite board interface and the 316L and Q345R substrate materials (obtained from the initial slope of the respective stress–strain curves), it was found that the elastic modulus of the composite board interface was lower than that of the substrate materials. Compared to Q345R, the elastic modulus of the composite board interface was reduced by about 19.13%; compared to the 316L material, the elastic modulus of the composite board interface was reduced by about 14.03%.

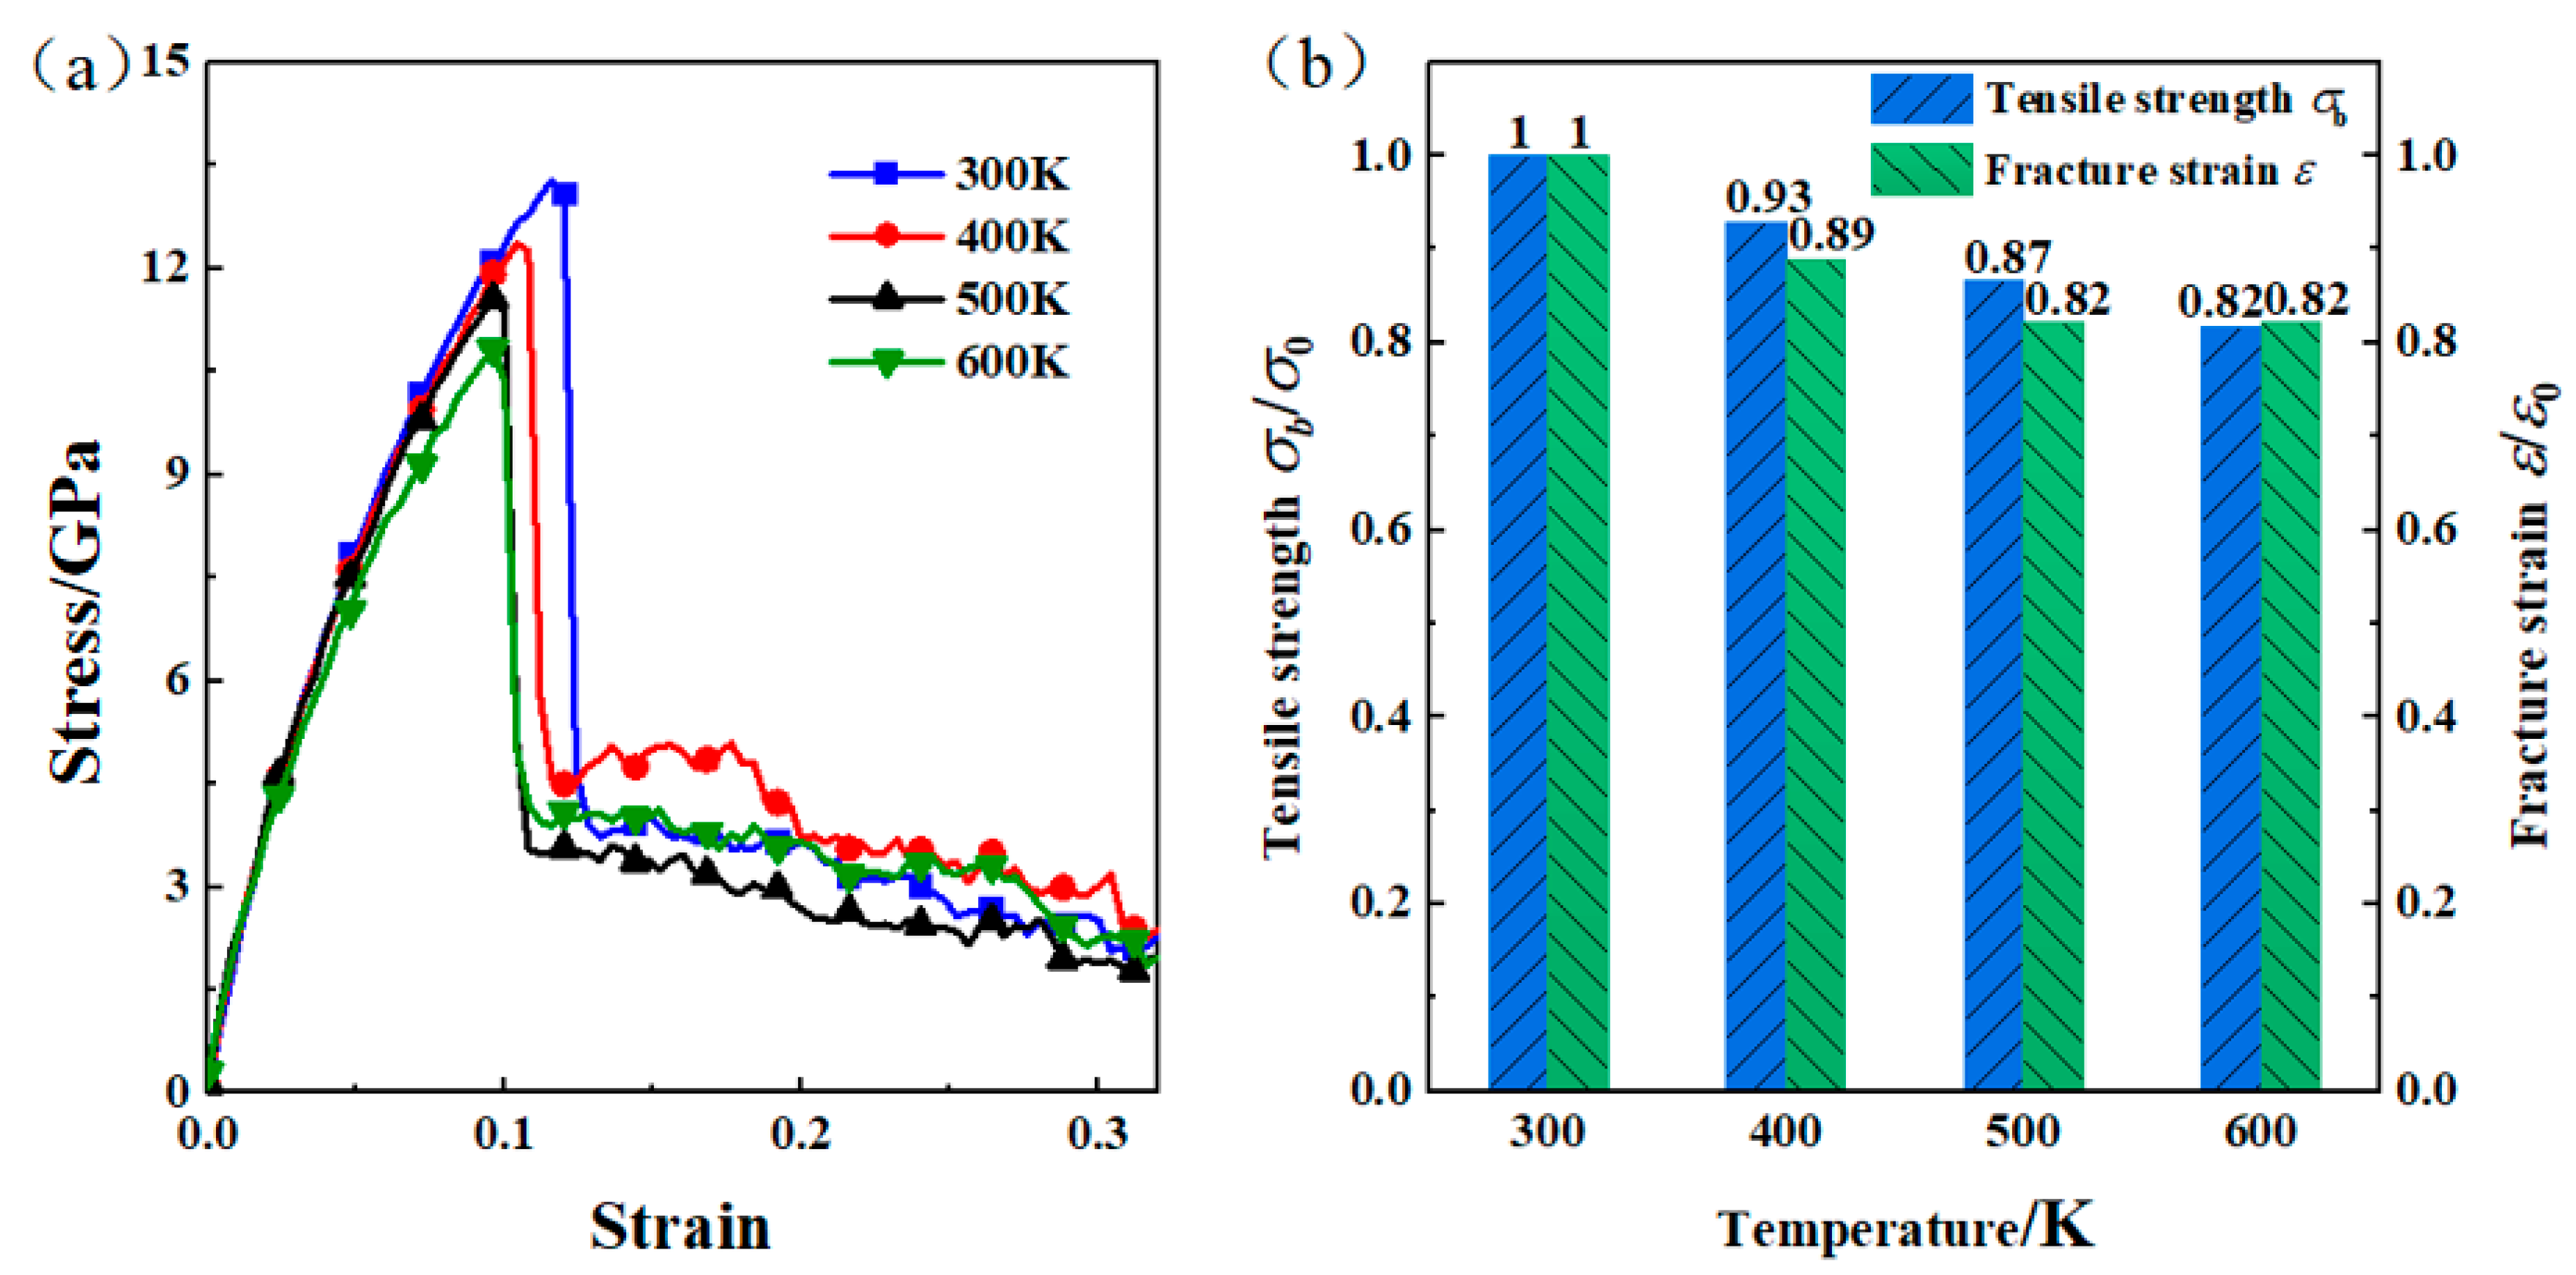
3.3. The Effect of Temperature on the Interfacial Bonding Strength of Composite Panels

To investigate the effect of temperature on the interfacial bonding strength of composite panels, uniaxial tensile simulations were conducted under a constant strain rate of 4 × 10⁸ S−1 at different temperatures (300 K, 400 K, 500 K, and 600 K). The stress–strain curves of the 316L/Q345R composite panel interface under tensile loading at different temperatures are shown in Figure 5a. In the initial elastic stage, the stress–strain curves at different temperatures nearly coincided. As the temperature increased, the rate of stress increases with the strain became slower. Clearly, the tensile strength and the corresponding strain of the composite panel interface continuously decreased with the increasing temperature. This is because, as the temperature rises, the molecular energy increases and the atoms become more active, making it easier to overcome the interatomic forces and undergo thermal motion. Consistent with the results of this study, Zhou et al. [22] showed that the interfacial strength of Cu/SiC nanocomposites decreased with increasing temperature, which was mainly attributed to enhanced atomic diffusion and increased lattice thermal perturbation due to thermal activation. Similarly, Kardani et al. [21] showed that the yield strength and elastic modulus of Cu/Ag nanocomposites decreased significantly at high temperatures. Furthermore, Chang et al. [17] showed that the stress response of titanium single crystals varied significantly at different strain rates, which supports the strain rate effect observed in this study.
To better represent the effect of temperature on the strength of the composite panel interface, the tensile strength σb and the fracture strain ε obtained at different temperatures were normalized by the values at 300 K, as shown in Figure 5b. σ0 and ε0 represent the tensile strength and fracture strain obtained at 300 K and a strain rate of 4 × 10⁸ S−1, respectively. As the temperature increased from 300 K to 400 K, the σb0 value decreased from 1 to 0.93, and the ε/ε0 value decreased from 1 to 0.89; as the temperature increased from 400 K to 500 K, the σb0 value decreased from 0.93 to 0.87, and the ε/ε0 value decreased from 0.89 to 0.82; as the temperature increased from 500 K to 600 K, the σb0 value decreased from 0.87 to 0.82, and the ε/ε0 value remained at 0.82. Therefore, within the temperature range of 300 K to 600 K, the ultimate stress of the composite panel interface decreased with increasing temperature, and for every 100 K increase in temperature, the value decreased by about 0.06σ0. Within the temperature range of 300 K to 500 K, the fracture strain of the composite panel interface also decreased with increasing temperature, but within the temperature range of 500 K to 600 K, the fracture strain remained unchanged as the temperature increased.
At higher temperatures, the atomic kinetic energy increased, leading to enhanced vibrational amplitudes and reduced lattice stability. This thermal agitation facilitated the activation of dislocation nucleation sites and promoted the breaking of atomic bonds at lower applied stresses. Moreover, an elevated temperature accelerated atomic diffusion at the interface, which weakened the sharpness of the compositional gradient and promoted atomic mixing, thereby reducing interface cohesion. These effects collectively led to a lower ultimate tensile strength and reduced fracture strain with increasing temperature.

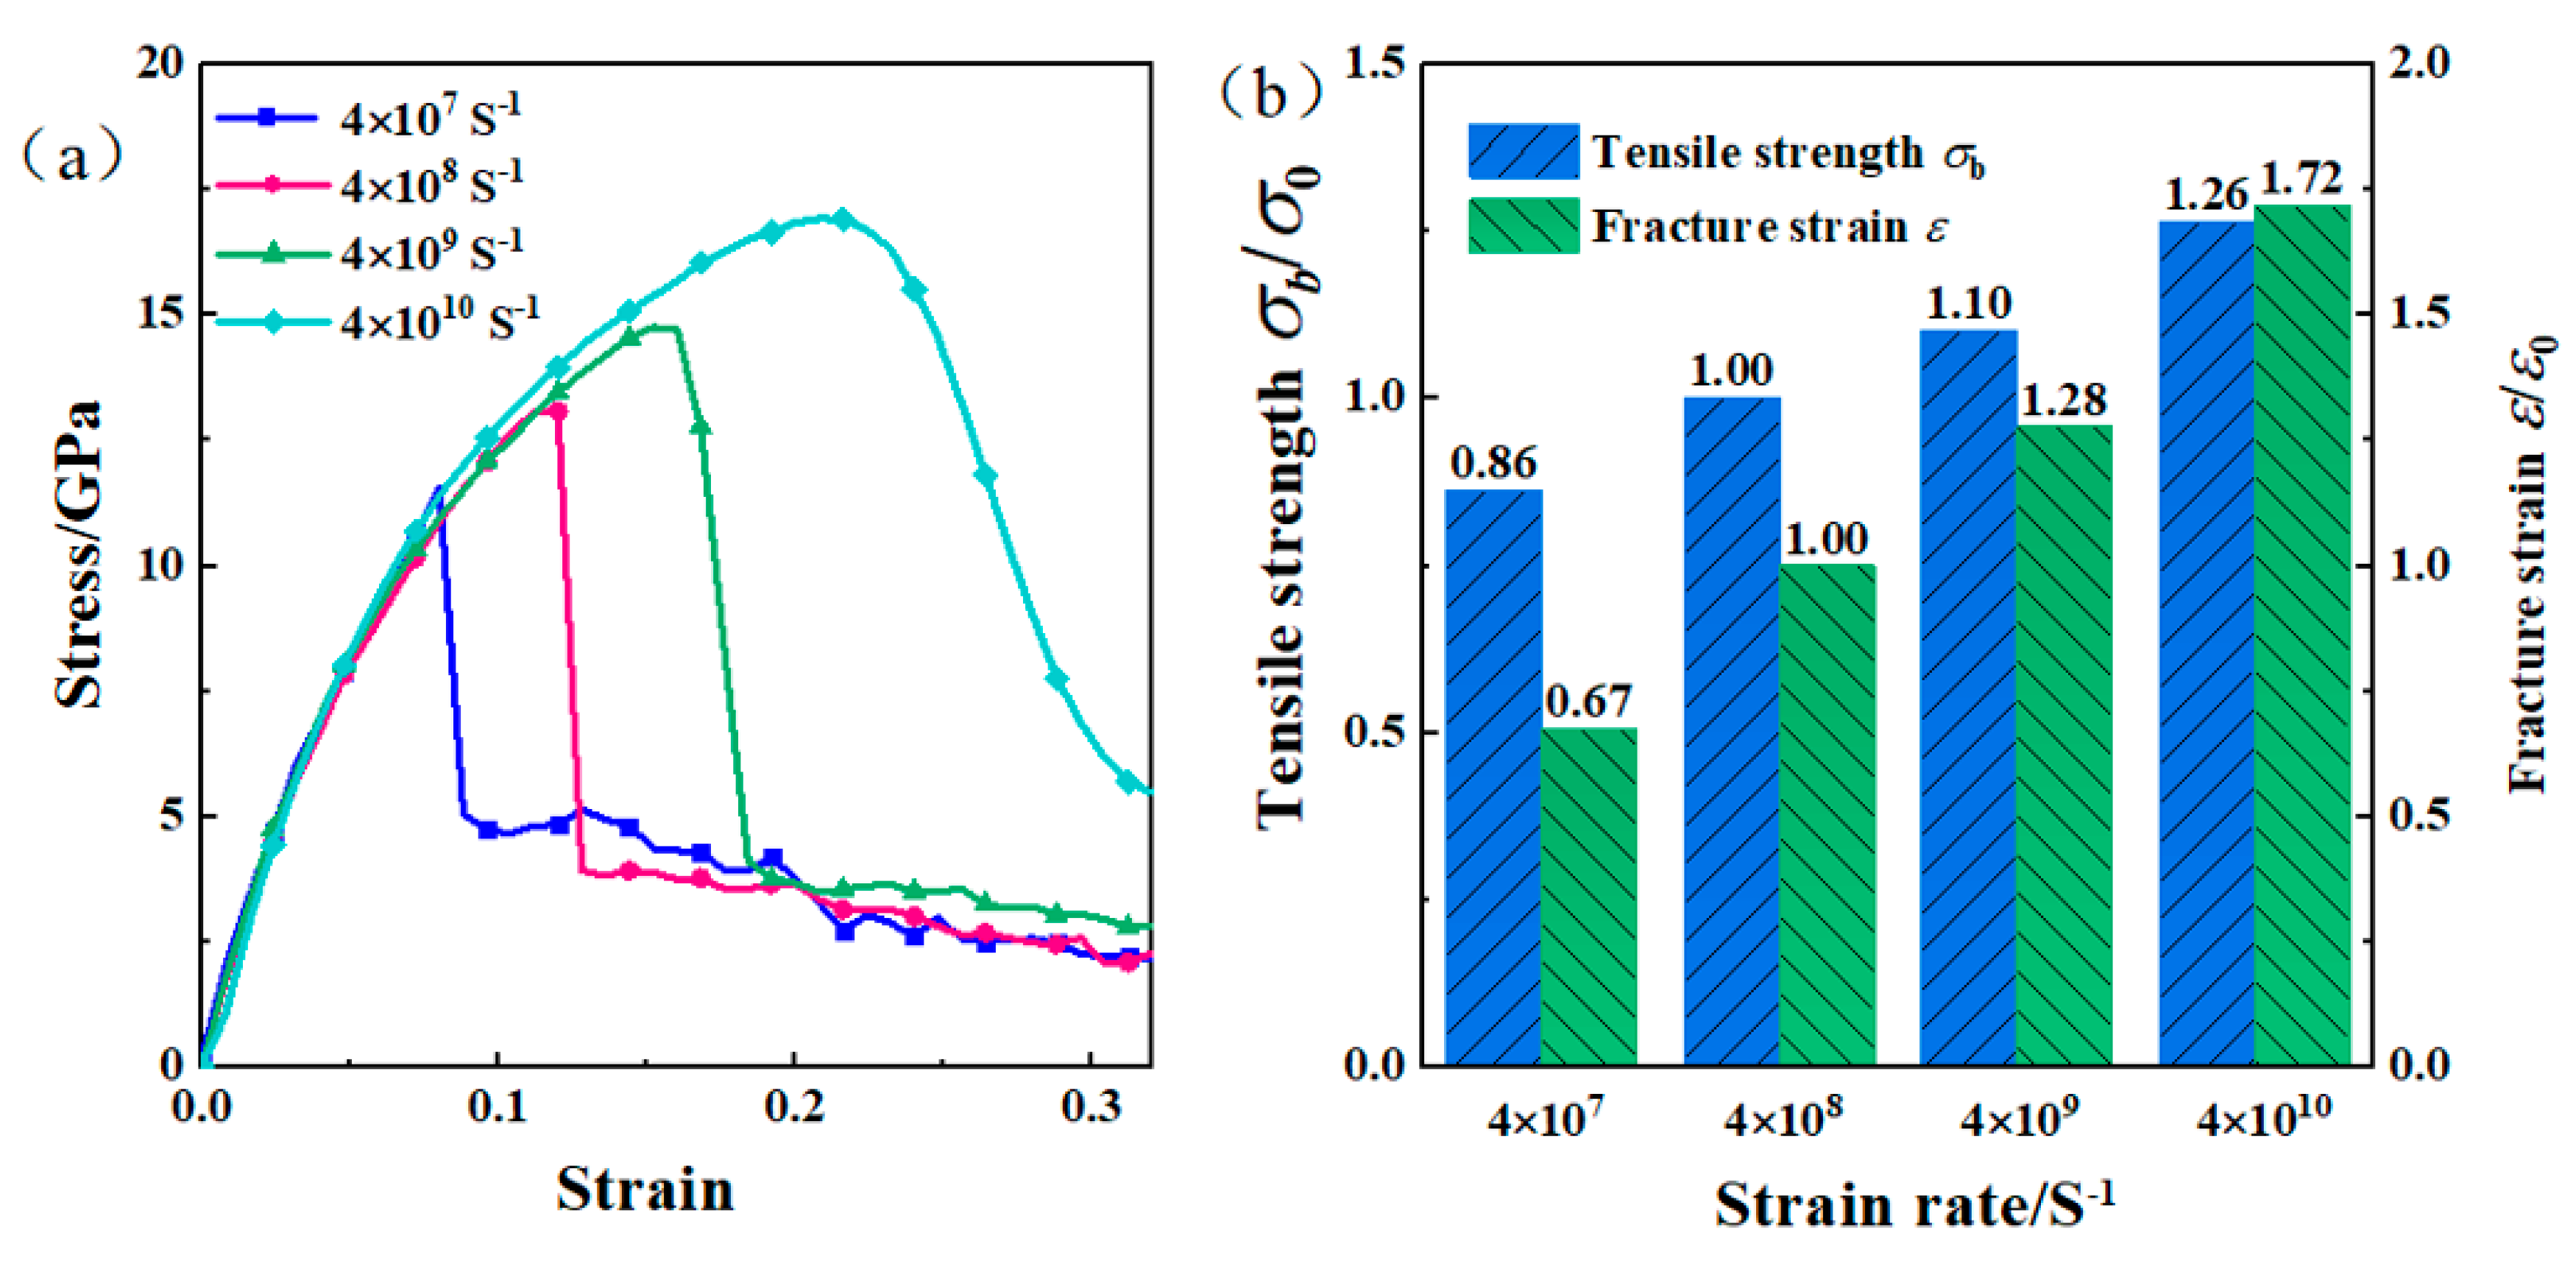
3.4. Effect of Strain Rate on the Interface Bonding Strength of Composite Plates

To investigate the effect of strain rate on the interface bonding strength of composite plates, uniaxial tensile simulations were conducted under a temperature of 300 K and different strain rates (4 × 10⁷ s−1, 4 × 10⁸ s−1, 4 × 10⁹ s−1, and 4 × 10¹⁰ s−1). The stress–strain curves of the composite plate interface under uniaxial tensile loading at a deformation temperature of 300 K and different strain rates are shown in Figure 6a. It can be found that the stress–strain curves at different strain rates exhibited the same trend and had similar slopes in the initial stage, indicating that the change in the strain rate had little effect on the elastic deformation behavior of the composite plate interface.
As the strain rate increased, the stress and strain at which the composite plate interface fractured gradually increased. To better represent the effect of the strain rate on the interface bonding strength of the composite plate, the tensile strength and fracture strain obtained at different strain rates at a temperature of 300 K were normalized by the values obtained at a strain rate of 4 × 10⁸ s−1, as shown in Figure 6b. When the strain rate increased from 4 × 10⁷ s−1 to 4 × 10⁸ s−1, the normalized tensile strength (σb0) increased from 0.86 to 1, and the normalized fracture strain (ε/ε0) increased from 0.67 to 1. When the strain rate increased from 4 × 10⁸ s−1 to 4 × 10⁹ s−1, the normalized tensile strength increased from 1 to 1.10, and the normalized fracture strain increased from 1 to 1.28. When the strain rate increased from 4 × 10⁹ s−1 to 4 × 10¹⁰ s−1, the normalized tensile strength increased from 1.10 to 1.26, and the normalized fracture strain increased from 1.28 to 1.72. Therefore, within the strain rate range of 4 × 10⁷ s−1 to 4 × 10¹⁰ s−1, the tensile strength and fracture strain of the composite plate interface continuously increased with the increase in strain rate.
At higher strain rates, atoms have less time to rearrange and relax under the applied load, resulting in suppressed dislocation mobility and limited defect propagation. As a consequence, deformation becomes more homogeneous and resistance to bond breaking increases, leading to higher peak stresses. Moreover, fast loading inhibits time-dependent mechanisms such as void growth, atomic diffusion, and creep, which further enhances the apparent interfacial strength and ductility under high-strain-rate conditions.

4. Conclusions

This study took 316L stainless steel/Q345R low-carbon steel composite plates as the research object and proposed a method to determine the interfacial bonding strength of composite plates based on molecular dynamics theory. First, an atomic structure model of the 316L/Q345R system was established to simulate the hot-pressing composite process of the composite plates, so as to obtain the interface layer structure. Then, the interface layer of the composite material was extracted perpendicular to the interface, and the obtained interface atomic structure model was stacked and copied in the direction perpendicular to the interface to obtain an independent interface atomic structure model. Based on the obtained interface atomic structure model, tensile simulation was performed on the interface layer structure model to determine the strength of the composite plate interface.
By comparative analysis of the strength of the composite plate interface and the 316L and Q345R base materials, it was found that the strength of the composite plate interface was 19.61% higher than that of the Q345R material and 29.98% higher than that of the 316L material. When the stress value reached the maximum, the strain of the composite plate interface increased by 2.59% compared to the 316L material, and the strain increased by 65.28% compared to the Q345R material.
In the temperature range of 300 K–600 K, the tensile strength of the composite plate interface decreased with the increase in temperature, and the tensile strength decreased by about 0.06σ0 for every 100 K increase in temperature. In the temperature range of 300 K–500 K, the fracture strain of the composite plate interface also decreased with the increase in temperature, but in the temperature range of 500 K–600 K, the fracture strain of the composite plate interface remained unchanged with the increase in temperature.
In the strain rate range of 4 × 10⁷ S−1~4 × 10¹⁰ S−1, the tensile strength and fracture strain of the composite plate interface continued to increase with the increase in the strain rate, and the tensile strength increased by about 0.13 σ0 and the fracture strain increased by about 0.35 ε0 for every 10-fold increase in the strain rate.
While this study provided valuable insights into the interfacial tensile behavior of 316L/Q345R stainless steel composite plates through molecular dynamics simulations, several open questions remain. First, the current simulations were conducted at nanosecond time scales and high strain rates, which differ significantly from practical experimental conditions. Future studies could employ multi-scale simulation methods (e.g., coupling MD with continuum models) to bridge this gap. Second, the influence of interface defects, impurities, and grain boundaries—common in real materials—was not considered and deserves further investigation. Additionally, the effect of complex loading conditions such as shear, cyclic loading, and mixed-mode deformation on interfacial failure mechanisms warrants detailed study. These directions will help to more accurately predict the reliability and performance of stainless steel-based composite structures in real-world applications.

Author Contributions

Conceptualization, L.X.; methodology, X.F.; software, J.K.; validation, L.X.; formal analysis, W.W.; writing—original draft preparation, J.K.; writing—review and editing, X.F.; visualization, J.K.; supervision, L.X.; project administration, W.W.; and funding acquisition, W.W. All authors have read and agreed to the published version of the manuscript.

Funding

The authors would like to gratefully acknowledge the National Science and Technology Major Project (Grant No. J2020-V-0004-0030) and the Central Guidance Local Science and Technology Development Special Fund Project (Grant No. ZYYD2024JD29) for providing financial support for experiments related to this paper.

Data Availability Statement

The original contributions presented in this study are included in the article. Further inquiries can be directed to the corresponding author.

Conflicts of Interest

Author Xuefei Fu was employed by the company Huai Hai Industrial Group Co., Ltd. The remaining authors declare that the research was conducted in the absence of any commercial or financial relationships that could be construed as a potential conflict of interest.

Abbreviations

MDMolecular Dynamics
FCCFace-Centered Cubic
BCCBody-Centered Cubic
316LAISI 316L Stainless Steel
Q345RChinese Standard Low-Carbon Steel
EAMEmbedded-Atom Method
OVITOOpen Visualization Tool
NPTIsothermal–Isobaric Ensemble
NVTCanonical Ensemble (Constant N, V, and T)
psPicosecond
σStress
εStrain
σ0, ε0Ultimate Stress and Strain at Baseline Condition (300 K, 4 × 10⁸ s−1)

References

  1. Make, A.; Schultz, B.F.; Rohatgi, P. Metal matrix composites. Adv. Mater. Process. 2012, 170, 19–23. [Google Scholar]
  2. Kaczmar, J.W.; Pietrzak, K.; Włosiński, W. The Production and Application of Metal Matrix Composite Materials. J. Mater. Process. Technol. 2000, 106, 58–67. [Google Scholar] [CrossRef]
  3. Abbasi, M.; Salehi, M.T.; Karimi Taheri, A. An Investigation on Cold Roll Welding of Copper to Aluminum Using Electrical Resistivity. Int. J. Mater. Res. 2001, 92, 423–430. [Google Scholar]
  4. Wang, T.; Sidhar, H.; Mishra, R.S.; Hovanski, Y.; Upadhyay, P.; Carlson, B. Friction Stir Welding of Dissimilar Alloys: Influence of Tool Offset on Microstructure and Mechanical Properties. Mater. Des. 2019, 174, 107795. [Google Scholar] [CrossRef]
  5. Manesh, H.D.; Taheri, A.K. Investigation of Mechanical Properties of Cold Roll Bonded Aluminum Strips. Mech. Mater. 2005, 37, 531–543. [Google Scholar] [CrossRef]
  6. Kim, Y.K.; Hong, S.I. Effect of interfacial intermetallic compounds evolution on the mechanical response and fracture of layered Ti/Cu/Ti clad materials. Mater. Sci. Eng. A 2019, 767, 138802. [Google Scholar] [CrossRef]
  7. Pozuelo, M.; Carreño, F.; Ruano, O.A. Processing and impact properties of steel-based laminated composites. Compos. Sci. Technol. 2006, 66, 2671–2680. [Google Scholar] [CrossRef]
  8. Borchers, C.; Lenz, M.; Deutges, M.; Klein, H.; Gärtner, F.; Hammerschmidt, M.; Kreye, H. Microstructure and mechanical properties of medium-carbon steel bonded on low-carbon steel by explosive welding. Mater. Des. 2016, 89, 369–376. [Google Scholar] [CrossRef]
  9. Kaya, Y.; Kahraman, N.; Durgutlu, A.; Gülenç, B. AISI 316 Austenitic Stainless Steel and AISI 430 Ferritic Stainless Steel Plates Explosive Welding: Effect of Explosive Ratio on Interface Formation. Metall. Mater. Trans. A 2017, 48, 3721–3730. [Google Scholar] [CrossRef]
  10. Kwiecień, M.; Majta, J.; Dziedzic, D. Shear deformation and failure of explosive welded Inconel-microalloyed steels bimetals. Arch. Civ. Mech. Eng. 2014, 14, 32–39. [Google Scholar] [CrossRef]
  11. Li, S.; Chen, Y.; Zhou, X.; Kang, J.; Huang, Y.; Deng, H. Effect of heat treatment on the microstructure and mechanical properties of a Cu–Ni–Sn–P alloy. Mater. Lett. 2019, 234, 155–158. [Google Scholar] [CrossRef]
  12. Camanho, P.; Erçin, G.; Catalanotti, G.; Mahdi, S.; Linde, P. A finite fracture mechanics model for the prediction of the open-hole strength of composite laminates. Compos. Part A Appl. Sci. Manuf. 2012, 43, 1219–1225. [Google Scholar] [CrossRef]
  13. Adams, R.D.; Coppendale, J. The measurement of the elastic moduli of structural adhesives by a resonant bar technique. J. Adhesion 1979, 10, 49–55. [Google Scholar] [CrossRef]
  14. Wu, Z. Influence of surface treatment on the strength of adhesive joints. Int. J. Adhes. Adhes. 2017, 77, 29–35. [Google Scholar] [CrossRef]
  15. Felger, J.; Stein, N.; Frey, C.; Becker, W. Experimental investigation of the mechanical behavior of adhesive joints under mixed-mode loading. Compos. Struct. 2018, 208, 546–556. [Google Scholar] [CrossRef]
  16. Ma, B.; Rao, Q.; He, Y. Phase-field modeling of microstructure evolution in solidification of binary alloys. Comput. Mater. Sci. 2016, 117, 40–47. [Google Scholar] [CrossRef]
  17. Chang, L.; Zhou, C.-Y.; Wen, L.-L.; Li, J.; He, X.-H. Molecular dynamics study of the deformation behavior and strengthening mechanisms of Cu/graphene composites under nanoindentation. Comput. Mater. Sci. 2017, 128, 348–355. [Google Scholar] [CrossRef]
  18. Choi, B.K.; Yoon, G.H.; Lee, S. Molecular dynamics studies of CNT-reinforced aluminum composites under uniaxial tensile loading. Compos. Part B Eng. 2016, 91, 119–125. [Google Scholar] [CrossRef]
  19. Tomar, V.; Zhou, M. Analyses of tensile deformation of nanocrystalline α-Fe2O3+fcc-Al composites using molecular dynamics simulations. J. Mech. Phys. Solids 2007, 55, 1053–1085. [Google Scholar] [CrossRef]
  20. Zhu, H.; Sun, W.; Kong, F.; Wang, X.; Song, Z.; Chen, Y. Cyclic behaviours of superelastic shape-memory alloy plates joined by tungsten inert gas welding. Mater. Sci. Eng. A 2019, 742, 704–710. [Google Scholar] [CrossRef]
  21. Kardani, A.; Montazeri, A. Temperature-based plastic deformation mechanism of Cu/Ag nanocomposites: A molecular dynamics study. Comput. Mater. Sci. 2018, 144, 223–231. [Google Scholar] [CrossRef]
  22. Zhou, Y.; Hu, M. Molecular dynamics simulations of the mechanical properties of graphene oxide nanosheets. Comput. Mater. Sci. 2017, 129, 129–135. [Google Scholar] [CrossRef]
  23. Chen, S.; Wu, Z.; Liu, K.; Li, X.; Luo, N.; Lu, G. Atomic diffusion behavior in Cu–Al explosive welding process. J. Appl. Phys. 2013, 113, 205–209. [Google Scholar] [CrossRef]
  24. Qin, Q.; He, W.; Xie, L.; Deng, J.; Zhu, X.; Peng, Q. Nonlinear diffusion, bonding, and mechanics of the interface between austenitic steel and iron. Phys. Chem. Chem. Phys. 2019, 21, 1464–1473. [Google Scholar] [CrossRef]
  25. Chen, Y.; Shao, S.; Liu, X.-Y.; Yadav, S.K.; Li, N.; Mara, N.; Wang, J. Misfit dislocation patterns of Mg-Nb interfaces. Acta Mater. 2017, 126, 552–563. [Google Scholar] [CrossRef]
  26. Zhang, R.F.; Beyerlein, I.J.; Zheng, S.J.; Zhang, S.H.; Stukowski, A.; Germann, T.C. Dislocation and twin interactions in a magnesium alloy: A molecular dynamics study. Acta Mater. 2016, 113, 194–205. [Google Scholar] [CrossRef]
  27. Stukowski, A. Visualization and analysis of atomistic simulation data with OVITO—The Open Visualization Tool. Modell. Simul. Mater. Sci. Eng. 2009, 18, 015012. [Google Scholar] [CrossRef]
  28. Plimpton, S. Fast parallel algorithms for short-range molecular dynamics. J. Comput. Phys. 1995, 117, 1–19. [Google Scholar] [CrossRef]
  29. Bonny, G.; Castin, N.; Terentyev, D. Interatomic potential for studying ageing under irradiation in stainless steels: The FeNiCr model alloy. Modell. Simul. Mater. Sci. Eng. 2013, 21, 085004. [Google Scholar] [CrossRef]
Figure 1. The modeling process of the interface of 316L/Q345R composites. : Fe atom in low-carbon steel (Q345R); : Fe atom in stainless steel (316L); : Cr atom in stainless steel (316L); and : Ni atom in stainless steel (316L).
Metals 15 00502 g001
Figure 2. (a) The tensile stress–strain curve for the 316L/Q345R interface and the sequence of snapshots capturing the atomic deformation process for the interface under Z-direction uniaxial tension: (b) ε = 0.12; (c) ε = 0.13; (d) ε = 0.21; and (e) ε = 0.32. : Fe atom in low-carbon steel (Q345R); : Fe atom in stainless steel (316L); : Cr atom in stainless steel (316L); and : Ni atom in stainless steel (316L).
Metals 15 00502 g002
Figure 3. (a) The tensile stress–strain curve of the 316L/Q345R composite and the sequence of snapshots capturing the atomic deformation process for the composite under Z-direction uniaxial tension: (b) ε = 0.12; (c) ε = 0.13; (d) ε = 0.21; and (e) ε = 0.32. : Fe atom in low-carbon steel (Q345R); : Fe atom in stainless steel (316L); : Cr atom in stainless steel (316L); and : Ni atom in stainless steel (316L).
Metals 15 00502 g003
Figure 4. The tensile stress–strain curve of 316L/Q345R interface, 316L, and Q345R under uniaxial tensile loading.
Metals 15 00502 g004
Figure 5. (a) The stress–strain curve and (b) the ultimate stress and fracture strain for the 316L/Q345R interface under uniaxial tensile loading with different temperatures along the Z-axis (σ0 and ε0 are, respectively, expressed as the ultimate stress and fracture strain at a temperature of 300 K and a strain rate of 4 × 10⁸ S−1).
Metals 15 00502 g005
Figure 6. (a) The stress–strain curve and (b) the ultimate stress and fracture strain for the 316L/Q345R interface under uniaxial tensile loading with different strain rates along the Z-axis (σ0 and ε0 are, respectively, expressed as the ultimate stress and fracture strain at a temperature of 300 K and a strain rate of 4 × 10⁸ S−1).
Metals 15 00502 g006
Table 1. Elemental composition of 316L and Q345R (in at.%).
NameFeCSiMnPSCrNiMoAlTi
Q345R98.00.170.21.40.010.000.020.02<0.01<0.01<0.01
SUS316L70.260.0170.421.260.0310.00316.0310.031.95--
Disclaimer/Publisher’s Note: The statements, opinions and data contained in all publications are solely those of the individual author(s) and contributor(s) and not of MDPI and/or the editor(s). MDPI and/or the editor(s) disclaim responsibility for any injury to people or property resulting from any ideas, methods, instructions or products referred to in the content.

