Article

Selective Removal of Copper from Nickel–Copper Leach Solution by Electrolysis Cells with High Convection

Department of Metallurgical & Materials Engineering, Hitit University, Çorum 19030, Turkey
Metals 2025, 15(4), 432; https://doi.org/10.3390/met15040432
Submission received: 13 March 2025 / Revised: 1 April 2025 / Accepted: 9 April 2025 / Published: 12 April 2025
(This article belongs to the Section Extractive Metallurgy)

Abstract

In this study, the selective separation of copper ions (Cu2+) from leaching solutions containing both Cu2+ and nickel ions (Ni2+) was investigated using electrolysis cells with high convection (Chemelec). Firstly, the electrochemical behavior of solutions containing only single Cu2+, single Ni2+, and both Cu2+ and Ni2+ was investigated using cyclic voltammetry (CV). Cu2+ reduction was observed at −0.15 V in solutions that contained either simply Cu2+ or a Cu2+-Ni2+ combination, whereas oxidation happened at 0.17 V in a single step. The CV analysis of a Ni2+-containing solution at pH 1 revealed that Ni2+ was not reduced. Potentiostatic selective Cu2+ reduction experiments were conducted at cathode potentials of −0.3 V, −0.4 V, and −0.5 V. Increasing the potential from −0.3 V to −0.5 V enhanced copper recovery from 84% to 94%. The current efficiency remained above 90% across all three potentials during 3 h experiments. At −0.5 V, extending the experiment time from 3 h to 5 h resulted in copper recovery exceeding 99%, while current efficiency declined from 90% to 80%. The cathode products were analyzed using X-ray diffraction (XRD), revealing that the main phase consisted of metallic copper.

1. Introduction

Copper and nickel are essential metals in modern technology with a wide range of industrial applications [1,2]. Copper is the third most widely used metal after iron and aluminum, and it plays a key role in the green energy transition [2,3]. Nickel is used in the production of many important industrial products, especially stainless steel, batteries, catalysts, and electroplating [4,5]. A significant portion of copper and nickel production is derived from sulfide ores. Approximately 70% of copper production involves the enrichment of chalcopyrite (CuFeS2) ores through crushing, grinding, and flotation, followed by pyrometallurgical and electrolytic processes [6,7]. Nickel ores are mainly classified into copper–nickel sulfide ores and lateritic (oxidic) nickel ores. Copper–nickel sulfide ores constitute 30–40% of the total nickel ores, while lateritic nickel ores make up the remaining 60–70%. Although copper–nickel sulfide ores represent a smaller proportion compared to lateritic nickel ores, they account for more than 60% of total nickel production due to the simpler production process [8,9]. Nickel sulfide ores are generally processed by crushing, grinding, flotation, pyrometallurgical nickel or nickel matte production, and refining [6,10,11]. Lateritic nickel ores are typically processed by hydrometallurgical methods such as high-pressure acid leaching (HPAL) or heap leaching [11,12].
Nickel sulfide ores are usually copper-rich, with copper and nickel closely associated [13]. Copper and nickel have many similar physicochemical properties, such as complete mutual solubility and density. These two metals are closely related and completely miscible in both the liquid and solid states. Therefore, they are often found intergrown in many minerals, making it difficult to separate them using direct beneficiation methods [14,15]. During nickel production and refining, copper tends to accumulate continuously in the nickel solution [11,16]. Copper is an impurity in nickel production solutions and needs to be strictly controlled [17]. Since the redox potential of Cu2+ (+0.340 V vs. SHE) is more positive than that of Ni2+ (−0.230 V vs. SHE), the concentration of copper ions in nickel electrolysis solutions should be minimized [18].
Various methods, such as chemical precipitation [14,19,20], solvent extraction [21,22], ion exchange resins [16,17], and electro-winning [8,23], are widely used for copper removal from Cu2+-Ni2+ solutions, either individually or in combination. These methods often face challenges in economically removing trace metals or are unsuitable when metals are present in low concentrations. For example, chemical precipitation presents difficulties in residue management and imposes high production costs for precipitants [24,25]. Solvent extraction raises concerns about toxicity due to contamination caused by phase entrainment and solvent evaporation in the resulting solutions. Electrochemical tank refining systems are insufficient for removing low concentrations of copper [8,16,26,27].
In this study, copper removal from Cu2+-Ni2+ leaching solutions was investigated using a Chemelec electrolysis cell, which enables high metal recovery with high current efficiency from solutions with low metal content. Chemelec cells are characterized by a high electrode surface area and enhanced electrolyte convection. They stand out due to their simple structure, scalability according to needs, and low installation and operating costs. Developed for metal recovery, the Chemelec cell features a grid-shaped electrode. Inert glass particles are used to disperse the barrier formed on the cathode surface. The grid-shaped electrodes allow the fluid inert glass particles to move freely within the cell. This movement enables the particles to approach the electrode surfaces from multiple directions, improving electrolyte mixing. In Chemelec cells, titanium or stainless steel grids are used as cathodes, while platinized or ruthenium dioxide-coated titanium anodes (DSAs) are used as anodes [28,29,30]. Figure 1 shows a schematic drawing of the Chemelec cell. It has been shown that this kind of cell can be used for the recovery of metals from industrial wastes with low metal concentrations, particularly by integrating them into the rinsing tanks of electroplating plants [28,30,31,32]. In addition to recovering metallic copper from the solution, electrolysis systems avoid the formation of copper slag, which occurs with other systems, as well as the additional steps required for its treatment.
In Chemelec cells, high electrolyte convection and inert glass beads reduce the diffusion layer on the electrode surface, increasing the limit current value and making it economical to recover metals at high current yields from low-concentration solutions [33,34]. Studies on metal removal using electrolysis cells with high convection have primarily focused on single-metal removal from different kind of solutions. Chemelec cells have been applied to the recovery of copper [27,35,36], nickel [37], cobalt [38], tin [39], cadmium [36,40], and lead [40]. Gorgievski et al. investigated the recovery of copper from acid mine drainage waters using a Chemelec cell and recovered 92% of copper from tailings containing 1.3 g/L Cu2+ at a current efficiency of over 60% [35]. Bettley et al. succeeded in reducing the Ni content to below 100 ppm in their studies using watt baths containing 1.5 g/L Ni [37]. Chaudhary et al. investigated Sn removal using Chemelec cells with solutions containing Pb as a single metal and impurity, reporting that the Sn concentration was reduced to 1 ppm under optimized conditions [39]. Segundo et al. investigated the removal of Pb and Cd from waste solutions and reported that Pb removal exceeded 99%, while Cd removal exceeded 94% at the end of experiments with single-metal solutions [40]. Boyanov et al. recovered 95% of Cu and Cd from waste solutions containing Cu and Cd using a Chemelec cell after 7 h of experiment time [36]. Chaudhary et al. recovered 99% of cobalt from waste solutions using a Chemelec cell under conditions of 8 h of experiment time and a current density of 15 A/m2 [38].
In this study, copper removal from mixed Cu2+-Ni2+ solutions with different Cu2+ ratios and constant Ni2+ content was investigated for the first time using an electrolysis cell with high convection, which has low installation and operating costs, produces no waste, and does not involve the use of chemicals. The electrochemical behavior of solutions containing Cu2+, Ni2+, and mixed Cu2+-Ni2+ was investigated using CV, and Cu2+ removal was carried out under potentiostatic conditions.

2. Materials and Methods

2.1. Materials

The metal salts NiSO4·6H2O (99.99% purity) and CuSO4·5H2O (99.99% purity), used to prepare Cu2+ and Ni2+ solutions, were purchased from Merck (Darmstadt, Germany) and used without further purification. All solutions were prepared using deionized water. Sulfuric acid (H2SO4, 70%) was supplied by Fisher Scientific (Hampton, NH, USA) and used for pH adjustments.

2.2. Methods

The experimental studies in this research consist of two parts: electrochemical analyses and potentiostatic Cu2+ removal experiments. To determine the potentiostatic reduction conditions, the ion behavior was first investigated electrochemically, followed by Cu2+ removal through potentiostatic experiments. For electrochemical measurements, a 6 mm-diameter glassy carbon (GC) electrode was used as the working electrode (WE), a coiled platinum wire as the counter electrode (CE), and an Ag/AgCl electrode as the reference electrode (RE). All reported potentials are plotted against Ag/AgCl. All electrochemical and potentiostatic experiments were conducted using an Autolab PGSTAT101 with a 10A booster. The amount of metal remaining in the solution was determined using inductively coupled plasma (ICP-OES) (PerkinElmer Avio 500, Waltham, MA, USA). The X-ray diffraction (XRD) patterns of the cathode products were obtained using Bruker D2 Phaser diffractometer (Billerica, MA, USA) with CuKα radiation (1.54 Å wavelength).

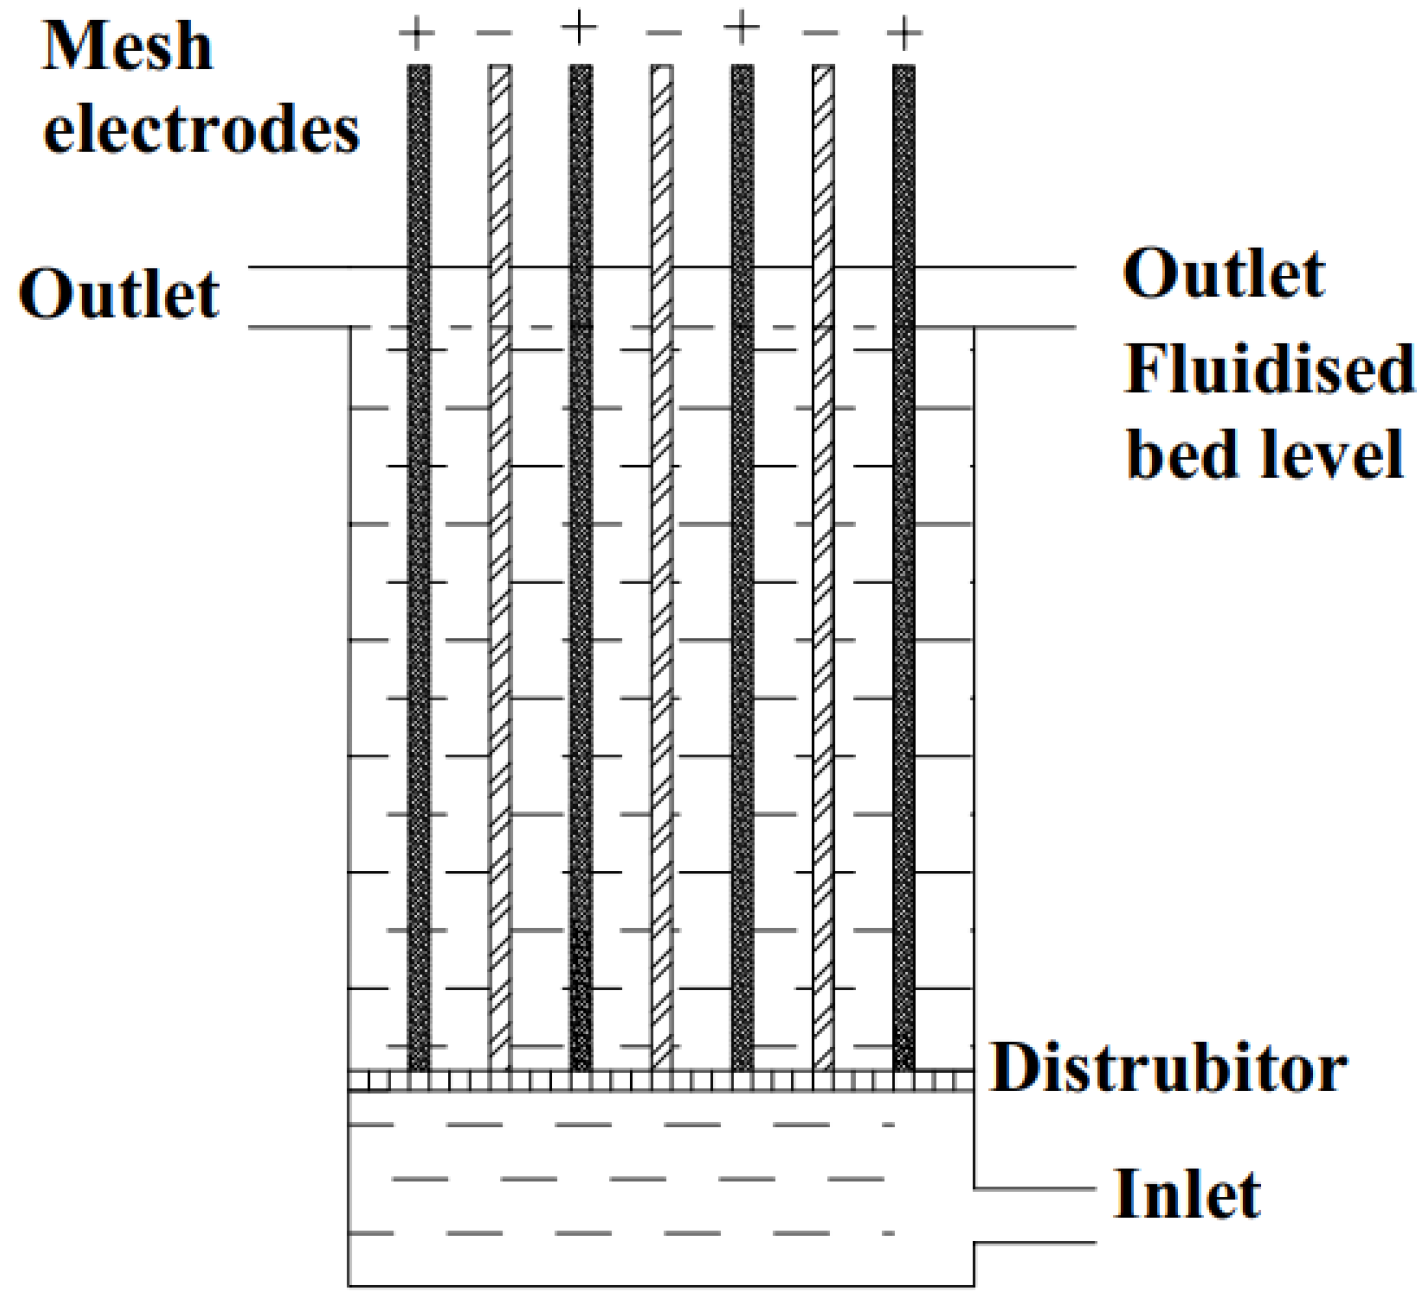
2.3. Electrolysis Cells with High Convection

The schematic depiction of the experimental setup utilized for copper removal from Cu-Ni mixed solution is shown in Figure 2.
Potentiostatic reduction experiments were conducted in a high-convection electrolysis cell, which was fabricated using a 3D printer (BambuLab, Shenzhen, China) from polypropylene (BASF Ultrafuse). The cell consists of three electrodes: two anodes and one cathode. The electrochemical reaction takes place in a compartment with dimensions of 0.05 × 0.03 × 0.04 m3 (length × width × height). The effective reactor volume of the cell was 60 cm3. To enhance ion transport, inert glass spheres (1.0 mm diameter, 2.5 g/cm3 density) were used. The amount of glass spheres was adjusted so that their height was 2 cm without flow and 3 cm under fluidization. The distance between the electrodes was 8 mm. A 316L perforated steel plate (orifice diameter = 1.5 mm, 60 × 50 × 1 mm3; length × width × thickness) was used as the cathode. Expanded porous platinized titanium was used as the anode. An Ag/AgCl electrode served as the reference electrode in the potentiostatic experiments, as in CV experiments.

3. Results

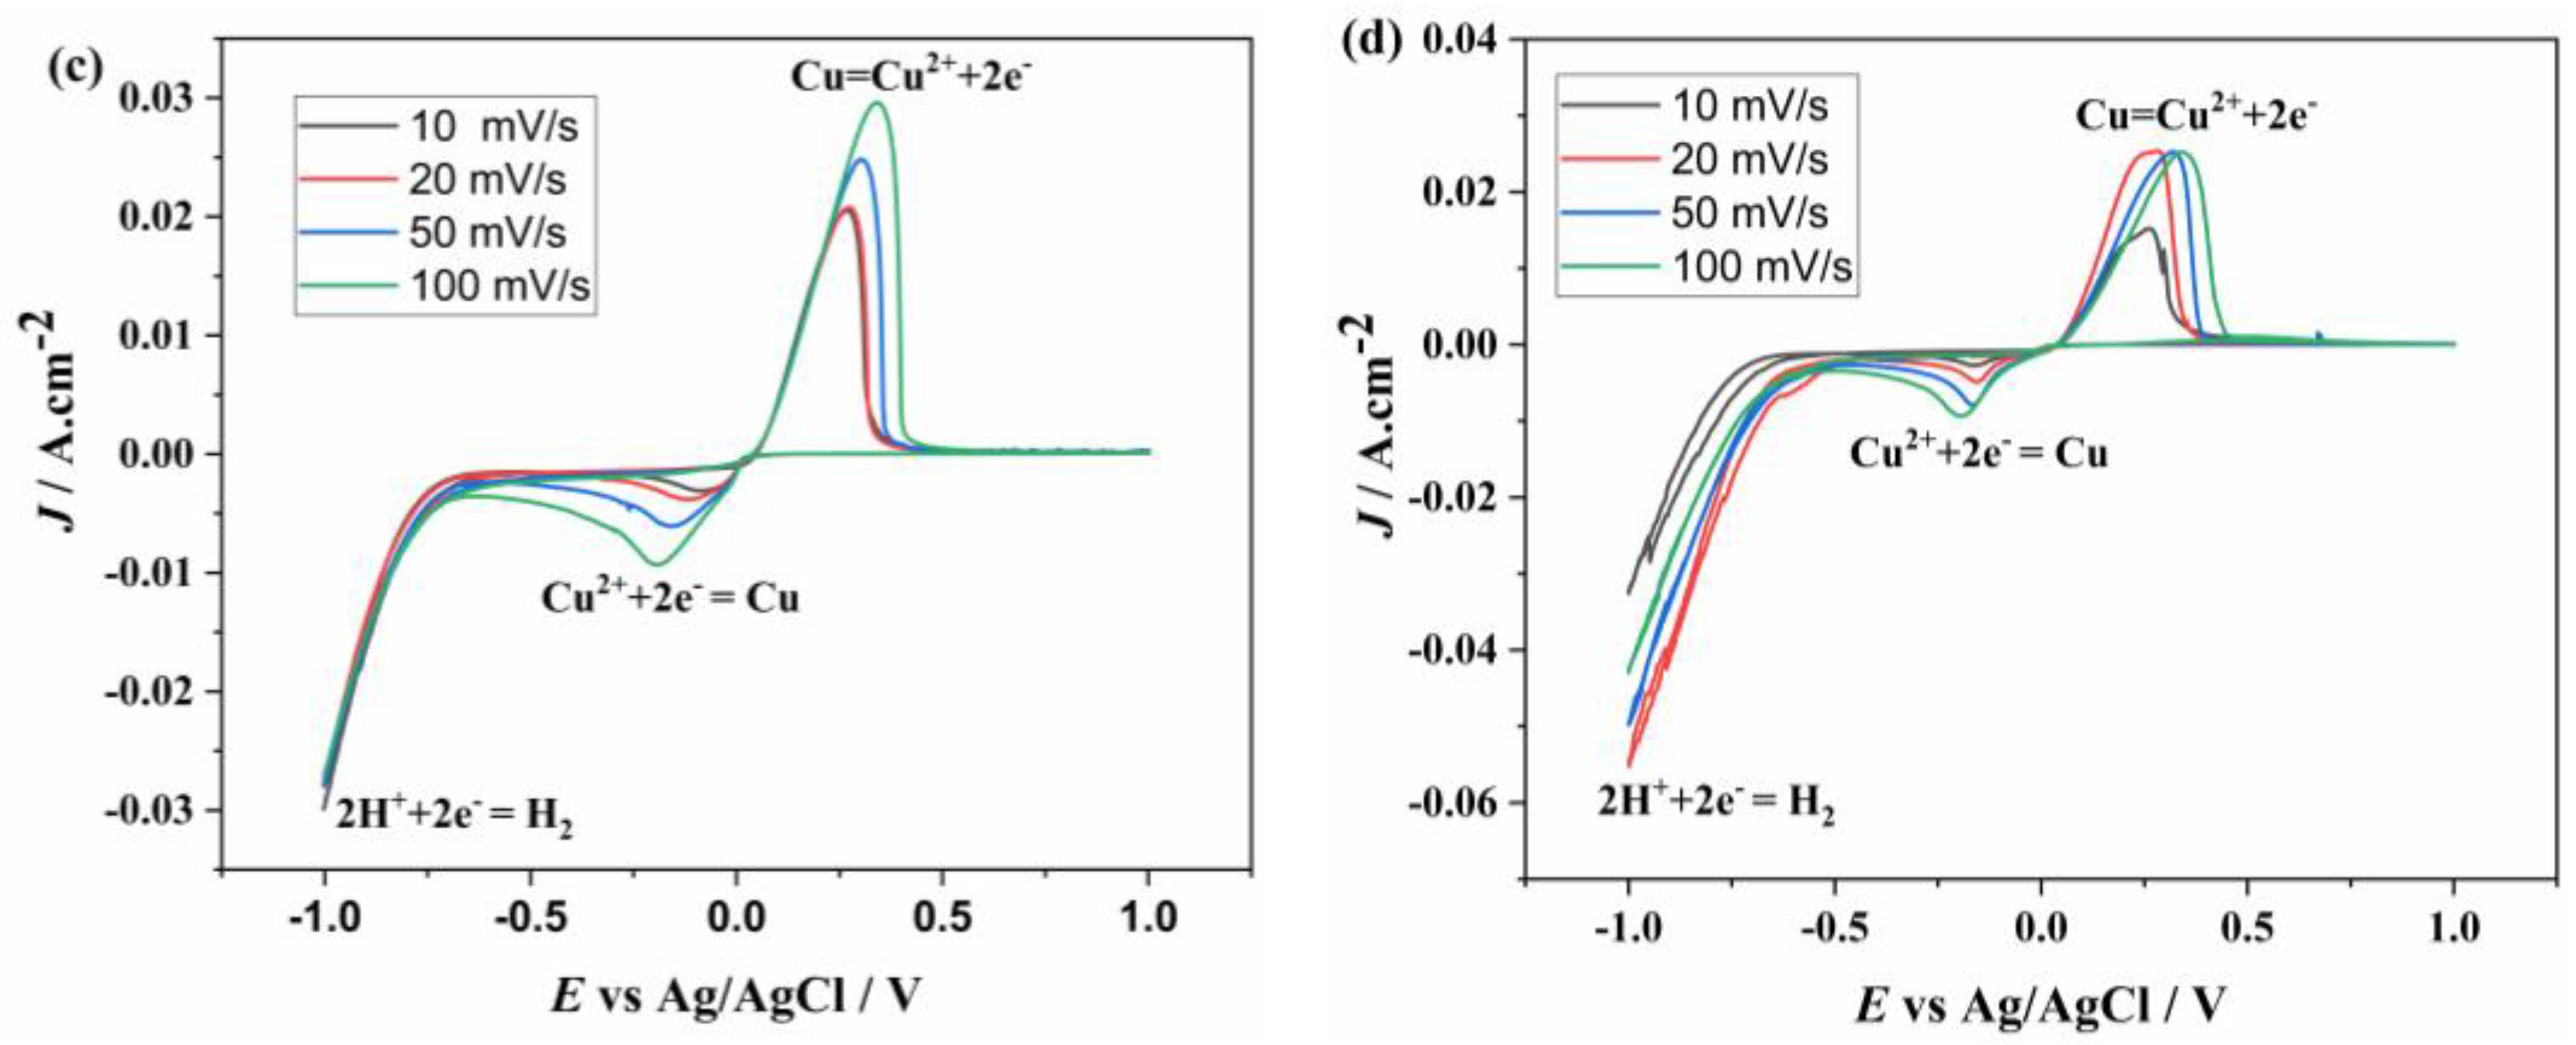
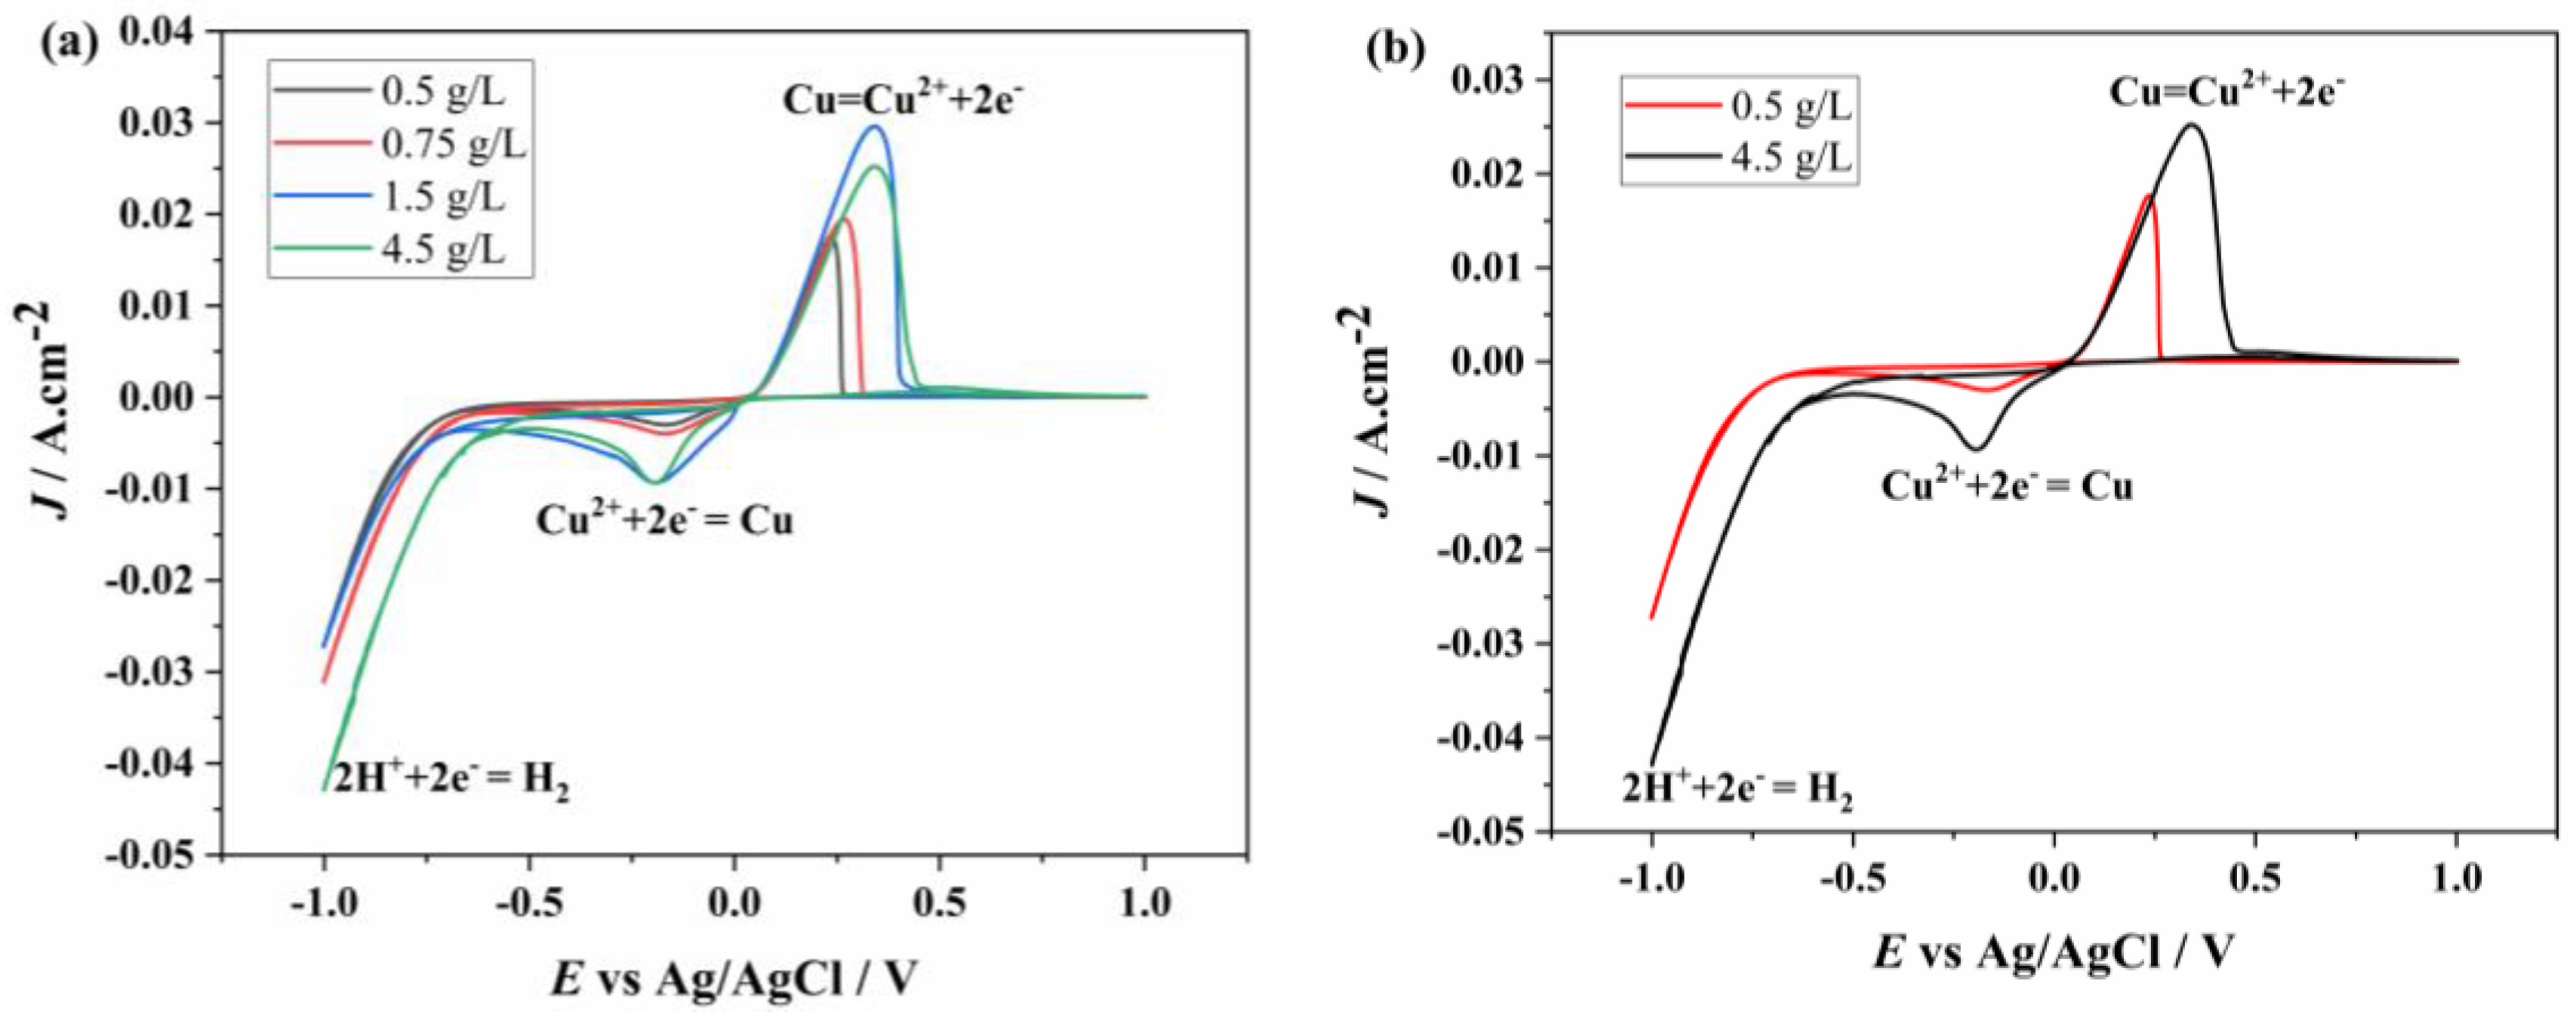
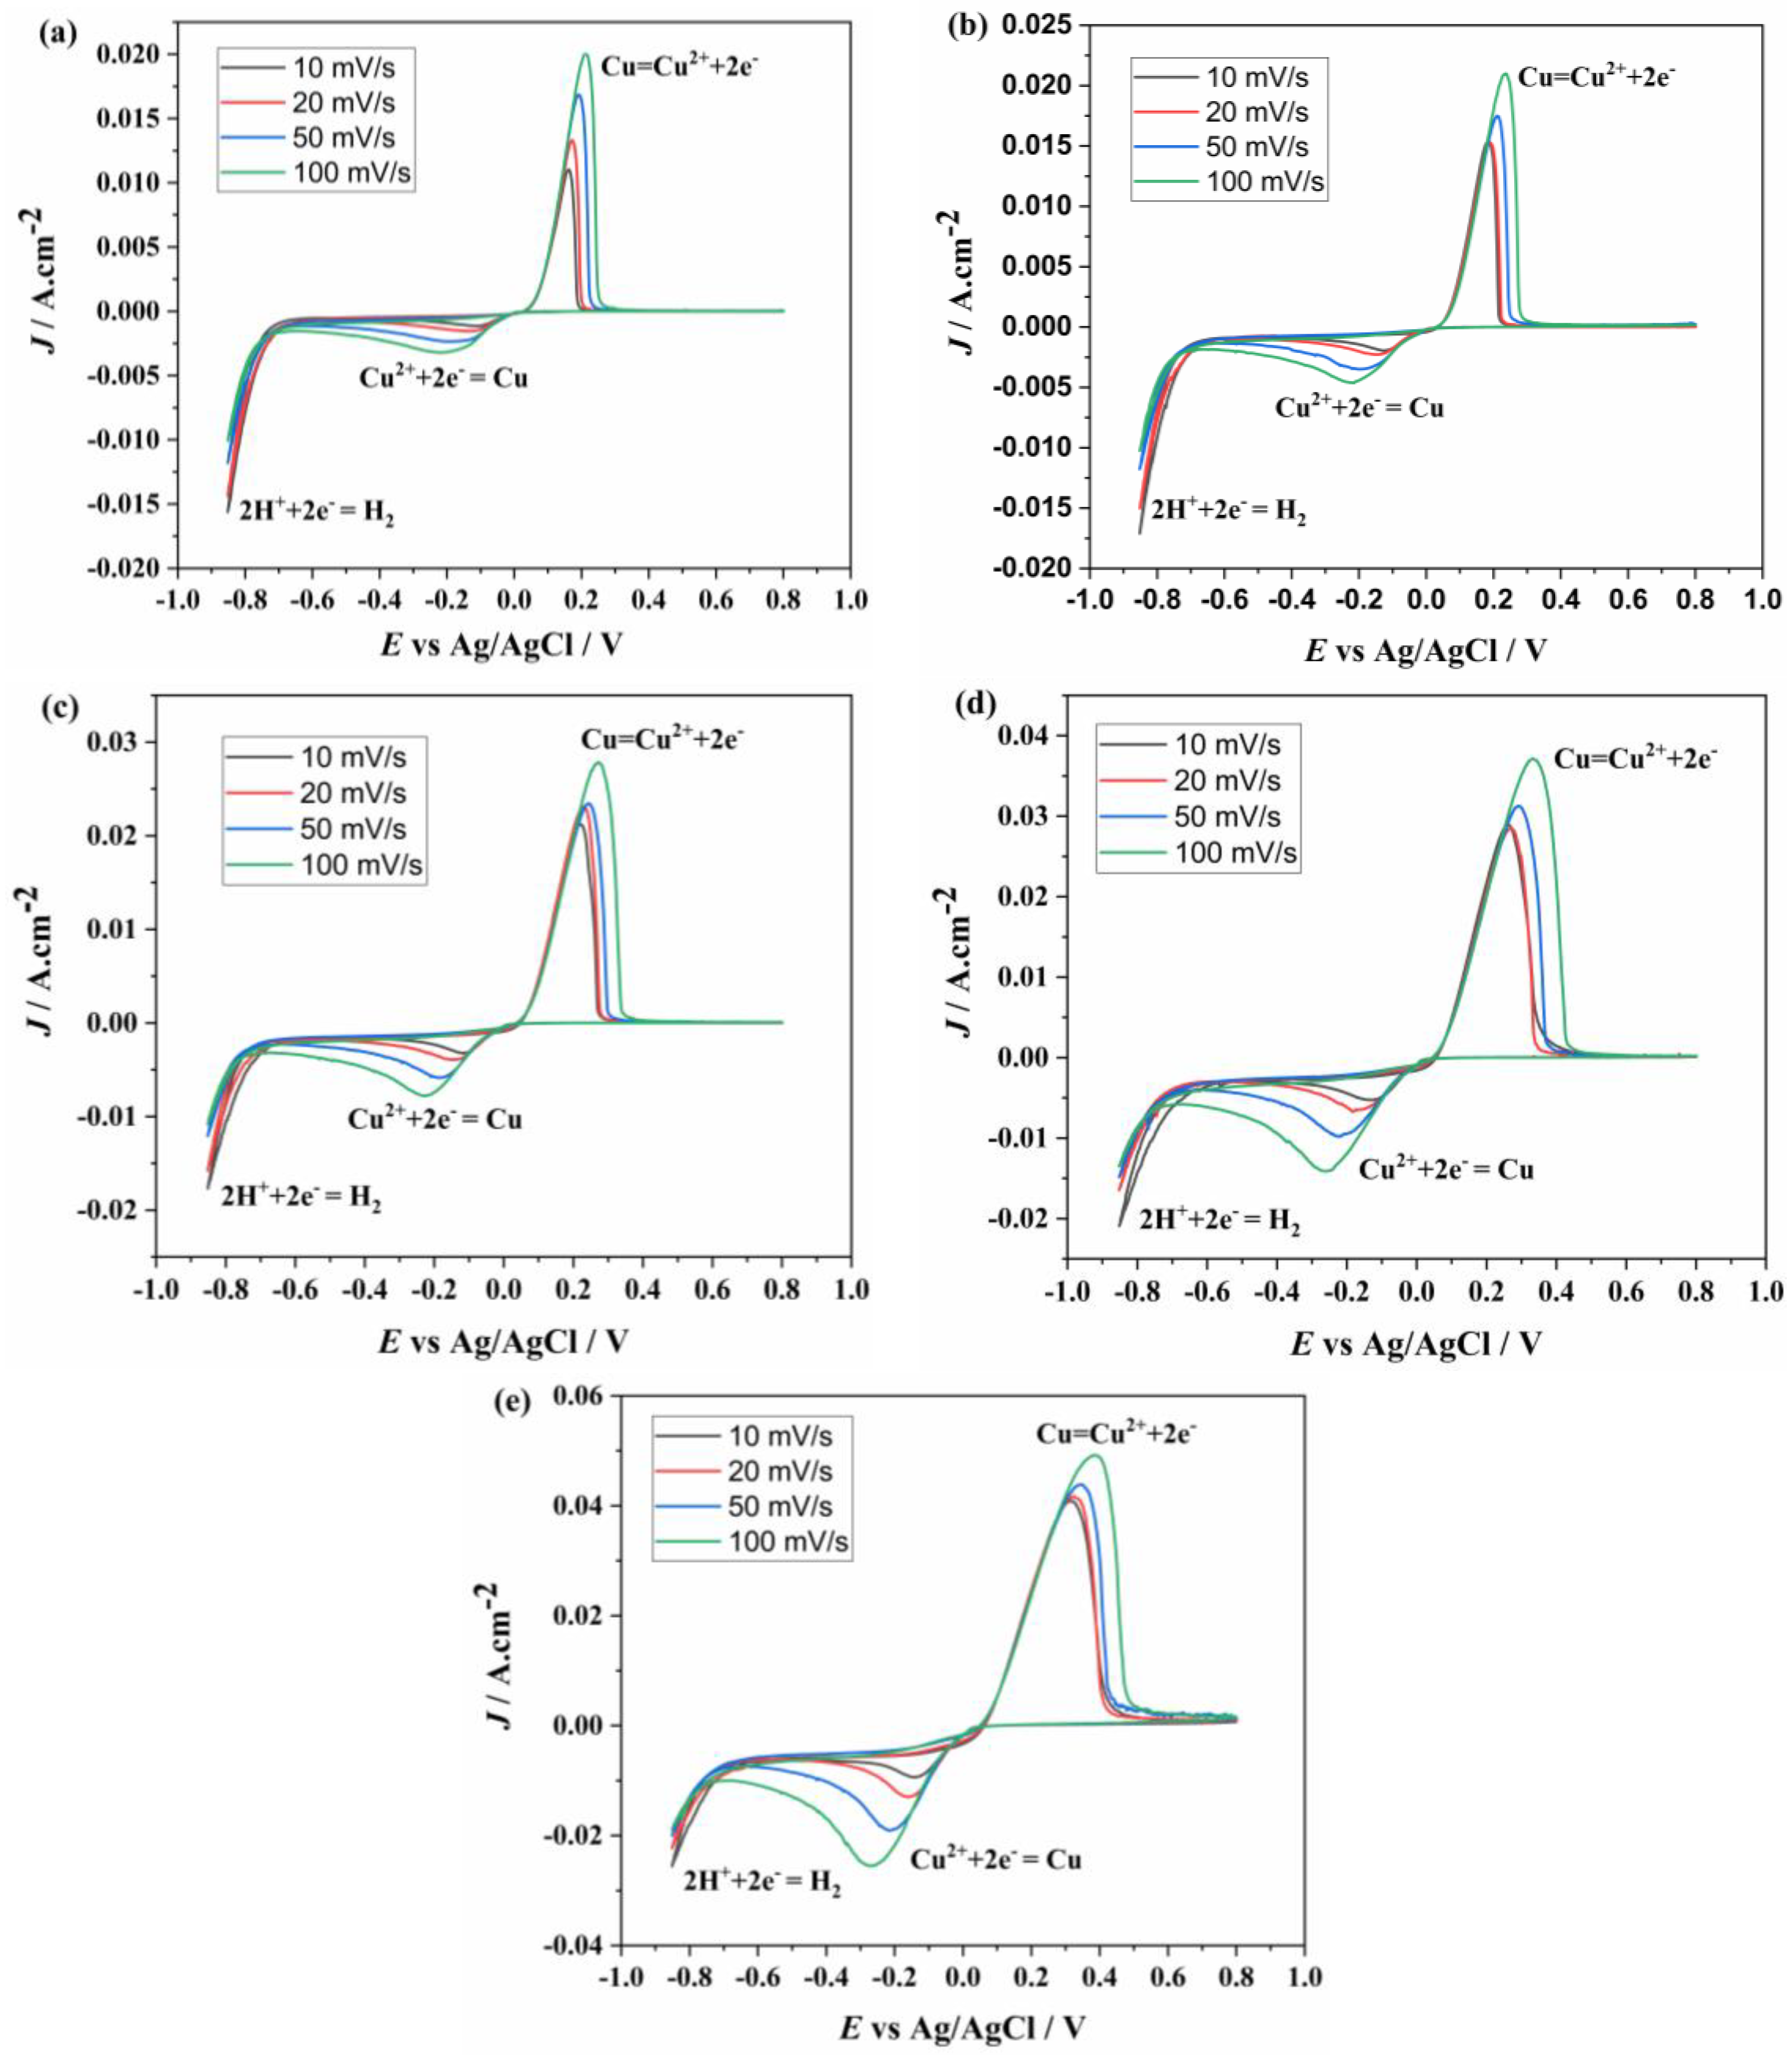
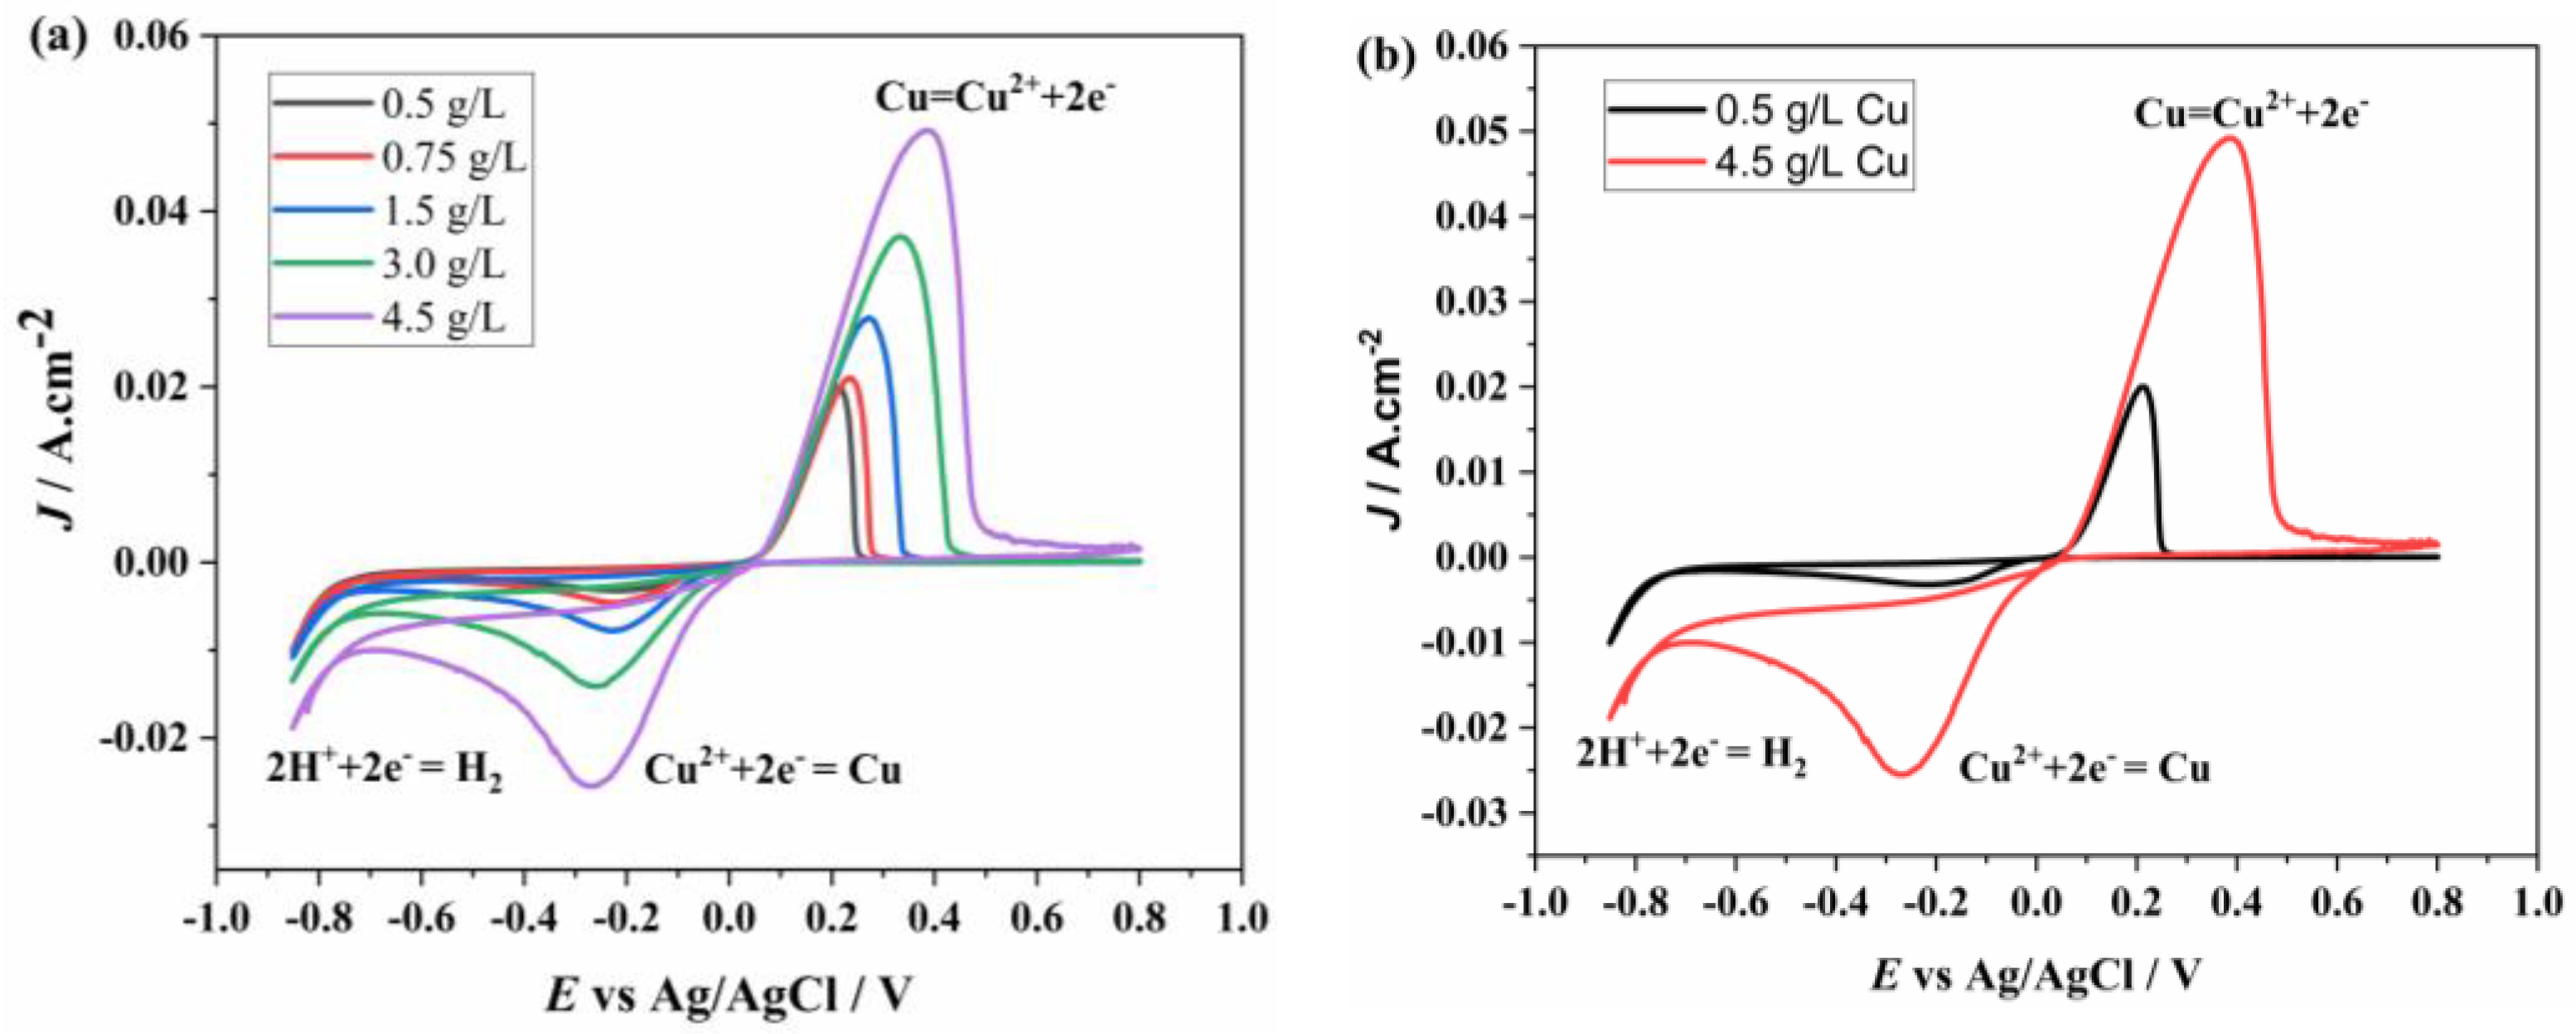
3.1. Electrochemical Behavior of Cu2+ Sulfate Solution

First, the electrochemical behavior of solutions containing different concentrations of Cu2+ was investigated using the CV technique. Cu2+ reduction can occur in either one step or two steps, depending on the solvent type and ambient conditions [23,26,41]. In the two-step reduction process, Cu2+ is first reduced to Cu+ according to Equation (1), and then, Cu+ is further reduced to Cu according to Equation (2):
Cu2+ + e → Cu+      E° = +0.158 V
Cu+ + e → Cu      E° = +0.522 V
In the one-step reduction process, Cu2+ is directly reduced to Cu0 in a single step, as shown in Equation (3):
Cu2+ + 2e       Cu0 E° = +0.337 V
During the reduction of Cu2+ from sulfate solutions, cathodic reactions proceed according to Equations (1)–(3), while at the anode, water undergoes decomposition, producing oxygen as described in Equation (4):
2H2O → O2 + 4e + 4H+ E° = +1.23 V
Sulphuric acid is widely used in the leaching of ores and concentrates due to its low cost, ease of availability, and high metal solubility [42]. For this reason, the production of many metals via electrolytic methods is typically conducted in sulfate solutions [43]. Since the copper content in ores, waste materials, and other metal sources varies more significantly than that of nickel, a wide range of Cu2+ concentrations was selected for investigation. The Cu2+ concentrations analyzed for their electrochemical behavior using CV are listed in Table 1.
The voltammetry graphs of the solutions containing Cu2+ concentrations, as listed in Table 1, are shown in Figure 3. First, the electrochemical behavior of the solution containing 0.5 g/L Cu2+ was investigated at different scan rates. In Figure 3a, the scan begins at 0 V, proceeding in the cathodic direction until the first reduction peak appears, corresponding to the reduction of Cu2+ to Cu. The graph clearly indicates that electron transfer is quasi-reversible. The reduction of Cu2+ occurs in a single step at −0.15 V, while the oxidation of Cu occurs in a single step at 0.17 V. The peak current values increase with the scan rate, and the peak potentials shift, becoming more negative at the cathodic peak and more positive at the anodic peak. The voltammetry graphs for the 0.75 and 1.5 g/L Cu2+ solution are presented in Figure 3b and Figure 3c, respectively. In these graphs, the reduction of Cu2+ was also observed at −0.15 V and oxidation at 0.17 V, similar to the 0.75 g/L solution. Finally, the CV graph of the solution with the highest Cu2+ concentration (4.5 g/L Cu2+) is shown in Figure 3d. Unlike the results at lower concentrations, the anodic peak height remains unchanged at scan rates of 20, 50, and 100 mV/s, whereas the cathodic peak height increases with scan rate. Although the onset values of the reduction and oxidation peaks remain constant, the peak potentials shift, becoming more negative in the cathodic region and more positive in the anodic region. It is observed that the peak current increases simultaneously with the increase in scan rate at all concentrations.
To better understand the electrochemical behavior as a function of Cu2+ concentration, the voltammetry graphs obtained at a 100 mV/s scan rate for different concentrations are presented together in Figure 4a. As expected, the anodic and cathodic peak current values increase with increasing concentration. From the graph in Figure 4a, it is observed that while the peak onset values remain unchanged, the peak potentials shift, becoming more negative for reduction and more positive for oxidation. To better visualize the concentration-dependent peak shift, the voltammetry graphs for the lowest (0.5 g/L Cu2+) and highest (4.5 g/L Cu2+) copper concentrations are shown together in Figure 4b. It is evident that as the concentration increases, the reduction peak shifts to a more negative potential, while the anodic peak shifts to a more positive potential.

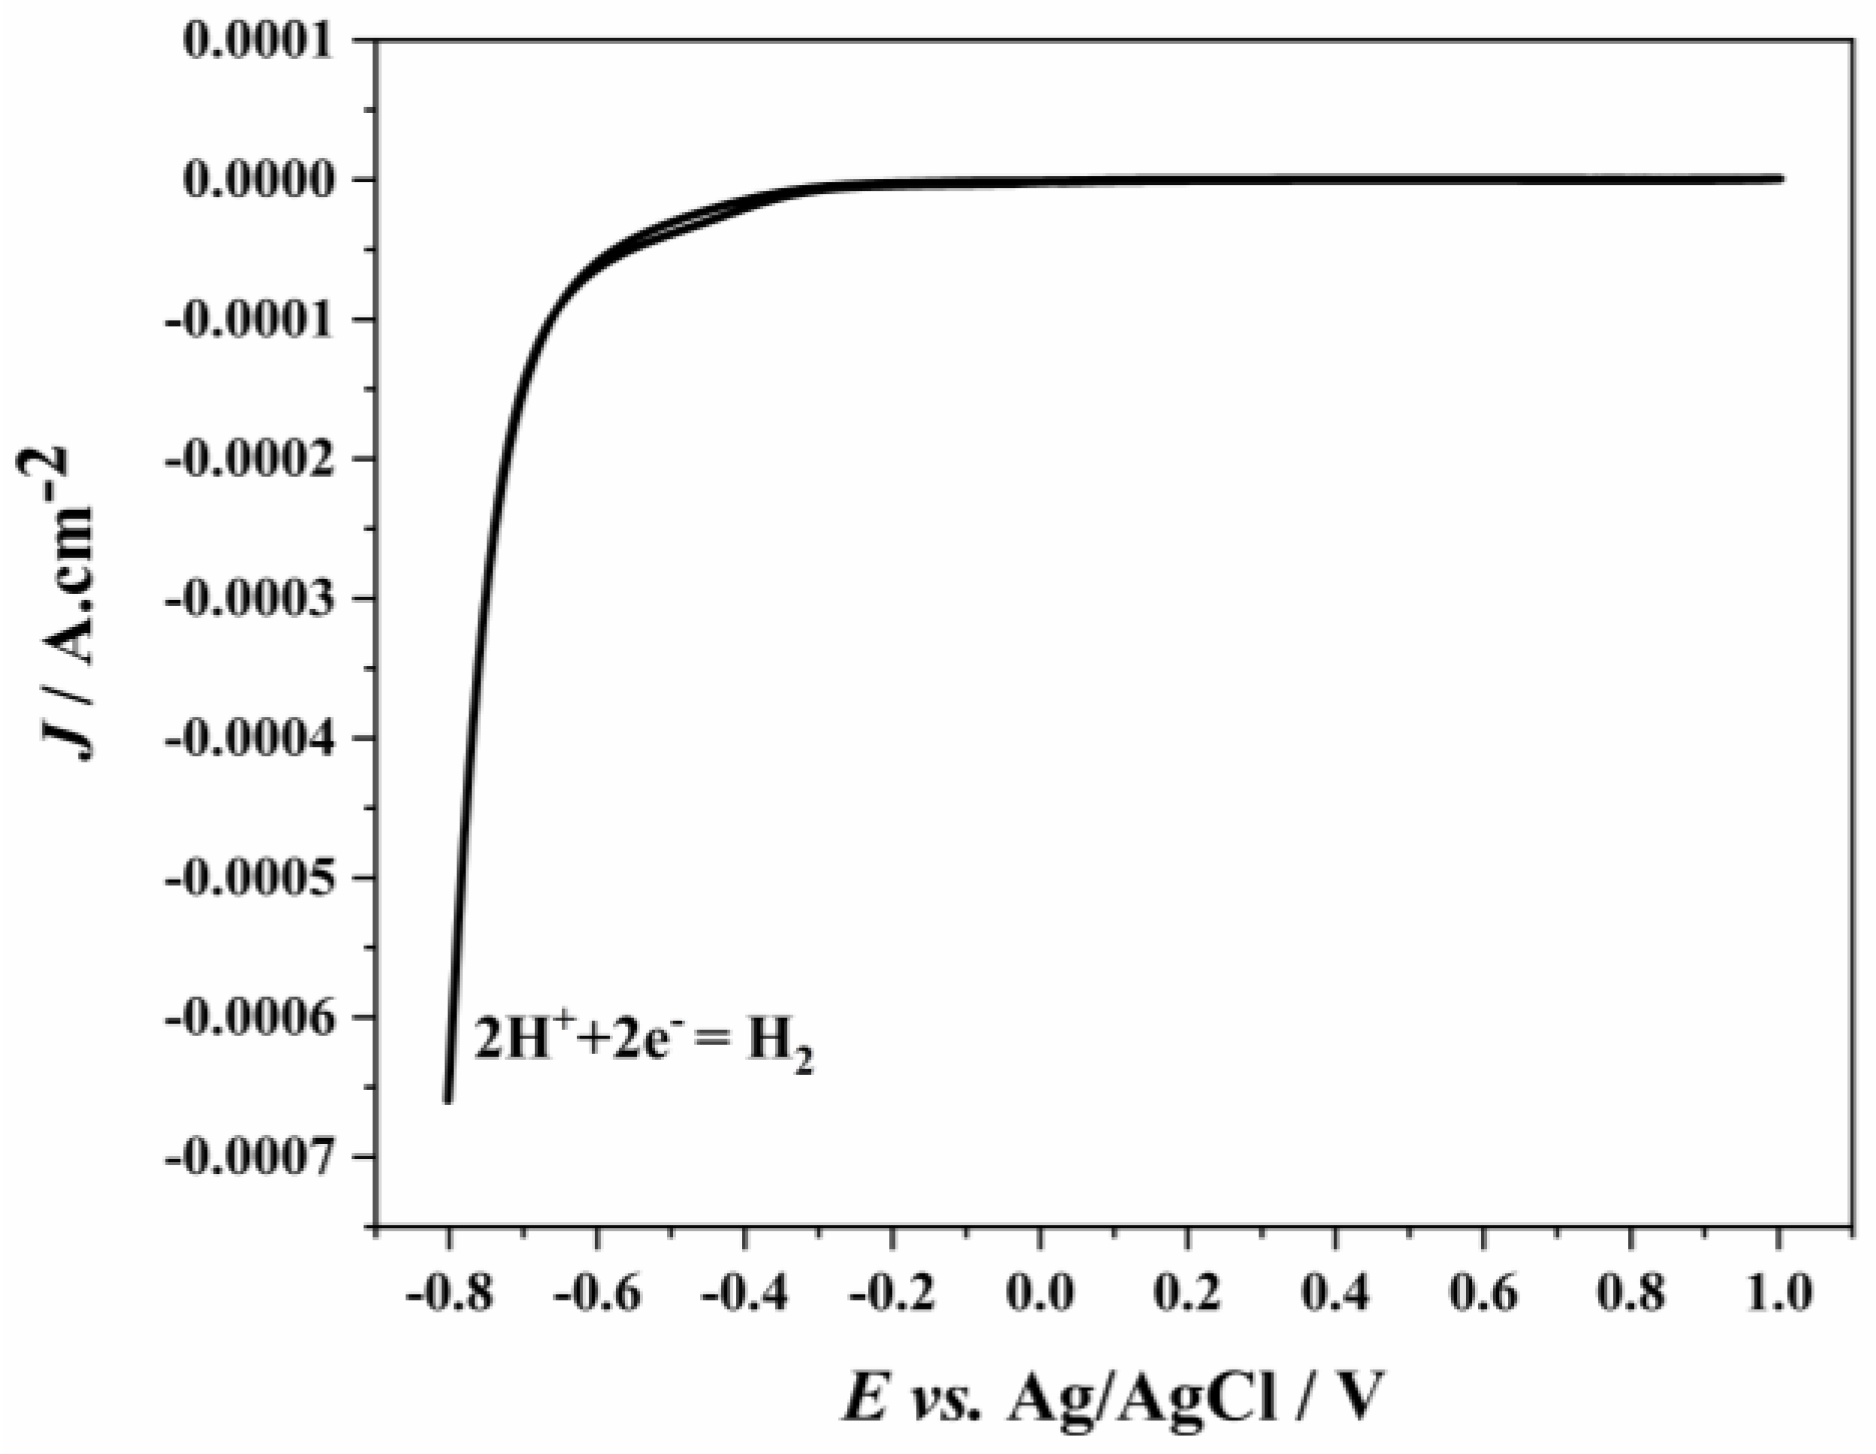
3.2. Electrochemical Behavior of Ni2+ Sulfate Solution

After analyzing Cu2+-containing solutions, the electrochemical behavior of the Ni2+-containing solution was investigated at pH 1 using solutions with 1.5 g/L Ni2+. It is well known that high acidity inhibits the deposition of nickel on the cathode [44]. Studies report that Ni2+ reduction does not occur at low pH values or occurs in combination with H+ reduction in a single step [23], as described by Equation (5):
Ni2+ + 2e = Ni     E° = −0.23 V
2H + + 2e = H2     E° = 0.00 V
The pH of the 1.5 g/L Ni2+ solution was adjusted to 1, and the solution was analyzed within the potential range of −0.8 V to 1.0 V. The voltammetry graph obtained is shown in Figure 5. It can be seen from Figure 5 that Ni2+ reduction did not occur, and H+ reduction began at −0.7 V [25]. The absence of an oxidation peak in the CV graph indicates that Ni2+ reduction does not take place and that all observed reduction peaks correspond to H+ reduction.
The absence of Ni2+ reduction at pH 1 indicates that mixed solutions containing Ni2+ and Cu2+ can be separated without Ni2+ reduction.

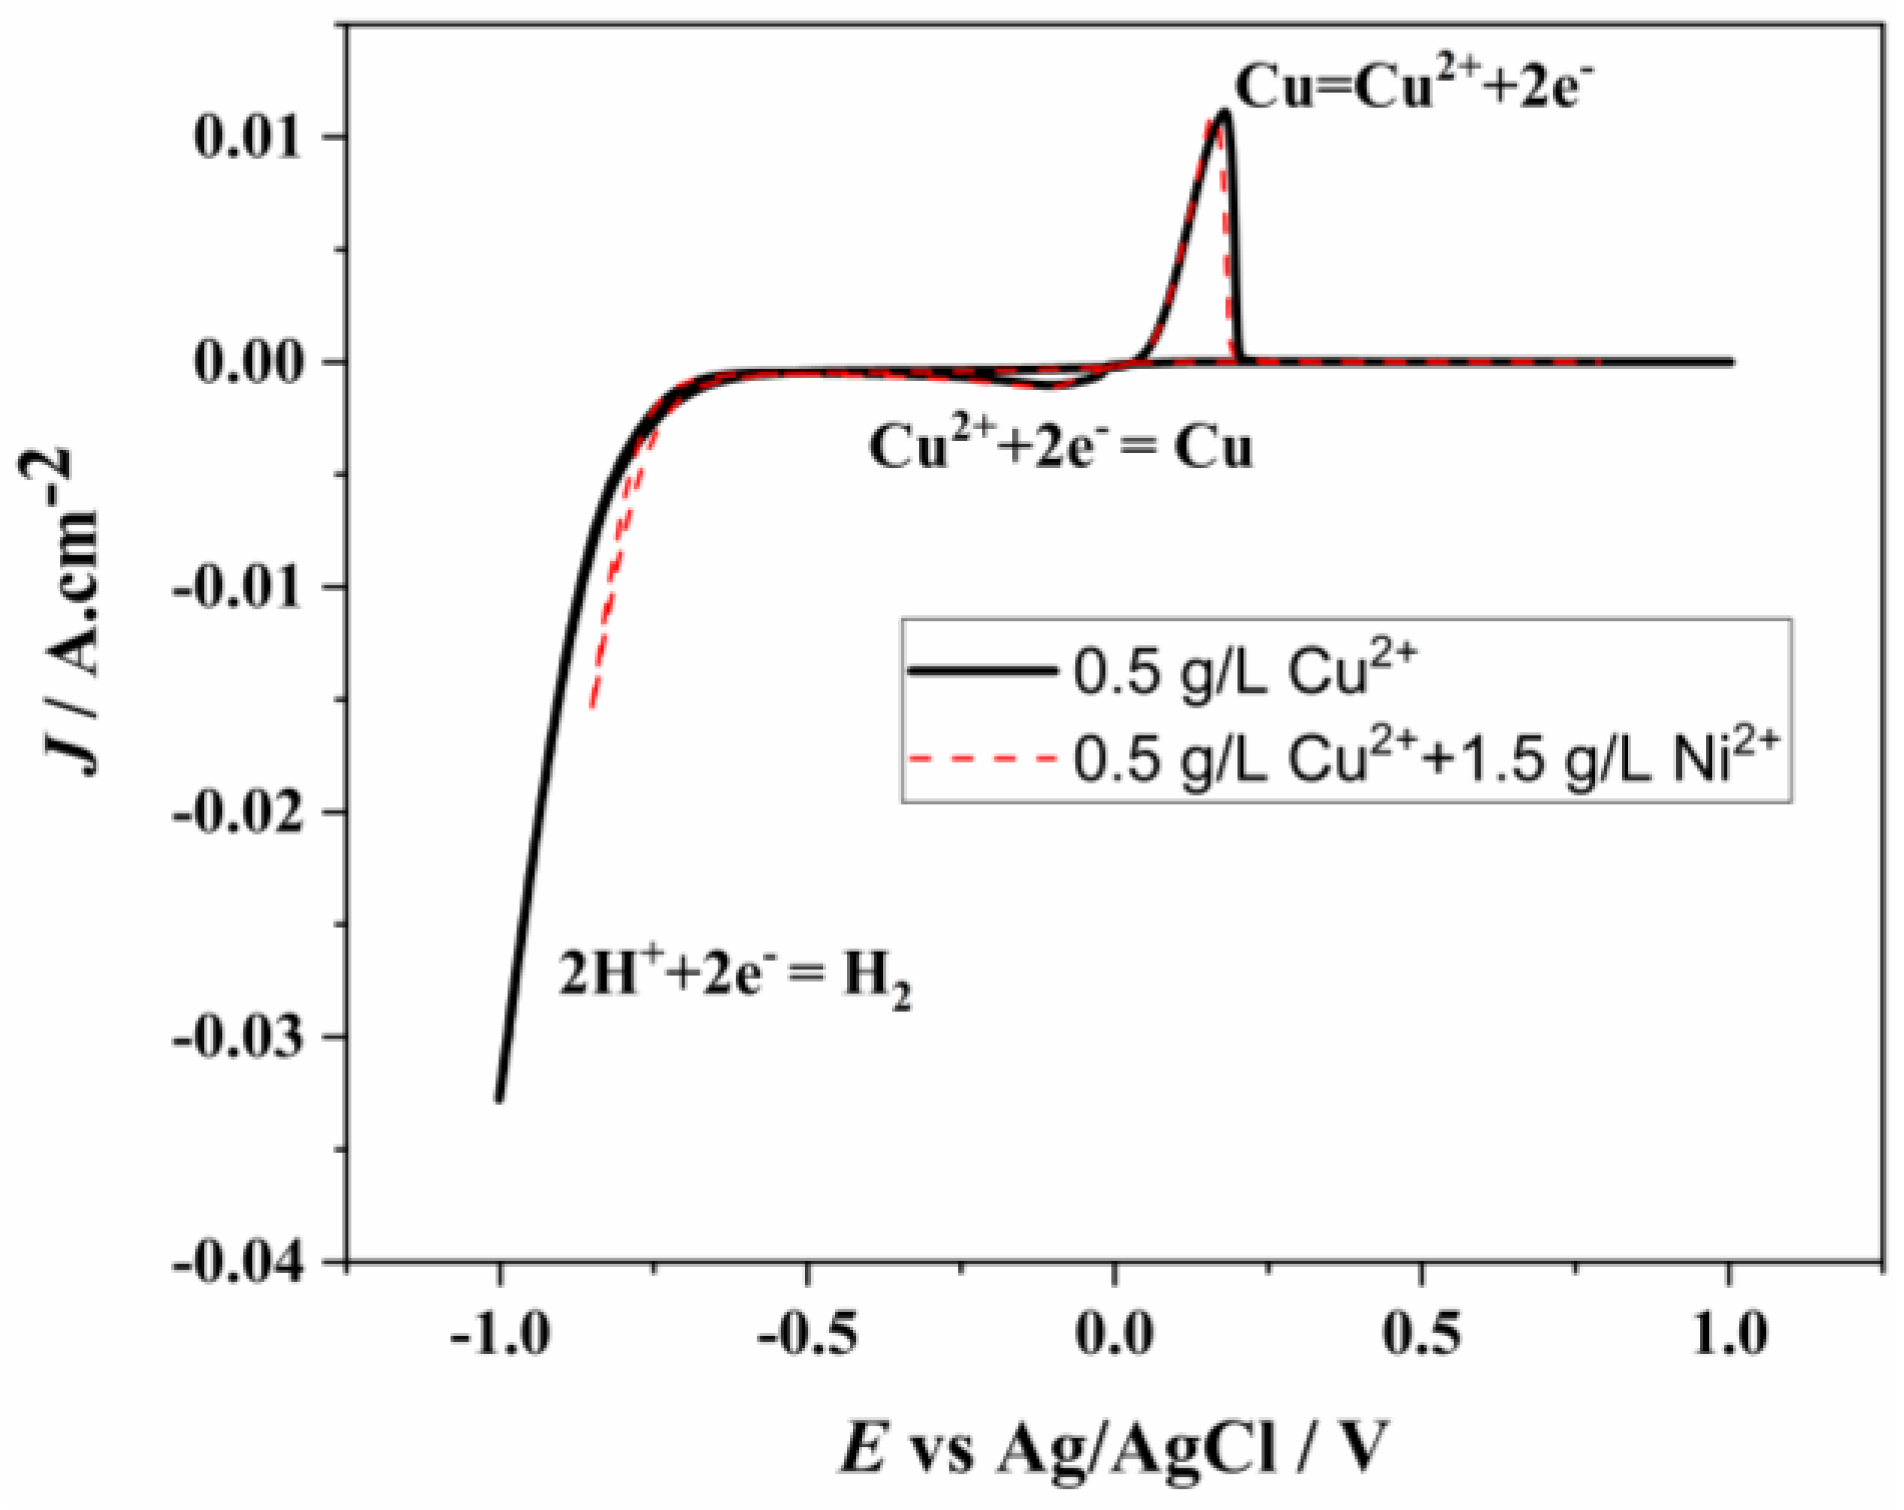
3.3. Electrochemical Behavior of Cu2+-Ni2+ Mixed Solution

After determining the electrochemical behavior of synthetic solutions containing individual Cu2+ and Ni2+, the electrochemical behavior of solutions with varying Cu2+ concentrations and a constant 1.5 g/L Ni2+ was investigated using CV at different scan rates. In all experiments, the solution pH was adjusted to 1 using sulphuric acid. CV analyses were performed at different scan rates (10–100 mV/s) within a potential range of −0.85 V to 0.8 V to minimize the influence of H+ reduction on the cathodic peak. The Cu2+ and Ni2+ concentrations of the solutions analyzed in this section are provided in Table 2.
CV graphs of the solutions prepared at the concentrations listed in Table 2 are shown in Figure 6. From these graphs, it is evident that Ni2+ reduction does not occur, while H+ reduction takes place at −0.70 V [25]. The Cu2+ reduction and oxidation peak values are approximately the same as those observed in the solution containing only Cu2+. The reduction of Cu2+ to Cu occurs at −0.15 V, while the oxidation of Cu to Cu2+ occurs at 0.17 V.
To better visualize the effect of Cu2+ concentration differences, the voltammetry graphs for various Cu2+ concentrations with a constant 1.5 g/L Ni2+ are combined and presented in Figure 7a. The peak current values increased with rising Cu2+ concentration, and the peak positions shifted in both negative and positive directions. Figure 7b displays the voltammetry graphs for the solutions with the lowest and highest Cu2+ concentrations. It is more clearly observed that the initial oxidation and reduction values remained unchanged, while the peak positions shifted in both positive and negative directions.
To determine whether nickel is reduced, the CV graphs of solutions containing only 0.5 g/L copper ions and those containing 0.5 g/L copper ions along with 1.5 g/L nickel ions are presented together in Figure 8. The anodic and cathodic reactions occurring at the same potentials in both graphs indicate that nickel reduction does not take place, and the observed peaks correspond to copper reduction and oxidation. This shows that at pH 1, the reduction potentials of Ni2+ and Cu2+ are clearly different, and as long as the correct electrode potential is applied, the separation of the two ions will occur [45].

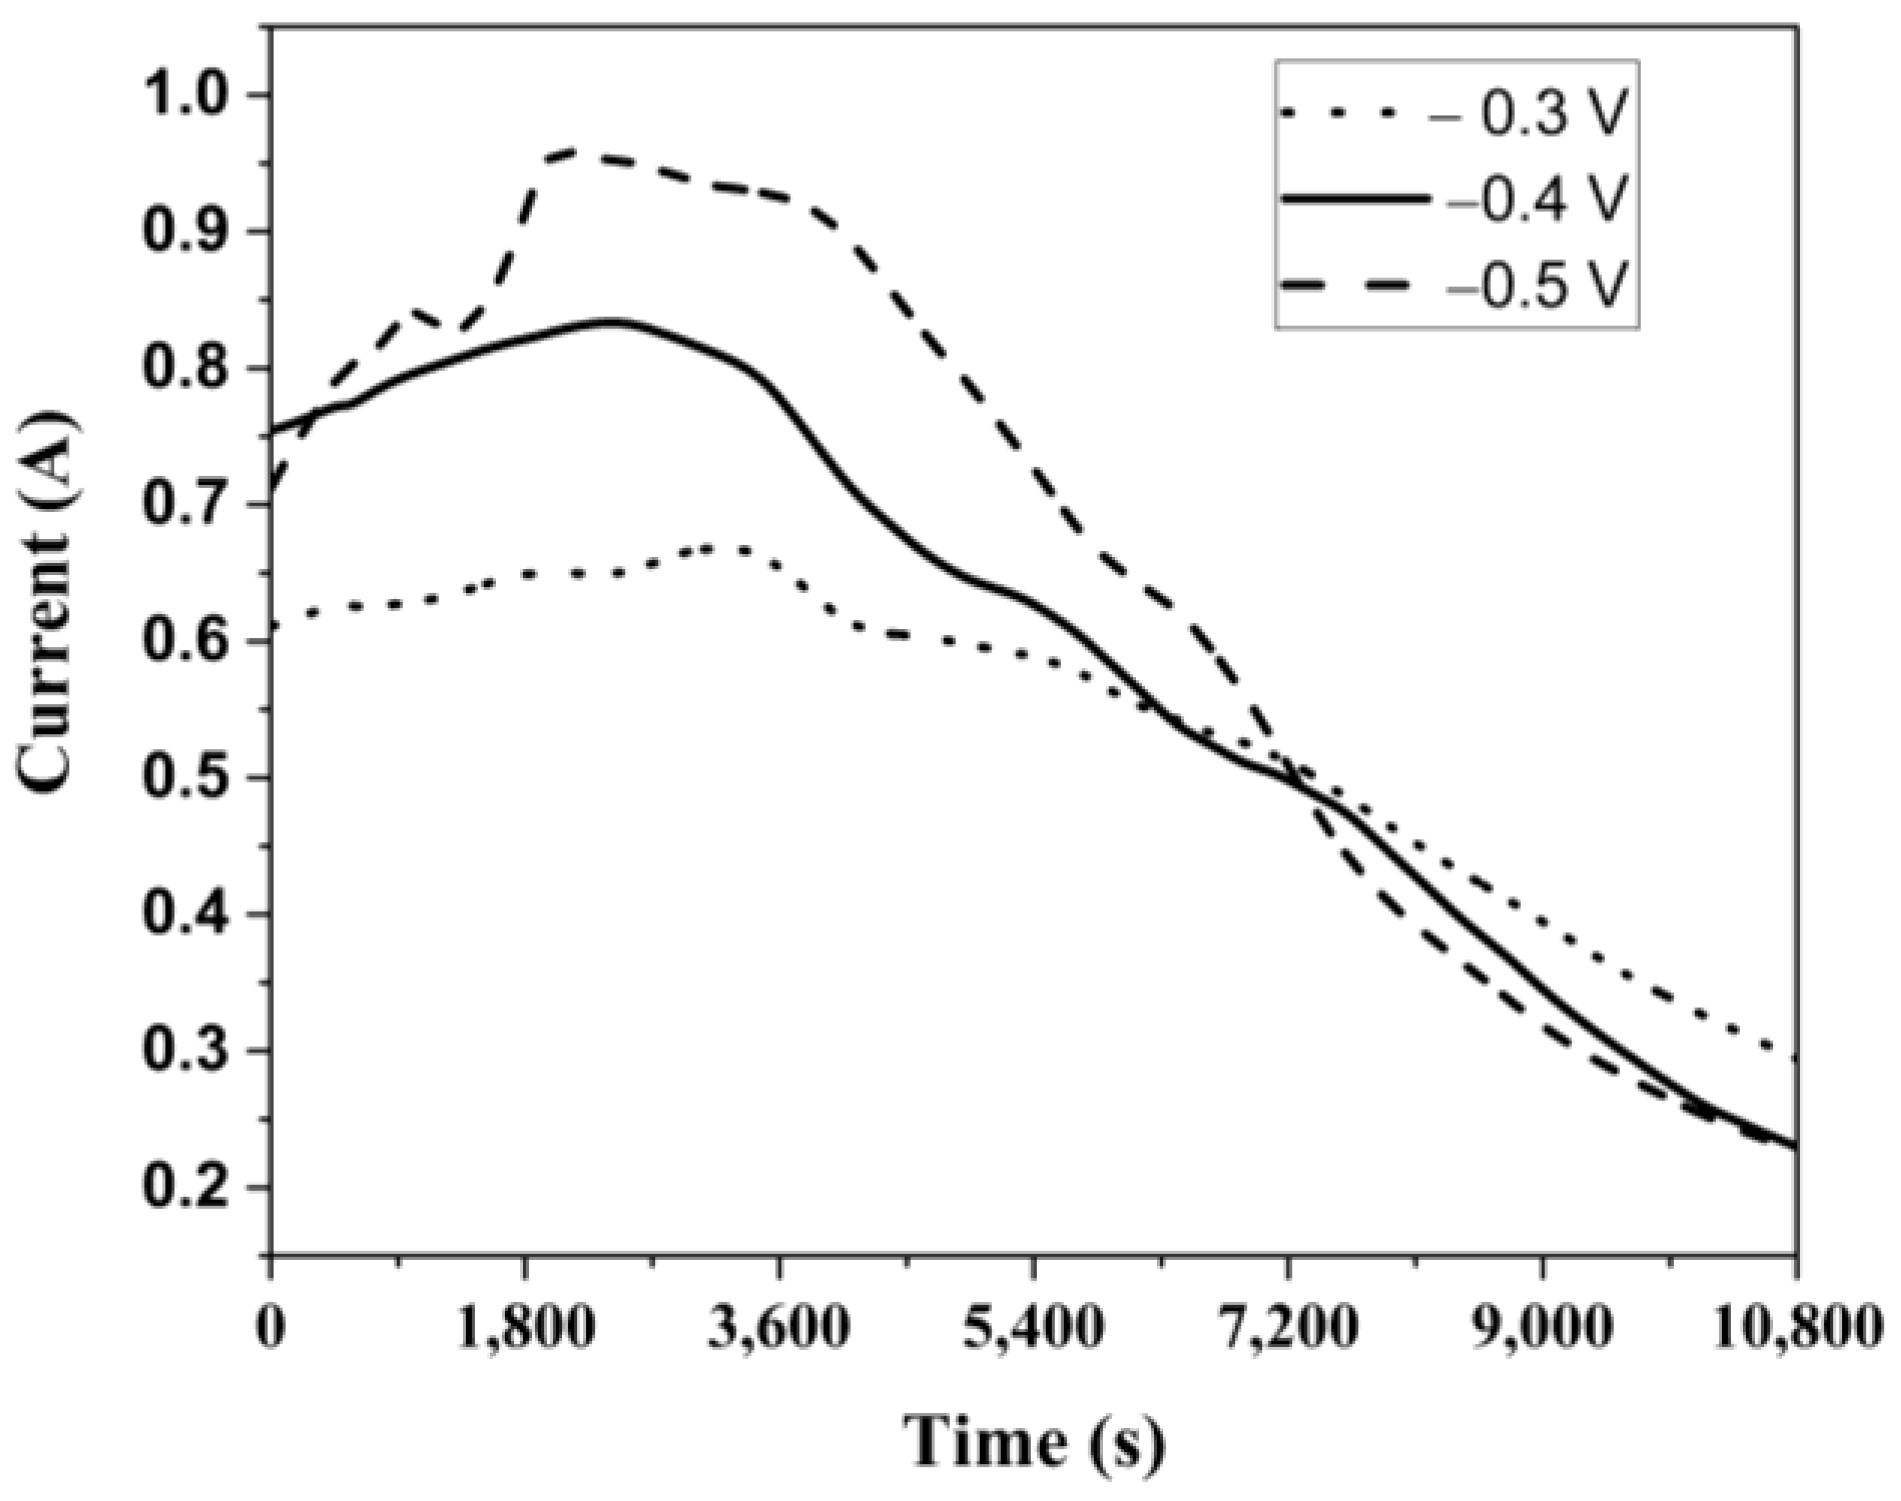
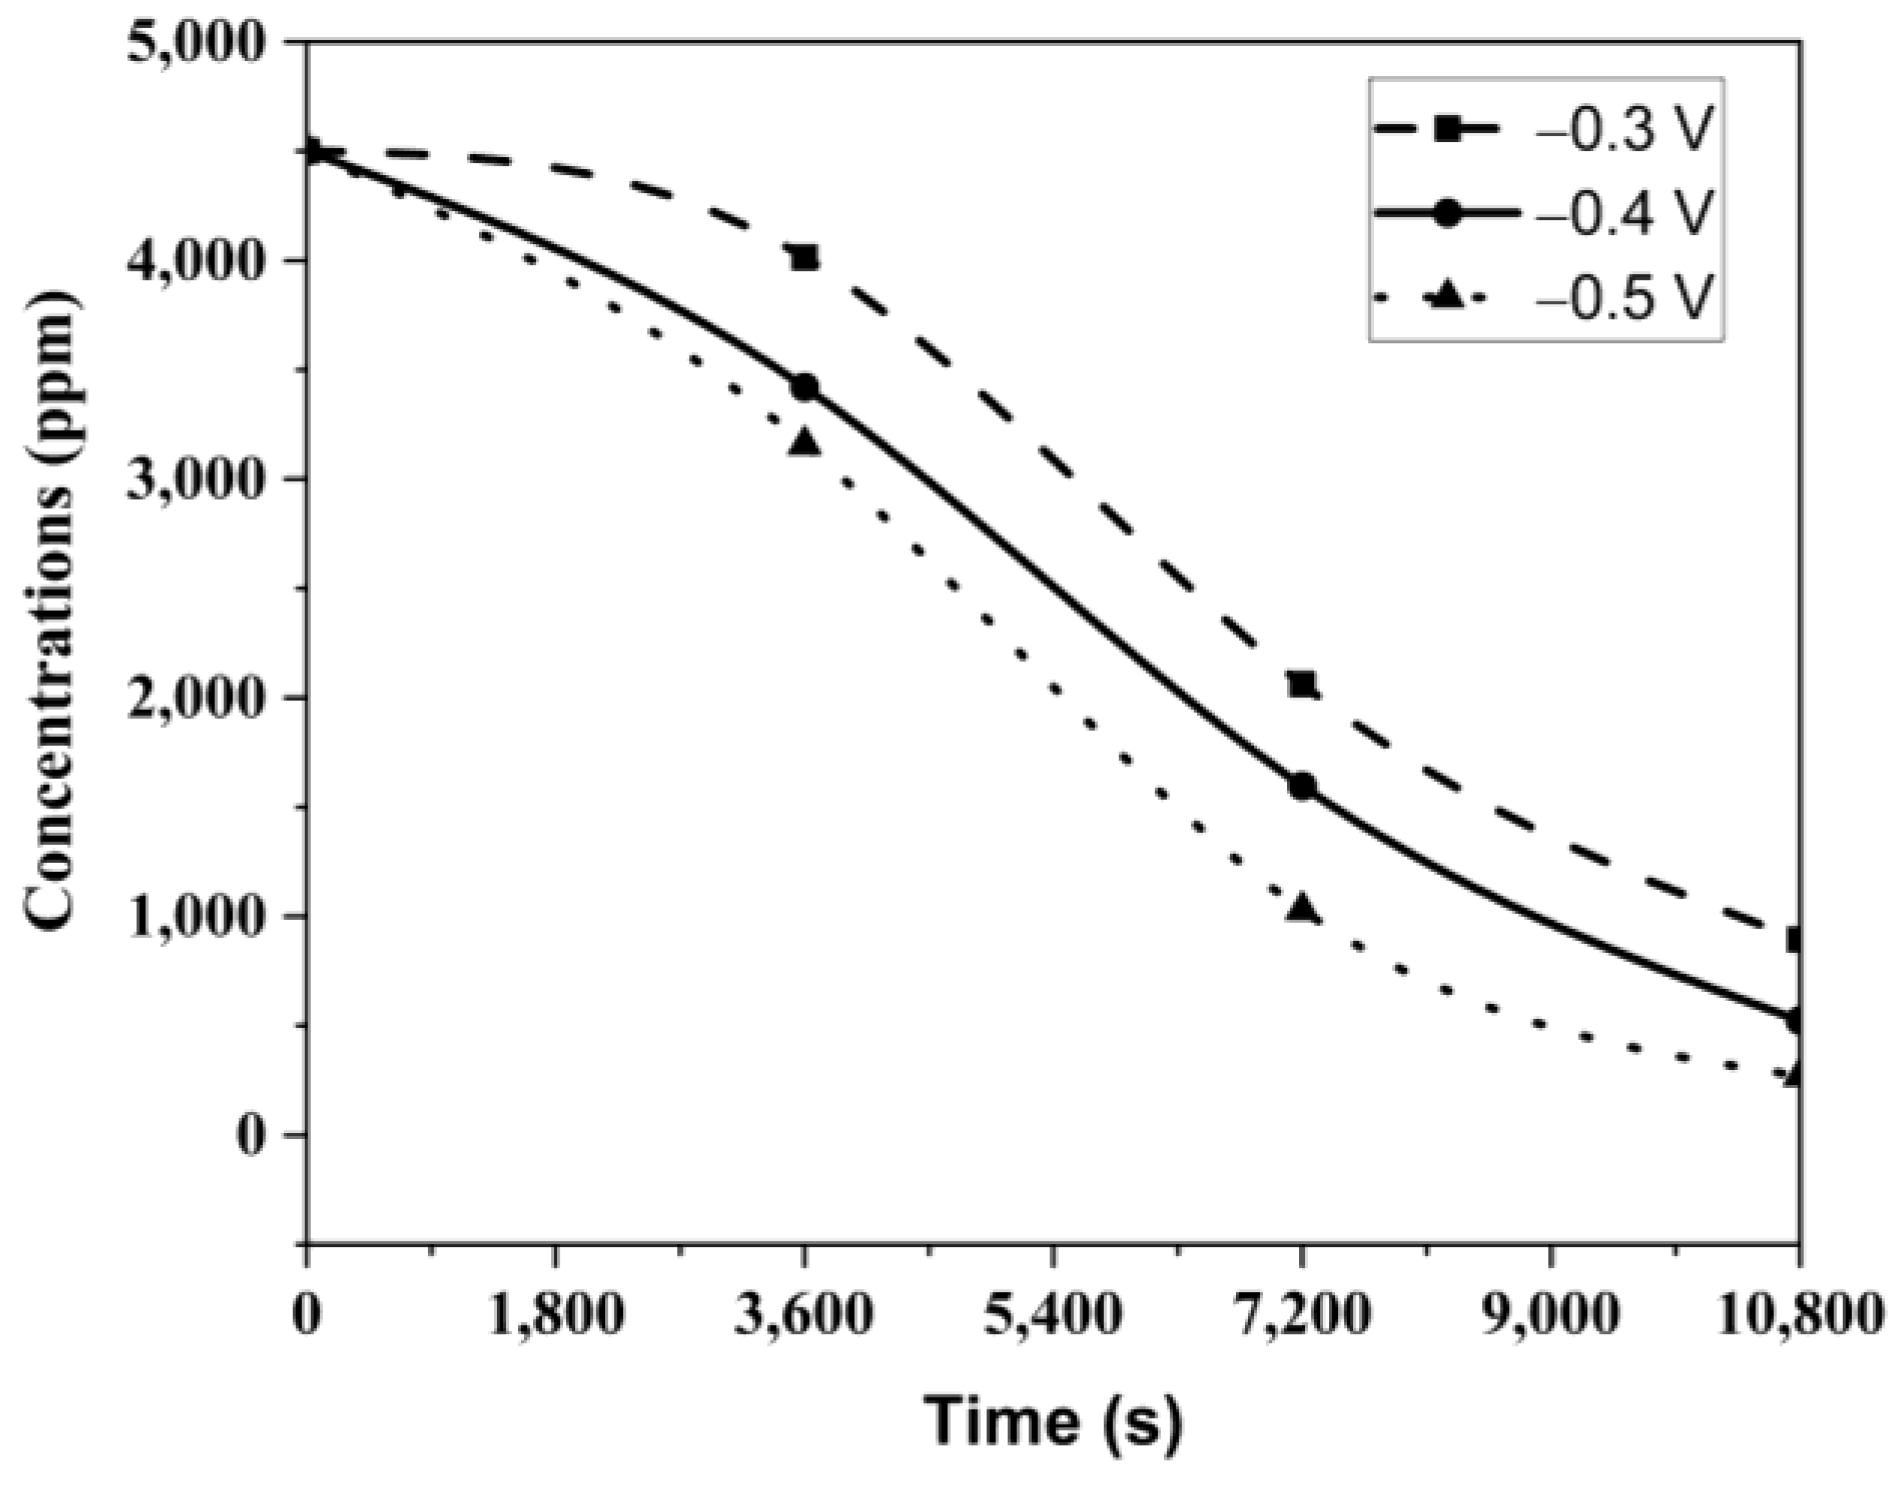
3.4. Potentiostatic Separation of Cu2+ from Cu2+-Ni2+ Mixed Sulfate Solution

After determining the oxidation and reduction conditions at different concentrations and pH values using CV, potentiostatic separation experiments were conducted at −0.3 V, −0.4 V, and −0.5 V cathode potentials. Initially, experiments were performed at different potentials for a fixed duration of 3 h. Figure 9 shows the time-dependent current variation for these experiments. Similarly, the current initially increased from 0 to a peak value for each potential and then gradually decreased over time to the residual current level. This is likely due to the continuous consumption of Cu2+ ions in the solution over time, leading to a decrease in their concentration. As clearly shown in Figure 9, the highest current value was observed at the highest potential, as expected, while the current decreased with decreasing potential.
The variation in Cu2+ concentrations in the solution over 3 h at different potentials is shown in Figure 10. The figure indicates that the Cu2+ content decreased proportionally with the applied potential each hour, with the lowest Cu2+ concentration recorded at 140 ppm after 3 h at −0.5 V. These experiments confirmed that Ni2+ reduction did not occur, as indicated by the CV analyses, and the Ni2+ concentration remained constant at 1.5 g/L across all potentials.
Figure 11 shows the copper recovery and charge values at different potentials. The lowest copper recovery was 80% at −0.3 V, while the highest recovery reached 94% at −0.5 V. As the potential increased from −0.3 V to −0.5 V, the charge increased from 5834 to 7001.
Table 3 shows the charge, current efficiency, and copper recovery data from experiments conducted at different potentials and durations. At the highest applied potential (−0.5 V), the experiment time was extended to 5 h, and the Cu2+ content of the solution was analyzed. While current efficiency remained nearly constant at different potential values for 3 h, it decreased to 86.4% when the duration was extended to 5 h. The highest copper recovery of 99.13% was achieved at −0.5 V with a 5 h experimental duration.
Figure 12 shows the graph of current variation over time. Similarly to the previous experiments, the current initially increased and then remained constant at the residual current level after the 4th hour.
The Cu2+ concentration change at −0.5 V over 5 h is shown in Figure 13. In parallel with the current change graph in Figure 12, the Cu2+ content initially decreased rapidly, followed by a more gradual decline after 3 h. By the end of 5 h, the Cu content of the solution had dropped to 39 ppm, the lowest copper concentration observed in all experiments. Conventional tank electrolysis systems are known to be inadequate for removing metals from dilute solutions. In a two-electrode system operating at similar concentrations, the metal concentration in the solution can be reduced to 280 ppm in 20 h. However, the high-convection Chemelec cell we used reduced it to 39 ppm in just 5 h [23]. Hannula et al. also studied copper removal from industrial wastewater with the classical two-electrode system and stated that 60% of the copper in the solution was removed in more than 20 h [25].
The phases present in the cathode-deposited metal were analyzed using XRD techniques. Figure 14 shows the XRD pattern of the cathode products. The diffractogram reveals two distinct phases: Cu and Cu2O. The Cu2O phase is believed to have formed during the drying process of the cathode products. In the XRD analysis, no Ni-containing phases were detected, which aligns with the ICP results. Djouani et al. also studied potentiostatic Cu-Ni separation using the classical two-electrode system and observed a small amount of the Cu2O phase, similar to our study [23].
The above analysis shows that the potentiostatic method can effectively reduce the Cu2+ ion concentration in a mixed solution of Ni2+ and Cu2+, enabling the separation of the two ions.

4. Conclusions

In this study, the potentiostatic selective separation of Cu2+ from Cu2+-Ni2+ leaching solutions was investigated using an electrolysis cell with high convection. First, the electrochemical behavior of synthetically prepared Cu2+, Ni2+, and mixed Cu2+-Ni2+ solutions was analyzed by CV, and the reduction potentials were determined. Then, selective Cu2+ reduction was carried out at −0.3 V, −0.4 V, and −0.5 V, and the effect of cathode potential on selective Cu2+ reduction, current efficiency, and copper recovery was examined. The obtained results are summarized below:
  • CV analyses showed that Cu2+/Cu reaction was a quasi-reversible process controlled by diffusion. Cu2+ was reduced at −0.15 V and oxidized at 0.17 V in a single step.
  • The electrochemical behavior of Ni2+ solutions was investigated at pH 1. It was seen that at pH 1, Ni2+ reduction did not occur, and only H+ reduction took place, with no anodic peak observed.
  • The electrochemical behavior of a mixed Cu2+ and Ni2+ solution, simulating a leaching solution, was studied. Due to the significant difference in the deposition potentials of the two ions, their separation was easily achieved using the potentiostatic method.
  • In potentiostatic selective reduction experiments, copper recovery increased from 84% to 94% as the applied potential increased from −0.3 V to −0.5 V.
  • Current efficiency remained above 90% for all three potentials in 3 h experiments.
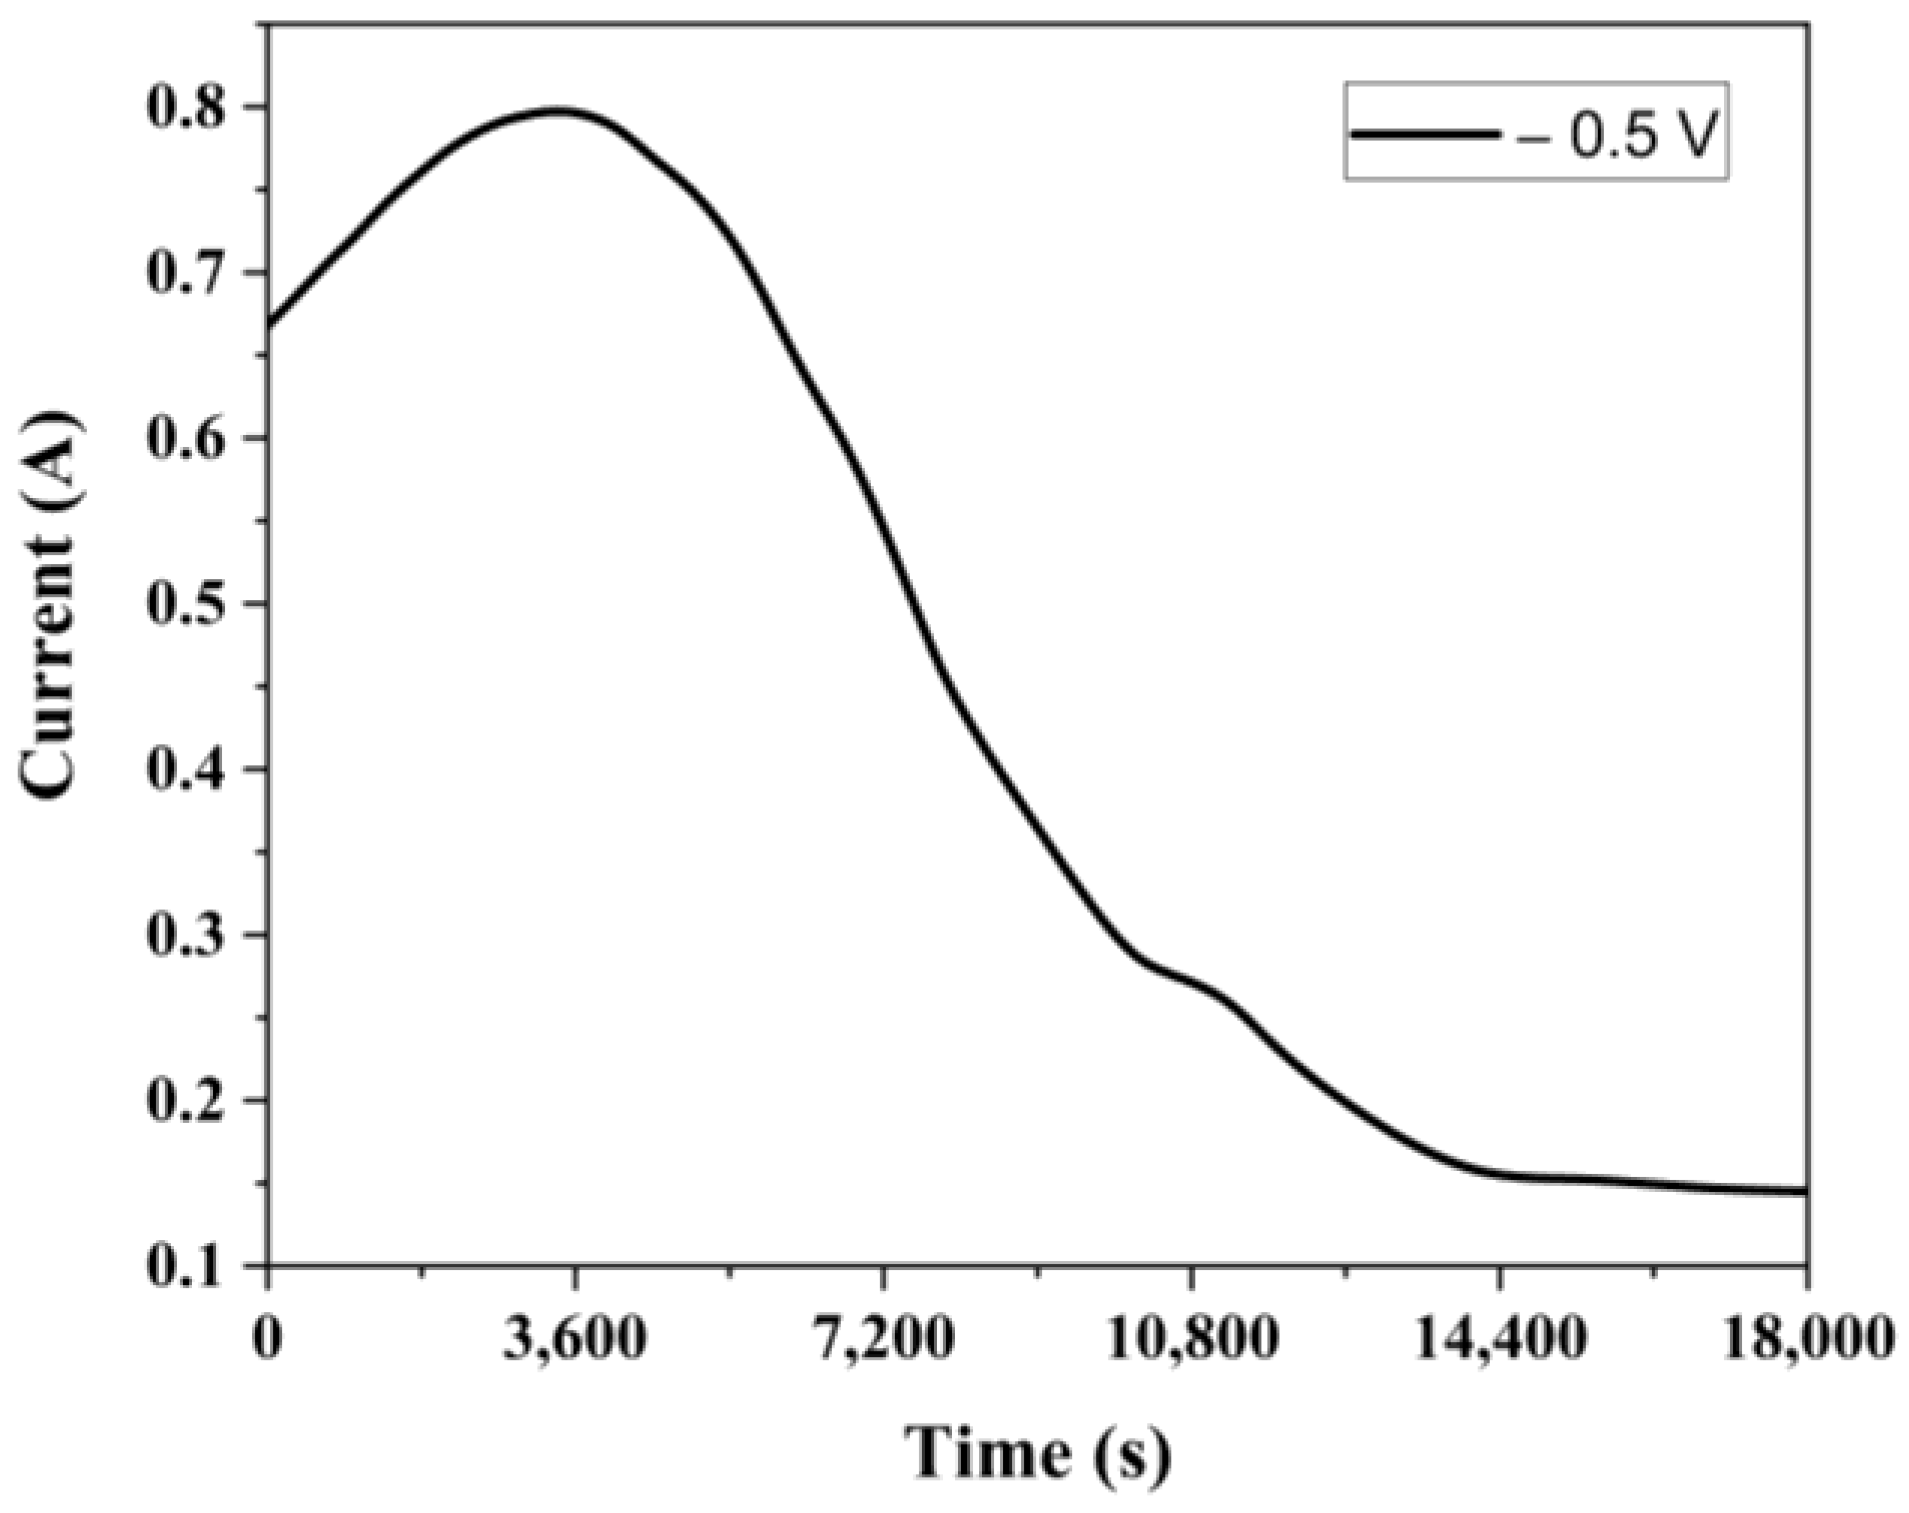
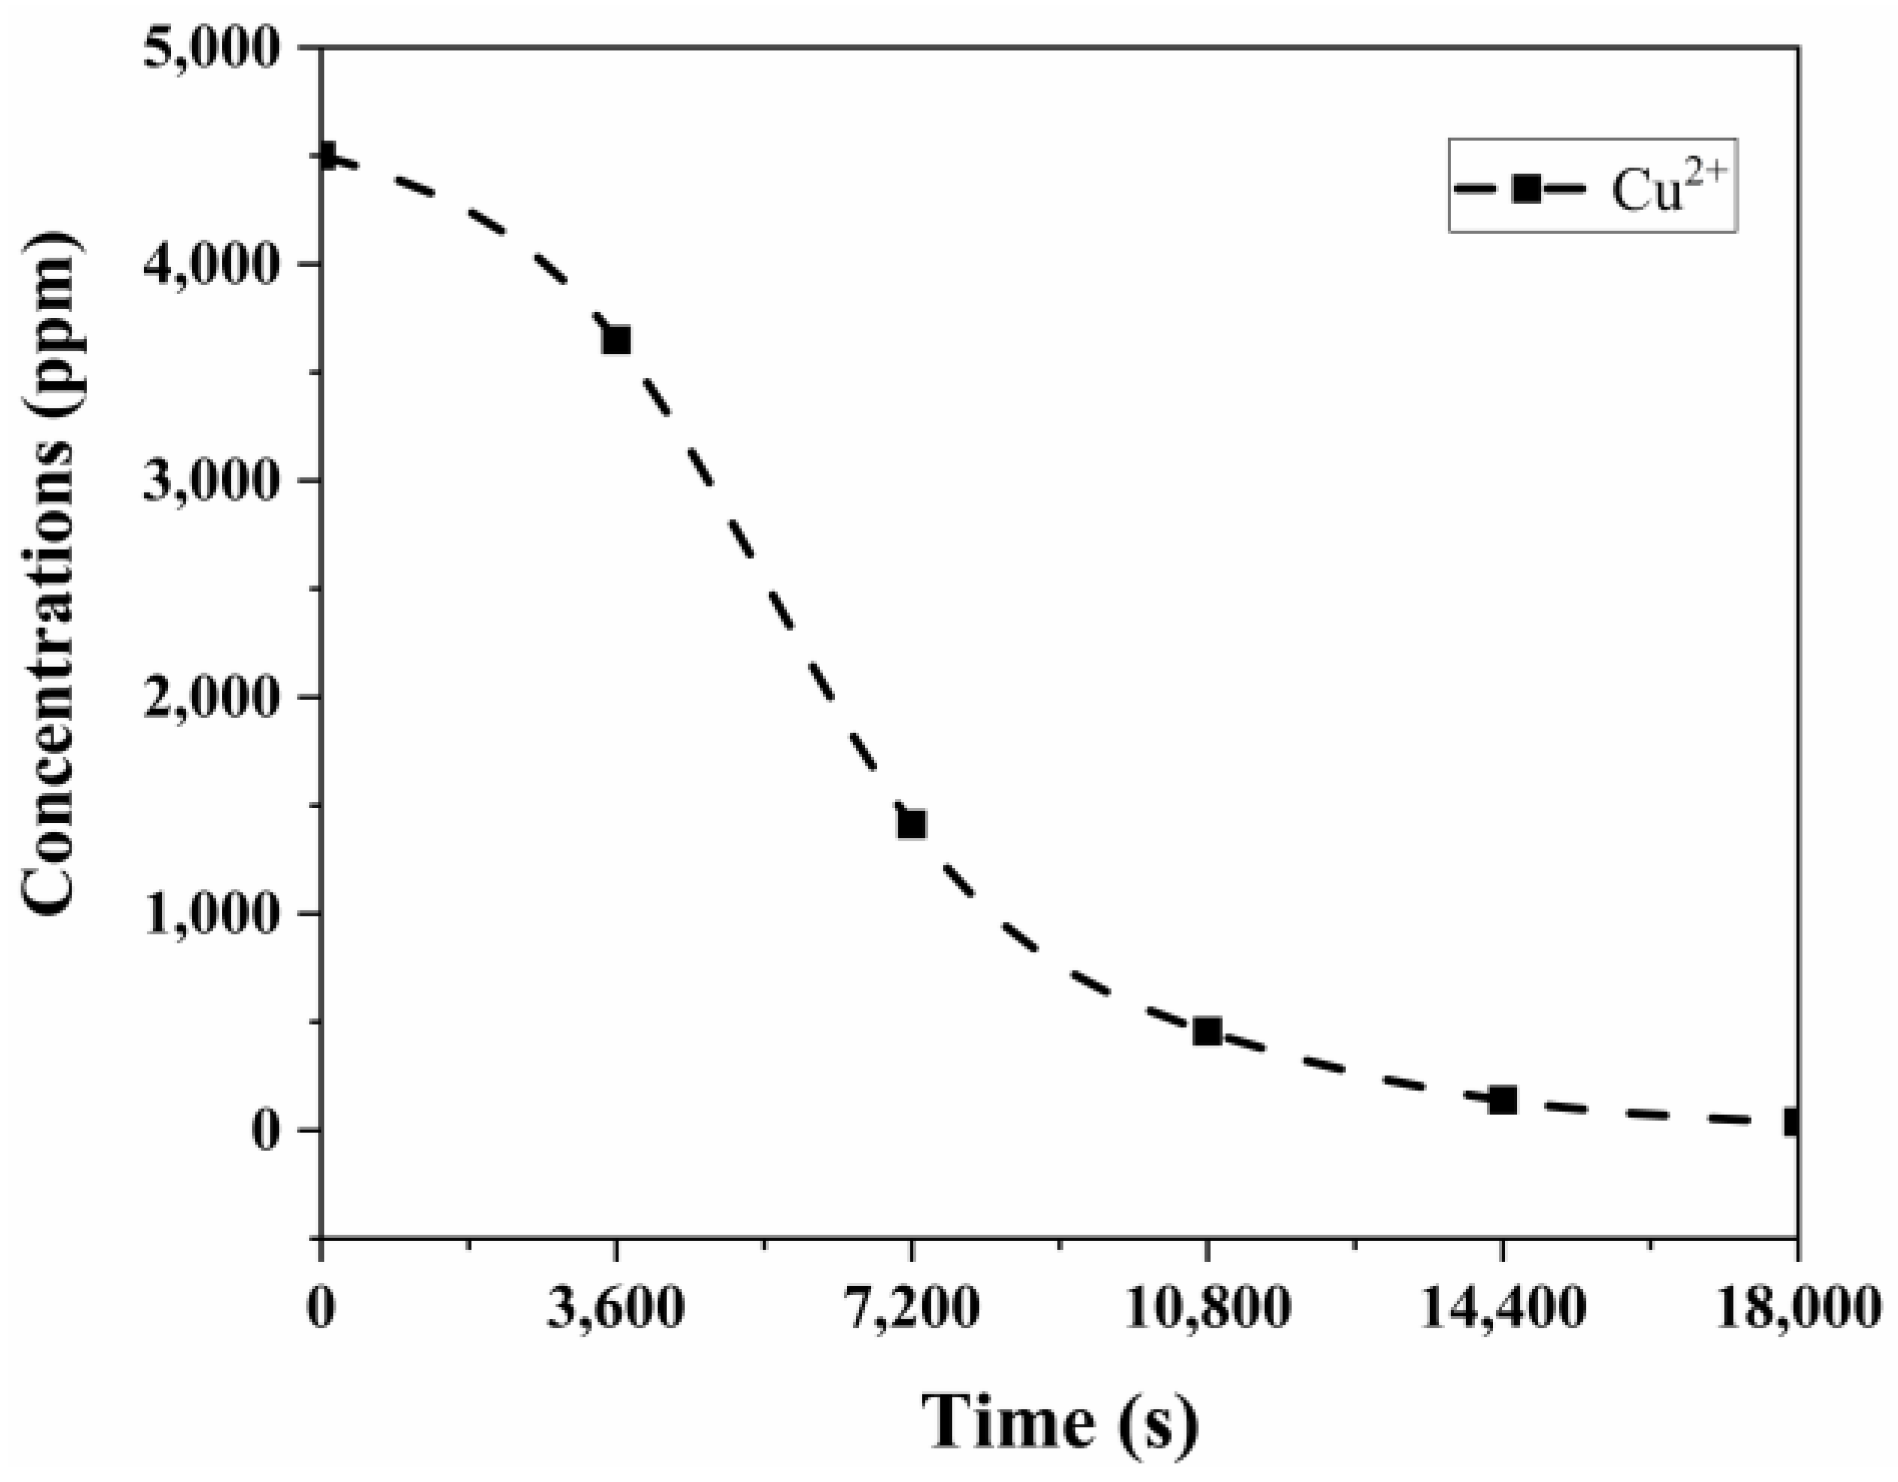
  • Extending the experiment duration from 3 h to 5 h at −0.5 V cathodic potential resulted in copper recovery exceeding 99%, while current efficiency decreased from 90% to 80%, leaving a residual Cu2+ concentration of 39 ppm in the solution.
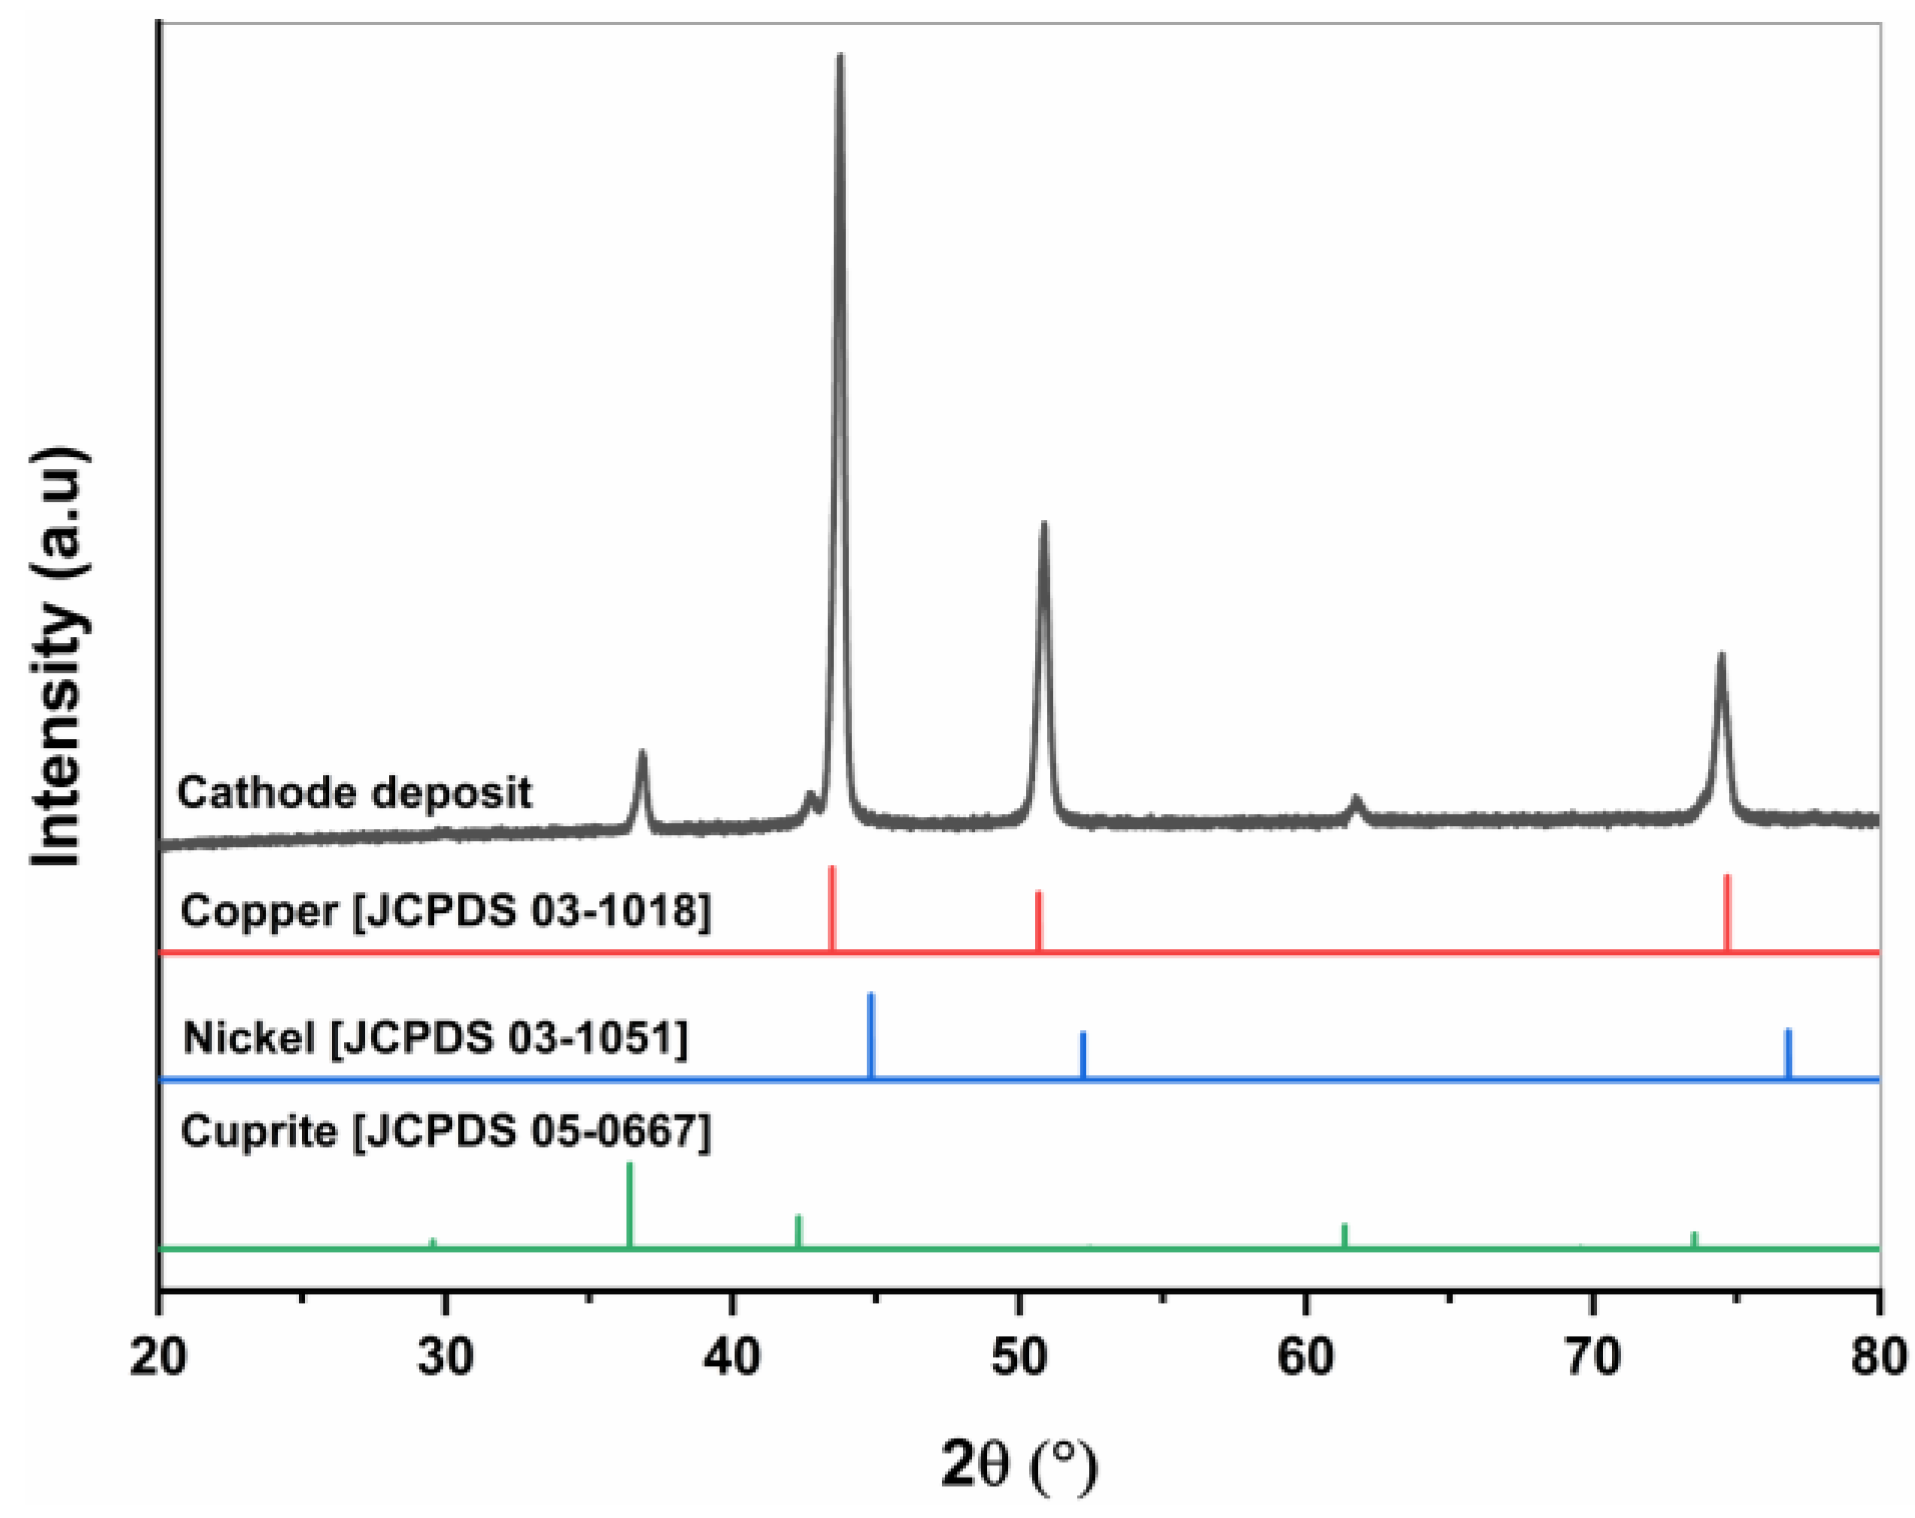
  • XRD analysis of the cathode products showed that the main structure was composed of copper, with a small amount of the Cu2O phase due to oxidation during drying.

Funding

This research received no external funding.

Data Availability Statement

The original contributions presented in this study are included in the article. Further inquiries can be directed to the corresponding author.

Conflicts of Interest

The author declares no conflicts of interest.

References

  1. Schlesinger, M.E.; King, M.J.; Sole, K.C.; Davenport, W.G. Production and Use. In Extractive Metallurgy of Copper; Elsevier: Amsterdam, The Netherlands, 2011; pp. 13–30. [Google Scholar] [CrossRef]
  2. Jensen, P.D.; Purnell, P.; Velenturf, A.P.M. Highlighting the need to embed circular economy in low carbon infrastructure decommissioning: The case of offshore wind. Sustain. Prod. Consum. 2020, 24, 266–280. [Google Scholar] [CrossRef]
  3. Hu, Q.; Gu, Y. Copper economic dynamics: Navigating resource scarcity, price volatility, and green growth. Resour. Policy 2024, 89, 104462. [Google Scholar] [CrossRef]
  4. Warlimont, H. Springer Handbook oƒ Materials Data, 2nd ed.; Springer International Publishing: Cham, Switzerland, 2018. [Google Scholar] [CrossRef]
  5. Everhart, J.L. Engineering Properties of Nickel and Nickel Alloys; Springer: Boston, MA, USA, 1971. [Google Scholar] [CrossRef]
  6. Vignes, A. Extractive Metallurgy 3; John Wiley & Sons, Inc.: Hoboken, NJ, USA, 2013. [Google Scholar] [CrossRef]
  7. Álvarez, M.L.; Fidalgo, J.M.; Gascó, G.; Méndez, A. Hydrometalurgical recovery of Cu and Zn from a complex sulfide mineral by Fe3+/H2SO4 leaching in the presence of carbon-based materials. Metals 2021, 11, 286. [Google Scholar] [CrossRef]
  8. Tang, X.; Ju, K. Exploring Strategies for Copper Removal from Nickel Anolytes: A Review. ChemEngineering 2023, 7, 116. [Google Scholar] [CrossRef]
  9. Goryachev, A.A.; Chernousenko, E.V.; Potapov, S.S.; Tsvetov, N.S.; Makarov, D.V. A study of the feasibility of using ammonium sulfate in copper–nickel ore processing. Metals 2021, 11, 422. [Google Scholar] [CrossRef]
  10. Vignes, A. Metallurgical Reaction Processes Sulfide Extraction Processes 6.1. In Extractive Metallurgy 2; Vignes, A., Ed.; Wiley-ISTE: London, UK, 2011. [Google Scholar]
  11. Crundwell, F.K.; Moats, M.S.; Robinson, T.G.; Davenport, W.G. Extractive Metallurgy of Copper, Nickel, and Cobalt; Elsevier: Amsterdam, The Netherlands, 2011. [Google Scholar]
  12. Zulhan, Z.; Adzana, Z.; Munawaroh, M.; Yusro, A.H.; Christian, J.D.; Saputri, A.D.; Hidayat, T. Sulfur Removal and Iron Extraction from Natrojarosite Residue of Laterite Nickel Ore Processing by Reduction Roasting. Metals 2023, 13, 52. [Google Scholar] [CrossRef]
  13. Santos, R.M.; van Audenaerde, A.; Chiang, Y.W.; Iacobescu, R.I.; Knops, P.; van Gerven, T. Nickel extraction from olivine: Effect of carbonation pre-treatment. Metals 2015, 5, 1620–1644. [Google Scholar] [CrossRef]
  14. Li, L.; Chen, X.; Liu, X.; Zhao, Z. Removal of Cu from the nickel electrolysis anolyte using amorphous MnS. Hydrometallurgy 2014, 146, 149–153. [Google Scholar] [CrossRef]
  15. Panyushkina, A.; Fomchenko, N.; Babenko, V.; Muravyov, M. Effect of temperature on biobeneficiation of bulk copper-nickel concentrate with thermoacidophilic microbial communities. Metals 2021, 11, 1969. [Google Scholar] [CrossRef]
  16. Tang, X.; Ju, K.; Zhao, Z. A strategy for deep removal of Cu from Ni anolyte based on the ion-exchange method. J. Environ. Chem. Eng. 2024, 12, 111786. [Google Scholar] [CrossRef]
  17. Chen, A.L.; Qiu, G.Z.; Zhao, Z.W.; Sun, P.M.; Yu, R.L. Removal of copper from nickel anode electrolyte through ion exchange. Trans. Nonferrous Met. Soc. China 2009, 19, 253–258. [Google Scholar] [CrossRef]
  18. Allen, L.R.F.; Bard, J. Electrochemical Methods: Fundamentals and Applications; John Wiley & Sons, Inc.: Oxford, UK, 2000. [Google Scholar]
  19. Lu, X.; Li, Y.; Zhang, A.; Luo, G.; Wu, X.; Wang, S.; Feng, J.; Guo, Y. Highly efficient and selective removal of copper from low pH nickel Watts solution through hydrogen sulfide. Chem. Pap. 2023, 77, 6707–6715. [Google Scholar] [CrossRef]
  20. Chen, X.; Chen, A.; Zhao, Z.; Liu, X.; Shi, Y.; Wang, D. Removal of Cu from the nickel electrolysis anolyte using nickel thiocarbonate. Hydrometallurgy 2013, 133, 106–110. [Google Scholar] [CrossRef]
  21. Belkhouche, N.E.; Didi, M.A.; Villemin, D. Separation of nickel and copper by solvent extraction using Di-2 ethylhexylphosphoric acid-based synergistic mixture. Solvent Extr. Ion Exch. 2005, 23, 677–693. [Google Scholar] [CrossRef]
  22. Rahmati, S.; Adavodi, R.; Hosseini, M.R.; Veglio, F. Efficient Metal Extraction from Dilute Solutions: A Review of Novel Selective Separation Methods and Their Applications. Metals 2024, 14, 605. [Google Scholar] [CrossRef]
  23. Djouani, R.; Xu, Q.; Song, Q.; Chen, Y. The Separation of Copper and Nickel from Ni-Cu Mixed Ore Simulated Leaching Solution Using Electrochemical Methods. Eurasian J. Anal. Chem. 2017, 12, 1015–1044. [Google Scholar] [CrossRef]
  24. Tang, X.W.; Zhao, Z.W. Simulated solution condition experiment and process design for copper deep removal from nickel anodes based on ion-exchange. J. Cent. South Univ. 2024. [Google Scholar] [CrossRef]
  25. Hannula, P.M.; Khalid, M.K.; Janas, D.; Yliniemi, K.; Lundström, M. Energy efficient copper electrowinning and direct deposition on carbon nanotube film from industrial wastewaters. J. Clean. Prod. 2019, 207, 1033–1039. [Google Scholar] [CrossRef]
  26. Dewi, G.C.; Levin, O. Analysis of Nickel(II) in Water Medium using Electrochemical Techniques. Chem. Mater. 2023, 2, 24–29. [Google Scholar] [CrossRef]
  27. Campbell, D.A.; Dalrymple, I.M.; Sunderland, J.G.; Tilston, D. The electrochemical recovery of metals from effluent and process streams. Resour. Conserv. Recycl. 1994, 10, 25–33. [Google Scholar] [CrossRef]
  28. Jüttner, K.; Galla, U.; Schmieder, H. Electrochemical approaches to environmental problems in the process industry. Electrochim. Acta 2000, 45, 2575–2594. [Google Scholar] [CrossRef]
  29. Chaudhary, A.J. Added-Value Chemicals from Secondary and Low-Grade Primary Sources; City University London: London, UK, 1990. [Google Scholar]
  30. Emre, M.; Orhan, G. Special electrolysis cells (Part I) Electrolysis cells with extended electrode surfaces. Metalurji TMMOB 2003, 132, 51–55. [Google Scholar]
  31. Cotgreave, S.A. Aspects of the Electrochemistry of the Chemelec. Ph.D. Thesis, Loughborough University of Technology, Loughborough, UK, 1983. [Google Scholar]
  32. Chen, G. Electrochemical technologies in wastewater treatment. Sep. Purif. Technol. 2004, 38, 11–41. [Google Scholar] [CrossRef]
  33. Orhan, G.; Duman, İ. Fundemental aspects of de-metalization electrolysis and cell design parameters. Metalurji TMMOB 2002, 131, 38–42. [Google Scholar]
  34. Emre, M.; Orhan, G. Special electrolysis cells (Part II) Electrolysis cells with high convection/electrolysis ells with high convection and extended electrode surfaces. Metalurji TMMOB 2003, 132, 51–55. [Google Scholar]
  35. Gorgievski, M.; Božić, D.; Stanković, V.; Bogdanović, G. Copper electrowinning from acid mine drainage: A case study from the closed mine “Cerovo”. J. Hazard. Mater. 2009, 170, 716–721. [Google Scholar] [CrossRef]
  36. Boyanov, B.S.; Donaldson, J.D.; Grimes, S.M. Removal of copper and cadmium from hydrometallurgical leach solutions by fluidised bed electrolysis. J. Chem. Technol. Biotechnol. 1988, 41, 317–328. [Google Scholar] [CrossRef]
  37. Bettley, A.; Tyson, A.; Cotgreave, S.A.; Hampson, N.A. The electrochemistry of nickel in the chemelec cell. Surf. Technol. 1981, 12, 15–24. [Google Scholar] [CrossRef]
  38. Chaudhary, A.J.; Grimes, S.M. Heavy metals in the environment. Part I: Removal of cobalt from dilute effluent streams by fluidised bed electrolysis. J. Chem. Technol. Biotechnol. 1993, 56, 15–20. [Google Scholar] [CrossRef]
  39. Chaudhary, A.J.; Dando, S.O.V.; Grimes, S.M. Removal of tin from dilute solutions. J. Chem. Technol. Biotechnol. 2001, 76, 47–52. [Google Scholar] [CrossRef]
  40. Segundo, J.E.D.V.; Salazar-Banda, G.R.; Feitoza, A.C.O.; Vilar, E.O.; Cavalcanti, E.B. Cadmium and lead removal from aqueous synthetic wastes utilizing Chemelec electrochemical reactor: Study of the operating conditions. Sep. Purif. Technol. 2012, 88, 107–115. [Google Scholar] [CrossRef]
  41. Hussain, N.; Saikia, U.; Puzari, P. Creatinine-copper interaction: Electrochemical and spectroscopic insight, and an innovative verification of a molecularly imprinted creatinine sensor design. J. Appl. Electrochem. 2025. [Google Scholar] [CrossRef]
  42. Sönmez, İ.; Şahbudak, K.; Kartal, L.; Alkan, B. Optimization of sulfuric acid leaching of roasted chalcopyrite concentrate with Box–Wilson experimental design. SN Appl. Sci. 2020, 2, 1–18. [Google Scholar] [CrossRef]
  43. Pletcher, D.; Walsh, F.C. Industrial Electrochemistr; Springer: Dordrecht, The Netherlands, 1993. [Google Scholar] [CrossRef]
  44. Boubatra, M.; Azizi, A.; Schmerber, G.; Dinia, A. The influence of pH electrolyte on the electrochemical deposition and properties of nickel thin films. Ionics 2012, 18, 425–432. [Google Scholar] [CrossRef]
  45. Reyes-Valderrama, M.I.; Salinas-Rodríguez, E.; Montiel-Hernández, J.F.; Rivera-Landero, I.; Cerecedo-Sáenz, E.; Hernández-Ávila, J.; Arenas-Flores, A. Urban mining and electrochemistry: Cyclic voltammetry study of acidic solutions from electronic wastes (printed circuit boards) for recovery of Cu, Zn, and Ni. Metals 2017, 7, 55. [Google Scholar] [CrossRef]
Figure 1. Schematic illustration of the Chemelec cell.
Metals 15 00432 g001
Figure 2. Schematic illustration of experimental setup.
Metals 15 00432 g002
Figure 3. CV graphs of different concentrations ((a) 0.5, (b) 0.75, (c) 1.5, (d) 4.5 g/L) of Cu2+ at different scan rates.
Metals 15 00432 g003aMetals 15 00432 g003b
Figure 4. CV of (a) different concentrations (0.5, 0.75, 1.5, 3, 4.5 g/L) of Cu2+ and (b) 0.5 and 4.5 g/L of Cu2+ at the GC electrode.
Metals 15 00432 g004
Figure 5. CV graph of solution containing 1.5 g/L of Ni2+ at pH 1 at the GC electrode at 100 mV/s scan rate.
Metals 15 00432 g005
Figure 6. CV diagrams of solutions containing different concentrations of Cu2+ ((a) 0.5, (b) 0.75, (c) 1.5, (d) 3, (e) 4.5 g/L) and fixed 1.5 g/L of Ni2+ at different scan rates.
Metals 15 00432 g006
Figure 7. CV of (a) different concentrations (0.5, 0.75, 1.5, 3, 4.5 g/L) of Cu2+ and 1.5 g/L of Ni2+ and (b) 0.5 g/L of Cu2+ + 1.5 g/L of Ni2+ and 4.5 g/L of Cu2+ + 1.5 g/L of Ni2+ at 100 mv/s.
Metals 15 00432 g007
Figure 8. CV of 0.5 g/L of Cu2+ and 0.5 g/L of Cu2+ + 1.5 g/L of Ni2+ in Cu2+-Ni2+ mixed solution at 100 mv/s.
Metals 15 00432 g008
Figure 9. Current change over time at different potentials.
Metals 15 00432 g009
Figure 10. Cu2+ change in solution with time at different potentials.
Metals 15 00432 g010
Figure 11. Cu recovery and charge values at different potentials at 3 h periods.
Metals 15 00432 g011
Figure 12. Current change with time at −0.5 V vs. Ag/AgCl.
Metals 15 00432 g012
Figure 13. Cu2+ change in solution with time at −0.5 V vs. Ag/AgCl.
Metals 15 00432 g013
Figure 14. XRD diffractogram of cathode deposit at −0.5 V vs. Ag/AgCl.
Metals 15 00432 g014
Table 1. Cu2+ concentrations used in CV analyses.
Samples1234
Cu2+/g/L4.51.50.750.5
Table 2. Cu2+ and Ni2+ concentrations of solutions used in CV analyses.
Samples12345
Cu2+/g/L4.531.50.750.5
Ni2+/g/L1.51.51.51.51.5
Table 3. Current efficiencies, charges and copper yields at different experimental times and potentials.
Cathode Potentials vs. Ag/AgCl/VDeposition
Time (h)
Quantity of
Charge (C)
Current
Efficiency (%)
Cu Recovery, %
−0.33583494.280
−0.43640094.388
−0.53700191.794
−0.55786086.499
Disclaimer/Publisher’s Note: The statements, opinions and data contained in all publications are solely those of the individual author(s) and contributor(s) and not of MDPI and/or the editor(s). MDPI and/or the editor(s) disclaim responsibility for any injury to people or property resulting from any ideas, methods, instructions or products referred to in the content.

